
94% of researchers rate our articles as excellent or good
Learn more about the work of our research integrity team to safeguard the quality of each article we publish.
Find out more
ORIGINAL RESEARCH article
Front. Mar. Sci., 04 September 2019
Sec. Marine Evolutionary Biology, Biogeography and Species Diversity
Volume 6 - 2019 | https://doi.org/10.3389/fmars.2019.00545
This article is part of the Research TopicExploring the Genetic Diversity of Marine Organisms Based on the Analysis of Chromosome and Genomic DNA MarkersView all 10 articles
 Allyson Santos de Souza1*
 Eurico Azevedo Dias Júnior1
 Manolo Fernandez Perez2
 Marcelo de Bello Cioffi2
 Luiz Antonio Carlos Bertollo2Erik Garcia-Machado3
 Marcelo Nazareno Souza Vallinoto4
 Pedro Manoel Galetti Jr.2
 Wagner Franco Molina1
Lutjanus analis (mutton snapper) and Lutjanus jocu (dog snapper) are mesopredator species with extensive geographic distribution in the Atlantic Ocean. Although historically overfished, their genetic diversity, population structuring, and historical demography along the Brazilian coast are unknown. Here, we present genetic data for the hypervariable region 1 (HVR1) of the mtDNA control region of both L. jocu and L. analis, and for cytB of L. analis from distinct geographic regions. Phylogeographic analyses based on HVR1 sequences revealed no geographic structuring of mtDNA lineages for either species. The bimodal mismatch distribution plots of mutton and dog snapper populations implied that they might have experienced secondary contact. Historical demographic parameters estimated that population expansions ranged from 13,631 to 61,171 years before present (ybp) for L. analis and 36,783–55,577 ybp for L. jocu, associated with events that occurred at the end of the last glaciation period. Estimates of the average effective population size for L. jocu were higher than those for L. analis, with the largest population occupying the Brazilian northeastern region coast. High migration rates are maintained among the three northernmost locations, with a substantial decrease to the further southern region. Our study suggests that a tripartite interaction of larval dispersion and interregional adult movement (aggregate spawning), allied to historical contingencies, contributed to contemporary population genetic patterns of these species, and adds relevant information for conservation management of such vulnerable – and valuable – marine resources.
Genetic data are critical for developing strategies to delimit populations and conserve marine species. Identifying geographic borders or diagnostic characteristics for distinct genetic subunits play decisive roles in defining threatened species and proposing conservation units. This information has a direct impact on conservation and management policies (Morin et al., 2010). Nevertheless, spatial distribution patterns of genetic diversity remain scarce for most commercially exploited species (Reiss et al., 2009). These include important marine resources, such as fishes of the family Lutjanidae, which are captured over the entire area of its geographic distribution (Allen, 1985; Burton, 2002; Graham et al., 2008).
Lutjanidae species, known as snappers, occur in the Eastern and Indo-Western Pacific, Eastern, and Western Atlantic. Many species have an extensive geographical distribution, although a few species have restricted ones (Allen, 1985; Lindeman et al., 2001; Moura and Lindeman, 2007). They are demersal fishes of medium to large size, with some species reaching more than one meter, occupying very shallow environments up to 500 m deep (Allen, 1985). Lutjanid fishes constitute one of the most valuable fisheries categories, which contributes to their considerable exploitation. Additionally, they also represent an important food resource for communities dependent on artisanal fishing (Rezende et al., 2003).
Twelve species of the genus Lutjanus have been intensely exploited along the Brazilian coast (Rezende et al., 2003; Klippel et al., 2005; Frédou et al., 2009). Among these fishing targets are Lutjanus analis (Cuvier, 1828) and Lutjanus jocu (Bloch and Schneider, 1801), mainly found in coral reefs, and on the sandy bottoms of bays and estuaries, from Massachusetts (United States) to southeastern Brazil, including the Caribbean and Gulf of Mexico (Allen, 1985).
Although several biological aspects of the Lutjanus species are well known (e.g., Rezende et al., 2003; Burton et al., 2005; Mattos and Maynou, 2009; Teixeira et al., 2010; Preveiro et al., 2011), including initiatives toward fish farming (Watanabe et al., 1998), population genetic studies are generally scarce (Garber et al., 2004; Zhang et al., 2006; Karlsson et al., 2009). Among the latter, some data are available for certain North Atlantic species (Heist and Gold, 2000; Gold et al., 2011) and, to a lesser extent, for Western Atlantic species (Salles et al., 2006; Gomes et al., 2008).
Accordingly, the Brazilian Lutjanus’ genetic patterns are still unknown, hindering appropriate conservation strategies for populations of this genus. This is a particularly necessary and urgent task, since it is estimated that the capture level of the species exceeds nearly 90% of that considered adequate (Frédou et al., 2009). In fact, L. analis is being overfished on the northeast coast of Brazil and is considered a near-threatened species (Frédou et al., 2009; IUCN, 2019).
In order to ascertain the levels of connectivity between populations of L. analis and L. jocu along the Brazilian coast, sequences of the hypervariable region 1 (HVR1) of the mtDNA control region of both species, and also of the cytochrome b (cytB) gene of L. analis were analyzed, comprising wide areas from northeastern to southeastern Brazilian coast. These data proved to be useful for assessing the stock and evolutionary dynamics of these particularly vulnerable species.
Lutjanus analis and L. jocu individuals were collected through artisanal fishing in four areas of the Brazilian coast; three in the NE region (Ceará – CE, Rio Grande do Norte – RN and Bahia – BA) and one in the SE region (Espírito Santo – ES), covering a representative zone of the species’ distribution in the South Western Atlantic. Eighty one L. analis individuals – the mutton snapper – and one hundred L. jocu – the dog snapper – were used in phylogeographic analyses (Table 1). Fragments of muscle or liver tissues were placed in 2.0 ml microtubes containing 95% ethyl alcohol and stored at a temperature of −20°C.
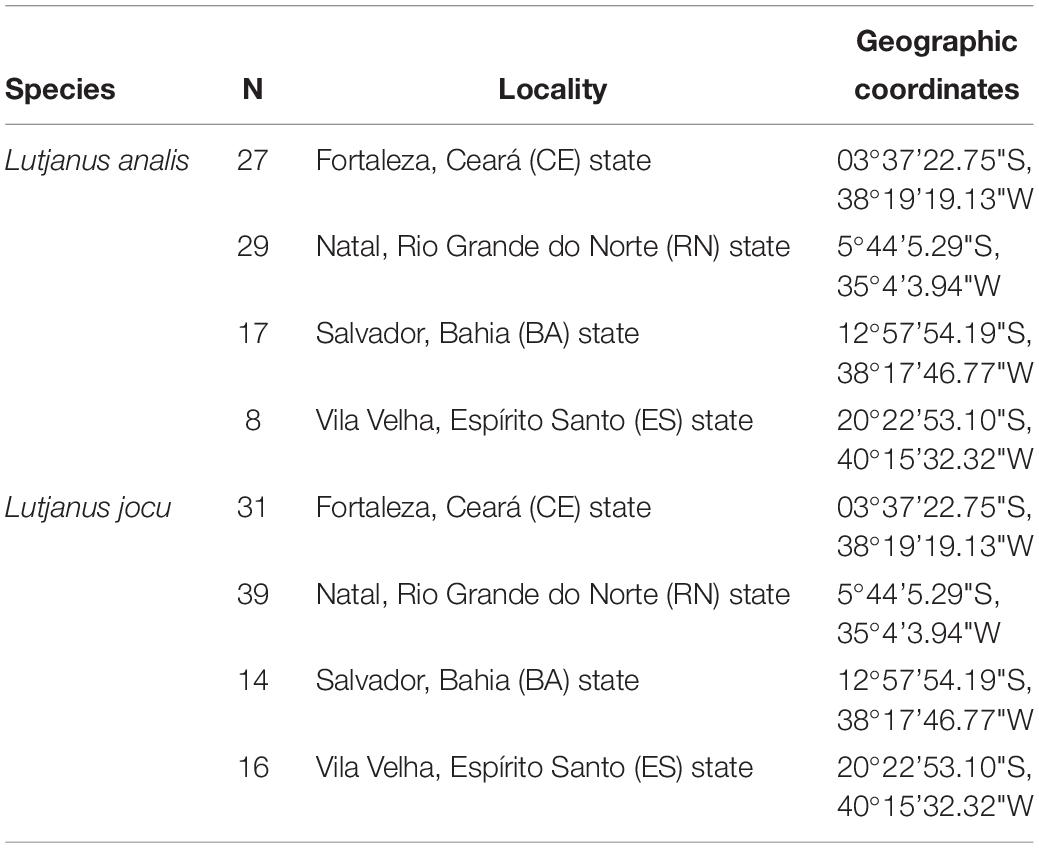
Table 1. Collection sites of Lutjanus jocu and Lutjanus analis individuals along the Brazilian coast.
DNA was extracted according to Sambrook et al. (1989). PCR primers L1 (5’ CCT AAC TCC CAA AGC TAG GTA TTC 3’) and H2 (5’ CCG GCA GCT CTT AGC TTT AAC TA 3’) (Gomes et al., 2008) were used to amplify hypervariable region 1 (HVR1) and cytB-F (5’ – ACC ACC GTT GTT ATT CAA CTA CAA GAA C– 3’) and cytBI-5R (5’ – GGT CTT TGT AGG AGA AGT ATG GGT GGA A– 3’) (Jiménez et al., 2007) were used to amplify the cytochrome b gene. PCR amplifications were composed of 4 μl of dNTP mix (1.25 mM), 2.5 μl of buffer (10×), 1 μl of MgCl2 (50 mM), 1.0 μl of each primer (10 pmol/μl), 1–2 μl of total DNA, 0.2 μl of Taq DNA Polymerase (5 U/μl) (Life Technologies Corporation, Carlsbad, United States) and ultra-pure water, for a final volume of 25 μl. The reactions were performed under the following conditions: initial denaturation at 94°C for 2 min; 30 denaturation cycles at 94°C for 30 s; hybridization at 57°C for control region and 52°C for cytB for 1 min; extension at 72°C for 2 min; final extension at 72°C for 5 min. PCR products were purified after ExoSAP-IT® digestion (USB Corporation, Cleveland, United States), according to manufacturer’s recommendations.
Samples were sequenced on an Applied Biosystems® 3500xL Genetic Analyzer (Thermo Fisher Scientific®, United Kingdom).
Nucleotide sequences for the cytB gene and HVR1 region (GenBank access numbers JQ727916-JQ72996 – Lutjanus analis) of mtDNA were checked, manually corrected, and aligned by Muscle (Edgar, 2004), implemented in MEGA6 (Tamura et al., 2013).
Dambe software (Xia and Xie, 2001) was used to determine the possible existence of saturation involving transitions and transversions. Haplotype (h) and nucleotide (π) diversities (Nei, 1987), as well as genetic differentiation between localities, using pairwise F-statistics were estimated using Arlequin 3.5.1.2 (Excoffier and Lischer, 2010). Fst values were tested for significance with 10,000 permutations. Analyses of molecular variance (AMOVA) (Excoffier et al., 1992) were also implemented to determine possible structuring between the different geographic regions analyzed. In addition, Spatial Analysis of Molecular Variance (SAMOVA) was used as an approach to define groups of populations that were geographically homogeneous and also maximally differentiated from each other (Dupanloup et al., 2002).
The distribution of haplotype diversity in each population was assessed with a haplotype network for each DNA marker built in TCS (Clement et al., 2000). We used TCSbu (Santos et al., 2015) for graphical representation of the obtained networks.
Mismatch analyses (frequency of pairwise nucleotide site differences between sequences) were carried out to estimate the historical demographic parameters τ, θ0 and θ1, according to the sudden population expansion model (Rogers and Harpending, 1992). Adjustments to an unimodal distribution of pairwise nucleotide differences among sequences, as expected for expanding populations, was tested using Harpending’s raggedness index (r). Non-significant r indices suggest a good fit to the growth-decline model, while significant indexes are indicative of a stable population (Harpending, 1994). The sum of square deviations (SSD) between the observed and expected distributions was also considered (Schneider and Excoffier, 1999). Additionally, Fu’s FS (Fu, 1997) and Tajima’s D neutrality tests (Tajima, 1989), with 10,000 permutations, were used to infer historical demographic variations.
Expansion times expressed in units of mutational time τ were translated to time since expansion as τ = 2ut, where 2u is the mutational rate per site per million years. Similarly, θ estimates (θ0 = 2N0 μ and θ1 = 2N1μ were used to estimate the female effective population sizes before (θ0) and after (θ1) expansion, where μ is the mutation rate (Rogers and Harpending, 1992; Rogers, 1995). Confidence intervals of parameters were calculated by applying a parametric bootstrap approach (Schneider and Excoffier, 1999). Values of τ were transformed in real-time by using the estimated expansion time, through the equation u = μmt, where u is the mutational rate by generation, μ (mi) the estimated mutation rate for the sequence analyzed, and mt the number of nucleotide bases involved. The expansion time interval was calculated as τ = 2ut, where t is the estimated time from the occurrence of expansion. To that end, a generation time of 4 years was used for L. analis (Burton, 2002) and 4.6 years for L. jocu, established as means of different estimates ranging from 2 to 6 years (Ault et al., 1998, Froese and Binohlan, 2000).
Estimates of contemporary migration rates among populations for each species were obtained using Migrate-n 4.2.14 (Beerli, 2006; Beerli and Palczewski, 2010). Based on preliminary runs, all priors were set as default, except for theta in L. analis, which was draw from a uniform distribution with mean 0.01, minimum 0.00 and maximum 0.10; and migration rate in L. jocu, that was set with mean 500.0, minimum 0.0 and maximum 5000.0. The analyses were conducted with two independent runs of three long chains over 30,000,000 iterations each, after discarding the first 50,000 steps as burn-in. Posterior samples were recorded every 500 steps. We used a static heating scheme with temperatures 1.0; 1.5; 3.0 and 10,000.0. Convergence for each parameter was evaluated with effective sample size (ESS) values.
Sequencing of the cytB gene from 73 L. analis individuals resulted in the production of a 667 bp sequence. We identified 19 distinct haplotypes differentiated by 20 polymorphic sites, all involving DNA sequence transitions (Table 2). The sequences showed no evidence of saturation between transitions and transversions (ts/tv). The haplotype and nucleotide diversity varied between 0.88 and 0.61, and 0.001 and 0.005, respectively (Table 2).
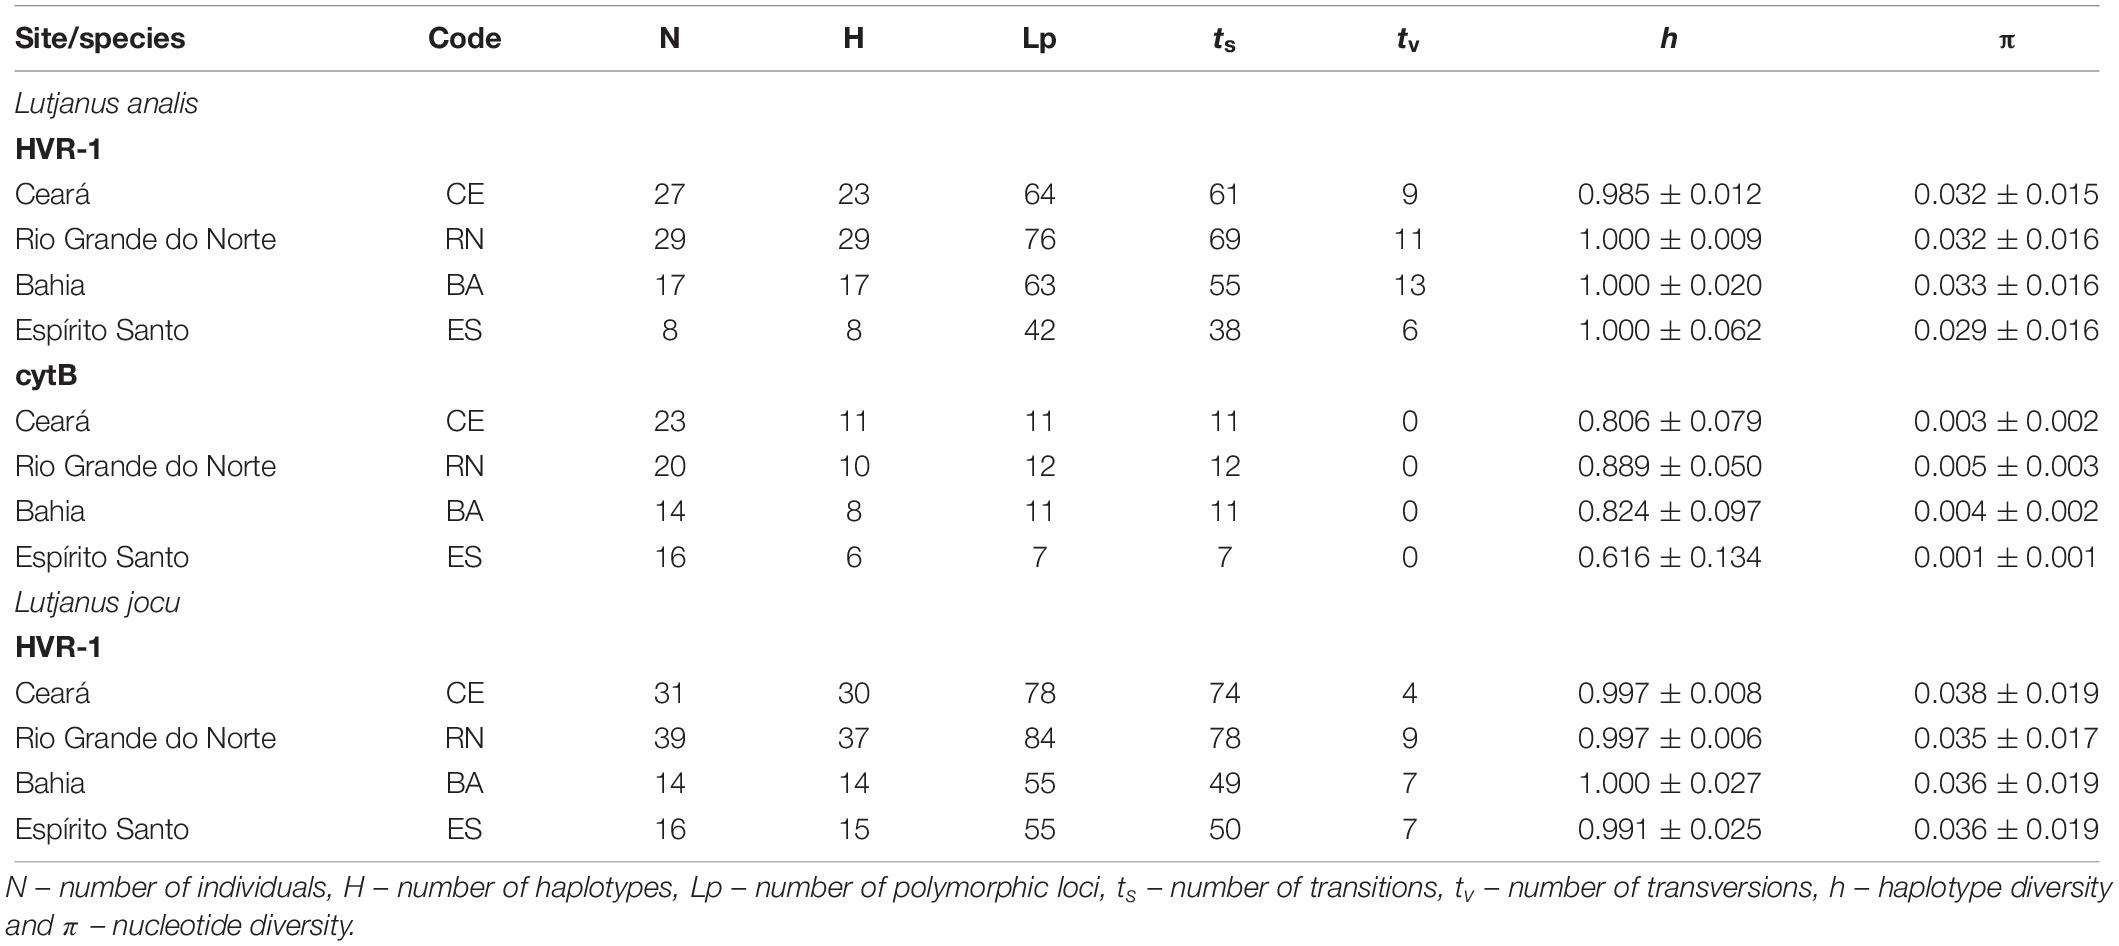
Table 2. Molecular and genetic diversity characteristics among mtDNA sequences of Lutjanus analis and Lutjanus jocu by locality.
PCR amplification of the HVR1 of L. analis and L. jocu produced 493 bp and 394 bp, respectively, analyzable sequences. For L. analis, a total of 245 polymorphic sites and 262 nucleotide substitutions (39 transversions and 223 transitions) were detected among the 72 haplotypes identified. Samples of L. jocu exhibited 91 haplotypes, with 272 polymorphic sites and 278 nucleotide substitutions (27 transversions and 251 transitions).
This marker in both species also showed no evidence of saturation involving ts/tv. Only five L. analis and nine L. jocu haplotypes were shared within and between the different sites. The amount of nucleotide bases followed the A > T > C > G pattern (Sbisà et al., 1997). Geographic samples showed high genetic variability in terms of haplotype (h) and nucleotide (π) diversity, whose values varied from 0.985 to 1.0, and 0.029 to 0.033, respectively, in L. analis, and from 0.991 to 1.0, and 0.035 to 0.038, respectively, in L. jocu (Table 2). The L. analis populations of CE, BA, and RN were more polymorphic than the ES population, while nucleotide diversity was similar in all L. jocu populations.
The reduced number of haplotypes shared within and between populations reflects the high h and π values observed, which is expected for populations without genetic depression.
Fst indexes based on HVR1 sequences indicated panmixia between the distribution areas for both L. analis and L. jocu (Table 3). However, the cytB sequences suggested a possible population structure of L. analis in relation to RN and ES (Fst = 0.19, p = 0.005). Given the absence of population structure suggested by Fst estimates concerning HVR1 sequences, AMOVA of samples from different localities were assessed as a single population. AMOVA analyses in both species indicated that genetic variation is majorly found within populations, with no variance among groups (Table 4). The absence of valid clusters was also supported by SAMOVA.
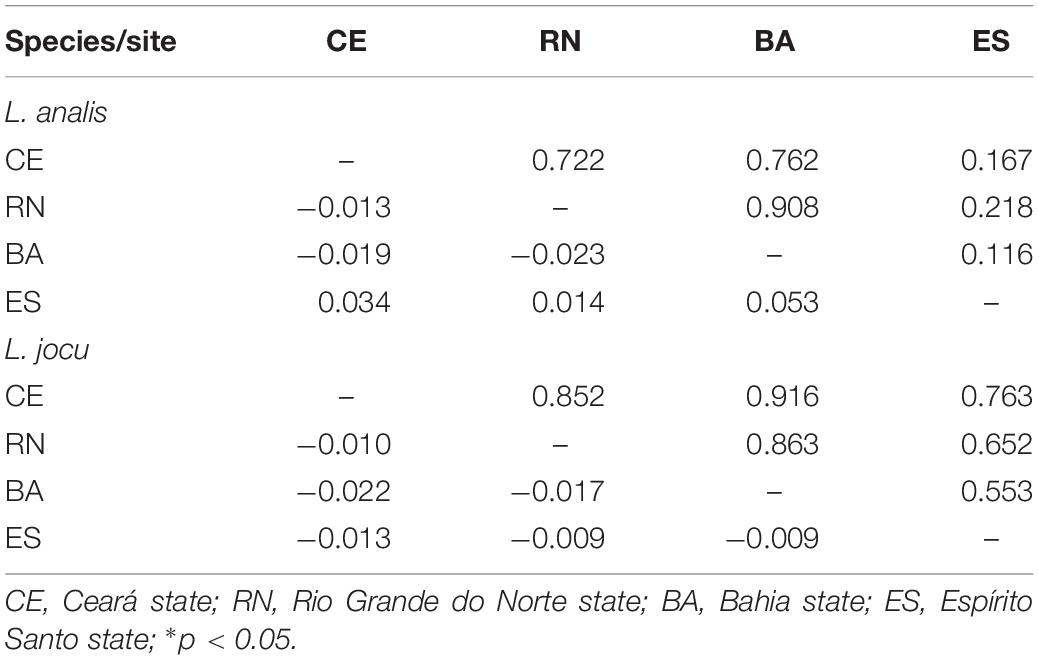
Table 3. Pairwise FST values among populations of Lutjanus analis and Lutjanus jocu based on HVR1 sequence dataset (below the diagonal), and p values (above the diagonal).
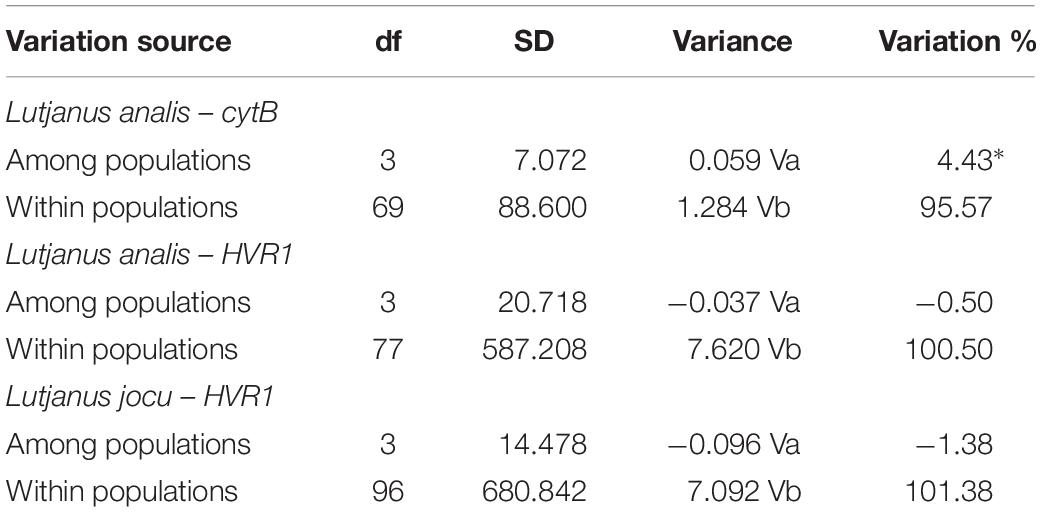
Table 4. Analysis of molecular variance (AMOVA) of Lutjanus analis and Lutjanus jocu, based on Fst indices among the different sample sites.
Haplotype networks for HVR1 in both species were similar with several singletons present in all populations, thus reflecting the high variability of this sequence and the absence of population differentiation. L. analis cytB network showed a lower number of haplotypes, with a high-frequency central haplotype present in all populations, and with other haplotypes with intermediate frequencies also appearing in several populations and in a few singletons located at the tips of the network (Figure 1).
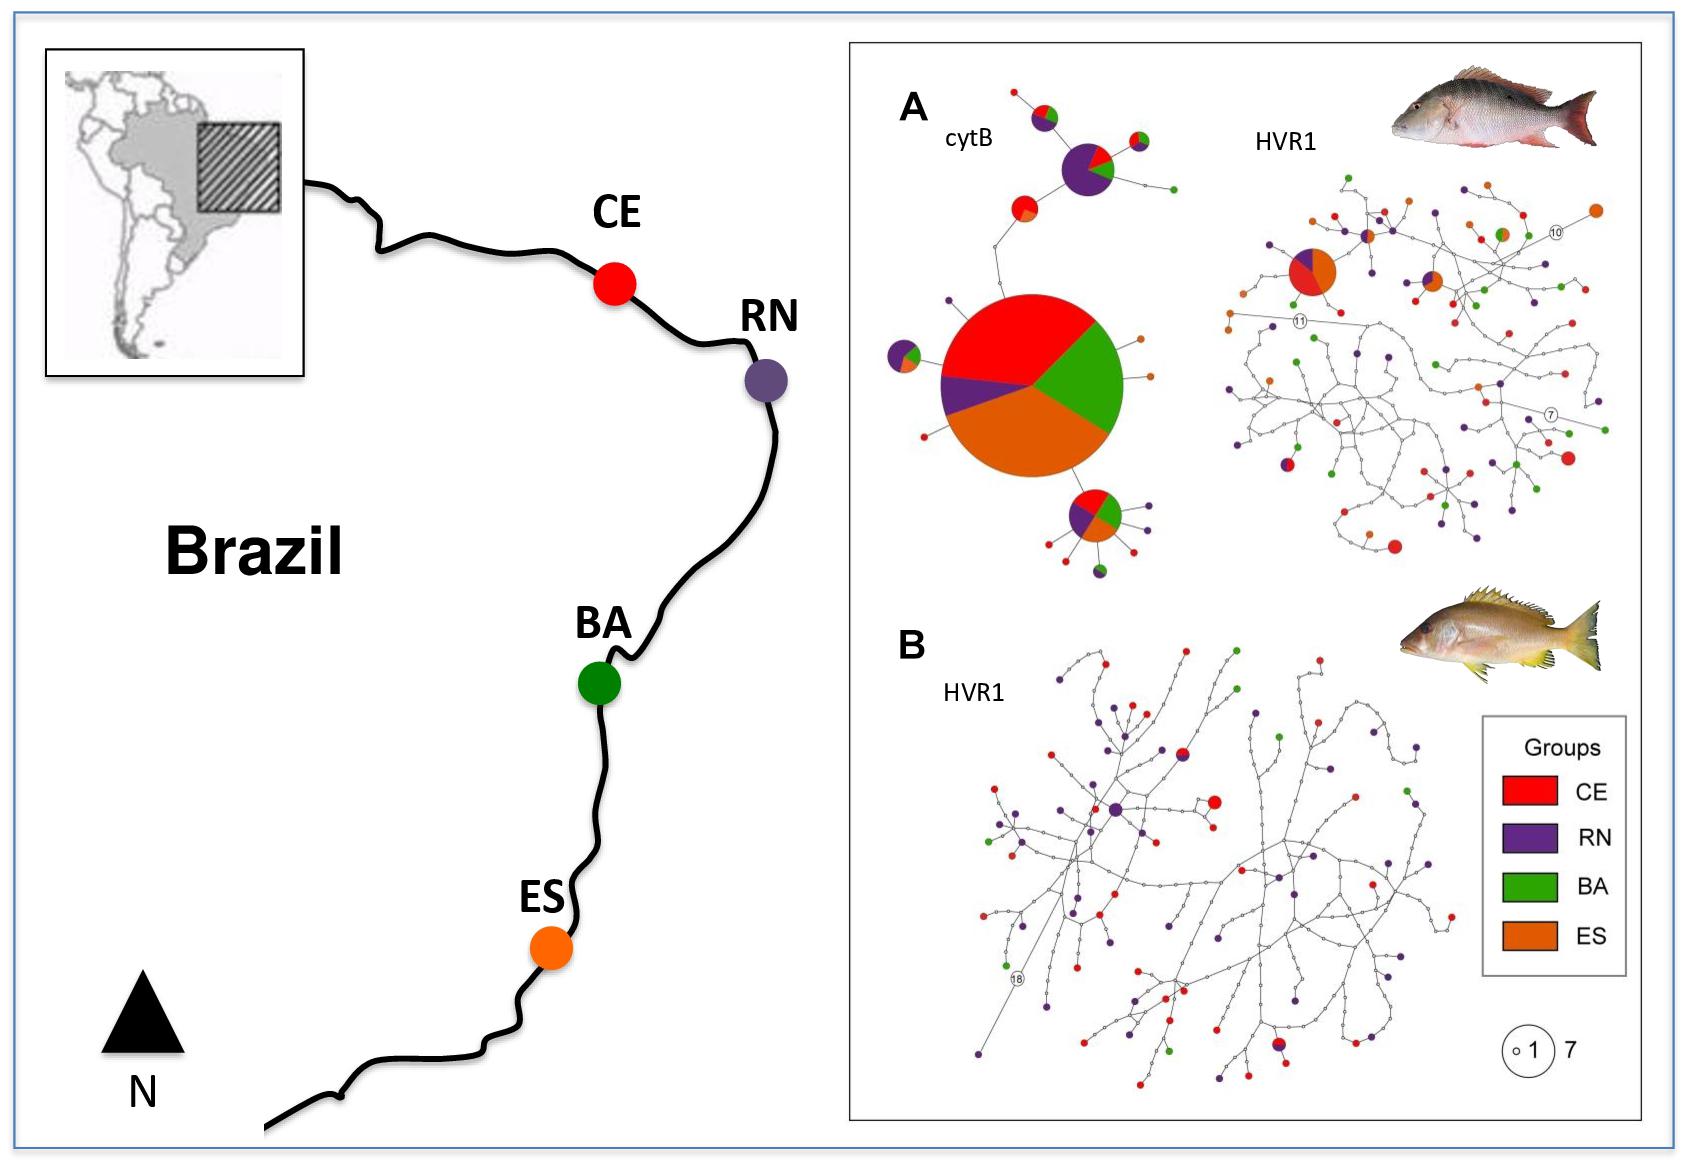
Figure 1. Map of collection points and haplotype networks of Lutjanus analis (A) and Lutjanus jocu (B). Each haplotype is represented by a circle, color coded according to the population of origin. Circle sizes are related to their respective frequency. Unsampled haplotypes are represented as empty circles, and multi-step differences between haplotypes are represented with an empty circle containing the number of mutation steps.
Estimated θ values (an estimator of effective population sizes, scaled by mutation) for L. analis, showed higher values in CE and BA populations, while RN and ES showed much lower estimates. In L. jocu, higher values were found in CE, RN and BA and a smaller sizes in ES (Figure 2). Migration rates among L. analis populations presented fewer immigrating individuals per generation in ES, and higher immigration in BA and CE. L. jocu populations presented similar gene flow patterns, with lower immigration rates observed in ES, while a high number of migrants per generation was detected from BA to CE, from RN to BA, and between CE and RN (Figure 2).
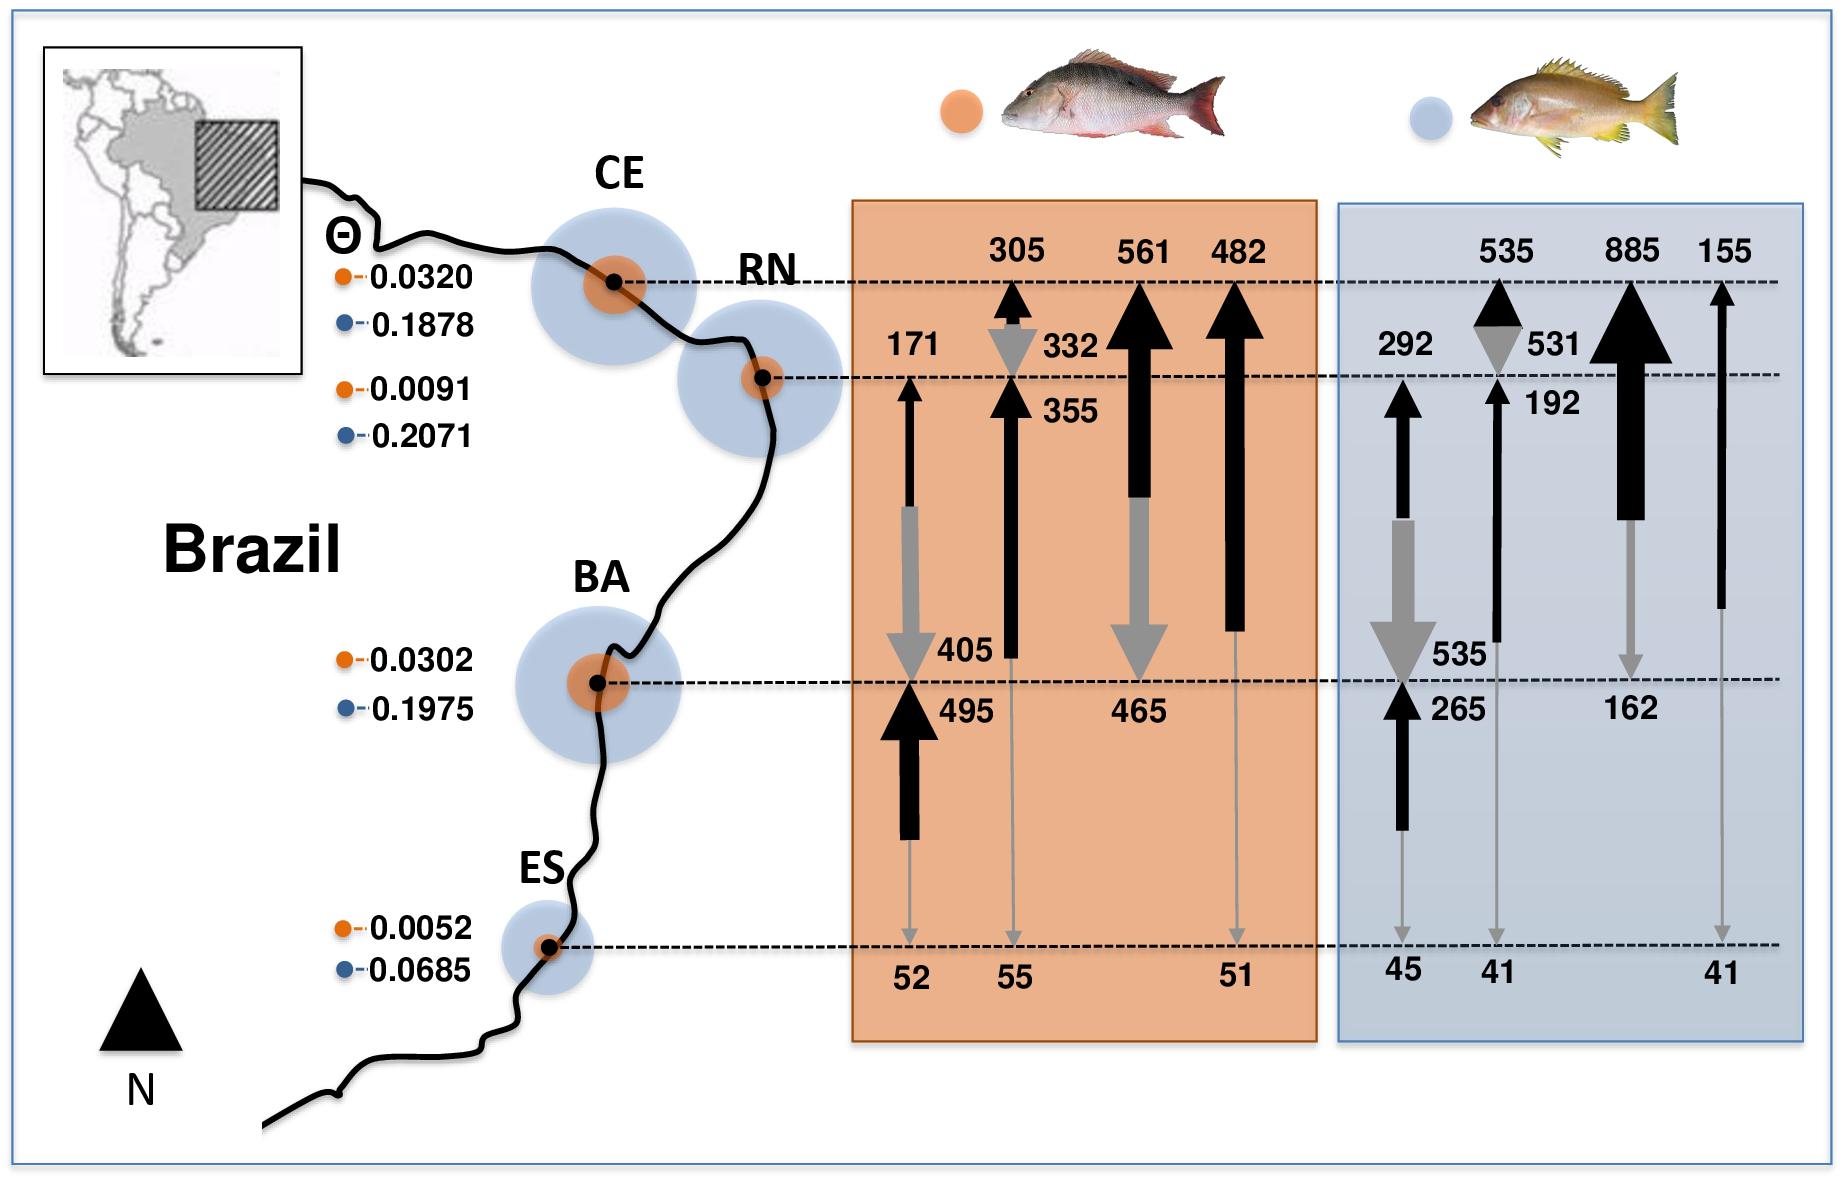
Figure 2. Effective population sizes (median estimates of θ; proportional to circles size) and migration rates among populations of Lutjanus analis (orange circle) and Lutjanus jocu (blue circle). Arrows represent migration rates, with arrow boldness being relative to the estimate of M.
Analysis of deviations from neutrality based on Tajima D and Fu’s FS, presented negative values for all populations of L. analis and L. jocu. Indeed, Fu’s FS (Fu, 1997), a sensitive index to identify sudden population expansions (Ramos-Onsins and Rozas, 2002), exhibited negative and significant values (P < 0.05), indicating a demographic expansion for all sampled populations, except for L. analis from ES (Table 4). Raggedness (r) indices and the sum of square deviations (SSD) performed on L. analis data were not significant (P > 0.05), also supporting population expansion for this species. Mismatch distribution graphs (Rogers, 1995) showed a typical bimodal pattern in both species. Associated with other indicators, the bimodal mismatch distribution can be indicative of secondary contact during the period of population expansion of the species (Figure 3).
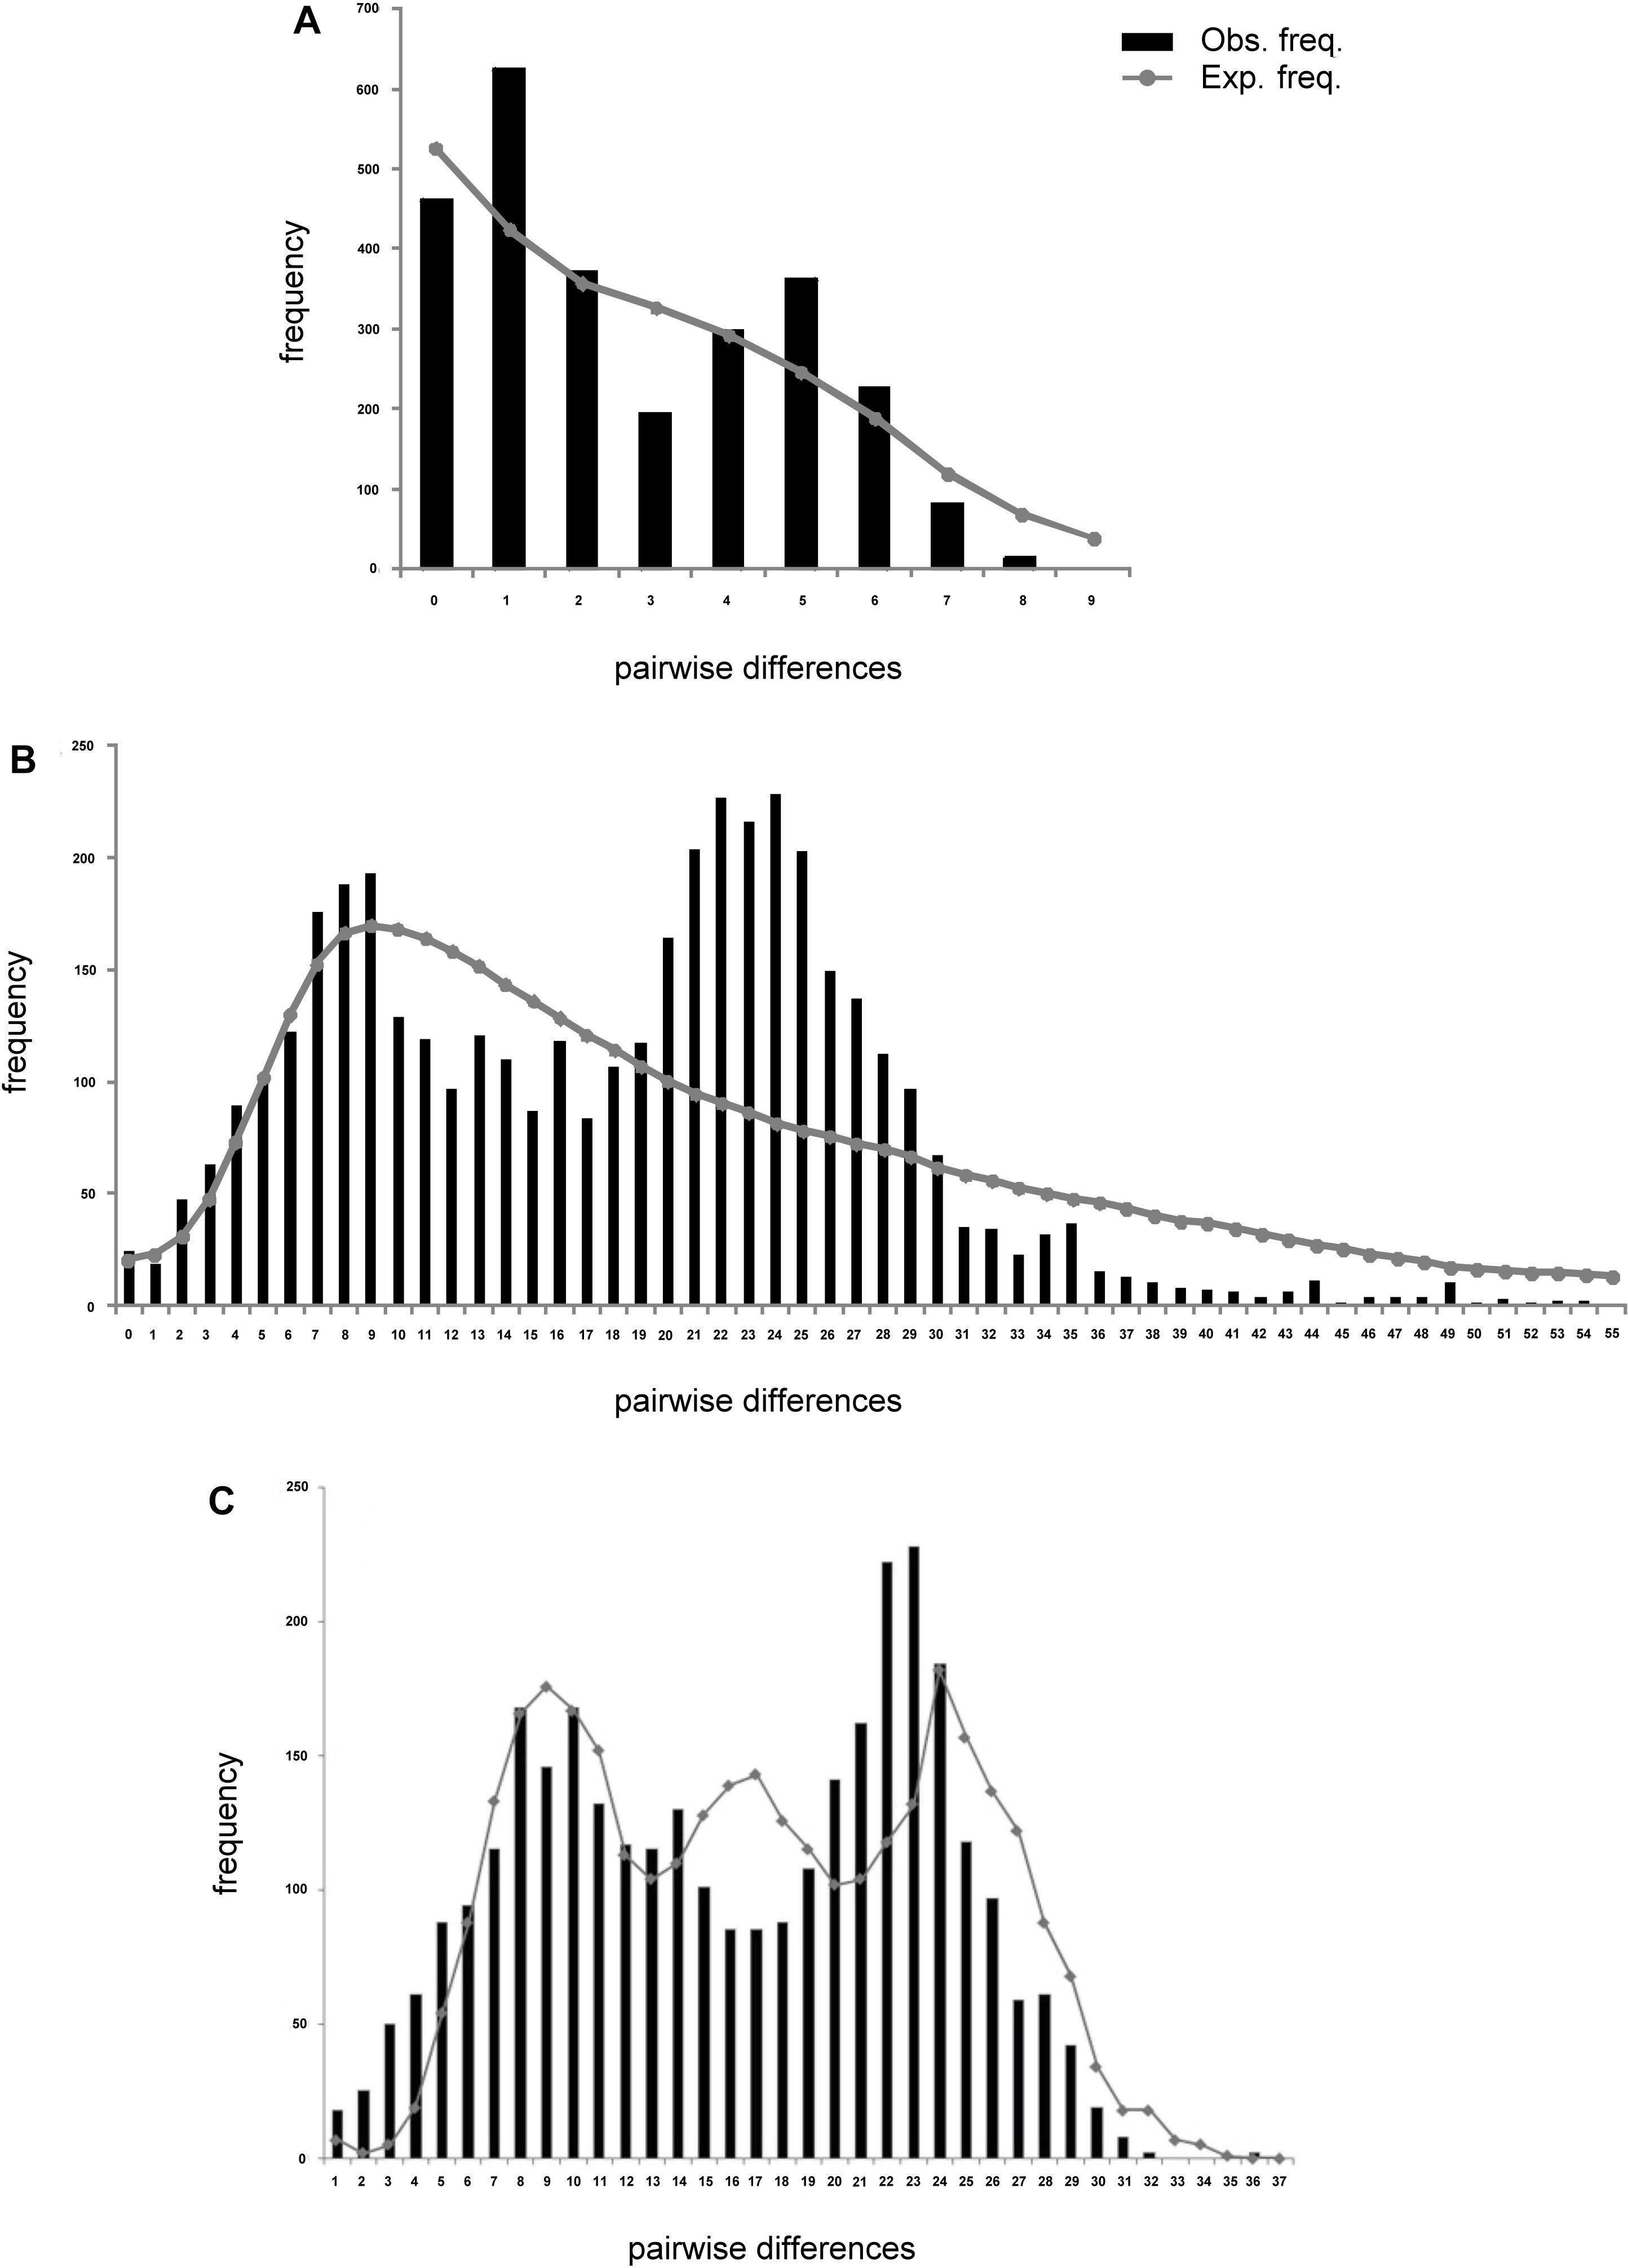
Figure 3. Mismatch distribution plots of Lutjanus analis (A,B) and Lutjanus jocu (C). mtDNA cytB (A), and HVR1 control region sequences (B,C). The observed distribution is represented by vertical bars. The expected distribution, as predicted by the population expansion model, is represented by a solid line.
Coalescence data based on t indicated a period of population expansion between 13,795 and 61,100 ybp, for L. analis and between 36,783 and 55,577 ybp for L. jocu (Table 5). This parameter was not calculated for ES due to no indication of expansion.
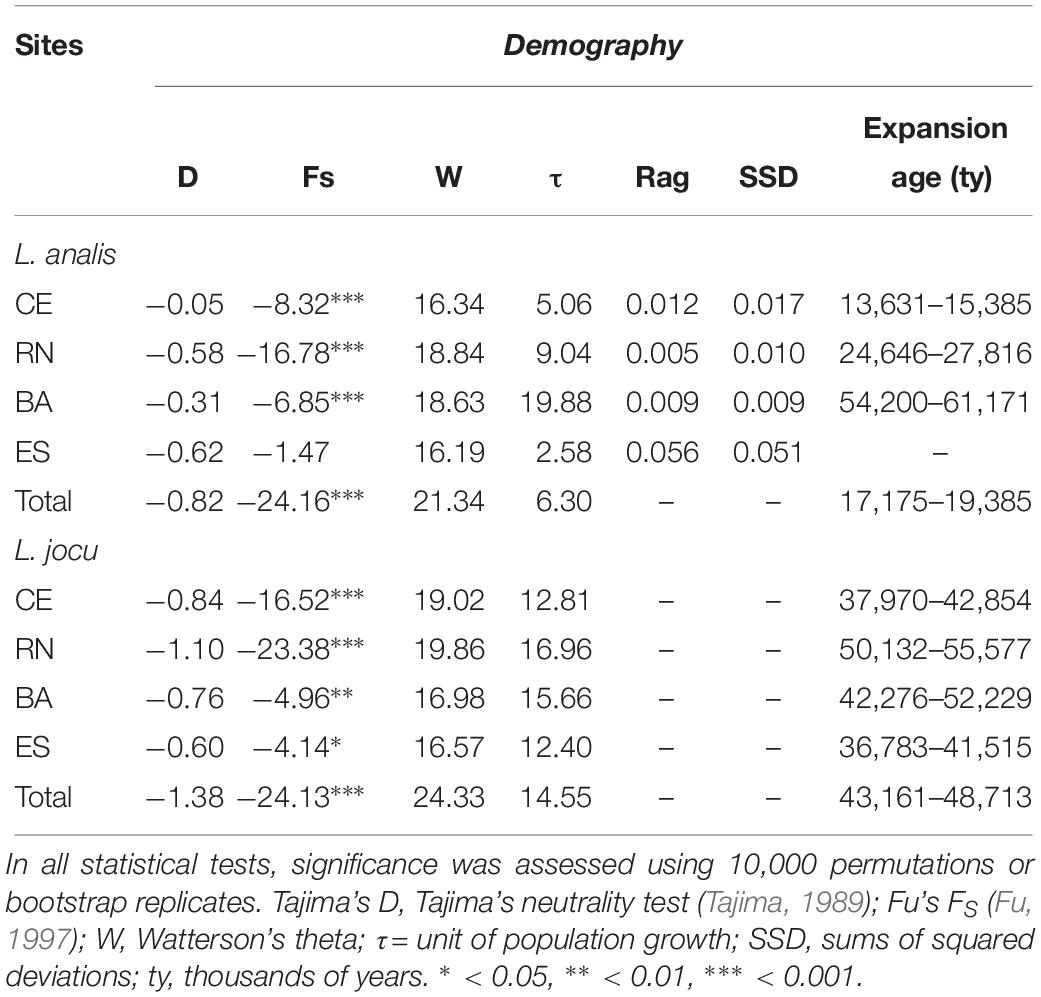
Table 5. Genetic demographic history for populations of Lutjanus analis and Lutjanus jocu, based on mtDNA HVR1 control region sequences variation.
Genetic congeneric comparisons provide an adequate phylogenetic model for estimating contemporary and historical events on population dynamics and genetic population structure. On the Brazilian coast, the species L. analis and L. jocu, present sympatric distribution, and share several biological and ecological characteristics (Allen, 1985), offering an excellent model for comparisons of spatial genetic patterns from historical and phylogenetic perspectives.
Mutton and dog snappers showed high haplotype (h) and nucleotide diversity (π) for mtDNA sequences, a pattern similarly presented by other lutjanid species (Ovenden and Street, 2003; Garber et al., 2004; Blaber et al., 2005; Zhang et al., 2006; Gomes et al., 2008), and compatible with the occurrence of secondary contacts among previously differentiated strains (Grant and Bowen, 1998).
Along the Brazilian coast, L. analis and L. jocu can be considered as a unique panmictic unit, suggesting shared evolutionary responses to similar environmental pressures and historical events to which they were subjected. In fact, the Fst values, based on the comparative analysis of the mitochondrial DNA HVR1 control region sequences, do not indicated genetic structuring in L. analis and L. jocu. Analyzes based on single locus markers can be prone to peculiarities of the selected marker (Hurst and Jiggins, 2005; Allio et al., 2017), and some patterns need be assessed by using other unlinked markers (Godinho et al., 2008). Nevertheless, analyzes with cytB sequences suggested some genetic structuring of the ES population of L. analis, located in the southernmost sampled site.
The level of genetic structuring in the marine environments seems to be the result of complex historical interactions due to interregional connectivity, physical barriers, restricted migratory behavior, short pelagic larval phase, Nef size, species ecology, and ocean current actions (Planes et al., 2001; Stepien et al., 2001). In contrast, panmixia is the predominant pattern challenging these factors in a large number of marine species (Liu et al., 2016, 2017), such as other lutjanids of the Brazilian province as L. purpureus (Salles et al., 2006; Gomes et al., 2008) and Ocyurus chrysurus (Vasconcellos et al., 2008).
Ocean currents have important biogeographic implications in the process of genetic differentiation of marine populations. In the Western Atlantic, two main ocean currents derived from the South Equatorial Current, the North Brazil one flowing in the northeastern/northern direction (RN – CE) and the Brazil Current flowing in a northeastern/southeastern direction (RN – BA – ES) (Lumpkin and Garzoli, 2005), dominate the areas of L. analis and L. jocu occurrence. In particular, the Brazil Current, with its northern and southern branches and extensive spatial trajectory, covers vast areas of both species’ distributions, favoring gene flow among populations.
Besides the physical factors acting in the Western Atlantic, the absence of genetic structuring is associated with biological and ecological characteristics of the species involved (Lecchini and Galzin, 2003). In this respect, L. analis and L. jocu share biological features that favor long-distance dispersal with others lutjanid species. Among these are included the relatively long pelagic larval phase of approximately one month (Lindeman et al., 2001), high dispersive potential of adult individuals, ontogenetic habitat variation with a direct relationship between body size and depth (Frédou and Ferreira, 2005), formation of reproductive aggregations (Paris et al., 2005, França and Olavo, 2015), long life, and delayed sexual development (Claro, 1981; Allen, 1985; Graham et al., 2008).
Several marine organisms synchronize the release of eggs and larvae by forming spawning aggregations during specific periods. Like others, lutjanids, L. analis and L. jocu are r-strategists that form reproductive aggregations with large densities of individuals in spawning areas (Carter and Perrine, 1994; Lindeman et al., 2001; Paris et al., 2005). This reproductive strategy, although presenting considerable levels of self-recruitment in some areas, contributes larvae to distant populations, promoting increases in the genetic variability and homogeneity of the populations (Paris et al., 2005) presented by both species.
Ecological abilities to explore and colonize habitats can also increase genetic cohesion among L. analis e L. jocu populations along the Brazilian coast. In this respect, continuous environments (environmental corridors) favorable for the maintenance of different ontogenetic phases of the species are found throughout their distribution areas, such as rocky and sandy bottoms and reefs which extend for approximately 3000 km along the NE coast (Maida and Ferreira, 1997), as well as mangroves and estuaries (Cocheret de la Morinière et al., 2003), generating favorable habitats for both species. Additionally, the role of deep reef environments in the formation of effective corridors cannot be ruled out when establishing large population interchanges, even during periods of pronounced marine regression such as during the last glacial maximum (LGM).
The indication of population structure for L. analis between RN-ES based on cytB sequences may likely be associated with historical-geographic conditions (Pinheiro et al., 2015), and low contemporary gene flow. These regions have particular geological and geographic aspects that, under historical ocean level changes, could be responsible for particular demographic and genetic lineage divergences. The Brazilian continental shelf adjacent to the Rio Grande do Norte State has a reduced width and shallow depths as compared with other parts of the Brazilian shelf (Vital et al., 2010). In front of the RN coast extends a submarine volcanic chain, paralleling the northern equatorial coast (east-west direction), and known as the Fernando de Noronha Ridge. This geomorphologic formation consists of an alignment of at least, six volcanic seamounts, which extends in a direction toward emersed areas of the Rocas Atoll and Fernando de Noronha Archipelago. Historical asynchronic demographic patterns involving reef fishes related to these continental and insular areas have been attributed to changes in eustatic sea levels (Souza et al., 2015). During transgression periods, the insular areas were reduced, while demographic expansion in the continental populations had occurred. In contrast, during historical regressions, the insular areas were increased, favoring demographic expansions. In fact, despite the limited information on genetic structuring of reef fish groups in these insular and continental areas, population genetic data for some reef species have shown evidence of differentiated genetic structures among them (Cunha et al., 2014; Souza et al., 2015).
The higher haplotype diversity and the occurrence of a more frequent haplotype in RN and, to a minor degree, to northeastern populations support the possible role of Fernando de Noronha Ridge as an historical functional refuge zone for genetic lineages of L. analis during the sea level changes that occurred in the Pleistocene epoch. Similarly, the continental shelf in the ES region is narrow, also with a sequential chain of underwater seamounts denominating the Vitória-Trindade Seamount Chain (VTC), where the Trindade Island and Martin Vaz Archipelago are the unique emersed areas. During the last oceanic transgression, the VTC also acted as refuge areas, promoting genetic diversification of evolutionary lineages (Pinheiro et al., 2015). Likely, temporary isolation of L. analis lineages in both aforementioned north and south seamount regions created conditions contributing to the genetic divergences detected by cytB analysis.
Other lutjanids species, such the Atlantic species Ocyurus chrysurus, represent a large genetic unit (Vasconcellos et al., 2008), similarly to L. campechanus in the Caribbean, Gulf of Mexico and Florida coast (Garber et al., 2004), or L. kasmira in Indo-Pacific areas, where no signs of genetic structuring along the more than 12,000 km distribution exist, except for the Marquesas Archipelago (Gaither et al., 2010). In fact, panmictic genetic populations are mainly recurrent in lutjanids from other marine regions in the absence of apparent physical barriers.
Both species presented values of Nef high enough to maintain a balance between the loss of variability by genetic drift and its replacement by new mutations. However, was evidenced a marked discrepancy between the species, in which L. jocu presented higher Nef values than L. analis.
Differences in contemporary or historically available habitats of L. analis and L. jocu, affected by recurrent cycles of retraction and sea level rise, may be linked to this demographic divergence pattern. Indeed, the widespread effects of such events have been perceived in several marine fishes (Grant and Bowen, 1998; Benzie, 1999; Lourie and Vincent, 2004), including lutjanid species such as L. kasmira, L. fulvus (Gaither et al., 2010) and L. erythropterus (Zhang et al., 2006). The demographic history of L. analis and L. jocu seems to be related to changes during the Pleistocene involving marine environments. Both species present evidence of population expansion along the Brazilian coast, as indicated by results of the Tajima (D) and Fu (Fs) tests. The measure of Fu’s Fs statistic, based on the HVR1 control region sequences, revealed negative values significantly different from zero in all localities, thus supporting recent sudden population expansions (Ramos-Onsins and Rozas, 2002). Raggedness indices and SSD applied to searches for additional demographic signs of population expansion in L. analis were also in concordance with a historically expanding pattern.
The L. analis and L. jocu populations presented bimodal mismatch distributions that are usually associated with constant population size. However, this may also indicate the presence of two distinct lineages (e.g., Alvarado-Bremer et al., 2005). In this sense, the networks indicated more than one distinct lineage for bimodal mismatches (L. analis and L. jocu). The data suggested that past fragmentation was followed by population expansions resulting in secondary contacts of genetically diverged populations that had been separated by historical sea level changes during the Pleistocene. The population expansion period was significantly asynchronous between the two species (L. analis – ≅17.1–19.4 Kybp; L. jocu – ≅43.1–48.7 Kybp), but consistent with changes which occurred during the last glacial period between 120 and 12 Kybp (Martinson et al., 1987). Events in this period are considered important agents in the demographic patterns of several other lutjanids (Zhang et al., 2006; Gaither et al., 2010).
Due to exploration of different environment depths, the rise and retraction of sea level certainly promoted differential historical habitat conditions for L. analis and L. jocu, respectively. The population expansion of L. analis occurred during the beginning of the LGM period, in which ice sheets reached their maximum volume, between 19 and 26.5 Kybp (Martinson et al., 1987; Clark et al., 2009). This event possibly supplied a geographic expansion of L. analis by providing access to new available ocean areas. In contrast, as L. jocu occupies varied shallow habitats (mangroves, estuaries, and reefs) during its ontogeny, with eventual migration offshore with age (Moura et al., 2011), it must have undergone a differentiated demographic impact by changes in these ecologically complex habitats.
High Nef values were found in L. analis and especially in L. jocu populations. This population size discrepancy is an indication of considerably different niches available for these species. In fact, the vast and structurally complex shallow coastal habitats occupied by L. jocu have been shown to favor greater effective population sizes. Both species have their larger population effectives in northeast populations (CE, RN, and BA), with a drastic reduction in the ES region, near the southern limit of their geographic distribution.
The estimation of a large female contingent connected with reproduction, in association with high haplotype diversity, suggested potential resilience to present over-exploitation of both species. In fact, a high Nef value contributes to maintaining the balance between loss of adaptive genetic variation due to genetic drift and its restoration by mutation (Schultz and Lynch, 1997), and this is linked to the evolutionary feasibility of species. In this way, it is a useful indicator of population response to evolutionary and ecological forces (Waples, 2010), and environmental disturbances (Anderson, 2005). Besides providing useful genetic comparative indications for marine populations (Hare et al., 2011), the present Nef estimates are similar to those of the Indo-Pacific lutjanids (Gaither et al., 2010).
Genetic patterns indicate that the mutton and dog snappers exhibit panmictic populations along the Brazilian coast with a high level of genetic variability and large effective population sizes. Despite the absence of genetic structuring, as revealed by HVR1 region sequence analysis, for all populations of both species, there are indications of genetic structuring concerning L. analis populations of the RN and ES related to cytB sequences. This is likely associated to genetic divergence in refuge regions during Pleistocene glaciations. Historical contingencies in this period were also responsible for demographic expansions events in these species. In summary, the importance of spawning aggregations in maintaining high genetic variability along large areas of distribution, particular attention should be given to protecting reproductive areas against overfishing and other anthropogenic disturbance. The present data provide useful information for the sustainable exploitation of these overfished species, and create parameters for future monitoring of natural stocks.
The datasets generated for this study can be found in the GenBank access numbers JQ727916–JQ72996.
The animal study was reviewed and approved by Committee of Ethics in the Use of Animals of the Federal University of Rio Grande (# 044/2015).
ED and WM contributed to the conception and design of the study. AS, ED, and MP organized the database and performed the statistical analysis. AS, ED, and WM wrote the first draft of the manuscript. MP, EG-M, MV, MC, LB, and PG wrote sections of the manuscript. All authors contributed to the manuscript revision, and read and approved the submitted version.
The authors declare that the research was conducted in the absence of any commercial or financial relationships that could be construed as a potential conflict of interest.
The authors wish to thank the Brazilian artisanal fishing communities involved in the study area, and the biologists Priscilla Malafaia and Flávio P. Filho for their help with sample collection, as well as the Brazilian research institutes CNPq and CAPES.
Allen, G. R. (1985). FAO Species Catalogue, vol. 6, Snappers of the world. An annotated and illustrated catalogue of lutjanid species known to date. FAO Fish. Synop. 6:208. doi: 10.1371/journal.pone.0087359
Allio, R., Donega, S., Galtier, N., and Nabholz, B. (2017). Large variation in the ratio of mitochondrial to nuclear mutation rate across animals: implications for genetic diversity and the use of mitochondrial DNA as a molecular marker. Mol. Biol. Evol. 34, 2762–2772. doi: 10.1093/molbev/msx197
Alvarado-Bremer, J. R., Viñas, J., Mejuto, J., Ely, B., and Pla, C. (2005). Comparative phylogeography of Atlantic bluefin tuna and swordfish: the combined effects of vicariance, secondary contact, introgression, and population expansion on the regional phylogenies of two highly migratory pelagic fishes. Mol. Phylogenet. Evol. 36, 169–187. doi: 10.1016/j.ympev.2004.12.011
Anderson, E. C. (2005). An efficient Monte Carlo method for estimating Ne from temporally spaced samples using a coalescent-based likelihood. Genetics 170, 955–967. doi: 10.1534/genetics.104.038349
Ault, J. S., Bohnsack, J. A., and Meester, G. A. (1998). A retrospective (1979-1996) multispecies assessment of coral reef fish stocks in the Florida Keys. Fish. Bull. 96, 395–414.
Beerli, P. (2006). Comparison of Bayesian and maximum-likelihood inference of population genetic parameters. Bioinformatics 22, 341–345. doi: 10.1093/bioinformatics/bti803
Beerli, P., and Palczewski, M. (2010). Unified framework to evaluate panmixia and migration direction among multiple sampling locations. Genetics 185, 313–326. doi: 10.1534/genetics.109.112532
Benzie, J. A. H. (1999). Genetic structure of coral reef organisms: ghosts of dispersal past. Am. Zool. 39, 131–145. doi: 10.1093/icb/39.1.131
Blaber, S. J. M., Dichmont, C. M., Buckworth, R. C., Badrudin, H., Sumiono, B., Nurhakim, S., et al. (2005). Shared Stocks of snappers (Lutjanidae) in Australia and Indonesia: integrating biology, population dynamics and socio-economics to examine management scenarios. Rev. Fish Biol. Fishe. 15:111. doi: 10.1007/s11160-005-3887-y
Burton, M. L. (2002). Age, growth and mortality of mutton snapper, Lutjanus analis, from the east coast of Florida, with a brief discussion of management implications. Fish. Res. 59, 31–41. doi: 10.1016/s0165-7836(02)00007-3
Burton, M. L., Brennan, K. J., Munoz, R. C., and Parker, R. O. (2005). Preliminary evidence of increased spawning aggregations of mutton snapper (Lutjanus analis) at Riley’s Hump two years after establishment of the Tortugas South ecological reserve. Fish. Bull. 103, 404–410.
Carter, J., and Perrine, D. (1994). A spawning aggregation of dog Snapper, Lutjanus jocu (Pisces, Lutjanidae) in Belize, Central-America. Bull. Mar. Sci. 55, 228–234.
Clark, P. U., Dyke, A. S., Shakun, J. D., Carlson, A. E., Clark, J., Wohlfarth, B., et al. (2009). The last glacial maximum. Science 325, 710–714. doi: 10.1126/science.1172873
Claro, R. (1981). Ecologia y ciclo de vida del pargo criollo, Lutjanus analis, en la plataforma cubana. Academia de Ciencias de Cuba. 186, 1–83.
Clement, M., Posada, D., and Crandall, K. A. (2000). TCS: a computer program to estimate gene genealogies. Mol. Ecol. 9, 1657–1659. doi: 10.1046/j.1365-294x.2000.01020.x
Cocheret de la Morinière, E., Pollux, B. Y. A., Nagelkerken, I., and Van der Velde, G. (2003). Diet shifts Caribbean grunts (Haemulidae) and snappers (Lutjanidae) and the relation with nursery-to-coral reef migrations. Estuar. Coast. Shelf Sci. 57, 1079–1089. doi: 10.1016/s0272-7714(03)00011-8
Cunha, M. I, Souza, A. S., Dias, E. A. Jr., Amorim, K. D., Soares, R. X., Costa, G. W. W. F., et al. (2014). Genetic multipartitions based on D-Loop sequences and chromosomal patterns in brown chromis, Chromis multilineata (Pomacentridae), in the Western Atlantic. Biomed Res. Int. 2014:254698. doi: 10.1155/2014/254698
Dupanloup, I., Schneider, S., and Excoffier, L. (2002). A simulated annealing approach to define the genetic structure of populations. Mol. Ecol. 11, 2571–2581. doi: 10.1046/j.1365-294x.2002.01650.x
Edgar, R. C. (2004). MUSCLE: multiple sequence alignment with high accuracy and high throughput. Nucleic Acids Res. 32, 1792–1797. doi: 10.1093/nar/gkh340
Excoffier, L., and Lischer, H. E. L. (2010). Arlequin suite ver 3.5: a new series of programs to perform population genetics analyses under Linux and Windows. Mol. Ecol. Resour. 10, 564–567. doi: 10.1111/j.1755-0998.2010.02847.x
Excoffier, L., Smouse, P. E., and Quattro, J. M. (1992). Analysis of molecular variance inferred from metric distances among DNA haplotypes: application to human mitochondrial DNA restriction data. Genetics 131, 479–491.
França, A. R., and Olavo, G. (2015). Indirect signals of spawning aggregations of three commercial reef fish species on the continental shelf of Bahia, east coast of Brazil. Braz. J. Oceanogr. 63, 289–302.
Frédou, T., and Ferreira, B. P. (2005). Bathymetric trends of Northeastern Brazilian snappers (Pisces, Lutjanidae): implications for the reef fishery dynamic. Braz. Arch. Biol. Technol. 48, 787–800. doi: 10.1590/s1516-89132005000600015
Frédou, T., Ferreira, B. P., and Letourneur, Y. (2009). Assessing the stocks of the primary snappers caught in Northeastern Brazilian Reef Systems. 2-A multi-fleet age-structured approach. Fish. Res. 99, 97–105. doi: 10.1016/j.fishres.2009.05.009
Froese, R., and Binohlan, C. (2000). Empirical relationships to estimate asymptotic length, length at first maturity and length at maximum yield per recruit in fishes, with a simple method to evaluate length frequency data. J. Fish Biol. 56, 758–773. doi: 10.1006/jfbi.1999.1194
Fu, Y. X. (1997). Statistical tests of neutrality of mutations against population growth, hitchhiking and background selection. Genetics 147, 915–925.
Gaither, M. R., Bowen, B. W., Toonen, R. J., Planes, S., Messmer, V., Earle, J., et al. (2010). Genetic consequences of introducing allopatric lineages of Bluestriped snapper (Lutjanus kasmira) to Hawaii. Mol. Ecol. 19, 1107–1121. doi: 10.1111/j.1365-294X.2010.04535.x
Garber, A., Tringali, M., and Stuck, K. (2004). Population structure and variation in Red snapper (Lutjanus campechanus) from the Gulf of Mexico and Atlantic coast of Florida as determined from mitochondrial DNA control region sequence. Mar. Biotechnol. 6, 175–185.
Godinho, R., Crespo, E. G., and Ferrand, N. (2008). The limits of mtDNA phylogeography: complex patterns of population history in a highly structured Iberian lizard are only revealed by the use of nuclear markers. Mol. Ecol. 17, 4670–4683. doi: 10.1111/j.1365-294X.2008.03929.x
Gold, J. R., Voelker, G., and Renshaw, M. A. (2011). Phylogenetic relationships of tropical western Atlantic snappers in subfamily Lutjaninae (Lutjanidae: Perciformes) inferred from mitochondrial DNA sequences. Biol. J. Linn Soc. 102, 915–929. doi: 10.1111/j.1095-8312.2011.01621.x
Gomes, G., Schneider, H., Vallinoto, M., Santos, S., Orti, G., and Sampaio, I. (2008). Can Lutjanus purpureus (South red snapper) be “legally” considered a Red Snapper (Lutjanus campeghanus). Genet. Mol. Biol. 31, 372–376. doi: 10.1590/s1415-47572008000200035
Graham, R. T., Carcamo, R., Rhodes, K. L., Roberts, C. M., and Requena, N. (2008). Historical and contemporary evidence of a mutton snapper (Lutjanus analis Cuvier, 1828) spawning aggregation fishery in decline. Coral Reefs. 27, 311–319. doi: 10.1007/s00338-007-0329-4
Grant, W. S., and Bowen, B. W. (1998). Shallow population histories in deep evolutionary lineages of marine fishes: insights from sardines and anchovies and lessons for conservation. Am. Genetic Assoc. 89, 415–426. doi: 10.1093/jhered/89.5.415
Hare, M. P., Nunney, L., Schwartz, M. K., Ruzzante, D. E., Burford, M., Waples, R. S., et al. (2011). Understanding and estimating effective population size for practical application in marine species management. Conserv. Biol. 25, 438–449. doi: 10.1111/j.1523-1739.2010.01637.x
Harpending, H. C. (1994). Signature of ancient population growth in a low-resolution mitochondrial DNA mismatch distribution. Hum. Biol. 66, 591–600.
Heist, E. J., and Gold, J. R. (2000). DNA microsatellites and genetic structure of red snapper (Lutjanus campechanus) in the Gulf of Mexico. Trans. Am. Fish Soc. 129, 469–475.
Hurst, G. D., and Jiggins, F. M. (2005). Problems with mitochondrial DNA as a marker in population, phylogeographic and phylogenetic studies: the effects of inherited symbionts. Proc. R Soc. B Biol. Sci. 272, 1525–1534. doi: 10.1098/rspb.2005.3056
IUCN (2019). IUCN Red List of Threatened Species. Version 2011.2. Available at: www.iucnredlist.org (accessed May 14, 2019).
Jiménez, S., Schönhuth, S., Lozano, I. J., González, J. A., Sevilla, R. G., Diez, A., et al. (2007). Morphological, ecological, and molecular analyses separate Muraena augusti from Muraena helena as a valid species. Copeia. 2007, 101–113. doi: 10.1643/0045-8511(2007)7%5B101:meamas%5D2.0.co;2
Karlsson, S., Saillant, E., and Gold, J. R. (2009). Population structure and genetic variation of lane snapper (Lutjanus synagris) in the northern Gulf of Mexico. Mar. Biol. 156, 1841–1855. doi: 10.1007/s00227-009-1217-y
Klippel, S., Costa, P. A. S., Martins, A. S., and Peres, M. B. (2005). “Avaliação dos estoques de lutjanídeos da costa central do Brasil: análise de coortes e modelo preditivo de Thompson e Bell para comprimentos,” in Pesca e Potenciais de Exploração de Recursos Vivos na Região Central da Zona Econômica Exclusiva Brasileira, eds P. A. S. Costa, A. S. Martins, and G. Olavo, (Rio de Janeiro: Museu Nacional do Rio de Janeiro), 83–98.
Lecchini, D., and Galzin, R. (2003). Influence of pelagic and benthic, biotic and abiotic, stochastic and deterministic processes on the dynamics of auto-recruitment of coral reef fish. Cybium 27, 167–184.
Lindeman, K. C., Lee, T. N., Wilson, W. D., Claro, R., and Ault, J. S. (2001). Transport of larvae originating in southwest Cuba and the Dry Tortugas: evidence for partial retention in grunts and snappers. Proc. Gulf Caribb. Fish. Inst. 52, 732–747.
Liu, B. J., Zhang, B. D., Gao, T. X., and Liu, J. X. (2017). Signatures of temporal genetic differentiation of the small yellow croaker (Larimichthys polyactis) revealed by microsatellite markers. Fish. Res. 194, 50–54. doi: 10.1016/j.fishres.2017.05.005
Liu, B. J., Zhang, B. D., Xue, D. X., Gao, T. X., and Liu, J. X. (2016). Population structure and adaptive divergence in a high gene flow marine fish: the small yellow croaker (Larimichthys polyactis). PLoS One 11:e0154020. doi: 10.1371/journal.pone.0154020
Lourie, S. A., and Vincent, A. C. J. (2004). A marine fish follows Wallace’s Line: the phylogeography of the three-spot seahorse (Hippocampus trimaculatus, Syngnathidae, Teleostei) in South-east Asia. J. Biogr. 31, 1975–1985. doi: 10.1111/j.1365-2699.2004.01153.x
Lumpkin, R., and Garzoli, S. L. (2005). Near-surface circulation in the Tropical Atlantic ocean. Deep sea Res. 52, 495–518. doi: 10.1038/s41598-019-39392-y
Maida, M., and Ferreira, B. P. (1997). “Coral reefs of Brazil: Overview and field guide,” in Proceedings of the 8th International Coral Reef Symposium, Panama, FL, 263–274.
Martinson, D. G., Pisias, N. G., Hays, J. D., Imbrie, J., Moore, T. C., and Shackleton, N. J. Jr. (1987). Age dating and the orbital theory of the Ice Ages: development of a high-resolution 0–300000-year chronostratigraphy. Quat. Res. 27, 1–29. doi: 10.1016/0033-5894(87)90046-9
Mattos, S. M. G., and Maynou, F. (2009). Virtual population analysis of two snapper species, lutjanus analis and lutjanus chrysurus, caught off Pernambuco state, North-Eastern Brazil. Braz. J. Oceanogr. 57, 229–242. doi: 10.1590/s1679-87592009000300006
Morin, P. A., Martien, K. K., Archer, F. I., Cipriano, F., Steel, D., Jackson, J., et al. (2010). Applied conservation genetics and the need for quality control and reporting of genetic data used in fisheries and wildlife management. J. Hered. 101, 1–10. doi: 10.1093/jhered/esp107
Moura, R. L., Francini-Filho, R. B., Chaves, E. M., Minte-Vera, C. V., and Lindeman, K. C. (2011). Use of riverine through reef habitat systems by Dog snapper (Lutjanus jocu) in eastern Brazil. Estuar. Coast. Shelf S. 95, 274–278. doi: 10.1016/j.ecss.2011.08.010
Moura, R. L., and Lindeman, K. C. (2007). A new species of snapper (Perciformes: Lutjanidae) from Brazil, with comments on the distribution of Lutjanus griseus and L. apodus. Zootaxa 1422, 31–43. doi: 10.11646/zootaxa.1422.1.2
Ovenden, R. J., and Street, R. (2003). Genetic population structure of mangrove jack, Lutjanus argentimaculatus (Forsskall). Mar. Freshwater Res. 54, 127–137.
Paris, C. B., Cowen, R. K., Claro, R., and Lindeman, K. C. (2005). Larval transport pathways from Cuban snapper (Lutjanidae) spawning aggregations based on biophysical modeling. Mar. Ecol. Prog. Ser. 296, 93–106. doi: 10.3354/meps296093
Pinheiro, H. T., Mazzei, E., Moura, R. L., Amado-Filho, G. M., Carvalho-Filho, A., and Braga, A. C. (2015). Fish biodiversity of the Vitória-Trindade seamount chain, Southwestern Atlantic: an updated database. PLoS One 10:e0118180. doi: 10.1371/journal.pone.0118180
Planes, S., Doherty, P., and Bernardi, G. (2001). Unusual case of extreme genetic divergence in a marine fish, Acanthochromis polyacanthus, within the Great Barrier Reef and the Coral Sea. Evolution 55, 2263–2273. doi: 10.1111/j.0014-3820.2001.tb00741.x
Preveiro, M., Minte-Vera, C. V., Freitas, M. O., Moura, R. L., and Dei Tos, C. (2011). Age and growth of the Dog snapper Lutjanus jocu (Bloch & Schneider, 1801) in Abrolhos Bank, Northeastern Brazil. Neotrop. Ichthyol. 9, 393–401. doi: 10.7717/peerj.3167
Ramos-Onsins, S. E., and Rozas, J. (2002). Statistical properties of new neutrality tests against population growth. Mol. Biol. Evol. 19, 2092–2100. doi: 10.1093/oxfordjournals.molbev.a004034
Reiss, H., Hoarau, G., Dickey-Collas, M., and Wolff, W. J. (2009). Genetic population structure of marine fish: mismatch between biological and fisheries management units. Fish Fish. 10, 361–395. doi: 10.1111/j.1467-2979.2008.00324.x
Rezende, S. M., Ferreira, B. P., and Frédou, T. (2003). A pesca de lutjanídeos no nordeste do Brasil: Histórico das pescarias, características das espécies e relevância para o manejo. Boletim Técnico Científico CEPENE. 11, 257–270.
Rogers, A. R. (1995). Genetic evidence for a Pleistocene population expansion. Evolution 49, 608–615. doi: 10.1111/j.1558-5646.1995.tb02297.x
Rogers, A. R., and Harpending, H. (1992). Population growth makes waves in the distribution of pairwise genetic differences. Mol. Biol. Evol. 9, 552–569.
Salles, R., Fonteles-Filho, A. A., Furtado-Neto, M. A. A., Carr, S. M., and Freitas, S. M. (2006). Morphometric and mitochondrial DNA analyses of the Caribbean red snapper, Lutjanus purpureus (Teleostei, Lutjanidae), in western Atlantic off Northern Brazil. Bol. Inst. Pesca. 32, 115–125.
Sambrook, J., Fritsch, E. F., and Maniatis, T. (1989). Molecular Cloning: A Laboratory Manual. New York, NY: Cold-Springer Harbor Laboratory Press.
Santos, A. M., Cabezas, M. P., Tavares, A. I., Xavier, R., and Branco, M. (2015). tcsBU: a tool to extend TCS network layout and visualization. Bioinformatics 32, 627–628. doi: 10.1093/bioinformatics/btv636
Sbisà, E., Tanzariello, F., Reyes, A., Pesole, G., and Saccone, C. (1997). Mammalian mitochondrial D-loop region structural analysis: identification of new conserved sequences and their functional and evolutionary implications. Gene 205, 125–140. doi: 10.1016/s0378-1119(97)00404-6
Schneider, S., and Excoffier, L. (1999). Estimation of past demographic parameters from the distribution of pairwise differences when the mutation rates vary among sites: application to human mitochondrial DNA. Genetics 152, 1079–1089.
Schultz, S. T., and Lynch, M. (1997). Mutation and extinction: the role of variable mutational effects, synergistic epistasis, beneficial mutations, and degree of outcrossing. Evolution 51, 1363–1371. doi: 10.1111/j.1558-5646.1997.tb01459.x
Souza, A. S., Dias, E. A. D. Jr., Galetti, P. M. Jr., Machado, E. G., Pichorim, M., and Molina, W. F. (2015). Wide-range genetic connectivity of Coney, Cephalopholis fulva (Epinephelidae), through oceanic islands and continental Brazilian coast. An. Acad. Bras. Cienc. 87, 121–136. doi: 10.1590/0001-3765201520130411
Stepien, C. A., Rosenblatt, R. H., and Bargmeyer, B. A. (2001). Phylogeography of the spotted sand bass, Paralabrax maculatofasciatus: divergence of Gulf of California and Pacific coast populations. Evolution 55, 1852–1862. doi: 10.1111/j.0014-3820.2001.tb00834.x
Tajima, F. (1989). Statistical method for testing the neutral mutation hypothesis by DNA polymorphism. Genetics 123, 585–595.
Tamura, K., Stecher, G., Peterson, D., Filipski, A., and Kumar, S. (2013). MEGA6: molecular evolutionary genetics analysis version 6.0. Mol. Biol. Evol. 30, 2725–2729. doi: 10.1093/molbev/mst197
Teixeira, S. F., Duarte, Y. F., and Ferreira, B. P. (2010). Reproduction of the fish Lutjanus analis (mutton snapper; Perciformes: Lutjanidae) from Northeastern Brazil. Rev. Biol. Trop. 58, 791–800.
Vasconcellos, A. V., Vianna, P., Paiva, P. C., Schama, R., and Solé-Cava, A. (2008). Genetic and morphometric differences between Yellowtail snapper (Ocyurus chrysurus, Lutjanidae) populations of the tropical West Atlantic. Genet. Mol. Biol. 31, 308–316. doi: 10.1590/s1415-47572008000200026
Vital, H., Gomes, M. P., Tabosa, W. F., Frazão, E. P., Santos, C. L. A., and Plácido Júnior, J. S. (2010). Characterization of the Brazilian continental shelf adjacent to Rio Grande do Norte state, NE Brazil. Braz. J. Oceanogr. 58, 43–54. doi: 10.1590/s1679-87592010000500005
Waples, R. S. (2010). Spatial-temporal stratifications in natural populations and how they affect understanding and estimation of effective population size. Mol. Ecol. Resour. 10, 785–796. doi: 10.1111/j.1755-0998.2010.02876.x
Watanabe, W. O., Ellis, E. P., Ellis, S. C., Chaves, J., and Manfredi, C. (1998). Artificial propagation of mutton snapper Lutjanus analis, a new candidate marine fish species for aquaculture. J. World Aquacult. Soc. 29, 176–187. doi: 10.1111/j.1749-7345.1998.tb00977.x
Xia, X., and Xie, Z. (2001). DAMBE: data analysis in molecular biology and evolution. J. Hered. 92, 371–373. doi: 10.1093/jhered/92.4.371
Keywords: Lutjanidae, Brazilian coast, genetic diversity, HVR1 control region, cytochrome B, Pleistocene
Citation: Souza AS, Dias Júnior EA, Perez MF, Cioffi MB, Bertollo LAC, Garcia-Machado E, Vallinoto MNS, Galetti PM Jr and Molina WF (2019) Phylogeography and Historical Demography of Two Sympatric Atlantic Snappers: Lutjanus analis and L. jocu. Front. Mar. Sci. 6:545. doi: 10.3389/fmars.2019.00545
Received: 21 June 2019; Accepted: 19 August 2019;
Published: 04 September 2019.
Edited by:
Dongdong Xu, Marine Fisheries Research Institute of Zhejiang, ChinaReviewed by:
Jin Sun, Hong Kong University of Science and Technology, Hong KongCopyright © 2019 Souza, Dias Júnior, Perez, Cioffi, Bertollo, Garcia-Machado, Vallinoto, Galetti and Molina. This is an open-access article distributed under the terms of the Creative Commons Attribution License (CC BY). The use, distribution or reproduction in other forums is permitted, provided the original author(s) and the copyright owner(s) are credited and that the original publication in this journal is cited, in accordance with accepted academic practice. No use, distribution or reproduction is permitted which does not comply with these terms.
*Correspondence: Allyson Santos de Souza, c291emFhc0B5YWhvby5jb20uYnI=
Disclaimer: All claims expressed in this article are solely those of the authors and do not necessarily represent those of their affiliated organizations, or those of the publisher, the editors and the reviewers. Any product that may be evaluated in this article or claim that may be made by its manufacturer is not guaranteed or endorsed by the publisher.
Research integrity at Frontiers
Learn more about the work of our research integrity team to safeguard the quality of each article we publish.