 Adam J. Fagan
 Allison R. Moreno
 Adam C. Martiny
- 1Department of Earth System Science, University of California, Irvine, Irvine, CA, United States
- 2Department of Ecology and Evolutionary Biology, University of California, Irvine, Irvine, CA, United States
El Niño Southern Oscillation (ENSO) influences multi-year variation in sea-surface temperature and the intensity of upwelling in many Pacific regions. However, it is currently unknown how El Niño conditions will affect the concentration and elemental ratios of particulate organic matter (POM). To investigate this, we have quantified POM weekly for 6 years (2012 to 2017) at the MICRO time-series station in the Southern California Bight. We found a strong influence of the 2015 El Niño on sea-surface temperature and phosphate concentration but to a lesser extent on nitrate availability. The 2015 El Niño also resulted in a short-term depression in POC and POP concentrations, whereas PON concentrations displayed an independent long-term decline regardless of the El Niño event. Reduced POM concentrations resulting from the 2015 El Niño occurred in parallel to high C:P and N:P ratios. Following the changes in PON, C:N continued to climb reaching ∼9.4 at the end of our sampling period. We suggest that an Eastern Pacific- vs. a Central Pacific-type El Niño as well as a switch in the Pacific Decadal Oscillation phase significantly altered the local response in POM concentrations and ratios.
Introduction
El Niño Southern Oscillation (ENSO) is a recurring climate cycle leading to multi-year variation in ocean environmental conditions (Dijkstra and Burges, 2002; McPhaden, 2015). In the California Current System, ENSO regulates sea-surface temperature (SST), upwelling source and intensity, thermocline depth, and large-scale circulation patterns (Mcgowan et al., 1998; Chavez, 2002; Checkley and Barth, 2009). In the southern part of the California Current Ecosystem (i.e., the Southern California Bight, SCB), El Niño conditions are typically manifested as periods of high temperature and low nutrient availability (Tegner and Dayton, 1987; Chavez, 2002; King and Barbeau, 2011). ENSO variability may have a negative effect on plankton growth and biomass accumulation, however this link has been elusive (Kim et al., 2009). Thus, it is currently unclear how coastal plankton will respond to recent ENSO-driven changes in ocean conditions.
There appears to be multiple modes of El Niño events including the Eastern-Pacific (EP) and Central-Pacific type (CP; Yu et al., 2012; Paek et al., 2017). The two types of El Niño conditions differentially regulate temperature anomalies including a shift in the regional location of maximum sea-surface temperature variability. A high positive temperature anomaly in the North Eastern Pacific Ocean is more indicative of an EP El Niño-type, whereas increased temperatures in the equatorial Pacific Ocean are typically associated with the CP El Niño-type (Paek et al., 2017). Furthermore, different El Niño modes result in spatially divergent patterns of declining vs. increasing phytoplankton biomass and growth (Racault et al., 2017). Generally a change in planktonic biomass and growth has an effect on the overall community structure. In the southern part of the California Current Ecosystem, the EP El Niño can result in significant shifts in community composition of phytoplankton. In contrast, CP El Niño has a proposed limited effect on phytoplankton in SCB. Thus, the mode of El Niño is predicted to differentially impact plankton communities in SCB.
A core property of ocean biogeochemistry is the elemental composition and stoichiometric ratios of particulate organic matter (POM). C:N:P of marine communities have traditionally been considered static at Redfield proportions (106C:16N:1P; Redfield, 1958). However, phytoplankton acclimation and adaptation to different ocean environmental conditions can have a large impact on C:N:P (Moreno and Martiny, 2018). Temperature and nutrient limitation are currently thought to be the most important regulators of C:N:P in the surface ocean although the relative contribution of each factor is subject to much debate. Increasing temperature is predicted to correspond to higher C:P and N:P in phytoplankton due to a reduced allocation to P-rich ribosomes (Toseland et al., 2013). Temperature is also known to affect microbial respiration rates (Pomeroy et al., 1991), which could affect the concentrations of POC, PON and POP. Nutrient limitation is predicted to lead to a reduced use of the respective nutrient and higher carbon-to-nutrient ratio although the effect may be higher for P vs. N limitation (Garcia et al., 2016). Temperature and nutrients may also affect stoichiometry via changes in phytoplankton community composition and growth physiology. Smaller cells thriving in warm, nutrient deplete waters are proposed to have higher C:N:P ratios compared to large cell types like diatoms (Klausmeier et al., 2004). Similarly, slower growing cells need fewer P-rich ribosomes and have higher C:N:P (Sterner and Elser, 2002). Thus, shifts in temperature and nutrient concentrations during El Niño conditions are expected to impact phytoplankton community composition, physiology, and associated C:N:P. Based on current theories for the regulation of phytoplankton elemental stoichiometry, we therefore predict elevated C:N:P during El Niño events.
Recent studies have demonstrated considerable regional and temporal variation in C:N:P (Martiny et al., 2013a,b; Moreno and Martiny, 2018). Higher C:N:P have been associated with warm, nutrient deplete ocean regions dominated by marine cyanobacteria and other small plankton. In contrast, colder, nutrient replete regions with high abundance of larger phytoplankton like diatoms have depressed C:N:P. A parallel link between environmental changes and C:N:P was also observed in a past study in the Southern California Bight (Martiny et al., 2016). Here, variation in POM concentrations and ratios corresponded to seasonal oscillations in environmental conditions and phytoplankton abundances. Specifically, winter/spring periods with low temperature, high nutrient concentrations and a dominance of large phytoplankton resulted in low C:N:P and vice-versa for warmer periods during the summer and fall. Similar links between environmental conditions, phytoplankton community structure and C:N:P were also found on weekly and multi-year time-scales (Martiny et al., 2016). Based on these observations, we predict that El Niño conditions will positively impact C:N:P, but the strength of the C:N:P response will be modulated by the mode of El Niño.
We quantify the changes in SST, macronutrient concentrations, POM concentrations, and POM elemental stoichiometric ratios at the MICRO time-series in the Southern California Bight weekly from the beginning of 2012 to the end of 2017 covering the large El Niño event in 2015. Based on these observations, we aim to quantify how El Niño conditions influence ocean POM concentrations and stoichiometric ratios. We predict annually temperatures would be at its highest and macronutrient concentrations are at the lowest due to an offshore damping in upwelling during the 2015 El Niño. Through the regulation of phytoplankton ecology, we should see low POM concentrations and high carbon-to-nutrient elemental ratios. The outcome of this study will allow us to further understand how climatic drivers of ocean environmental conditions affect the link between the C, N, and P biogeochemical cycles.
Materials and Methods
Collection
Surface water was collected weekly at the MICRO time-series (33.608°N and 117.928°W; Martiny et al., 2016). Two autoclaved bottles are rinsed with ocean water and filled for processing in the lab. Water temperature data is collected from an automated shore station off of Newport Pier as part of the Southern California Coastal Ocean Observing Systems (SCCOOS).
Triplicate 300 ml samples for POC/PON or POP from each bottle are filtered within an hour of collection through pre-combusted (500°C, 5 h) 25 mm GF/F filters (Whatman, MA). Each filter is rinsed with Milli-Q water before being fitted in order to remove potential P residues. The filtrate from the initial filtration is collected and used for macronutrient quantification. The filtrate is filtered through a 0.2 μm syringe filter into a 50 ml tube. Triplicates are collected for both macronutrient and stored in the -20°C freezer.
Macronutrients
Nitrate and phosphate samples were collected in prewashed 50 mL Falcon tubes and filtered through a 0.2 μm syringe filter and stored at -20°C until further analysis. Soluble reactive phosphorus (SRP) concentrations were determined using the magnesium induced co-precipitation (MAGIC) protocol and calculated against a potassium monobasic phosphate standard (Karl and Tien, 1992; Lomas et al., 2010). Nitrate samples were treated with a solution of ethylenediaminetetraacetate and passed through a column of copperized cadmium fillings (Knap et al., 1993). Measurements were conducted using the same standards and protocols throughout the time series.
Particulate Organic Carbon and Nitrogen
After thawing, POC/PON filters were allowed to dry overnight at 65°C before being packed into a 30 mm tin capsule (CE Elantech, Lakewood, New Jersey). Samples were then analyzed for C and N content on the same FlashEA 1112 nitrogen and carbon analyzer (Thermo Scientific, Waltham, Massachusetts), following the Sharp (1974) protocol. POC and PON concentrations were calibrated using known quantities of atropine.
Particulate Organic Phosphorus
Particulate organic phosphorus filters are placed in combusted glass vials. Potassium Monobasic Phosphate (1.0 mM-P) is used as a standard. 2 ml of Magnesium sulfate (0.017 M; Macron Fine Chemicals) are added to each vial, covered in tin foil, and put into an oven at 80°C overnight. The vials are wrapped in tinfoil and placed into a 500°C muffle oven for 2 h. Once cooled to room temperature, 5 ml HCl (0.2 M; EMD) is added to each vial and then capped with a Teflon coated cap and placed into the 80°C oven for 30 min and placed into a 15 ml glass centrifuge tube. Each vial is then washed with 5 ml Milli-Q water and then added to the tubes. 1 ml of mixed reagent is added to each of the tubes, centrifuged at 4000 rpm for 1 min and stored in the dark for 30 min. Each standard and sample is quantified at 885 nm. Quantifications were conducted using the same protocol, modified from Lomas et al., 2010, throughout the time series.
Data Analysis
All analyses were done on Supplementary Table S1 data in Matlab (Mathworks, MA). Using the smooth function, a four point moving average was overlaid onto the raw data time-series plots. Sum of square analysis was conducted on linear regressions to quantify the monthly and annual contributions. To detrend seasonality in our time series parameters, we apply a seasonal adjustment using a stable seasonal filter applying a 53-point moving average, representing our weekly sampling. To determine potential covariations, a Pearson’s correlation coefficient was calculated for each pair of variables, followed by a test of statistical significance (p-value ≤0.05).
El Niño Impacts
We used the ERSSTv5 estimate of the Oceanographic El Niño Index (ONI; Huang et al., 2017). Regional temperature anomalies are derived by a linear interpolation of the weekly satellite SST optimum interpolation fields to daily fields then averaging the daily values over a month (Reynolds et al., 2002) from 1983 to 2018. To estimate the mean temperature anomaly for Southern California Bight region, we used satellite observations between 29°–38°N and 115°–124°W.
Results
The ONI data indicate that a strong El Niño event followed La Niña in 2015 (Figure 1). Generally, the ONI index data were significantly correlated with positive temperature anomalies at our MICRO site (Rpearson = 0.38, p < 1e-16) and more broadly in the SCB (Rpearson = 0.44, p < 1e-22). In support, El Niño periods including the 2015 event led to positive temperature anomalies of >2°C. One notable disconnect between ONI and the temperature anomalies at MICRO and in SCB was the period following the El Niño 2015 event. Here, ONI suggested a slightly negative anomaly and La Niña conditions. However, SCB and our site still experienced strong positive temperature anomalies. This positive anomaly occurred during both the summer and winter periods and might be related to an unusually high temperature in the North Eastern Pacific Ocean (Di Lorenzo and Mantua, 2016). Thus, the 2015 El Niño event led to a positive temperature anomaly in SCB and MICRO, but the period following was unexpectedly warm.
Figure 1. Multi-year variation in temperature at MICRO and surrounding region. (A) The in situ daily temperature from 2005 to 2018 from the SCCOOS station on Newport Pier and the 2-year moving average (green line). (B) The temperature anomaly at the MICRO time-series (estimated from satellite). (C) The temperature anomaly in the Southern California Bight. (D) Oceanographic El Niño Index (ONI). (E) Central Pacific Ocean temperature anomaly for August throughout the time-series.
To understand the impact of El Niño conditions on the composition of marine POM, we quantified weekly macronutrient concentrations, POM concentrations, and elemental stoichiometric ratios from the beginning of 2012 to the end of 2017. Temperature oscillated annually with a peak in August and trough in January (Figure 2A). In 2015, the average annual temperature was higher than any other year at 22.4°C, peaking to 23.7°C (Figure 2A). As described earlier, nutrient availability showed a strong seasonal anti-correlation with temperature (Martiny et al., 2016) as well as some annual differences (Figure 2B). Nitrate concentrations also oscillated in parallel with phosphate and reached extremely low or undetectable levels during the summer (Figure 2C). In 2015, the nitrate level did not appear particularly low and stayed in detectable ranges through most of the year. POM concentrations all peaked during the spring bloom period and oscillated annually (Figures 2D–F). POC and POP concentrations did not show any consistent long-term trends, whereas PON levels declined 26% throughout the time-series. Although a slight increasing trend in C:N appeared from the start of the time series, a clear increasing trend was obvious after 2014 (Figure 2G). Annually, C:P peaked during the summer/fall at ∼140 although we saw a big spike during the winter of 2014–2015 but this was not an annually re-occurring phenomenon (Figure 2H). N:P followed the annual oscillation in C:P with high values of 20 in the summer and also spiked during the same time periods (Figure 2I). Overall, we detected both seasonal and annual variation in both environmental conditions and POM concentrations and ratios.
Figure 2. Environmental conditions (A), macronutrient concentrations (B,C), POM concentrations (D–F), and elemental stoichiometric ratios (G–I) over time at MICRO study site in Newport Pier, Newport, CA. The solid black points represent the averaged data per week from the period of 1/1/2012 to 12/31/2017. The red line represents a 4-point moving average. Stoichiometric ratios are molar.
The MICRO study site experienced long-term shifts in oceanographic conditions (Figure 3). Seasonally detrended temperature concentrations have an increasing trend during the sampling period (Figure 3A). Macronutrient and POM concentrations have a slight decreasing trend, whereas the C:N and C:P ratios have increasing trends. The strongest positive correlations seen in the seasonally detrended data is POC and PON with POP demonstrating that the POM concentrations are linked (Figure 3B). Temperature is positively correlated with macronutrient and POM concentration and negatively correlated with stoichiometric ratios (Figure 3B). Thus, temperature is most likely the leading contributor to overall trends seen throughout the time series.
Figure 3. Seasonally detrended values and correlations in environmental conditions, macronutrients concentrations, POM concentrations, and stoichiometric ratios. (A) Detrended seasonal data over time for each factor. Statistical trends quantified using a Mann-Kendal analysis (p < 0.05). (B) Pearson correlation coefficient for each pair of factors. Redder squares signify a strong positive correlation between the two variables, while blue squares signify a strong negative correlation between the two variables. Large black squares represent a correlation of 1. The small black squares indicate that the correlation is statistically significant.
We sought to quantify the amount of variability for environmental conditions, POM concentration, and ratio that is attributable to monthly versus annual variance. In general, we found that monthly variability explained a higher proportion of variance in environmental metrics and POM concentrations than yearly variability (Figure 4). For temperature, monthly variability explained a large fraction of the total variance, representing over 60% of the variance. Monthly variability in nitrate and phosphate were the second and third highest proportion of variance explained among the environmental conditions. In contrast, yearly variability explained less than 10% of variance in temperature, nitrate, and phosphate. Similar to temperature and nutrients, monthly variability is greater among POM concentrations. As POM concentrations generally cycle in unison, there was less monthly variance in POM ratios. In contrast, we saw a larger proportion of variance in POM ratios between years. Monthly variation has more control on the environmental conditions and POM concentrations, whereas annual processes dominated for stoichiometric ratios. Thus, we should expect that POM stoichiometric ratios will be sensitive to El Niño events.
Impact of the 2015 El Niño Event
The 2015 El Niño event had some impact on the POM concentrations and ratios at MICRO (Figure 5). Temperature was highest in 2015, 15.9°C (Figure 5A). The phosphate concentration was 0.15 μM lower than in 2015 compared to 2012, although 2016 had lowest levels with a change of 0.16 μM (Figure 5B). However, nitrate concentrations were not particularly low that year and both 2014 and 2017 had lower levels (Figure 5C). POM concentrations showed divergent annual trends. POC showed a decrease of 4.7 and 3.1 μM in 2014 and 2015 compared to 2012. PON also decreased during these years by 0.8 and 0.9 μM, respectively. Both POC and POP displayed low levels in 2014 and 2015, which could be indicative of an El Niño effect. In contrast, PON showed a declining trend throughout the sampling period leading to a 26% drop in concentration (Figure 5E). The change in PON coincided with a continually rising C:N and a high average ratio of 9.4 in 2017 (Figure 5G). In contrast, C:P and N:P were at their highest in late 2014 and all of 2015 (Figures 2H,I). Thus, it appeared that the C:P and N:P were sensitive to the 2015 El Niño event, whereas C:N showed a divergent long-term increase.
Figure 4. The contribution of monthly and annual variation for environmental conditions and POM concentrations and ratios. The remaining variance represents variance associated with short-term events and measurement errors. Proportions are calculated using the sum of squares from the linear regression data shown in Figure 5.
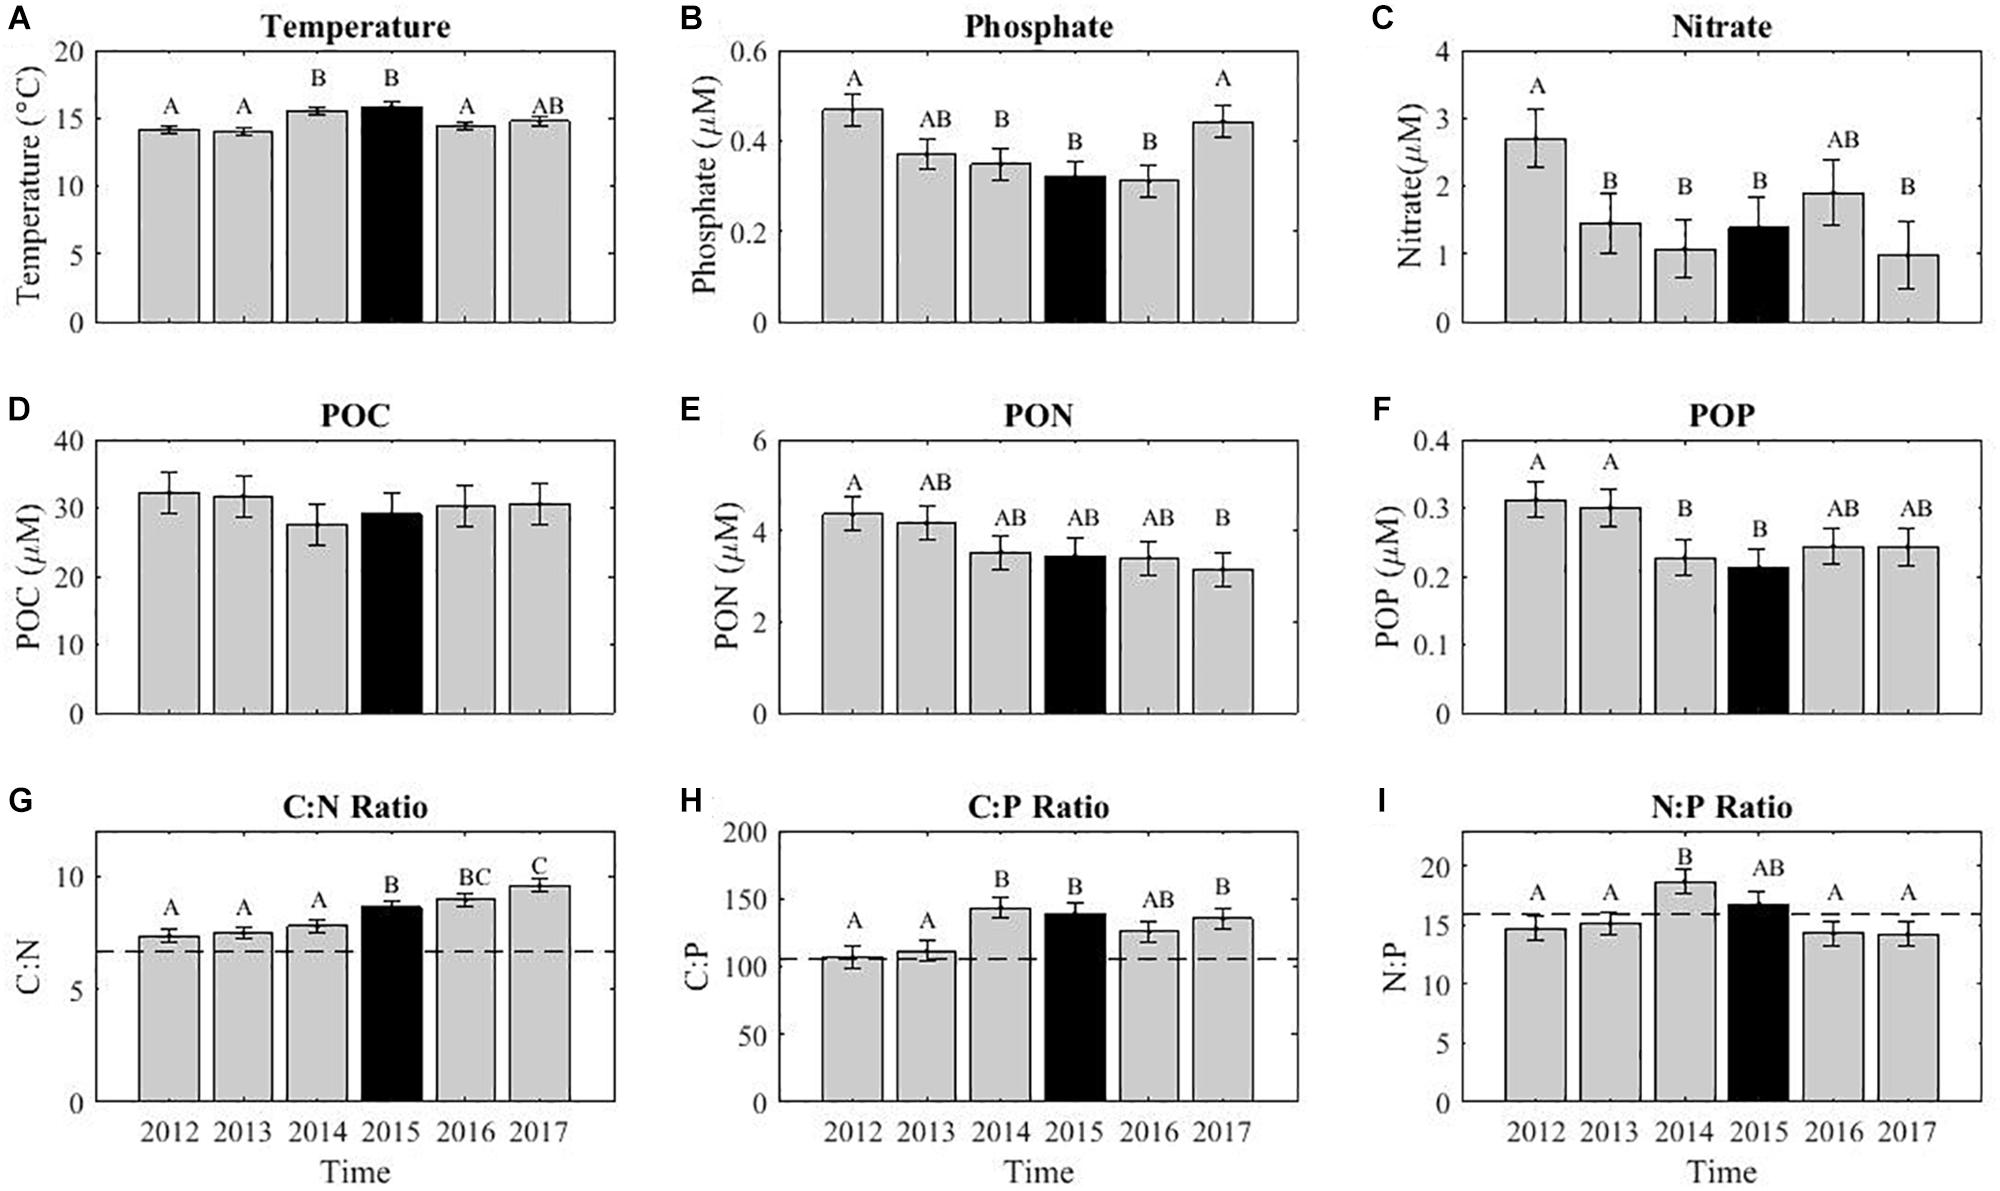
Figure 5. The average annual variability in environmental conditions (A–C), POM concentrations (D–F), and stoichiometric ratios (G–I). The annual variations in August quantified using a linear decomposition of annual and monthly variation. Error bars represent the standard deviation. The letters above each bar represent a post hoc Tukey multiple comparison test (p < 0.05), where similar letters show no statistical difference. The dashed lines across the stoichiometric ratios indicates the static Redfield ratio (C:N = 6.6, C:P = 106, and N:P = 16), strictly used for comparison purposes.
Discussion
Our time-series data suggest that the 2015 El Niño event impacted SST, phosphate conditions, POM concentrations, and stoichiometric ratios in our study region. The El Niño event resulted in unusually high temperature conditions and lower phosphate concentrations. Such environmental conditions are starting to resemble open-ocean conditions although the POM concentrations are still much higher than common oligotrophic regions. The high C:P and N:P ratios during the El Niño event support our hypothesis although the underlying drivers are unclear. Due to the strong seasonal and annual links between temperature, phosphate and phytoplankton community at our site, we are unable to identify the exact mechanism resulting in high C:P and N:P.
The C:N ratio appeared to be regulated by different processes than C:P and N:P. At our study site, we saw a long-term decline in PON concentration that led to high C:N. We hypothesize that the observed trend in C:N is regulated by an overall N limitation, shown by the declining nitrate supply (Geider and LaRoche, 2002; Moreno and Martiny, 2018). The nitrate concentration followed a different multi-year trajectory in comparison to phosphate and temperature leading to lower nitrate concentrations in later years. It is unclear if changing nitrogen, i.e., nitrate and ammonium; levels were driven by differences in nutrient run-off or by offshore shifts in source water and upwelling strength. In 1998, the Santa Ana Regional Water Quality Control Board started regulating nitrogen run-off near our study site. This regulation has led to a decline in terrestrial nitrogen inputs (French et al., 2006). Furthermore, shifts in the source water for the SCB has led to declining phosphate:nitrate levels in subsurface waters (at the σθ = 26.5 kg m3 isopycnal surface; Bograd et al., 2014). Thus, there could be multiple ultimate causes for the observed declining nitrate level, but we predict that lower nitrate availability and plankton N stress has proximately led to higher C:N ratios.
We expect that the observed correspondence between changing environmental conditions and C:N:P are at least in part driven by shifts in phytoplankton community composition and physiological state. Our past work has demonstrated that increasing temperature and declining nutrient availability as observed during the El Niño event lead to increasing abundance of picophytoplankton lineages at the expense of larger eukaryotic phytoplankton (Martiny et al., 2016). Several studies have suggested that smaller phytoplankton lineages have higher C:P and N:P ratios (Klausmeier et al., 2004). Furthermore, phytoplankton will acclimate to increasing temperature and lower nutrient availability leading to higher cellular carbon-to-nutrient ratios. Both mechanisms could possibly explain the elevated C:P and N:P seen in late 2014 and 2015 but our data does not allow for a direct identification of the underlying mechanism controlling the shift in POM stoichiometry.
El Niño events can vary in their expression leading to unique impacts on the environmental conditions and biogeochemical functioning of the SCB (Capotondi et al., 2015; Jacox et al., 2016). The 2015 event is likely an ‘Eastern Pacific’ type leading to a temperature anomaly in the North Eastern Pacific Ocean (Paek et al., 2017). However, there was also a strong temperature anomaly in the equatorial section of the Pacific and a high overall warming of most of the eastern part of the basin. As such, the biogeochemical impact of the 2015 El Niño event may diverge from a traditional ‘Central Pacific’ event. In addition to the El Niño event, we also saw a strong positive temperature and negative nitrate anomaly in 2016 and 2017. Such a long term warming of the region may be caused by a shift in the Pacific Decadal Oscillation (PDO; Newman et al., 2016). A positive PDO leads to overall high temperatures in the central/eastern part of the Pacific Ocean (Mantua et al., 1997) and a >2°C temperature anomaly in the SCB. The underlying physical driver of the PDO is currently not clear but a shift in the phase could suggest elevated temperatures in the SCB for years to come. This would further lead to low POM concentrations but high C:nutrient ratios.
El Niño events can act as a natural ‘experiment’ to understand climate change effects on POM concentrations and stoichiometric ratios. Future climate scenarios predict increased SST and more stratified waters, and El Niño events share these characteristics. Due to the offshore topography at MICRO, the local conditions share similarities with pelagic waters rather than typical coastal regions. Thus, our findings suggest that elevated temperature cause changes in phytoplankton ecology with clear implications for POM concentrations and ratios. However, it is unclear whether or not future El Niño events will superimpose on or blend into the already high ocean temperatures in the region. If the former, we predict large changes in the biogeochemical and ecosystem functioning of the SCB in the future.
Data Availability
All datasets generated for this study are included in the manuscript and/or the Supplementary Files.
Author Contributions
AF collected the samples, quantified the measurements, worked on the data analysis, and edited the manuscript. ARM collected the samples, performed the data analysis, and wrote and edited the manuscript. ACM wrote and edited the manuscript.
Funding
Financial support for this work was provided by the UCI Undergraduate Research Opportunities Program (to AF), NSF Graduate Research Fellowship Program and UCI Chancellor’s Club Fellowship (to ARM), and NSF Biological Oceanography (OCE-1848576 to ACM).
Conflict of Interest Statement
The authors declare that the research was conducted in the absence of any commercial or financial relationships that could be construed as a potential conflict of interest
Acknowledgments
We would like to thank Professor Yu for advice on ENSO cycles, and Tanya Lam, Sarah Bowen, and Jenna Lee for contributing to the MICRO time-series.
Supplementary Material
The Supplementary Material for this article can be found online at: https://www.frontiersin.org/articles/10.3389/fmars.2019.00386/full#supplementary-material
TABLE S1 | Full Dataset for time series at MICRO study site. Including date, environmental conditions, POM concentrations and stoichiometric ratios for all replicates.
References
Bograd, S. J., Pozo, M., Di, E., Castro, C. G., Schroeder, I. D., Goericke, R., et al. (2014). Changes in source waters to the southern california bight. Deep. Res. 112, 42–52. doi: 10.1016/j.dsr2.2014.04.009cpssnm0cpesnm
Capotondi, A., Wittenberg, A. T., Newman, M., Di Lorenzo, E., Yu, J. Y., Braconnot, P., et al. (2015). Understanding enso diversity. Bull. Am. Meteorol. Soc. 96, 921–938. doi: 10.1175/BAMS-D-13-00117.1
Chavez, F. P. (2002). Biological and chemical consequences of the 1997-1998 El Niño in central california waters biological and chemical consequences of the 1997 – 1998 El Niño in central california waters. Prog. Oceanogr. 54, 205–232. doi: 10.1016/s0079-6611(02)00050-2
Checkley, D. M., and Barth, J. A. (2009). Progress in oceanography patterns and processes in the california current system. Prog. Oceanogr. 83, 49–64. doi: 10.1016/j.pocean.2009.07.028
Di Lorenzo, E., and Mantua, N. (2016). Multi-year persistence of the 2014/15 North Pacific marine heatwave. Nat. Clim. Chang. 6, 1042–1047. doi: 10.1038/nclimate3082
Dijkstra, H. A., and Burges, G. (2002). Fluid dynamics of el nino variability. Annu. Rev. Fluid Mech. 34, 531–558. doi: 10.1146/annurev.physchem.57.032905.104621
French, C., Wu, L., Meixner, T., Kabashima, J., and Jury, W. A. (2006). Modeling nitrogen transport in the newport bay / san diego creek watershed of southern california. Agric. Water Manag. 81, 199–215. doi: 10.1016/j.agwat.2005.03.006
Garcia, N. S., Bonachela, J. A., and Martiny, A. C. (2016). Interactions between growth-dependent changes in cell size, nutrient supply and cellular elemental stoichiometry of marine Synechococcus. ISME J. 10, 2715–2724. doi: 10.1038/ismej.2016.50
Geider, R. J., and LaRoche, J. (2002). Redfield revisited: variability of C:N:P in marine microalgae and its biochemical basis. Eur. J. Phycol. 37, 1–17. doi: 10.1017/S0967026201003456
Huang, B., Thorne, P. W., Banzon, V. F., Boyer, T., Chepurin, G., Lawrimore, J. H., et al. (2017). Extended reconstructed sea surface temperature, version 5 (ersstv5): upgrades, validations, and intercomparisons. Am. Meterol. Soc. 5, 8179–8205. doi: 10.1175/JCLI-D-16-0836.1
Jacox, M. G., Hazen, E. L., Zaba, K. D., Rudnick, D. L., Edwards, C. A., Moore, A. M., et al. (2016). Impacts of the 2015–2016 El Niño on the california current system: early assessment and comparison to past events. Geophys. Res. Lett. 43, 7072–7080. doi: 10.1002/2016GL069716
Karl, D. M., and Tien, G. (1992). MAGIC: a sensitive and precise method for measuring dissolved phosphorus in aquatic environments. Limnol. Oceanogr. 37, 105–116. doi: 10.4319/lo.1992.37.1.0105
Kim, H., Webster, P. J., and Curry, J. A. (2009). Impact of shifting patterns of pacific ocean warming on north atlantic tropical cyclones. Science 325, 77–80. doi: 10.1126/science.1174062
King, A. L., and Barbeau, K. A. (2011). Dissolved iron and macronutrient distributions in the southern california current system. J. Geophys. Res. Ocean. 116:8. doi: 10.1029/2010JC006324
Klausmeier, C. A., Litchman, E., and Levin, S. A. (2004). Phytoplankton growth and stoichiometry under multiple nutrient limitation. Limnol. Oceanogr. 49, 1463–1470. doi: 10.4319/lo.2004.49.4_part_2.1463
Knap, A. H., Michaels, A., Dow, R. L., Johnson, R., Gundersen, K., Sorensen, J., et al. (1993). Bermuda Atlantic Time-series Study Methods Manual (Version 3). Oxford: JGOFS.
Lomas, M. W., Burke, A. L., Lomas, D. A., Bell, D. W., Shen, C., Dyhrman, S. T., et al. (2010). Sargasso sea phosphorus biogeochemistry: an important role for dissolved organic phosphorus (DOP). Biogeosciences 7, 695–710. doi: 10.5194/bg-7-695-2010
Mantua, N. J., Hare, S. R., Zhang, Y., Wallace, J. M., and Francis, R. C. (1997). A pacific interdecadal climate oscillation with impacts on salmon production. Bull. Am. Meteorol. Soc. 78, 1069–1079. doi: 10.1175/1520-0477(1997)078<1069:apicow>2.0.co;2
Martiny, A. C., Pham, C. T. A., Primeau, F. W., Vrugt, J. A., Moore, J. K., Levin, S. A., et al. (2013a). Strong latitudinal patterns in the elemental ratios of marine plankton and organic matter. Nat. Geosci. 6, 1–5. doi: 10.1038/ngeo1757
Martiny, A. C., Vrugt, J. A., Primeau, F. W., and Lomas, M. W. (2013b). Regional variation in the particulate organic carbon to nitrogen ratio in the surface ocean. Glob.al Biogeochem. Cycles 27, 723–731. doi: 10.1002/gbc.20061
Martiny, A. C., Talarmin, A., Mouginot, C., Lee, J. A., Huang, J. S., Gellene, A. G., et al. (2016). Biogeochemical interactions control a temporal succession in the elemental composition of marine communities. Limnol. Oceanogr. 61, 531–542. doi: 10.1002/lno.10233
Mcgowan, J. A., Cayan, D. R., and Dorman, L. M. (1998). Climate-Ocean variability and ecosystem response in the northeast pacific. Science 281, 210–217. doi: 10.1126/science.281.5374.210
McPhaden, M. J. (2015). Playing hide and seek with El Niño. Nat. Clim. Chang. 5, 791–795. doi: 10.1038/nclimate2775
Moreno, A. R., and Martiny, A. C. (2018). Ecological stoichiometry of ocean plankton. Ann. Rev. Mar. Sci. 10, 43–69. doi: 10.1146/annurev-marine-121916-063126
Newman, M., Alexander, M. A., Ault, T. R., Cobb, K. M., Deser, C., Di Lorenzo, E., et al. (2016). The pacific decadal oscillation, revisited. Am. Meterol. Soc. 29, 4399–4427. doi: 10.1175/JCLI-D-15-0508.1
Paek, H., Yu, J. Y., and Qian, C. (2017). Why were the 2015/2016 and 1997/1998 extreme El Niños different? Geophys. Res. Lett. 44, 1848–1856. doi: 10.1002/2016GL071515
Pomeroy, L. R., Wiebe, W. J., Deibel, D., Thompson, R. J., Rowe, G. T., and Pakulski, J. D. (1991). Bacterial responses to temperature and substrate concentration during the newfoundland spring bloom. Mar. Ecol. Prog. Ser. 75, 143–159. doi: 10.3354/meps075143
Racault, M.-F., Sathyendranath, S., Brewin, R. J. W., Raitsos, D. E., Jackson, T., and Platt, T. (2017). Impact of El Niño Variability on Oceanic Phytoplankton. Front. Mar. Sci. 4:133. doi: 10.3389/fmars.2017.00133
Redfield, A. C. (1958). The biological control of the chemical factors in the environment. Am. Sci. 46, 1–18.
Reynolds, R. W., Rayner, N. A., Smith, T. M., Stoker, D. C., and Wang, W. (2002). An Improved In Situ and Satellite SST Analysis for Climate. J. Clim. 15, 1609–1625. doi: 10.1175/1520-0442(2002)015<1609:aiisas>2.0.co;2
Sharp, J. H. (1974). Improved analysis for “particulate” organic carbon and nitrogen from seawater. Limnol. Oceanogr. 19, 984–989. doi: 10.4319/lo.1974.19.6.0984
Sterner, R. W., and Elser, J. J. (2002). Ecological stoichiometry: the biology of elements from molecules to the biosphere. Princeton, NJ: Princeton University Press.
Tegner, M. J., and Dayton, P. K. (1987). El Nino Effects on Southern California Kelp Forest Communities. Adv. Ecol. Res. 17, 243–279. doi: 10.1016/s0065-2504(08)60247-0
Toseland, A., Daines, S. J., Clark, J. R., Kirkham, A., Strauss, J., Uhlig, C., et al. (2013). The impact of temperature on marine phytoplankton resource allocation and metabolism. Nat. Clim. Chang. 3, 979–984. doi: 10.1038/nclimate1989
Keywords: MICRO, ecological stoichiometry, marine, ENSO, redfield
Citation: Fagan AJ, Moreno AR and Martiny AC (2019) Role of ENSO Conditions on Particulate Organic Matter Concentrations and Elemental Ratios in the Southern California Bight. Front. Mar. Sci. 6:386. doi: 10.3389/fmars.2019.00386
Received: 19 February 2019; Accepted: 20 June 2019;
Published: 11 July 2019.
Edited by:
Christian Lønborg, Australian Institute of Marine Science (AIMS), AustraliaReviewed by:
Stuart C. Painter, National Oceanography Centre, United KingdomHelene Frigstad, Norwegian Institute for Water Research (NIVA), Norway
Copyright © 2019 Fagan, Moreno and Martiny. This is an open-access article distributed under the terms of the Creative Commons Attribution License (CC BY). The use, distribution or reproduction in other forums is permitted, provided the original author(s) and the copyright owner(s) are credited and that the original publication in this journal is cited, in accordance with accepted academic practice. No use, distribution or reproduction is permitted which does not comply with these terms.
*Correspondence: Adam C. Martiny, YW1hcnRpbnlAdWNpLmVkdQ==
†These authors have contributed equally to this work