 Caroline Brennan
 Matthew Ashley
 Owen Molloy
- 1Discipline of Information Technology, College of Engineering and Informatics, National University of Ireland, Galway, Ireland
- 2School of Biological and Marine Sciences, University of Plymouth, Plymouth, United Kingdom
Ocean Literacy (OL) has multiple aspects or dimensions: from knowledge about how the oceans work and our impact on them, to attitudes toward topics such as sustainable fisheries, and our behaviour as consumers, tourists, policy makers, fishermen, etc. The myriad ways in which individuals, society and the oceans interact result in complex dynamic systems, composed of multiple interlinked chains of cause and effect. To influence our understanding of these systems, and thereby increase our OL, means to increase our knowledge of our own and others’ place and role in the web of interactions. Systems Thinking has a potentially important role to play in helping us to understand, explain and manage problems in the human-ocean relationship. Leaders in the OL field have recommended taking a systems approach in order to deal with the complexity of the human-ocean relationship. They contend that the inclusion of modelling and simulation will improve the effectiveness of educational initiatives. In this paper we describe a pilot study centred on a browser-based Simulation-Based Learning Environment (SBLE) designed for a general audience that uses System Dynamics simulation to introduce and reinforce systems-based OL learning. It uses a storytelling approach, by explaining the dynamics of coastal tourism through a System Dynamics model revealed in stages, supported by fact panels, pictures, simulation-based tasks, causal loop diagrams and quiz questions. Participants in the pilot study were mainly postgraduate students. A facilitator was available to participants at all times, as needed. The model is based on a freely available normalised coastal tourism model by Hartmut Bossel, converted to XMILE format. Through the identification and use of systems archetypes and general systems features such as feedback loops, we also tested for the acquisition of transferable skills and the ability to identify, apply or create sustainable solutions. Levels of OL were measured before and after interaction with the tool using pre- and post-survey questionnaires and interviews. Results showed moderate to very large positive effects on all the OL dimensions, which are also shown to be associated with predictors of behaviour change. These results provide motivation for further research.
Introduction
The functioning of the oceans and the human-ocean relationship have, up to now, been poorly understood. In the past, the ocean was for many people a remote place, used by a few as a source of food, and as a means of travel. However, the last centuries have seen a dramatic increase in its use, for oil and gas exploration, wind farms, aquaculture, tourism and much increased transport of goods. More maritime sectors are emerging, as illustrated in the EU strategy for Blue Growth. This increased pressure on the ocean makes it more pressing to protect the seas from the consequences of human use. Pressures on marine ecosystems must be reduced and the development opportunities offered by the ocean must be managed sustainably.
In recent years there have been a number of important international efforts to promote Ocean Literacy (OL).
The National Marine Educators Association (NMEA)1 in the US has been at the forefront, worldwide, of work to define OL, centring on their ‘7 Ocean Literacy Principles’, and to make recommendations for education in the ocean sciences. Their special report, ‘Ocean Literacy Scope and Sequence for Grades K-12’ (National Marine Educators Association, 2010), includes an article by Tran et al. (2010), which asserts that an absence of systems literacy impedes learning and teaching ocean sciences, with few if any examples of systems-oriented teaching initiatives found in the field of OL.
The NMEA supported the inception of the European Marine Science Educators Association (EMSEA) in 2012. Since then, the European Union has adopted the OLPs, has committed to the development of OL within the EU, and has provided for a number of OL projects under Horizon 2020, including ResponSEAble2. According to EMSEA, ‘A more informed and concerned public will better understand the need to manage the ocean resources and marine ecosystems in a sustainable way’3.
On 25 September 2015 the 193 countries of the United Nations General Assembly announced 17 Sustainable Development Goals, including Goal 14: ‘Conserve and sustainably use the oceans, seas and marine resources for sustainable development’4. The 14 targets within this goal include sustainable management of fisheries, aquaculture and tourism, and an increase in scientific knowledge of the oceans.
Given the need for greater public understanding of marine issues, and for a basic level of Systems literacy needed to underpin this, we created an online OL tool that was designed to teach ocean issues and the necessary System concepts together, to a general audience. Interaction with simulations was an integral part of this. The test case was Coastal Tourism. We conducted a pilot study in December 2018 and measured the effectiveness of the tool using pre- and post-survey questionnaires and interviews.
The following sections will explore some of the concepts underlying the recommendations by the NMEA, such as complex systems, Systems literacy, what it means to take a Systems approach, the human-ocean relationship as a system, and modelling and simulation in the context of educational tools.
Background
Defining Ocean Literacy
The most popular definition of OL currently in use was developed by the National Oceanic and Atmospheric Administration (2013), as follows: ‘Ocean literacy is an understanding of the ocean’s influence on you – and your influence on the ocean.’ An ocean-literate person:
• Understands the importance of the ocean to humankind
• Can communicate about the ocean in a meaningful way
• Is able to make informed and responsible decisions regarding the ocean and its resources’5
A survey of OL definitions reveals that in its broadest sense, it is not just what we “know”, but also how we feel (our attitudes) on certain issues, how we behave in our personal and professional lives, and the extent to which we communicate about ocean-related issues with our families, friends and acquaintances. This can range from casual conversations, to promoting discussions and ideas on social media to engaging in social activism. According to the definition of Ocean Environmental Awareness proposed by Umuhire and Fang (2016), it includes a readiness to participate in marine environment actions.
For the ResponSEAble project, and this study, the authors of this paper have amalgamated the various definitions of literacy to create a framework consisting of OL dimensions (see Figure 1). Each dimension is measured independently, and an individual can have different levels in different dimensions. We define the dimensions as follows:
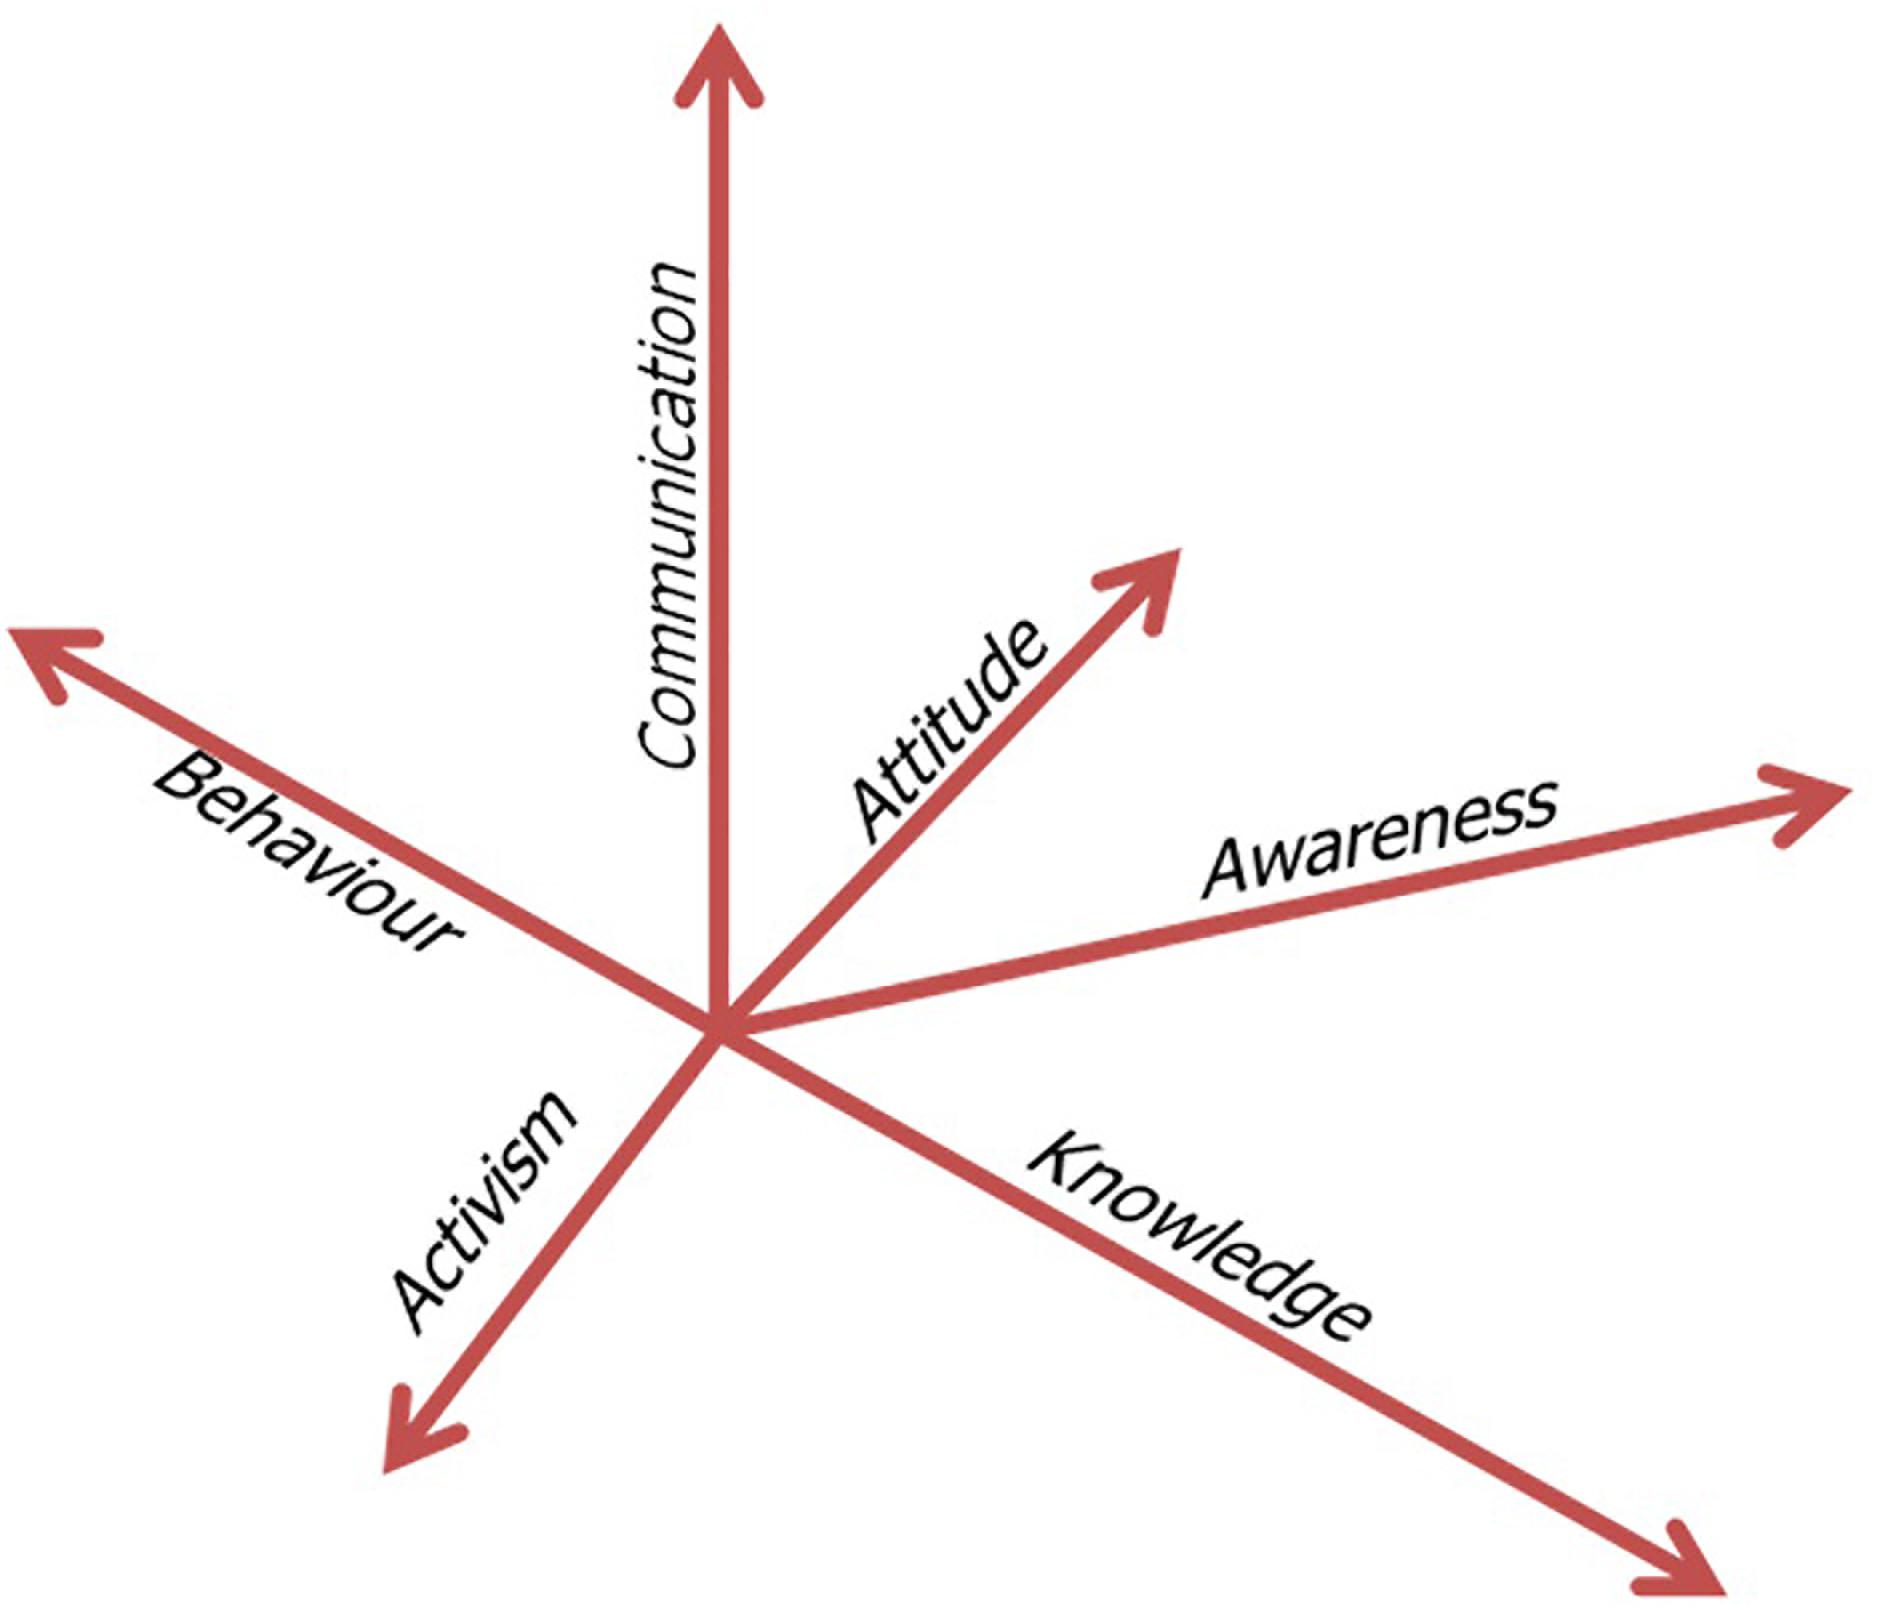
Figure 1. The Ocean Literacy dimensions.
• Awareness as the basic knowledge that a situation, problem or concept exists.
• Knowledge is what a person knows about an ocean related topic and the links between topics.
• Attitude is related to a level of agreement with or concern for a particular position.
• Communication is the extent to which a person communicates with others, such as family and peer groups, on ocean related topics.
• Behaviour relates to decisions, choices, actions, and habits with respect to ocean related issues.
• Activism is the degree to which a person engages in activities such as campaigning (for example through social media) to bring about changes in policy, attitudes, behaviour, etc.
Unfortunately there is no absolute scale on which we can measure these OL dimensions, so normally we are more interested in tracking shifts or changes in people’s knowledge, attitude, awareness, communication, behaviour and activism.
Relationship Between the Ocean Literacy Dimensions and Behaviour Change
Numerous studies have been conducted on the links between environmental knowledge, attitude and behaviour, with sometimes conflicting results. Díaz-Siefer et al. (2015) showed that there is a correlation between greater human-environment system knowledge and pro-environmental behaviour. However, correlation does not imply causation, as numerous other studies have shown. In a study of the relationship between knowledge, attitude and behaviours toward energy consumption, Paço and Lavrador (2017) found a lack of relationship between knowledge and attitudes and between knowledge and behaviour, while there was just a weak relationship between attitudes and behaviour. Johnson and Činčera (2015) found in their work with schoolchildren that attitude change was the primary factor in promoting environmental behaviour, while knowledge alone does not often change what people do in reality. Values and attitudes are key to behaviour change. In work on pro-environmental behaviour among urban residents in Malaysia, Latif et al. (2013) found indirect links between knowledge and behaviour, with environmental values determining behaviour. In work with students, Kukkonen et al. (2018) found that scientific ecological knowledge alone is not sufficient to advance pro-environmental behaviour.
The aim of our experimental OL tool is ultimately behaviour change. In evaluating the effectiveness of the tool, changes in participants’ levels of the OL dimensions are measured in order to evaluate the likelihood of behaviour change after the intervention (see section “Evaluation Methodology”).
Taking a Systems Approach to Ocean Literacy
What Is a Complex System?
According to the Merriam-Webster dictionary, a system is defined as a regularly interacting or interdependent group of items forming a unified whole. A system is more than a collection of its parts (Meadows, 2008). Systems generally consist of elements, interrelationships, and an overall function or purpose (the purpose of an education system is education, and that of a digestive system is to break down food, for example). They are inherently complex, with multiple causal links between elements that can result in unexpected behaviour.
What Is Systems Literacy?
To be literate means having a good understanding of a particular subject. To be literate about Systems means to consider not only the parts but the interrelationships, patterns, and dynamics when faced with complex issues. It means embracing complexity. Linda Booth-Sweeney argues that ‘most of us… were taught that the best way to understand a subject was to analyse it or break it up into parts. We were not taught the skills we need to see systems of complex cause and effect relationships and unintended impacts.’6 She defines Systems literacy as a combination of ‘conceptual knowledge (knowledge of system properties and behaviours) and reasoning skills (the ability to locate situations in wider contexts, see multiple levels of perspective within a system, trace complex interrelationships, look for endogenous or “within system” influences, be aware of changing behaviour over time, and recognise recurring patterns that exist within a wide variety of systems).’
What Is Systems Thinking?
The concept of Systems Literacy is closely related to that of ST. Arnold and Wade (2015) review various definitions of ST and its key components. The term was coined by Barry Richmond in 1987. In essence, ST is the ability to understand, represent, predict and manage dynamic complexity, i.e., behaviour that arises from the interaction of a system’s parts over time. Key ST skills include discovering feedback loops, stock and flow relationships, recognising delays, identifying non-linear relationships, and understanding the boundaries of mental (and formal) models.
Barry Richmond defines ST as ‘the art and science of making reliable inferences about behaviour by developing an increasingly deep understanding of underlying structure… [and] people embracing ST position themselves such that they can see both the forest and the trees (one eye on each).’ (Richmond, 1994).
Like Booth-Sweeney, Arnold and Wade assert that ‘Systems Thinking is widely believed to be critical in handling the complexity facing the world in the coming decades; however, it still resides in the educational margins.’
The Benefits of Identifying Abstract Characteristics of Systems
Learning to recognise similar patterns of structure and behaviour occurring in different systems is a core ST skill. These recurring systems patterns are known as systems archetypes. They offer the opportunity for accelerated learning about newly encountered systems – with an obvious potentially positive effect on both overall environmental literacy and systems literacy. As noted by Forrester (2007), “A rather small number of relatively simple and compact structures are found repeatedly in different businesses, professions, institutions, and problems. One… junior high school student, working with bacteria in a culture and in computer simulation, observed, “This is the world population problem, isn’t it?” … [This is the] transfer of insights from one setting to another …”.
Examples of systems archetypes are “Tragedy of the Commons”, “Limits to Growth” and “Success to the Successful” (Wolstenholme, 2003; Meadows, 2008). Systems archetypes have well-known behaviours when the system is out of control – and, crucially, they have known ‘fixes’. Why try to solve each problem as if it is brand new, when tried-and-tested reusable solutions exist?
The Human-Ocean System
The HOS fits the definition of a complex system, in that it is a complex whole consisting of mutually interacting parts. Understanding the system involves a study of the whole, as well as the parts. Given the many ways that human actors interact with the ocean, an understanding of multiple perspectives, interrelationships and dependencies is needed. In order to bring about improvements in the state of the ocean, and to plan to make sustainable use of its resources in the future, it is necessary to be able to reliably predict the impact of changes to the system. These are all key ST skills (Arnold and Wade, 2015).
Mental Models
As discussed in Landriscina (2013a), certain types of human reasoning require the use of ‘mental models’. Psychologist Kenneth Craik, one of the earliest practitioners of cognitive science, first laid the foundation for the concept of mental models, asserting that the mind develops these ‘small-scale models of reality’ on the basis of experience (Craik, 1967). They are internal representations of reality that we use to understand, reason about, and predict events. They represent knowledge, and are a relatively stable cognitive structure. According to Sterman (2002), becoming an effective Systems Thinker ‘requires the use of formal models and simulations to test our mental models and develop our intuition about complex systems’.
Mental Models for Understanding Human-Ocean Systems
Where the aim is to improve understanding of a complex system in order to effect change, we need to develop and then communicate a mental model of the system in question.
While knowledge is just one factor in what makes people change their attitudes and behaviour, knowledge of the causal mechanisms involved allows them to make informed decisions. It also facilitates more effective communication with others.
The DPSIR framework
One causal modelling framework suitable for modelling the complex HOS is the DPSIR framework (Driver, Pressure, State, Impact, Response Framework [DPSIR], 2013), of which there are numerous variations (Patrício et al., 2016; Elliott et al., 2017). The DAPSIWR variant is useful in describing interactions between society and the environment. The letters in the acronym represent Drivers, Activities, Pressures, States, Impacts, Responses and Welfare. For the ResponSEAble project, the DAPSIWR framework was used to create causal models of six key topics or ‘stories’, including Coastal Tourism and Sustainable Fisheries.
Whilst this framework is useful for structuring knowledge and causal relationships flowing in one direction, it does not capture dynamics such as feedback loops, time delays, and stocks and flows, and it does not support simulation. SD models do support these features.
Modelling Complex Systems to Support Learning
There are many kinds of modelling and simulation paradigms (Landriscina, 2013a, chapter 4).
System Dynamics Modelling
System Dynamics was created during the mid-1950s by Jay Forrester (1961). It is a method for understanding the dynamic behaviour of complex systems over time. Causal loop diagrams are constructed in order to visualise a system’s structure and behaviour and analyse the system qualitatively. Feedback loops and time delays are identified. The causal loop diagram, a qualitative conceptual map, is then usually transformed into a stock and flow diagram to create a more detailed quantitative analysis. A stock is the term for any entity that accumulates or depletes over time, and a flow is the rate of change in a stock. Stock and flow models demonstrate feedback, accumulation of flows into stocks and time delays. The model includes equations defining flows over time, and initial stock levels and parameters. The stock and flow model created is then typically built and simulated using computer software. This demonstrates changes in stock levels over time according to the model definition.
System Dynamics modelling has many applications and is very useful for visualising system behaviour over time, and for designing and testing effective strategies for system change.
Of the various ways to model complex systems, SD seems to us to be most suitable, since such models have been used successfully to examine complex social, managerial, economic, and ecological problems. The HOS is a form of what is variously called a coupled human-environment system, a coupled natural-human system, a socio-environmental system or a social-ecological system (SES), in which humans are seen as an integral part of the biophysical world. The ‘WORLD3’ model underpinning ‘Limits to Growth’ (Meadows et al., 1972) and the range of environmental and natural resource systems modelled by Andrew Ford (1999) are good examples of applying SD modelling to SESs. SD models are well-suited for representing such systems, since they can include the ‘soft’ variables often necessary when modelling human motivations, and they are useful for providing the broad, ‘big picture’ perspective necessary both for making sense out of inherent complexity, and for designing effective policy decisions.
Models and Simulation
According to Forrester (2007), ‘It is only from the actual simulations that inconsistencies within our mental models are revealed.’ And in the field of OL, ‘Understanding complex systems like the ocean is difficult. However, the use of models [and] computer simulations… strongly enhance learning and teaching.’ (National Oceanic and Atmospheric Administration, 2013).
Computer-based simulations rely on formalised conceptual models built by making mental models explicit, subjecting them to scrutiny and then refining them.
Simulation in Education
In their critical review of 61 studies to evaluate effectiveness of simulations used for science instruction, Smetana and Bell (2012) report on detailed findings across a wide range of factors determining the best use of simulation, including types of support, combination with other instructional methods, and their optimal order. They say that the evidence clearly demonstrates the importance of the teacher in providing guidance and support during simulation and may even replace the need for supports embedded in the software, and that ‘simulations used in isolation were found to be ineffective’.
There are two main approaches to SBLE – learning by building a simulation, or by using an existing one. Learners can gain more insight from building models (Gobert and Buckley, 2000), but considerable time and skills are required. If this is not feasible, manipulation of an existing simulation offers an alternative. The approach can vary from the simplest, where learners can change a few variable values and see the consequences of their decisions on graphs, to the more complex, where learners can restructure the model. For the pilot study we have adopted the simplest approach.
The question of model opacity requires careful thought (Landriscina, 2013b). Learners interact with the SBLE through the simulation program’s user interface – not with the conceptual model directly. There are ‘black box’ and ‘glass-box’ model simulations. In the former, learners can explore a system’s behaviour, but the underlying conceptual model remains hidden and can only be inferred. This can lead to learners making incorrect assumptions about the conceptual model. In the latter, the simulations overtly display relationships between variables. However, this requires the learner to have some familiarity with that modelling method. One way to render the model’s structure more understandable is to disclose it in stages, via a guided narrative, an approach we have taken in this pilot study.
The Challenge of Increasing Systems Literacy
Whilst the benefits of a systems approach to environmental problems are well established (Meadows et al., 1972), the challenges of teaching ST and SD are also well documented (Sweeney and Sterman, 2000; Cronin et al., 2009). People struggle to comprehend stock-and-flow and causal loop diagrams, and to visualise the dynamics of even simple systems.
ST requires a change in perspective, and a different form of reasoning than is normally applied from a non-systems perspective – a ‘Paradigm Shift’, to use the phrase coined by the philosopher Kuhn (1962).
Our Approach
Presenting the Complex Human-Ocean System
The DAPSIWR ‘stories’ built for the ResponSEAble project were highly complex. The main difficulty we found was how to present this complex knowledge adequately without overwhelming the learner. We investigated a number of different approaches, including data visualisation techniques, the use of narratives, storytelling, ‘story maps’, guided and/or gradual display of the DAPSIWR, and web-based multimedia.
We concluded that the most promising approach was to take a Systems view. Finding and explaining the essential dynamics of the system helps to find order in complexity and can be done relatively economically. We chose one key story as a case study, Coastal Tourism, and analysed the HOS underlying it, in order to find system structures such as feedback loops, stocks and flows, and system archetypes.
Research Questions
Our work is designed to help answer the following research questions:
1. Does the inclusion of Systems Thinking and System Dynamics make teaching a specific Ocean Literacy topic more effective, in terms of faster acquisition of skills, deeper understanding, development of critical thinking skills, and/or greater retention?
2. Does the teaching of Systems Constructs and Systems Archetypes in particular help learners to transfer their knowledge from one specific Ocean Literacy topic to another?
3. Does the use of Systems Thinking and System Dynamics in Ocean Literacy education increase the ability to recognise, create or apply sustainable solutions in that domain?
Methods
Our approach was to identify those basic concepts which are essential foundations for effective system thinking. We then performed a mapping (see Figure 2) between these basic concepts and the phenomena which exemplify them in the key story chosen as the sample system - Coastal Tourism. We aimed to simultaneously impart ST knowledge and improved knowledge and understanding of the key story (Coastal Tourism) itself.
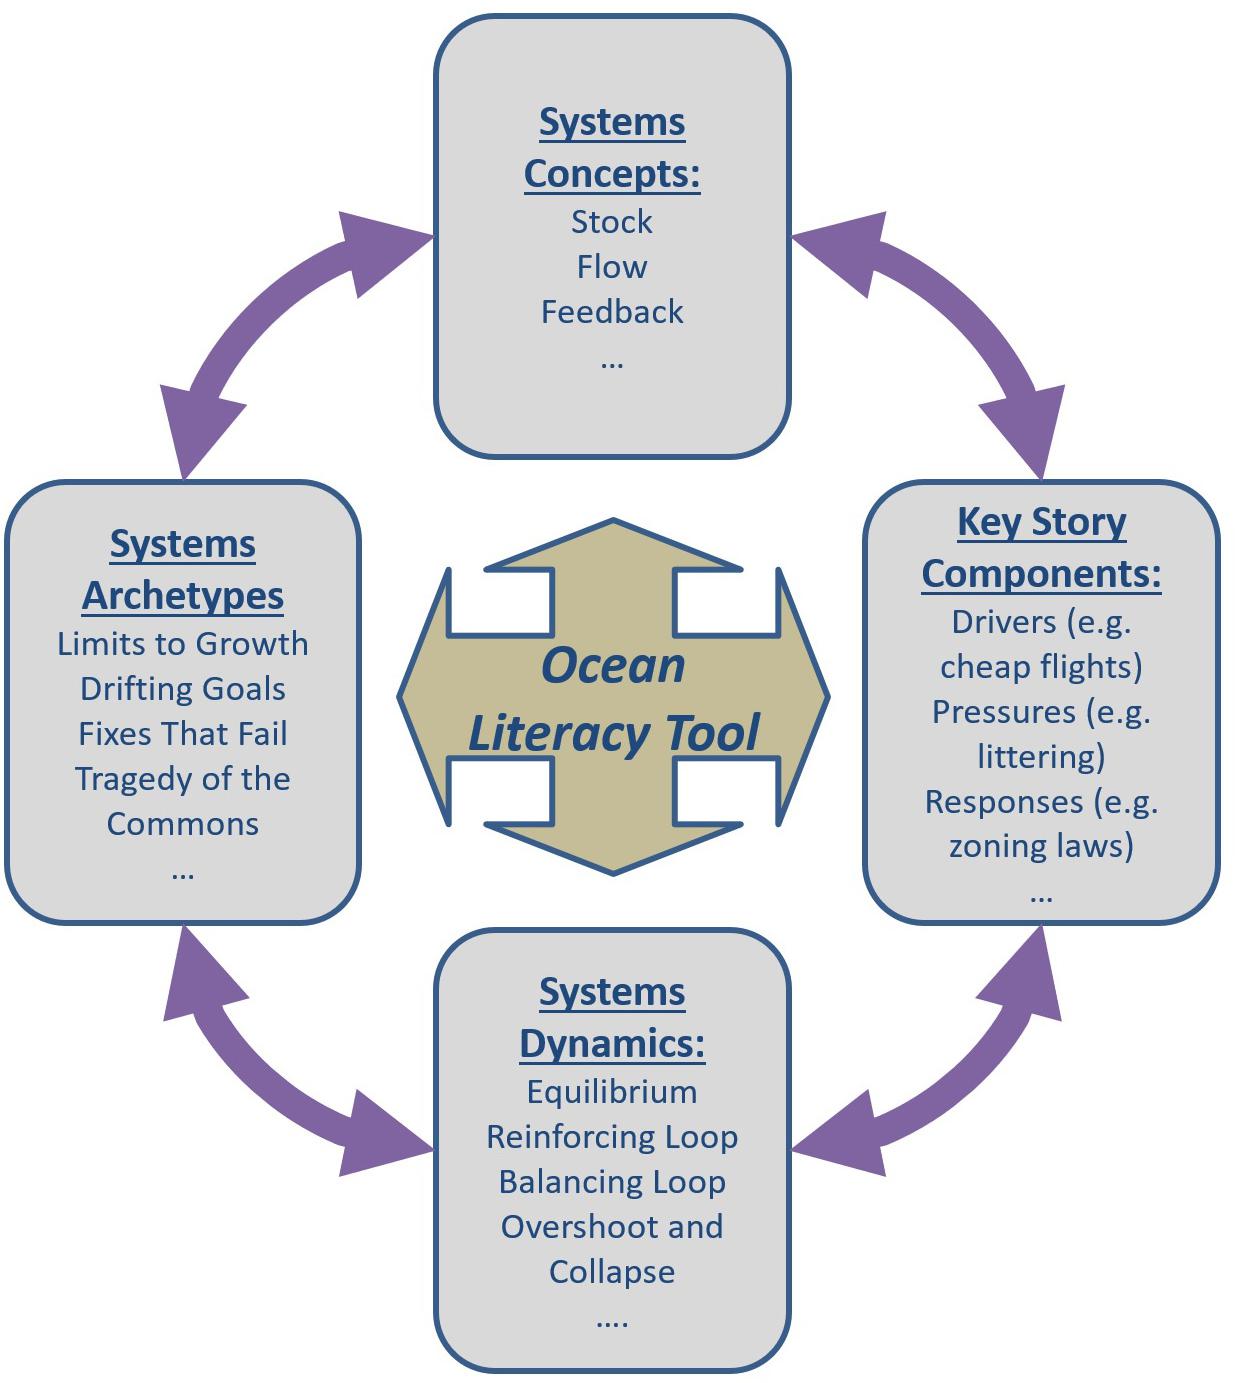
Figure 2. Systems Thinking and Key Story concept map.
The System Simulation Learning Tool
This first version of the tool was designed for a general audience7. It is unique in using online simulation of a SD model as part of an OL tool. The user is led through a series of pages which introduce and explain the Coastal Tourism story in a gradual manner. Sample screenshots are given in Figures 3–5.
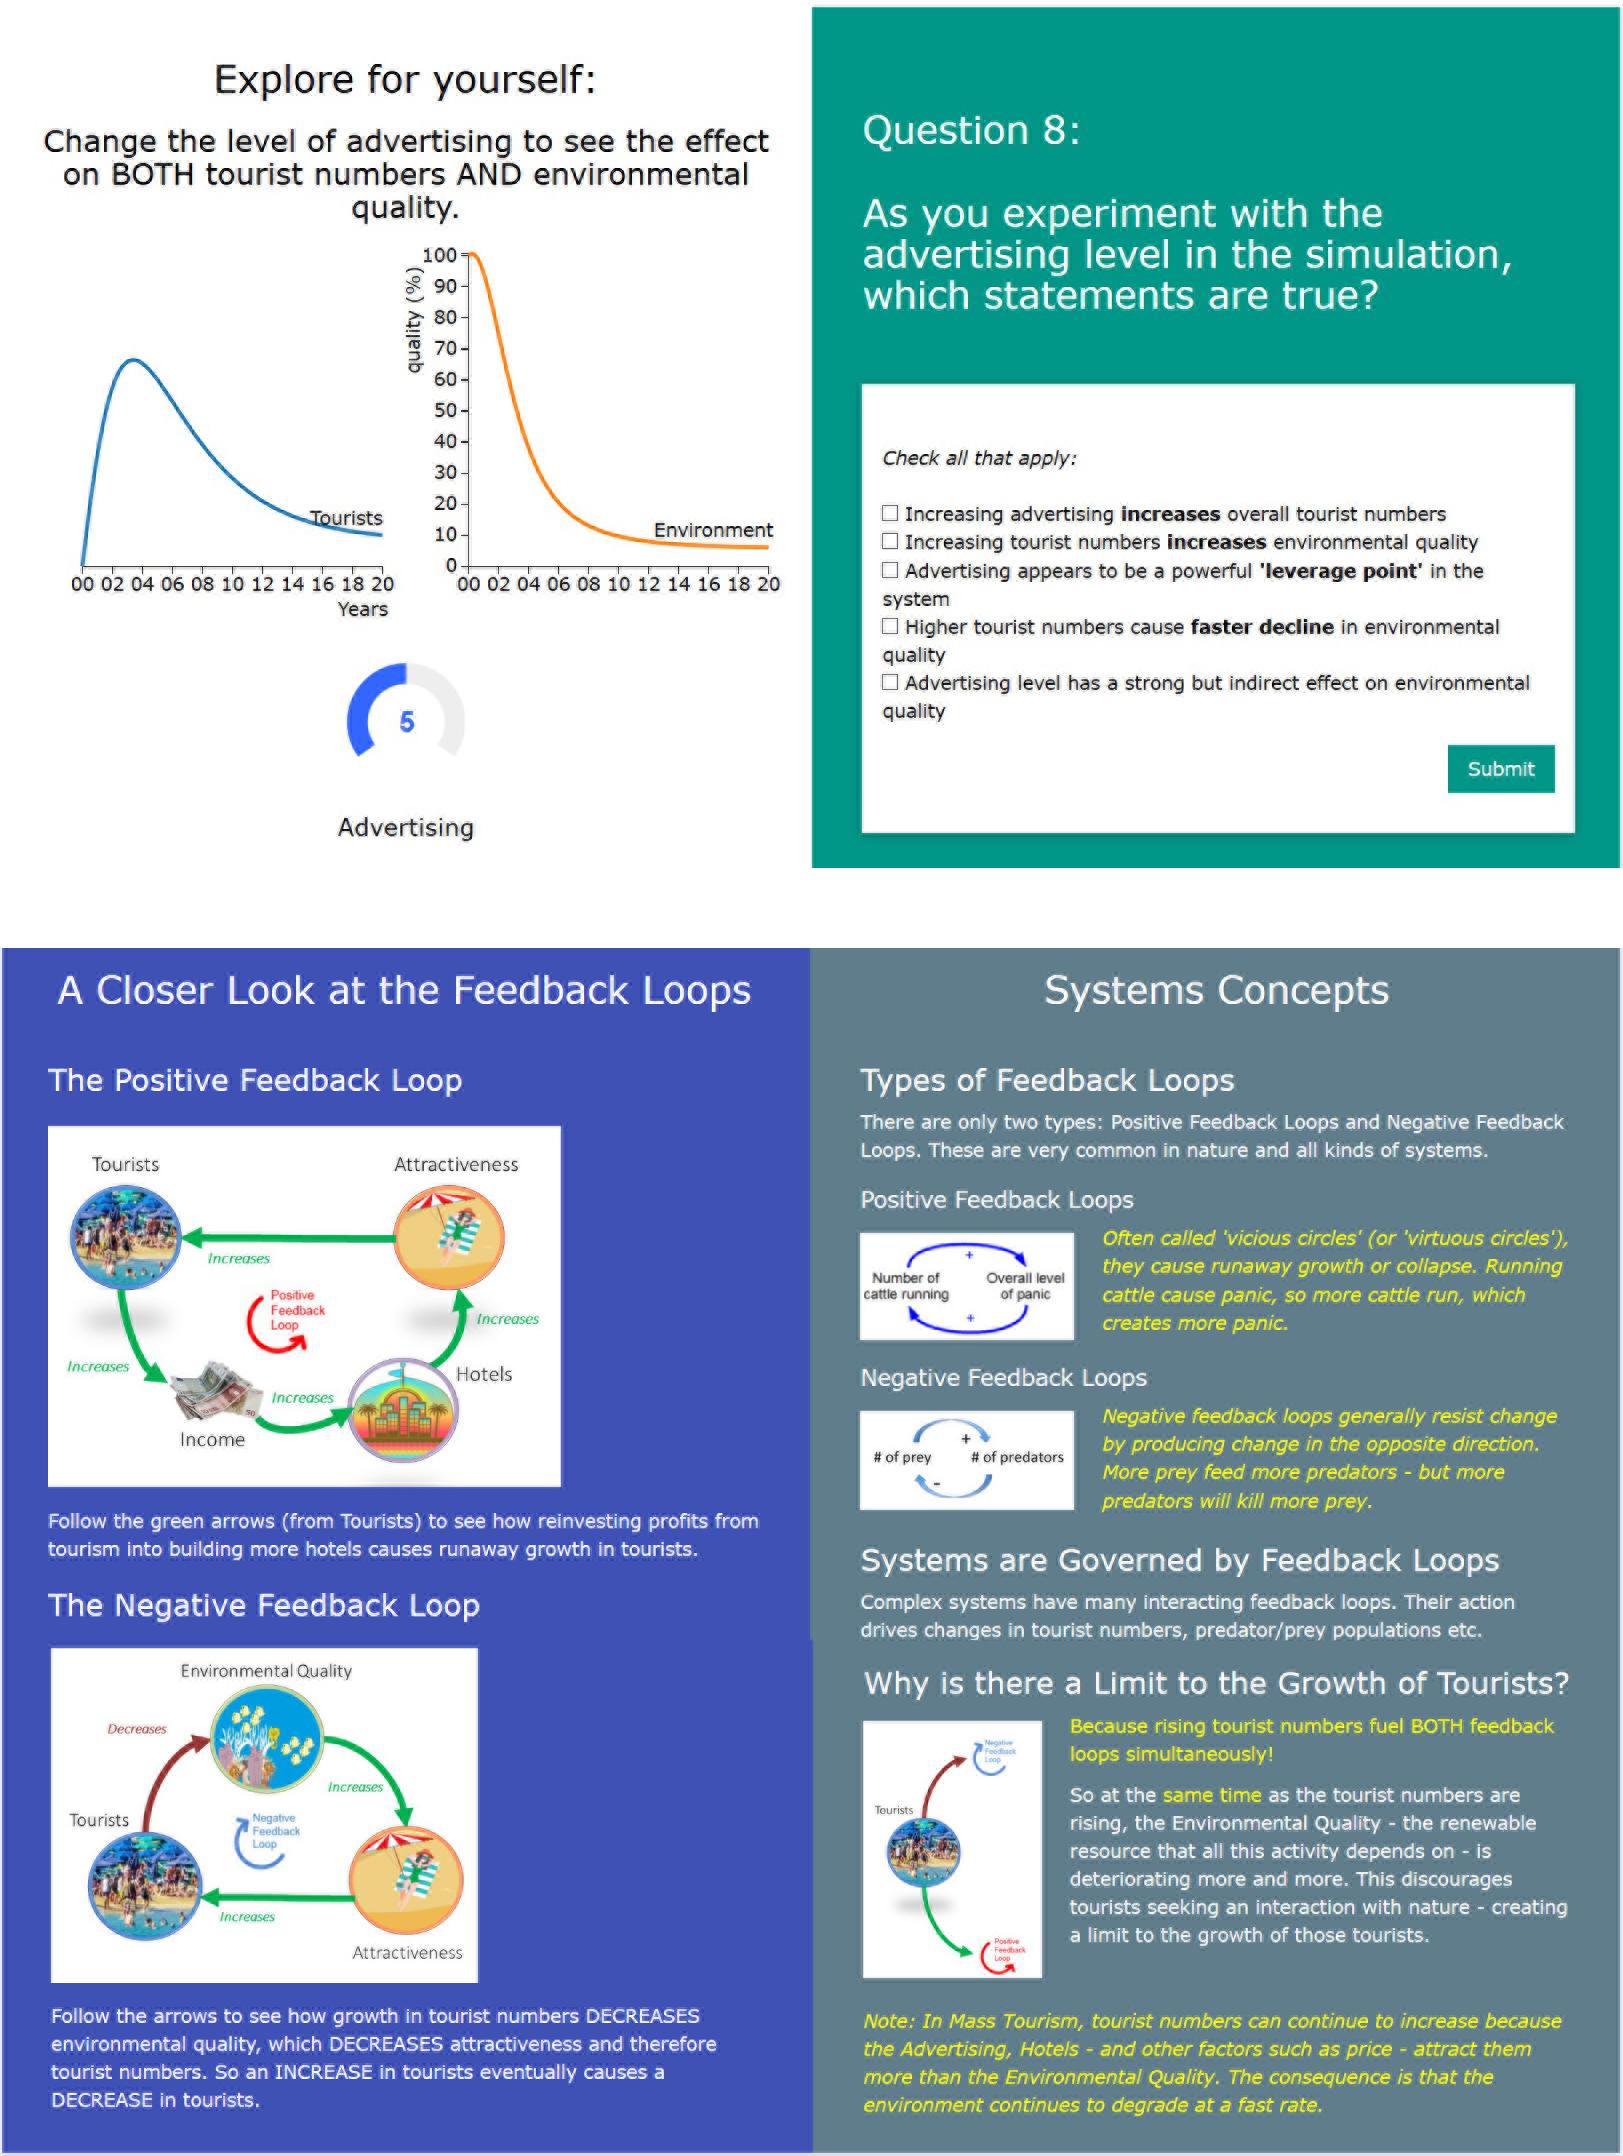
Figure 3. OL tool screenshots: simulation showing two key stocks and a key variable, together with a reinforcing in-tool quiz question; feedback loops explained using Causal Loop diagrams, both in the context of Coastal Tourism, and in general System Thinking terms (RQ1).
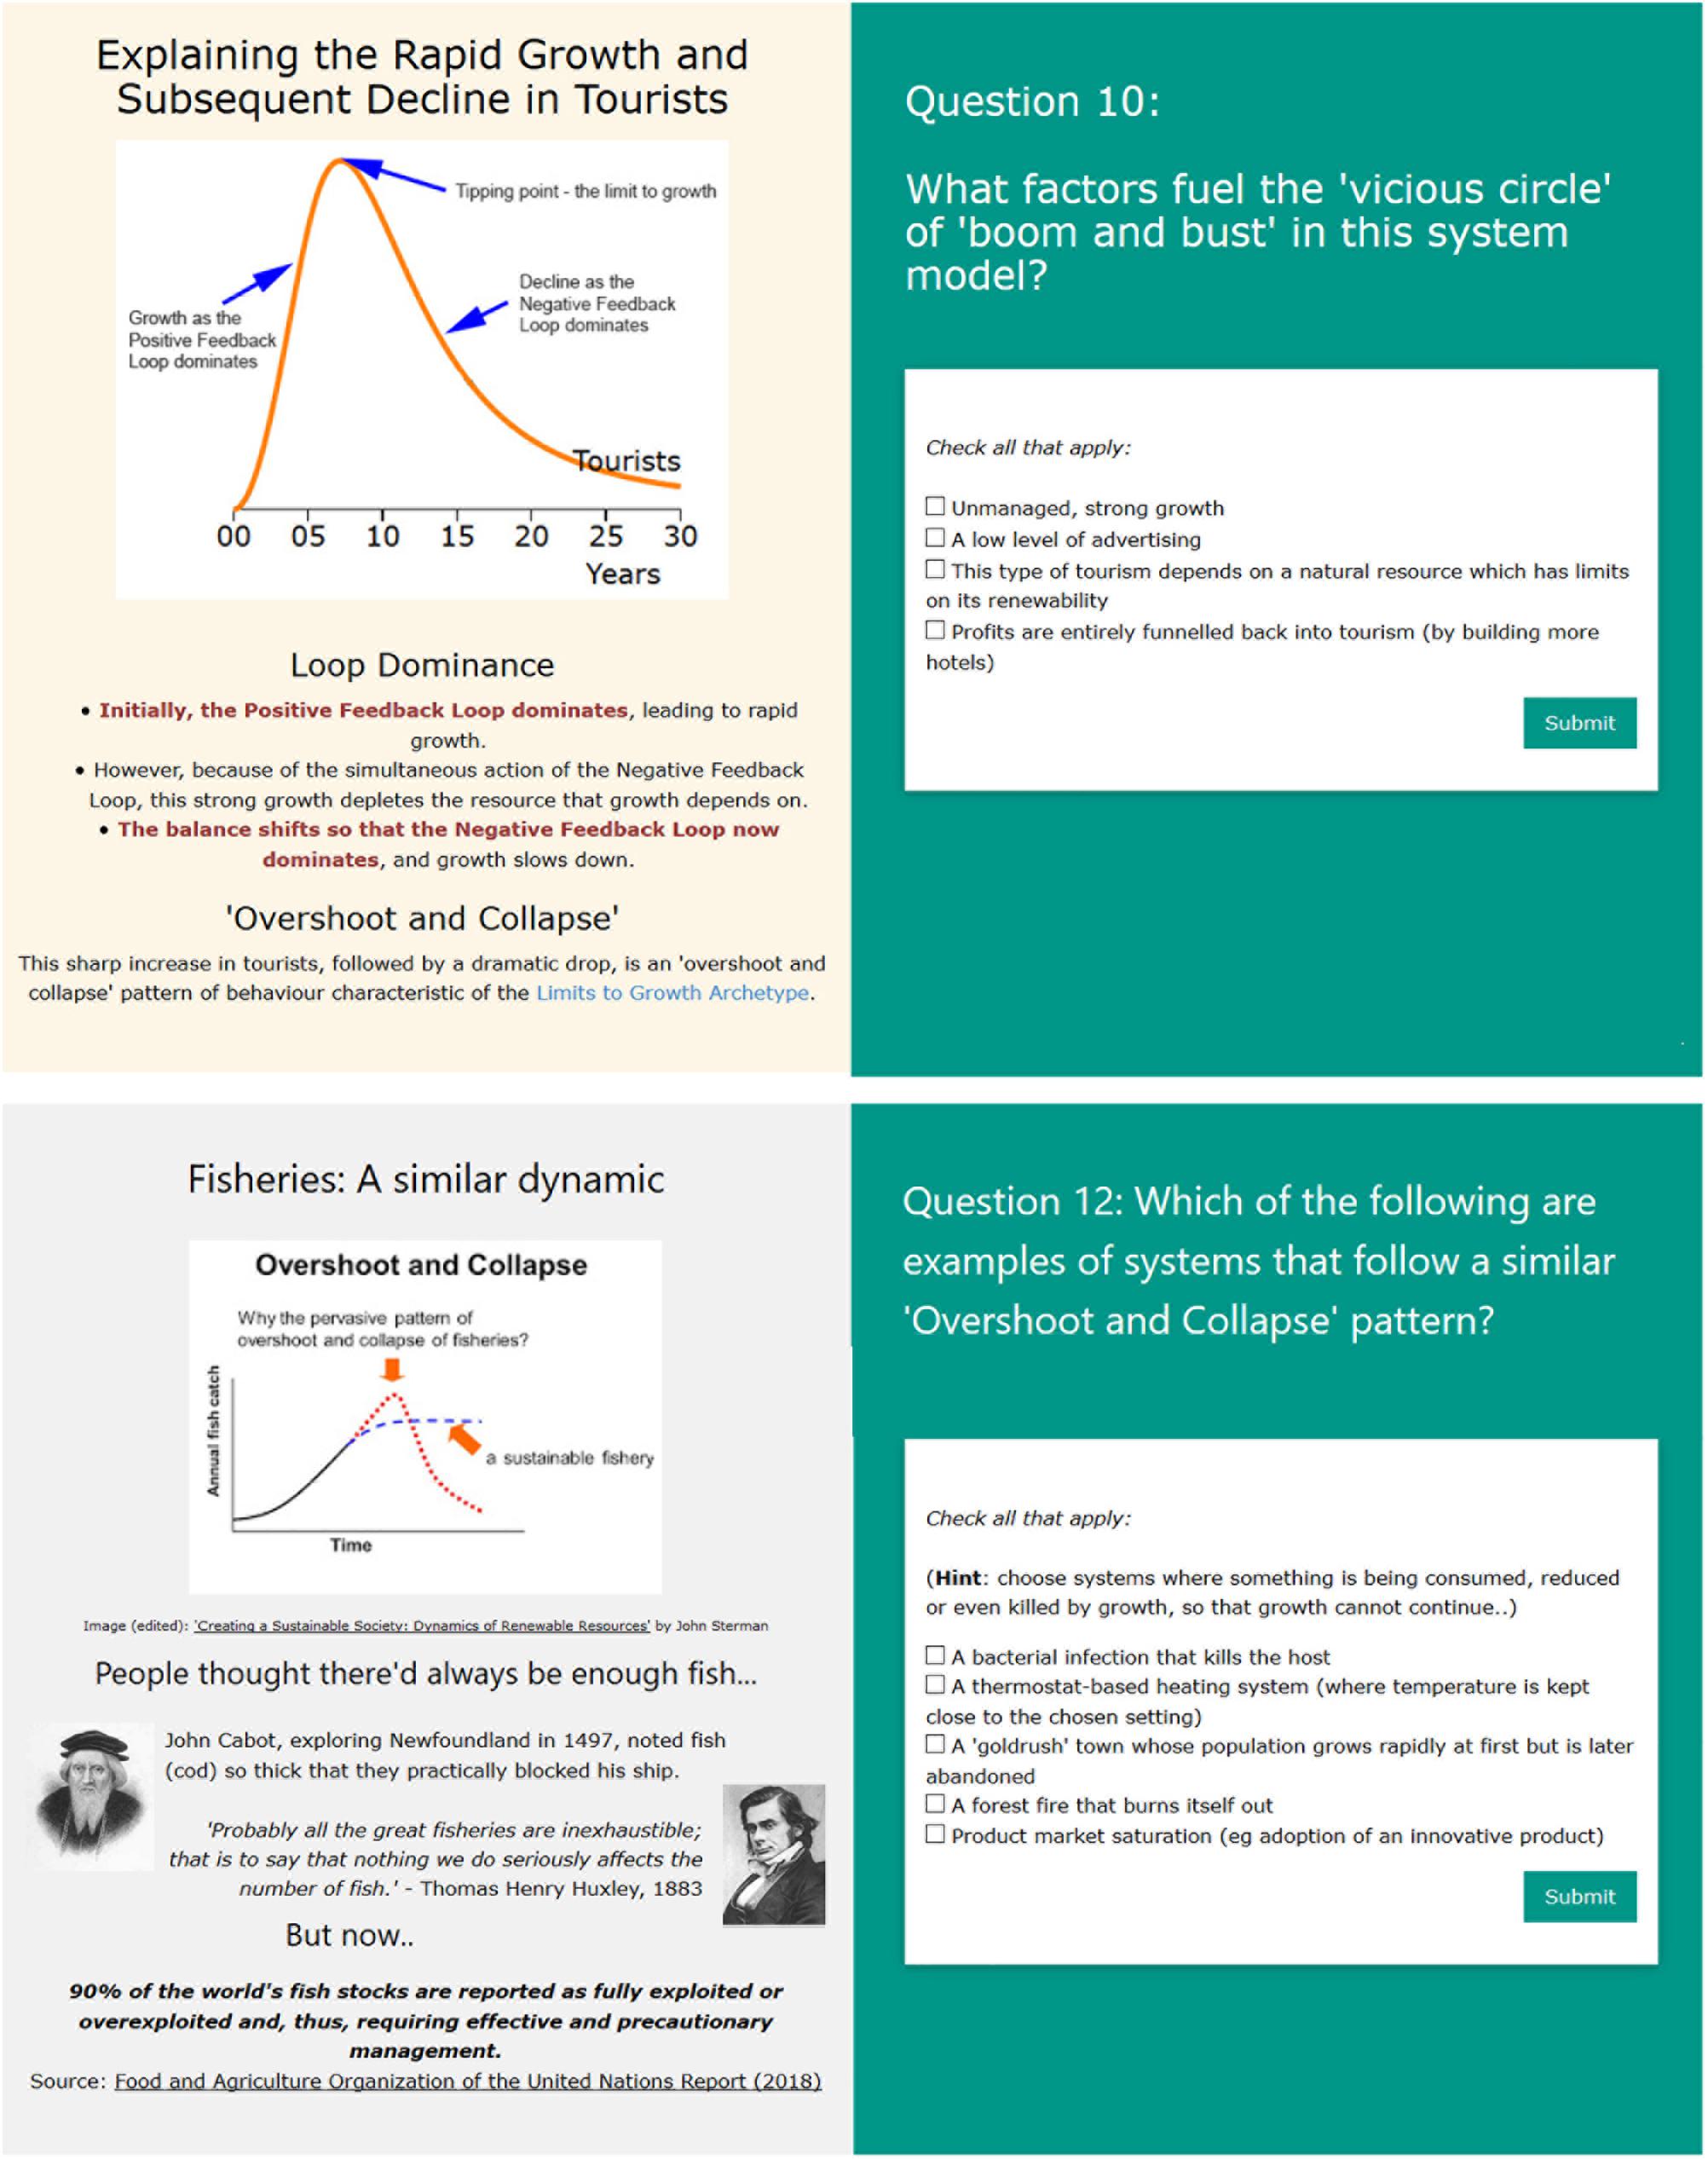
Figure 4. OL tool screenshots: description of the Limits to Growth Archetype and its relevance to Coastal Tourism, together with a reinforcing in-tool quiz question; application of the same Archetype to Fisheries, and quiz question to test for recognition in other systems (RQ2).
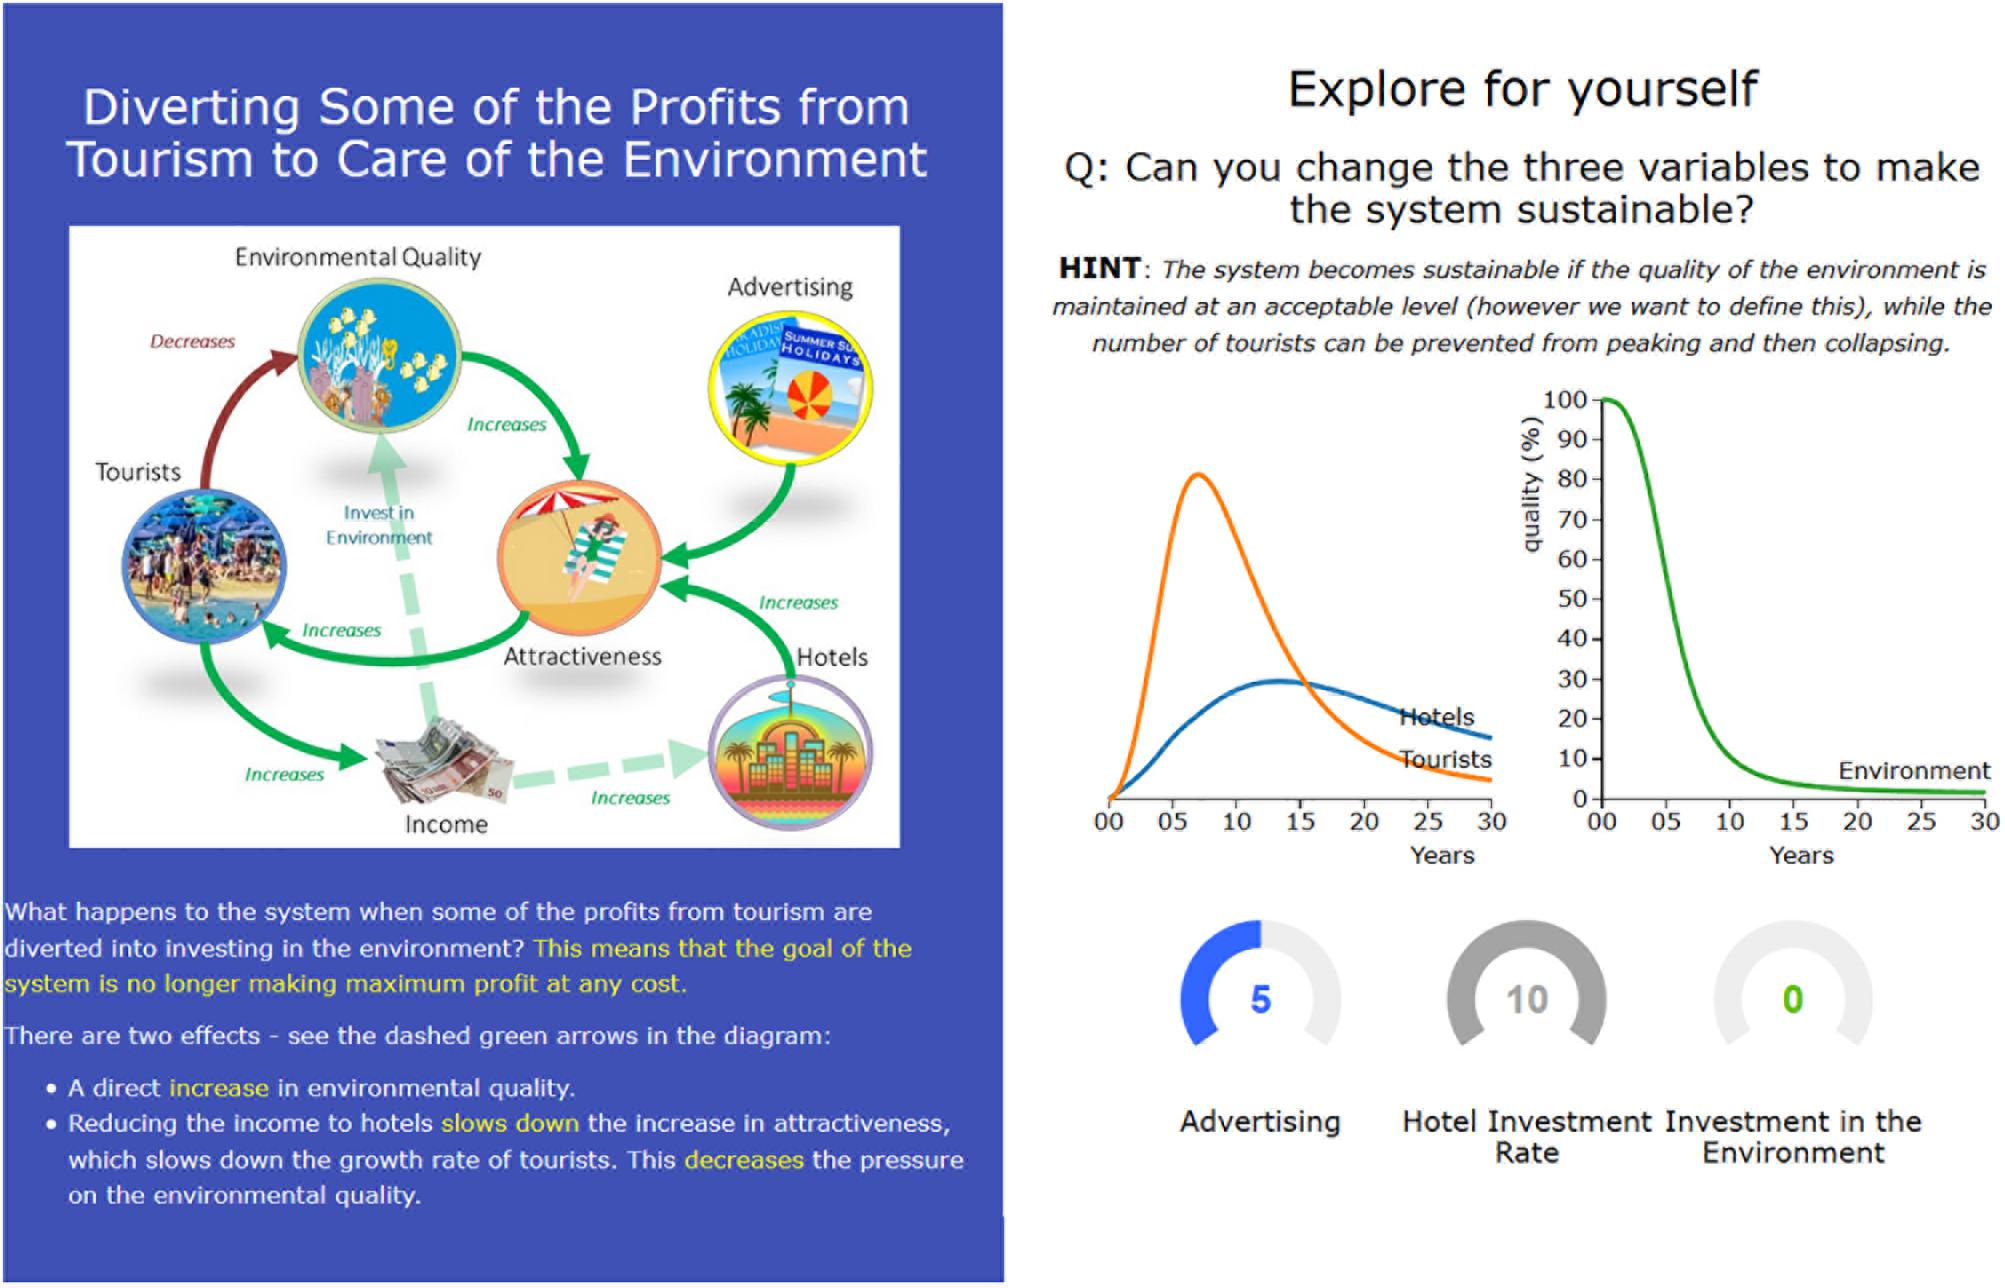
Figure 5. OL tool screenshot: illustration of changing the system structure for sustainability, and a simulation giving users an opportunity to practise bringing the system into a sustainable state by manipulating model variables (RQ3).
As they progress, users can play with gradually more complex simulation models and answer quiz questions which test their understanding of the story and the relevant SD concepts underpinning it. In the simulations, users can change variables and immediately observe the effects on key stocks, such as numbers of tourists and environmental quality. A key aim of the tool is that by interacting with simulations, users will develop transferable critical thinking skills that both increase their understanding of dynamic behaviour, and provide insight into how to change system behaviour.
Essential ST tools and concepts are used to analyse the HOS that encapsulates Coastal Tourism. CLDs are central to the explanations. The model diagram is not displayed in the main pages, since it is potentially off-putting to the general user, but is available for interested users in the ‘Extras’ page. Fundamental Systems concepts are explained and explored, including stocks, flows and accumulation, dynamic equilibrium, feedback loops, loop dominance, the Limits to Growth (Overshoot and Collapse) archetype, structure determines behaviour, leverage points, system goals, renewable versus non-renewable resources, and sustainability.
A Systems View of the Coastal Tourism Problem
A key ST learning objective is to invite understanding of the connection between a positive feedback loop and exponential growth. Central to our systems-orientated analysis of the Coastal Tourism problem is that the unchecked growth of tourism that occurs when profits are reinvested back into tourism creates a positive feedback loop which leads directly to the exponential growth of tourists. This exponential growth is inherently unsustainable and is a powerful driver for the damage caused both to the natural environment and to the human environment if unchecked. It is powerful enough to lead to the collapse not only of environmental quality, but also to tourism at the resort under some conditions.
Key leverage points are explored, such as advertising level, growth of hotels and tourist infrastructure, and investment in the environment, in order to explore ways to bring the system into a sustainable state. Participants can use simulations to actively explore the effects of changing these key variables, and can practise bringing the system toward sustainability, a system state that is described as one where tourism can continue over time, rather than peaking and then collapsing, within a healthy coastal and human environment.
In order to investigate Research Question 2, we drew comparisons between the Coastal Tourism model and Sustainable Fisheries, since both can exhibit the ‘Overshoot and Collapse’ archetype. An in-tool quiz question then invited participants to identify a similar pattern of behaviour in other diverse systems.
Ocean Literacy Content
The prototype online interactive SBLE centres on one key story – Coastal Tourism – and highlights the similarity of the dynamics inherent in another key story, Sustainable Fisheries. The source material is based on the Key Story DAPSIWR analyses documented for the ResponSEAble EU project.
Learning Objectives
A set of learning objectives was established for the key story (Coastal Tourism), comprising the relevant OL knowledge, systems knowledge, and the knowledge required for identification of sustainable solutions (see Tables 1, 2).
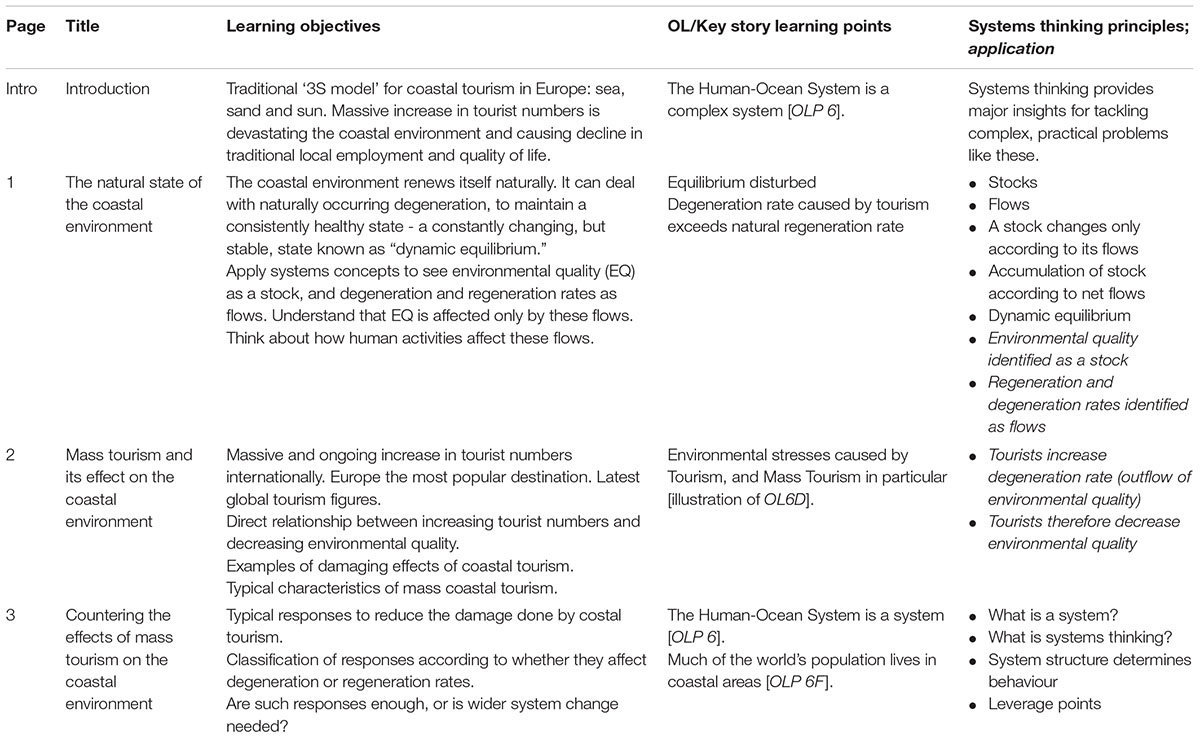
Table 1. Ocean literacy and systems thinking learning objectives identified (part 1).
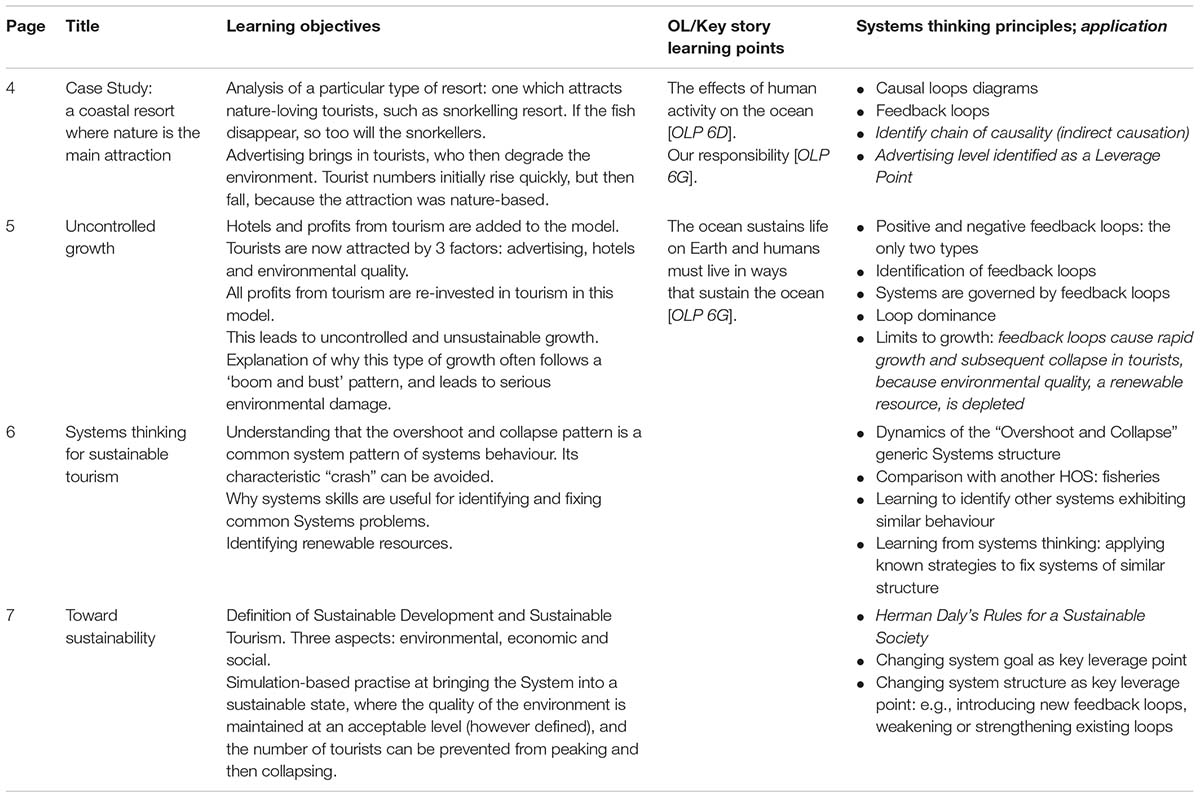
Table 2. Ocean literacy and systems thinking learning objectives identified (part 2).
Models Used
The SD model on which the simulations were based was the generic, normalised Simulation Model Z412B, described and documented in Hartmut Bossel’s System Zoo 2 (Bossel, 2007). The original Bossel model is in Vensim format, and is available for free download8. It is not a calibrated model based on empirical data for a specific coastal tourism resort over a particular period in time; rather, it is an illustrative, qualitative model, suitable for teaching the main structures and dynamics of a typical coastal tourism system.
We recreated the model in Stella Architect in order to obtain a version in XMILE9 format, required by the software library sd.js (see section “Software Platform”). XMILE is the emerging standard for storing and sharing SD models.
We supported a story-telling approach by creating two simpler models that built in complexity toward the final model. The first model introduced the stock Environmental Quality, and its flows, Degeneration Rate and Regeneration Rate. The second model added the stock Tourists and the variables Advertising and Attractiveness. The final model includes a third stock, Hotels, and variables Hotel Investment Rate and Investment in the Environment.
Software Platform
We used the Open Source simulation tool, sd.js10. This is a Javascript-based library for fast, in-browser SD model simulation that reads models in XMILE format and uses D3 to construct interactive graphs and jQuery to implement interactive variable controls.
Teaching Environment
We designed this platform for use in combination with face-to-face teaching individually or in groups, following best practise for Simulation Based Learning Environments (SBLEs) (Landriscina, 2013a) and Systems teaching (Fisher, 2011).
Data Captured
Pre- and post-test surveys
Before using the OL tool, the participants completed a survey which assessed their current level of OL on the topic of Coastal Tourism, in terms of the OL dimensions. After use of the tool, participants completed a post-test survey consisting largely of the same questions as the pre-test, in order to assess effectiveness of the tool in increasing OL levels.
Most questions were scale based (0–10) and designed to assess whether a change in awareness, knowledge, attitude, social and personal norms (communication) and reported or intended behaviour had taken place. Other questions were designed to elicit qualitative responses relating to current coastal holidaymaking behaviour, awareness of problems with coastal tourism and understanding of the concept of sustainability. The post-survey contained additional questions to gather opinions about the usefulness of the simulations and the tool itself.
Qualitative feedback interviews
The facilitator observed and noted user interaction with the tool and gathered verbal feedback both during the training and afterward in a moderated feedback session (structured around key questions).
Answers to in-tool questions
There were 13 multiple-choice questions embedded in the tool. Answers to these were captured and stored on the NUIG ResponSEAble server, and downloadable in CSV and JSON format for analysis.
Evaluation Methodology
Measuring Effect Size
Each survey question was designed to measure one of the OL dimensions (knowledge, attitude, behaviour and so on). Where answers for a particular question were given on a scale from 0 to 10, the mean of answers from all the participants was calculated, before and after interaction with the tool. The results were grouped by OL dimension. The difference in each OL dimension was then analysed using ‘Cohen’s d’ (Cohen, 1988), a statistical measure of the effect size, calculated by taking the difference between the two means and dividing by the pooled standard deviation (i.e., the root mean square of the two standard deviations).
Measuring Effectiveness of the Ocean Literacy Tool
A framework was applied and tested in the ResponSEAble project to identify strengths and weaknesses of OL initiatives. Effectiveness was assessed in terms of the potential for behaviour change. Unfortunately, this is difficult to measure directly; however, it is possible to measure predictors of behaviour. We employed assessment frameworks and methodologies which draw on psychology and behavioural research concepts and methods to analyse predictors of behaviour change.
Assessing Potential for Behaviour Change
To assess effectiveness of the OL tool, the OL dimensions were integrated with predictors of behaviour change identified in social science and psychology literature (Klöckner, 2013; Phal and Wyles, 2017).
In a study of the psychology of environmental behaviour, Klöckner (2013) concluded that the best direct predictors of behaviour were:
• Intentions (“I will do this”).
• Perceived behaviour control (“It is up to me whether I do this rather than other people or contextual factors”).
• Habits (behaviours that have become automatised through repetition).
Factors having an indirect effect on behaviour were identified as:
• Attitudes (favourable or unfavourable evaluations).
• Norms (what is seen as commonly done by others).
• Responsibility (ascriptions of who should deal with the problem).
• Awareness of consequences (knowledge about impacts).
• Values (general trans-situational goals such as equality or individualism).
Other studies have identified further factors:
• Negative emotions such as worry, and positive emotions such as hope (Ojala, 2008).
• People who regard themselves as environmentalists may exhibit more environmentally conscious behaviour (Whitmarsh and O’Neill, 2010).
These ten social and psychological concepts can be measured empirically and provide important means of changing behaviour beyond information and knowledge provision (Phal and Wyles, 2017).
The relationships between the ten predictors of behaviour change, the OL dimensions, and the corresponding questions used in the pre- and post-surveys for assessing the effectiveness of the OL tool are shown in Table 3.
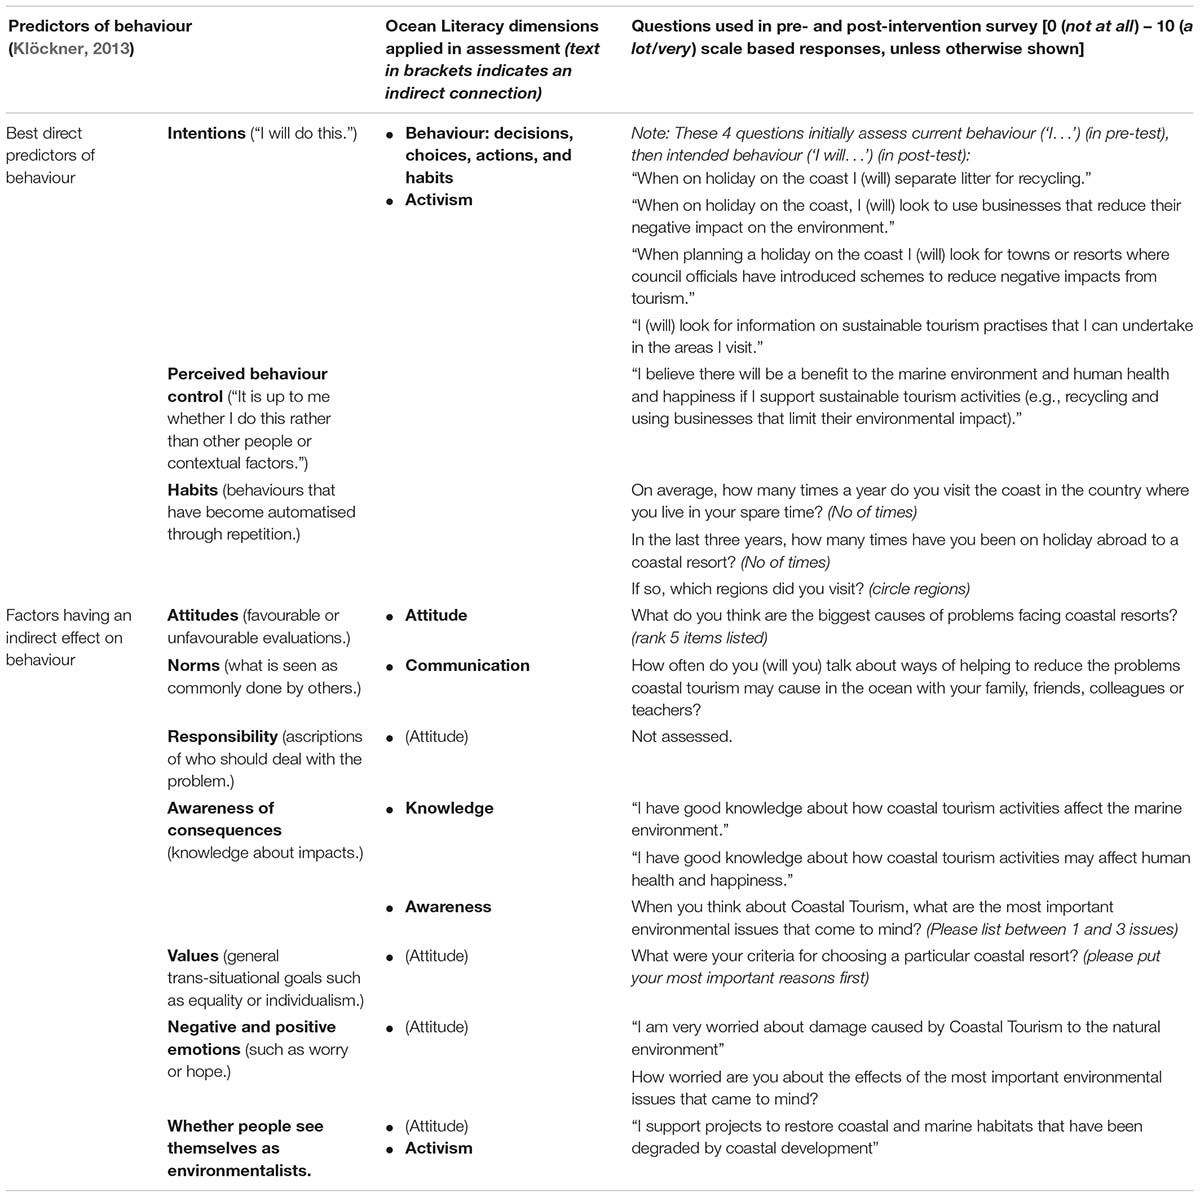
Table 3. Relationship between questions developed to assess effectiveness of the Ocean Literacy tool, predictors of behaviour and Ocean Literacy dimensions assessed.
A theory of change logic model
In defining the process to achieve behaviour change objectives, we adopted the Theory of Change logic model (Connell and Kubisch, 1998) and the ‘PRECEDE-PROCEED’ model developed by Green and Kreuter (1999).
The PRECEDE-PROCEED model is a step-by-step planning and evaluation model, originally aimed at directing behaviour change processes in health promotion. Central to the model is the principle that a change process should focus on the outcome, not the activity. Originally applied to initiatives that promoted behaviours to reduce the incidence of major causes of death and disability, it has been widely adopted in environmental awareness programmes, including the OL dimension related predictors of behaviour change.
A Theory of Change logic model was completed in collaboration with social and behavioural science researchers at the University of Plymouth and ProSea11 tool developers. The formulation of the Theory of Change steps designed to achieve behaviour change were guided by predictors of behaviour identified in the OL dimensions (Table 4).
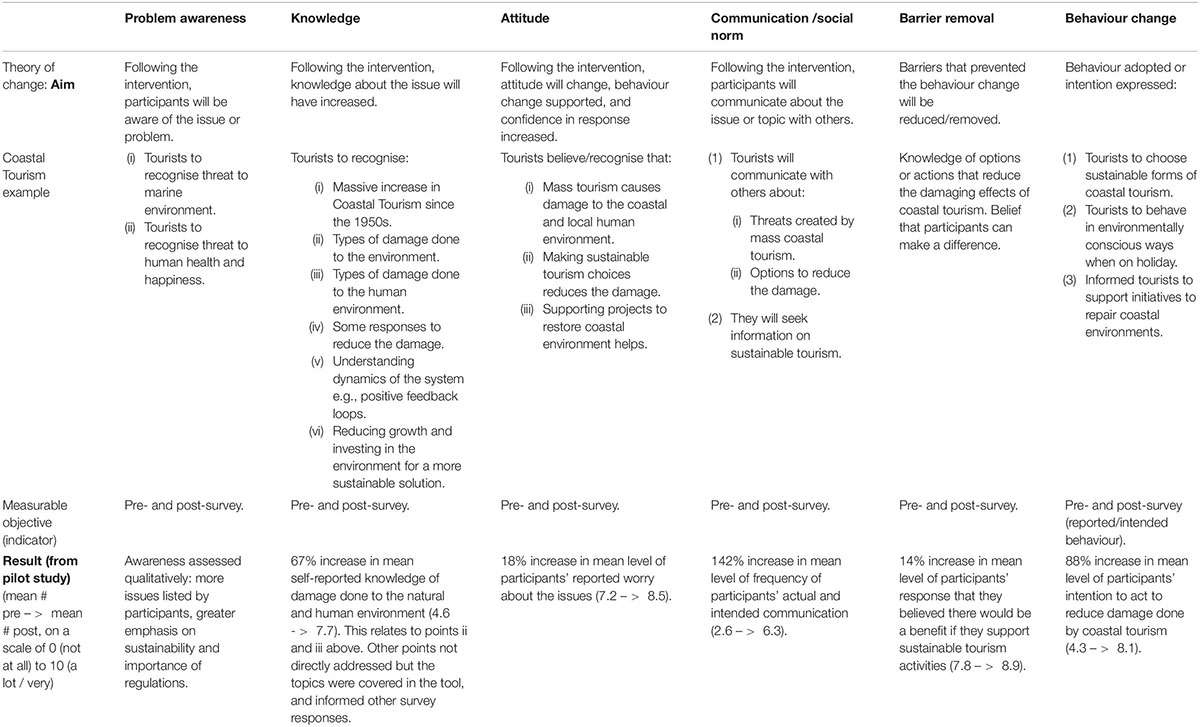
Table 4. Theory of change logic model developed to assess effectiveness of OL tool.
Predictors of behaviour change and OL dimensions can be assessed using research techniques such as surveys, repeated pre and post interaction with the OL tool (Phal and Wyles, 2017). In order to assess change over time, the same questions can be asked before and after interaction with the tools, and again during longer follow-up studies as necessary.
Questionnaire surveys were conducted with course participants before and after interacting with the OL tool. Each survey question addressed an objective within the Theory of Change framework and therefore an OL dimension.
Results
The ST for OL tool was piloted for the ResponSEAble project in December 2018 in Galway, Ireland, in a series of one-to-one sessions with 15 adult participants (9 women and 6 men), eleven of whom were Ph.D. students, one retired local council manager, a Masters student, an engineering graduate, and a teacher. Participants were aged between 18 and 64 years, with the majority (two thirds) in the age range 35–54. A facilitator was available at all times for guidance as required by each participant. The participants took an average of 40 minutes to work through the tool, and another 30 minutes in total filling in pre- and post-test surveys and giving qualitative feedback.
Survey Questionnaire Results
Quantitative Survey Answers
Answers to pre- and post-survey questions with quantitative answers (on a scale 0–10) were analysed for effect size with regard to change in the OL dimensions using Cohen’s d (see Table 5). 0.20 is considered a small effect, 0.50 is medium, 0.80 is large, and >1.20 is very large. The table shows that the effect on knowledge, communication and (intended) behaviour was very large, and that on barrier removal and attitude was moderate. All effects were positive, i.e., indicating an increase.
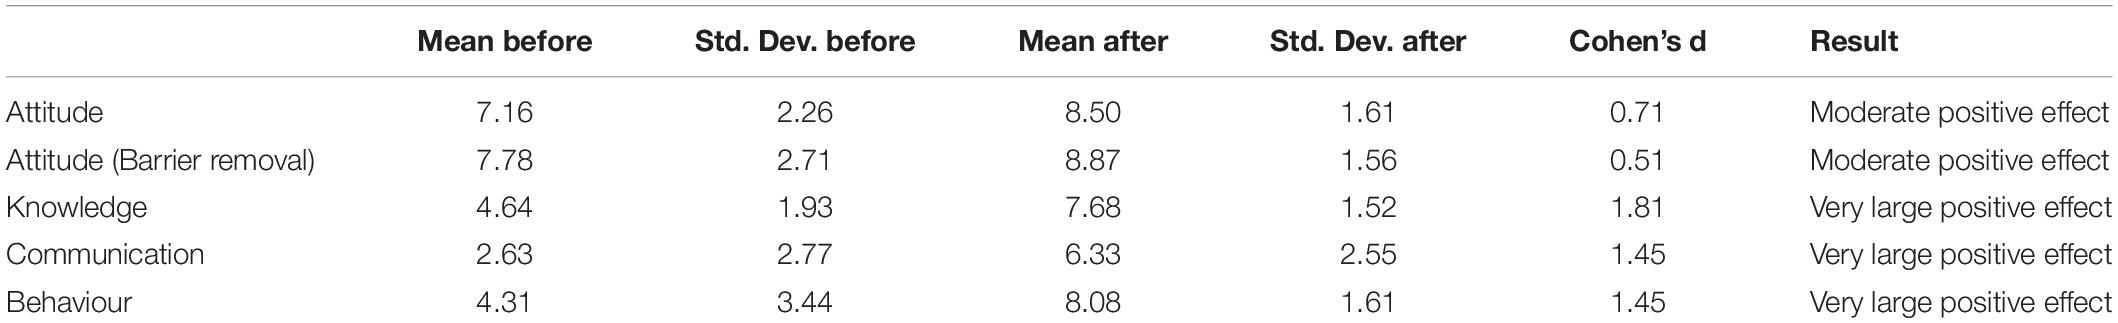
Table 5. Measuring effect size of pre- and post-survey scaled question results using Cohen’s d.
The same data are summarised, broken down by four OL dimensions, using a radar chart (Figure 6). Taking each dimension in turn, the chart illustrates that:
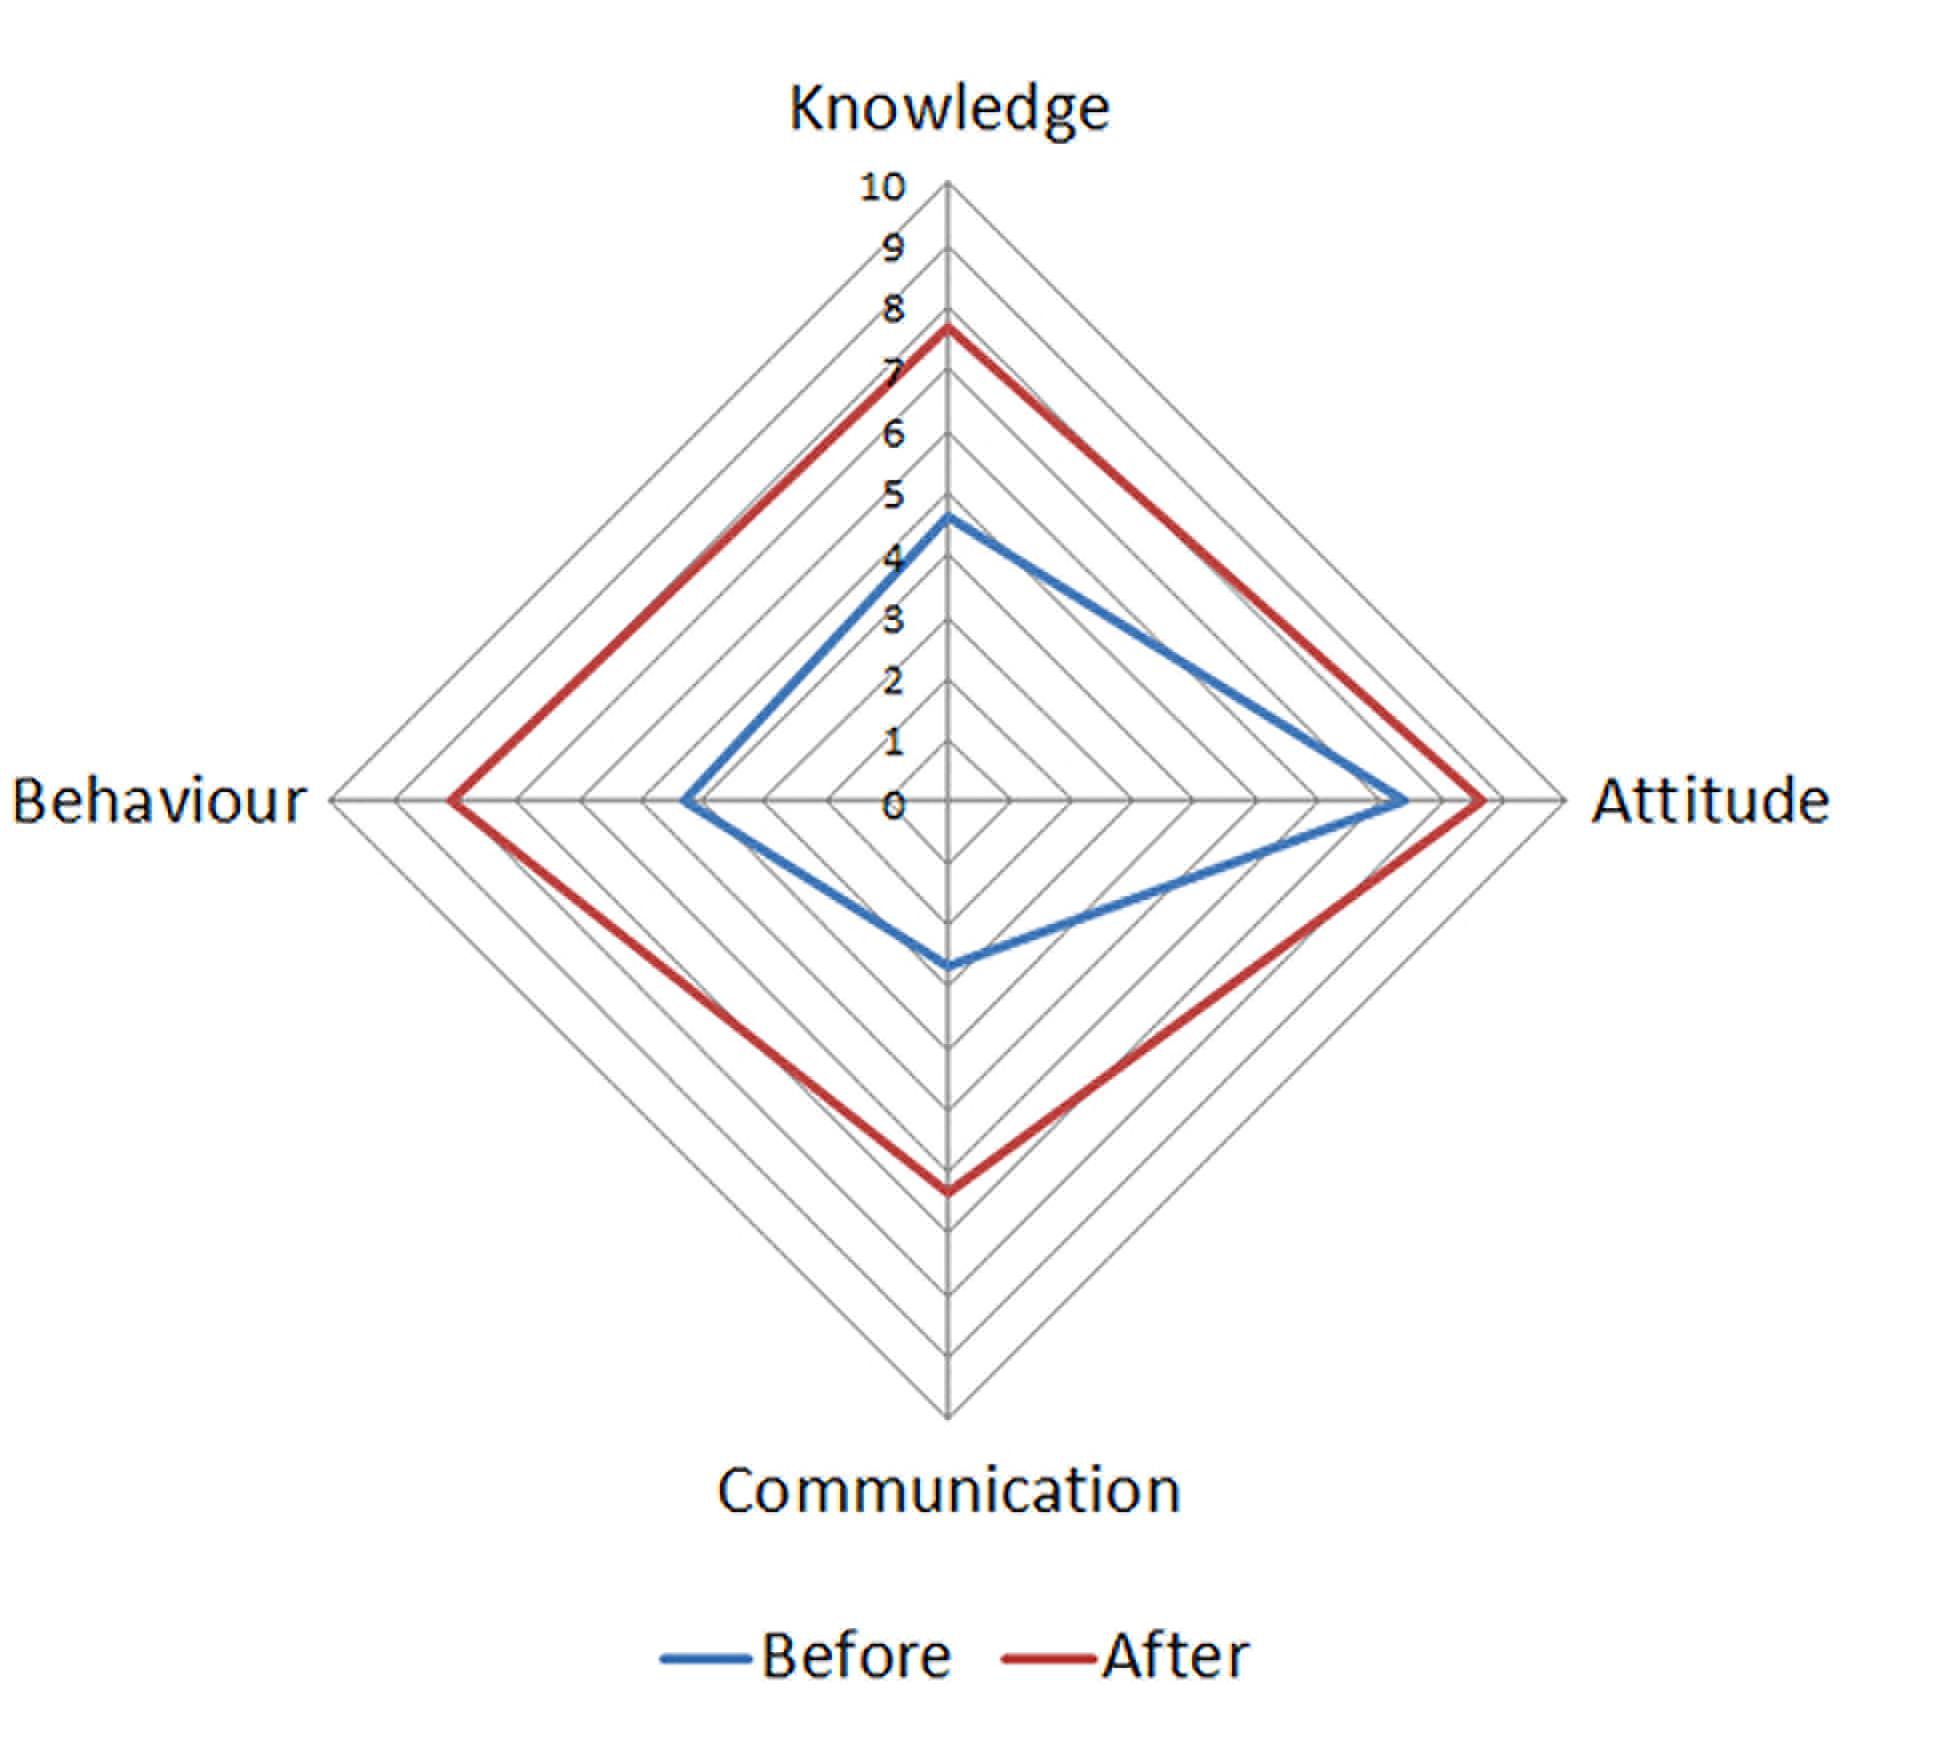
Figure 6. Radar chart showing changes in four of the dimensions of Ocean Literacy before and after use of the tool.
• Attitude levels were quite high before the intervention, meaning that participants were already worried about the damage caused by coastal tourism.
• They did not often communicate about these issues, however.
• They had only moderate confidence in their knowledge about how coastal tourism affects the marine and the human environment.
• They were only moderately likely to take action to reduce the negative effects of coastal tourism (behaviour).
All these OL dimensions increased in the post-test survey. For the mean scores, pre- and post-survey, and the percentage change, please see Tables 6, 7. Table 6 gives an overview by OL dimension, whereas Table 7 presents results per question. These tables demonstrate that the largest percentage increases were for how often participants intended to communicate about the effects of coastal tourism on the marine and human environment, their intention to take action to reduce the negative effects of coastal tourism (behaviour), and their self-reported level of knowledge about the issues.
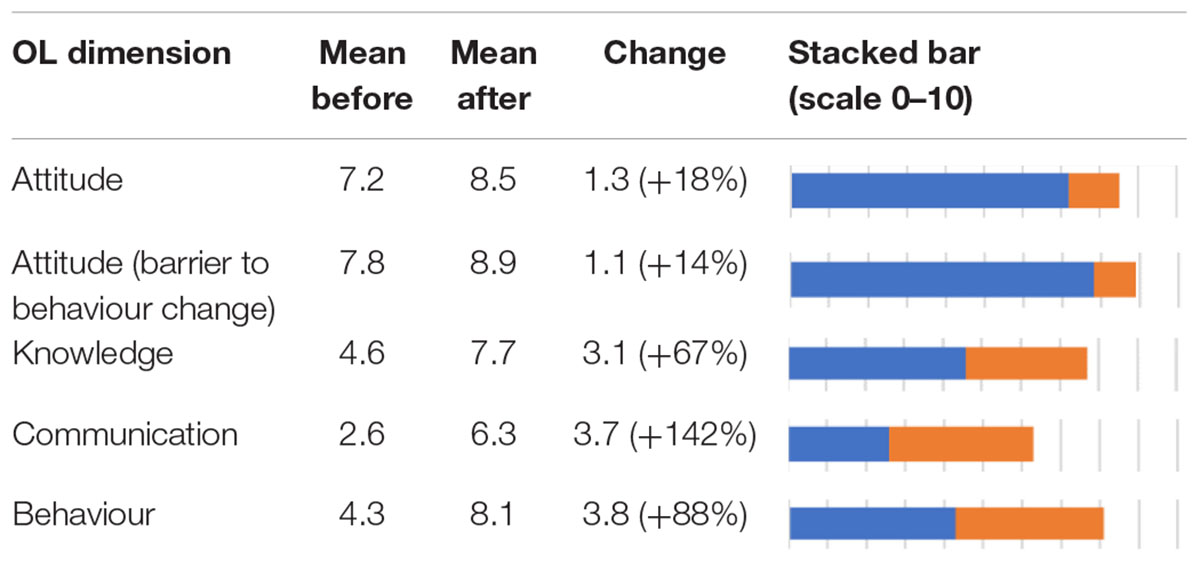
Table 6. Pre- and post-survey scaled question results, summarised by OL dimension and percentage change.
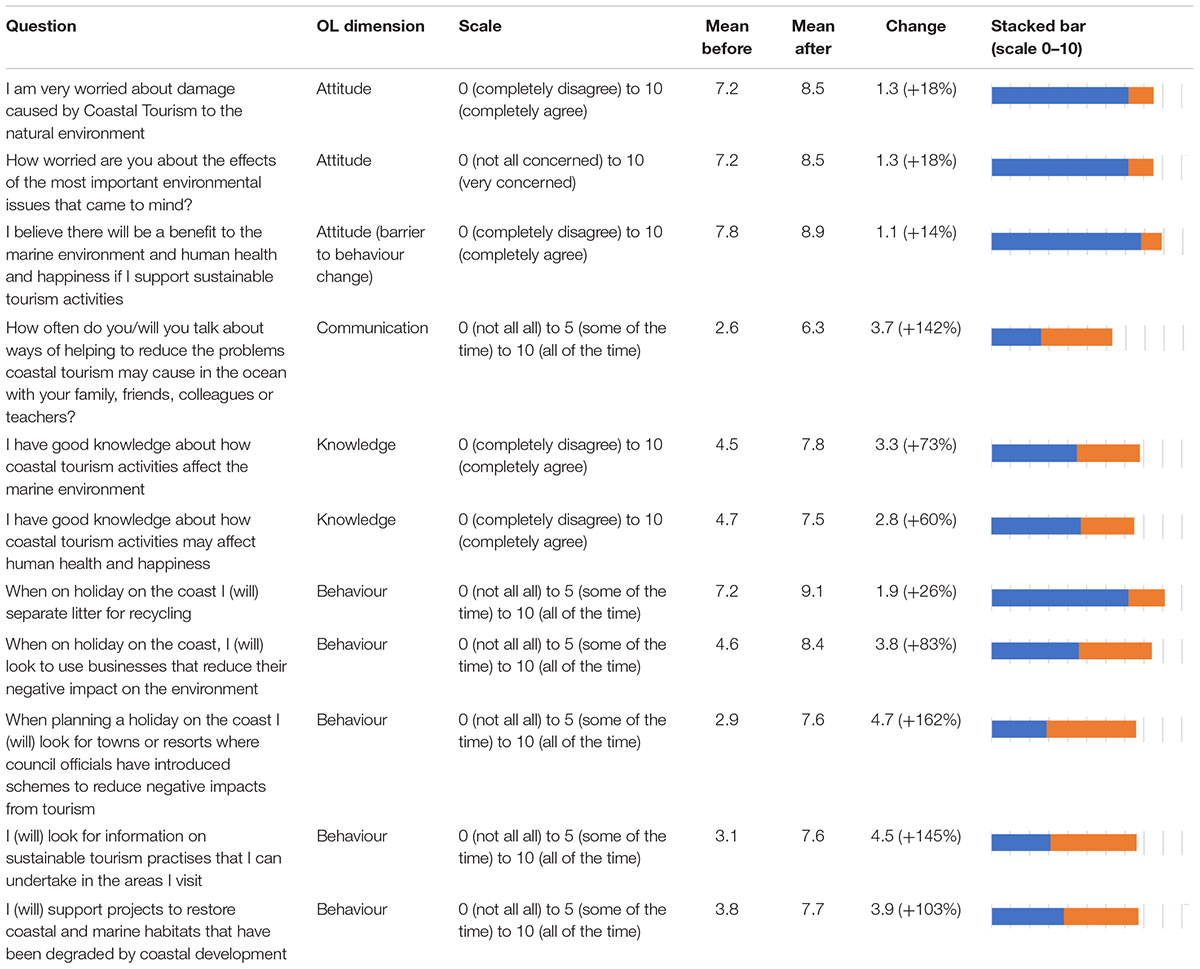
Table 7. Pre- and post-survey individual scaled question results, summarised for all 15 participants by percentage change.
It is worth noting that the relatively low (18%) increase in how concerned participants felt about the effects of coastal tourism on the marine environment (attitude) does not mean that the tool was less successful in this regard, since the pre-test level of concern was higher than for all the other OL dimensions.
Qualitative Survey Answers
Regarding their criteria for choosing coastal holidays (Figure 7, first question), many participants did not think much about it, and did not record their criteria in the survey, but if they did, they made their choice on the basis of facilities (including sun/sea/sand) and cost. After using the tool, there were more varied responses given, and a marked change in priorities for planning intended future coastal holidays: environmental quality or impact, and sustainable or responsible tourism, were most often given as criteria.
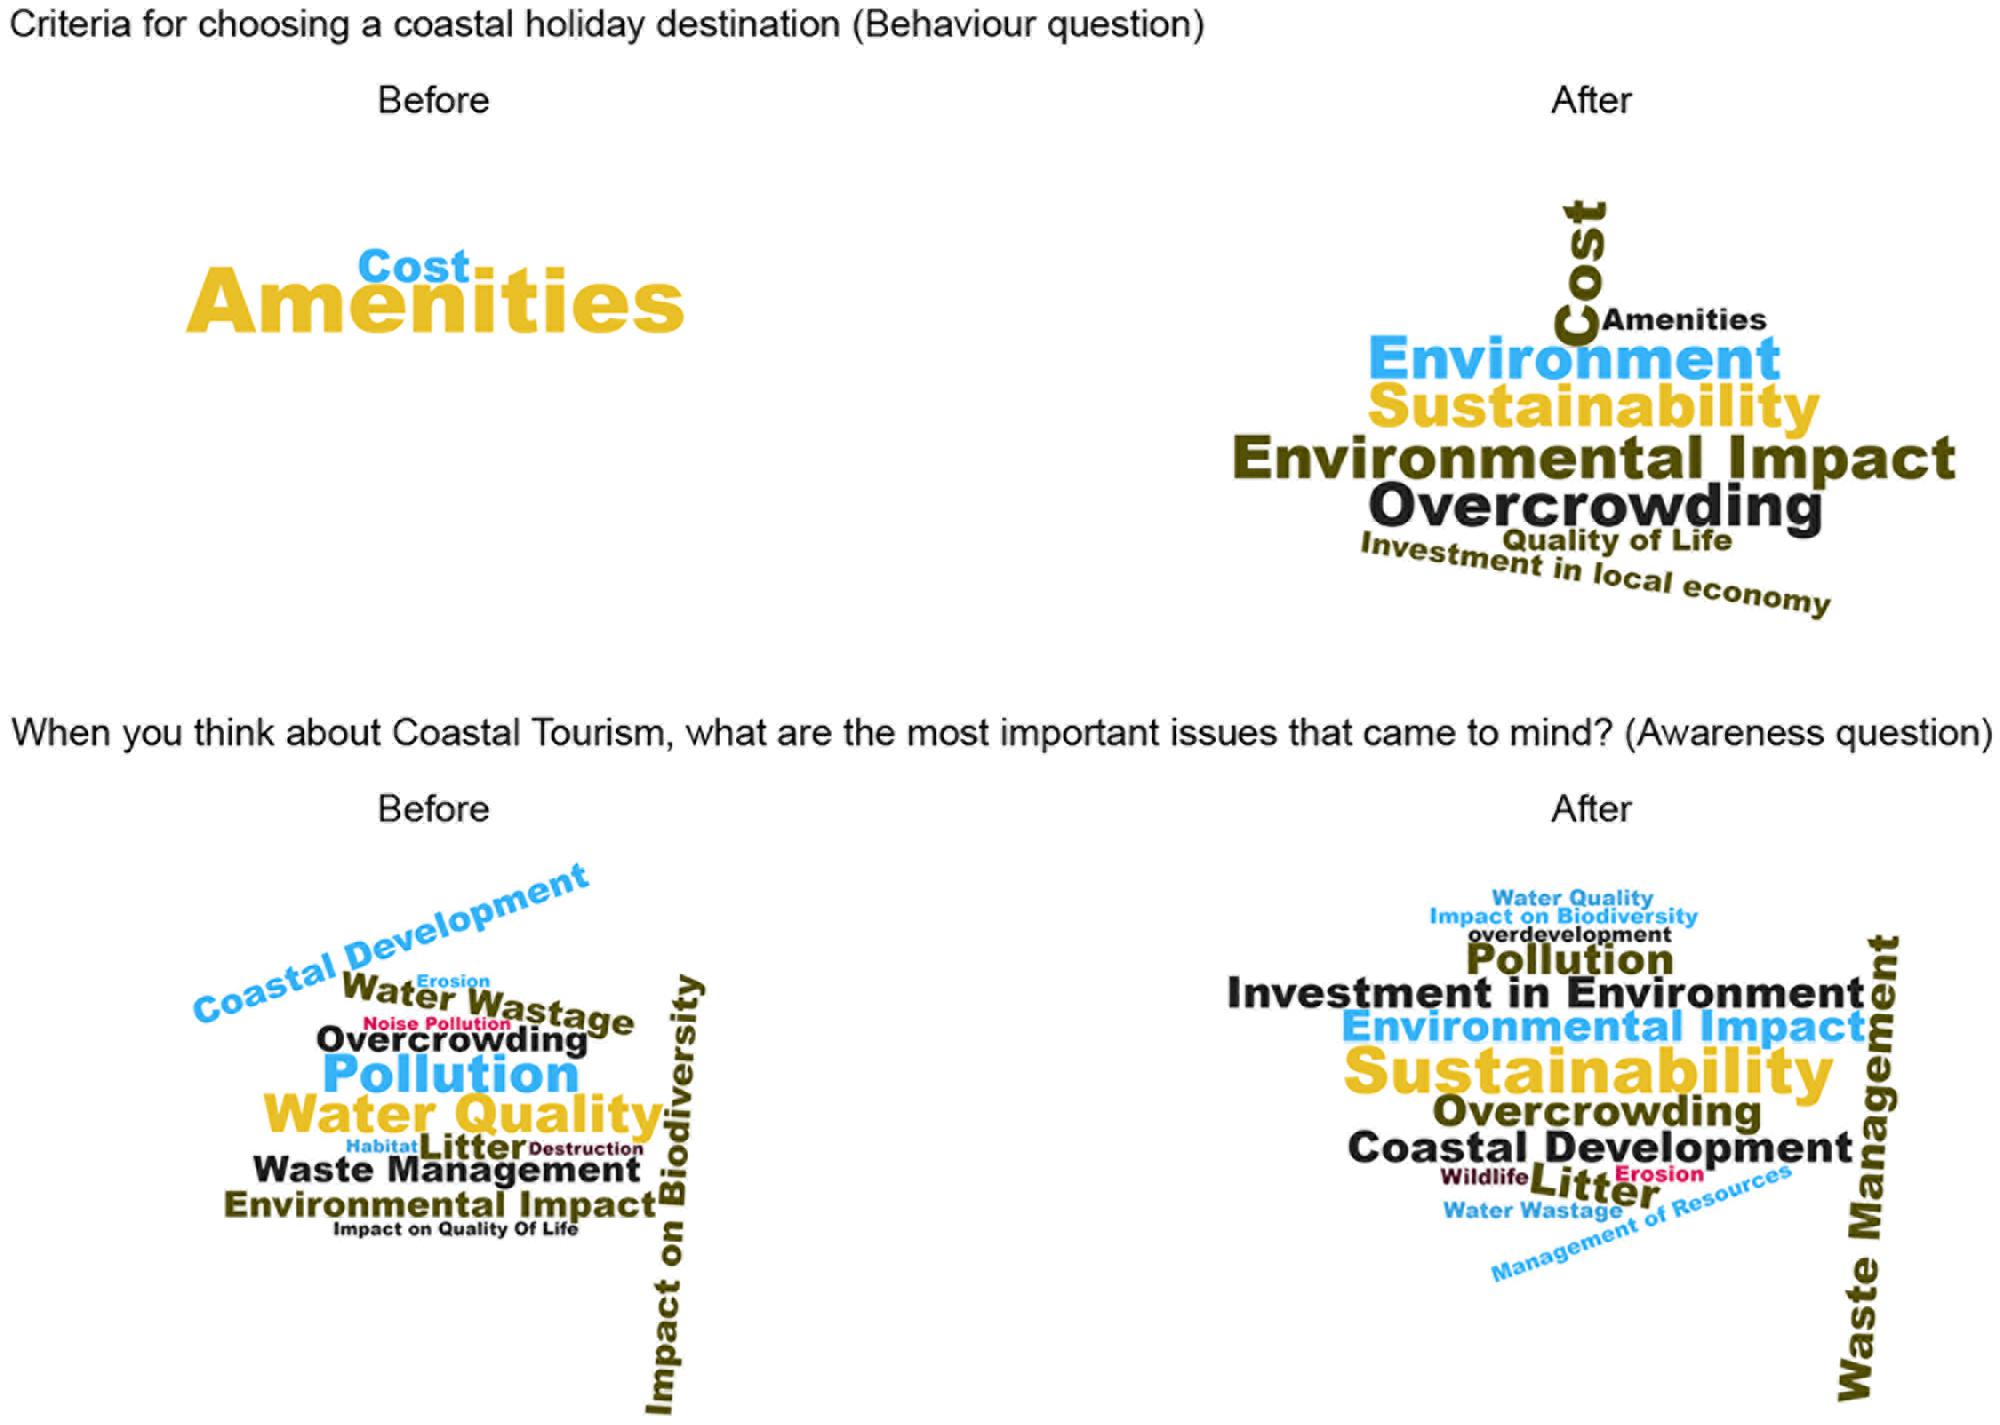
Figure 7. Wordclouds representing before and after survey responses for two qualitative questions.
From pre- and post-survey answers to a question asking participants to write down their understanding of the concept of sustainable coastal tourism, there was some evidence of a richer understanding post-survey (in terms of dynamics and balance).
Responses showed an increase in the number of issues participants were aware of post-survey, a greater emphasis on the need for sustainability and investment in the environment (Figure 7, second question). Responses to a survey question about perceived causes of coastal tourism related problems demonstrated an increased awareness of the need to impose regulations on coastal tourism development.
Finally, all participants said that they found the simulations useful for improving their understanding of the dynamics of the Coastal Tourism system. When asked what they found most memorable about the tool, most participants cited interacting with the simulations and discovering the dynamics of the system.
Data From In-Tool Quizzes
The in-tool quiz questions served mainly to provide learning challenges for the participants, to help them engage and practise applying new OL and Systems concepts. The recorded answers helped us, as tool developers, to obtain feedback and thereby improve the efficacy of the presentation approach.
One third of participants gave incorrect answers for reading the Causal Loop Diagrams. Taken together with participants’ comments on this topic, outlined in the next section, this suggests an area for improvement in the tool.
Participants scored well (13/15 correct) on the question testing their understanding of how to bring the coastal tourism system to a sustainable state (RQ3). They also scored better than expected (11/15 correct) when identifying systems with similar structure (archetype) (RQ2). They scored less well (8/15 correct) when asked to identify factors that fuel a ‘boom and bust’ (‘overshoot and collapse’) dynamic. This part of the tool therefore needs further work.
Qualitative Feedback Given by Participants and Observations Made While They Interacted With the Tool
(1) Regarding the quantity of material: A number of people found that following the tool required too much reading and concentration. Sections should not be too long. Respondents took an average of about 45 minutes to work through the material and answer questions. Many of them commented that this was too long. 20–30 minutes would be acceptable.
(2) Use of systems terminology such as stocks and flows, feedback loops: Some participants thought this was off-putting. One participant said that the Systems concepts were the most challenging. One participant reflected out loud, “.. are we educating people about Systems Thinking and/or System Dynamics (to improve Systems Literacy in general), or are we trying to educate them in a specific domain (in which case the less jargon the better?).” Another said that the system is designed too much around academic concepts and would lose members of the general public. Another thought that it did take a lot of concentration but that having to think about the “learning points” meant that she learned something of value.
(3) Different needs of different types of user, from general public to technical: For general users with no knowledge of ST/SD it might be hard for them to stay focused all the way to the last page. What exactly is the intended audience? This needs to be better defined.
(4) Visual versus textual content: A number of participants wanted more visual material (video, animation or slideshow with voiceover), instead of long sections of text and static diagrams. More interaction would help keep users engaged. A narrator with a strong storyline would help.
(5) Response to in-tool quiz questions: Participants’ reaction to these varied. A majority became visibly worried about ‘getting answers wrong’. Others found the reinforcing of learning from material on the page useful. A few said they enjoyed the challenge. Some questions and answers caused confusion and needed clearer wording.
(6) Understanding of dynamics of the system: Most people expressed a new understanding of the importance of the major drivers in the HOS under investigation, for example, the effect of huge increases in tourist numbers, and the powerful effect of feedback loops.
(7) Difficulty with Causal Loop Diagrams: Reading CLDs caused a bit of confusion, mainly with regard to how to read the arrows. We annotated arrows with ‘increase’ and ‘decrease’ – e.g., A increases B, which means ‘As A increases, B increases.’ But if A decreases instead, then users need to understand that B will decrease. One participant suggested letting users practise creating their own causal loops.
(8) Issues with the models underlying the simulations: Some participants pointed out flaws with the simulation models, for example, unexpected behaviour of stocks (tourists, hotels or environmental quality) when variables were set at extremes, i.e., at minimum or maximum values. Models need to be thoroughly tested at the extremes in order to avoid causing potential confusion for learners. Our models, based on Bossel’s, are normalised, i.e., unitless. They are useful for showing general dynamic trends but some users commented on the lack of y-axis scales on some graphs, and the lack of concrete figures.
(9) Facilitation versus unsupervised self-study: Most people thought that a facilitator would be preferable for this type of material. Alternatively, facilitator sessions could be recorded and video clips included in the tool for each major topic.
(10) Learning by using the simulations: Most people said that they found the interactive simulations useful and enjoyable to use. Learning by experimenting is effective and can give unexpected results. The last simulation in the series attracted a lot of positive comment. In it, users attempt to manipulate three variables in order to bring the system to a sustainable state. The most interesting suggestion was that it should be possible, after attempting the task, to display a pre-prepared answer (variables would be set for a sustainable outcome, visible on the graphs).
(11) Perceived limits of the influence of the public: One participant pointed out that policy changes are needed, as well as actions by individuals, in order to reduce the damage caused by coastal tourism. The systems view arguably emphasises the policy (‘big picture’) point of view.
Sample of Spontaneous Feedback During Post-tool Interviews
‘Genuinely eye-opening, much more concerned about the problem than before.’ [Increased awareness/attitude of concern].
An interesting response to pre-questionnaire behaviour questions: ‘If I’m on my holidays, I’m on my holidays!’ – meaning, I don’t want to have to think about recycling and being environmentally responsible. [Reveals attitude].
‘It’s both too easy and too hard at the same time. It requires a level of concentration people probably won’t want to give.’ People would need to be motivated by interest in the subject. ‘Could be used as a teaching tool by a facilitator.’ [Comments by a teacher].
Some Comments Left In-Tool
‘Understanding how to work towards Sustainable Tourism has opened my eyes to what I can do to help.’
‘Good resource - this is engaging, it made me think, taught me a little about Systems Thinking, raised my consciousness about choosing holidays and amenities that have a sustainable approach, and a concern for the environment.’
Discussion
We have not been able to find existing applications of SD (or other) simulation in the context of OL. In the related field of climate change education, Moxnes and Saysel (2009) describe in detail an experiment involving simulation which was designed to correct common misperceptions of carbon dioxide accumulation and its consequences. They report ‘promising learning effects’. In his paper on communicating climate change risks, Sterman (2011) argues that, where misunderstanding of a complex system is the norm, and where there is an urgent need to correct the mental models of the public and policymakers, these problems ‘cannot be remedied merely by providing more information about the climate, but require different modes of communication, including experiential learning environments such as interactive simulations.’ The C-ROADS Climate Change Policy Simulator12 is based on a SD model and is used by policy makers and the public to better understand how to reduce greenhouse gas emissions and to test strategies for dealing with climate change (Sterman et al., 2012).
The results of this pilot study are in line with other studies where computer simulations have been found to enhance outcomes in science education (Rutten et al., 2012). Our work addresses the need to introduce a Systems approach and simulation to the field of OL (Tran et al., 2010) and adds to work done with SD modelling and simulation in the related field of environmental literacy. Whilst the SD model underlying the C-ROADS Climate Change Policy Simulator described by Sterman has been tested, we cannot find studies that test C-ROADS for effectiveness in terms of learning outcomes or support for policy making, which suggests a gap in the research that this study has the potential to address.
Increase in Ocean Literacy and Systems Literacy Levels
The results of the pilot study show a significant increase in the OL dimensions for participants (knowledge, attitude, behaviour, and so on). Participants showed a better understanding of the complex dynamics of the HOS underlying coastal tourism, and developed a more dynamic understanding of the concepts of sustainability and sustainable tourism (Research Question 3). This understanding was in addition to, and arguably provided a mental model as context for, the more usual issues and mitigating responses described in non-Systems oriented OL initiatives.
All participants said that they found the simulations useful. This suggests that it will be worthwhile to investigate further the possibility that ST and SD can be used to create effective educational tools for increasing OL (Research Question 1).
Participants also scored well when recognising a generic Systems structure (a Systems archetype) as applying to other systems (Research Question 2). There is evidence, therefore, that their Systems Literacy, as well as their OL, has improved through use of the tool.
Recommendations for Enhancing the Ocean Literacy Tool
The next version would need to be refined according to the feedback received from participants and observations made when watching them interact more or less successfully with different aspects of the design.
• The prior knowledge and technical aptitude of the target audience would need to be more closely defined.
• Appropriate, possibly simplified, terminology and diagrams should be used for the theoretical Systems aspects. Whilst some participants struggled with terms such as stocks, flows and feedback loops, attempting to teach ST without them may be too limiting. The use of an alternative, simpler set of terms, and assessment of their usefulness, would be an interesting topic for research.
• Creative ways, possibly animated, of presenting Causal Loop Diagrams should be explored. There are a number of existing alternatives for annotating arrows between variables, but none easily solve the problem of clearly representing the differing causal result in the second variable that arises depending on whether the first variable increases or decreases. Some form of novel presentation such as animation could be considered, or use of a short teaching video clip. Users could perhaps hover over an arrow to get both senses of its meaning.
• The length of the session should probably not exceed about 30 minutes, and a facilitator would ideally be present, or video recordings of a facilitator presenting key themes embedded in the tool.
• More visual and interactive elements are preferable to long sections of explanatory text and static diagrams.
• The underlying SD models should be thoroughly tested for performance under extreme variable values to avoid confusion, and the use of some non-normalised models should be considered. It may be useful to provide a detailed model for a specific coastal resort so that concrete figures and scales can be displayed.
• After giving participants the opportunity to practise bringing the model into a sustainable state, providing the facility for them to view ‘pre-cooked’ variable combination settings for sustainable scenarios would be a useful teaching device.
Assessment of Effectiveness of the Tool
As discussed in the Evaluation Methodology section, an OL tool is said to be effective if it leads to change, specifically behaviour change. Whilst behaviour change was not explicitly tested in this study, using the assessment frameworks described, there is evidence of likely behaviour change in participants in that both their stated intentions (behaviour) and their increased scores in the OL dimensions, are associated with the predictors of change, as shown in Tables 3, 4. Further research could explore the actual effect on behaviour.
Survey Design Limitations and Recommendations
Survey design in this study was kept relatively simple, in that a limited number of questions were used to assess each dimension of the predictors of behaviour change. A more detailed survey could add more questions for each dimension, which would reduce the error associated with a single question (Phal and Wyles, 2017).
It is possible that, since participants were aware that they were participating in a Coastal Tourism OL initiative, this may have influenced their answer toward what was felt to be ‘expected’ in pre- and post-surveys.
Follow-up surveys, to identify whether participants have undertaken intended behaviours, together with enabling and inhibiting factors, would provide valuable data on long term behaviour change.
The surveys collected data on current behaviour as regards trips to the coast locally and on holidays abroad. The online tool also collected data on participants’ location, age, gender, occupation and highest educational qualification. The data for these has not yet been analysed. These factors could be investigated to assess their level of influence on participant’s responses and predictors of behaviour change.
Recommendations for Full Study
Results of the pilot study show improvement in OL, Systems Literacy, and likelihood of behaviour change, and are thus encouraging. The tool and teaching methods can be refined according to the qualitative feedback obtained during the initial study, and a full trial conducted with a larger number of participants.
In order to provide evidence that a Systems approach, including interacting with simulations, increases effectiveness (RQ1), use of a control group would help to isolate the effect of this approach from that of other features of the tool. The control group would interact with a tool with similar OL content, but without explicit Systems concepts, nor simulations.
The tool was designed for a general audience for the purposes of the pilot study but would benefit from being designed to suit more closely one of two main groups: policy makers, and general learners such as adults in the community or schoolchildren.
Conclusion
This research represents a promising start in the direction recommended by the NMEA (Tran et al., 2010) toward a Systems- and simulation-oriented approach to OL tools. All OL dimensions were increased after use of the tool in the pilot study, some very significantly. A Systems approach could well make OL and sustainability teaching more effective. The theoretical link between the increases in OL dimensions and predicted behaviour change, described in this paper, is also important, given the current urgency for dealing with serious problems with the world’s oceans. These results provide motivation for further research. The next step would be to further develop the OL tool and design it for use with policy makers and for the general public, and in education, and to conduct a larger study.
Ethics Statement
Ethical approval is not required for this research because it does not collect personal information. The data gathered from the survey participants did not contain any information which could identify the individual participant. The information gathered from the participants in-tool included their country at the time of participation, age category, gender, occupation and highest educational qualification. Location, occupation and educational qualification data have not so far been used. The information gathered from the survey included location (town or city) and their responses to questions related to their awareness, knowledge, attitude, communication and behaviour in relation to ocean literacy topics. According to the National University of Ireland, Galway’s ethical approval guidelines, this research does not come under an area that requires ethical approval.
The surveys were carried out using paper forms and at the start of the survey each participant was required to agree with the following statement: “This survey forms part of a study being carried out to evaluate the effectiveness of ocean literacy (awareness raising and training) materials developed under the ResponSEAble project. Answers given will remain confidential and only anonymised and grouped data will be used in the analysis and reporting. By taking part in this survey you are consenting to your data being used as part of this study.”
Author Contributions
CB was the principal author of this manuscript. OM was the secondary author and the leader of the work package under which this research was conducted. MA contributed to evaluation methodology, theory of change and survey design.
Funding
This research was carried out as part of the project ResponSEAble (Project No. 652643), funded by the EU Horizon 2020 Framework Programme for Research and Innovation.
Conflict of Interest Statement
The authors declare that the research was conducted in the absence of any commercial or financial relationships that could be construed as a potential conflict of interest.
Abbreviations
CLD, causal loops diagram; HOS, human-ocean system; OL, ocean literacy; OLP, ocean literacy principle; SBLE, simulation-based learning environment; SD, system dynamics; ST, systems thinking.
Footnotes
- ^ https://www.marine-ed.org/
- ^ https://www.responseable.eu/
- ^ http://www.emsea.eu/info.php?pnum=17
- ^ https://www.un.org/sustainabledevelopment/oceans/
- ^ http://www.seachangeproject.eu/seachange-about-2/ocean-literacy (accessed April 6, 2019). This page includes a useful short video explaining ocean literacy.
- ^ https://thesystemsthinker.com/%ef%bb%bffood-systems-climate-systems-laundry-systems-the-time-for-systems-literacy-is-now/
- ^ http://responseable.nuigalway.ie/st/
- ^ Contained within ZOO MDL.zip, available for download from the Centre for Environmental Research, University of Kassel, Germany, at https://www2.cesr.de/
- ^ https://www.oasis-open.org/committees/xmile/
- ^ https://github.com/bpowers/sd.js
- ^ http://www.prosea.info/
- ^ https://www.climateinteractive.org/tools/c-roads/
References
Arnold, R. D., and Wade, J. P. (2015). A definition of systems thinking: A systems approach. Proced. Comp. Sci. 44, 669–678. doi: 10.1016/j.procs.2015.03.050
Bossel, H. (2007). System Zoo 2 Simulation Models: Climate, Ecosystems, Resources. Norderstedt: BoD–Books on Demand.
Cohen, J. (1988). Statistical Power Analysis for the Behavioral Sciences, 2nd Edn. Hillsdale, NJ: Lawrence Earlbaum Associates.
Connell, J. P., and Kubisch, A. C. (1998). “Applying a Theory of Change Approach,” in New Approaches to Evaluating Community Initiatives Theory, Measurement, and Analysis, eds K. Fulbright Anderson, A. C. Kubisch, and J. P. Connell (Washington, DC: Aspen Institute).
Cronin, M. A., Gonzalez, C., and Sterman, J. D. (2009). Why don’t well-educated adults understand accumulation? A challenge to researchers, educators, and citizens. Organ. Behav. Hum. Decis. Process. 108, 116–130. doi: 10.1016/j.obhdp.2008.03.003
Díaz-Siefer, P., Neaman, A., Salgado, E., Celis-Diez, J. L., and Otto, S. (2015). Human-environment system knowledge: a correlate of pro-environmental behavior. Sustainability 7, 15510–15526. doi: 10.3390/su71115510
Driver, Pressure, State, Impact, Response Framework [DPSIR] (2013). Environmental Justice Organizations, Liabilities and Trade. Available at: http://www.ejolt.org/2013/02/dpsir/. (accessed January 18, 2019).
Elliott, M., Burdon, D., Atkins, J. P., Borja, A., Cormier, R., De Jonge, V. N., et al. (2017). “And DPSIR begat DAPSI(W)R(M)!” - A unifying framework for marine environmental management. Mar. Poll. Bull. 118, 27–40. doi: 10.1016/j.marpolbul.2017.03.049
Fisher, D. M. (2011). “Everybody thinking differently”: K–12 is a leverage point. Syst. Dyn. Rev. 27, 394–411. doi: 10.1002/sdr.473
Ford, A. (1999). Modeling the Environment: an Introduction to System Dynamics Models of Environmental Systems. Washington, DC: Island press.
Forrester, J. W. (2007). System dynamics - A personal view of the first fifty years. Syst. Dyn. Rev. 23, 345–358. doi: 10.1002/sdr.382
Gobert, J. D., and Buckley, B. C. (2000). Introduction to model-based teaching and learning in science education. Int. J. Sci. Educ. 22, 891–894. doi: 10.1080/095006900416839
Green, L. W., and Kreuter, M. W. (1999). Health Promotion and Planning: An Educational and Environmental Approach, 4th Edn. Mountain View, CA: Mayfield Publishing Co.
Johnson, B., and Činčera, J. (2015). Examining the relationship between environmental attitudes and behaviour in education programmes. Soc. Stud. 12, 97–111.
Klöckner, C. A. (2013). A comprehensive model of the psychology of environmental behaviour – A meta-analysis. Glob. Environ. Change 2013, 1028–1038. doi: 10.1016/j.gloenvcha.2013.05.014
Kukkonen, J., Kärkkäinen, S., and Keinonen, T. (2018). Examining the Relationships between Factors Influencing Environmental Behaviour among University Students. Sustainability 10:4294. doi: 10.1007/s11121-011-0232-7
Landriscina, F. (2013a). Simulation and Learning: A Model-Centered Approach. Berlin: Springer Science & Business Media.
Landriscina, F. (2013b). Simulation-based learning: open questions and guidelines for the instructionally effective use of simulation. J. Formaz. Rete. 13, 68–76.
Latif, S. A., Omar, M. S., Bidin, Y. H., and Awang, Z. (2013). Role of environmental knowledge in creating pro-environmental residents. Proced. Soc. Behav. Sci. 105, 866–874. doi: 10.1016/j.sbspro.2013.11.088
Meadows, D. H., Meadows, D. L., Randers, J., and Behrens, W. W. (1972). The Limits to Growth: A Report for the Club of Rome’s Project on the Predicament of Mankind. New York, NY: Universe Books.
Moxnes, E., and Saysel, A. K. (2009). Misperceptions of global climate change: information policies. Clim. Change 93:15. doi: 10.1007/s10584-008-9465-2
National Marine Educators Association (2010). Ocean Literacy Scope and Sequence for Grades K-12, published in the Special Report #3 on The Ocean Literacy Campaign Featuring the Ocean Literacy Scope & Sequence for Grades K-12. Available at: http://oceanliteracy.wp2.coexploration.org/ocean-literacy-framework/principles-and-concepts/?page_id=1073. (accessed January 18, 2019).
National Oceanic and Atmospheric Administration (2013). Ocean Literacy: The Essential Principles and Fundamental Concepts of Ocean Sciences for Learners of All Ages Version 2, a Brochure Resulting From the 2-Week On-Line Workshop on Ocean Literacy through Science Standards. Silver Spring: National Oceanic and Atmospheric Administration.
Ojala, M. (2008). Recycling and ambivalence quantitative and qualitative analyses of household recycling among young adults. Environ. Behav. 40, 777–797. doi: 10.1177/0013916507308787
Paço, A., and Lavrador, T. (2017). Environmental knowledge and attitudes and behaviours towards energy consumption. J. Environ. Manag. 197, 384–392. doi: 10.1016/j.jenvman.2017.03.100
Patrício, J., Elliott, M., Mazik, K., Papadopoulou, K.-N., and Smith, C. J. (2016). DPSIR—two decades of trying to develop a unifying framework for marine environmental management? Front. Mar. Sci. 3:177. doi: 10.3389/fmars.2016.00177
Phal, S., and Wyles, K. J. (2017). The human dimension: how social and behavioural research methods can help address microplastics in the environment. Anal. Methods. 2017:1404. doi: 10.1039/c6ay02647h
Richmond, B. (1994). “Systems Dynamics/Systems Thinking: Let’s Just Get On With It,” in Proceedings of the International Systems Dynamics Conference, Sterling.
Rutten, N., Van Joolingen, W. R., and Van Der Veen, J. T. (2012). The learning effects of computer simulations in science education. Comput. Educ. 58, 136–153. doi: 10.1016/j.compedu.2011.07.017
Smetana, L. K., and Bell, R. L. (2012). Computer simulations to support science instruction and learning: a critical review of the literature. Int. J. Sci. Educ. 34, 1337–1370. doi: 10.1080/09500693.2011.605182
Sterman, J., Fiddaman, T., Franck, T., Jones, A., Mccauley, S., Rice, P., et al. (2012). Climate interactive: the C-ROADS climate policy model. Syst. Dyn. Rev. 28, 295–305. doi: 10.1002/sdr.1474
Sterman, J. D. (2002). All models are wrong: reflections on becoming a systems scientist. Syst. Dyn. Rev. 18, 501–531. doi: 10.1002/sdr.261
Sterman, J. D. (2011). Communicating climate change risks in a skeptical world. Clim. Change 108:811. doi: 10.1007/s10584-011-0189-3
Sweeney, L. B., and Sterman, J. D. (2000). Bathtub dynamics: initial results of a systems thinking inventory. Syst. Dyn. Rev. 16, 249–286. doi: 10.1002/sdr.198
Tran, L. U., Payne, D. L., and Whitley, L. (2010). Research on learning and teaching ocean and aquatic sciences. NMEA Spec. Rep. 3, 22–26.
Umuhire, M. L., and Fang, Q. (2016). Method and application of ocean environmental awareness measurement: lessons learnt from university students of China. Mar. Poll. Bull. 102, 289–294. doi: 10.1016/j.marpolbul.2015.07.067
Whitmarsh, I., and O’Neill, S. (2010). Green identity, green living? The role of pro-environmental self-identity in determining consistency across diverse pro-environmental behaviours. J. Environ. Psychol. 2010, 305–314. doi: 10.1016/j.jenvp.2010.01.003
Keywords: ocean literacy, system dynamics, simulation based learning environment, SBLE, human-ocean systems
Citation: Brennan C, Ashley M and Molloy O (2019) A System Dynamics Approach to Increasing Ocean Literacy. Front. Mar. Sci. 6:360. doi: 10.3389/fmars.2019.00360
Received: 31 January 2019; Accepted: 12 June 2019;
Published: 28 June 2019.
Edited by:
Gail Scowcroft, University of Rhode Island, United StatesReviewed by:
Marcos Mateus, University of Lisbon, PortugalCatherine Jane Collier, James Cook University, Australia
Copyright © 2019 Brennan, Ashley and Molloy. This is an open-access article distributed under the terms of the Creative Commons Attribution License (CC BY). The use, distribution or reproduction in other forums is permitted, provided the original author(s) and the copyright owner(s) are credited and that the original publication in this journal is cited, in accordance with accepted academic practice. No use, distribution or reproduction is permitted which does not comply with these terms.
*Correspondence: Caroline Brennan, Y2Fyb2xpbmUuYnJlbm5hbkBudWlnYWx3YXkuaWU=