- Department of Biological Sciences, Florida Atlantic University, Boca Raton, FL, United States
Sea turtles are vulnerable immediately after emerging from nests and before they reach the surf. Mortality rates during this brief period are largely unknown. Many sea turtle monitoring programs measure hatchling production from nest inventories. These inventories rarely account for post-emergence mortality, leaving an unknown bias in hatchling production estimates. This study addresses the nest-to-surf data gap for Florida’s east coast nesting assemblages of loggerhead sea turtles (Caretta caretta). Five locations were surveyed during the 2016-nesting season. Across all beaches, 7.6% of the observed hatchlings did not survive to reach the water. Mortality sources varied by location. Observed predators include: mammals, birds, and crabs. Hatchling disorientation and misorientation due to photopollution occurred more frequently in urban areas than natural areas. Factors identified as important in hatchling mortality included numbers of hatchlings emerging, nest-to-surf distance, and level of urbanization. The results of this study may help sea turtle nesting managers address nest-to-surf mortality and improve hatchling production estimates.
Introduction
Robust measures of hatchling sea turtle production are fundamental for characterizing demographics and establishing management plans for these imperiled species. In wildlife studies, certain life stages are often more accessible than others. This challenge holds true for marine turtles, as nesting females and emerging hatchlings are reasonably accessible on beaches during the nesting season (Bowen et al., 1992; Eckert, 1999; Tomillo et al., 2010; Brost et al., 2015).
Loggerhead turtles are a protected species and are managed. In the United States, the species is listed as threatened under the Endangered Species Act of 1973, as amended (16 USC 1531 et seq.) (U.S. Fish and Wildlife Service and National Marine Fisheries Service, 1978). The International Union for Conservation of Nature lists loggerhead sea turtles (Caretta caretta) globally as a vulnerable species (Casale and Tucker, 2015). To manage the species for recovery, robust demographics data are essential. Hatchling production rates are among the inputs to demographic analyses.
Typically, gravid females come ashore to lay clutches of eggs and then depart, leaving their eggs to incubate and hatch unattended. Nesting sea turtles are abundant during the summer months on many beaches of the southeastern United States, and Florida in particular (National Marine Fisheries Service and U.S. Fish and Wildlife Service [NMFS and USFWS], 2008).
Loggerhead sea turtles nesting in the United States deposit an estimated 2–8 nests (modal number is 5) between the months of April and September in a given season, and predominantly nest every 2–3 years, though this frequency may vary significantly (Bjorndal et al., 1983; Frazer and Richardson, 1985; National Marine Fisheries Service and U.S. Fish and Wildlife Service [NMFS and USFWS], 2008; Tucker, 2010; Shamblin et al., 2017). Each Floridian nest, on average, contains 115 eggs (Brost et al., 2015), which incubate for 42–60 days depending on environmental factors like temperature, time of year, and geographical location (Mrosovsky and Yntema, 1980; McGehee, 1990; National Marine Fisheries Service and U.S. Fish and Wildlife Service [NMFS and USFWS], 2008; Brost et al., 2015). After incubation is complete, the hatchlings will break through their leathery egg shells, but remain relatively inactive for about a day while their carapaces straighten (Miller, 1985). Hatchlings dig their way out of the nest and emerge on the surface after ∼ 4.1 days (range of 4–7 days; Godfrey and Mrosovsky, 1997). Emergence times are normally distributed; the vast majority of sea turtle hatchlings emerge at night with a peak between 23:00 and 24:00 h for loggerheads in Florida (Witherington et al., 1990). Despite the accessibility of marine turtle nests in Florida, no studies address the fate of sea turtle hatchlings as they crawl to the water. Just a single observational study in Costa Rica (Tomillo et al., 2010) described predation on hatchling leatherback sea turtles (Dermochelys coriacea) during sea finding.
Sea turtles are solitary throughout most of their life stages; however, during emergence, hatchlings from the same nest travel to the water, often in groups, which minimizes predation risk in some animals (Hamilton, 1971; Spencer et al., 2001). In Kefalonia, Greece, sea turtle hatchlings emerge over a prolonged time period throughout the night, not necessarily in a large group. The prolonged emergence time was correlated with a large thermal range between the top and bottom nest temperatures. Nests with uniform temperatures did not exhibit these prolonged emergence patterns (Houghton and Hays, 2001). In areas of high predation risk, emerging in large groups may be crucial to survival depending on the predator. Terrestrial predators are not the only threat that sea turtle hatchlings may face. Anthropogenic threats from photopollution (Witherington et al., 2014) and impediments to sea finding from accumulated marine debris also may prevent hatchlings from reaching the surf (Triessnig et al., 2012).
Hatchling production is usually estimated by inventory of nest contents following hatchling emergences (Brost et al., 2015). Data from nests excavated for inventory are important to identify trends in production but they do not account for hatchling losses between the nest and the surf zone. Failing to account for the proportion of emergent hatchlings that die before entering the surf on Florida beaches, inflates production estimates and ignores sources of risk.
The Florida east coast loggerhead rookery is one of the two largest rookeries in the world (National Marine Fisheries Service and U.S. Fish and Wildlife Service [NMFS and USFWS], 2008) and the productivity of this population accounts for a biologically significant segment of the species. Therefore, accurate production estimates are important to species management. This study quantifies nest-to-surf hatchling mortality along the east coast of Florida, and simultaneously identifies the sources of mortality, by location.
Materials and Methods
Study Sites
Study site selection was guided by consultation with the staff of the Florida Fish and Wildlife Conservation Commission (FWC) and interviews with primary permit holders. Five east coast beaches were selected to represent various habitat types: Canaveral National Seashore, Archie Carr National Wildlife Refuge (ACNWR), Wabasso Beach, Tequesta Beach, and Boca Raton Beaches (Figure 1).
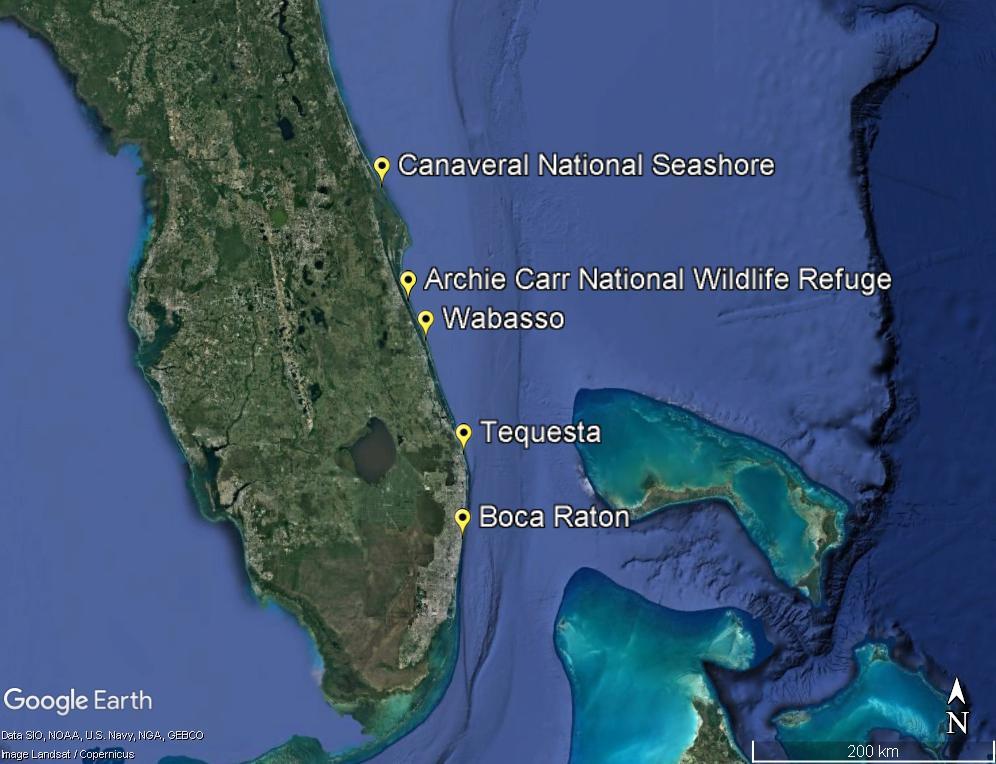
Figure 1. Map of the field sites along the east coast of Florida. Latitude and Longitude range (south to north) for each site are: Boca Raton (26.336402, –80.070652 to 26.38852, –80.06628); Tequesta (26.945217, –80.071242 to 26.972893, –80.081022); Wabasso (27.75771, –80.39334 to 27.76611, –80.39810); Archie Carr National Wildlife Refuge (27.92647, –80.48456 to 28.04064, –80.54398); and Canaveral National Seashore (28.86854, –80.78275 to 28.887722, –80.795525).
Each site environment was characterized by a range anthropogenic modification from completely natural to mostly urban; each was assigned a level of urbanization on a scale from 1 (natural) to 4 (urban). This scale provided a categorical assignment of anthropogenic developmental at each nest site:
1 = Completely natural, park setting, no buildings visible.
2 = Mostly natural, 1–5 buildings visible.
3 = Mixed urban with large natural areas/trees, 5–10 buildings visible.
4 = Urban with few natural areas, >10 buildings visible.
Nests were selected quasi-randomly based upon expected emergences as suggested by local sea turtle monitors. The perpendicular distance from the nest to the mean high tide line was measured and designated as the minimum crawl axis.
Because ghost crabs (Ocypode quadrata) are known hatchling predators, the numbers of ghost crab holes were counted within 1-m to each side of the minimum crawl axis between the nest and surf. This hole count served as a conservative estimate of the density of ghost crabs in the immediate surrounding area.
The perpendicular distance from the nest to the upland transition zone (the point where the open sandy beach ends) was also measured. Examples include: toe of dune, seawall, and condominium gate.
Field Data Collection
A combination of techniques were used to characterize nest-to-surf mortality: time-lapse image collection, direct observation, and detailed hatchling track maps.
We identified locations of nests predicted to emerge in coordination with permit holders at each site, based on incubation durations of local emergences. Once at the nests, infra-red sensitive cameras (Stealth CamTM G42 No-Glo Trail Game Cameras, Model #STC-G42NG, Grand Prairie, TX, United States) were fitted on tripods and placed behind each nest to capture images of the emergence events. Cameras were programmed on a time-lapse setting to take a photograph every 5 or 10 s. In areas where the beach was wide or sloped out of view toward the shoreline, a second camera was placed at mid-beach to photograph hatchlings as they entered the water, were lost to predators, or disoriented before entering the water. Prior to nest emergences, small irregularities in the sand surface around each nest (such as investigator footprints) were smoothed by gentle sweeping with a broom so hatchling tracks could be identified clearly.
Throughout the night, we periodically checked nests and observed hatchling emergences using a night-vision scope from a distance of ≥10 m. At dawn, we drew detailed hatchling track maps to assist in the identification of hatchling fate. To ensure temporal and spatial representation of the hatching season, each beach was sampled multiple times across the season.
Hatchlings and Hatchling Fate
Total number of hatchlings that emerged per nest was measured to account for emergence size. Each hatchling observed was assigned a fate of “no,” “likely,” or “confirmed” mortality. Hatchlings that successfully crawled to the ocean had no mortality. Confirmed mortality was the fate of hatchlings that were observed being killed. Likely mortality was the fate of hatchlings where mortality was highly likely without intervention but was not confirmed in person or on camera, e.g., ghost crab dragged a hatchling out of view of the camera and no subsequent hatchling tracks from the drag mark. Likely mortality was also the fate given to hatchlings that likely died as a consequence of exhaustion, an inability to right themselves from an upside-down position, or mis- or disoriented crawls into dune vegetation with no sign of an exit toward the water.
The camera’s view was limited by the fixed focus lens and the distance that the infrared flash reached. Consequently, disoriented hatchlings left only a limited record of their movements. When possible, disoriented turtles were followed from a distance, so that their fate could be verified. If hatchlings entered vegetation, they were given at least 30 min from that point of entry to reorient toward the ocean before being classified in the “likely mortality” group. Hatchling fate from such events were designated on the detailed track maps.
Statistical Analysis
Modeling identified the best predictor variables for mortality of sea turtle hatchlings. Analyses were performed in RStudio (version 1.0.143) using packages “lme4,” “stats,” and “MASS.” Likely mortality and confirmed mortality were combined into a single category of mortality. Mortality was calculated as a proportion of hatchlings from each nest that failed to reach the water (Mortality = # failed hatchlings/total hatchlings emerging; values ranged from 0 = no mortality to 1 = complete emergence mortality).
A Generalized Linear Mixed Model (GLMM) was used to identify the best parameter estimates of mortality among all sites. The GLMM model was used to identify general predictors of hatchling mortality among sites, with proportion hatchling mortality as the response variable.
A generalized linear model (GLM) was used to identify if location was an important predictor variable to consider on a finer scale for hatchling mortality (Appendix A1). Since location was found to be an important variable, GLMs were used for each of the five locations. The goal of running these additional models was to determine site-specific predictors of mortality, especially if it varied in severity and source by location.
Several variables were included in these models: Location; Urbanization; Crab holes; Total hatchlings; Nest-to-surf (m); and Upland (m). The variable “Location” was the only variable considered as a random factor in the GLMM, consistent with the definitions laid out by Bolker et al. (2008). The locations represent a sample from the population of sea turtle nesting areas and include variation among sites. All other variables are classified as fixed for the purpose of the GLMM analysis.
Results
Interviews with permit holders at each site confirm that direct observations of hatchling mortality are rare. At Canaveral and Tequesta, no nest-to-surf mortality was documented by beach surveyors.
Observations of hatchling emergence events were attempted at 236 nests. Not all were successful due to the unpredictable nature of emergence events, and low nest success in 2016 (personal communication from K. Rusenko [permit holder in charge of managing the nesting beach at Boca Raton] and S. Hirsch, [manager of the nesting beach at Tequesta]). Data were obtained from 66 nests. Nests had 1–64 emergent hatchlings for a total of 1089 hatchlings observed. Emergence events occurred between August 10 and October 3, 2016.
Overall, 7.6% of the observed hatchlings failed to complete a crawl to the water. Of these, 4.2% were “likely mortalities” and 3.4% were “confirmed mortalities” (Table 1). Mortality rates based on proportions of total hatchlings per site, ranked from lowest to highest were Wabasso, ACNWR, Tequesta, Canaveral, and Boca Raton. When examining individual nests as the study unit, as opposed to individual hatchlings, the mean mortality rates ±95% CI (Table 2) described from lowest to highest were Wabasso, Boca Raton, Canaveral, ACNWR, and Tequesta.
Sources of Hatchling Mortality
Hatchling mortality source varied at each of the study sites (Table 3). Ghost crabs (O. quadrata) were the most common predators and the largest source of mortality at three of the five sites (Canaveral, ACNWR, and Wabasso). Ghost crabs often left behind tracks and drag marks from captured hatchlings, which remained visible in the morning when track maps were made. Interpretations of the marks were confirmed using time series photographs of predation events (Figure 2). Yellow-crowned night herons (Nyctanassa violacea) were the dominant predators at Tequesta and the most common source of hatchling mortality at that site (Figure 3).
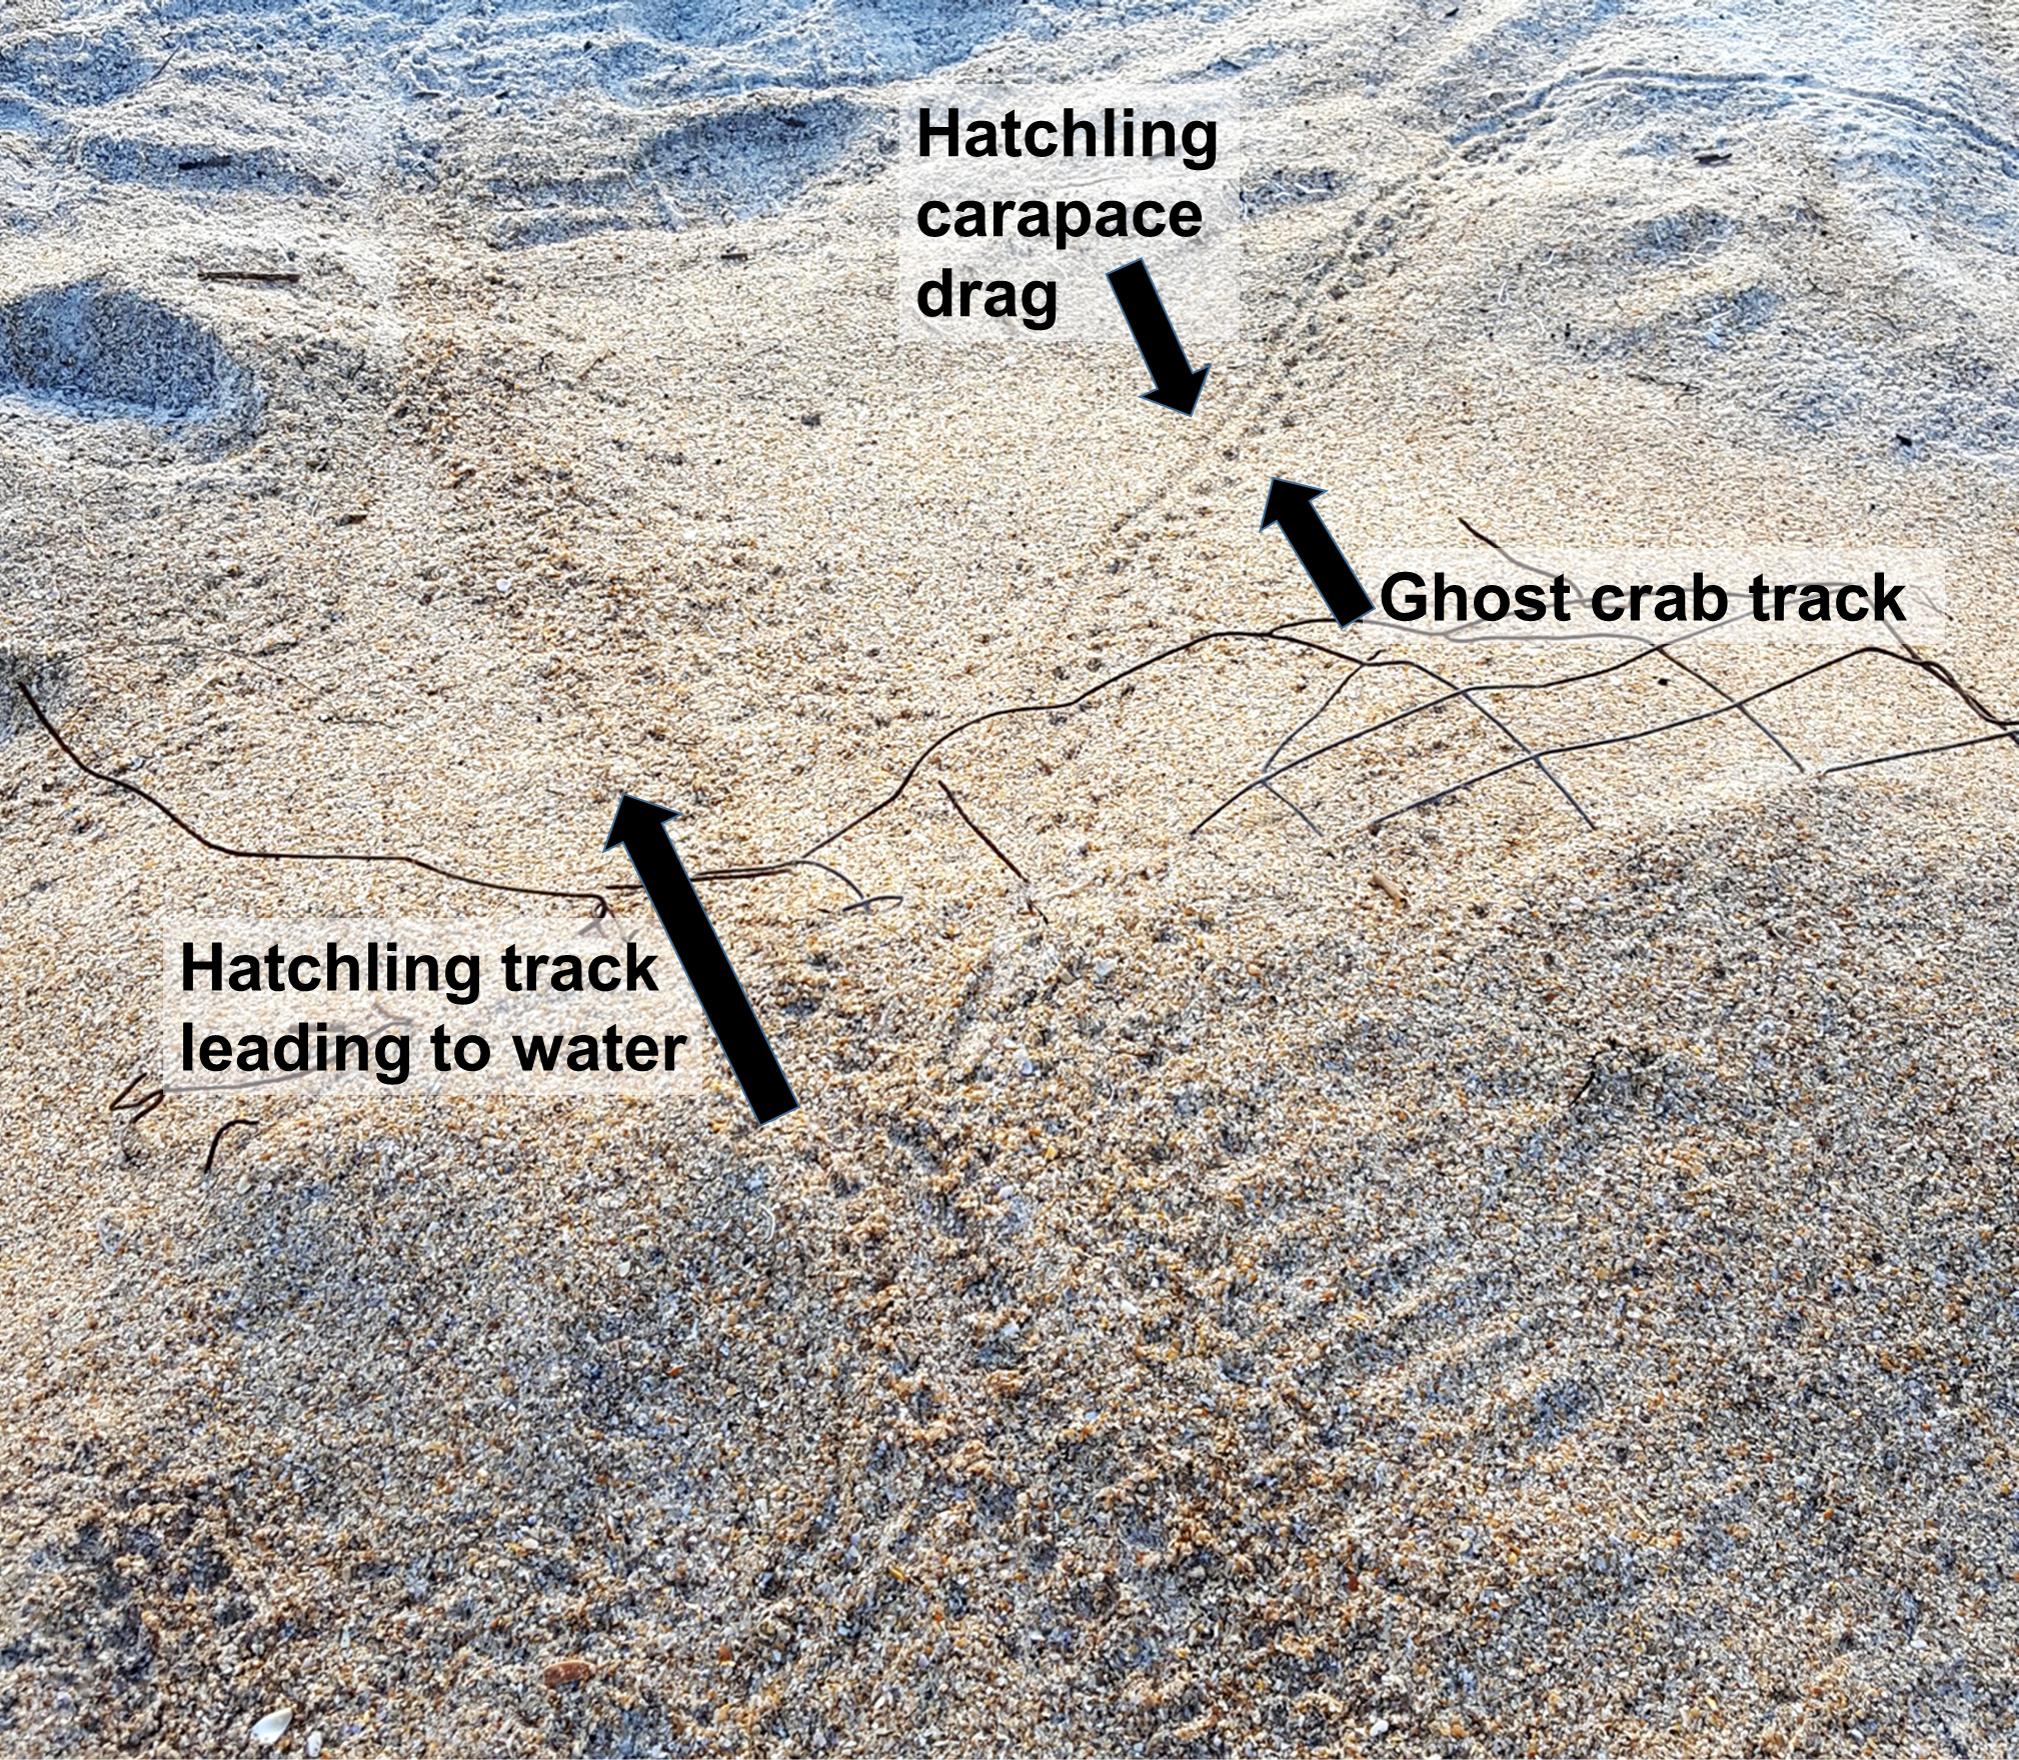
Figure 2. The difference between a hatchling track leading to the ocean (Left), and a hatchling track that was intercepted by a ghost crab (Right). When a ghost crab took the hatchling, the turtle was dragged on its side so the carapace created a continuous line in the sand adjacent to the point-like tracks of the crab. The track details were still clearly visible the following morning. The interpretation of these tracks was confirmed by time-lapse infrared photography throughout the night.
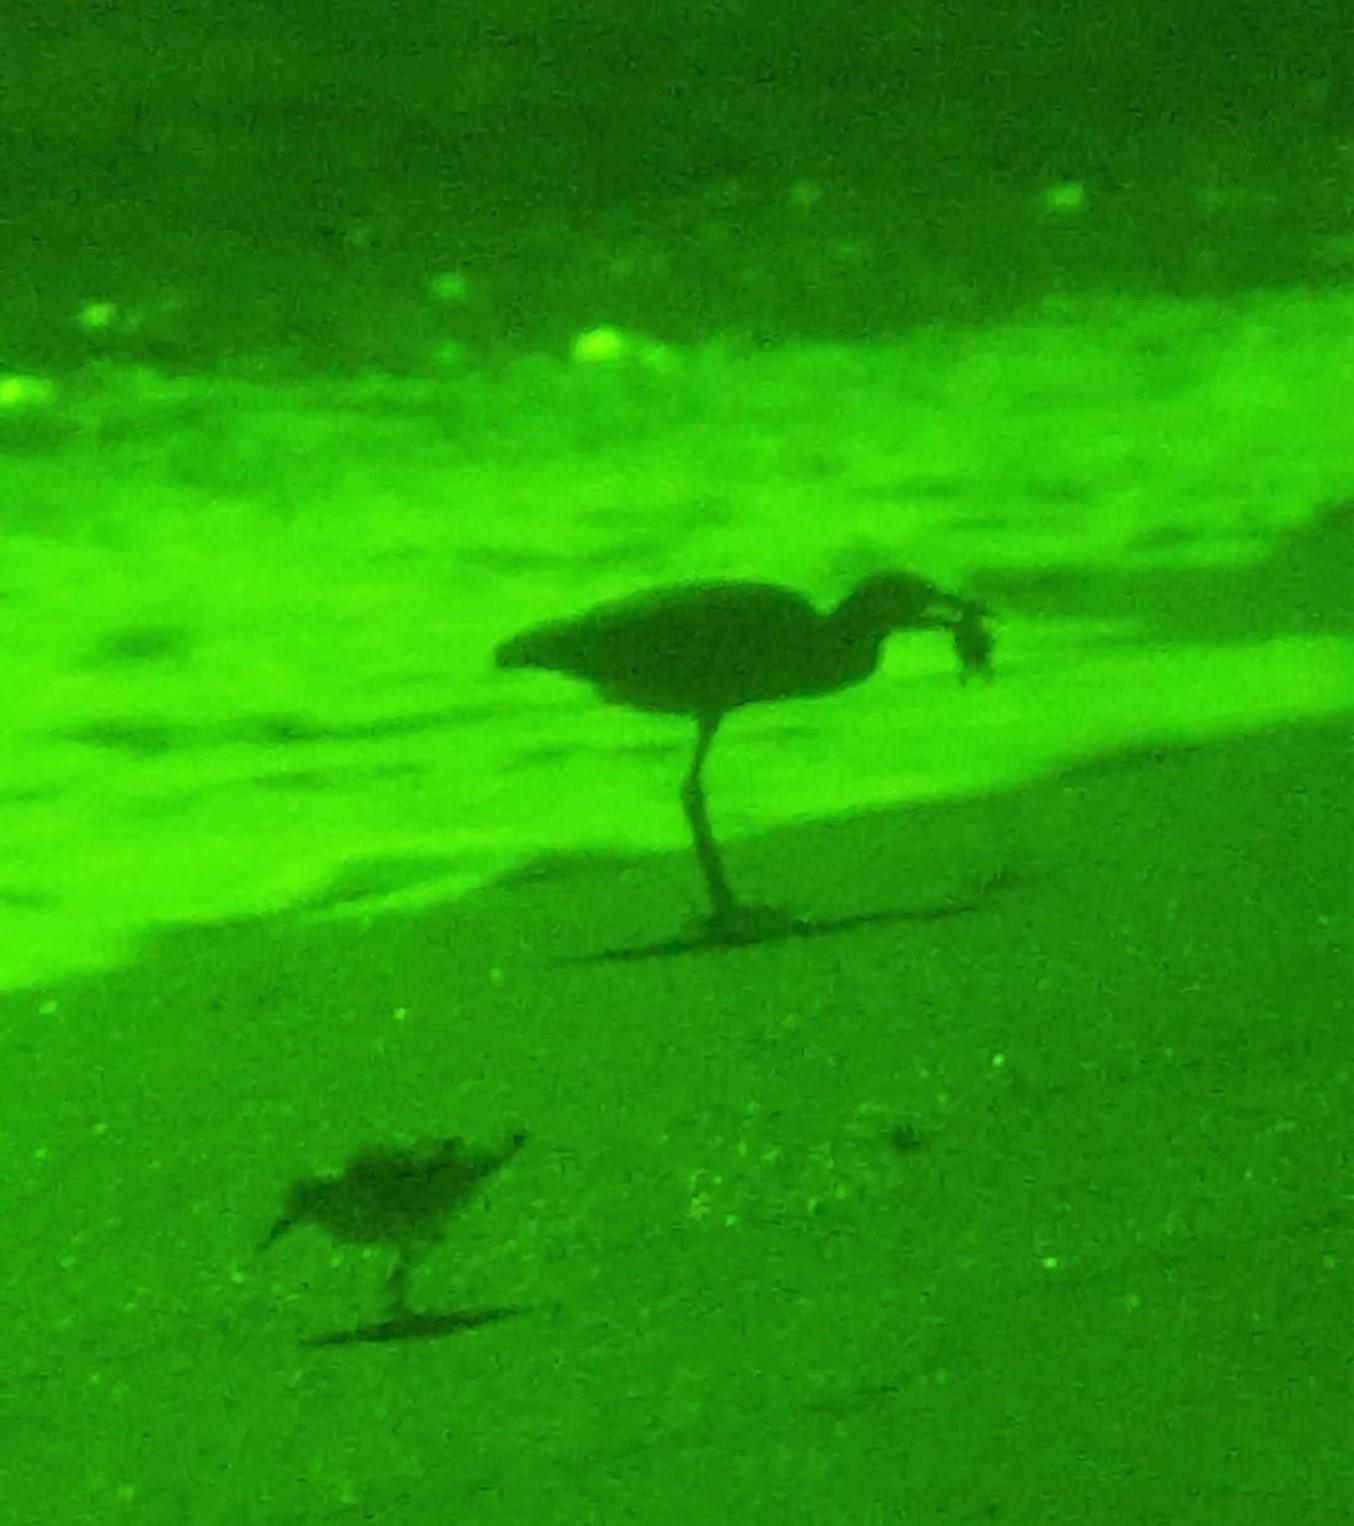
Figure 3. Yellow-crowned night heron (Nyctanassa violacea; large bird) preying upon a loggerhead hatchling at Tequesta Beach. Night heron predation was observed directly. The herons pick up, drop, and stab hatchlings with their beaks. In at least one instance, this behavior was repeated for over 15 min before the hatchling was consumed. The smaller bird in the lower left is a sanderling (Calidris alba) and is not a hatchling predator.
At Boca Raton, mis- or disorientation was the largest cause of nest-to-surf mortality. Six misoriented hatchlings were followed. They eventually crawled into vegetation and did not exit. Two succumbed to ant predation and four did not reorient toward the ocean. The four unsuccessful hatchlings were found entrapped in vegetation. They could not have freed themselves to reorient seaward. They were collected after >30 min in the vegetation and released at the shoreline. The light source(s) causing misorientation may have been from sky glow, lights present at two condominiums, or both (Figure 4). Gray fox (Urocyon cinereoargenteus) predation was the second largest cause of mortality at Boca Raton. Foxes killed, but did not consume, two hatchlings from our study nests during the sampling period. Fox predation was also documented by local sea turtle patrol staff at nests not included in this study.
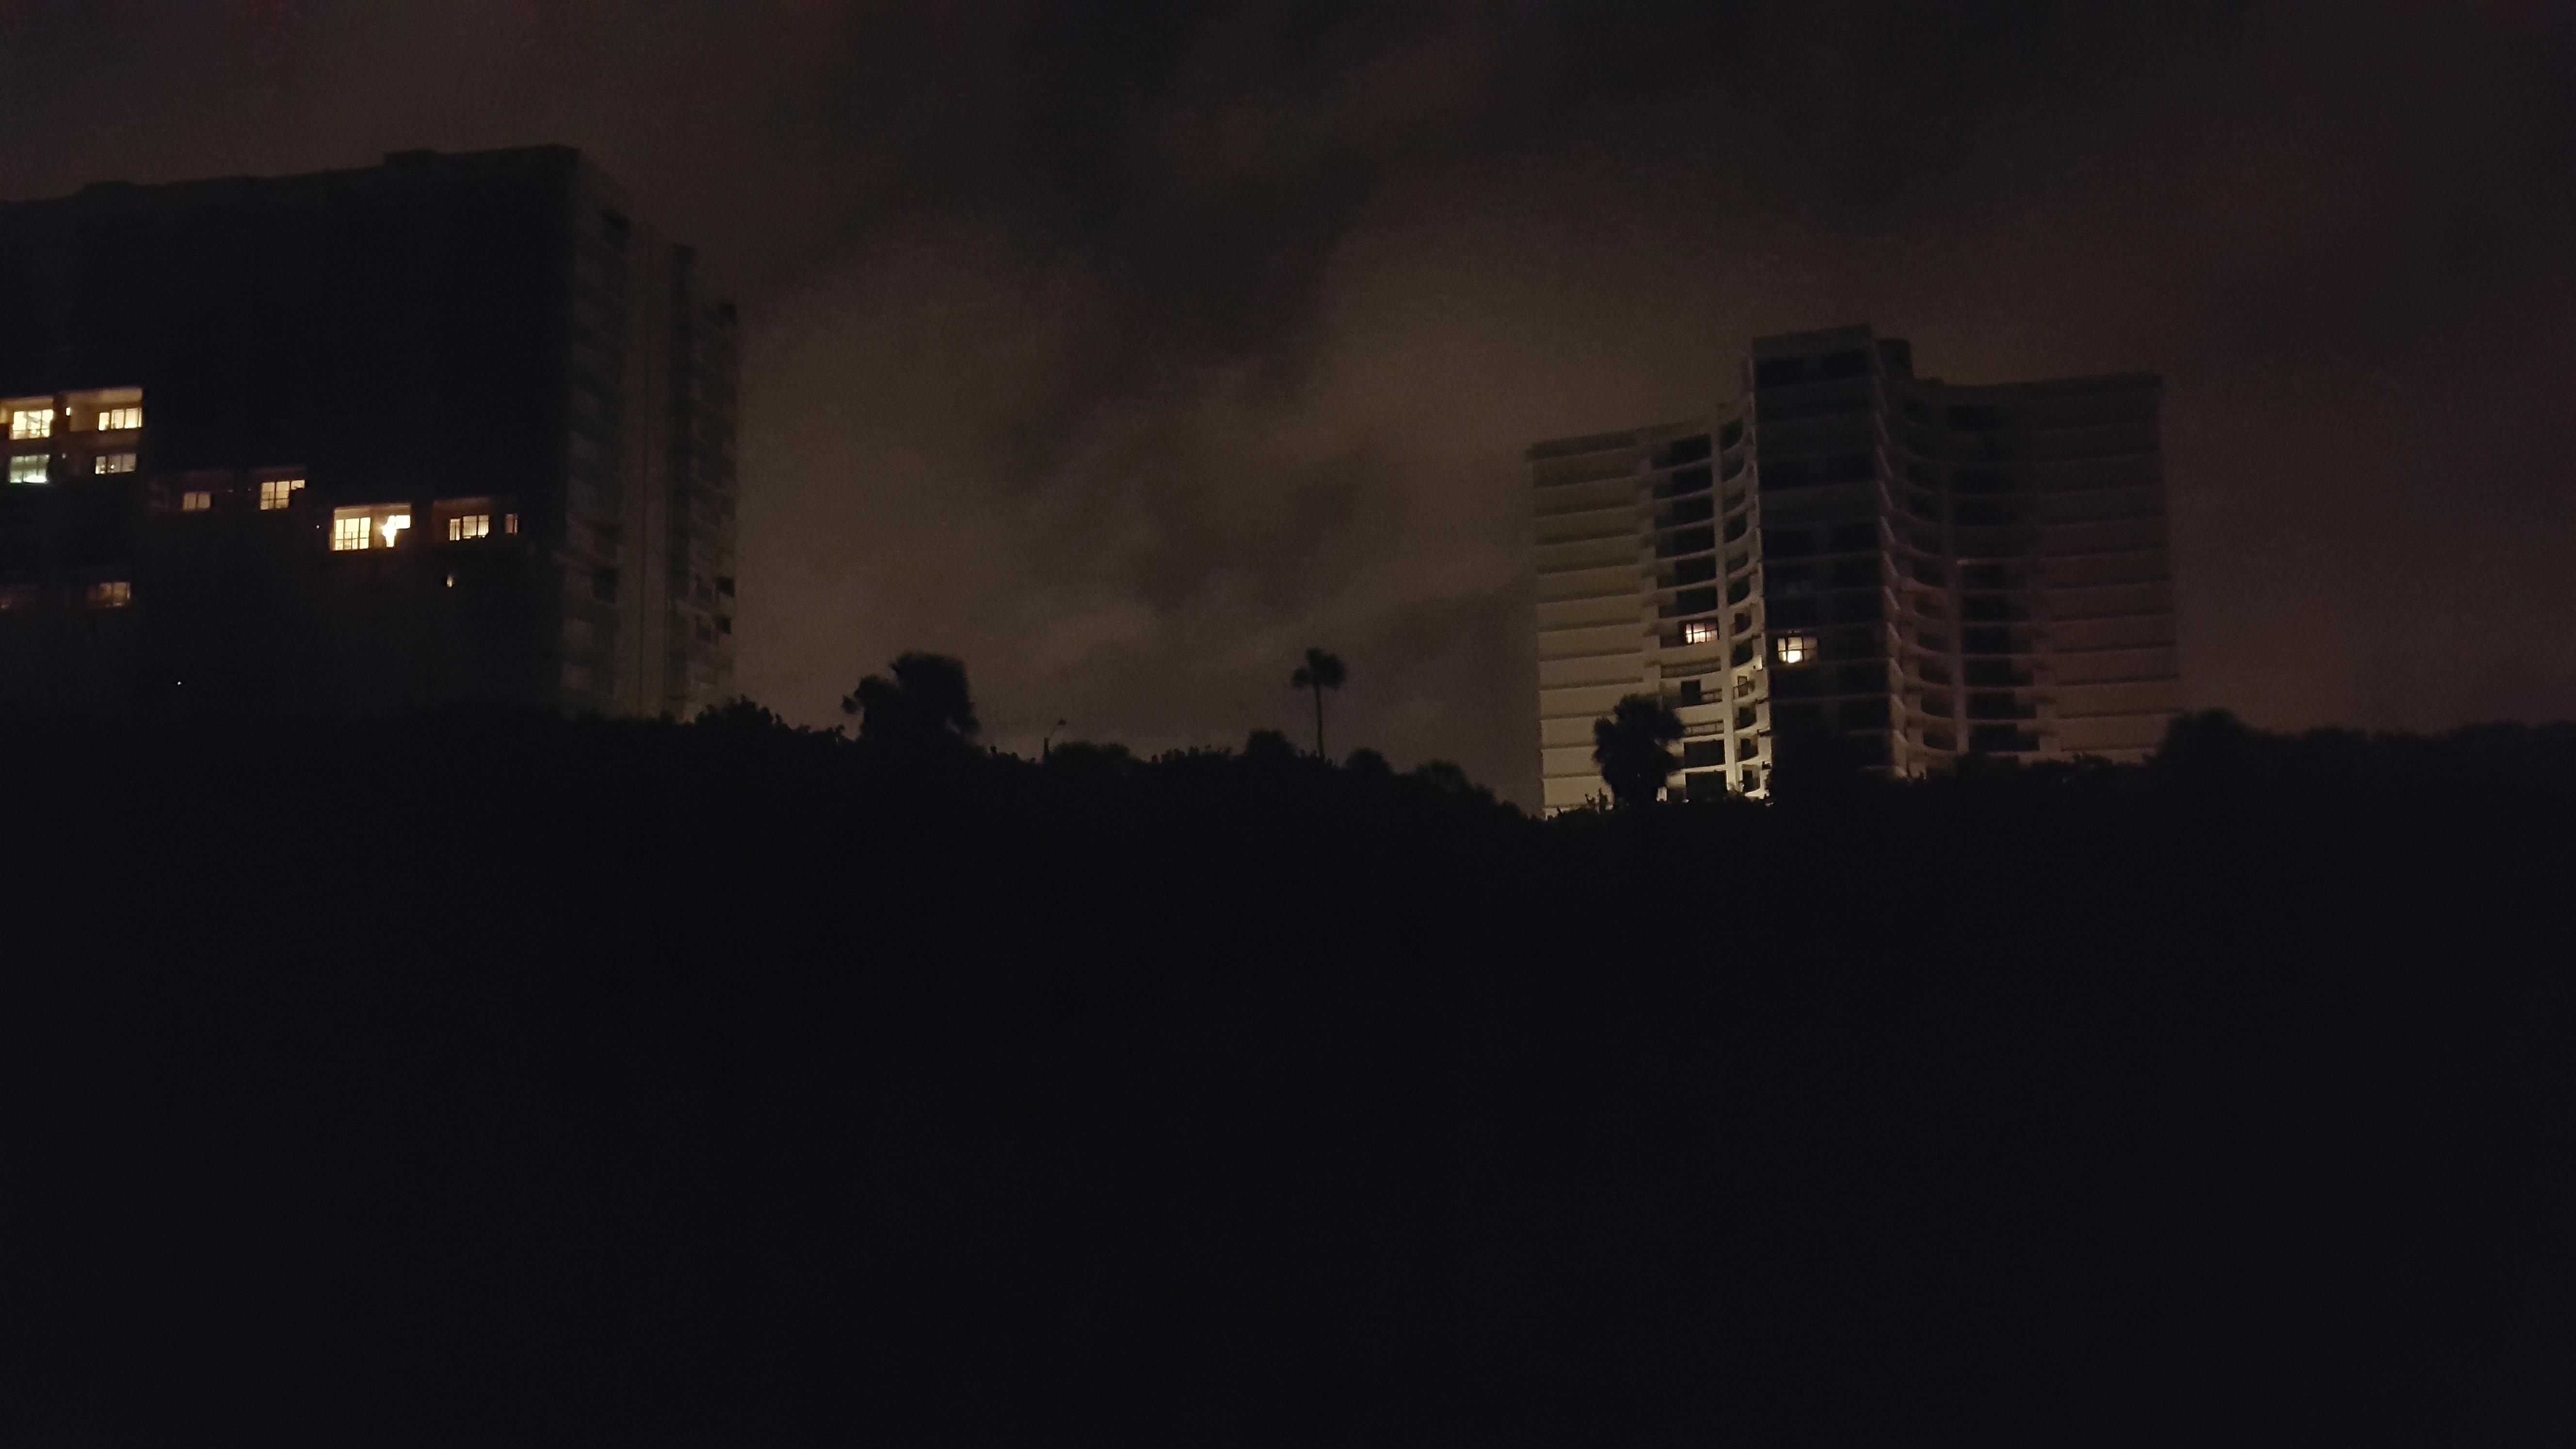
Figure 4. Two condominiums in Boca Raton with sky glow and common urban lighting visible from the beach. Low clouds increase the reflection of lights from the adjacent city and sky glow. Sky glow is associated with hatchling disorientation.
Factors Impacting the Likelihood of Hatchling Mortality
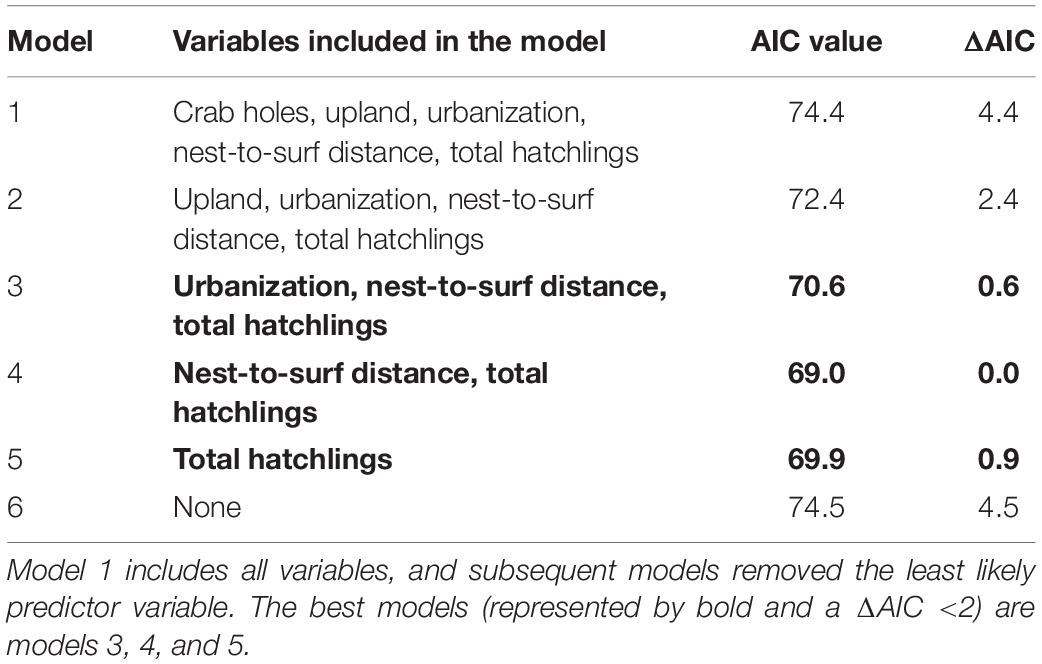
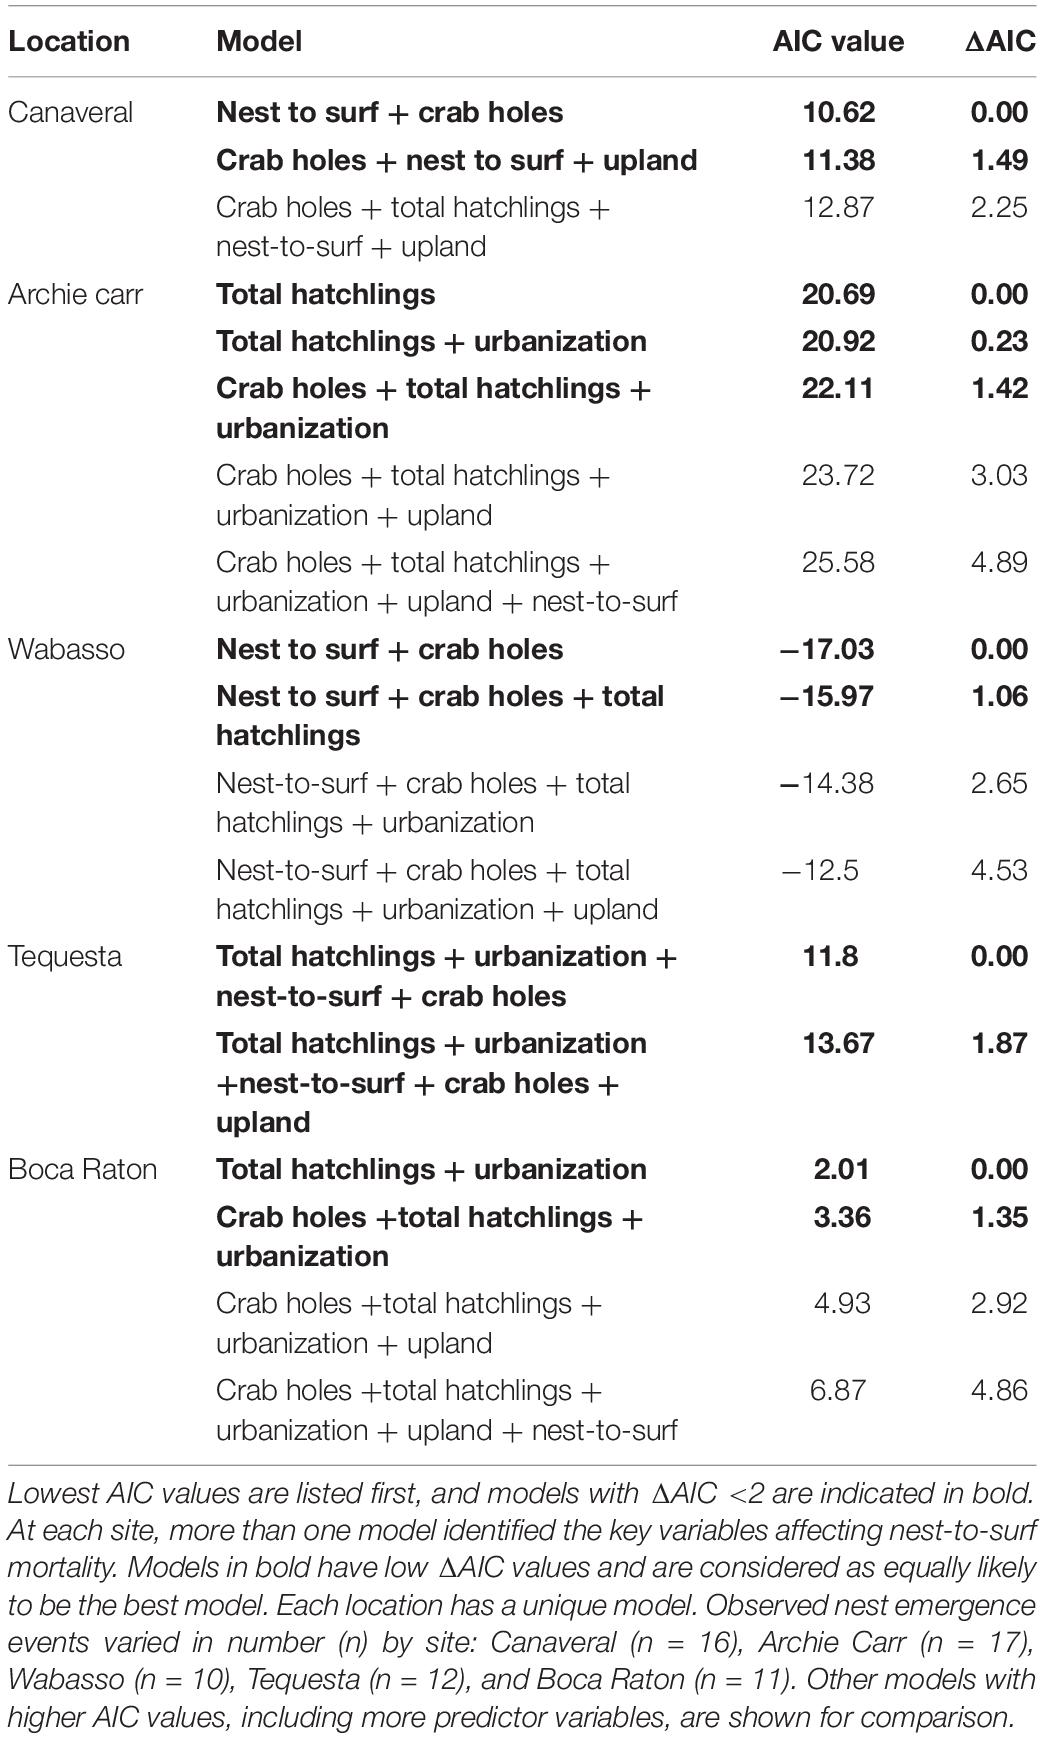
A GLM was run including the location variable and it was determined that location was one of the parameters contributing to mortality (Appendix 1); therefore, a generalized linear mixed model (GLMM) and GLM models were carried out. Results from the GLMM (Table 4) indicate that when generalizing among all locations, the best models for predicting mortality include a combination of nest-to-surf distance, total hatchlings, and urbanization (Models 3, 4, and 5). Model 6, which does not include any of the measured variables, has the highest AIC value and is the worst fit model. GLM models were then run for each of the five locations and the AIC values obtained were used to identify site-specific risk factors (Table 3). Urbanization was not included in the Canaveral variables because it is a completely natural nesting beach. Each location had varying results for the best-fit models.
Total hatchlings in an emergence was plotted against proportion of emergent hatchling mortality, and the best fit line is represented by a power regression (Figure 5).
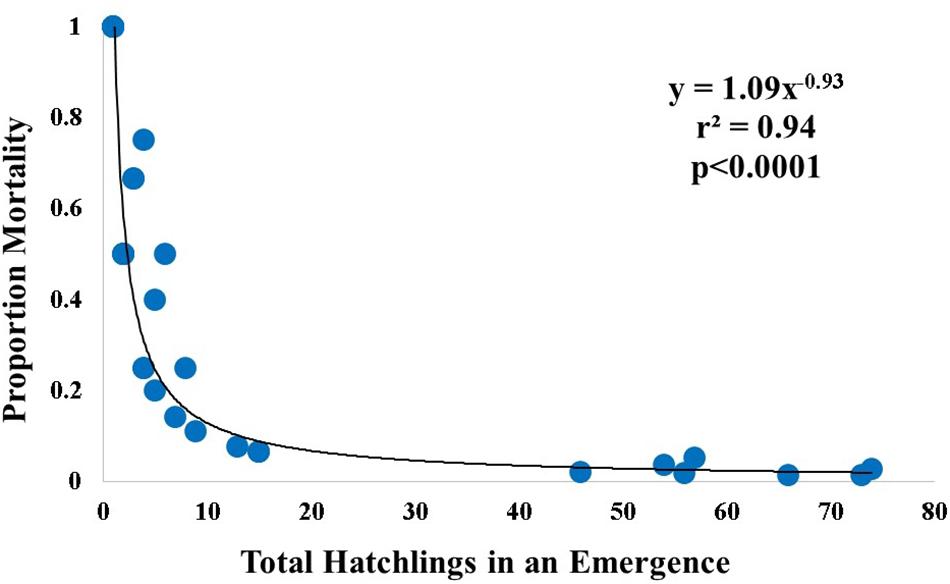
Figure 5. Relationship between nest emergence size and proportion mortality. A power regression line for proportion mortality and total hatchlings in an emergence fit the relationship. Blue circles indicate individual nests, and represent only nests that had mortality (n = 38).
Discussion
The 2016 nesting season was characterized by very low hatching and emergence success, especially at Boca Raton and Tequesta Beaches (K. Rusenko and S. Hirsch, personal communication). July 2016 was the hottest month on record (Noaa National Centers for Environmental Information, 2016) and rainfall was much below normal for Florida throughout July when most nests were incubating1. The combination of high heat and drought condition prevailed along many nesting beach sites when most of the nests were incubating. Other studies show that exceedingly high temperatures lead to sea turtle embryo mortality (Valverde et al., 2010; Howard et al., 2014), as does too much or too little water (McGehee, 1990). As a consequence, there were relatively few opportunities to observe hatchlings crawling from nest-to-surf because many nests were not viable. The number of observed hatchling emergences was therefore lower than anticipated.
Furthermore, the number of hatchlings emerging from each nest was relatively small overall. Small numbers of hatchlings per emergence was associated with a greater proportion of nest-to-surf mortality (Figure 5). If a hatchling was in a nest emergence of 10 or less, the chance of that hatchling surviving was less than if it emerged in a larger group. In other words, a small nest emergence has a smaller chance of contributing its genetic diversity to the population. Interestingly, regardless of the emergence size, when a nest was predated upon, only 1–3 hatchlings were killed per nest. This is evidence of the predator-swamping hypothesis (Ims, 1990) that is often mentioned in literature but little data exist to support it. By being part of a larger group, it creates a dilution effect where the individual hatchlings are more likely to survive (Santos et al., 2016). This is dependent on the predator but in this study, for example, the most common predator was the ghost crab, which is limited in the number of turtles it can take in a given emergence. Therefore, if you have a larger number of hatchlings in a given emergence, and a single crab is only able to take one hatchling, the proportion of mortality will be smaller than in a small emergence. An unanticipated negative influence of rising temperatures on hatchling production is small emergence size and an associated higher risk of individual hatchling mortality.
Despite the unexpected challenges due to the thermal and hydric extremes, novel and relevant predation observations were made during this study. Ghost crabs were the most common predator of loggerhead hatchlings. This finding was consistent with observations from a study done on leatherback hatchlings in Costa Rica (Tomillo et al., 2010). Not only was ghost crab predation observed on many occasions, but failed predation attempts by ghost crabs were also seen. In these instances, a hatchling was picked up by a ghost crab and later dropped, allowing the hatchling to escape. Failed predation attempts were not observed for any other predator. A previous study at Canaveral National Sea Shore (Northern Brevard County) showed raccoon and ghost crab populations were inversely correlated, and removing raccoons may allow ghost crab populations to increase and so increase crab predation on loggerhead hatchlings (Barton and Roth, 2008). In 2016, raccoon trapping occurred at Canaveral National Seashore. Thus, the ghost crab population may have been high in 2016 when the current study was conducted. No raccoon predation at Canaveral National Seashore was documented during our study nor was any recorded by the beach monitoring team in 2016.
Yellow-crowned night herons (N. violacea) were seen preying on hatchlings at Tequesta only, but the birds were present near nests at Boca Raton and Wabasso Beach. It is likely that they prey on hatchlings at these two sites as well. The heron predation events were difficult to document because these predators usually hunt near the surf zone, leaving behind no physical evidence that any turtle was consumed. Interviews with permit holders confirm that night heron predation events are not being documented, and therefore not included in hatchling mortality inventories. In most cases, these birds stay near the water-line and thus predation is cryptic. During one instance on Tequesta, a yellow crowned night heron moved to mid beach to take a hatchling, and this behavior was then evident in the morning on the track map.
Disorientation and misorientation were less severe than anticipated in the study overall. Boca Raton, an urban site where artificial lighting remains a persistent problem, was where 32 hatchlings were observed entering the vegetation and not returning to enter the water; while it only was possible to actively track six misoriented hatchlings, sea turtles that never enter the water will not survive. Consequently, hatchlings that travel landward and don’t turn back toward the water are considered and treated as nest-to-surf mortalities. By examining total hatchling mortality by location (Table 1), it was possible to gain a broader insight into the overall proportion of hatchlings that are not actually reaching the water during their nest-to-surf dash. This allows us to see which beaches overall are contributing more sea turtle hatchlings to the population. For example, not only did Boca Raton produce very small and few hatchlings in each emergence, but the hatchlings emerging from these nests had the smallest chance of survival when compared to the other beaches. This suggests that these turtles may be less valuable to the population than those at Archie Carr National Wildlife Refuge and Wabasso Beach, which had proportionally less hatchlings die on their way to the surf (Table 1). On the other hand, the nest level analysis (Table 2), provided information at the individual nest level. This allows us to analyze the proportion of turtles from each nest that will not survive to the water. Some of these numbers appear larger than those in Table 1 because Table 2 addresses nest-level mortality. That means if two hatchlings emerge from a single nest and one is taken by a ghost crab, the proportional mortality for that nest will be 0.5. This provides insight into the success of a nesting female and the proportion of hatchlings that she will or will not successfully contribute to the population.
The goal of running the GLMM model was to provide robust predictions of hatchling mortality when all locations were considered (with the lowest AIC values as the metric). This approach could become a valuable tool in predicting the severity of mortality on a general scale, but it is also important to recognize the limitations of this test, as differing sources of mortality were seen among sites. The best model across all locations included total hatchlings in an emergence, nest-to-surf distance, and urbanization level (Table 4). It is likely that greater nest-to-surf distance provides hatchlings with a longer period on the beach and thus a longer period over which predators may detect them, or they might enter a light field and become mis- or disoriented. The number of hatchlings in an emergence (Figure 5) was significantly inversely associated with the proportion of mortality per nest. Hatchlings in larger emergences were much more likely to survive and enter the surf than those in smaller emergences. This observation is consistent with the predator-swamping hypothesis (Ims, 1990) in which synchronized emergence means that a group crawls to the surf and increases an individual’s chance of survival.
Because sources of mortality were variable at each location, it was important to also look at the GLMs within each location to understand site-specific mortality. GLM analyses revealed that site-specific estimation may be a more accurate way to explain nest-to-surf hatchling mortality. Four different combinations of best-fit models were found for the five locations (Table 5). Both Canaveral National Seashore and Wabasso identified the nest-to-surf distance and number of crab holes as the most important factors. Surprisingly the ACNWR, which is structurally similar to Wabasso Beach, had completely different predictor variables. The best model for ACNWR identified only the total number of hatchlings as most important in the model. The best model for Tequesta includes multiple variables (total hatchlings, urbanization, nest-to-surf, and crab holes). The nests located on Tequesta varied in level of urbanization; some were near park areas and others were near dwellings, so it is not surprising that many variables contributed. Interestingly, nests at Boca Raton, the most urban site, are adjacent to a mixture of urban and park areas, yet the model identifies total hatchlings and urbanization as important. Boca Raton is the location where the highest proportion of hatchling mortality occurred, and it also has ongoing photopollution challenges (Salmon et al., 1995).
The total number of hatchlings emerging from nests was quite low in 2016 due to hot dry conditions leading to low nest success. As the southernmost site, the nests in
Boca Raton may be particularly vulnerable because future weather in Florida will likely include longer periods of drought during the summer, interrupted occasionally by intense flooding events (National Weather Service and National Oceanic and Atmospheric Administration [NWS and NOAA], 2015). If this prediction becomes a reality and continues in future years, it likely will be particularly detrimental to nest success and hatchling survival at Boca Raton, but may also affect more northern locations. A further explanation of site-specific results is detailed in Appendix 2.
The models for the ACNWR, Tequesta, and Boca Raton all included urbanization and crab holes. A recent study by Silva et al. (2017) noted that increased lighting may actually attract hunting ghost crabs to areas that also mis- or disorient turtles, thus increasing predation risk for hatchlings. Ironically, in more developed areas (with more lighting), beach raking often occurs which removes cover and alternative food and so is harmful for many organisms (Colombini and Chelazzi, 2003), including ghost crabs, so raking may reduce crab numbers.
Conclusion
This study provides the first estimation of loggerhead nest-to-surf mortality in Florida, and may serve as a baseline for comparison with future studies in Florida and elsewhere. Together the direct observations, photographs, and identification of the signs of losses to predators can increase future documentation of nest-to-surf mortality. Without prior knowledge of the cues to look for after a predation event, evidence may be missed, and some predation events may even be cryptic (e.g., night heron predation). Further, nest-to-surf mortality must also include the hatchlings that disorient or misorient into landward vegetation where they perish (through predation, entrapment, or exhaustion). This study documents that 7.6% of hatchlings emerging died during their movement from the nest-to-surf across Florida’s east coast. Hatchling survival is strongly influenced by emergence size, distance to the water, and urbanization but also may vary based on location specific variables. We provide the first measure to improve current loggerhead hatchling production estimates. The results underscore that generalizing the risks of nest-to-surf hatchling mortality among sites can be dubious, because mortality sources varied among sites. Future studies should be conducted to compare more beaches and risks in years with less extreme weather effects to identify trends over time and variation around the mortality estimate.
Ethics Statement
This research was exempt from an Institutional Animal Care and Use Committee (IACUC) approval at Florida Atlantic University, as this was a fully observational field study.
Author Contributions
VE helped to design and conducted the study and wrote the first draft of the manuscript. JW helped to design the study, obtained funding and the permit, and wrote and edited the manuscript.
Funding
This project was funded through the University of Florida/Disney “Reverse the Decline” of sea turtles initiative. Additional funding came from the Gordon Gilbert Gumbo Limbo Scholarship and the National Save the Sea Turtle Foundation.
Conflict of Interest Statement
The authors declare that the research was conducted in the absence of any commercial or financial relationships that could be construed as a potential conflict of interest.
Acknowledgments
We thank undergraduate assistants C. Cappiello and B. Villegas-Vindiola for nighttime fieldwork assistance. For logistical support, we thank M. Koperski with FWC; K. Rusenko and D. Anderson at Gumbo Limbo Nature Center in Boca Raton; S. Hirsch and A. McCracken at Loggerhead Marinelife Center; B. Witherington, R. Smith, J. Brown, and K. Van Nevel with the Disney team at Wabasso Beach; K. Mansfield, E. Seney, and J. Solis with UCF and the Archie Carr National Wildlife Refuge; and K. Kneifl and M. Daley at Canaveral National Seashore. A special thanks to M. Salmon and B. Witherington, whose input improved the study; B. Witherington lent a high-resolution night vision scope to VE, which made crucial night observations possible. E. Noonburg and J. Monsinjon provided statistical help.
Footnotes
References
Barton, Â, and Roth, J. (2008). Implications of intraguild predation for sea turtle nest protection. Biol. Conserv. 141, 2139–2145. doi: 10.1016/j.biocon.2008.06.013
Bjorndal, K. A., Meylan, A. B., and Turner, B. J. (1983). Sea turtles nesting at Melbourne Beach, Florida, I. Size, growth and reproductive biology. Biol. Conserv. 26, 65–77. doi: 10.1016/0006-3207(83)90049-6
Bolker, B. M., Brooks, M. E., Clark, C. J., Geange, S. W., Poulsen, J. R., Stevens, M. H. H., et al. (2008). Generalized linear mixed models: a practical guide for ecology and evolution. Trends Ecol. Evol. 24, 127–135. doi: 10.1016/j.tree.2008.10.008
Bowen, B. W., Meylan, A. B., Ross, J. P., Limpus, C. J., Balazs, G. H., and Avise, J. C. (1992). Global population structure and natural-history of the green turtle (Chelonia mydas) in terms of matriarchal phylogeny. Evolution 46, 865–881. doi: 10.1111/j.1558-5646.1992.tb00605.x
Brost, B., Witherington, B., Meylan, A., Leone, E., Ehrhart, L., and Bagley, D. (2015). Sea turtle hatchling production from Florida (USA) beaches, 2002-2012, with recommendation for analyzing hatching success. Endanger. Species Res. 27, 53–69.
Casale, P., and Tucker, A. D. (2015). Caretta caretta. The IUCN Red List of Threatened Species 2015. Available at: http://www.iucnredlist.org (accessed May 21, 2018).
Colombini, I., and Chelazzi, L. (2003). Influence of marine allochthonous input on sandy beach communities. Oceanogr. Mar. Biol 41, 115–159.
Eckert, K. L. (1999). “Designing a conservation program,” in Research and Management Techniques for the Conservation of Sea Turtles, Vol. 4, eds K. L. Eckert, K. A. Bjorndal, F. A. Abreu-Grobois, and M. Donnelly (Gland: IUCN), 6–8.
Frazer, N., and Richardson, J. (1985). Annual variation in clutch size and frequency for loggerhead turtles, Caretta-caretta, nesting at Little Cumberland Island, Georgia, USA. Herpetologica 41, 246–251.
Godfrey, M., and Mrosovsky, N. (1997). Estimating the time between hatching of sea turtles and their emergence from the nest. Chelonian Conserv. Biol. 2, 581–585.
Hamilton, W. (1971). Geometry for the selfish herd. J. Theor. Biol. 31, 295–311. doi: 10.1016/0022-5193(71)90189-5
Houghton, J., and Hays, G. (2001). Asynchronous emergence by loggerhead turtle (Caretta caretta) hatchlings. Naturwissenschaften 88, 133–136. doi: 10.1007/s001140100212
Howard, R., Bell, I., and Pike, D. A. (2014). Thermal tolerances of sea turtle embryos: current understanding and future directions. Endanger. Species Res. 26, 75–86. doi: 10.3354/esr00636
Ims, R. A. (1990). On the adaptive value of reproductive synchrony as a predator-swamping strategy. Am. Nat. 136, 485–498. doi: 10.1086/285109
McGehee, M. (1990). Effects of moisture on eggs and hatchlings of loggerhead sea turtles (Caretta caretta). Herpetologica 46, 251–258. doi: 10.1016/j.zool.2017.06.007
Miller, J. D. (1985). “Embryology of marine turtles,” in Biology of Reptilia, (Development A), Vol. 14, eds C. Gans, F. Billett, and P. F. A. Maderson(Armidale: University of New England), 269–328.
Mrosovsky, N., and Yntema, C. (1980). Temperature dependence of sexual differentiation in sea turtles: implications for conservation practices. Biol. Conserv. 18, 271–280. doi: 10.1016/0006-3207(80)90003-8
National Marine Fisheries Service, and U. S. Fish, and Wildlife Service [NMFS, and USFWS] (2008). Recovery Plan for the Northwest Atlantic Population of the Loggerhead Sea Turtle (Caretta caretta), 2nd Edn. Silver Spring, MD: National Marine Fisheries Service.
National Weather Service, and National Oceanic, and Atmospheric Administration [NWS, and NOAA] (2015). Summer 2015 Weather Summary. Miami, FL: National Weather Service Forecast Office.
Noaa National Centers for Environmental Information (2016). State of the Climate: Global Analysis for July, Published Online August 2016. Available at: http://www.ncdc.noaa.gov/sotc/global/201607 (accessed December 14, 2016).
Salmon, M., Tolbert, M., Painter, D., Goff, M., and Reiners, R. (1995). Behavior of loggerhead sea turtles on an urban beach. II. Hatchling orientation. J. Herpetol. 29, 568–576.
Santos, R. G., Pinheiro, H. T., Martins, A. S., Riul, P., Bruno, S. C., Janzen, F. J., et al. (2016). The anti-predator role of within-nest emergence synchrony in sea turtle hatchlings. Proc. Biol. Sci. 283:20160697. doi: 10.1098/rspb.2016.0697
Shamblin, B. M., Dodd, M. G., Griffin, D. B., Pate, S. M., Godfrey, M. H., Coyne, M. S., et al. (2017). Improved female abundance and reproductive parameter estimates through subpopulation-scale genetic capture-recapture of loggerhead turtles. Mar. Biol. 164:138.
Silva, E., Marco, A., da Graça, J., Pérez, H., Abella, E., Patino-Martinez, J., et al. (2017). Light pollution affects nesting behavior of loggerhead turtles and predation risk of nests and hatchlings. J. Photochem. Photobiol. B Biol. 173, 240–249. doi: 10.1016/j.jphotobiol.2017.06.006
Spencer, R. J., Thompson, M. B., and Banks, P. B. (2001). Hatch or Wait? A dilemma in reptilian incubation. Oikos 93, 401–406. doi: 10.1034/j.1600-0706.2001.930305.x
Tomillo, P. S., Paladino, F. V., Sus, J. S., and Spotila, J. R. (2010). Predation of leatherback turtle hatchlings during the crawl to the water. Chelonian Conserv. Biol. 9, 18–25. doi: 10.2744/ccb-0789.1
Triessnig, P., Roetzer, A., and Stachowitsch, M. (2012). Beach condition and marine debris: new hurdles for sea turtle hatchling survival. Chelonian Conserv. Biol. 11, 68–77. doi: 10.2744/ccb-0899.1
Tucker, A. D. (2010). Nest site fidelity and clutch frequency of loggerhead turtles are better elucidated by satellite telemetry than by nocturnal tagging efforts: implications for stock estimation. J. Exp. Mar. Biol. Ecol. 383, 48–55. doi: 10.1016/j.jembe.2009.11.009
U.S. Fish and Wildlife Service and National Marine Fisheries Service (1978). Listing and protecting loggerhead sea turtles as “threatened species” and populations of green and olive ridley sea turtles as threatened species or “endangered species.” Fed. Regist. 43, 32800–32811.
Valverde, R. A., Wingard, S., Gómez, F., Tordoir, M. T., and Orrego, C. M. (2010). Field lethal incubation temperature of olive ridley sea turtle Lepidochelys olivacea embryos at a mass nesting rookery. Endanger. Species Res. 12, 77–86. doi: 10.3354/esr00296
Witherington, B., Bjorndal, K., and McCabe, C. (1990). Temporal pattern of nocturnal emergence of loggerhead turtle hatchlings from natural nests. Copeia 1990, 1165–1168.
Appendices
Appendix 1 – Preliminary GLM
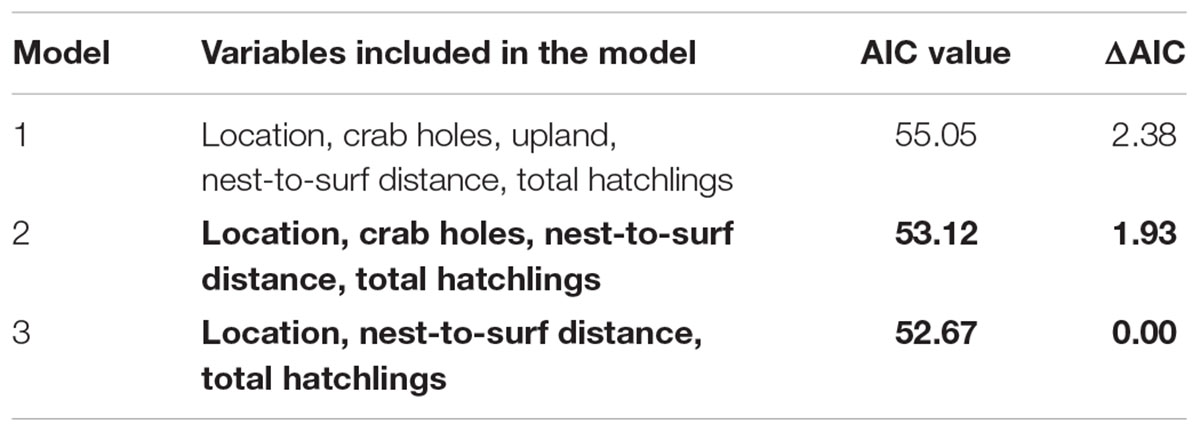
Before site-specific GLM modeling was carried out, an overall GLM was run to identify the important parameters, including the random variable “Location.” Results from the model are shown in Table A1. Location remained an important parameter in all of the models with the lowest AIC values (ΔAIC <2). It was then determined that using a mixed model, in addition to site specific GLM models was the most thorough approach to determining overall and site-specific parameters.
The StepAIC function in R was used. Lowest AIC values are listed first, and models with ΔAIC <2 are indicated in bold. The models in bold are considered as equally likely to be the best model, and all variables should be considered.
Appendix 2 – Understanding GLM Parameters at Each Location
Canaveral
Including nest to surf, crab holes, and upland in the model is very logical considering the make-up of the beach at Canaveral. One thing that was unique to Canaveral this year was extremely large tides. Early in the season, a lot of sand was naturally deposited, which created a plateau-like beach. During some periods, the hatchlings would be traveling a farther distance and thus spending more time on the beach. This made the turtles vulnerable to land predators, specifically ghost crabs.
Archie Carr National Wildlife Refuge
When considering the model for ACNWR, it is important to remember that few hatchlings died on their way to the water overall. The emergences where mortality was observed were very small emergences. The model here includes total hatchlings, urbanization, and crab holes. The emergences with only a few hatchlings were not beneficial to the hatchlings.
Wabasso
The model for Wabasso includes nest to surf, crab holes, and total hatchlings. Wabasso had the lowest documented mortality, but crab predation was the biggest threat to hatchlings, and the longer distance the hatchlings had to travel on the beach, the greater the risk they faced.
Tequesta
The model for Tequesta includes total hatchlings, urbanization, nest to surf, crab holes, and upland. The results here are biologically relevant because Tequesta is quite a dynamic beach made up of urban and natural areas; therefore, including a lot of factors would be important to understanding mortality. Total hatchlings in an emergence influenced their chance of survival, and urbanization is important because Tequesta has areas that are mostly park settings and then more urban condominium settings. Crab predation was also present at Tequesta. Some areas of the beach are wide while others are quite narrow making the nest to surf and upland distances vary.
Boca Raton
Boca Raton is the most urbanized location in the study, with a few scattered park areas. Total hatchlings, urbanization, and crab holes are the best parameters for fitting this model. Many of the observations at Boca Raton had small nest emergence numbers because the incubation success in Boca Raton was extremely low. The development along the coast and inland is also highest at Boca Raton, making urbanization extremely important. The number of crab holes also played a role in mortality, which is a bit more challenging to explain. Ghost crabs were a smaller threat to hatchlings at Boca Raton, largely due to the fact that the hatchling numbers were smaller. It is possible that the increased lighting, attracted ghost crabs and increased their hunting in lit areas (Silva et al., 2017).
Keywords: Cheloniidae, mortality, hatchling, demographics, loggerhead, Florida
Citation: Erb V and Wyneken J (2019) Nest-to-Surf Mortality of Loggerhead Sea Turtle (Caretta caretta) Hatchlings on Florida’s East Coast. Front. Mar. Sci. 6:271. doi: 10.3389/fmars.2019.00271
Received: 01 February 2019; Accepted: 06 May 2019;
Published: 22 May 2019.
Edited by:
Daniel Rittschof, Duke University, United StatesReviewed by:
Luis Cardona, University of Barcelona, SpainDavid Terrington Booth, The University of Queensland, Australia
Copyright © 2019 Erb and Wyneken. This is an open-access article distributed under the terms of the Creative Commons Attribution License (CC BY). The use, distribution or reproduction in other forums is permitted, provided the original author(s) and the copyright owner(s) are credited and that the original publication in this journal is cited, in accordance with accepted academic practice. No use, distribution or reproduction is permitted which does not comply with these terms.
*Correspondence: Victoria Erb, dmVyYjIwMTVAZmF1LmVkdQ==
 Victoria Erb
 Jeanette Wyneken


