 Sean T. Beckwith
 Robert H. Byrne
 Pamela Hallock
- College of Marine Science, University of South Florida, Saint Petersburg, FL, United States
Carbonate-rich groundwater discharged from springs, seeps, and spring-fed rivers on carbonate platforms creates environments of potential refuge for calcifying organisms in coastal waters by supplying higher [Ca2+] and [CO32-] along with typically lower nutrient concentrations. The benefits associated with carbonate terrains are maximized in the presence of submerged aquatic vegetation (SAV), especially seagrasses. To improve the accuracy of carbonate saturation state (Ω) determinations, calculated values of [CO32-] and Ksp∗ were paired with [Ca2+] values determined using a model that incorporates directly measured riverine calcium end-members (model A). This model results in Ω values larger than those calculated by assuming that [Ca2+] is directly proportional to salinity (model B; e.g., using CO2SYS, CO2calc). As an example, for salinity (S) between 13.5 and 24, improvements in saturation states calculated as differences (ΔΩ) between model A and model B saturation states in the tidal mixing zone of the Weeki Wachee River (Florida, United States) ranged from 0.39 to 1.00 (aragonite) and 0.61–1.65 (calcite). Saturation state ratios (Ω(A)/Ω(B)) for coastal waters with enhanced [Ca2+] originating from carbonate-rich groundwater can be calculated from end-member calcium concentrations and salinity. Applied to several river systems in the conterminous United States, Ω(A)/Ω(B) values calculated at S = 20 lead to Ω(A)/Ω(B) ratios of 1.12 (Weeki Wachee), 1.09 (Anclote), 1.06 (Mississippi), and 1.03 (Columbia). These increases in saturation states can be used to identify potential calcification refugia for subsequent high resolution field studies that focus on, for example, the long-term viability of oyster communities and other calcifying organisms in brackish coastal waters.
Introduction
While it has been shown that the global ocean is acidifying due to anthropogenic emissions of greenhouse gases (Ciais et al., 2013), the evidence that this is potentially occurring faster than any ocean acidification (OA) event discernible in the geologic record (Kump et al., 2009; Honisch et al., 2012) should be of paramount concern. In light of the prospect that human intervention will not quickly or effectively limit or reverse greenhouse gas emissions (Ciais et al., 2013; Collins et al., 2013; Kirtman et al., 2013) and avoid foreseeable hardships (including loss of marine species), resource management must focus on identifying and protecting coastal areas that have the potential to provide refuge for organisms most sensitive to changing environmental conditions. A pragmatic approach would be to map habitats around the globe that exhibit some resilience to global stressors such as warming and acidification.
Numerous studies have revealed deleterious effects that unabated OA is likely to have on organisms from corals to shellfish to foraminifera (e.g., Kleypas and Yates, 2009; Gaylord et al., 2011; Uthicke et al., 2013). Although relatively few studies have explored potential solutions to the problem of rapid OA, some insight may be gleaned from looking at the past. The long-recognized association between mass-extinction events and carbonate depositional hiatuses (e.g., Magaritz, 1991) indicates that ocean chemistry was sufficiently acidified to induce dissolution and prevent preservation of carbonate sediments. At times in the geologic past, species have disappeared from the fossil record, commonly at a mass-extinction horizon, but were subsequently found in a later interval within facies comparable to their pre-event habitats. Termed “Lazarus” taxa (Jablonski, 1996; Erwin, 1998), such surviving species withstood regional or global stressors, but existed in such low numbers or under conditions of minimal preservation that they essentially disappeared from a portion of the geologic record. Lazarus species likely survived in micro- or macrohabitats that buffered the changes caused by an unfavorable event. Such habitats are referred to as refugia.
Seagrasses significantly draw down CO2, and coral reefs downstream of seagrass beds have shown resistance to OA (Manzello et al., 2012; Okazaki et al., 2013). Similarly, mangroves have been shown to harbor organisms sensitive to ocean warming and acidification. Yates et al. (2014) reported that corals living on mangrove prop roots are protected from photic stress by shade that the mangroves provide, protected from warming through adaptation to extremely shallow waters, and more resistant to OA owing to the variable water chemistry that is associated with a highly heterogeneous environment. In addition to seagrasses and mangroves, what other natural systems might favor the survival of organisms sensitive to increases in CO2?
In an area known as the “Springs Coast” (Florida, United States), numerous spring-fed rivers emerge from Eocene and Oligocene limestone and dolostone substrata found along the Gulf of Mexico coastal region adjoining the Florida peninsula and panhandle. Florida hosts the largest assemblage of artesian springs in the world and the largest number of first-magnitude springs (Knight, 2017), most of which are concentrated in north central Florida. In coastal mixing zones associated with spring-fed rivers, Archaias angulatus, a symbiont-bearing, large benthic foraminifer (LBF), was commonly found living on seagrass blades and in sediments sampled during seagrass monitoring (2012–2014) by the Florida Fish and Wildlife Conservation Commission (FWC). Although A. angulatus occurs abundantly in warm, shallow waters of the Caribbean and Western Atlantic, in the low salinities and cooler temperatures of the Springs Coast its occurrence provoked curiosity. In previous work leading up to this study (Beckwith, 2016), we examined the prevalence and spatial distribution of A. angulatus in nearshore waters of the Springs Coast, hypothesizing that the water chemistry of the springs and spring-fed rivers increases calcium carbonate saturation states (Ω) in coastal waters and, to an extent, compensates for low salinity, allowing A. angulatus to thrive at salinities below their previously known range (29 ≤ S ≤ 39, Hallock and Peebles, 1993; Weinmann et al., 2013; Murray, 2014).
Carbonate rocks occur at or near the land surface at many locations around the world. Where these rocks form aquifers that feed springs and rivers, especially in coastal zones, they alter the water chemistry. Calcium is treated as a substantially conservative ion in marine waters, but, while constancy of calcium/salinity ratios is a good approximation for most of the open ocean, coastal waters can show significant variability (e.g., Chakrabarti et al., 2018). Previous studies have alluded to this observation and discussed a need for further analysis of carbonate system variability related to calcium concentrations (e.g., Keul et al., 2010; Wanninkhof et al., 2015). Similar in focus, the recent work of DeCarlo et al. (2018) linked OA resistance in corals to active increases in calcium concentration ([Ca2+]) in internal calcifying fluids at the site of calcification.
It is notable that empirically derived calcium concentrations are rarely included in calculations of CaCO3 saturation states (Ω). Accordingly, the contributions of freshwater sources to CaCO3 saturation are typically overlooked. By considering calcium end-member contributions, this work provides a model to more effectively assess CaCO3 saturation states for regions where [Ca2+] significantly deviates from direct proportion to salinity. A ratio of saturation states obtained with and without consideration of freshwater calcium contributions provides a useful examination of regional calcification potential.
Materials and Methods
Saturation State Model for Mixing of Seawater and Calcium-Rich Freshwater
To account for the effects of riverine and groundwater contributions to CaCO3 saturation states (Ω) in coastal waters, particularly in carbonate provinces, we propose use of a simple mixing model. Defining Ssw and [Ca2+]sw as the seawater end-members of salinity and calcium specific to a particular coastal region and [Ca2+]fw as the freshwater end-member specific to a river or other source, total calcium concentrations are derived as follows:
(A) model for [Ca2+]fw > 0:
(B) model for [Ca2+]fw = 0:
Dividing Equation (3) by Equation (4) and multiplying both the numerator and denominator by [CO32-]T, we obtain:
In this study, we use [Ca2+]T from Equation (3) to calculate more accurate values of Ω in two coastal mixing zones, and use Equation (5) as a tool to highlight regional differences in Ω resulting from models that do and do not consider riverine [Ca2+] contributions. The dependence of Ω(A)/Ω(B) on salinity reveals regions with disproportionately elevated [Ca2+] as a result of substantial inputs of freshwater calcium.
Acquisition of Riverine [Ca2+] Data
Although the primary focus of this study was the coastal rivers of west Florida, characteristics of other United States rivers and streams were investigated to provide comparisons. Calcium data were gathered from online data repositories, including WMIS (Southwest Florida Water Management District), DBHYDRO (South Florida Water Management District), and the Environmental Protection Agency’s STORET Data Warehouse and Water Quality Portal. To locate sampling sites appropriately representative of riverine calcium (data unaffected by tidally influenced saltwater intrusion), downriver sites were limited to those with measured S < 0.5. Sites were included in the analysis only if they were sampled for [Ca2+] and salinity on the same day. Whenever possible, sites with records spanning several months or years were chosen.
Data were gathered for every mapped river in the Southwest Florida Water Management District (SWFWMD). For the Alafia and Hillsborough rivers, the most complete records were obtained from the Environmental Protection Commission Hillsborough County (EPCHC). For south Florida, [Ca2+] and salinity data were accessed from DBHYDRO for the Shark River and for Canal 111 (both located in the Everglades). For other locations in the conterminous United States, data were obtained through EPA portals by searching ‘Rivers/Streams’ station types within selected states or specific drainage basins. These data were used for comparisons between the Florida rivers and rivers found in non-carbonate provinces. The method for measuring [Ca2+] varied among agencies and over time, but the majority of calcium measurements, as reported by the respective laboratories, were made by either the flame atomic absorption spectrometric method [APHA 3500-CA(B)] or by the inductively coupled plasma-atomic emission spectrometric method (USEPA 200.7).
Data were filtered to meet the criteria mentioned above. For sites where only specific conductivity was reported, conversion to salinity was made. Using one sample per day from each site, [Ca2+] and salinity were averaged for every site within the timeframe requested in the data download (e.g., the most recent 20 years), although a few of the sites returned limited sampling records. The stations for the selected rivers were chosen as the most robust representation of individual freshwater end-members for each river (farthest downriver sites with a long measurement record), but distances between sampling stations and river mouths differ, with concomitant small variations in salinity (S ≤ 0.5 at all sites). In contrast, Crystal River in the Springs Coast is an estuarine spring/river system where the salinity is rarely less than 0.5. Due to the limitations imposed by the data filter used in our analysis (S ≤ 0.5), data for the Crystal River station were sparse and not fully indicative of the contributions of [Ca2+] to coastal waters by the many springs of King’s Bay. Homosassa River (also in the Springs Coast) was excluded altogether due to a lack of available data, and, as this study is not an exhaustive analysis of the Gulf Coast of Florida, there are additional rivers not included in the analysis.
GIS Analysis
Substratum Type and [Ca2+] in Rivers
Subsequent to the acquisition process described above, data for all sampling sites were plotted in ArcMap (EsriTM), and one site for each river was chosen for a representative riverine [Ca2+]. The [Ca2+] for each river was symbolized by color, producing a gradient of concentrations for various rivers across the conterminous United States. Concentrations of Ca2+ were commonly reported in mg/L, so all units were converted to micromoles per kilogram (μmol/kg) to make direct comparisons to concentrations of marine waters. Averaging [Ca2+] over a sufficiently long sampling record accounts for any interannual, seasonal, or daily fluctuations in [Ca2+] and provides a signature end-member value for each river in order to assess regional differences in Ω enhancement through use of the Ω(A)/Ω(B) model.
Rivers were superimposed on a lithology layer to examine the spatial connection between limestone substrata and riverine [Ca2+]. The lithology layer, downloaded from the USGS Mineral Resources Online Spatial Data catalog1, was modified from Dicken et al. (2005) for central-west Florida (CWF), and from Schweitzer (2011) for the conterminous United States, to include only substrata for which the primary rock type was limestone.
Interpolated Mapping of the Ω-Ratio Model
Values of Ω(A)/Ω(B) for 14 coastal rivers along CWF and portions of north Florida were used to model differences in saturation state potential in coastal waters. Utilizing NOAA satellite derived 5-year mean salinity data for autumn (Allee et al., 2012)2, salinity values corresponding to the mesohaline and polyhaline boundaries (S = 5–30) in the NOAA Gulf of Mexico Data Atlas were used to create points within the coastal waters to simulate the riverine output. By the Inverse Distance Weighted interpolation method (Watson and Philip, 1985), and given [Ca2+]sw = 0.0103 mol/kg for typical seawater of S = 35, Ω(A)/Ω(B) values for the simulated coastal points were assessed to spatially examine any gradient in estuarine waters related to differences in calcium contributions of the rivers along CWF.
Quantifiable Improvements to Ω From Riverine Contributions
The difference between (a) Ω calculated by inclusion of directly measured calcium (Equation 3) and (b) a model wherein calcium is directly proportional to salinity (i.e., CO2SYS), represents the increase in Ω attributable to riverine calcium: ΔΩ = ΩA – ΩB. To calculate absolute values of Ω, [CO32-]T must be known in addition to [Ca2+]T, salinity and temperature. Carbonate-system water-sampling data from Beckwith (2016) were utilized to compare ΔΩ between the two mixing zones of the Weeki Wachee and Anclote rivers. For input variables of total alkalinity (TA) and dissolved inorganic carbon (DIC), the constants chosen in CO2SYS for the calculation of ΩB, and likewise for the calculation of [CO32-] for ΩA, include and (Millero, 2010), (Dickson, 1990), and BT (Uppstrom, 1974). To properly compute ΔΩ, it is necessary to use the same set of constants to obtain [CO32-] for both ΩA and ΩB. The constants should be chosen based on whether they are appropriate over the observed environmental range of salinity. If the same constants are used for both saturation state assessments, no bias should be introduced in the calculations. For absolute values of ΩA, [Ca2+]T (Equation 3) was paired with [CO32-]T from CO2SYS, and calcium carbonate solubility products appropriate to seawater/freshwater mixtures were calculated using the model of Mucci (1983). Using this model, which is appropriate for S ≥ 5, is expressed as a product of total calcium and total carbonate ion concentrations.
Results
Calcium Concentrations for Representative Conterminous United States Rivers
Geologic maps compiled by the USGS for the conterminous United States (Schweitzer, 2011; Horton, 2017) classify lithologic units by primary and secondary rock type. Some limestone units contain a secondary rock type of sand, sandstone, clay, mudstone, or any one of the numerous non-CaCO3 substrates. Examples of areas with the highest percentage of CaCO3 include those where limestone is the primary rock type and the secondary rock type is dolostone [CaMg(CO3)2] or calcarenite (consolidated calcareous sand), as well as cases where the absence of a stated secondary rock type implies that the lithology is wholly limestone.
Figure 1 shows limestone substrata for the conterminous United States drawn in dark gray or black (for varying CaCO3 content) and overlain by selected rivers whose colors depict calcium concentrations. This graphical description confirms logical expectations: rivers that traverse limestone substrata have elevated calcium concentrations. Likewise, higher carbonate/bicarbonate concentrations are expected for rivers that traverse limestone. Two river systems in central-west Florida (CWF), a carbonate province, were studied by Beckwith (2016), and carbonate-system data for the two were compared, as described in the section pertaining to ΔΩ.
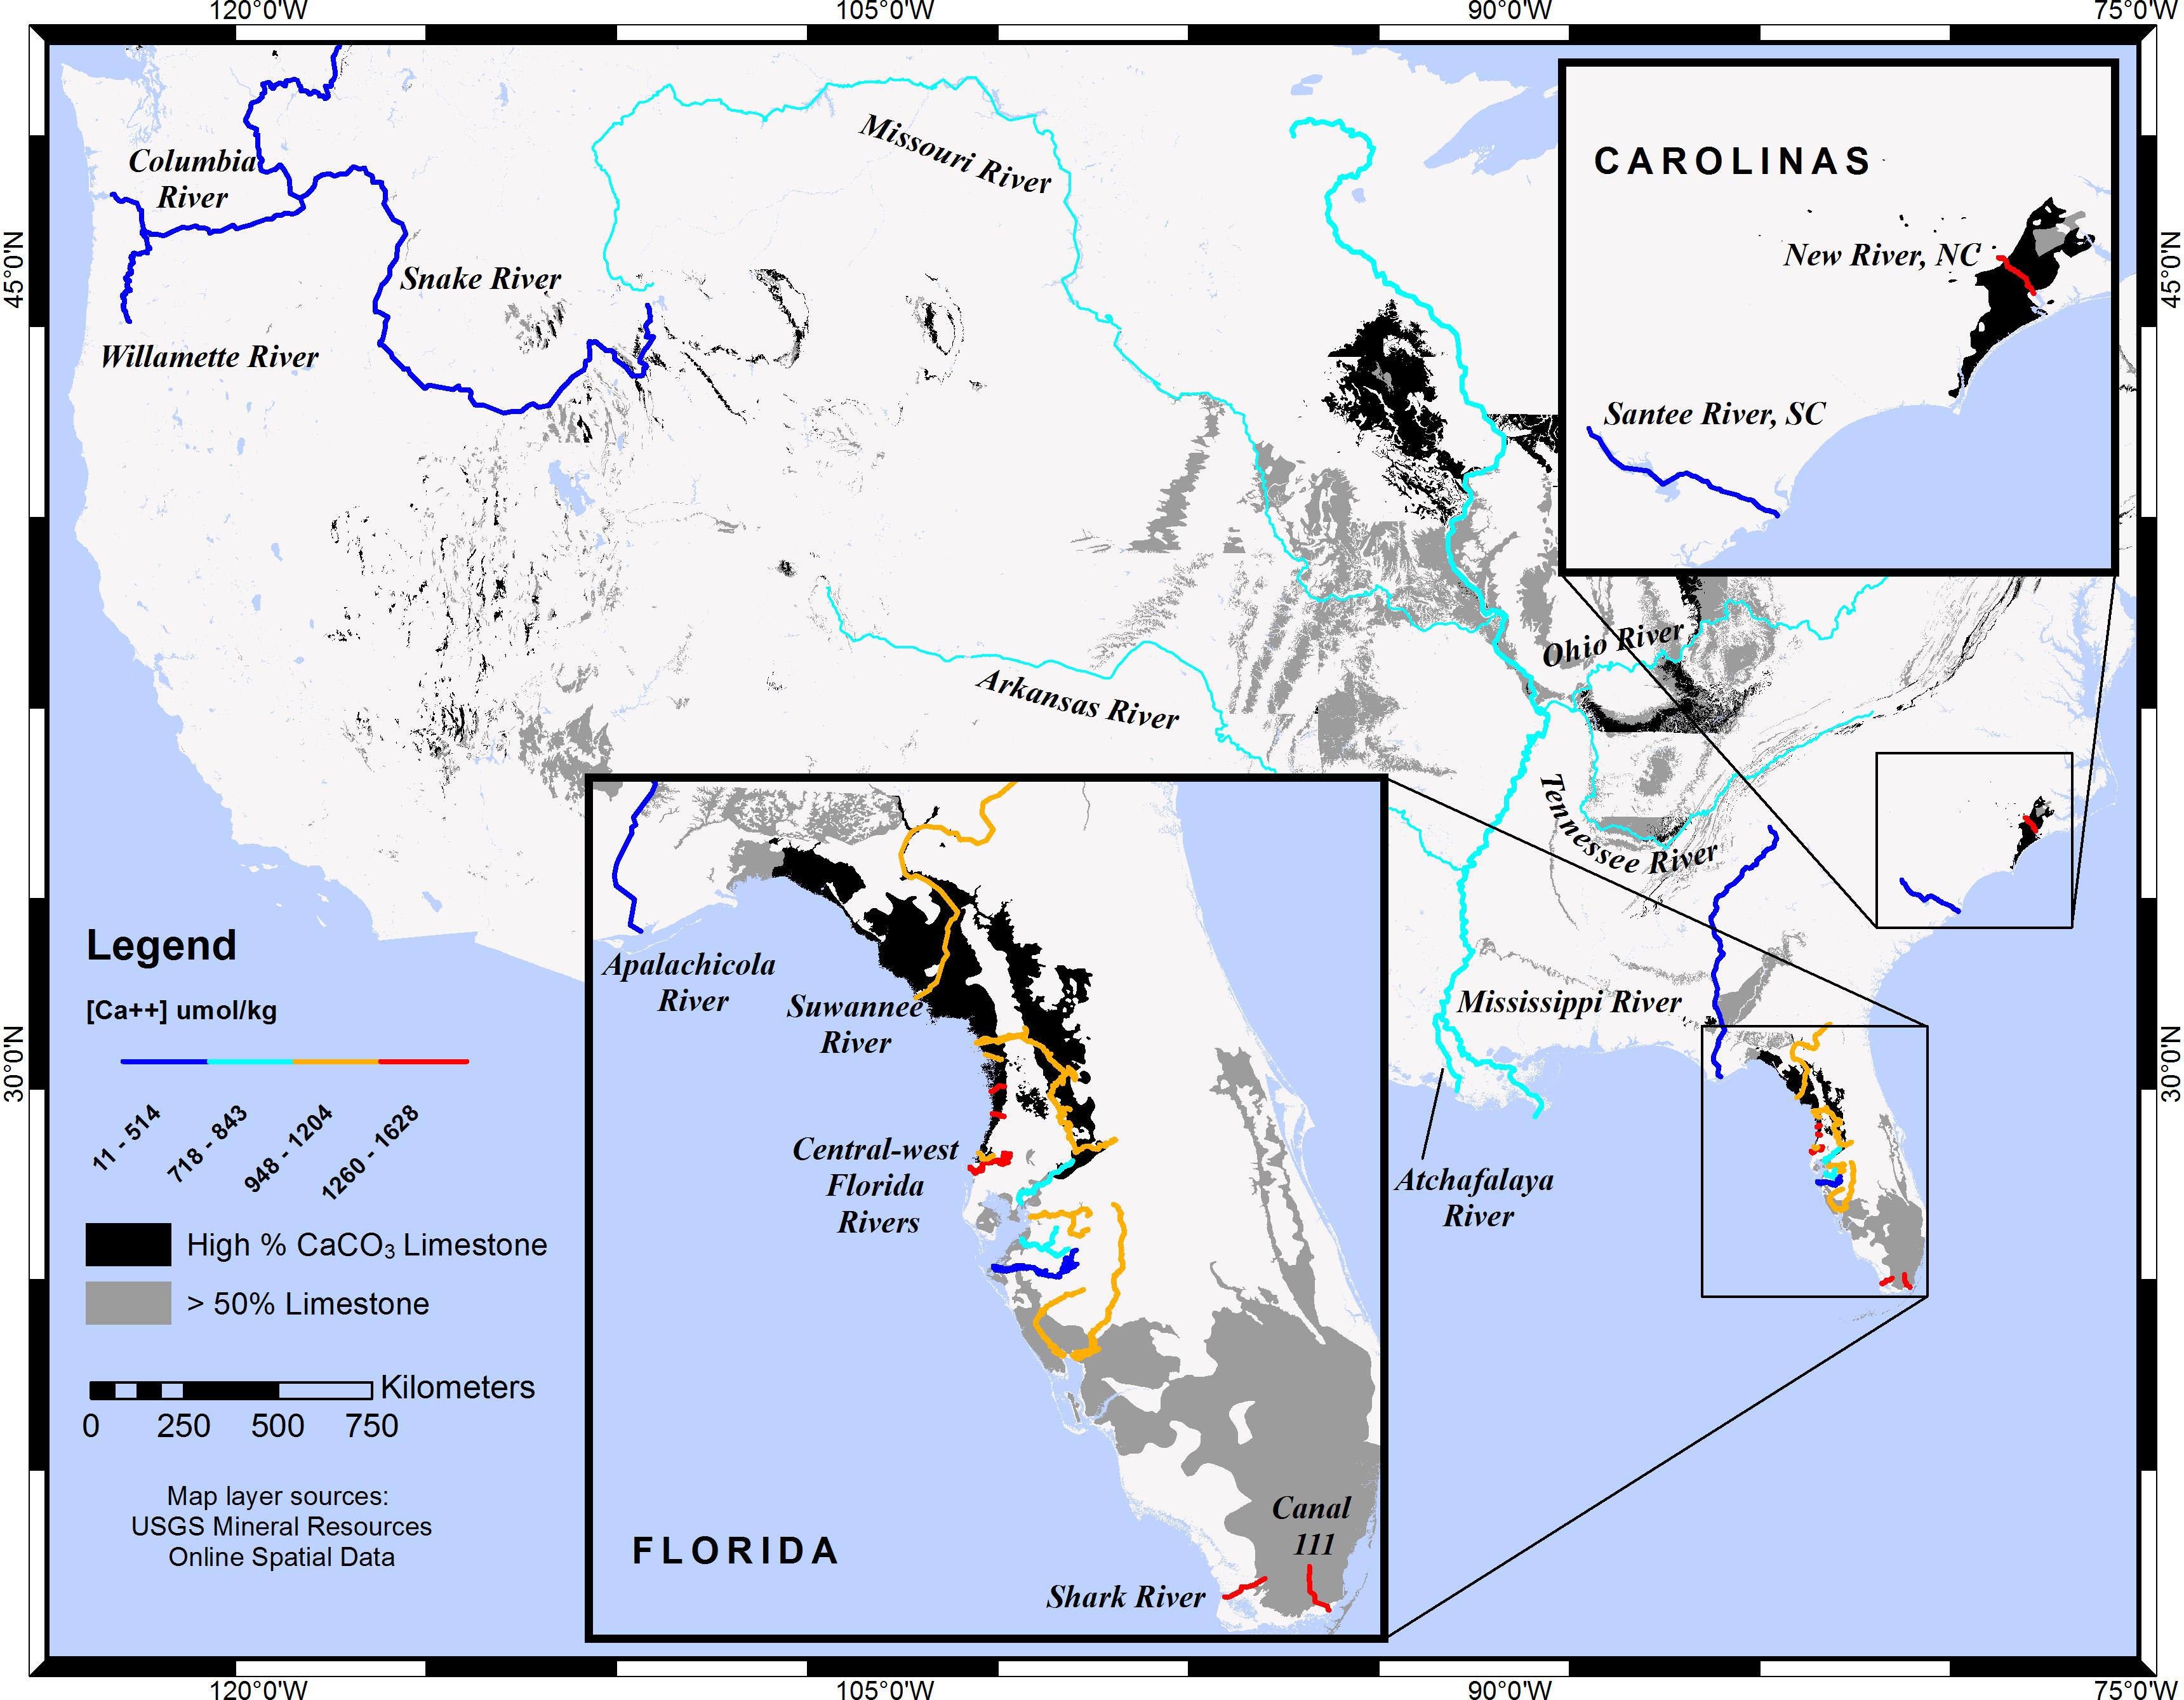
Figure 1. Map of selected rivers in the conterminous United States showing riverine calcium concentrations and limestone lithology. Rivers with low calcium concentrations traverse few to no limestone substrata, while rivers with high [Ca2+] traverse substrata composed primarily of limestone rock: dark gray areas symbolize rock that is primarily limestone (>50%) with a secondary rock type that is non-CaCO3, while black areas symbolize main rock composed of limestone-dolostone, limestone-calcarenite, or exclusively limestone. Although rivers are symbolized uniformly along their entire lengths and tributaries are generalized, [Ca2+] characterizations were determined from a single downstream sampling station. The limestone layer map was adapted from the USGS Geologic map of the conterminous United States (Schweitzer, 2011).
Riverine [Ca2+] Effects on Estuarine Ω
Dissolved calcium is elevated in rivers that traverse limestone substrata. New River in North Carolina and several rivers found along the Springs Coast of CWF are prime examples of increases in Ω attributed to riverine [Ca2+]. This increase is quantified as a ratio (Ω(A)/Ω(B)) by Equation (5), and the values for all rivers in this study are shown in Table 1, along with riverine [Ca2+] end-members and lithology traversed. The Weeki Wachee River, in the Springs Coast, and New River had the highest [Ca2+] of natural rivers in this study ([Ca2+] = 1,594 and 1,534 μmol kg-1, respectively), which translates to the highest Ω-ratios. Table 1 shows a large difference in Ω-ratios between highlighted rivers of the Pacific Northwest that traverse mostly igneous and siliciclastic sedimentary rocks versus rivers to the East that traverse extensive limestone terrains.
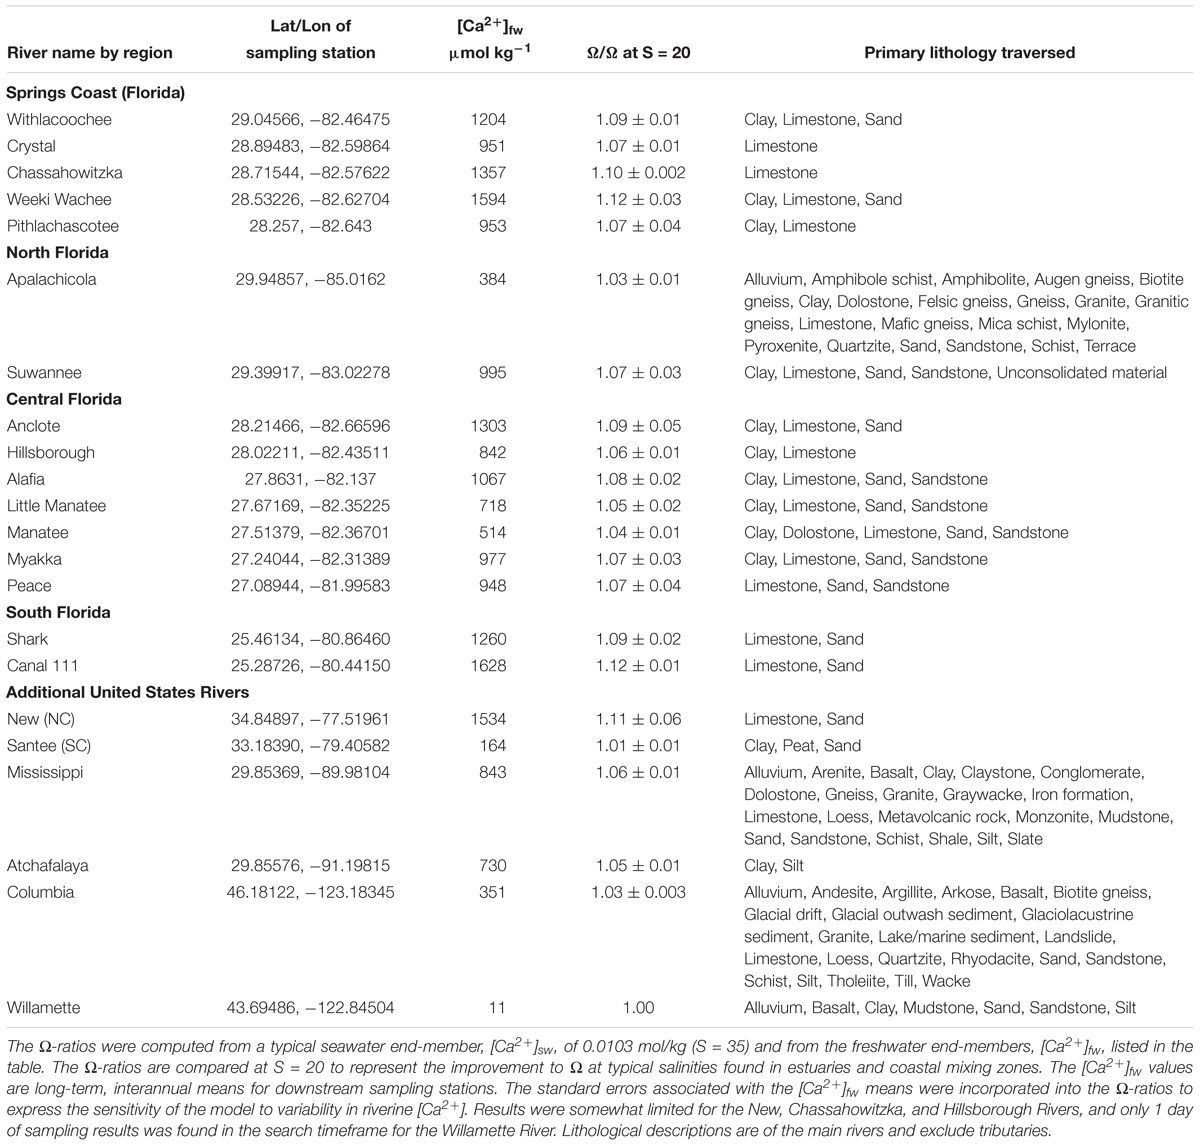
Table 1. Freshwater calcium end-members, lithology, and Ω-ratios of rivers in this study.
A very stark contrast in Ω-ratios exists between New River, NC and nearby Santee River, in South Carolina. The Santee River, with one of the lowest [Ca2+] values in the East (although still an order of magnitude greater than the Willamette River of Oregon), produced almost no enhancement to estuarine waters (standardized to S = 20). By contrast, the New River, with one of the highest [Ca2+] values (2.5 orders of magnitude greater than the Willamette), had an Ω-ratio of 1.11 (or, an 11% increase in the value of Ω) at S = 20. Both the Weeki Wachee River in the Springs Coast, and Canal 111, which empties into Florida Bay, had an Ω-ratio of 1.12, the highest in this study. While there is little to no effect on the Ω-ratio model at oceanic salinity where riverine calcium contributions are negligible, substantial differences can be found in estuaries that receive high riverine calcium concentrations. As an example of the variation in [Ca2+] enhancements to Ω at lower salinities, Figure 2 highlights improved Ω values for three rivers in this study that feed into the Gulf of Mexico. Saturation state enhancements in the waters around the Weeki Wachee River are profound at very low salinities, while at high salinities the regional differences become insignificant. Preliminary examination of SWFWMD data for coastal sampling sites (which are somewhat limited) confirmed [Ca2+] well above the mixing line for brackish waters and diminishing discrepancies for increases in salinity.
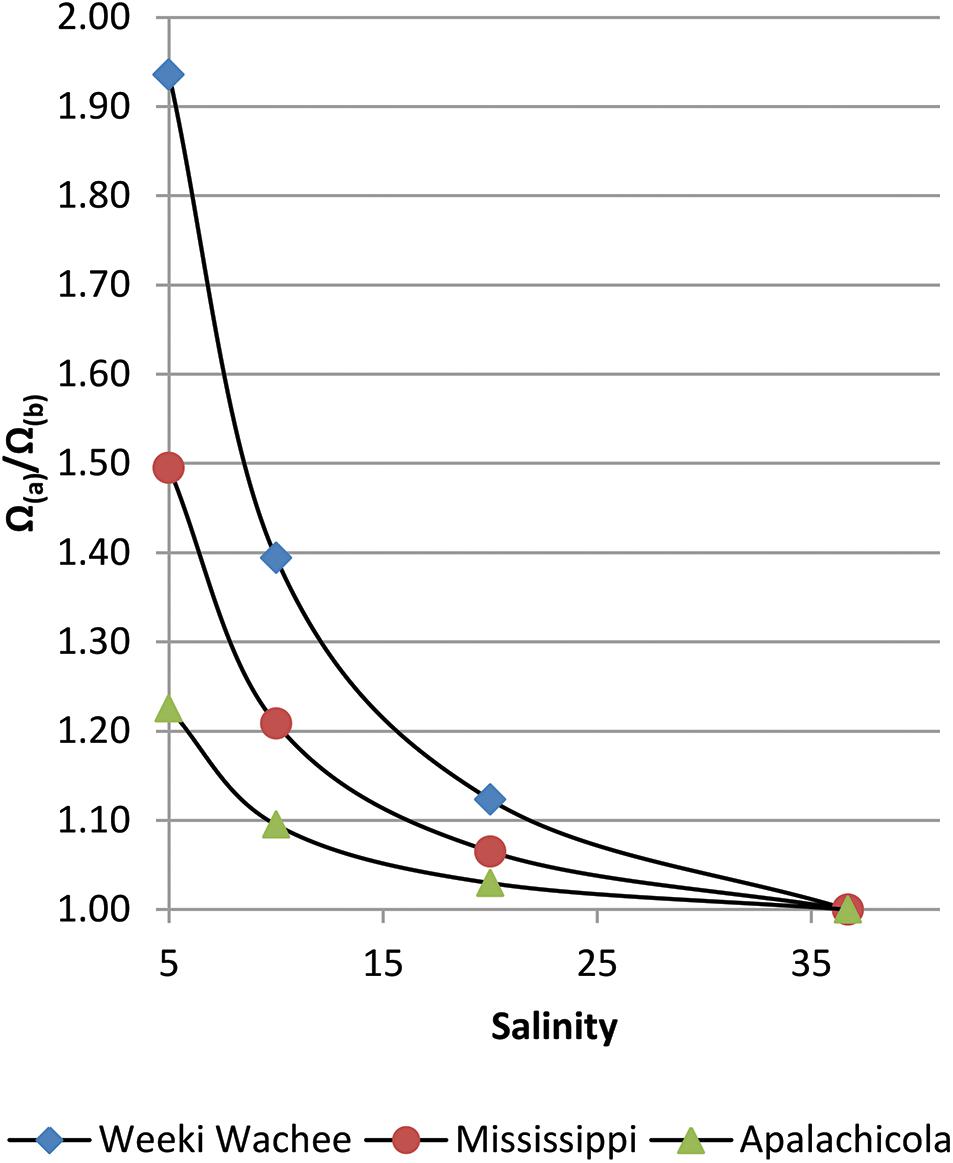
Figure 2. Salinity versus Ω(A)/Ω(B) for three rivers that discharge into the Gulf of Mexico; the seawater end-member (S≅37) is for the Loop Current (Wang et al., 2013). In addition to highlighting differences among river regions, this graph reveals an increasing disparity, as salinity decreases, between models that do and do not account for riverine [Ca2+].
The interpolation created from Ω(A)/Ω(B) values for several rivers along CWF shows the greatest [Ca2+] enhancement to Ω values in the zone encompassing the Springs Coast (Figure 3). Considering the maximum extent of brackish waters along portions of CWF coastal waters, a substantially large area exhibits elevated [Ca2+]. The large areal extent of brackish waters in the Springs Coast is due to the cumulative discharge of many coastal rivers. The Springs Coast is also the largest estuarine seagrass habitat in the study area. Assessed at S = 20, the range of Ω-ratios in the Springs Coast was 1.08–1.12. Numerous springs infuse the rivers of this coastal region with groundwater rich in calcium and bicarbonate (Yobbi and Knochenmus, 1989). Submarine springs and seeps add an additional, although unquantified, contribution of water interacting with the limestone substrata.
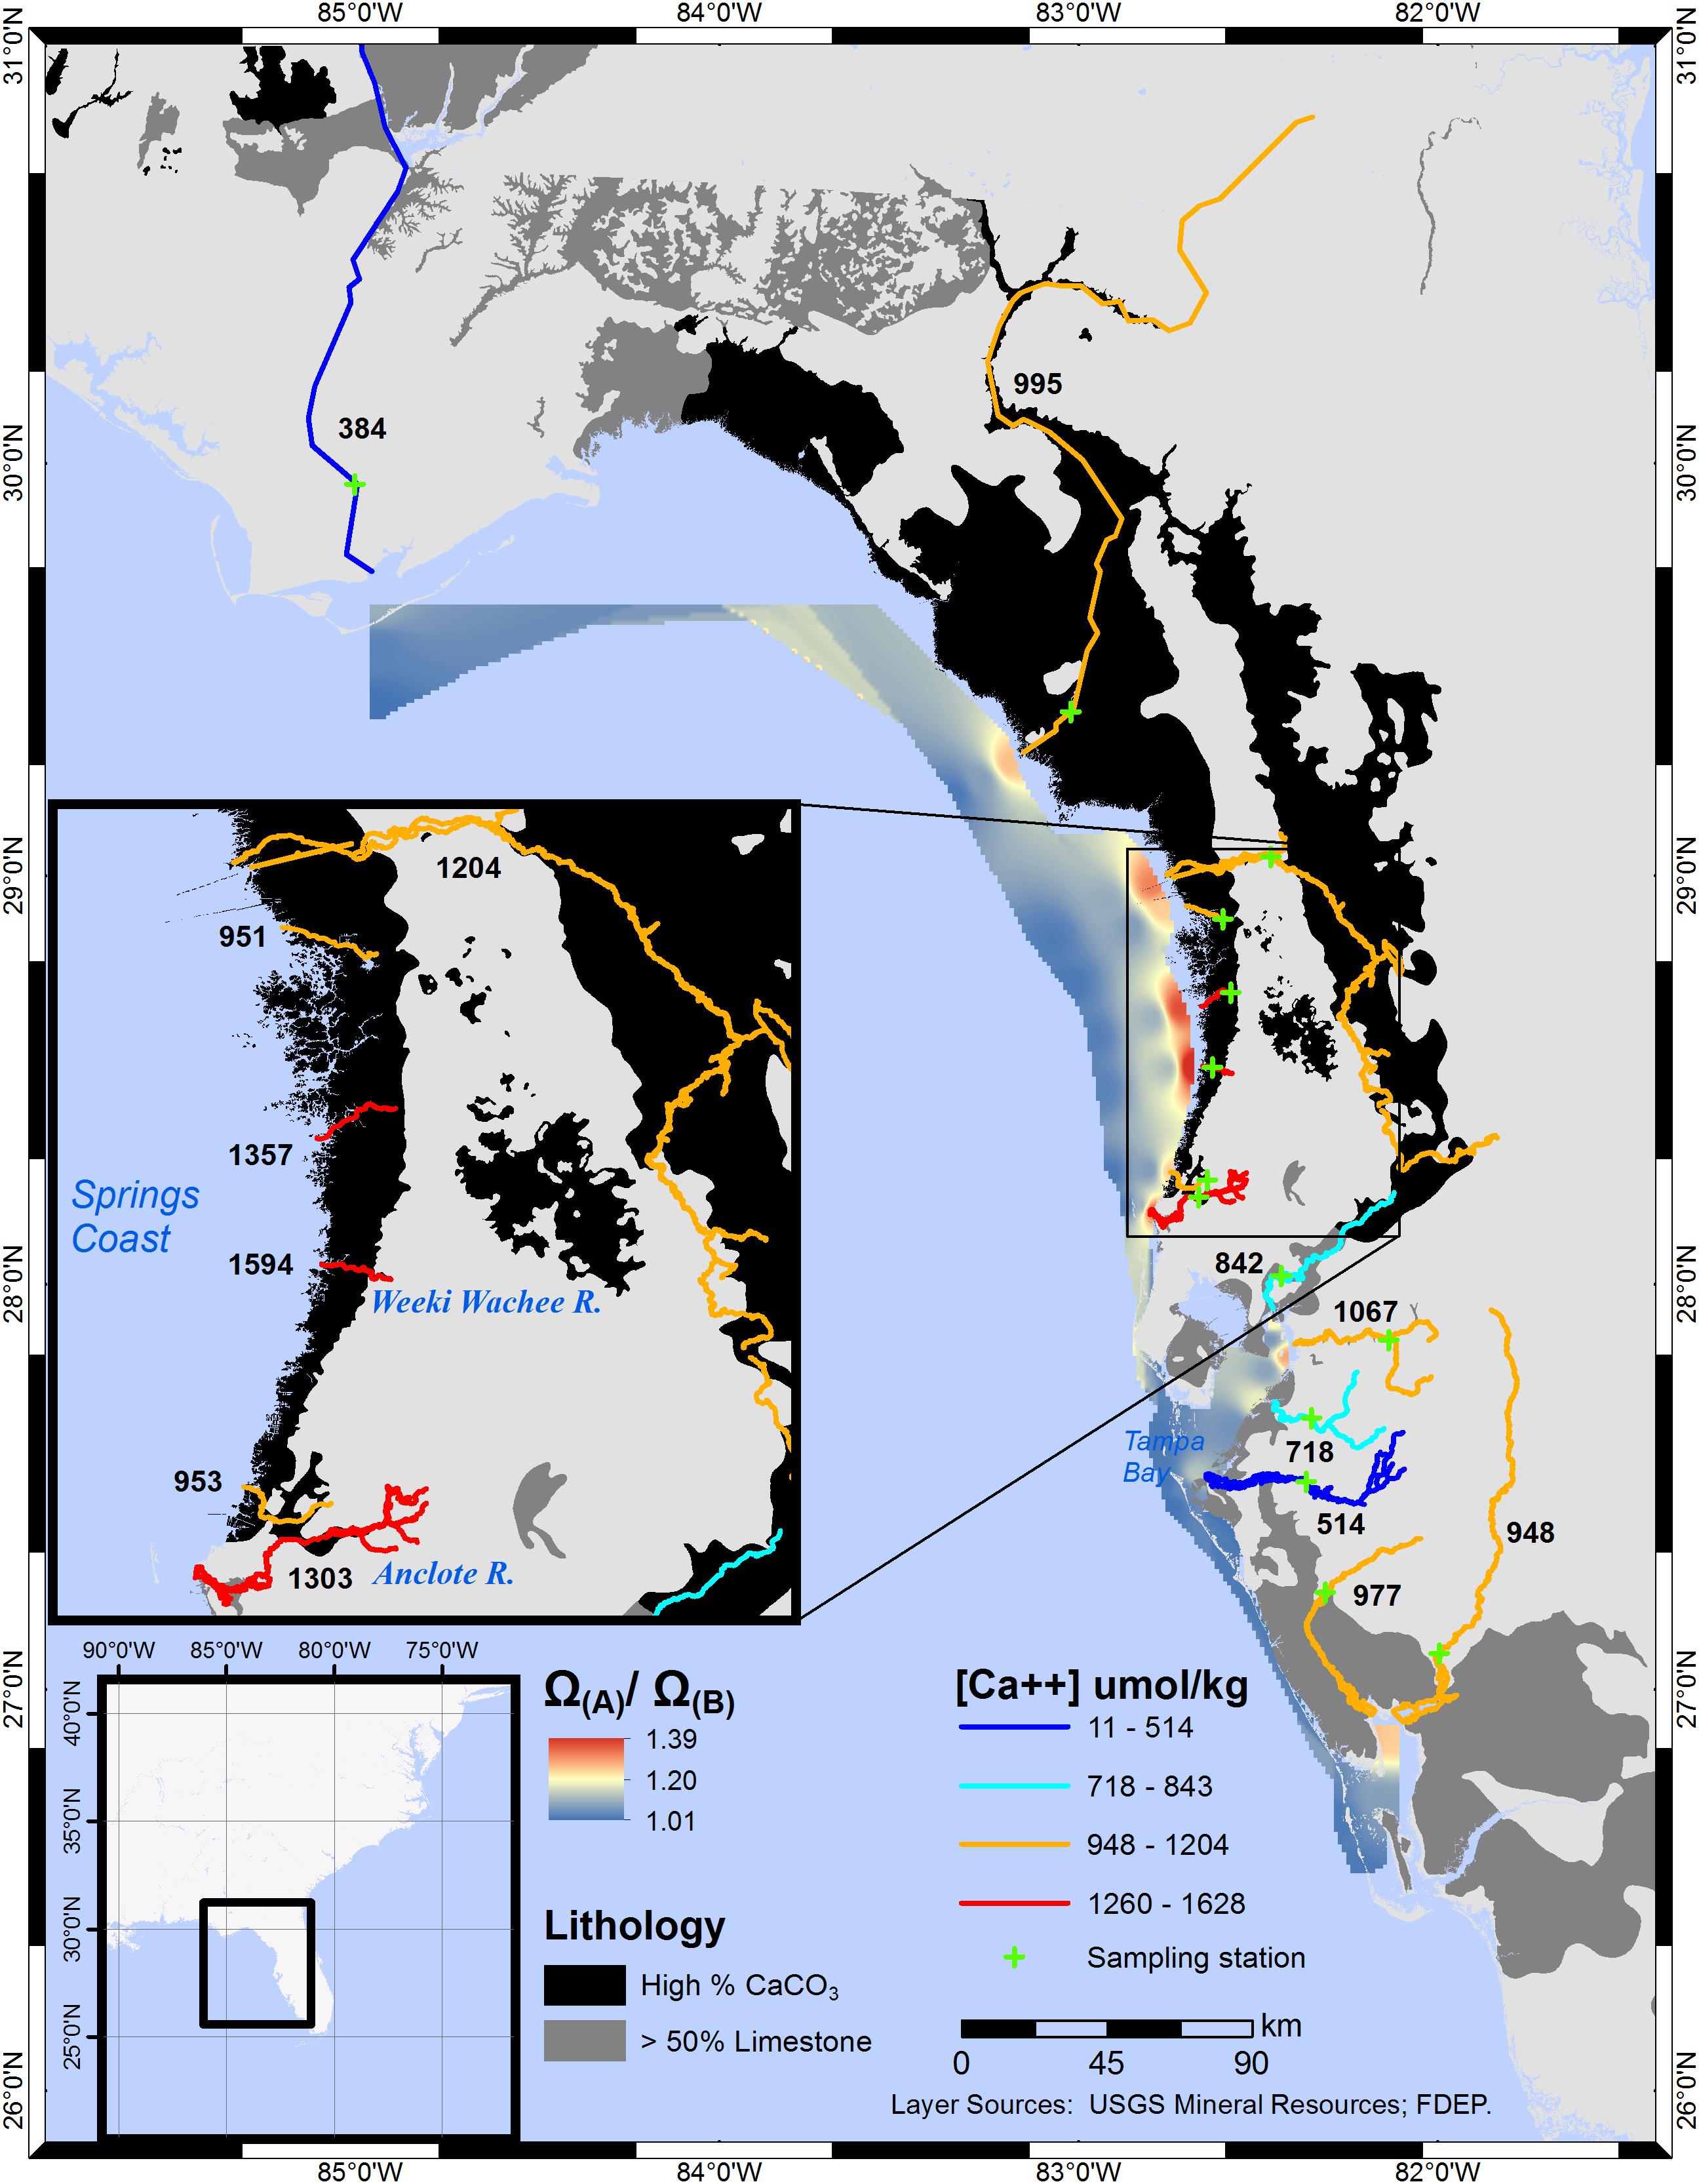
Figure 3. Interpolated Ω(A)/Ω(B) ratios for central-west and central-north Florida coastal waters. Averaged calcium ion concentrations for individual sampling stations, in μmol/kg, are labeled adjacent to each river. Comparing the Manatee and Weeki Wachee Rivers ([Ca2+] = 514 and 1594 μmol/kg, respectively), the Ω-ratio, assessed at S = 20, translates to a 4 and 12% increase, respectively, in calculated Ω values. The boundaries of the interpolation approximately encompass the mesohaline and polyhaline regions (S≅5-30) in Oct–Dec (5 years mean), as estimated from NOAA satellite imagery.
In waters of central Tampa Bay, Ω-ratios were notably lower (1.03–1.07) than in adjacent regions to the north and south. Although some springs feed into the rivers of this central region, most of the river volume is associated with surface hydrology. In the northernmost portion of the Florida study region, a large contrast exists between the [Ca2+], and therefore the Ω-ratio, of the Apalachicola and Suwannee Rivers. While the Apalachicola River flows alongside limestone substrata near the Alabama-Florida-Georgia border, the Suwannee River flows through substrata of high CaCO3 composition over most of its length.
Errors (ΔΩ) in Calculation of Ω From Salinity-Dependent Calcium
While the value of Ω(A)/Ω(B) is a ratio of the two models, increases in the value of Ω by inclusion of riverine [Ca2+] can be obtained as a difference between Ω calculated with [Ca2+]T from Equation (3) and Ω calculated in proportion to salinity. Focusing on two mixing zones, we examined the increase in the value of Ω at a number of locations near the Weeki Wachee and Anclote rivers (Table 2) using available carbonate-system chemical data from multiple seasons presented by Beckwith (2016). Improved determinations of Ω are especially evident at low to intermediate salinities. Calculations of Ω(calcite) using [Ca2+]T from Equation (3) ([Ca2+]sw = 0.0103 mol/kg for S = 35) produced ΔΩ values of 0.10–0.26 near the Anclote River (S = 23–32) and 0.61–1.65 near the Weeki Wachee (S = 13–24) (Figure 4). Likewise, ΔΩ(aragonite) values were 0.06–0.16 near the Anclote River and 0.39–1.00 near the Weeki Wachee River.
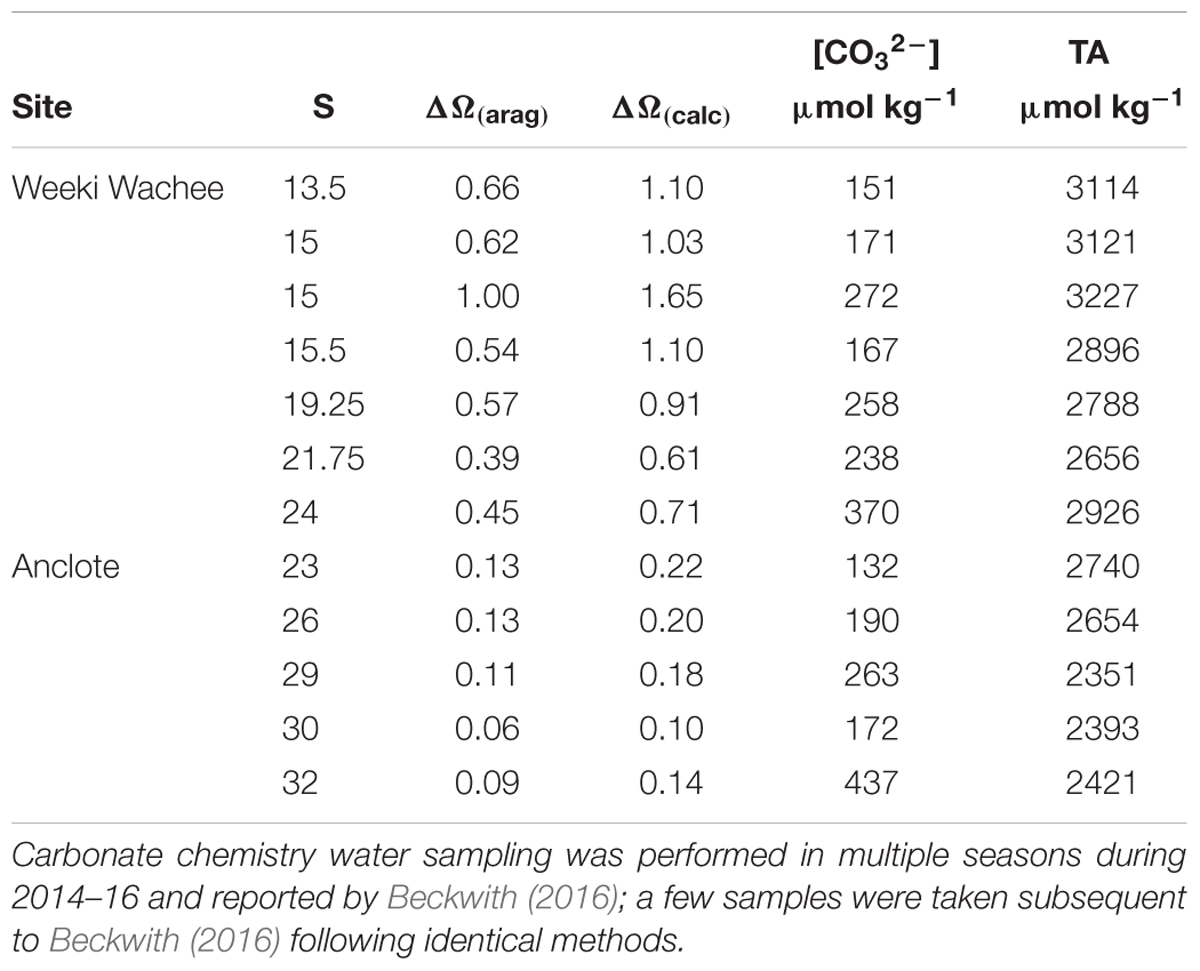
Table 2. The salinity, ΔΩ(aragonite), ΔΩ(calcite), carbonate ion concentration and total alkalinity for sampling sites in the mixing zones of the Anclote and Weeki Wachee Rivers in central-west Florida.
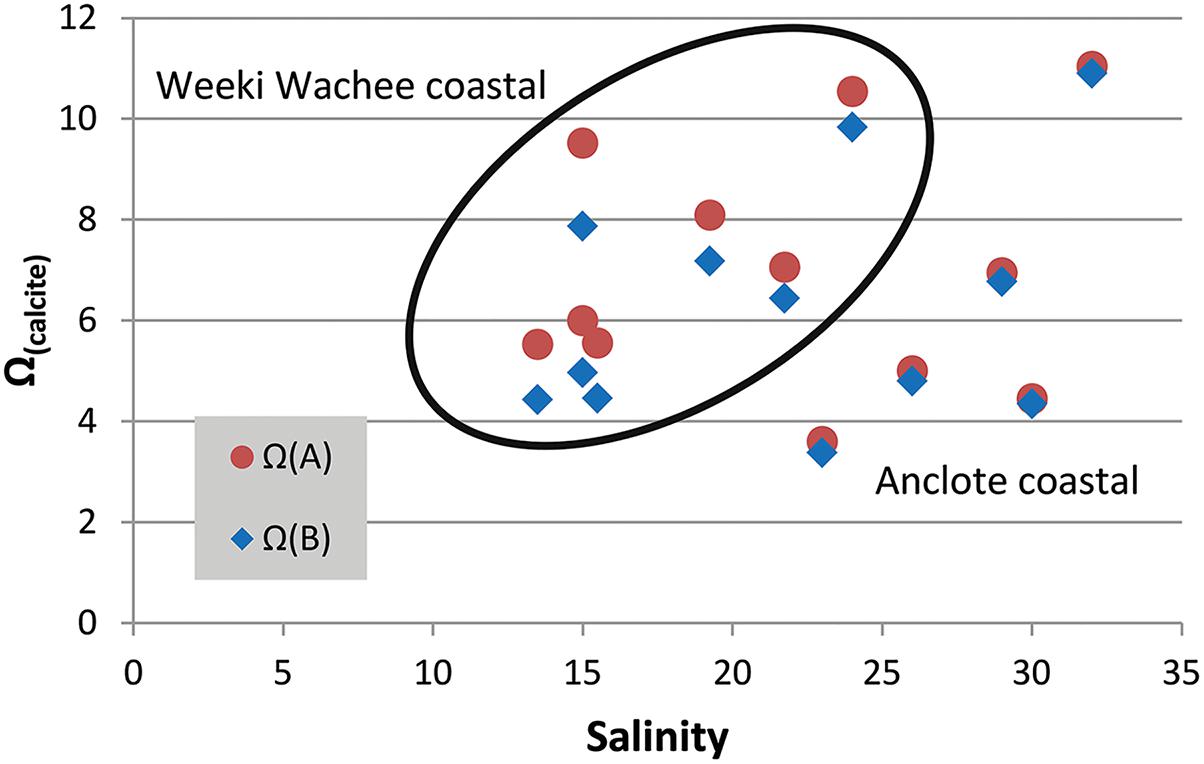
Figure 4. Salinity versus Ω(calcite). Calcium carbonate saturation state measurements shown for two mixing zones in central-west Florida (Weeki Wachee coastal samples encircled). The red circle markers represent Ω(A) calculated from total calcium (Equation 3) and the blue diamond markers represent Ω(B) calculated in CO2SYS, which does not account for measured [Ca2+]. The distance between the two marker types, ΔΩ, is the error created by not accounting for riverine calcium. The error is more profound at lower salinities but also varies by river region.
The higher values of ΔΩ for all samples in the Weeki Wachee mixing zone are in part related to the lower salinities of the samples taken there; at lower salinities ΔΩ is substantially more pronounced (i.e., Figure 2). However, the high ΔΩ values are also attributable to higher end-member [Ca2+] in the Weeki Wachee River. Both rivers have high [Ca2+] and enhance the Ω of the coastal waters, but the [Ca2+] of the Weeki Wachee River is roughly 20% greater. Comparing the two coastal mixing zones at roughly similar salinity revealed ΔΩ(calcite) = 0.71 (S = 24) for the Weeki Wachee area versus ΔΩ(calcite) = 0.22 (S = 23) for the Anclote area.
Discussion
Ω(A)/Ω(B) Interpolation Reveals Subregional Differences
The Ω-ratio represents corrections to Ω values owing to freshwater calcium sources. By spatially interpolating the results of this model, regional and subregional differences in calcification potential emerge. In general, riverine [Ca2+] is higher in rivers of the Eastern United States than in rivers of the Western United States due to greater abundance of limestone substrata. Comparing subregions or even individual river basins provides useful insight, as the [Ca2+] can change markedly from river to river. With a large number of rivers traversing substrata of varying CaCO3 composition, CWF is an ideal location to demonstrate the contrast in riverine [Ca2+] contributions to coastal waters.
The coastal lithology of CWF transitions from Eocene and Oligocene limestones/dolostones in the north, to Miocene and younger clays, sand, and limestone around Tampa Bay, to Pliocene and Pleistocene limestones in the south. The Ω-ratios, significantly above 1.00 for all rivers in the region, highlight the need to include directly measured [Ca2+] in Ω calculations. River-by-river comparisons reveal that further variability is found within carbonate provinces.
Similar to the contrast seen between the Carolina rivers (Santee and New), the underlying lithology in CWF explains much of the variation in [Ca2+] seen among the rivers. Short, coastal rivers in the Springs Coast, such as the Weeki Wachee River, emerge from and flow entirely within Eocene-Oligocene limestone. In contrast to the Weeki Wachee River ([Ca2+] = 1594 μmol/kg), the Manatee River ([Ca2+] = 514 μmol/kg) traverses primarily clay, sand, and sandstone as well as some areas of dolostone and limestone.
While lithology appears to be a strong predictor of riverine calcium, other contributing factors exist. The Alafia River, for example, flows along a narrow section of limestone lithology, seemingly exposed by the action of the river (although, at the scale of Figure 3, this is not clearly visible among the surrounding lithology class representing clay, sand, and sandstone). An additional noteworthy factor is the high number of riparian springs that feed into the Alafia River. Seemingly, the additive effects of substrata type and groundwater activity give the Alafia the highest [Ca2+] among the rivers feeding the Tampa Bay estuary. Thus, flow is an important factor to consider in addition to lithology. The Manatee River, which has the lowest [Ca2+] among the CWF rivers examined, also has a very low rate of discharge. In the comparison of the Weeki Wachee and Anclote Rivers, the case is more subtle: the lack of major springs seems to contribute to a lower [Ca2+] in the Anclote, which equates to the lower ΔΩ seen in estuarine waters. More broadly, the Ω-ratios provide the best overview of regional differences, and the strongest influence of riverine calcium is attributed to the Springs Coast.
Taken together, the lithology of an area can influence the riverine chemistry and in turn the coastal chemistry to an extent that substantially increases calculated Ω. The Ω-ratio model does not provide actual Ω values for a given location but rather provides a useful tool for first-order examination of coastal Ω trends by region. The model, by obviating the need for carbonate-system measurements (TA, DIC, pCO2, pH), reduces efforts in the field and laboratory that can instead be exerted on subsequent high-resolution studies of narrower regions of interest. Where [Ca2+] and [CO32-] data are available, however, improved Ω calculations can be made, as highlighted by the presentation of ΔΩ in this study.
Biogeochemical Signals of Refugia: A Case Study
Synergy of Limestone Bedded Rivers and Submerged Aquatic Vegetation Enhances Coastal Ω for Calcifying Species
In spring-fed rivers buffered by the dissolution of CaCO3 in the Springs Coast, the pH is typically high (≈ 8) (Yobbi and Knochenmus, 1989), and, as highlighted in this study, the riverine [Ca2+] is high. Total alkalinity is also high in these rivers, typically around 3,000 μmol/kg (Beckwith, 2016). At pH 8 in freshwater, a greater proportion of the TA is in the form of bicarbonate, HCO3-, than is the case for seawater at pH 8. The high concentration of CO2 found in groundwater bubbling from the headsprings and riparian springs is drawn down in part by degassing but primarily through the influence of SAV (Troester and White, 1986; de Montety et al., 2011).
Farther downstream, in the coastal mixing zone, prolific seagrass and macroalgae further draw down CO2, raising the pH and shifting the relative proportions of carbonate species from HCO3- to CO32-. Based on higher TA found in the Weeki Wachee River relative to seawater, a gradual dilution of the TA might be expected to occur due to seawater mixing, yet an increase in [CO32-] and TA occurs from the headwaters into the coastal waters, cresting to a maximum, for both [CO32-] and TA, at intermediate salinities before decreasing further offshore (Beckwith, 2016). The increase in TA is possibly due to additional input from downstream springs. This maximum zone is reflected in the distribution of Archaias angulatus (a foraminifer) in the Springs Coast; the highest density (individuals per gram of sediment) was seen at sampling sites within a band of intermediate salinity along the coastline (Figure 5) that could be termed a calcification “sweet spot,” referring to an ideal calcification environment. Similar sweet spots likely exist in any low latitude location where there is concurrence of limestone-influenced riverine discharge and extensive SAV, resulting in enhanced Ω.
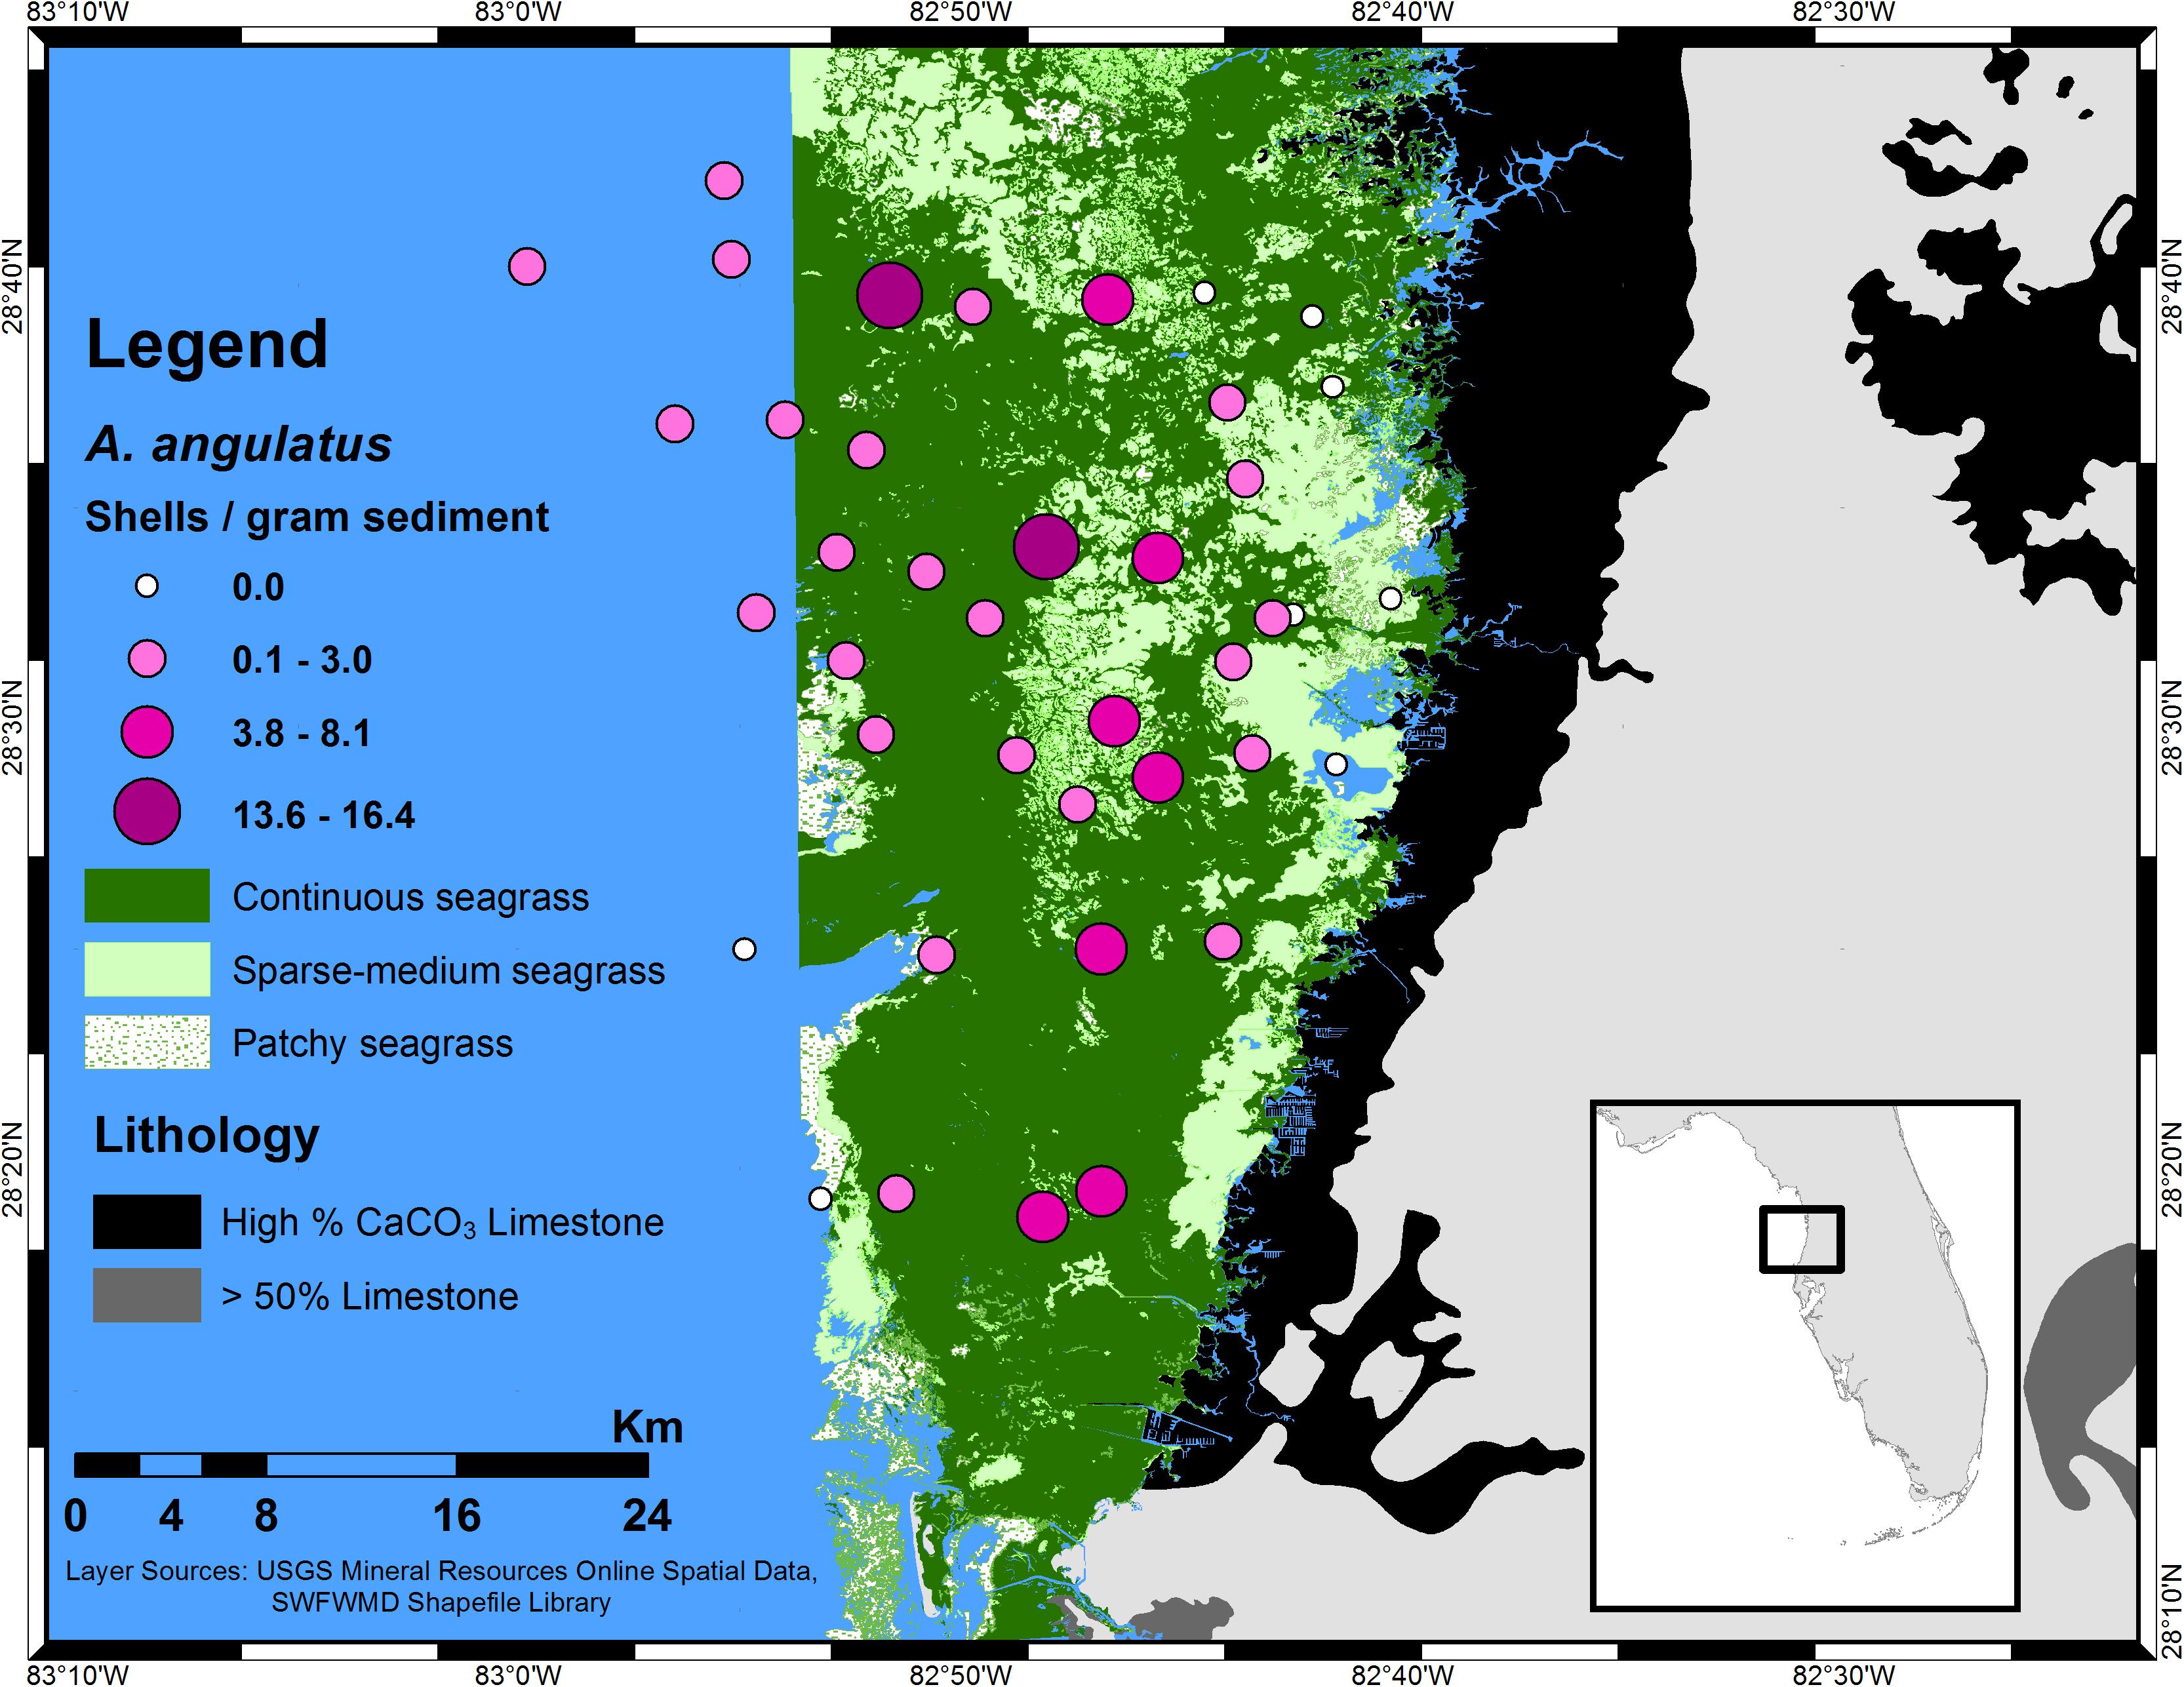
Figure 5. Distribution of A. angulatus (by density) in the southern Springs Coast of central-west Florida. The larger, darker circles represent higher density; note the concentration of highest density along a band parallel with the coastline. The A. angulatus distribution is shown over seagrass of varying density. The foraminiferal abundances were determined from sediment analysis and presented in Beckwith (2016); a few additional samples were examined subsequent to Beckwith (2016) following identical methods.
Ideal calcification environments require additional contributing factors beyond high Ω. Environmental conditions in the Springs Coast that contribute to the abundance of A. angulatus include the low nutrient concentrations that are common in these spring-fed coastal rivers. In addition, these rivers receive little runoff due to their low-gradient drainage basins (Yobbi and Knochenmus, 1989). Low nutrients and low runoff result in high water clarity, providing ample light for benthic organisms in these shallow waters. Also, a lack of barrier islands in this region (a result of an extremely low sloping gradient on this portion of the west Florida shelf) eliminates the potential stagnation that can occur in bay and lagoonal waters during slack tides.
What Constitutes a Refugium?
As defined by Keppel et al. (2012), refugia are “habitats that components of biodiversity retreat to, persist in and can potentially expand from under changing environmental conditions” (p. 394). Kavousi and Keppel (2017) outlined two essential criteria and four additional criteria that must be met to deem an area a refugium for coral reefs: (1) long term buffering, (2) protection from multiple climatic stressors, (3) accessibility, (4) microclimatic heterogeneity, (5) size of the refugia, and (6) low exposure to other disturbances. By first-order examination, the Springs Coast seems to meet all of these criteria, although not necessarily for coral reefs in the present day. Other organisms, such as oysters, scallops, calcareous algae, and foraminifera, to name a few, thrive in the Springs Coast. Calculation of the enhancement to saturation state values (Ω-ratio) presents a new tool to search for additional locations around the globe that meet the criteria of a refugium for calcareous organisms in terms of calcification potential. Here, we have highlighted environments with such potential: limestone-bedded rivers that meet with substantial SAV in the coastal mixing zone.
Along with measures such as the ratio of ΔpH to ΔDO (dissolved oxygen), and either the TA/DIC ratio or the closely related [CO32-]/[HCO3-] ratio, the Ω-ratio can serve as a useful tool for comparing coastal habitats. Bach (2015) contends that the [HCO3-]/[H+] ratio may be a more robust indicator than Ω for assessments of OA on a global scale. In consideration of the direct impacts of carbonate system variables such as pH and pCO2 on calcification in organisms, it is clear that Ω describes only a portion of the complex processes associated with OA. Cyronak et al. (2016) suggest that greater importance should be placed on pH in ambient seawater, owing to evidence of strong internal control of [CO32-] within organismal calcification fluids and concern that a reduced proton (H+) gradient potential between internal fluids and ambient seawater can strain an organism’s ability to maintain homeostasis. With respect to any of these indicators, carbonate springs and SAV are clearly beneficial factors that buffer the effects of OA.
Implications for Commercial Shellfish Harvesting
While the role of refugia may take many decades or longer to unravel, the case for conserving ecologically and economically-viable habitats is more compelling. A much more immediate benefit of locating areas of anomalously high saturation states exists for shellfish industries looking to sustainably harvest in locations that demonstrate longevity. Although the bay scallop (Argopecten irradians) meta-population in Florida has declined significantly since the 1960s, seemingly due to a combination of habitat loss, diminished water quality, overfishing, and recruitment failure (Barber and Blake, 1983; Arnold and Marelli, 1991; Blake et al., 1993; Sargent et al., 1995), a much needed reduction in harvesting pressures and environmental restoration efforts have subsequently facilitated a minor rejuvenation of key source populations of scallops (Arnold et al., 2005; Geiger et al., 2010). Factors that determine successful recovery of scallop populations include adequate adult density, suitable biological and environmental factors, and availability of seagrass beds (Arnold et al., 2005). The “Big Bend” coast of Florida, which includes the Springs Coast, is not immune to algal blooms that sometimes threaten shellfish populations, however, the coastal waters and benthic habitats of this area remain nearly pristine in other regards and provide the habitat and large-scale connectivity needed for successful restoration.
In this study, the rivers with the highest Ω-ratio were those fed by groundwater emerging from limestone. In the presence of SAV, this constant supply of calcium and carbonate creates essential buffering capacity to mediate changes in pH. While the rivers of the Springs Coast are a source of CO2 to the atmosphere (Barrera and Robbins, 2017), and while a recent decreasing trend in pH has been shown for rivers in the Springs Coast (increased water consumption has led to shorter residence times of high CO2 groundwater, and therefore lower pH)(Barrera and Robbins, 2017), the SAV draws down CO2 creating a relatively high pH coastal environment. The high TA of the riverine discharge provides long-term buffering potential, but the realization of the buffering effect is dependent on sufficient draw down of CO2 by SAV. Because of their value as potential calcification refugia, the first priority in managing highly buffered areas should be protection and conservation. Through proper management and industry collaboration, it seems plausible that calcification refugia might also be ideal for shell-fish fisheries.
Conclusion
Consideration of freshwater contributions to saturation states reveals substantial enhancements in calcium carbonate saturation states (Ω). The model described in this study offers researchers and resource managers a tool to examine regional differences in calcification potential by utilizing riverine calcium data wherever available. Key points of this study are summarized as follows:
(1) Groundwater discharged by limestone bedded seeps, springs, and rivers results in highly non-conservative [Ca2+] at sub-regional and regional scales in coastal waters.
(2) Saturation state calculations can be improved by directly measuring [Ca2+]; ΔΩ(aragonite) = ∼0.06–1.00 and ΔΩ(calcite) = ∼0.10–1.65 for the Anclote and Weeki Wachee River areas.
(3) Models using actual riverine end-members highlight regions of enhanced calcification potential: ∼1.04–1.12 at S = 20 for CWF.
(4) Especially in combination with abundant SAV, carbonate springs and rivers may provide greater resistance to OA in coastal waters than offshore waters can provide.
Data Availability
The datasets generated for this study can be found in the United States Environmental Protection Agency’s Water Quality Data online data warehouse, https://www.epa.gov/waterdata/water-quality-data-wqx.
Author Contributions
SB performed the data collection and analysis. RB developed the calcium end-member and saturation state ratio models. All authors contributed to the development of the study, interpretation of the data, and writing of the manuscript.
Conflict of Interest Statement
The authors declare that the research was conducted in the absence of any commercial or financial relationships that could be construed as a potential conflict of interest.
Acknowledgments
A portion of this work was performed in fulfillment of SB’s thesis, including carbonate system water sampling and sediment analysis of foraminiferal abundance. The Cushman Foundation for Foraminiferal Research provided partial funding of the thesis work through the Joseph A. Cushman Award for Student Research. Dr. Paul Carlson of the Florida Fish and Wildlife Conservation Commission Fish and Wildlife Research Institute provided sediment samples collected during the Springs Coast Seagrass Monitoring project, which was funded by a United States Fish and Wildlife Service State Wildlife Grant. SB thanks Marshall Lester, Christian Gfatter, and Kyle Amergian for help with sediment sample analysis.
Footnotes
References
Allee, R., Finkbeiner, R., Gould, R., Ko, D.-S., Lary, D., Kurtz, J., et al. (2012). Coastal and Marine Ecological Classification Standard (CMECS) Application for Sea Surface Salinity in the N Gulf of Mexico in GOM Data Atlas. Asheville, NC: National Centers for Environmental Information.
Arnold, W. S., Blake, N. J., Harrison, M. M., Marelli, D. C., Parker, M. L., Peters, S. C., et al. (2005). Restoration of bay scallop (Argopecten irradians (Lamarck)) populations in Florida coastal waters: planting techniques and the growth, mortality and reproductive development of planted scallops. J. Shellfish Res. 24, 883–904. doi: 10.2983/0730-8000(2005)24[883:ROBSAI]2.0.CO;2
Arnold, W. S., and Marelli, D. C. (1991). Assessment of Bay Scallop Populations on the West Coast of Florida. Tallahassee, FL: Florida Department of Environmental Protection.
Bach, L. T. (2015). Reconsidering the role of carbonate ion concentration in calcification by marine organisms. Biogeosciences 12, 4939–4951. doi: 10.5194/bg-12-4939-2015
Barber, B. J., and Blake, N. J. (1983). Growth and reproduction of the bay scallop, Argopecten irradians (Lamarck) at its southern distributional limit. J. Exp. Mar. Biol. Ecol. 66, 247–256. doi: 10.1016/0022-0981(83)90163-6
Barrera, K. E., and Robbins, L. L. (2017). Historical patterns of acidification and increasing CO2 flux associated with Florida springs. Limnol. Oceanogr. 62, 2404–2417. doi: 10.1002/lno.10573
Beckwith, S. T. (2016). Abundance of Archaias angulatus on the West Florida Coast Indicates the Influence of Carbonate Alkalinity Over Salinity. Master’s thesis, University of South Florida, Tampa, FL.
Blake, N. J., Lu, Y., and Moyer, M. (1993). Evaluation of Tampa Bay Waters for the Survival and Growth of Southern Bay Scallop Larvae and Juveniles. St. Petersburg, FL: Tampa Bay National Estuary Program Technical Publications, 04–93.
Chakrabarti, R., Mondal, S., Acharya, S. S., Lekha, J. S., and Sengupta, D. (2018). Submarine groundwater discharge derived strontium from the Bengal Basin traced in Bay of Bengal water samples. Sci. Rep. 8:4383. doi: 10.1038/s41598-018-22299-5
Ciais, P., Sabine, C., Bala, G., Bopp, L., Brovkin, V., Canadell, J., et al. (2013). “Carbon and other biogeochemical cycles,” in Climate Change 2013: The Physical Science Basis. Contribution of Working Group I to the Fifth Assessment Report of the Intergovernmental Panel on Climate Change, eds T. F. Stocker, D. Qin, G.-K. Plattner, M. Tignor, S. K. Allen, J. Boschung, A. Nauels, Y. Xia, V. Bex and P. M. Midgley (Cambridge: Cambridge University Press), 465–570.
Collins, M., Knutti, R., Arblaster, J., Dufresne, J.-L., Fichefet, T., Friedlingstein, P., et al. (2013). “Long-term climate change: projections, commitments and irreversibility,” in Climate Change 2013: The Physical Science Basis. Contribution of Working Group I to the Fifth Assessment Report of the Intergovernmental Panel on Climate Change, eds T. F. Stocker, D. Qin, G.-K. Plattner, M. Tignor, S. K. Allen, J. Boschung, A. Nauels, Y. Xia, V. Bex and P. M. Midgley (Cambridge: Cambridge University Press), 1029–1136.
Cyronak, T., Schulz, K. G., and Jokiel, P. L. (2016). The Omega myth: what really drives lower calcification rates in an acidifying ocean. ICES J. Mar. Sci. 73, 558–562. doi: 10.1093/icesjms/fsv075
de Montety, V., Martin, J., Cohen, M., Foster, C., and Kurz, M. (2011). Influence of diel biogeochemical cycles on carbonate equilibrium in a karst river. Chem. Geol. 283, 31–43. doi: 10.1016/j.chemgeo.2010.12.025
DeCarlo, T. M., Comeau, S., Cornwall, C. E., and McCulloch, M. T. (2018). Coral resistance to ocean acidification linked to increased calcium at the site of calcification. Proc. R. Soc. B 285:20180564. doi: 10.1098/rspb.2018.0564
Dicken, C. L., Nicholson, S. W., Horton, J. D., Foose, M. P., and Mueller, J. A. (2005). Integrated Geologic Map Databases for the United States: Alabama, Florida, Georgia, Mississippi, North Carolina, and South Carolina: United States Geological Survey Open-File Report 2005-1323. Reston, VA: United States Geological Survey.
Dickson, A. G. (1990). Standard potential of the reaction: AgCl(s) + 1/2 H2(g) = Ag(s) + HCl(aq), and the standard acidity constant of the ion HSO4- in synthetic sea water from 273.15 to 318.15 K. J. Chem. Thermodynam. 22, 113–127. doi: 10.1016/0021-9614(90)90074-Z
Erwin, D. H. (1998). The end and the beginning: recoveries from mass extinctions. Trends Ecol. Evol. 13, 344–349. doi: 10.1016/S0169-5347(98)01436-0
Gaylord, B., Hill, T. M., Sanford, E., Lenz, E. A., Jacobs, L. A., Sato, K. N., et al. (2011). Functional impacts of ocean acidification in an ecologically critical foundation species. J. Exp. Biol. 214, 2586–2594. doi: 10.1242/jeb.055939
Geiger, S. P., Stephenson, S. P., and Arnold, W. S. (2010). Protracted recruitment in the bay scallop Argopecten irradians in a west Florida estuary. J. Shellfish Res. 29, 809–817. doi: 10.2983/035.029.0414
Hallock, P., and Peebles, M. W. (1993). Foraminifera with chlorophyte endosymbionts: habitats of six species in the Florida Keys. Mar. Micropaleontol. 20, 277–292. doi: 10.1016/0377-8398(93)90037-X
Honisch, B., Ridgwell, A., Schmidt, D., Thomas, E., Gibbs, S., Sluijs, A., et al. (2012). The geological record of ocean acidification. Science 335, 1058–1063. doi: 10.1126/science.1208277
Horton, J. D. (2017). The State Geologic Map Compilation (SGMC) Geodatabase of the Conterminous United States (ver.1.1). Reston, VA: United States Geological Survey.
Jablonski, D. J. (1996). “Causes and consequences of mass extinctions: a comparative approach,” in Dynamics of Extinction, ed. D. K. Elliot (Hoboken, NJ: Wiley), 183–229.
Kavousi, J., and Keppel, G. (2017). Clarifying the concept of climate change refugia for coral reefs. ICES J. Mar. Sci. 75, 43–49. doi: 10.1093/icesjms/fsx124
Keppel, G., Van Niel, K. P., Wardell-Johnson, G. W., Yates, C. J., Byrne, M., Mucina, L., et al. (2012). Refugia: identifying and understanding safe havens for biodiversity under climate change. Global Ecol. Biogeogr. 21, 393–404. doi: 10.1111/j.1466-8238.2011.00686.x
Keul, N., Morse, J. W., Wanninkhof, R., Gledhill, D. K., and Bianch, T. S. (2010). Carbonate chemistry dynamics of surface waters in the Northern Gulf of Mexico. Aquat. Geochem. 16, 337–351. doi: 10.1007/s10498-010-9091-2
Kirtman, B., Power, S. B., Adedoyin, J. A., Boer, G. J., Bojariu, R., Camilloni, I., et al. (2013). “Near-term climate change: projections and predictability,” in Climate Change 2013: The Physical Science Basis. Contribution of Working Group I to the Fifth Assessment Report of the Intergovernmental Panel on Climate Change, eds T. F. Stocker, D. Qin, G.-K. Plattner, M. Tignor, S. K. Allen, J. Boschung, A. Nauels, Y. Xia, V. Bex and P. M. Midgley (Cambridge: Cambridge University Press), 953–1028.
Kleypas, J. A., and Yates, K. K. (2009). Coral reefs and ocean acidification. Oceanography 22, 108–117. doi: 10.5670/oceanog.2009.101
Knight, R. L. (2017). Florida, Land of 1,000 Springs. Available at: FloridaSpringsInstitute.org (accessed March 2, 2017).
Kump, L. R., Bralower, T. J., and Ridgewell, A. (2009). Ocean acidification in deep time. Oceanography 22, 94–107. doi: 10.5670/oceanog.2009.100
Magaritz, M. (1991). Carbon isotopes, time boundaries and evolution. Terra Nova 3, 251–256. doi: 10.1111/j.1365-3121.1991.tb00142.x
Manzello, D. P., Enochs, I. C., and Melo, N. (2012). Ocean acidification refugia of the Florida Reef Tract. PLoS One 7:e41715. doi: 10.1371/journal.pone.0041715
Millero, F. J. (2010). Carbonate constants for estuarine waters. Mar. Freshw. Res. 61, 139–142. doi: 10.1071/MF09254
Mucci, A. (1983). The solubility of calcite and aragonite in seawater at various salinities, temperatures and one atmosphere total pressure. Am. J. Sci. 283, 780–799. doi: 10.2475/ajs.283.7.780
Murray, J. W. (2014). Ecology and Palaeoecology of Benthic Foraminifera (Frontiers in Palaeobiology). New York, NY: Routledge. doi: 10.4324/9781315846101
Okazaki, R. R., Swart, P. K., and Langdon, C. (2013). Stress-tolerant corals of Florida Bay are vulnerable to ocean acidifcation. Coral Reefs 32, 671–683. doi: 10.1007/s00338-013-1015-3
Sargent, F. J., Leary, T. J., and Crewz, D. W. (1995). Scarring of Florida’s Seagrasses: Assessment and Management Options. FMRI Technical Report TR-1. St. Petersburg, FL: Florida Department of Environmental Protection.
Schweitzer, P. N. (2011). Combined Geologic Map Data for the Conterminous US. (Derived) From the USGS State Geologic Map Compilation. Available at: https://mrdata.usgs.gov/geology/state
Troester, J. W., and White, W. B. (1986). Geochemical investigations of three tropical karst drainage basins in Puerto Rico. Groundwater 24, 475–482. doi: 10.1111/j.1745-6584.1986.tb01026.x
Uppstrom, L. R. (1974). The boron/chlorinity ratio of deep-sea water from the Pacific Ocean. Deep Sea Res. 21, 161–162. doi: 10.1016/0011-7471(74)90074-6
Uthicke, S., Momigliano, P., and Fabricius, K. E. (2013). High risk of extinction of benthic foraminifera in this century due to ocean acidification. Sci. Rep. 3:1769. doi: 10.1038/srep01769
Wang, Z. A., Wanninkhof, R., Cai, W.-J., Byrne, R. H., Hu, X., Peng, T.-H., et al. (2013). The marine inorganic carbon system along the Gulf of Mexico and Atlantic coasts of the United States: insights from a transregional coastal carbon study. Limnol. Oceanogr. 58, 325–342. doi: 10.4319/lo.2013.58.1.0325
Wanninkhof, R., Barbero, L., Byrne, R., Cai, W.-J., Huang, W.-J., Zhang, J.-Z., et al. (2015). Ocean acidification along the Gulf Coast and East Coast of the USA. Contin. Shelf Res. 98, 54–71. doi: 10.1016/j.csr.2015.02.008
Watson, D. F., and Philip, G. M. (1985). A refinement of inverse distance weighted interpolation. Geoprocessing 2, 315–327.
Weinmann, A. E., Rodder, D., Lotters, S., and Langer, M. R. (2013). Heading for new shores: projecting marine distribution ranges of selected larger foraminifera. PLoS One 8:e62182. doi: 10.1371/journal.pone.0062182
Yates, K. K., Rogers, C. S., Herlan, J. J., Brooks, G. R., Smiley, N. A., and Larson, R. A. (2014). Diverse coral communities in mangrove habitats suggest a novel refuge from climate change. Biogeosciences 11, 4321–4337. doi: 10.5194/bg-11-4321-2014
Keywords: carbonate-rich groundwater, first-magnitude springs, riverine calcium, ocean acidification, west Florida coastal waters, seagrass
Citation: Beckwith ST, Byrne RH and Hallock P (2019) Riverine Calcium End-Members Improve Coastal Saturation State Calculations and Reveal Regionally Variable Calcification Potential. Front. Mar. Sci. 6:169. doi: 10.3389/fmars.2019.00169
Received: 16 October 2018; Accepted: 18 March 2019;
Published: 03 April 2019.
Edited by:
Tyler Cyronak, University of California, San Diego, United StatesReviewed by:
Zvi Steiner, University of Cambridge, United KingdomEmily E. Bockmon, California Polytechnic State University, United States
Copyright © 2019 Beckwith, Byrne and Hallock. This is an open-access article distributed under the terms of the Creative Commons Attribution License (CC BY). The use, distribution or reproduction in other forums is permitted, provided the original author(s) and the copyright owner(s) are credited and that the original publication in this journal is cited, in accordance with accepted academic practice. No use, distribution or reproduction is permitted which does not comply with these terms.
*Correspondence: Sean T. Beckwith, c3RiZWNrd2l0aEBtYWlsLnVzZi5lZHU=