 Nina Bednaršek
 Richard A. Feely
 Marcus W. Beck
 Olivier Glippa
 Mirella Kanerva4
 Jonna Engström-Öst
94% of researchers rate our articles as excellent or good
Learn more about the work of our research integrity team to safeguard the quality of each article we publish.
Find out more
ORIGINAL RESEARCH article
Front. Mar. Sci., 12 December 2018
Sec. Global Change and the Future Ocean
Volume 5 - 2018 | https://doi.org/10.3389/fmars.2018.00486
This article is part of the Research TopicEl Niño-Southern Oscillation on a Changing Planet: Consequences for Coastal EcosystemsView all 7 articles
Understanding the interactive effects of multiple stressors on pelagic mollusks associated with global climate change is especially important in highly productive coastal ecosystems of the upwelling regime, such as the California Current System (CCS). Due to temporal overlap between a marine heatwave, an El Niño event, and springtime intensification of the upwelling, pteropods of the CCS were exposed to co-occurring increased temperature, low Ωar and pH, and deoxygenation. The variability in the natural gradients during NOAA’s WCOA 2016 cruise provided a unique opportunity for synoptic study of chemical and biological interactions. We investigated the effects of in situ multiple drivers and their interactions across cellular, physiological, and population levels. Oxidative stress biomarkers were used to assess pteropods’ cellular status and antioxidant defenses. Low aragonite saturation state (Ωar) is associated with significant activation of oxidative stress biomarkers, as indicated by increased levels of lipid peroxidation (LPX), but the antioxidative activity defense might be insufficient against cellular stress. Thermal stress in combination with low Ωar additively increases the level of LPX toxicity, while food availability can mediate the negative effect. On the physiological level, we found synergistic interaction between low Ωar and deoxygenation and thermal stress (Ωar:T, O2:T). On the population level, temperature was the main driver of abundance distribution, with low Ωar being a strong driver of secondary importance. The additive effects of thermal stress and low Ωar on abundance suggest a negative effect of El Niño at the population level. Our study clearly demonstrates Ωar and temperature are master variables in explaining biological responses, cautioning the use of a single parameter in the statistical analyses. High quantities of polyunsaturated fatty acids are susceptible to oxidative stress because of LPX, resulting in the loss of lipid reserves and structural damage to cell membranes, a potential mechanism explaining extreme pteropod sensitivity to low Ωar. Accumulation of oxidative damage requires metabolic compensation, implying energetic trade-offs under combined thermal and low Ωar and pH stress. Oxidative stress biomarkers can be used as early-warning signal of multiple stressors on the cellular level, thereby providing important new insights into factors that set limits to species’ tolerance to in situ multiple drivers.
The consequences of the release of anthropogenic CO2 emissions into the atmosphere result in increasing warming, ocean acidification, and deoxygenation in global ocean. Physiological tolerances for temperature, pH, and dissolved oxygen define a natural envelope of suitable habitat within organismal tolerance limits. Independently or synergistically, once these drivers exceed the natural envelope of physiological tolerance, suitable habitat for some organisms becomes limiting, ultimately controlling the distribution and interaction among species, and overall ecosystem productivity. These combined impacts are dependent on how the effects of the drivers amplify (i.e., synergistic) or counter (i.e., antagonistic) one another. The multiple driver interactions may potentially trigger biological impairments that can carry across different levels of biological organization. We refer to environmental drivers as stressors when they exceed physiological tolerance limits and result in negative biological impacts leading to non-linear outcomes, such that the combined effects can be more severe than expected. As demonstrated for a wide range of ecosystems, non-linear relationships between environmental variables can result in a loss of ecosystem services and reduction in biodiversity (Kelly et al., 2015).
Understanding the interactive effects of global environmental stressors is especially important within Eastern Boundary Upwelling Systems (EBUS) that are among the most productive ecosystems in the world, providing significant economic, cultural, and recreational services to large populations living near the coast (Halpern et al., 2009). The California Current System (CCS) is one of the EBUS for which some of the highest rates of climate-related changes have already been demonstrated (Feely et al., 2008, 2016; Gruber et al., 2012; Hauri et al., 2013; Bakun et al., 2015; Turi et al., 2016). However, the predictive abilities required to accurately assess biological responses to interactive effects of multiple drivers are still limited. The challenge remains to establish the linkages from cellular to physiological up to population-level effects that occur over different temporal and spatial scales. These interactive conditions are not easily replicated within experimental laboratory settings, making it difficult to reproduce realistic in situ exposure to multiple stressors. Here, we use the conditions of a strong El Niño with a preceding heat wave and concurrent upwelling event to study the responses of pteropods exposed to combinations of thermal stress, high CO2, low pH, low aragonite saturation state (Ωar), and deoxygenation (low oxygen concentrations). The combination of various environmental parameters provided multifaceted settings with different multiple drivers and their in situ interactions against which the biological responses of pelagic mollusks were studied.
The convergence of the 2013–2015 ocean heat wave coupled with the strong 2015–2016 El Niño (Bond et al., 2015; Di Lorenzo and Mantua, 2016; Jacox et al., 2016) caused one of the lowest phytoplankton abundances since 2013 (Gómez-Ocampo et al., 2018) and a complete restructuring of pelagic populations (Peterson et al., 2017). Prior to the May-June 2016 West Coast Ocean Acidification (WCOA16) cruise, the northeast Pacific was under the influence of a marine heat wave (MHW) that began in late 2013 and ended in the spring of 2016, with surface temperature anomalies ranging from 1.5 to 6.2°C (Bond et al., 2015; Di Lorenzo and Mantua, 2016). The MHW overlapped with the 2015–2016 El Niño (Gentemann et al., 2017; Hu et al., 2017). By the spring and early summer of 2016, extremely high sea surface temperature anomalies had dissipated but surface waters generally remained warmer than normal by 1–1.5°C (Gentemann et al., 2017). Upwelling of low-oxygen, low-aragonite-saturation waters was strong just prior to the WCOA16 cruise, and corrosive waters approached the surface near the coast (Figures 1–3). This confluence of oceanographic phenomena led to lower overall productivity of plankton and higher abundances of warm-water zooplankton species relative to cold-water species (Peterson et al., 2017). When El Niño came abruptly to an end around May 2016 (Jacox et al., 2016; Frischknecht et al., 2017), spring transition had already induced an upwelling, simultaneously creating a temporal window where El Niño and increased upwelling overlapped. Although milder in the beginning, wind stress quickly intensified and resulted in intense upwelling by the end of May 2016, bringing subsurface high-CO2, low pH waters with low Ωar from the combined effects of the uptake and deep mixing of anthropogenic CO2 as well as in situ respiration processes (hereafter described as ocean acidification) to the shallow depths in the near-coastal region (Feely et al., 2008, 2016; Alin et al., 2012; Harris et al., 2013).
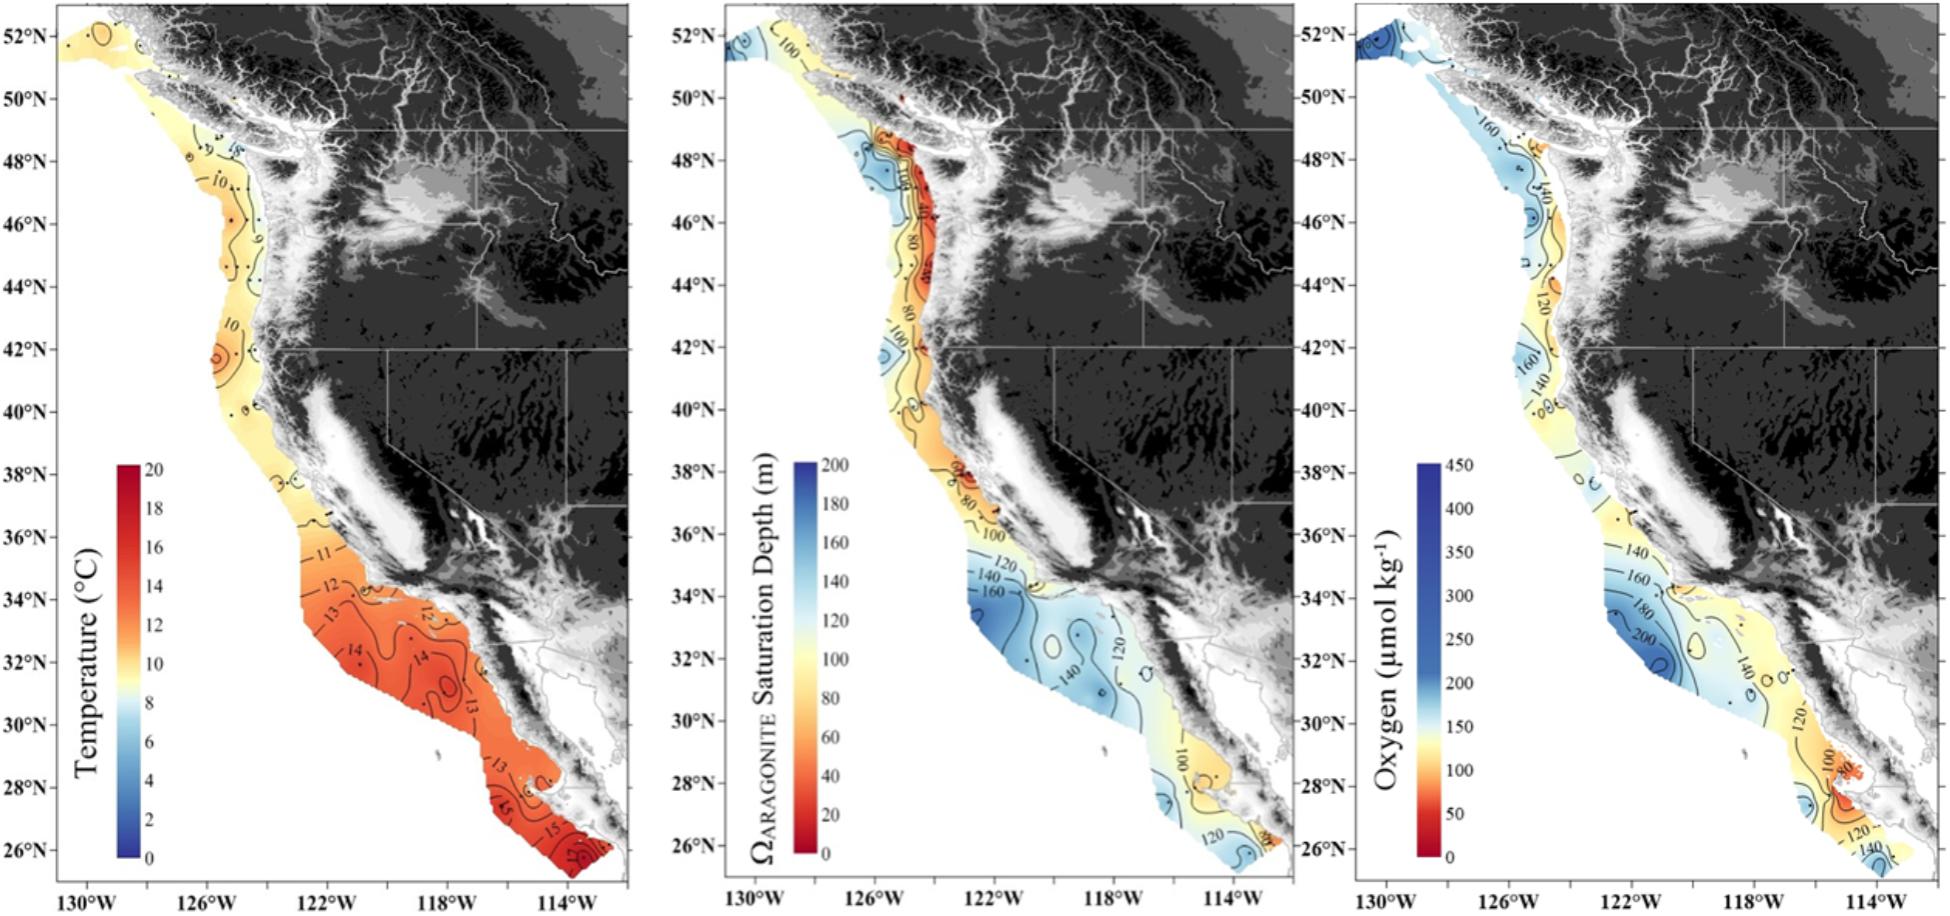
Figure 1. Large-scale gradients of temperature (50 m), depth of aragonite saturation (Ωar = 1) and oxygen concentration (100 m) along the United States West Coast in May–June 2016.
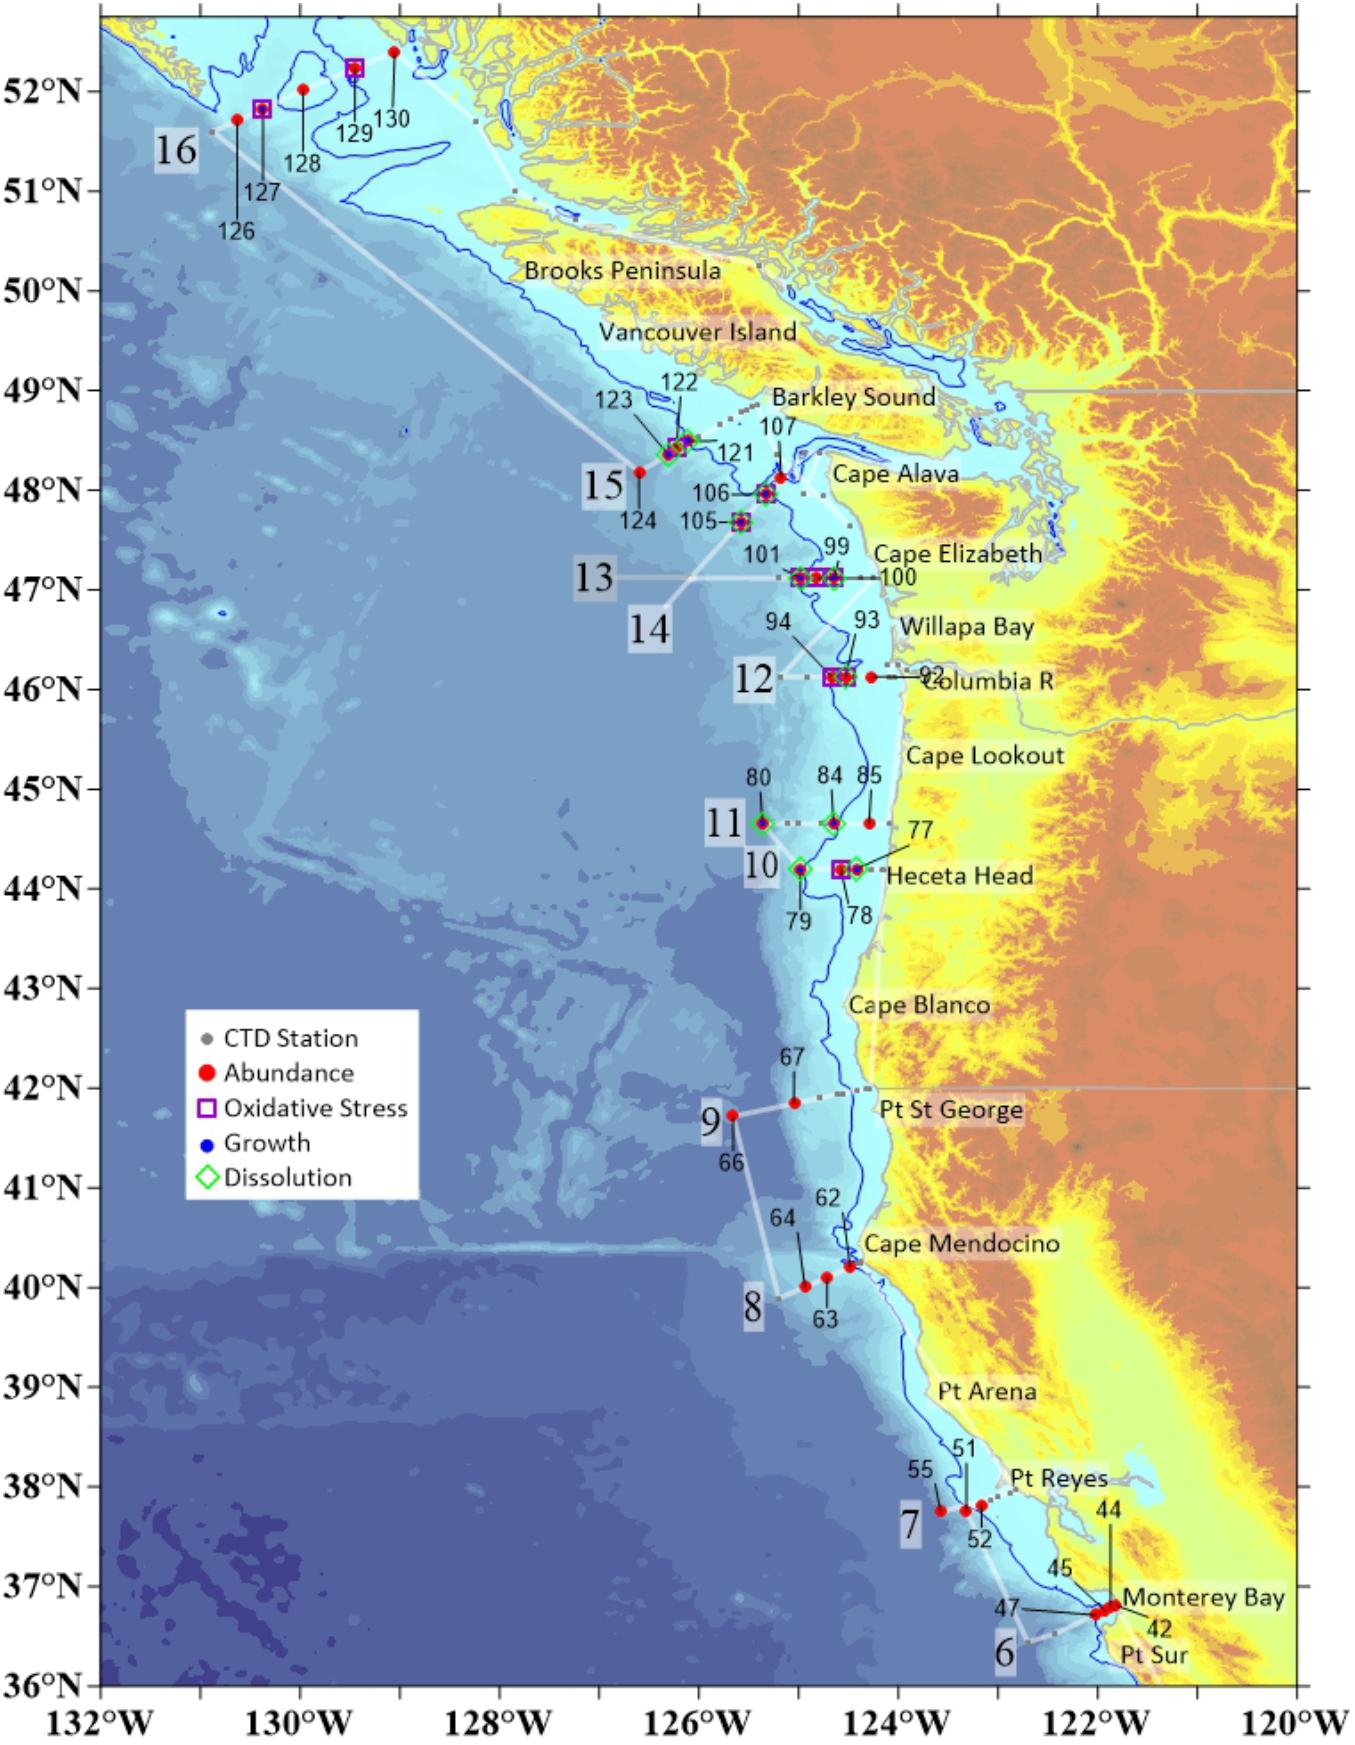
Figure 2. Stations in the CCS at which physical–chemical data matched variety of different biological parameters measured in pteropods, including shell dissolution, oxidative stress, length measurements, and abundance. We investigated the responses along 11 of 17 transect lines that comprised the entire cruise. Individual station numbers are aligned with characteristic biological measurements. CTD measurements were taken on all stations where biological data were collected.
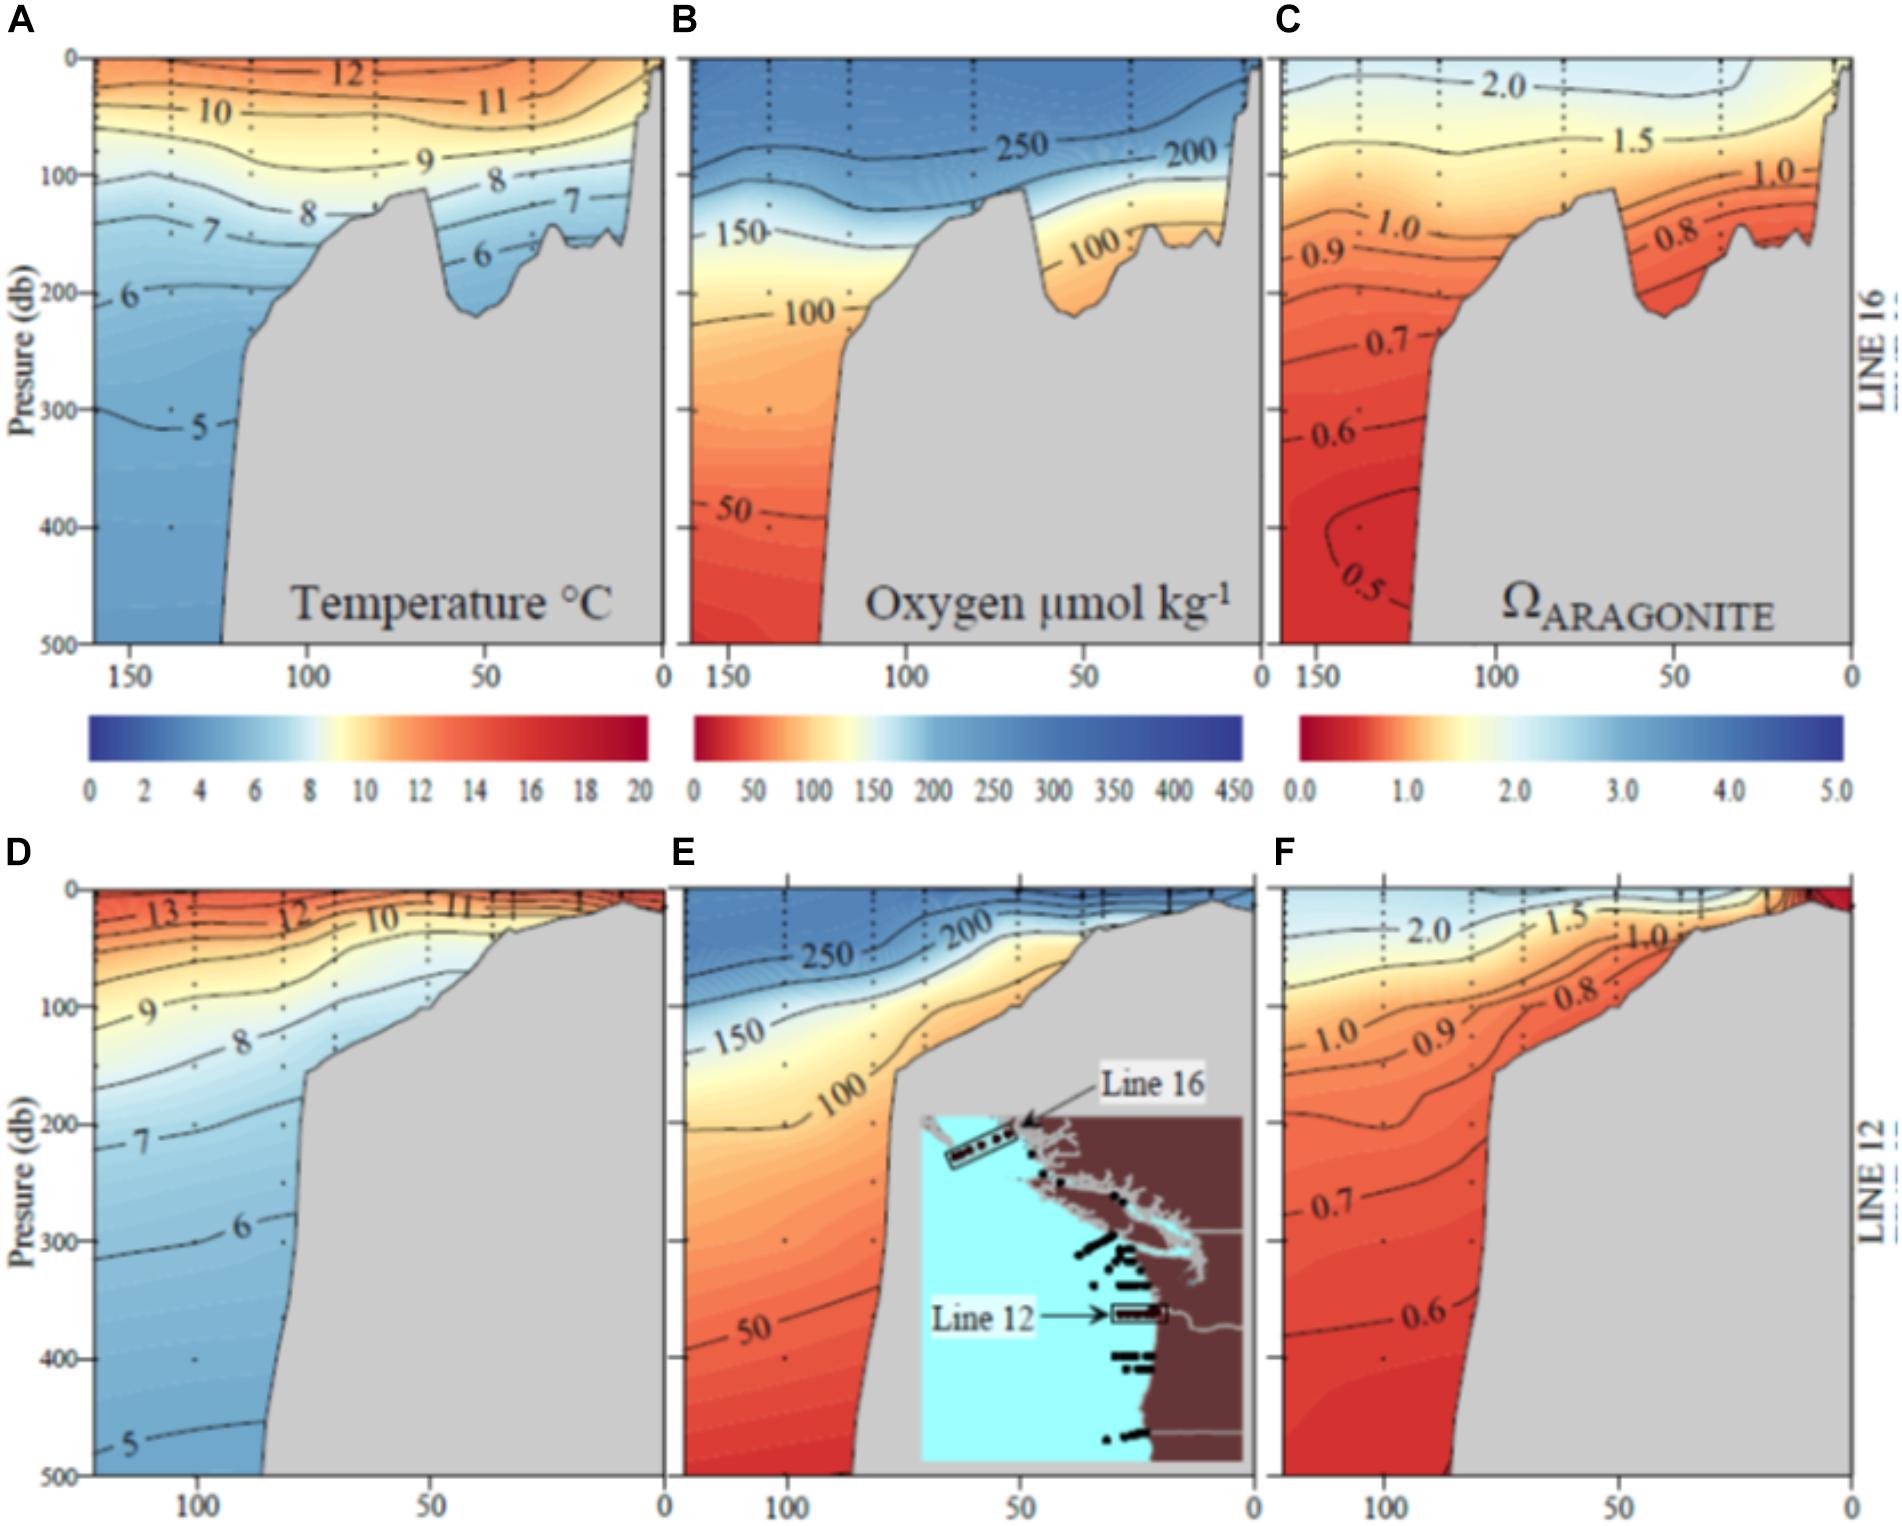
Figure 3. Sections of (A) temperature; (B) oxygen; (C) aragonite saturation state (Ωar) off the British Columbia coast (Line 16) and (D) temperature; (E) oxygen; (F) aragonite saturation off the Oregon–Washington coast due west of the Columbia River (Line 12).
The temporal dynamics of concurrent time events created large-scale temperature and low pH and Ωar gradients along the US West Coast (Figure 1), with pronounced coastal-offshore dynamics in the northern part of the CCS, where we conducted our studies (Figure 2, 3). The space-for-time approach along the temperature and low Ωar natural gradients were used to study the exposure effects of the pelagic communities at cellular, physiological, and population levels (Bednaršek and Ohman, 2015).
Pteropods are pelagic mollusks that are one of the most sensitive and best studied indicator species for ocean acidification, in particular for Ωar (Bednaršek et al., 2017a). The most dominant species in the CCS, i.e., Limacina helicina, has demonstrated increased susceptibility that is further exacerbated under thermal stress (Lischka et al., 2011; Lischka and Riebesell, 2012; Gardner et al., 2018). This susceptibility is demonstrated through increased shell dissolution and reduced metabolic activity, calcification, growth, and survival (Lischka and Riebesell, 2012; Maas et al., 2015; Bednaršek et al., 2016a, 2017b; Moya et al., 2016; Gardner et al., 2018). Given the importance of pteropods as a food resource for a variety of ecologically and commercially important marine species in the CCS (Aydin et al., 2005; Karpenko et al., 2007; Armstrong et al., 2008), it is an imperative to understand their sustainability under global environmental change scenarios.
The commonality behind the multiple stressor effects is the production of reactive oxygen species (ROS) and cellular stress that result in increased energy expenditure and compensatory energetic trade-offs on a physiological level, which may carry over effects to the population level (Tomanek, 2011; Sokolova et al., 2012). To capture the linkages across different levels of biological organization, the biomarkers on one level need to be related to the responses on the higher level. For example, cellular biomarkers need to be related to physiological responses to establish the connection between the cellular and physiological levels. Oxidative stress occurs as a consequence of an imbalance between ROS production and the available antioxidative defense that enables scavenging and neutralization of generated radicals (Table 1), such as superoxide anions (O2-), hydrogen peroxide (H2O2), and hydroxyl radical. While thermal stress seems to be one of the most potent stressors of ROS production, low pH and Ωar along with deoxygenation can also result in elevated oxidative stress (Zenebe et al., 2007; Murphy, 2009), especially in their co-occurring interaction (Sokolova et al., 2012). ROS are capable of unrestricted oxidation of various cellular components that lead to non-specific modifications of lipids, proteins, and nucleic acids, causing disruption of cellular homeostasis and enhanced cellular stress. From the bioenergetic perspective, the results of oxidative stress can induce increased energy expenditure and negatively affect the efficiency of generating aerobic energy (ATP), which can ultimately result in compensatory energetic trade-offs and compromised health (Wood et al., 2008; Belhadj Slimen et al., 2014).
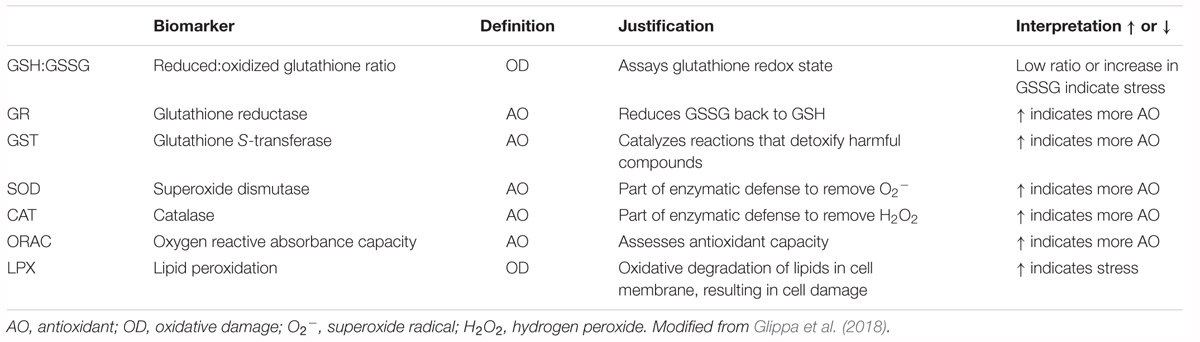
Table 1. Definition, justification, and interpretation of used biomarkers with zooplankton examples from literature.
To our knowledge, there is no previous study to date using oxidative stress to assess cellular stress levels and antioxidant defenses in these pelagic mollusks under multiple environmental drivers, including low pH, low Ωar, thermal stress, and deoxygenation. Currently, there is a lack of comprehensive understanding to link cellular to physiological and population-level responses in pteropods in the natural environment that with its diverse gradients create natural analogs of multiple stress for studying biological responses. The objective of this study is therefore to (1) examine the interaction effects of co-occurring multiple stressors; (2) assess their impact and understand the relative role of drivers and their magnitudes behind the stress response; (3) delineate the interaction effects that can determine non-additive responses; and (4) link cellular to physiological and population-level effects on Limacina helicina.
During the WCOA2016 cruise, which encompassed 17 cross-shelf transects, we obtained measurements of conductivity-temperature-depth (CTD) and oxygen. At each station, water samples were collected in modified Niskin-type bottles, poisoned with HgCl2 and analyzed onboard the ship for dissolved inorganic carbon (DIC), total alkalinity (TA), pH, fluorescence, and oxygen using the methods described in Feely et al. (2016). From these data we calculated pCO2 and Ωar (Figure 2). On 11 of the 17 transects, spanning the region from Central California to Oregon, Washington, and British Columbia (Figure 3), we conducted biological sampling for pteropods. Limacina helicina were collected at the biological subset of 37 stations using 200μm mesh Bongo nets, with integrated sampling over the upper 100μm and combined with counts of Limacina helicina for overall abundance (Figure 2). Depending on the subsequent analyses, the samples were stored in 100% non-denatured ethanol or flash-frozen at -80°C. Complete physical–chemical characterization of pteropod habitat was provided to link the environmental conditions with biological responses, including cellular, physiological, and pteropod population-level responses assessed through oxidative biomarkers, shell dissolution and growth, and abundance counts, respectively.
Altogether, there were 37 different stations at which biological parameters were measured. While the abundance data were collected on the entire set of 37 stations, the data with measured length frequency, shell dissolution, and oxidative stress were collected on a subset of the stations, i.e., 11 stations for each parameter (Supplementary Table S1 and Figure 2). Although stations were collected at different latitudes, we have excluded the latitudinal parameter from the RDA analyses for the variety of reasons. First, the unique variation explained by latitude that was not associated with the OA carbonate parameters. The loadings on the PC axes (Supplementary Figure S1) show a distinct separation of latitude on the second axis and the OA parameters on the first. Therefore, latitude does not confound the interpretation of pteropod responses to carbonate chemistry parameters. Second, all the latitude-related impact is mostly driven by temperature, and not OA (Supplementary Figure S1), and as such, latitude does not add anything to the interpretation of our correlations. In fact, there is a complete lack of mechanistic interpretation related to pteropod responses, mostly because of the third argument, i.e., compilation of all different parameters with indistinguishable nature of what they represent.
We recorded the diameter of the Limacina helicina organisms across the largest body length (Bednaršek et al., 2012b). Depending on the location, we recorded the lengths of a different number of organisms (N = 11 stations with 26 organisms on average) and calculated the average length based on all organisms measured per station (Figure 2).
To measure the impact on biomineralization, i.e., shell dissolution, all Limacina helicina individuals (N = 11 stations with 8 individuals on average) were examined for mechanical damage first, with only intact and actively swimming individuals considered for the analyses (Table 1). Following the protocol of Bednaršek et al. (2017a), the percentage of dissolution across the shell was determined and Type II and III damages were differentiated based on the classification scheme from Bednaršek et al. (2017a). Type II shell damage is related to the dissolution of the upper prismatic layer, while Type III is related to deeper-protruding dissolution of the crossed-lamellar layer. We also examined scarring on the shell; a pattern that visually resembles shell etchings and relates to the dissolution of the upper prismatic layer (Bednaršek et al., 2017a).
Immediately after sample collection, pteropods were flash-frozen with liquid nitrogen before being stored on dry ice (for transportation); they remained frozen at -80°C until we resumed the biomarker analysis. Samples from 11 stations were analyzed for oxidative stress (Figure 2). Each sample corresponded to approximately 20 organisms. At some locations with higher numbers of individuals in the sample, more replicates were taken (Table 1 and Supplementary Material).
For the determination of antioxidant defense and oxidative stress biomarkers, pteropod samples were homogenized in 0.1 M K2HPO4 + 0.15 M KCl buffer (pH 7.4) using a Tissue Lyser II bead mill (Qiagen). An aliquot of 25 μL of raw homogenate was immediately frozen in liquid nitrogen and stored at -80°C for analyses of lipid peroxidation (LPX). The rest of the sample homogenate was centrifuged for 15 min at 4°C and the supernatant was divided into aliquots for glutathione S-transferase (GST), glutathione reductase (GR), catalase (CAT), and superoxide dismutase (SOD) enzyme activity determination, oxygen radical absorbance capacity (ORAC) assay. For the latter, the sample was deproteinized by adding 5% sulfosalicylic acid, incubated on ice for 10 min and centrifuged for 10 min at 4°C. The supernatant was divided into two different tubes for reduced (GSH) and oxidized glutathione (GSSG), and 33 mM M2VP (1-methyl-2-vinylpyridinium trifluoromethanesulfonate, Sigma Chemicals) in 0.1 M HCl (a scavenger of GSH) was added to the GSSG sample in 1:10 proportion. The sample homogenate aliquots and glutathione samples were frozen in liquid nitrogen and stored at -80°C until further analysis.
The lipid hydroperoxides were measured by using the FOXII method described in Eymard and Genot (2003) and Bou et al. (2008) with slight modifications (cf. Vuori et al., 2015). The raw homogenates were mixed with methanol and centrifuged for 5 min at room temperature. 450 μL of the reaction mix (ferrous oxidation-xylenol orange) reagent was added to the samples (50 μL) and absorbance measured after 2 h of incubation. GST and GR activities were determined as described in Vuori et al. (2015). The SOD inhibition rate was measured using a SOD determination kit (Sigma Chemicals). The CAT activity was modified to microplate from the Catalase Assay kits’ colorimetric assay (Sigma Chemicals) (Vuori et al., 2012). The amount of GSH and GSSG was analyzed with Glutathione 384-well plate Fluorescent Detection Kit (Arbor Assays) and intracellular soluble antioxidant capacity with OxiSelectTM ORAC Activity Assay (Cell Biolabs) following the manufacturers’ instructions, except for adjusting the reaction volumes for 384-well plate when needed. The enzyme activities, lipid hydroperoxides, and total GSH were normalized to the protein content of the samples, which was determined with PierceTM BCA Protein Assay (Thermo Scientific) with bovine serum albumin (Sigma) as the standard.
All samples, standards, and blanks were analyzed in triplicate. For all assays performed in this study, the mean coefficient of variation percentage (CV%) of technical replicates ranged between 2.91 and 5.48%. Plate-to-plate variation was normalized with control samples, and it ranged between 3.97 and 14.73%. Only four biomarkers were modeled for synergistic effects based on significant correlations with environmental variables and to minimize the number of multiple comparisons. All biomarkers were evaluated for exploratory analysis, as explained below.
The selected approach for this analysis was to identify relationships among variables as potentially additive (positive or negative) or synergistic (interactions) by evaluating pairwise effects of stressors on each response measure. Several of the environmental variables were correlated, which presented a challenge for inferring causal relationships with pteropod response measures. To address this issue, the analysis was conducted in two stages, where the first was exploratory, and the second was a formal approach using a subset of the environmental variables to directly infer causation. The first set of analyses included all variables to demonstrate the complexity of the environmental dataset (Figures 4, 5) and provide the insights into multiple variables that co-vary, such as pH, pCO2, Ωar, and O2. To demonstrate the collinearity issues, we conducted first principal component axis of a PCA of all environmental variables (Supplementary Figure S1). Nearly 100% of the variance was described by the first three axes: axis one explained the following parameters pCO2, pH, O2, and Ωar, while axis 2 explained temperature and latitude, and axis 3 explained fluorescence. RDA also directly informed the second set of analyses, whereby variables associated with the response measures were further screened to reduce collinearity in subsequent models (see details below).
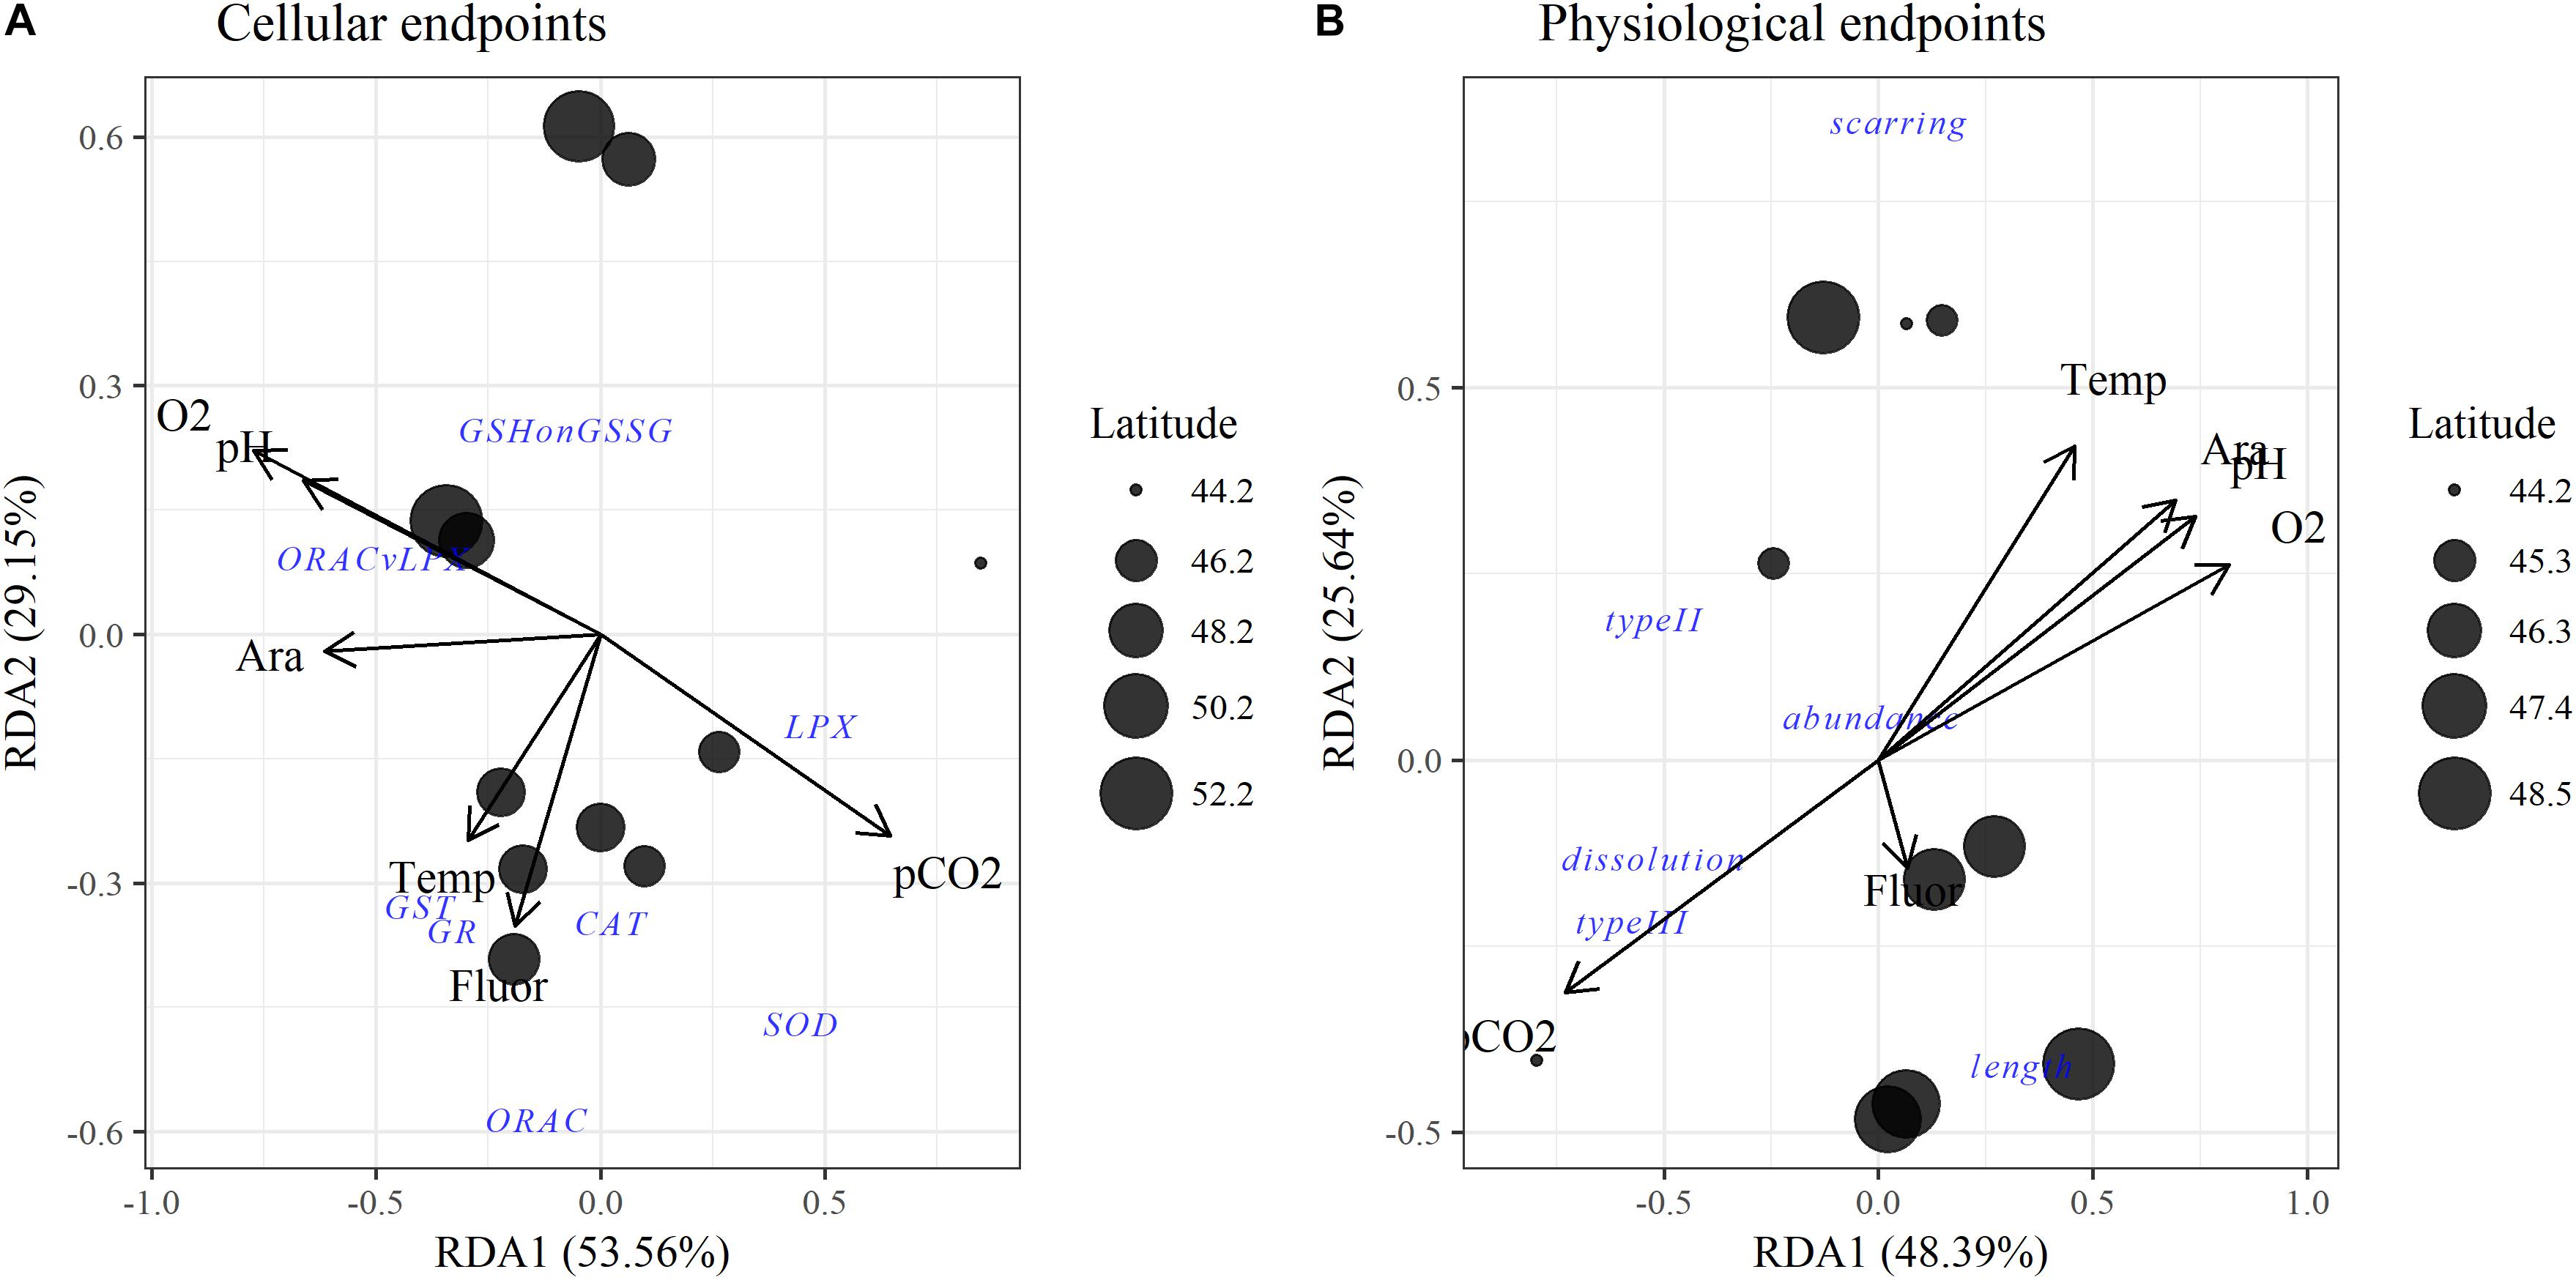
Figure 4. Redundancy analyses (RDAs) for environmental variables with pteropod (A) cellular and (B) physiological and population endpoints. Points are site locations in multivariate space with the size proportional to latitude. Separate RDAs were created for cellular and physiological endpoints because not all data were available across all stations. Ara, aragonite saturation state (Ωar). For abbreviations of oxidative biomarkers refer to Table 1.
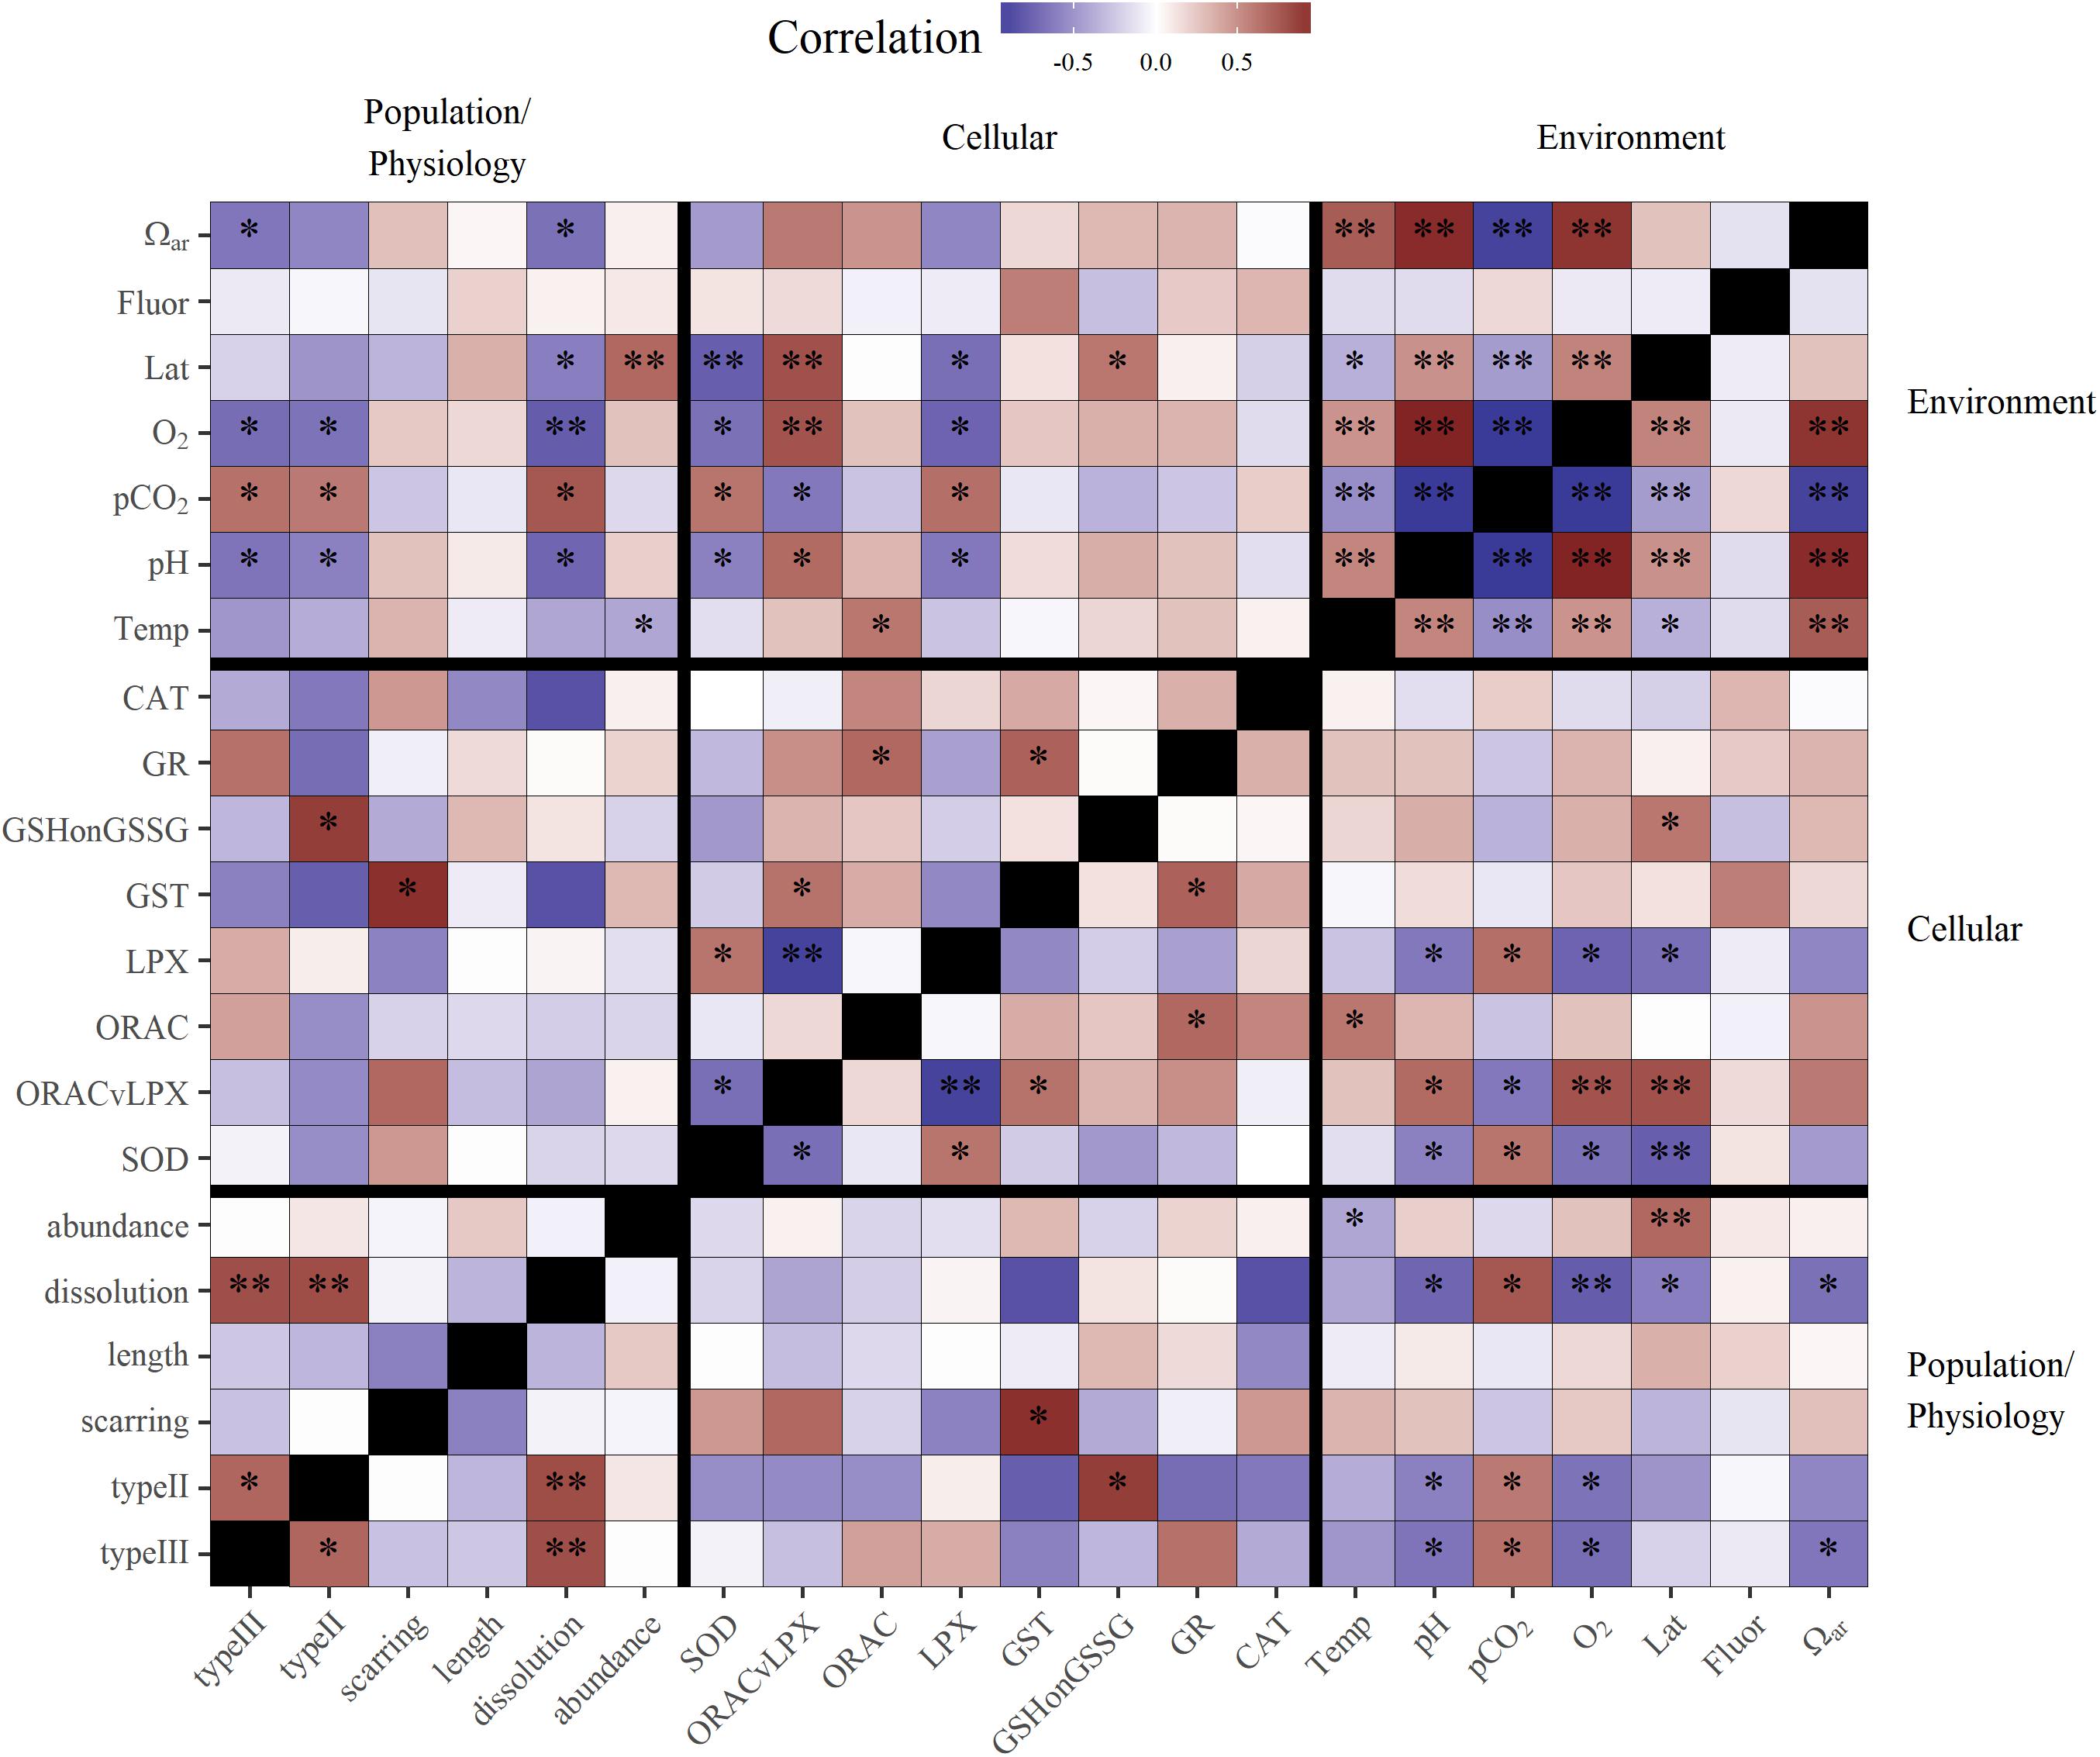
Figure 5. Correlation matrix of environmental variables, with cellular, physiological, and population response endpoints for pteropods. Darker red values are strong positive correlations and darker purple values are strong negative correlations. Significance values at alpha = 0.05 are shown by stars (p < 0.05∗, p < 0.01∗∗). For oxidative biomarker abbreviations refer to Table 1.
Pearson correlations of environmental parameters (carbonate chemistry related, temperature, and fluorescence) with cellular, physiological, and population responses were first evaluated to identify potential associations with individual variables. Correlations between cellular and physiological responses were also evaluated to identify links between the two levels of biological organization. Non-continuous or skewed variables were transformed to better satisfy assumptions of parametric tests (e.g., abundances were logarithmically transformed, proportions were arcsine transformed). All analyses were performed with the R statistical programming language (R Core Team, 2017).
Multivariate comparisons of all cellular response measures and environmental variables were assessed using redundancy analysis (RDA) to jointly characterize relationships between sampling stations. This analysis is conceptually similar to principal components analysis with an additional constraint on the environmental matrix, where the relationships are further partitioned based on covariance among response measures at each site in addition to the covariance between environmental variables. The final triplot (two biplots of environmental and response matrices) can be used to evaluate which environmental variables are correlated, as well as their relationships to the cellular response measures at each site. Prior to RDA, the environmental and response matrices were standardized to range from zero to one using the following equation:
where zi is the standardized variable for observation i, xi is the raw variable for observation i, and min(x) and max(x) are the minimum and maximum values for the variable x. The vegan package for R was used for standardization and RDA (Oksanen et al., 2017).
The second set of analyses used linear models for pairwise combinations of environmental variables to evaluate additive and interactive effects on stressor response. To reduce the likelihood of false positive results from multiple comparisons, variables were chosen a priori that were considered most relevant for describing pteropod response to stressors using results from the exploratory comparisons above. Only LPX, ORAC, and SOD biomarkers were evaluated for cellular response, and only abundance, dissolution, and length were evaluated for biomineralization and physiological and population responses. Environmental variables were selected for analysis that were orthogonal in multivariate space to reduce collinearity and included Ωar, fluorescence, pCO2, and temperature. Oxygen and Ωar were evaluated for relationships with biomineralization and physiological and population response measures. Variance inflation factors (VIFs) were quantified for all pairwise combinations of environmental variables to estimate potential collinearity in each model, such that:
where, VIF is the reciprocal of the unexplained variance (1 -R2) of the linear regression of variable j against all other explanatory variables. Zuur et al. (2007) suggest that VIF values less than 50 may be appropriate for analysis, but we chose a value of 5 for excluding combinations of environmental variables. We chose this conservative value to further reduce the potential for false positive results by reducing the number of combinations that were evaluated, in addition to reducing the likelihood of spurious results from collinear explanatory variables.
Linear models for the selected pairwise combinations of environmental variables and response measures included separate terms for the main effects of individual variables and a third term for the interaction of the pair. A model selection procedure was then used to compare every smaller subset of the global model (main and interactive effects) to identify the most parsimonious solution for each pair. The final model for each pairwise combination was chosen based on a minimization of corrected Akaike Information Criterion (Burnham and Anderson, 2002; Barton, 2018). Further, models with probability values greater than alpha of 0.05 for the overall model fit were excluded. These p-values were not adjusted for multiple comparisons due to the relatively small sample sizes of each model (N = 11 for all, except N = 37 for abundance).
Evidence for additive effects were based solely on the magnitude of the estimated parameter of the main effect for each variable, whereas synergistic or antagonistic effects were evaluated from the estimated parameter for the interaction, if demonstrated. A positive interaction was evidence of a synergistic effect and a negative interaction was evidence of an antagonistic effect. Results of the linear models were further evaluated using effects plots to characterize the relationship of a pteropod response measure to continuous values for one driver, given two different values for the second driver (constant at the minimum and maximum observed values).
The MHW and the El Niño left a characteristic physical–chemical signature in the investigated region, with uniform increase in temperature across the large-scale region stretching from Queen Charlotte Sound in Canada to northern Oregon. The sea surface temperature anomaly of approximately 1–1.5°C from the usual baseline was observed in the upper 50–80 m, with surface temperatures ranging from 12 to 15°C off southern Oregon to 10 to 12°C off British Columbia at the time of the West Coast cruise in 2016. Pteropods were collected across strong temperature and Ωar, pH, and pCO2 gradients with differential degrees of interaction, depending on location. Near the end of El Niño, the onset of increased upwelling added a spatial complexity with respect to carbonate chemistry. The region off northern California and southern Oregon was under the strong influence of the combined stressors of warming, low Ωar, and deoxygenation (Figure 3). Associated with these events were higher than normal aragonite saturation values in Washington, Oregon, and British Columbia in near-surface waters, and normal to lower-than-normal aragonite saturation and low oxygen values in the subsurface waters near the coast off Washington and Oregon (but less so off the coast of British Columbia). Aragonite state saturation horizon (Ωar = 1) was positioned at shallow water depths of approximately 40–80 m at mid-shelf in northern California, Oregon, and Washington coastal regions and gradually deepened northward to about 120–150 m in Canadian waters (Figure 3). Although to a much lesser extent, upwelling induced a regionally specific decline in oxygen, with oxygen concentrations <100 μmol kg-1 occurring off the Oregon and Washington coasts but not as low farther north. With the general increase in temperature across the entire region, there were unique regional Ωar, pH, and pCO2 vertical gradients, with the most severe in the south (northern California, Oregon, and Washington) gradually decreasing to the north. These gradients were strong from deep water to shallow water depths within the upper 100 m, overlapping with pteropod vertical habitat and the depth of their collection.
The multiple stressor interactions in these environmental stresses are defined by high collinearity, as depicted on the RDA plot of the upper 100 m (Figures 4A,B). The two main components explained, in total, around ∼75% of the observed variance in the RDA, i.e., 53.6% of Component 1 and 29.2% of Component 2 for the cellular RDA; 48.4% of Component 1 and 25.6% of Component 2 of the physiological RDA. While carbonate chemistry parameters (pH, Ωar, pCO2) and oxygen are all highly correlated, as demonstrated by their loadings along the RDA1 axis, temperature shows higher loading along the RDA2 taxis, and thus less correlation with carbonate chemistry parameters (Figure 4A). Food availability (measured as fluorescence) was not correlated with any of the environmental parameters.
Biomarkers of pteropod organismal stress showed the highest cellular stress present in the south and a gradual decrease northward. LPX and GSH:GSSG (reduced oxidized glutathione ratio), both biomarkers related to cellular damage, showed significant association with latitude and the stress response (increase in LPX and GSH:GSSG) increasing southward (Table 1 and Figure 5). Additionally, the overall cumulative stress marker (ORAC/LPX; i.e., cellular toxicity compensated by antioxidative marker, with low ORAC/LPX indicating increased oxidative stress) was the highest under co-occurring conditions of Ωar, pH, and pCO2 stress in the south, while its significance decreased under less severe stressors in the north. Correspondingly, the highest antioxidative defense was observed through increased SOD levels, with values significantly higher in the south than in the north and negative correlations with LPX and ORAC/LPX.
Increased temperature (i.e., thermal stress) is strongly associated with metabolic pathways related to increased antioxidative activity. The results demonstrated the highest positive correlation with ORAC (Figure 5), while the other antioxidative biomarkers showed positive, yet insignificant correlations. On the other hand, thermal stress does not activate the same biomarkers as carbonate chemistry stress, as shown by the lack of correlation between ORAC and pH. Based on the measured cellular toxicity parameters (i.e., LPX, ORAC/LPX, GSH:GSSG), temperature did not trigger oxidative stress but it was significantly important when it co-occurred with the other stressors (described below). Given that ORAC was not significantly correlated with latitude confirmed a uniform warming signal along the entire region related to the El Niño event.
Carbonate chemistry stress was associated with significant activation of oxidative stress biomarkers, as indicated by the increased levels of LPX (Figure 5) at low pH. This is indicative of cellular damage because LPX is the first line of evidence of cellular oxidative stress. Accordingly, the cumulative cellular stress level, as indicated by a low ORAC/LPX ratio, is also significantly correlated with carbonate chemistry stress (Figure 5). The only antioxidative pathway activated under low pH was the increased expression of the SOD biomarker. Low oxygen in combination with carbonate chemistry stress is also associated with oxidative stress, and in a cumulative manner activates cellular damage pathways (Figure 5), as indicated by a negative correlation with LPX and positive correlation with ORAC/LPX.
The effect of co-occurring stressors on the cellular responses is additive, with no demonstrated interactions between the drivers. The negative impact of carbonate chemistry parameters (low Ωar, low pH, and high pCO2) and deoxygenation can be mediated by temperature and fluorescence, where the direction of stressor effect might be different under multiple-stressor scenario.
There are several additive and mediating effects of multiple drivers on LPX. First, the combination of Ωar and thermal stress indicated a positive additive effect, with higher temperature (thermal stress) enhancing LPX toxicity as experienced under low Ωar (R2= 0.5; model 2; Table 2 and Figure 6A). Although the individual correlations of LPX with Ωar and temperature showed that LPX decreases with an increase in both, temperature has an inverse effect when modeled together with Ωar, with lower temperature reducing LPX toxicity. Temperature-mediated effects on cellular stress occurred even at slight temperature decreases of 2–3°C within the temperature range they experience in the natural environment. Second, fluorescence also demonstrated an additive effect with pCO2 and pH, with high fluorescence offsetting the LPX effect (R2= 0.72 and R2= 0.65, respectively; models 1 and 4, Table 2 and Figure 6B). Third, fluorescence displayed a similar mediating effect on LPX in combination with reduced oxygen concentrations (R2= 0.74; model 3; Table 2 and Figure 6B). Similar additive effects were also demonstrated for the cumulate stress effect (ORAC/LPX) ratio under various combinations of carbonate drivers and oxygen, mediated by high fluorescence and low temperature (Table 2).
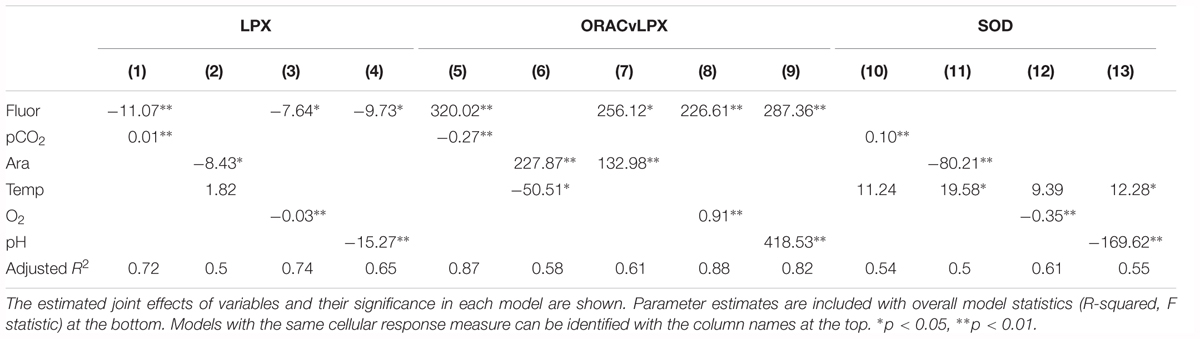
Table 2. Model results for pteropod cellular response to pairs of co-occurring environmental variables.
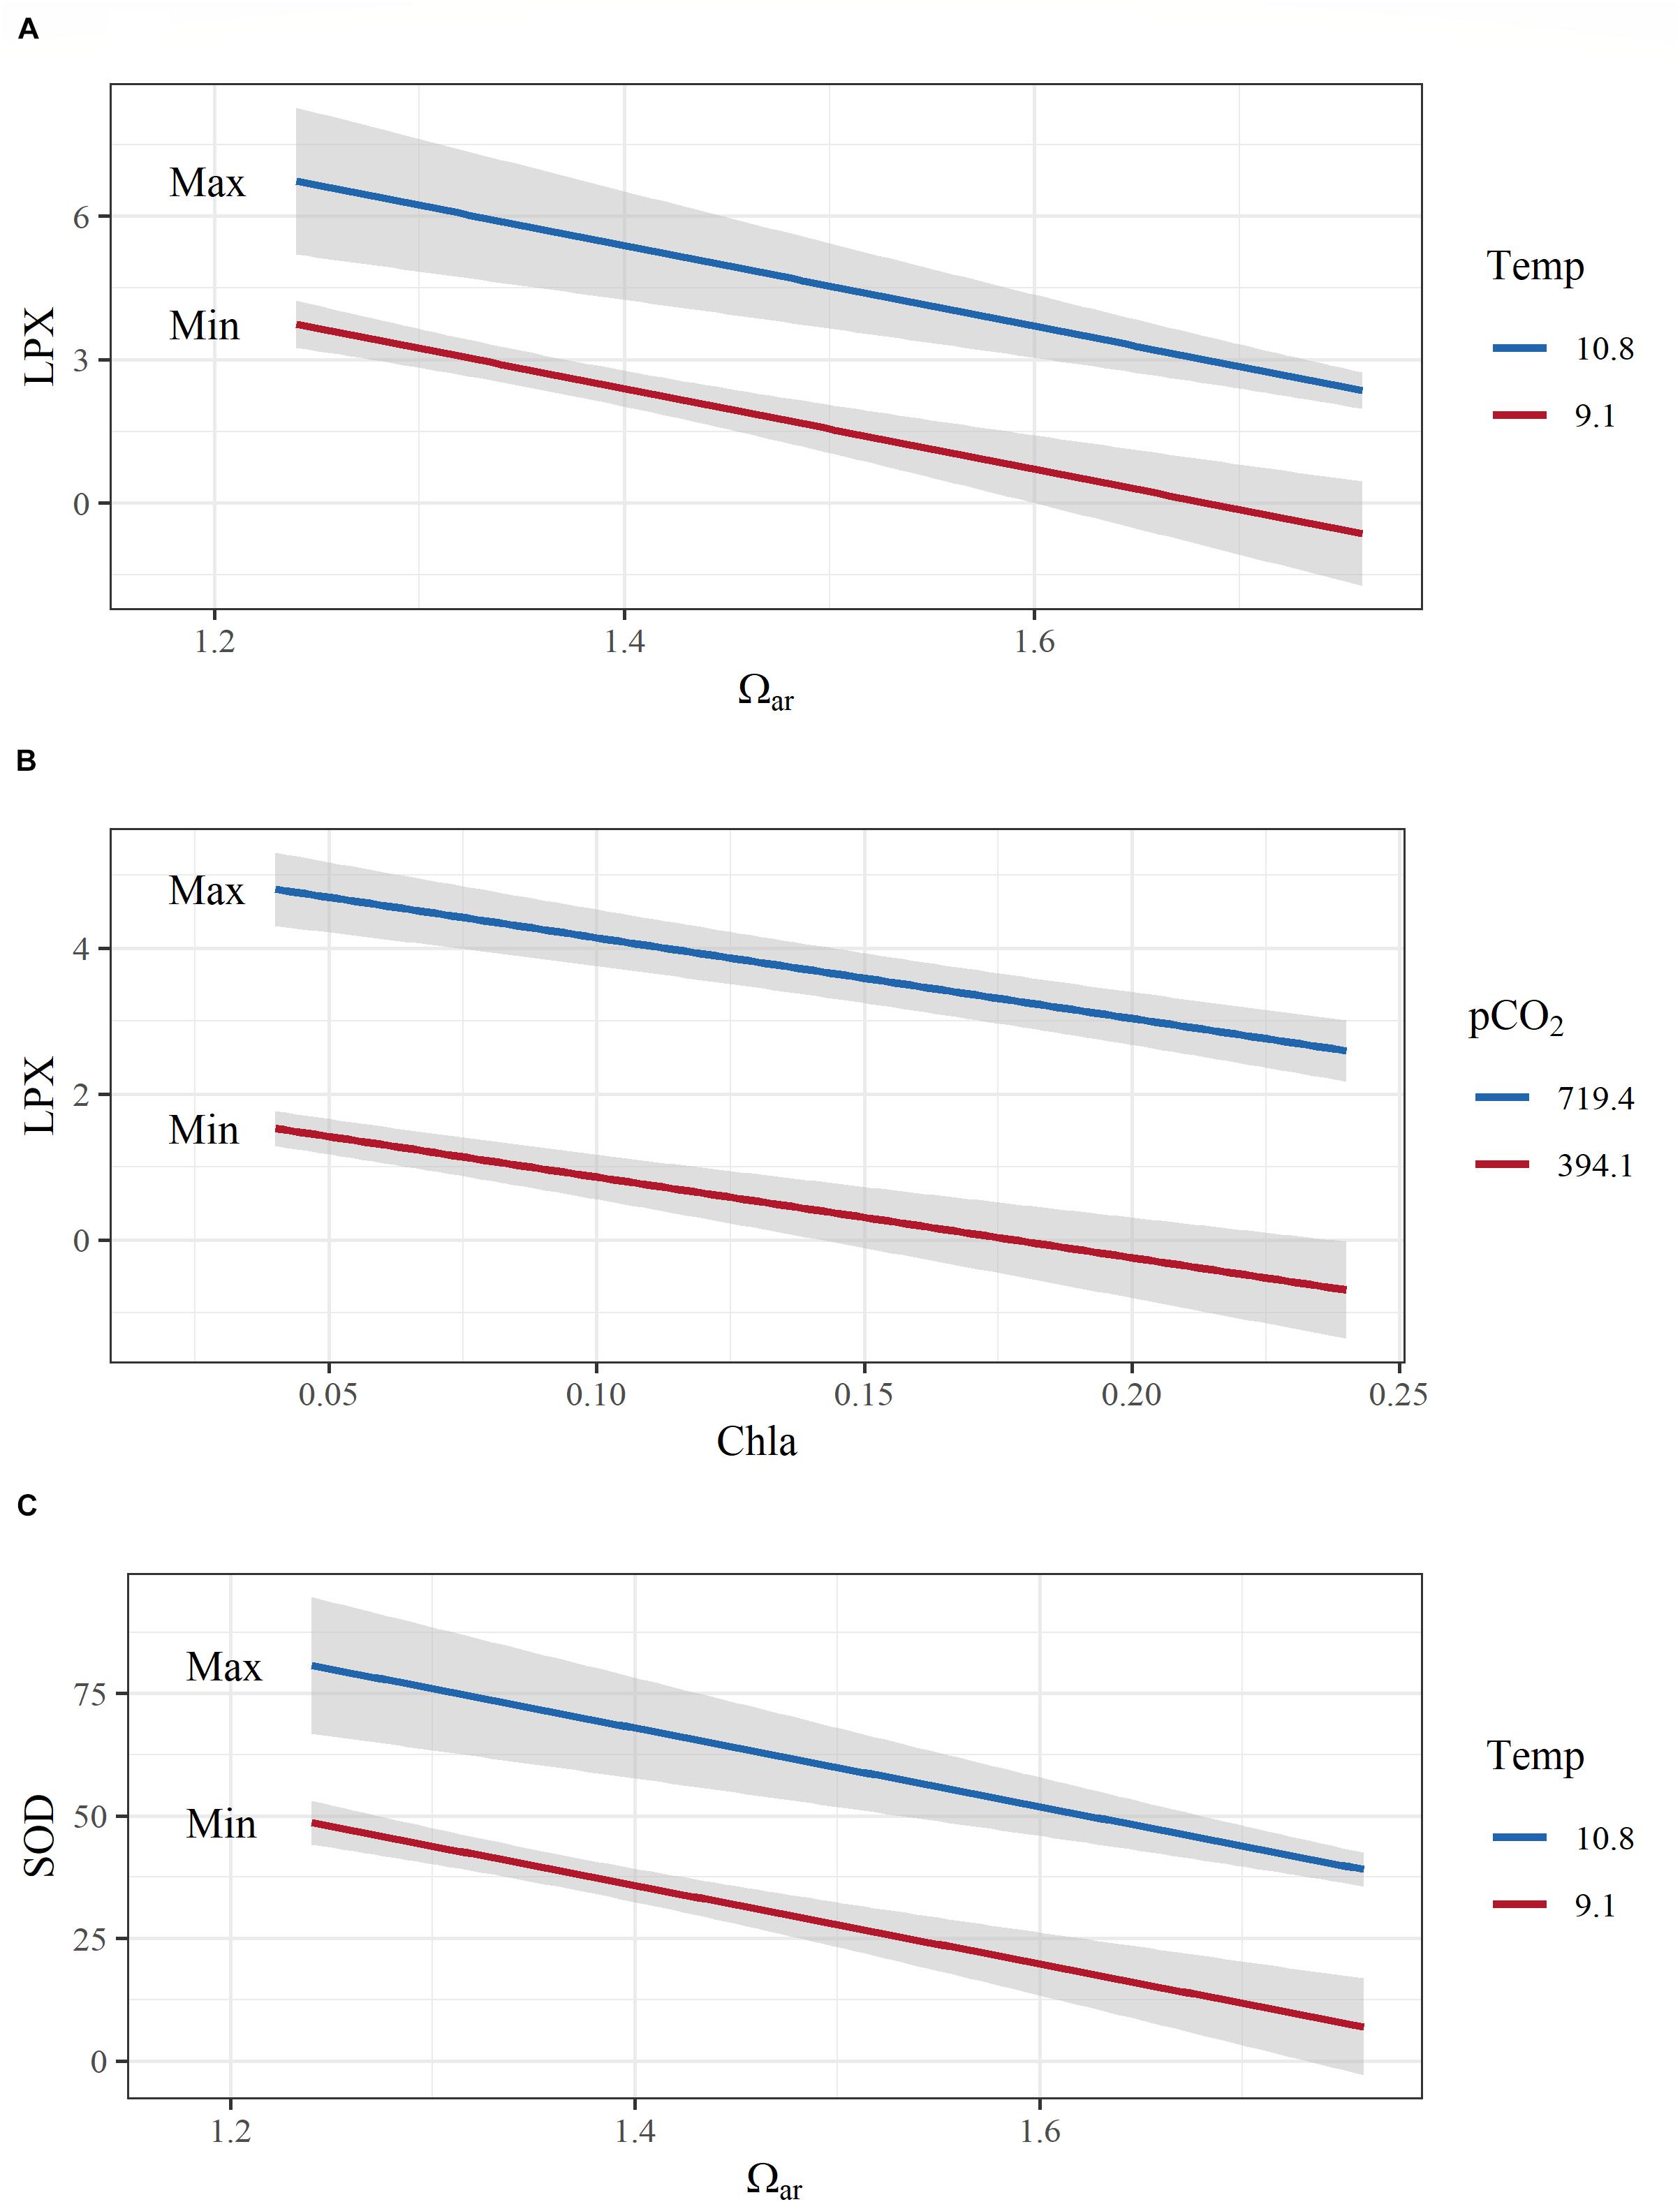
Figure 6. Examples of model interactions of co-occurring environmental variables on pteropod cellular responses. (A) A negative additive effect between aragonite saturation state (Ωar) and temperature on cellular toxicity (lipid peroxidation; LPX); (B) negative additive effects of fluorescence and pCO2 on LPX; (C) positive additive effects of temperature and Ωar on antioxidative activity (sodium dismutase, SOD). Both y-axes are transformed to conform to model output. Covarying environmental variables were held constant at the minimum and maximum values in the observed data. Color range depicts the max and min values of the observed parameters.
Given SOD antioxidative properties, its activation is triggered by unfavorable conditions (low pH, high pCO2, and low oxygen), and additively enhanced under the co-occurrence of multiple stressors, such as increased temperature with low Ωar and low pH (R2= 0.5 and 0.55, respectively; Table 2 and Figure 6C). In addition, thermal stress in combination with low oxygen also intensified antioxidative production (R2= 0.61; Table 2). Fluorescence did not have any mediating effect on the SOD activity, either alone or in combination with an additional driver.
In contrast to the cellular level, some multiple stressor effects on the physiological level demonstrate interactions, in addition to additive effects. For example, the interaction between thermal stress and low Ωar and oxygen synergistically increased a negative physiological effect, i.e., biomineralization. The population-level effects were additive, with low temperatures mediating negative effects of pH, Ωar, and oxygen.
Biomineralization, which was measured as shell dissolution (dissolution extent of Type II and III damage), showed a strong negative correlation with Ωar, the main driver of shell dissolution (Figure 5). While shell scarring was positively but not significantly correlated with thermal stress (Figure 3), this was not the case for shell dissolution, where no correlation was observed. In addition, increased fluorescence can mediate the negative effect of increased pCO2 on shell dissolution (R2 = 0.71; Table 3).
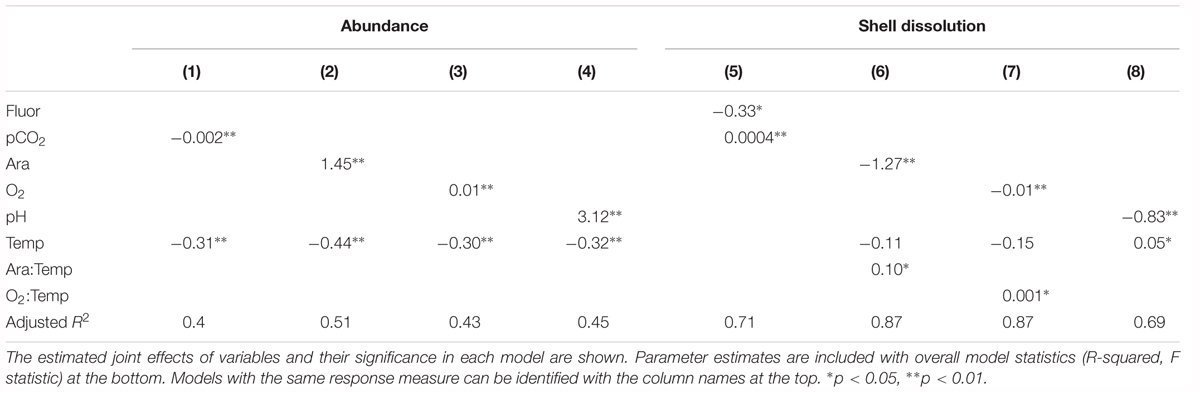
Table 3. Model results for physiological and abundance responses to pairs of co-occurring environmental variables.
Interactive effects (Ωar:T, R2= 0.87; model 6, Table 3 and Figures 7A,B) demonstrated that the co-occurrence of T and Ωar synergistically increased dissolution. The effect is magnified at higher Ωar (Ωar > 1.3) where thermal stress can increase dissolution. At biologically relevant low Ωar (Ωar < 1), the temperature effect is not significant and does not contribute additionally to shell dissolution. The lack of this interaction is important for consideration of dissolution processes at greater depths where both low Ωar and low T co-occur (Figure 7A). On the other hand, the interactive effect of oxygen and temperature (O2:T, R2= 0.87; model 7, Table 3 and Figure 7B) on biomineralization is amplified at low temperature and low oxygen. Low oxygen concentrations do not significant affect physiological processes at higher temperatures. This indicates greater physiological vulnerability, especially at deeper depth, when deoxygenation co-occurs with low temperature. While oxygen and temperature do not directly impact shell dissolution, this synergistic interaction might indirectly impact biomineralization activity through an overall physiological scope, ultimately resulting in increased dissolution.
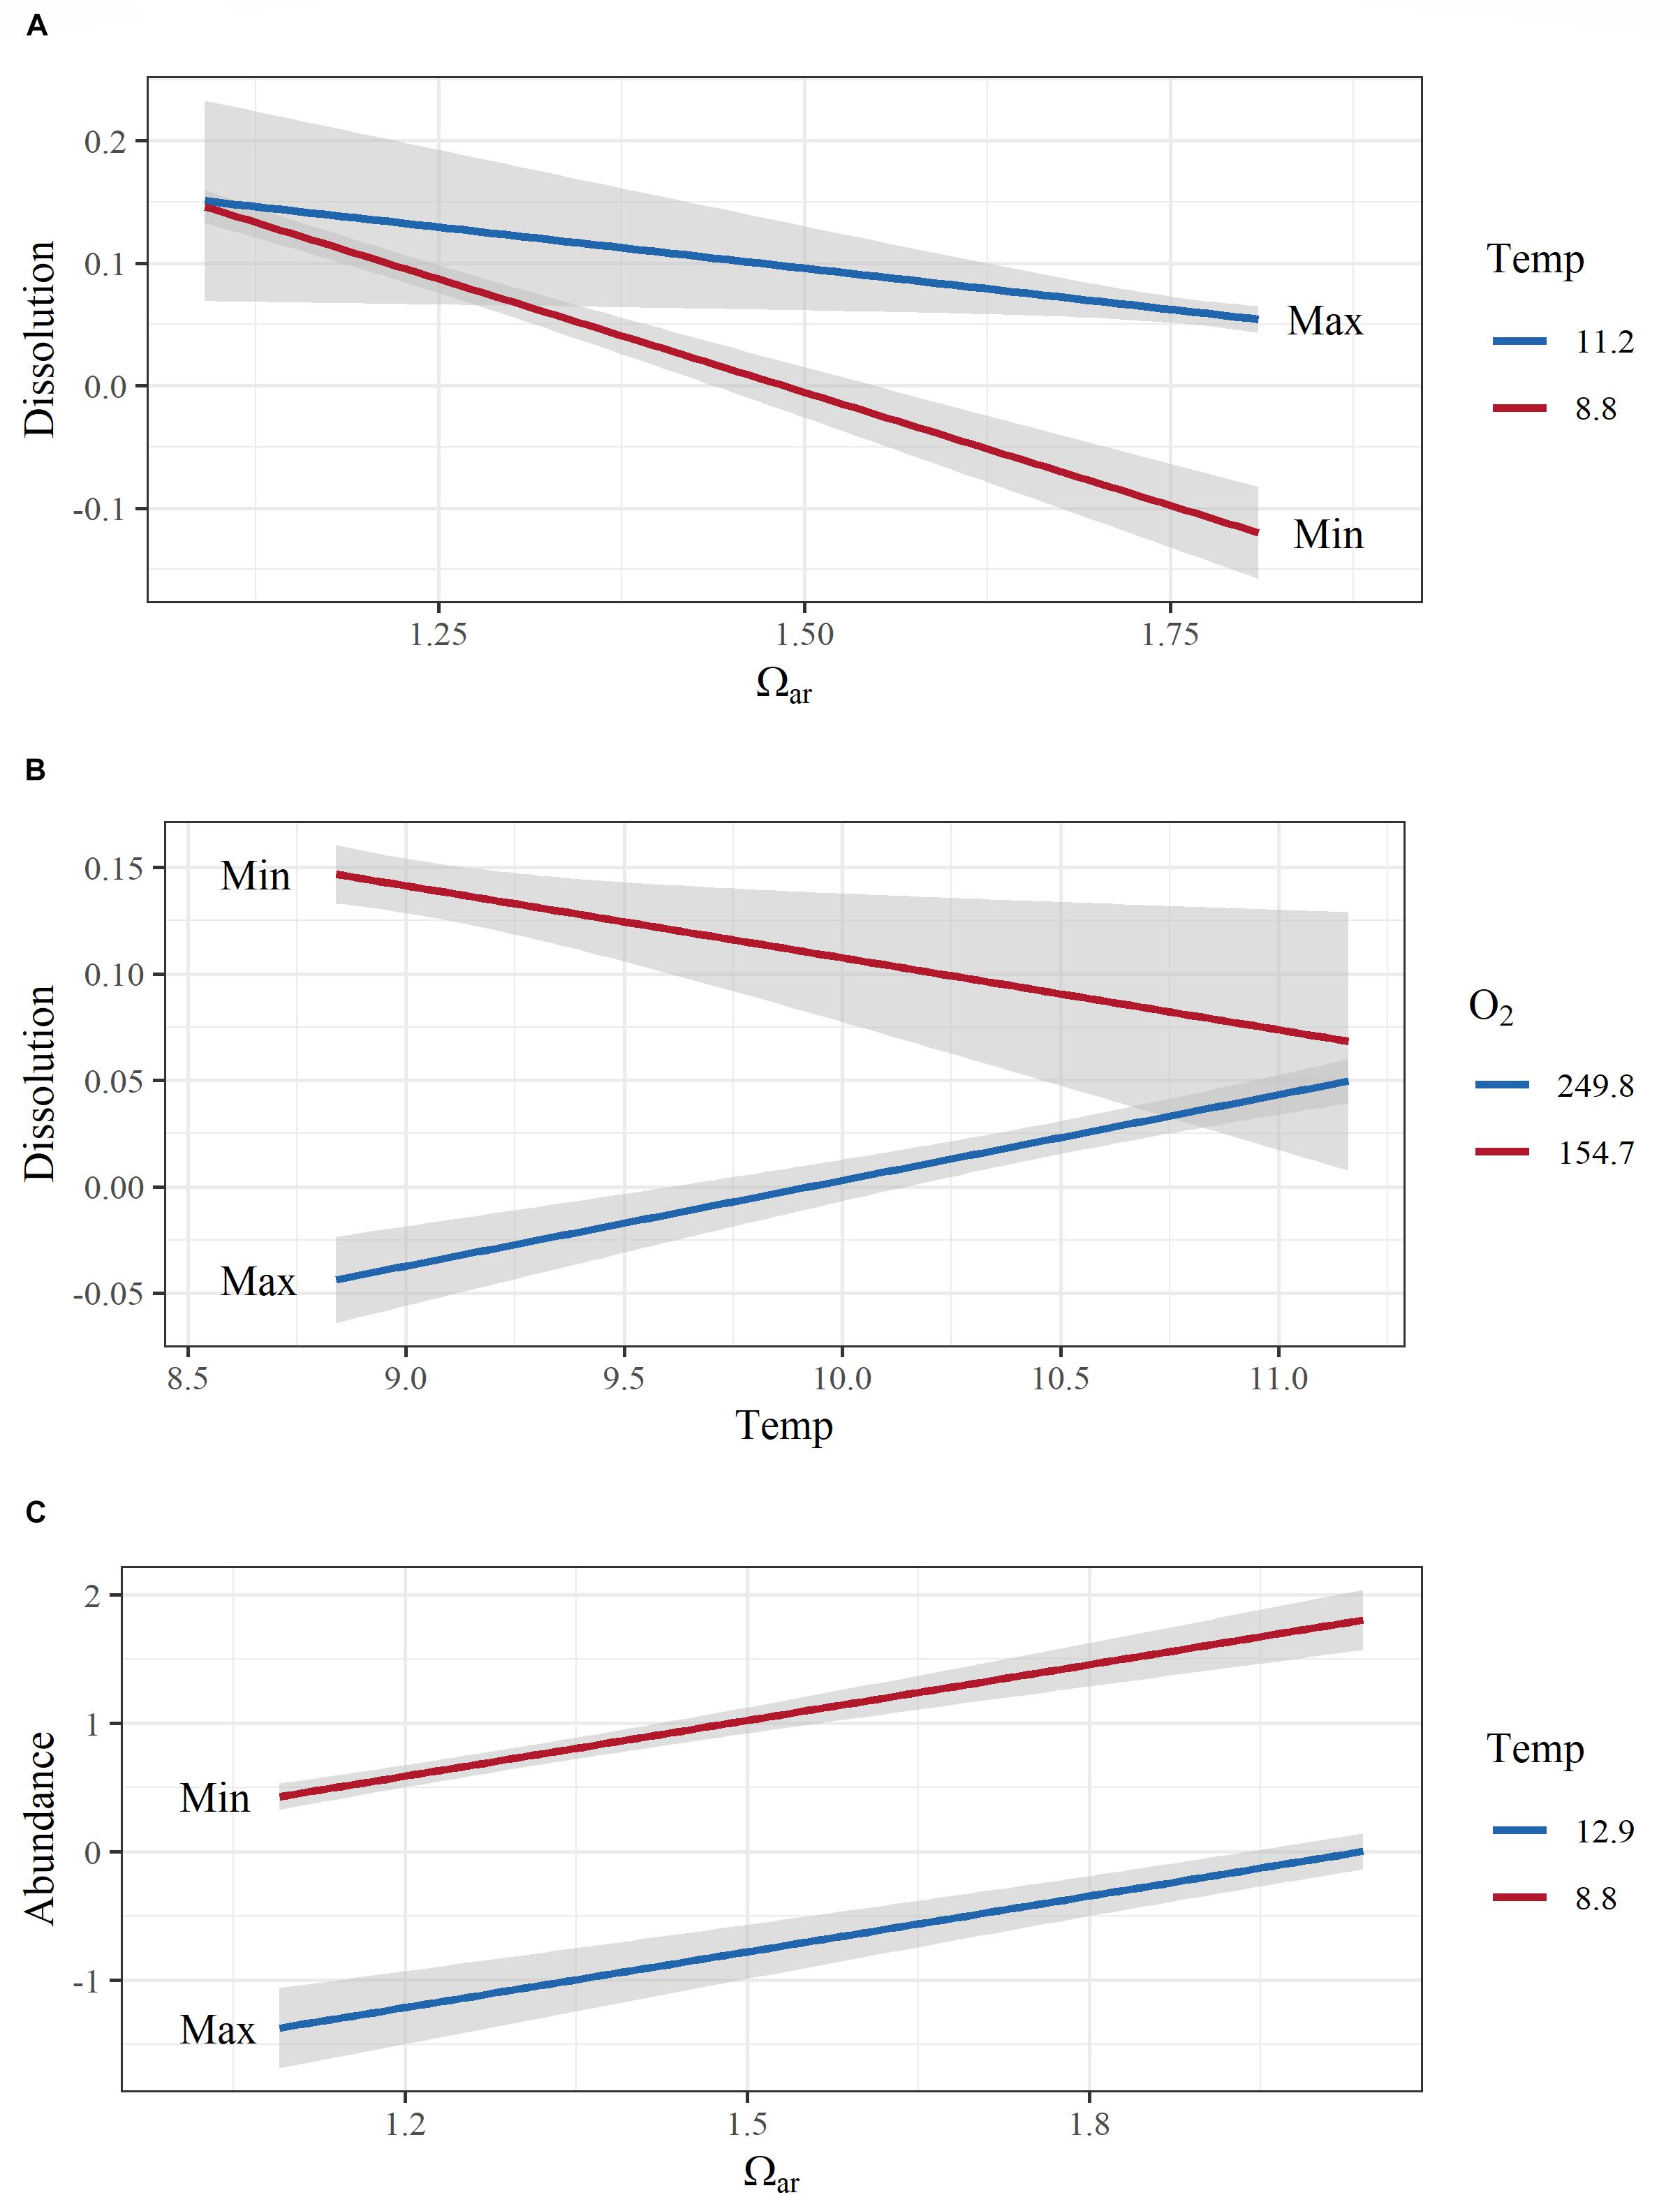
Figure 7. Model interactions and additive effects of co-occurring environmental variables with biomineralization (shell dissolution) and population (abundance) responses. Interactive effects between aragonite saturation state (Ωar) and temperature on biomineralization (shell dissolution) are shown in (A), temperature and O2 on dissolution in (B), and the additive effect of temperature and Ωar on abundance in (C). All y-axes are transformed to conform to model output. Covarying environmental variables were held constant at the minimum and maximum values in the observed data. Color range depicts the max and min values of the observed parameters.
In terms of the correlation between cellular and physiological endpoints, increased shell dissolution and scarring corresponded positively with cellular stress (GSH:GSSG, OPAC/LPX), and negatively with the majority of biomarkers of antioxidative activity, except GST biomarkers (Figure 5).
Growth (measured as length diameter) did not show a significant correlation to any environmental parameters, but was negatively correlated with shell dissolution and scarring, indicating decreased growth coinciding with the presence of shell dissolution (Figure 5). Fluorescence did not have any significant additive effect on growth, making it a comparatively less important variable.
Pteropod abundance, which exemplified population-level effects, showed significant negative correlation with temperature (Figure 5). Additive effects were observed when thermal stress co-occurred with the carbonate chemistry parameters (pH, Ωar, or pCO2) and deoxygenation (models 1–4; Table 3), but there were no interactions between the multiple drivers. The additive effect of two stressors (e.g., low Ωar or low oxygen and thermal stress) resulted in significantly lower abundances compared to high Ωar or high oxygen at increased temperatures (Table 3 and Figure 7C), demonstrating a multiple stressor sensitivity at the population level. Fluorescence did not show any additive effect on abundance with any stressors.
El Niño has been known to leave a characteristic imprint of thermal stress on the coastal and near-shore habitats of the CCS, with implications for the coastal ecosystems and fisheries management (Chavez et al., 2018). However, less is known about ecological responses when El Niño overlaps with springtime intensification of an upwelling event, impacting habitats across wider spatial scales and lasting for several months. During this period, coastal and near-shore habitats are exposed to multiple driver dynamics that can compromise the suitability of habitats, especially in coastal ecosystems. The overlap of El Niño and upwelling also affects oxygen distribution, with regionally low oxygen concentrations that act as a third driver on biological responses. Because the thermal stress includes the impact of the preceding MHW, the results of this study carry implications that are directly relevant to future climate change effects in the EBUS. Not only does it demonstrate the wide range of conditions that EBUS will be experiencing in the near future (Gruber et al., 2012; Hauri et al., 2013; Bakun et al., 2015; Turi et al., 2016), but it delineates the interactions between multiple stressors that will often have the most significant ecological implications.
This is one of the first synoptic studies of pteropod responses under in situ multiple drivers, as created during overlapping El Niño and upwelling, inducing low pH, low Ωar, and deoxygenation in the CCS. El Niño can drive important negative responses across several levels of biological organization. While increased food availability and lower temperature can mediate negative impacts of low Ωar and pH, these mitigating effects are absent during El Niño years and MHW, and under intensifying effects of climate change, resulting in more severe biological implications.
During these events, the species are affected by multiple adverse pathways acutely affecting cellular and physiological responses, including internal acidosis, hypercapnia, metabolic depression, reduced oxygen supply and anaerobiosis, and thermal stress (Pörtner, 2008). In general, individual correlations are rarely descriptive (i.e., correlation does not mean causation); thus, examining a combination of two effects supports a mechanistic underpinning under realistic, in situ conditions. It is very likely that various combinations of carbonate chemistry parameters (pH, pCO2, and Ωar) activate different cellular pathways at the same time. Given that thermal stress elicits different antioxidative biomarkers than low pH- and Ωar associated stress (ORAC and SOD, respectively), this supports the notion that both drivers activate different cellular pathways. Based on cellular and population-level responses, low pH, low Ωar, and deoxygenation activate similar oxidative damage pathways and antioxidative defense. Moreover, interactions with thermal stress at low Ωar and deoxygenation were particularly significant in inducing enhanced negative biomineralization effects; this requires a more extensive study beyond the scope of this paper. The combination of carbonate chemistry stress with oxygen appears to be a significant predictor of biological responses and should be considered in interaction with thermal stress on the physiological and population levels. This calls for future in-depth studies of deoxygenation with other stressors on pteropods.
In this study, we found the magnitude of overall stress conditions to be reflected through various cellular, biomineralization, and physiological responses. This suggests that unfavorable conditions probably remained mainly uncompensated in the southern part of the study region, although pteropods from this region reallocated more antioxidative efforts to compensate against stress than their northern counterparts. This is likely due to a deficiency of antioxidative response activity resulting from either insufficient expression or inefficiency of antioxidative defenses (Matozzo et al., 2013), possibly linked to shutting down of energy-consuming processes under severe low Ωar/pH stress.
At the population level, temperature was the main driver of abundance distribution, with a suite of various carbonate chemistry parameters acting as a strong driver, but one of secondary importance. Additive effects of low pH, low Ωar, and deoxygenation with thermal stress on abundance clearly suggest that El Niño has a negative effect at the population level. It is likely that long-lasting (2–3 years) thermal stress was carried through at least 2–3 generations, given that pteropods along the West Coast live for approximately 1–1.5 years. However, given that the warm water effect was latitudinally spread over the entire United States West Coast in a fairly consistent way, both spatially and in their anomalies, we predict that transgenerational exposure was uniformly applicable for the majority of the United States West Coast pteropod populations.
At the cellular and physiological level, however, we observed a remarkable shift from temperature to low pH and low Ωar-driven responses. The upwelling-induced low Ωar/pH conditions elicit similarly high levels of cellular stress and damage, as preliminarily demonstrated by Koh et al. (2015), and can resonate on physiological levels. At the cellular level, the action mode of low Ωar and pH elicits an excess in ROS production. This subsequently activates different oxidative damage pathways that result in a negative capacity for ATP production (Abele et al., 2002) and significant damage to lipids (Monaghan et al., 2009). These mechanisms are conservative across a diverse group of organisms, including mammals, plants, and fungi (Quirós et al., 2014, 2015; Pinti et al., 2015). ROS-targeted LPX is mainly induced in lipids with polyunsaturated fatty acid (PUFA) bonds, which are more susceptible to LPX than monounsaturated or saturated fatty acids. The amount of PUFA can impact the extent of oxidative damage (Hulbert et al., 2007). Across different pteropod life stages as much as 60–80% of structural lipids and triacylglycerols are predominantly composed of PUFAs (Gannefors et al., 2005), so they are easily targeted by ROS. LPX might have double negative implications for organisms: First, PUFA sensitivity to LPX results in their decrease (Yin and Pörter, 2003), leaving organisms without the essential lipid structure and reserves. Second, LPX increases ROS-induced structural damage of cell membranes (Bou et al., 2008), as demonstrated by the activation of genes involved in membrane processes (Koh et al., 2015).
Food quality has a major effect on the transfer of energy and matter in food webs, and essential long-chained PUFAs can affect the quality of zooplankton as food (Persson and Vrede, 2006). where PUFA has been shown to be critical for normal larval development and survival across many fish species (Izquierdo et al., 2000). As such, pteropods under low pH, Ωar conditions in combination with elevated temperatures may be a sub-optimal food source for many fish species, including juvenile salmonids. These species would then have to predate more heavily on other zooplankton to consume sufficient PUFA content, to reduce the risk of developmental delays. In a recent comparative study, multiple stressors affected pteropods significantly more than copepods, pelagic non-calcifiers that show much lower cellular stress levels than calcifying mollusks. The top-down effect of changing the prey items with sufficient PUFA may have repercussions down the food web.
In the perpetual process of cellular damage, even more ROS are generated, aiming at proteins as their next targets. Accumulation of the oxidative damage under exposure to stress thus requires metabolic compensation to recover the energetic costs of the antioxidative activity, stress protein expression, and the activation of protein degradation pathways (Tomanek, 2011; Sokolova et al., 2012), which is one of the most expensive ATP sinks in the cells (Hochachka and Somero, 2002). In mollusks, for example, energy costs of protein synthesis can increase from 10% during control conditions to as much as 40% during extreme stress (Ivanina et al., 2008), or 10–25% of total ATP consumption (Cherkasov et al., 2006).
Various studies agree that the extreme sensitivity of pteropods to low Ωar, low pH stress is related to their energetics metabolism, pointing toward the trade-off processes underlined by their insufficient energy budget (e.g., Lischka and Riebesell, 2012, 2017; Seibel et al., 2012; Bednaršek et al., 2016b; Peck et al., 2018). Based on the numerous lines of evidence, and as previously demonstrated for numerous other taxa (Lesser, 2006; Ivanina and Sokolova, 2016; Ivanina et al., 2016), oxidative stress biomarkers offer important insights into bioenergetic requirements for pteropods under exposure to multiple stressors. Therefore, assessing oxidative stress as it relates to multiple stressors offers an opportunity to link early warning stress effects and bioenergetics, and predict effects beyond the cellular level. To establish the link between the stress and bioenergetics, it is necessary to take food availability into account because it can directly impact organism’s bioenergetics status, where no longer limiting energy budget can be restructured in a way to invest increased energy resources into mediating detrimental effect of stressor toxicity. For example, we observed that food availability is important factor to reduce the LPX toxicity associated with carbonate chemistry parameters (pCO2 and pH) and low oxygen; as well as decreasing shell dissolution, however, it did not have the effects on antioxidative activity or abundance.
Here, we attempt to demonstrate how increased oxidative stress on the cellular level could impose energetic trade-offs, with implications for organismal fitness. Cumulatively, our evidence suggests the potential for oxidative stress impacting life history trade-offs that could manifest over different timescales. On short timescales, increased toxicity coupled with altered energetic demand due to increased maintenance costs (Wood et al., 2008; Moya et al., 2016) and down-regulation of aerobic metabolism (Maas et al., 2015) would imply lower energy allocations and carry-over energetic trade-offs under a multiple stressor scenario. This presumption indeed agrees with our observations of increased shell dissolution as related to reduced antioxidative activity and growth. Regarding the former, shell dissolution is positively correlated with cellular stress biomarkers; thus, we expected an increase in antioxidative activity. Instead, we observed reduced levels of antioxidative biomarkers. While none of the correlations with cellular endpoints were significant, some trends were observed; in particular, negative correlations with GST and CAT. This most likely implies an insufficient energetic budget for the support of energetically expensive antioxidative production (Monaghan et al., 2009). This is additionally supported by the negative correlation between shell dissolution and growth, as previously demonstrated by Lischka et al. (2011).
On population-level timescales, there may be longer-term trade-offs in biological functions. Our supposition from the physiological level predicts a carry-over effect on the population structure, but without an immediate knock-on effect. None of the cellular biomarkers or physiological endpoints were significantly correlated with abundances, although a negative correlation in LPX abundance indicates a potential trend linking cellular and population levels. However, the lack of correlation does not mean that other life history components are not already compromised (e.g., growth, fitness). Although cellular or physiological effects cannot be immediately extrapolated to the population level, the costs of energetic requirements potentially could be paid by reduced reproductive potential and would be demonstrated over longer timescales. Advancing from physiological to population-level effects is obviously marked by complexities that require further understanding and biomarker studies correlated with prolonged exposures. However, a strong correlation of multiple drivers with cellular responses make pteropods strong candidate indicators for cumulative effects (Bednaršek et al., 2016a). This is supported by studies in which multiple driver effects have been linked to pteropod long-term population declines in the North Atlantic (Beaugrand et al., 2013) and the North Sea (Beare et al., 2013).
The question thus remains how pteropods can thrive in high abundances in various upwelling regimes (Bednaršek et al., 2017a) when low pH and Ωar conditions display strong detrimental effects. Based on our results, we infer that pelagic mollusks have developed several approaches to mediate the conditions related to low pH and Ωar, at least partially. First, along the strongest low Ωar and pH hotspots, we found evidence of continuous activation of antioxidative activity, indicative of scavenging mechanisms detoxifying excess ROS to decrease overall oxidative damage. Second, upwelled waters are cold and nutrient-rich, both parameters that can mediate the negative low pH and Ωar stress and reduce the overall effect on the cellular toxicity. While fluorescence has been demonstrated to partially offset negative effects (Seibel et al., 2012), the mitigating effect of low temperature was demonstrated here for the first time. The compensatory effects of low pH, low Ωar, and thermal stress likely occur also because of negative additive effects stimulating antioxidative production. Third, pteropods likely shut down more energetically expensive processes to conserve energy under the most severe low pH and Ωar conditions.
In summary, this study delineates, for the first time, some of the implications behind pteropod vulnerability in high-temperature, low-oxygen, low-pH and Ωar coastal waters. This involves the link between low pH and Ωar eliciting enhanced oxidative stress in organisms with exceptionally high PUFA levels, such as pteropods, which are extremely sensitive to low pH and Ωar. Oxidative stress biomarkers can be used as an early-warning signal of multiple stressors on the cellular level. We recommend that future studies focus on mechanisms that govern the linkage between low temperature and carbonate chemistry drivers, especially in the context of multiple environmental drivers and intensification of anthropogenic-driven ocean acidification. The understanding of cellular responses to oxidative stress can provide important new insights into factors that set limits to species’ tolerance of multiple drivers in the natural environment, especially when mechanistically linked though energetic implications. Moreover, it will not only help identify the habitats that cannot support viable physiological responses (Sokolova et al., 2012) but also predict future adaptation strategies by the high content PUFA sensitive organisms to ocean acidification.
The generated datasets for this study can be found in the PANGEA database under the following link:
https://issues.pangaea.de/browse/PDI-18087
Online material supporting this manuscript, including full presentation of results, is available at:
https://sccwrp.shinyapps.io/pteropod_biomarker/physio.Rmd
https://sccwrp.shinyapps.io/pteropod_biomarker/biomark.Rmd
The source content and data citation for the above two links can be found at: http://doi.org/10.5281/zenodo.1405158
The WCOA 2016 physical and chemical cruise data can be found at:
https://www.nodc.noaa.gov/ocads/oceans/Coastal/WCOA.html
NB conducted the fieldwork and performed lab and data analyses. RF provided the physical and chemical data from the WCOA 2016 cruise and description of the physical–chemical processes. OG, MK, and JE-Ö performed the oxidative stress analyses. MB conducted the statistical analyses. NB wrote the paper with the contribution of all authors.
This project has been funded by NOAA Ocean Acidification Program under contract number 4791 and Academy of Finland (276947).
The authors declare that the research was conducted in the absence of any commercial or financial relationships that could be construed as a potential conflict of interest.
We thank the crew of the NOAA Ship Ronald H. Brown for invaluable assistance with pteropod collection. Contribution number 4791 from the Pacific Marine Environmental Laboratory of NOAA. We also thank Libby Jewett and Dwight Gledhill of the NOAA Ocean Acidification Program for their support of this research.
The Supplementary Material for this article can be found online at: https://www.frontiersin.org/articles/10.3389/fmars.2018.00486/full#supplementary-material
FIGURE S1 | Results of principal components analysis of the environmental data. The first plot shows the estimated axis scores for the first and second principal components and the second plot shows the scores for the second and third principal components. The first three axes explained nearly 99% of the variation among the observations. Length and direction of each vector shows the relative loadings of each variable with the axes.
TABLE S1 | The compilation of all stations along the United States West Coast collected at NOAA WCOA 2016 cruise, with chemical and biological data providing baseline for subsequent analyses.
Abele, D., Heise, K., Pörtner, H. O., and Puntarulo, S. (2002). Temperature-dependence of mitochondrial function and production of reactive oxygen species in the intertidal mud clam Mya arenaria. J. Exp. Biol. 205, 1831–1841.
Alin, S. R., Feely, R. A., Dickson, A. G., Hernández-Ayón, J. M., Juranek, L. W., Ohman, M. D., et al. (2012). Robust empirical relationships for estimating the carbonate system in the southern california current system and application to CalCOFI hydrographic cruise data (2005-2011). J. Geophys. Res. 117:C05033. doi: 10.1029/2011JC007511
Armstrong, J. L., Myers, K. W., Beauchamp, D. A., Davis, N. D., Walker, R. V., Boldt, J. L., et al. (2008). Interannual and spatial feeding patterns of hatchery and wild juvenile pink salmon in the gulf of alaska in years of low and high survival. Trans. Am. Fish. Soc. 137, 1299–1316. doi: 10.1577/T07-196.1
Aydin, K. Y., McFarlane, G. A., King, J. R., Megrey, B. A., and Myers, K. W. (2005). Linking oceanic food webs to coastal production and growth rates of Pacific salmon (Oncorhynchus spp.), using models on three scales. Deep Sea Res. Part II Top. Stud. Oceanogr. 52, 757–780. doi: 10.1016/j.dsr2.2004.12.017
Bakun, A., Black, B. A., Bograd, S. J., García-Reyes, M., Miller, A. J., Rykaczewski, R. R., et al. (2015). Anticipated effects of climate change on coastal upwelling ecosystems. Curr. Clim. Change Rep. 1, 85–93.
Beare, D., McQuatters-Gollop, A., van der Hammen, T., Machiels, M., Teoh, S. J., and Hall-Spencer, J. M. (2013). Long-term trends in calcifying plankton and pH in the North Sea. PLoS One 8:e61175. doi: 10.1371/journal.pone.0061175
Beaugrand, G., McQuatters-Gollop, A., Edwards, M., and Goberville, E. (2013). Long-term responses of North Atlantic calcifying plankton to climate change. Nat. Clim. Change 3, 263–267. doi: 10.1038/nclimate1753
Bednaršek, N., Harvey, C. J., Kaplan, I. C., Feely, R. A., and Možina, J. (2016a). Pteropods on the edge: cumulative effects of ocean acidification, warming, and deoxygenation. Prog. Oceanogr. 145, 1–24. doi: 10.1016/j.pocean.2016.04.002
Bednaršek, N., Johnson, J., and Feely, R. A. (2016b). Comment on Peck et al.: vulnerability of pteropod (Limacina helicina) to ocean acidification: shell dissolution occurs despite an intact organic layer. Deep Sea Res. Part II Top. Stud. Oceanogr. 127, 53–56. doi: 10.1016/j.dsr2.2016.03.006
Bednaršek, N., Feely, R. A., Tolimieri, N., Hermann, A. J., Siedlecki, S. A., Waldbusser, G. G., et al. (2017a). Exposure history determines pteropod vulnerability to ocean acidification along the US West Coast. Sci. Rep. 7:4526. doi: 10.1038/s41598-017-03934-z
Bednaršek, N., Klinger, T., Harvey, C. J., Weisberg, S., McCabe, R. M., Feely, R. A., et al. (2017b). New ocean, new needs: application of pteropod shell dissolution as a biological indicator for marine resource management. Ecol. Indic. 76, 240–244. doi: 10.1016/j.ecolind.2017.01.025
Bednaršek, N., and Ohman, M. D. (2015). Changes in pteropod distributions and shell dissolution across a frontal system in the california current system. Mar. Ecol. Prog. Ser. 523, 93–103. doi: 10.3354/meps11199
Bednaršek, N., Tarling, G. A., Bakker, D. C. E., Fielding, S., Cohen, A., Kuzirian, A., et al. (2012a). Description and quantification of pteropod shell dissolution: a sensitive bioindicator of ocean acidification. Glob. Change Biol. 18, 2378–2388. doi: 10.1111/j.1365-2486.2012.02668.x
Bednaršek, N., Tarling, G. A., Fielding, S., and Bakker, D. C. E. (2012b). Population dynamics and biogeochemical significance of Limacina helicina antarctica in the Scotia Sea (Southern Ocean). Deep Sea Res. Part II Top. Stud. Oceanogr. 59, 105–116.
Belhadj Slimen, I., Najar, T., Ghram, A., Dabbebi, H., Ben Mrad, M., and Abdrabbah, M. (2014). Reactive oxygen species, heat stress and oxidative-induced mitochondrial damage. a review. Int. J. Hyperther. 30, 513–523. doi: 10.3109/02656736.2014.971446
Bond, N. A., Cronin, M. F., Freeland, H., and Mantua, N. (2015). Causes and impacts of the 2014 warm anomaly in the NE Pacific. Geophys. Res. Lett. 42, 3414–3420. doi: 10.1002/2015GL063306
Bou, R., Codony, R., Tres, A., Decker, E. A., and Guardiola, F. (2008). Determination of hydroperoxides in foods and biological samples by the ferrous oxidation–xylenol orange method: a review of the factors that influence the method’s performance. Anal. Biochem. 377, 1–15. doi: 10.1016/j.ab.2008.02.029
Burnham, K. P., and Anderson, D. R. (2002). Model Selection and Multimodel Inference: A Practical Information-Theoretic Approach, 2nd Edn. New York: Springer-Verlag.
Chavez, F. P., Sevadjian, J., Wahl, C., Friederich, J., and Friederich, G. E. (2018). Measurements of pCO2 and pH from an autonomous surface vehicle in a coastal upwelling system. Deep Sea Res. Part II Top. Stud. Oceanogr. 151, 137–146. doi: 10.1016/j.dsr2.2017.01.001
Cherkasov, A. S., Biswas, P. K., Ridings, D. M., Ringwood, A. H., and Sokolova, I. M. (2006). Effects of acclimation temperature and cadmium exposure on cellular energy budgets in the marine mollusk Crassostrea virginica: linking cellular and mitochondrial responses. J. Exp. Biol. 209, 1274–1284. doi: 10.1242/jeb.02093
Di Lorenzo, E., and Mantua, N. (2016). Multi-year persistence of the 2014/15 North Pacific marine heatwave. Nat. Clim. Change 6, 1042–1047. doi: 10.1038/nclimate3082
Eymard, S., and Genot, C. (2003). A modified xylenol orange method to evaluate formation of lipid hydroperoxides during storage and processing of small pelagic fish. Eur. J. Lipid Sci. Tech. 105, 497–501. doi: 10.1002/ejlt.200300768
Feely, R. A., Alin, S. R., Carter, B., Bednaršek, N., Hales, B., Chan, F., et al. (2016). Chemical and biological impacts of ocean acidification along the west coast of North America. Estuar. Coast. Shelf Sci. 183, 260–270.
Feely, R. A., Sabine, C. L., Hernandez-Ayon, J. M., Ianson, D., and Hales, B. (2008). Evidence for upwelling of corrosive” acidified” water onto the continental shelf. Science 320, 1490–1492. doi: 10.1126/science.1155676
Frischknecht, M., Münnich, M., and Gruber, N. (2017). Local atmospheric forcing driving an unexpected california current system response during the 2015–2016 El Niño. Geophys. Res. Lett. 44, 304–311. doi: 10.1002/2016GL071316
Gannefors, C., Böer, M., Kattner, G., Graeve, M., Eiane, K., Gulliksen, B., et al. (2005). The Arctic sea butterfly Limacina helicina: lipids and life strategy. Mar. Biol. 147, 169–177. doi: 10.1007/s00227-004-1544-y
Gardner, J., Manno, C., Bakker, D. C. E., Peck, V. L., and Tarling, G. A. (2018). Southern ocean pteropods at risk from ocean warming and acidification. Mar. Biol. 165:8. doi: 10.1007/s00227-017-3261-3
Gentemann, C. L., Fewings, M. R., and García-Reyes, M. (2017). Satellite sea surface temperatures along the west coast of the united states during the 2014–2016 northeast pacific marine heat wave. Geophys. Res. Lett. 44, 312–319. doi: 10.1002/2016GL071039
Glippa, O., Engström-Öst, J., Kanerva, M., Rein, A., and Vuori, K. (2018). Oxidative stress and antioxidant defense responses in Acartia copepods in relation to environmental factors. PLoS One 13:e0195981. doi: 10.1371/journal.pone.0195981
Gómez-Ocampo, E., Gaxiola-Castro, G., Durazo, R., and Beier, E. (2018). Effects of the 2013-2016 warm anomalies on the california current phytoplankton. Deep Sea Res. Part II Top. Stud. Oceanogr. 151, 64–76. doi: 10.1016/j.dsr2.2017.01.005
Gruber, N., Hauri, C., Lachkar, Z., Loher, D., Frölicher, T. L., and Plattner, G.-K. (2012). Rapid progression of ocean acidification in the california current system. Science 337, 220–223. doi: 10.1126/science.1216773
Halpern, B. S., Kappel, C. V., Selkoe, K. A., Micheli, F., Ebert, C. M., Kontgis, C., et al. (2009). Mapping cumulative human impacts to california current marine ecosystems. Conserv. Lett. 2, 138–148. doi: 10.1111/j.1755-263X.2009.00058.x
Harris, K. E., DeGrandpre, M. D., and Hales, B. (2013). Aragonite saturation state dynamics in a coastal upwelling zone. Geophys. Res. Lett. 40, 2720–2725.
Hauri, C., Gruber, N., Vogt, M., Doney, S. C., Feely, R. A., Lachkar, Z., et al. (2013). Spatiotemporal variability and long-term trends of ocean acidification in the california current system. Biogeosciences 10, 193–216. doi: 10.5194/bg-10-193-2013
Hochachka, P. W., and Somero, G. N. (2002). Biochemical Adaptation: Mechanism and Process in Physiological Evolution. Oxford: Oxford University Press.
Hu, Z. Z., Kumar, A., Jha, B., Zhu, J., and Huang, B. (2017). Persistence and predictions of the remarkable warm anomaly in the northeastern pacific ocean during 2014–16. J. Climate 30, 689–702. doi: 10.1175/JCLI-D-16-0348.1
Hulbert, A. J., Pamplona, R., Buffenstein, R., and Buttemer, W. A. (2007). Life and death: metabolic rate, membrane composition, and life span of animals. Physiol. Rev. 87, 1175–1213. doi: 10.1152/physrev.00047.2006
Ivanina, A. V., Cherkasov, A. S., and Sokolova, I. M. (2008). Effects of cadmium on cellular protein and glutathione synthesis and expression of stress proteins in eastern oysters, Crassostrea virginica Gmelin. J. Exp. Biol. 211, 577–586. doi: 10.1242/jeb.011262
Ivanina, A. V., Nesmelova, I., Leamy, L., Sokolov, E. P., and Sokolova, I. M. (2016). Intermittent hypoxia leads to functional reorganization of mitochondria and affects cellular bioenergetics in marine molluscs. J. Exp. Biol. 219, 1659–1674. doi: 10.1242/jeb.134700
Ivanina, A. V., and Sokolova, I. M. (2016). Effects of intermittent hypoxia on oxidative stress and protein degradation in molluscan mitochondria. J. Exp. Biol. 219, 3794–3802. doi: 10.1242/jeb.146209
Izquierdo, M. S., Socorro, J., Arantzamendi, L., and Hernández-Cruz, C. M. (2000). Recent advances in lipid nutrition in fish larvae. Fish Physiol. Biochem. 22, 97–107.
Jacox, M. G., Hazen, E. L., Zaba, K. D., Rudnick, D. L., Edwards, C. A., Moore, A. M., et al. (2016). Impacts of the 2015–2016 El Niño on the california current system: early assessment and comparison to past events. Geophys. Res. Lett. 43, 7072–7080. doi: 10.1002/2016GL069716
Karpenko, V. I., Volkov, A. F., and Koval, M. V. (2007). Diets of pacific salmon in the sea of okhotsk, bering sea, and northwest pacific ocean. N. Pac. Anadr. Fish Commun. Bull. 4, 105–116.
Kelly, R. P., Erickson, A. L., Mease, L. A., Battista, W., Kittinger, J. N., and Fujita, R. (2015). Embracing thresholds for better environmental management. Philos. Trans. R. Soc. B Biol. Sci. 370:20130276. doi: 10.1098/rstb.2013.0276
Koh, H. Y., Lee, J. H., Han, S. J., Park, H., Shin, S. C., and Lee, S. G. (2015). A transcriptomic analysis of the response of the arctic pteropod Limacina helicina to carbon dioxide-driven seawater acidification. Polar Biol. 38, 1727–1740. doi: 10.1007/s00300-015-1738-4
Lesser, M. P. (2006). Oxidative stress in marine environments: biochemistry and physiological ecology. Annu. Rev. Physiol. 68, 253–278. doi: 10.1146/annurev.physiol.68.040104.110001
Lischka, S., Büdenbender, J., Boxhammer, T., and Riebesell, U. (2011). Impact of ocean acidification and elevated temperatures on early juveniles of the polar shelled pteropod Limacina helicina: mortality, shell degradation, and shell growth. Biogeosciences 8, 919–932. doi: 10.5194/bg-8-919-2011
Lischka, S., and Riebesell, U. (2012). Synergistic effects of ocean acidification and warming on overwintering pteropods in the Arctic. Glob. Change Biol. 18, 3517–3528. doi: 10.1111/gcb.12020
Lischka, S., and Riebesell, U. (2017). Metabolic response of arctic pteropods to ocean acidification and warming during the polar night/twilight phase in Kongsfjord (Spitsbergen). Polar Biol. 40, 1211–1227. doi: 10.1007/s00300-016-2044-5
Maas, A. E., Lawson, G. L., and Tarrant, A. M. (2015). Transcriptome-wide analysis of the response of the thecosome pteropod Clio pyramidata to short-term CO2 exposure. Comp. Biochem. Physiol. D 16, 1–9. doi: 10.1016/j.cbd.2015.06.002
Matozzo, V., Giacomazzo, M., Finos, L., Marin, M. G., Bargelloni, L., and Milan, M. (2013). Can ecological history influence immunomarker responses and antioxidant enzyme activities in bivalves that have been experimentally exposed to contaminants? A new subject for discussion in “eco-immunology” studies. Fish Shellfish Immunol. 35, 126–135. doi: 10.1016/j.fsi.2013.04.013
Monaghan, P., Metcalfe, N. B., and Torres, R. (2009). Oxidative stress as a mediator of life history trade-offs: mechanisms, measurements and interpretation. Ecol. Lett. 12, 75–92. doi: 10.1111/j.1461-0248.2008.01258.x
Moya, A., Howes, E. L., Lacoue-Labarthe, T., Forêt, S., Hanna, B., Medina, M., et al. (2016). Near-future pH conditions severely impact calcification, metabolism and the nervous system in the pteropod Heliconoides inflatus. Glob. Change Biol. 22, 3888–3900. doi: 10.1111/gcb.13350
Murphy, M. P. (2009). How mitochondria produce reactive oxygen species. Biochem. J. 417, 1–13. doi: 10.1042/BJ20081386
Oksanen, J., Guillaume Blanchet, F., Friendly, M., Kindt, R., Legendre, P., McGlinn, D., et al. (2017). Vegan: Community Ecology Package. R package version 2.4-5. Available at: https://CRAN.R-project.org/package=vegan.
Peck, V. L., Oakes, R. L., Harper, E. M., Manno, C., and Tarling, G. A. (2018). Pteropods counter mechanical damage and dissolution through extensive shell repair. Nat. Commun. 9:264. doi: 10.1038/s41467-017-02692-w
Persson, J., and Vrede, T. (2006). Polyunsaturated fatty acids in zooplankton: variation due to taxonomy and trophic position. Freshw. Biol. 51, 887–900.
Peterson, W. T., Fisher, J. L., Strub, P. T., Du, X., Risien, C., Peterson, J., et al. (2017). The pelagic ecosystem in the northern california current off oregon during the 2014–2016 warm anomalies within the context of the past 20 years. J. Geophys. Res. Oceans 122, 7267–7290. doi: 10.1002/2017JC012952
Pinti, M., Gibellini, L., Liu, Y., Xu, S., Lu, B., and Cossarizza, A. (2015). Mitochondrial Lon protease at the crossroads of oxidative stress, ageing and cancer. Cell. Mol. Life Sci. 72, 4807–4824. doi: 10.1007/s00018-015-2039-3
Pörtner, H. O. (2008). Ecosystem effects of ocean acidification in times of ocean warming: a physiologist’s view. Mar. Ecol. Prog. Ser. 373, 203–217.
Quirós, P. M., Español, Y., Acín-Pérez, R., Rodríguez, F., Bárcena, C., Watanabe, K., et al. (2014). ATP-dependent Lon protease controls tumor bioenergetics by reprogramming mitochondrial activity. Cell Rep. 8, 542–556. doi: 10.1016/j.celrep.2014.06.018
Quirós, P. M., Langer, T., and López-Otín, C. (2015). New roles for mitochondrial proteases in health, ageing and disease. Nat. Rev. Mol. Cell Biol. 16, 345–359. doi: 10.1038/nrm3984
R Core Team (2017). R: A Language and Environment for Statistical Computing. Available at: https://www.R-project.org/
Seibel, B. A., Maas, A. E., and Dierssen, H. M. (2012). Energetic plasticity underlies a variable response to ocean acidification in the pteropod, Limacina helicina antarctica. PLoS One 7:e30464. doi: 10.1371/journal.pone.0030464
Sokolova, I. M., Frederich, M., Bagwe, R., Lannig, G., and Sukhotin, A. A. (2012). Energy homeostasis as an integrative tool for assessing limits of environmental stress tolerance in aquatic invertebrates. Mar. Environ. Res. 79, 1–15. doi: 10.1016/j.marenvres.2012.04.003
Tomanek, L. (2011). Environmental proteomics: changes in the proteome of marine organisms in response to environmental stress, pollutants, infection, symbiosis, and development. Annu. Rev. Mar. Sci. 3, 373–399.
Turi, G., Lachkar, Z., Gruber, N., and Munnich, M. (2016). Climatic modulation of recent trends in ocean acidification in the california current system. Environ. Res. Lett. 11:e014007. doi: 10.1088/1748-9326/11/1/014007
Vuori, K., Kiljunen, M., Kanerva, M., Koljonen, M. L., and Nikinmaa, M. (2012). Stock-specific variation of trophic position, diet and environmental stress markers in atlantic salmon salmo salar during feeding migrations in the baltic sea. J. Fish Biol. 81, 1815–1833. doi: 10.1111/j.1095-8649.2012.03386.x
Vuori, K. A., Lehtonen, K. K., Kanerva, M., Peltonen, H., Nikinmaa, M., Berezina, N. A., et al. (2015). Oxidative stress biomarkers in the copepod limnocalanus macrurus from the northern baltic sea: effects of hydrographic factors and chemical contamination. Mar. Ecol. Prog. Ser. 538, 131–144. doi: 10.3354/meps11471
Wood, H. L., Spicer, J. I., and Widdicombe, S. (2008). Ocean acidification may increase calcification rates, but at a cost. Proc. R. Soc. Lond. Ser. B Biol. Sci. 275, 1767–1773. doi: 10.1098/rspb.2008.0343
Yin, H., and Pörter, N. A. (2003). Specificity of the ferrous oxidation of xylenol orange assay: analysis of autoxidation products of cholesteryl arachidonate. Anal. Biochem. 313, 319–326. doi: 10.1016/S0003-2697(02)00621-8
Zenebe, W. J., Nazarewicz, R. R., Parihar, M. S., and Ghafourifar, P. (2007). Hypoxia/reoxygenation of isolated rat heart mitochondria causes cytochrome c release and oxidative stress; evidence for involvement of mitochondrial nitric oxide synthase. J. Mol. Cell. Cardiol. 43, 411–419. doi: 10.1016/j.yjmcc.2007.05.019
Keywords: El Niño, coastal ecosystem, pelagic mollusks, oxidative stress, ocean acidification, interaction effects, antioxidant defense strategies, bioenergetics
Citation: Bednaršek N, Feely RA, Beck MW, Glippa O, Kanerva M and Engström-Öst J (2018) El Niño-Related Thermal Stress Coupled With Upwelling-Related Ocean Acidification Negatively Impacts Cellular to Population-Level Responses in Pteropods Along the California Current System With Implications for Increased Bioenergetic Costs. Front. Mar. Sci. 5:486. doi: 10.3389/fmars.2018.00486
Received: 27 May 2018; Accepted: 29 November 2018;
Published: 12 December 2018.
Edited by:
Ruben Escribano, Universidad de Concepción, ChileReviewed by:
Laura Ramajo, Adolfo Ibáñez University, ChileCopyright © 2018 Bednaršek, Feely, Beck, Glippa, Kanerva and Engström-Öst. This is an open-access article distributed under the terms of the Creative Commons Attribution License (CC BY). The use, distribution or reproduction in other forums is permitted, provided the original author(s) and the copyright owner(s) are credited and that the original publication in this journal is cited, in accordance with accepted academic practice. No use, distribution or reproduction is permitted which does not comply with these terms.
*Correspondence: Nina Bednaršek, bmluYWJAc2Njd3JwLm9yZw==
Disclaimer: All claims expressed in this article are solely those of the authors and do not necessarily represent those of their affiliated organizations, or those of the publisher, the editors and the reviewers. Any product that may be evaluated in this article or claim that may be made by its manufacturer is not guaranteed or endorsed by the publisher.
Research integrity at Frontiers
Learn more about the work of our research integrity team to safeguard the quality of each article we publish.