 Petra Roiha
 Simo-Matti Siiriä
 Noora Haavisto
 Pekka Alenius
 Antti Westerlund
 Tero Purokoski1
95% of researchers rate our articles as excellent or good
Learn more about the work of our research integrity team to safeguard the quality of each article we publish.
Find out more
ORIGINAL RESEARCH article
Front. Mar. Sci. , 12 September 2018
Sec. Coastal Ocean Processes
Volume 5 - 2018 | https://doi.org/10.3389/fmars.2018.00308
This article is part of the Research Topic Living Along Gradients: Past, Present, Future View all 28 articles
Argo floats have been used in the environmental monitoring of the very shallow Bothnian Sea, a sub-basin of the Baltic Sea, for 5 years as part of the Finnish Euro-Argo programme. The Bothnian Sea is so far considered to be an environmentally healthy part of the Baltic Sea because the deep waters of the basin are well-ventilated by inflowing oxygen-rich saltier and heavier surface layer waters of the Baltic Sea proper. Thus the deep water flow is of interest in the Bothnian Sea. In this study, we used Argo float data from six different long-term missions, from 111 to 512 days, to analyze the deep-water flow in the Bothnian Sea where no continuous monitoring of currents exist. We estimated mainly the flow below the expected halocline from the paths of the floats. We analyzed the movements statistically and estimated the error caused by the surface drift of the floats during their stay at the surface by using 3D hydrodynamic model results as reference data. Our results show a northward flowing resultant current in the deep trench of the Bothnian Sea. There seemed to be very little exchange between coastal zone and open-sea waters in deeper layers. The drifting speed of the floats in the deep layers of Bothnian Sea generally was around 2 cm/s but instantaneous speeds of up to 30 cm/s in the middle-layer (50 dbars) were observed. In the Bothnian Sea deep, the deep trench on the Finnish side of the Bothnian Sea, the vast majority of the observations showed deep currents from south to north, with the same average speed of around 2 cm/s but the instantaneous maximum was smaller at 13 cm/s. Our study indicates that the routine Argo float observations can be used to get information on the deep currents in the basin in addition to hydrographic observations.
The Baltic Sea is a small shallow sea that consists of several basins with most of the deeper parts separated from each other by underwater sills. The water quality of the deep waters of the basins differ considerably from each other, although the whole Baltic Sea is more or less under loads from the land. For example, the marine ecosystems change because of nutrient and energy fluxes between the surface and benthos; the local climate and ice conditions depend on the energy storage of the sea and its movements. To know the deep currents and their variations is to be aware of potential changes in the environment.
The dynamics of the deep areas of the Baltic Sea are still partly poorly known due to the limited quantity of measurements in these areas. Most of the studies that enlighten the deeper water layer dynamics concentrate on the Baltic Proper (e.g., Wieczorek, 2012), southern Baltic Sea (e.g., Bulczak et al., 2016), and Gulf of Finland (e.g., Suhhova et al., 2018) and are often related to examining the influence of major Baltic inflows on the deep water (Meier et al., 2006). Subsurface currents transport energy and substances, and they also have an effect on ecosystems by transporting the matter and the organisms.
The Bothnian Sea, a large sub-basin of the Baltic Sea, has been considered to be an environmentally healthy part of the vulnerable Baltic Sea, which suffers from environmental problems, the most severe of which is the oxygen deficit in the deep waters of the Baltic Sea Proper. Some concern on the slight worsening of the deep-water oxygen conditions in the Bothnian Sea was expressed by Raateoja (2013). The general understanding of the dynamics of the deep waters of the Bothnian Sea is that oxygen-rich saltier and heavier water from the surface layer of the Baltic Sea proper flow in to the Bothnian Sea and sinks toward the bottom and continues toward the north along the bottom, thus ventilating the deep-waters there (Hietala et al., 2007). This deep-water flow is of interest and should be monitored. However, there is no monitoring of currents in that open-sea area.
Kuosa et al. (2017) have studied the development of the Gulf of Bothnia ecosystem and concluded that variation in deep-water inflow from the Baltic Proper has an effect on phyto- and zooplankton communities in the Bothnian Sea.
The Finnish Meteorological Institute (FMI) has operated Argo floats in the Bothnian Sea already for 5 years as part of the Finnish Euro-Argo contribution. On average year the Bothnian Sea freezes almost completely (SMHI, 1982) and the floats are equipped with ice-avoidance algorithm. When ice avoidance is used the float is given a temperature value near freezing temperature (in the Bothnian Sea 0.25–0.5°C). If the float detects freezing water it stops profiling and returns to the parking depth. In this study period no ice-avoidance was needed as the missions were performed in either ice-free period or in the area with no ice. However, the ice-avoidance was tested during this study with test value around 3°C.
In this paper we study the possibility to utilize the Bothnian Sea Argo float data to estimate the deep currents below the pycnocline and thus add the value of the regular monitoring with these instruments. We analyzed the 5 years data of Argo float measurements from 2012 to 2016 to study the deep water movements in the Bothnian Sea in order to gain understanding of the processes affecting ecosystems there now and to be able in the future to predict the changes in the physical conditions. This type of data has far too coarse time resolution to reflect internal oscillations in the basin, like inertial ones and Bothnian Sea seiches. The results reflect more the net water transport in the deep layer.
The Bothnian Sea is located in the northern part of the Baltic Sea (Figure 1). It is generally shallow, with an average depth of 66 m, but it is divided topographically different sections. There is relatively straight forward sloping bottom on the eastern side of the basin and an arch-shaped deep trench with maximum depth of 293 m in the north-western part of the basin. The area of the basin is 64 886 km2 (Fonselius, 1996). The surface salinity in the open sea area is 5–6 and the deep-water salinity is 6–7 (Fonselius and Valderrama, 2003). The shoreline is near, and the area is important for marine traffic, nature conservation and fishing activities (Backer and Frias, 2013).
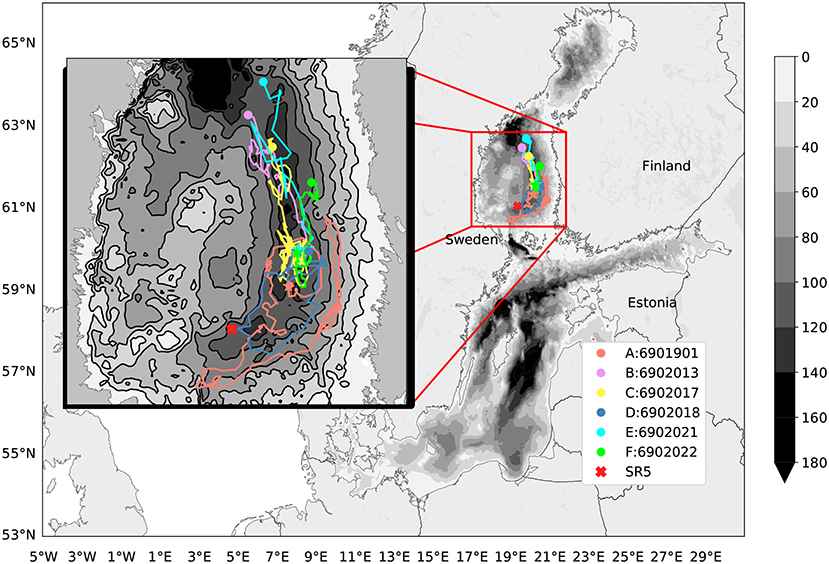
Figure 1. Map of Argo missions in the Bothnian Sea 2012–2016. The deployment site of the floats is in a deep part of the Bothnian Sea. The starting and ending points are marked with stars and circles, respectively.The gray-scale shows the bathymetry. The cross marks the HELCOM continuous monitoring station, SR5.
The northern parts and the coastal areas of the basin freeze or are near to the freezing point during the winter. The upper layer temperature is then smaller than maximum density temperature. In spring the surface temperature increases toward maximum density temperature, which causes overturning. In summer the temperature is greater than maximum density temperature and a seasonal thermocline forms. When the surface layer cools in the autumn toward maximum density temperature the surface layer overturns again. In winter the upper and deep layers are separated by a weak halocline, which also is a pycnocline, at somewhere between 70 and 90 m depths. The winter time convection reaches this pycnocline as interpreted from Argo data in the Bothnian Sea (Haavisto et al., 2018) and data from fixed oceanographic station at Utö (Haapala and Alenius, 1994).
The Bothnian Sea is a basin that is behind several smaller basins and sills that prevent the direct deep water flow from the Baltic Sea Proper. Thus the deep waters in the Bothnian Sea are formed during the winter from surface water from the Baltic Proper (Leppäranta and Myrberg, 2009). In last 20 years the saline water inflow to the deep layers of the Bothnian Sea has increased potentially by changes in sea-level dynamics in the Baltic Proper or the salinity content of the inflowing water (Raateoja, 2013). The deep water in the Gulf of Bothnia is mainly cooled winter water from the Gotland Sea, that has sunk over the southern Åland sill (Marmefelt and Omstedt, 1993). During the summer the deep water system resembles the deep water system in the Baltic Proper, with a strong thermocline and dicothermal layer. Then the direct wind mixing can only effect the layer that is on top of the thermocline, and deeper mixing can only happen when the thermocline disappears during spring and autumn overturning. This has a significant effect on the microbial ecosystem on the surface layer and oxygen conditions in the bottom layer (Raateoja, 2013).
The currents are induced in the sea by four different mechanisms: wind stress, sea surface tilt, horizontal thermohaline gradient of density and tidal forces (Leppäranta and Myrberg, 2009). The currents are altered by Coriolis acceleration, topography and friction. The period of the inertial oscillation is around 13.75 h in the southern Bothnian Sea and around 13.44 h in the Northern Bothnian Sea. River run-off could also change the local sea-level height and thus the currents. The passing low pressure cells often cause seiches in the Bothnian Sea. The theoretical uninodal seiche period for the Baltic Proper–Bothnian Sea system is 35.6 h and water-level observations suggest it might be as long as 39 h (Leppäranta and Myrberg, 2009). With Merian formula we may estimate that the uninodal seiche period accross the Bothnian Sea is 4.4 h and along the Bothnian Sea 7 h. A northerly wind also drives the surface layer toward the south and west, causing upwelling on the Finnish coast. The compensating current in the deep layer then flows toward the north.
The general concepts of the circulation in the Gulf of Bothnia were laid down in the early 20th century when Witting (1912) and Palmén (1930) studied the currents using observations from drift cards, ship borne current measurements and from light ships. They noticed that the main feature in the Bothnian Sea surface and near surface was a cyclonic circulation moving water to the north on the Finnish side of the basin and southwards on the Swedish side. Witting's works indicated two main circulation cells, one in the northern part of the Bothnian Sea and the other in the southern part. Palmén, however, concluded that there is only one basin-wide circulation cell, and that concept has been the basis of the general thinking since the 1930s.
Witting (1912) described the surface circulation separately for June, August, October and from June to October. He described the deep water movements in connection to water transports and gave figures for transports in spring and autumn. In that description the deep water transport goes down to the deep trench of the Bothnian Sea and rises upwards on the Swedish side where the depth of the sea is smaller. In both seasons the deep water transport is toward north.
The data on the deep water currents in the Bothnian Sea is sparse, and most of the measurements are concentrated in the southern part near the Understen–Märket trench, where the water exchange between the Baltic Sea Proper and the Bothnian Sea is taking place. Witting and Pettersson (1925) were the first to analyze the deep currents in that area in two short campaigns in the early 1920s. In the 1950s Hela (1958) studied the hydrography of the area. In the 1960s Palosuo (1964) studied the water exchange in the Åland Sea and the Quark and the routes of the water in the upper layers (15–40 m) of the Bothnian Sea.
In 1991 the Gulf of Bothnia Year programme aimed at a better understanding of the processes affecting on the ecosystem. This programme also included an intensive field observation of currents (e.g., Uotila et al., 1996). Coastal-open sea exchange processes as well as deep-sea mixing processes were scrutinized by using moored current meters and thermistor chains among others to gain insight into the structure and dynamics of the whole water column (Murthy et al., 1993). The current meter data from 8 and 60 m depth from a station with bottom depth of 112 m, showed mainly northward going currents at both depth levels even in summer and inertial oscillations were sometimes present at both depths. Unfortunately even those datasets cannot answer to the question if there exists a two layer flow in the area under conditions when there is clear summer stratification.
Hietala et al. (2007) performed a measurement campaign with R/V Aranda to study with ship-mounted acoustic Doppler current profiler (ADCP) the currents in the Understen–Märket trench. 3D hydrodynamic modeling studies have also been executed to understand the water movements (e.g., Myrberg and Andrejev, 2006). These studies concentrate mainly on the near surface layers because there has not been good long-term observational data on the currents in the whole water column. The models today have achieved a certain maturity, but alongside the models we need observations to improve our understanding on the movement of water masses in the whole water column. Mesoscale phenomena on the surface have been also studied by remote sensing methods (Kahru et al., 1995), but those methods do not tell what happens in the deep layers.
In the 1990s the time was right to start a global pursuit to automatically monitor the oceans' evolving temperature and salinity fields (Riser et al., 2016). The first global pursuit to survey the physical properties of the world oceans was the World Ocean Circulation Experiment (WOCE) (Woods, 1985). The global Argo programme was launched after WOCE and has been working since the year 2000 and it aims at real time monitoring of the world's oceans including sea areas that are difficult to reach by other means. Nowadays the main task of the floats is to measure the vertical distribution of basic hydrography fields and up to 80 additional parameters (Carval et al., 2015) at regular intervals and upload the data right after the measurements to the Internet. The floats have mostly been used in Open Ocean in areas where the depth is much more that 1,000 m. In between the profile measurements, the floats drift freely with currents deep below the surface (Argo, 2000).
In general, floats are designed to be used in oceans where there is no danger of hitting the bottom or being hit by a ship while on the surface. Normally there is no need to change the diving parameters during the mission, and a one-way satellite transmission from float to shore is sufficient.
Usually the floats drift for about 10 days at a depth from 1 to 2 km. While ascending, they collect profiles of at least the temperature and salinity, but other sensors might be included too. Once the float is at the surface, the measurement data as well as the float's GPS position is transmitted to the data collector via satellite. All the data from Argo floats is transmitted by satellite and made available in a public database. Thus, continuous measurement data becomes available from sea areas where in-situ observations otherwise would be sparse (Le Traon, 2013). Currently, almost all deployed floats are in the deep oceans, with only a few operating in shallow, marginal seas.
The floats are successfully used to study currents in the deep oceans and shelf seas for example in the Black Sea (Korotaev et al., 2006), the Nordic Seas (Lavender et al., 2005; Voet et al., 2010), and the Mediterranean Sea (Menna and Poulain, 2010), too. The methods for analyzing the deep currents from the Argo data have been developed during the years (e.g., Park et al., 2005) In this study, we used the Argo data for the first time in analyzing currents in a shallow brackish water basin. With this data, we are able to achieve time series that cover most of the ice free seasons in the Bothnian Sea.
The Baltic Sea has a different operating environment than the oceans. With the aim of preventing the float from hitting the bottom and from drifting to shore, a much more active involvement with the float's mission is required. Therefore, to be able to change the diving parameters of the float, two-way satellite communication and short dive cycles are necessary requirements (Purokoski et al., 2013). The main cost of operating the floats is the manpower needed to keep watch on the floats. Benefit for this is the ability to react to interesting phenomena and increasing the observation frequency when needed.
The Finnish Meteorological Institute has used Argo floats in monitoring the Baltic Sea since the year 2012. At least two Argo floats have been continuously in the sea in the Gotland Deep, Baltic Sea Proper and in the Bothnian Sea. In our early Bothnian Sea Argo float missions, the floats were taken out from the sea for the ice-covered season, but later in the years 2015 and 2016 the floats have been equipped with ice avoidance system and they stay there also during the winter and a potentially ice-covered period. The floats have been measuring in the areas where there are routine HELCOM monitoring stations but no dense time series. As the floats are kept away from the coast, they can be used to estimate the water movements in areas where so far only short-term deep current measurements have been done.
In January 2011, FMI received two floats specifically balanced for use in sea areas around Finland. These APEX (Autonomous Profiling Explorer) floats were manufactured by Teledyne Webb Research Corp. (East Falmouth, Massachusetts). Both of the floats were equipped with basic Sea-Bird Electronics Inc. (Bellevue, Washington) SBE 41CP CTD (Conductivity-Temperature-Depth) sensors and a two-way Iridium satellite transmitter. Later a bio-optical float was also deployed to the Bothnian Sea (Table 1). The floats were especially balanced to function in brackish water. Since 2012, the measuring activity has been continuous.
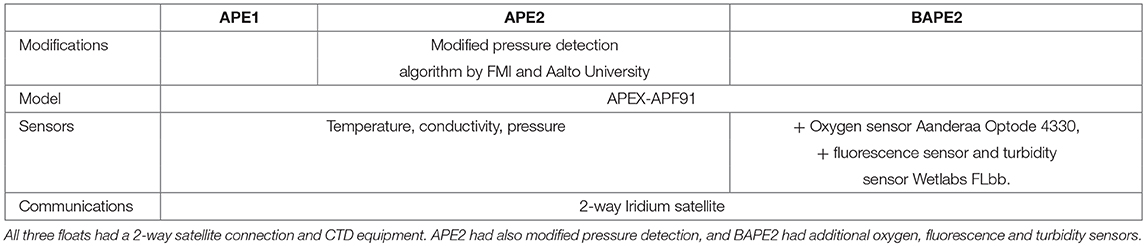
Table 1. Technical details of the floats used in this study.
There were altogether six missions in the years 2012–2016 done by three different floats (Table 2). FMI recovers the floats after missions and reuses them after service. Five of the missions were launched between mid-May and mid-June and one mission was launched in September. All the missions were launched near the same location in the middle of the Bothnian Sea deep to avoid bottom contact and collision with vessels. The deployment area is relatively deep and has a level bottom. During the winter time the ice avoidance was also tested in open water with ice avoidance temperature higher than exact ice avoidance temperature, but the largest number of observations are from the summer season. In later years, the number of winter measurements has also been increasing due to positive experiences with the ice-avoidance algorithm (Figure 2).
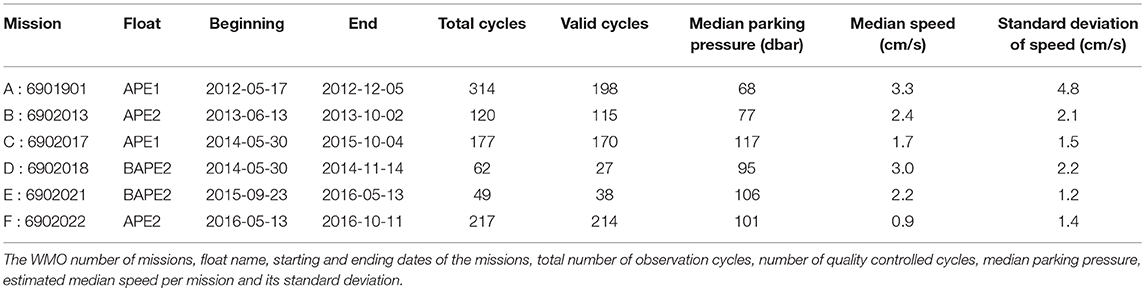
Table 2. Some statistics of Argo measurements in the Bothnian Sea 2012–2016.
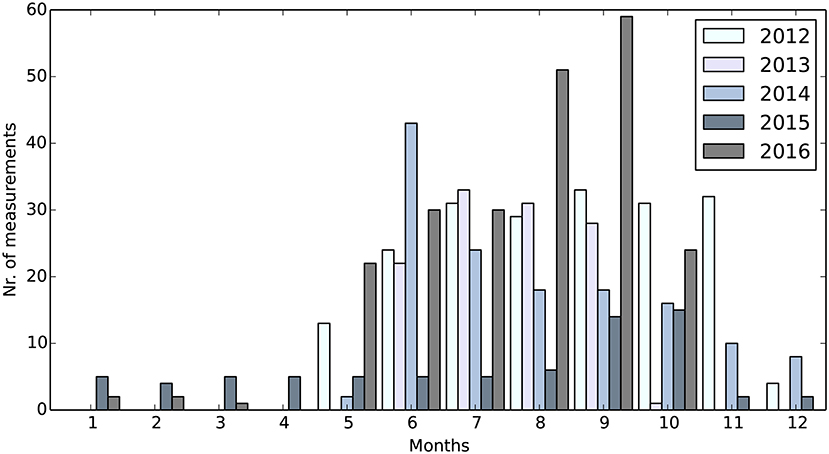
Figure 2. Number of Argo cycles per month and per year in the Bothnian Sea, 2012–2016.
The typical measuring cycle starts when a float starts the diving procedure. When reaching the target pressure, the float stays at that depth, measuring pressure and temperature. After a pre-set diving time the float starts to measure the profile. Unlike the ocean, the profile is started from the parking depth (Figure 3). During the missions, the floats sometimes stayed on the surface during the diving cycle, hit the bottom, or did not send the complete log file. These occasions are removed from the analyzed datasets (Table 2).
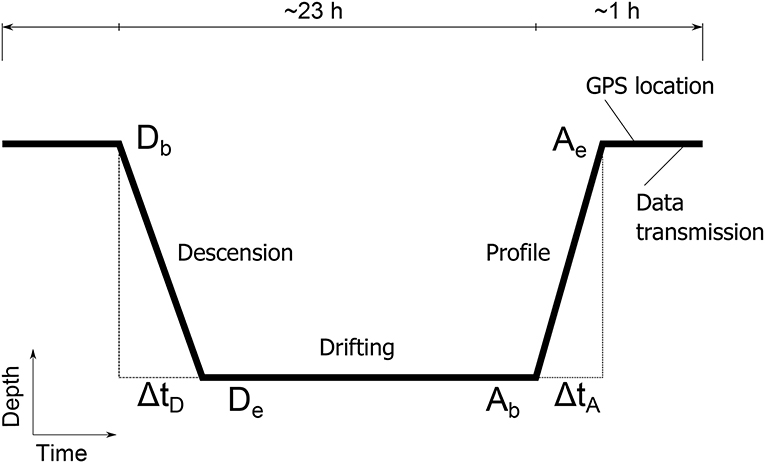
Figure 3. Schematic diagram of the APEX cycle during the first mission in the Baltic Sea. The time scale is much shorter than in the deep ocean Argo measurements. The parking depth also is the same as the depth where the profile starts. Db is the beginning of the descension and De is the end. Ab and Ae are the beginning and the end of ascension, respectively, and ΔtD and ΔtA are the times used for descension and ascension, respectively.
From the Argo logs we can directly access the diving time, the time floated at the parking depth and the ascending time. When we know the total cycle time, we can estimate the time spent at the surface from those values.
For comparing estimated velocities from floats and analyzing surface drift errors we used a 2 nautical mile set-up of the NEMO 3D ocean model (V3.6) covering the Baltic Sea and North Sea area. We ran the model for the year 2014. This set-up was documented and validated for mixing in Westerlund and Tuomi (2016) and for the currents in Westerlund et al. (2018) and is based on the NEMO Nordic configuration by Hordoir et al. (2013, 2015).
The vertical resolution of this set-up starts from 3 m on the surface, and increases with depth. The temporal resolution of the model is 15 min and the values are saved as 1 day averages. The bathymetry of the set-up was updated to the latest version of the NEMO Nordic bathymetry. River run-offs and precipitation fields were climatological. We used forecasts from the FMI numerical weather prediction system HIRLAM (HIRLAM-B, 2015) as forcing. Forcing was read into the NEMO run with the CORE bulk formulae (Large and Yeager, 2004).
We divided our analysis of deep-water currents in two sections. First we wanted to get an overall impression of the deep currents and their statistics in the Bothnian Sea in general and analyze the extreme velocities with results from a hydrodynamic model. The second topic was to analyze specifically the deep flow in the Bothnian Sea deep, which is the deepest trench along the basin, and the flow persistence there.
In the Bothnian Sea the floats median diving pressure was 93 dbar and median cycle length was 24 h, varying from around 2 h to 7 days. Diving pressures were chosen so, that the estimated distance from bottom remained roughly 30 m in the first two missions A (6901901) and B (6902013) (Figure 1) and 10 m in the rest of the missions, based on known topography. For further description of the bottom distance see (Haavisto et al., 2018). The shortest cycles are used when the float has been deployed and recovered to ensure that the float can receive commands via satellite. The typical distance the float moved was 2 to 3 km per cycle and typical estimated speed around 2 cm/s (Table 2), which has been considered to be typical residual speed in the deep waters. Seventy-five percent of the estimated velocities were under 3.5 cm/s. High velocities over 10 cm/s were very rare, only 3% of the cases and were only observed during the first mission at a fairly shallow depth, median 47 dbars. The highest estimated speed was 30 cm/s toward south at 50 dbar depth near to Finnish coast in a situation where sea level was going down in the Gulf of Bothnia. The floats' paths followed usually the expected northward going resultant current in the deep layers of the Bothnian Sea. The first mission A (6901901) had a shallower average drifting depth than the others (Figure 1).
We compared the speeds from the NEMO model to the estimated speeds in each measurement way point in the model layer that corresponded to the diving pressure of the float. The model was run from June to December 2014. The model results cannot be compared directly to speed estimations, because the time scale of events suitable to be investigated by this model is limited by the structure of the model configuration and available inputs for the model. Overall, comparison of modeled currents to observed ones always constitutes a challenge. To be able to estimate the scale of the speeds we analyzed the speed distributions from the model and observations. In two cases the speeds either modeled by NEMO or estimated from Argo trajectories represents the highest 5% of the speeds (Figure 4).
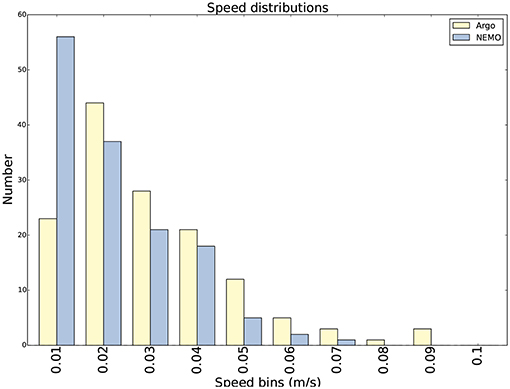
Figure 4. Comparison of APEX parking pressure speed distribution versus respective NEMO speed distribution from June 2014 to December 2014.
In the study period there were three occasions, where there were steady hard winds over period of several days. During all these three events the estimated maximum speeds were over 7 cm/s. On the surface, hard constant northward winds cause upwellings on the Finnish coast of the Bothnian Sea and the low pressure system tilts the water level in the basin speeding the deep currents northward.
In the beginning of June 2014, there was a steady northern wind, exceeding a daily average of 14 m/s at four coastal weather stations along the Finnish coast on June 13. The tide gauges on Gulf of Bothnia registered a rapid water level drop during this event. The Argo float reached the speed of 8 cm/s to N-N-E at an average pressure of 110 dbars. The cycle length was 24 h.
On September 20–22 2014, there was a deep low pressure system passing over Sweden, which caused hard northerly winds, speeds exceeding 26 m/s at the Swedish coastal weather stations in the Bothnian Sea. This low pressure system affected water levels throughout the Gulf of Bothnia where there was a sudden drop in water level and afterwards a very quick rise. The sea surface temperatures also dropped rapidly and we could see an upwelling event in the south-eastern coast of Bothnian Sea. This event also affected on the estimated velocity of the Argo float. The highest speed was 7.6 cm/s to N-N-W at the average diving pressure of 117 dbars during a 48-h cycle.
During this 7 months study period, there was one occasion where southern hard winds were dominant from October 22 to November 4. The float moved at the fastest 8 cm/s to N-N-E in the diving pressure of 100 dbars. This is probably due to weakened stratification, which allows the wind to affect deeper layers than in the summer time when the water column is heavily stratified and wind effect is limited on the mixed layer. The Ekman transport has an effect on the right hand direction from the wind direction.
We may argue that both estimations show exceptionally high speeds during these events and our current estimation from the float trajectories is valid. On the last occasion the wind direction was southward and the model could not show a clear signal of higher current speeds. This could be due to issues in weather forcing and the fact that the routes of the low pressure cells may not be described exactly by the weather models, the poorly known bathymetry in the area or the model's inadequacies to produce correct stratification in the autumn.
The Bothnian Sea Deep is a passage for deep water (Figure 5). Our datasets have 257 cycles from this deep. On average, the buoys drifted at 106 dbar pressure, while the maximum diving pressure was 126 dbar. The minimum pressure of 51 dbar was reached while deployed in June 2013. The shallow parking pressure was set to avoid bottom contact during the first dive (Siiriä in submitted). The median cycle time was 24 h. When ice avoidance was tested, the cycle time was as long as 7 days.
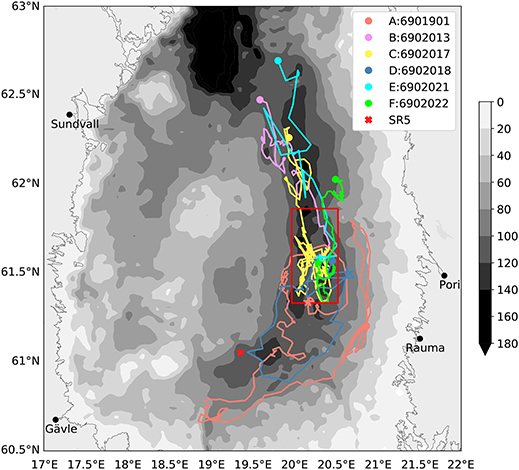
Figure 5. Argo cycles in Bothnian Sea deep area. There were altogether 257 measurement cycles analyzed for this study. The bathymetry is shown in grayscale and the studied area is marked with red box. The routes of the missions are are marked with colors.
On average, the speed estimated from float movement was 2 cm/s, while the temporary maximum was 13 cm/s. The main directions of the currents were along the north-south axis, with the major part of observations showing northward movement. The N-W to N sector covers 37% of all the observed directions, while the sector S-S-W to S-S-E sector covers around 22% of all directions (Figure 6).
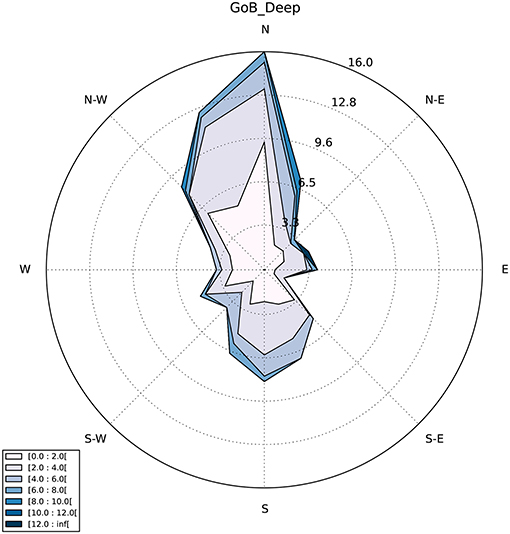
Figure 6. Velocity distribution of the Apex missions in the Gulf of Bothnia Deep. The colors show the estimated speed (cm/s) and the curves show the percentage of the measurements in different directions.
The average speeds were calculated for the area (Figure 7). The diving cycles below 90 dbars were selected to represent the deep currents. We divided the area to a 3′ latitude × 6′ longitude grid and computed the number of observations and average current speed in each grid box. The average speed was calculated as follows:
and
where ū and are the average eastward and northward components of velocity, un and vn are the respective components of the velocity in a single cycle, and N is the number of cycles. Cases where there have been fewer than three measurement have been discarded. From the Equations (1, 2) we see that the average movement is measured as distance/time. Each dive has the same weight regardless of the diving time, as the float likely moves back and forth between the dives. Therefore a longer diving time would not indicate the actual drift direction with a higher probability than a short one.
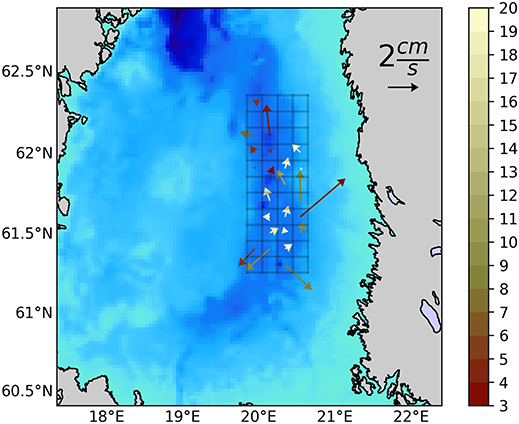
Figure 7. Average Argo velocities for the drifting depth (>90 dbar) in the Bothnian Sea Deep. The length of the arrow indicates the average speed, and the color indicates the number of observations in a grid box. The lighter the color, the more observations.
The persistency R of the current was also calculated by dividing the mean vector speed by the average scalar speed as presented by Palmén (1930)
Most of the averaged velocities have a a stronger northward component in the area, even though the averaged velocities are fairly small. Only the south-west corner of the studied area appears to have a stronger southward component.
We analyzed also the persistence of the flows in different grid boxes. In this study the persistence varied between 17 and 96% per cell in the grid boxes that had over 8 measurements (i.e., the float had measured the averaged currents a week or longer). In common place, the measurement per grid box are consecutive so it is possible that synoptic scale weather phenomena is one explanatory factor for persistent current. Within this method we are able to study effects of the synoptic scale weather effects to the Bothnian Sea.
In the southern part of the study area the persistence is in general fairly small and the directions of the estimated current changes quite often. However, in the middle part of the area the currents are fairly persistently flowing toward north. This is probably partly due to the directing effect of the bottom bathymetry.
Katsumata and Yoshinari (2010) have analyzed the possible sources of errors in measurement in Argo drifting. These are positioning errors, internal clock drift, and unknown surface drift before submerging and after surfacing. In this paper, we took a deeper look on surface drift because unlike the other sources of error, it is not as randomly distributed as the other errors. It is possibly the biggest source of error due to the fact that floats in the Bothnian Sea spend a fairly long portion of their mission time on the surface compared to Argos in the ocean.
The distance drifted needs to be estimated from a model or by estimating the velocity shear in the upper water column (Lebedev et al., 2007). In this study we have estimated the scale of the surface drift from the NEMO implementation in FMI. For this study, we analyzed the year 2014 from the model and observations and estimated the scale of the surface drift by calculating the drifted distance from the model at the surfacing point for each cycle. To avoid excessive error from surface drifting, we removed the measurements that stayed in the surface layer (<20 dbars), where wind has a strong effect on the float movements.
In the depth range of the Bothnian Sea Deep, roughly 100 m, the Argo floats take on average 15 min to reach the parking depth. In general, the speed goal for descending and ascending is 8 cm/s. The exact speed cannot be determined because the first pressure check is done 15 min after the diving procedure starts. In that time the float has usually reached the target depth.
In this study the surface drift time was around 50 min varying from 25 to 166 min depending on how quickly the floats gets the GPS position and how quickly it succeeds in getting the data connection. Another factor that affects the surface drift time is the depth of the profile and hence the amount of data to be sent. The float drifts an unknown distance while ascending, descending and while at the surface, since it reports its location only once per cycle, just before diving.
From the pressure data we assumed that the median amount of time spent in parking pressure was 95% of the total cycle time varying from 90 to 99% from mission to mission. The median value of surface drift time was 2.8% of the cycle, varying from 1 to 4% from mission to mission. The standard deviation for park time is 6% and for surface drift 3.4%. The rest of the cycle is descending (ΔtD) and ascending (ΔtA) (Figure 3).
We were able to evaluate the drifting speed on surface in few cases, as the floats stay on surface for few hours, before recovery transmitting their location roughly once in 10 min. These occasions gave average surface drifting speed of 9 cm/s (lowest 3.2 cm/s, highest 15.5 cm/s). We also estimated the surface drift from model run of the year 2014. On every cycle the float surface time was multiplied by the model surface velocities. This gives us the rough estimation of the scale of surface drift and cannot be understood as the exact drift due to the limitations of the hydrodynamic model. The median value with this method was around 100 m per cycle and maximum 540 m. In this estimation the median value for the distance traveled on the surface is 5%. In comparison, the size of float's internal GPS sensor error is less than 15 m. One must notice that most of the surface drift values are beyond the resolution of current regional 3D models.
Finnish Meteorological Institute has used Argo floats in hydrographic monitoring of the Bothnian Sea for over 6 years. The floats have measured hundreds of profiles in all seasons and we have got lots of new data from the open sea conditions and physics of the Bothnian Sea. Alongside the hydrographic data we have collected a unique dataset of over 700 estimates of the drifting velocity of the floats in their parking depths. We have analyzed those velocity estimates and their uncertainties to see if they are useful and give added value to the monitoring program.
In our measuring strategy the floats stay at maximum pressure and measure the profile from there to the surface. The pressure is defined according to the estimated topography of the area where the float is. Thus the parking depth should represent the deepest layer of the area and drift there the deep currents. The average parking pressure of our whole data set was 90 dbars, but there were differences from mission to mission. In the first two missions the average parking pressure was around 70 dbars, but later on we kept the floats deeper, at more than 95 dbars, even up to 113 dbars pressure.
It should be noted that the observation strategy was not specifically planned for measuring the drift. Thus the time step between observations varies a lot, from a few hours to several days. However, In half of the cases the time step was around one day and in 16% of the cases half a day, which both are much shorter than time steps in conventional Argo float measurements.
The aim of this study was to analyse how well these measurements describe the deep water currents and what kind of uncertainties remains. Therefore we compared our results to the earlier studies in the area.
As shown in the introduction and description of the Bothnian Sea, the general circulation of the sea was described already in the early 1900's. Those descriptions were based on current measurements from research ship and light ships. Some decades later Palosuo (1964) studied the hydrography of the Bothnian Sea and found the cyclonic circulation in the upper layers (15–40 m).
Strong efforts were put to the Gulf of Bothnia in its specific study year 1991. In that context Alenius (1993) concluded that the 60 m currents in the southern Bothnian Sea, on station SR5, were more variable in direction and speed than on coastal stations being less than 20 cm/s with northward currents dominating. Current measurements were done in 1990 and 1991 with Aanderaa RCM-4 and RCM-7 current meters at station SR5 (61.0520N, 19.3555E) (Figure 1) in the central southern Bothnian Sea (Alenius, 1993) for several months in both years with 10 and 15 min time steps. The data consists of over 33,000 individual observations from 113 m depth. In almost half of the observations, the current speed was below the threshold speed, 1.1 cm/s, of the current meters, which makes impossible to estimate the true average speed there. The mean current speed from data including the threshold speed was 4.5 cm/s. There exists also ADCP data and ship measurements from the Bothnian Sea Hietala et al. (2007).
We detected a northward resultant current in the Bothnian Sea deep in accordance with the earlier studies. Our results of current direction and speed were in line with present knowledge in that area. Analysis of the persistence of the deep currents showed that there were some areas where the flow was fairly persistent and the flow toward the north was notably constant.
This is partly due to the topographical steering of the deep area. In the literature we could find values for persistence of the surface currents in the area, which are typically between 20 and 40% (Leppäranta and Myrberg, 2009) or 20 and 90% (Witting, 1912). In general, the deep currents are more persistent than upper layer currents in the open sea.
Our analysis of persistence for the currents shows values that are in accordance of the values found in early literature. The limited number of drift estimates filter out possible short time scale motions which makes difficult to generalize our persistence results. Further studies are needed to analyze the persistence on the longer time scales.
The overall properties of the currents estimated from Argo float trajectories are similar enough to the earlier studies to give confidence that Argo data is useful in describing at least the net transport of the deep waters in the Bothnian Sea. However, because the floats leave the parking depth water mass when they measure the vertical profile, the water mass where they return after the profile measurement and consequent surface drift, is not exactly the same than where they were before. How this affects the results remains to be studied.
Argo float drift is not the best method to describe extreme velocity cases, though such cases may be important in shaping the underwater environment. The strong currents feed energy for the mixing processes, shape the bottom and move matter. The suspension and resuspension caused by friction and turbulence is an important factor in nutrient cycling. These extreme deep currents are difficult to study with hydrodynamic models because of their small scale. With Argo float data, we may still get more accurate information about the strength of the currents.
One major source of error in the deep current estimate is the surface drift of the float, when it determines its position and sends the data and receives instructions. The float can also drift horizontally during the ascent and descent from and to the parking depth. This may especially be the case in measurements in the shallow sea and short time steps between the profiles. For using the floats specifically for deep flow measurements, one should optimize the measurement interval so that our resolution is fine enough to be in the scale of the deep water phenomena to be studied and large enough in comparison to the surface drift so that the error does not overwhelm the whole estimation.
We used surface drift estimates from numerical model and data from the recovery of the floats in our error estimation. During the recovery the float records its position with 10–15 min intervals and sends typically several positions values during the drift at the surface. This is the best estimate of the float's surface drift, for the float behaves similarly during the mission.
The data collected in the recovery includes only fairly calm wind situations so it would be beneficial to measure the surface drift also in windy situations to achieve the speed range of the wind driven drift.
We are still on the way of studying other methods to estimate the surface drift of our floats and how it really affects to the estimates of deep currents.
Our aim was to study how well Argo float measurements describe the deep water currents and what kind of uncertainties remains. As the drift of the float follows the water mass, we conclude that we have caught the water mass movements of the deep water in the Bothnian Sea, which is essential for the long-term environmental conditions in the basin.
Argo floats have been used for years in the ocean monitoring for their reliability, affordability, weather independence, and real-time data sending after profiling.In this study we have shown that they are usable also for current estimation in the very shallow semi-enclosed sea as the Baltic Sea.
In shallow waters the Argo floats have still limitations, some of which may be resolved in the future. The strength and weakness of Argos is that they are not stationary. Larger areas can be covered with the floats, but the prevailing currents steer their movement mostly. We can steer the floats in some degree by adjusting the cycle length and the diving pressure or by keeping the float at the surface when it drifts to the desired direction there, but the true destination remains still dependent on the currents and winds.
For shallow water the lack of altimeter in the float forces to define the parking pressure by relying on the existing bathymetric data, which is not always accurately known. Thus the very near-bottom currents remain out of sight of the floats.
Even though the floats are used for routine monitoring, their capacity allows to react to differing conditions and increase the observing frequency when needed. Coordinated use of Argo floats and other autonomous vehicles, like gliders, increase the monitoring and research possibilities even further.
In the future with better GPS positioning at the surface we can reduce the error in deep water flow estimates and we can get surface drift estimates, too. With these features we may give new use for the Argo data in monitoring and this comes without any extra costs. Argo floats have become an integral part of the Baltic Sea monitoring and they serve scientific research, too.
The next step is the optimizing of the number of floats as well as their measuring frequency as already studied in the Black Sea (Grayek et al., 2015). Optimization depends on many factors, such as whether studying long-term changes in the current field or quick changes caused by low pressure systems.
In order to be able to detect mesoscale phenomena, we need to have measurements in time interval of days and spatial scale of kilometres, which can be easily achieved by Argo measurements as shown in our study. These mesoscale phenomena are for example eddies, lenses of different water masses and effects of mixing in the water column during the storms. These measurements can be used as well in analysing the present conditions as well as in developing the hydrodynamic models, forecasts, and scenario studies for the future.
We may also use the Argo data to estimate the age of the water in the basin, as is done with models by Myrberg and Andrejev (2006) Also, the data may be used to study, for example, the salinity changes and oxygen conditions under the halocline and the accumulation of environmentally harmful substances in the deep areas.
By combining Argo data with other in-situ measurements and hydrodynamic model results we could get a more complete picture of the water movements in the Gulf of Bothnia. Argos have been used already before in the ocean to characterize the interplay of the different water masses and currents (e.g., Gasparin et al., 2011).
These measurements could also be assimilated into forecasting systems with hydrodynamical models to gain a better understanding of the dynamics in the deep areas (e.g., Taillandier et al., 2010). The better we understand the connections between the sea and the atmosphere, the better we can estimate the effects of the changing climate on the biotic and abiotic environment.
All authors contributed to planning of this study. PR wrote the first draft and did largely the analyses for the observations and model results. S-MS and NH contributed on analyses and illustrations. PR, NH, and PA did literature and background research. AW did the 3D modeling for this study and contributed on analyzing the model results. TP participated significantly on acquisition of the data and evaluation of the measurements with PR and NH. All authors wrote sections for this manuscript and revised and approved the final version.
The authors declare that the research was conducted in the absence of any commercial or financial relationships that could be construed as a potential conflict of interest.
These data were collected and made freely available by the International Argo Program and the national programs that contribute to it (http://www.argo.ucsd.edu, http://argo.jcommops.org). The Argo Program is part of the Global Ocean Observing System. The authors want to thank Laura Tuomi for enabling and commenting this work and Eemeli Aro for technical support in the early phases of the Baltic Sea Argo monitoring. This work has been partly supported by the Strategic Research Council at the Academy of Finland, project SmartSea (grant number 292 985).
Alenius, P. (1993). “Finnish Eulerian current measurements,” in The Gulf of Bothnia Year 1991. Physical Transport Experiments, SMHI Reports Oceanography (Norrköping: Swedish Meteorological and Hydrological Institute), 30–40.
Argo (2000). Argo float data and metadata from global data assembly centre (Argo GDAC). SEANOE. doi: 10.17882/42182
Backer, H., and Frias, M. (2013). Planning the Bothnian Sea–Key Findings of the Plan Bothnia project. Plan Bothnia.
Bulczak, A., Rak, D., Schmidt, B., and Beldowski, J. (2016). Observations of near-bottom currents in Bornholm Basin, Slupsk Furrow and Gdansk Deep. Deep Sea Res. II Top. Stud. Oceanogr. 128, 96–113. doi: 10.1016/j.dsr2.2015.02.021
Carval, T., Keeley, B., Takatsuki, Y., Yoshida, T., Loch, S., Schmid, C., et al. (2015). ARGO User's Manual, Version 3.2. (Ifremer). doi: 10.13155/29825
Fonselius, S., and Valderrama, J. (2003). One hundred years of hydrographic measurements in the Baltic Sea. J. Sea Res. 49, 229–241. doi: 10.1016/S1385-1101(03)00035-2
Gasparin, F., Ganachaud, A., and Maes, C. (2011). A western boundary current east of New Caledonia: observed characteristics. Deep Sea Res. I Oceanogr. Res. Pap. 58, 956–969. doi: 10.1016/j.dsr.2011.05.007
Grayek, S., Stanev, E. V., and Schulz-Stellenfleth, J. (2015). Assessment of the Black Sea observing system. A focus on 2005-2012 Argo campaigns. Ocean Dyn. 65, 1665–1684. doi: 10.1007/s10236-015-0889-8
Haapala, J., and Alenius, P. (1994). Temperature and salinity statistics for the northern Baltic Sea 1961-1990. Finn. Mar. Res. 262, 51–121.
Haavisto, N., Tuomi, L., Roiha, P., Siiriä, S.-M., Alenius, P., and Purokoski, T. (2018). Argo floats as a novel part of the monitoring the hydrography of the Bothnian Sea. Front. Mar. Sci. 5:324. doi: 10.3389/fmars.2018.00324
Hietala, R., Lundberg, P., and Nilsson, J. A. (2007). A note on the deep-water inflow to the Bothnian Sea. J. Mar. Syst. 1, 255–264. doi: 10.1016/j.jmarsys.2006.12.004
Hordoir, R., Axell, L., Löptien, U., and Dietze, H. (2015). Influence of sea level rise on the dynamics of salt inflows in the Baltic Sea. J. Geophys. Res. 120, 6653–6668. doi: 10.1002/2014JC010642
Hordoir, R., Dieterich, C., Basu, C., Dietze, H., and Meier, H. (2013). Freshwater outflow of the Baltic Sea and transport in the Norwegian current: a statistical correlation analysis based on a numerical experiment. Contin. Shelf Res. 64, 1–9. doi: 10.1016/j.csr.2013.05.006
Kahru, M., Håkansson, B., and Rud, O. (1995). Distributions of the sea-surface temperature fronts in the Baltic Sea as derived from satellite imagery. Contin. Shelf Res. 15, 663–679.
Katsumata, K., and Yoshinari, H. (2010). Uncertainties in global mapping of Argo drift data at the parking level. J. Oceanogr. 66, 553–569. doi: 10.1007/s10872-010-0046-4
Korotaev, G., Oguz, T., and Riser, S. (2006). Intermediate and deep currents of the Black Sea obtained from autonomous profiling floats. Deep Sea Res. II Top. Stud. Oceanogr. 53, 1901–1910. doi: 10.1016/j.dsr2.2006.04.017
Kuosa, H., Fleming-Lehtinen, V., Lehtinen, S., Lehtiniemi, M., Nygård, H., Raateoja, M., et al. (2017). A retrospective view of the development of the Gulf of Bothnia ecosystem. J. Mar. Syst. 167, 78–92. doi: 10.1016/j.jmarsys.2016.11.020
Large, W. G., and Yeager, S. G. (2004). Diurnal to Decadal Global Forcing for Ocean and Sea-Ice Models: the Data Sets and Flux Climatologies. NCAR Technical Note, NCAR/TN-460+STR, CGD Division of the National Center for Atmospheric Research.
Lavender, K. L., Owens, W. B., and Davis, R. E. (2005). The mid-depth circulation of the subpolar North Atlantic Ocean as measured by subsurface floats. Deep Sea Res. I Oceanogr. Res. Pap. 52, 767–785. doi: 10.1016/j.dsr.2004.12.007
Le Traon, P. Y. (2013). From satellite altimetry to Argo and operational oceanography: three revolutions in oceanography. Ocean Sci. 9, 901–915. doi: 10.5194/os-9-901-2013
Lebedev, K. V., Yoshinari, H., Maximenko, N. A., and Hacker, P. W. (2007). Yomaha'07: Velocity Data Assessed from Trajectories of Argo Floats at Parking Level and at the Sea Surface. International Pacific Research Center (IPRC) Technical Note.
Leppäranta, M., and Myrberg, K. (2009). Physical Oceanography of the Baltic Sea. Berlin: Springer. doi: 10.1007/978-3-540-79703-6
Marmefelt, E., and Omstedt, A. (1993). Deep water properties in the Gulf of Bothnia. Contin. Shelf Res. 13, 169–187.
Meier, H. E. M., Feistel, R., Piechura, J., Arneborg, L., Burchard, H., Fiekas, V., et al. (2006). Ventilation of the Baltic Sea deep water: a brief review of present knowledge from observations and models. Oceanologia 48, 133–164.
Menna, M., and Poulain, P. M. (2010). Mediterranean intermediate circulation estimated from Argo data in 2003-2010. Ocean Sci. 6, 331–343. doi: 10.5194/os-6-331-2010
Murthy, R., Håkansson, B., and Alenius, P. (1993). The Gulf of Bothnia Year 1991 Physical Transport Experiments. Technical Report 15, SMHI, Norrköping.
Myrberg, K., and Andrejev, O. (2006). Modelling of the circulation, water exchange and water age properties of the Gulf of Bothnia. Oceanologia 48S, 55–74.
Palmén, E. (1930). Untersuchungen über die Strömungen in den Finnland umgebenden Meeren. Soc. Sci. Fenn. Comm. Phys. Math. 12, 1–82.
Palosuo, E. (1964). A description of the seasonal variations of water exchange between the Baltic Proper and the Gulf of Bothnia. Merentutkimuslaitoksen Julkaisu 215 32, 1–32.
Park, J. J., Kim, K., King, B. A., and Riser, S. C. (2005). An advanced method to estimate deep currents from profiling floats. J. Atmos. Ocean. Technol. 22, 1294–1304. doi: 10.1175/JTECH1748.1
Purokoski, T., Aro, E., and Nummelin, A. (2013). First long-term deployment of Argo float in Baltic Sea Argo's inaugural operation in shallow, low-salinity water. Sea Technol. 54, 41–44.
Raateoja, M. (2013). Deep-water oxygen conditions in the Bothnian Sea. Boreal Environ. Res. 18, 235–250.
Riser, S. C., Freeland, H. J., Roemmich, D., Wijffels, S., Troisi, A., Belbeoch, M., et al. (2016), Fifteen years of ocean observations with the global Argo array, Nat. Clim. Change 6, 145–153, doi: 10.1038/nclimate2872
SMHI (1982). “Climatological ice atlas for the Baltic Sea, Kattegat, Skagerrak and lake Vänern (1963-1979),” in Swedish Meteorological and Hydrological Institute & Institute of Marine Research, Finland. Norrköping.
Suhhova, I., Liblik, T., Madis-Jaak, L., and Urmas, L. (2018). A descriptive analysis of the linkage between the vertical stratification and current oscillations in the Gulf of Finland. Boreal Environ. Res. 23, 83–103.
Taillandier, V., Dobricic, S., Testor, P., Pinardi, N., Griffa, A., Mortier, L., et al. (2010). Integration of Argo trajectories in the Mediterranean forecasting system and impact on the regional analysis of the western Mediterranean circulation. J. Geophys. Res. Oceans 115:C03007. doi: 10.1029/2008JC005251
Uotila, J., Launiainen, J., and Vihma, T. (1996). Analysis of the surface drift currents in the Bothnian Sea. Oceanogr. Lit. Rev. 5:432.
Voet, G., Quadfasel, D., Mork, K. A., and Søiland, H. (2010). The mid-depth circulation of the Nordic Seas derived from profiling float observations. Tellus A 62, 516–529.
Westerlund, A., Tuomi, L., Alenius, P., Miettunen, E., and Vankevich, R. E. (2018). Attributing mean circulation patterns to physical phenomena in the Gulf of Finland. Oceanologia 60, 16–31. doi: 10.1016/j.oceano.2017.05.003
Westerlund, A., and Tuomi, L. (2016). Vertical temperature dynamics in the Northern Baltic Sea based on 3D modelling and data from shallow-water Argo floats. J. Mar. Syst. 158, 34–44. doi: 10.1016/j.jmarsys.2016.01.006
Wieczorek, G. (2012). Spatiotemporal Scales of the Deep Circulation in the Eastern Gotland Basin/Baltic Sea. Ph.D. thesis. Meereswissenschaftliche Berichte MARINE SCIENCE REPORTS No. 88 Leibniz-Institut für Ostseeforschung Warnemünde.
Witting, R. (1912). Zusammenfassende übersicht der Hydrographie des Bottnischen und Finnischen Meerbusens und der Nördlichen Ostsee. Finnländische hydrographisch-biologische Untersuchungen.
Keywords: autonomous, measurement device, real-time, ocean observations, circulation, environmental monitoring, hydrography
Citation: Roiha P, Siiriä S-M, Haavisto N, Alenius P, Westerlund A and Purokoski T (2018) Estimating Currents From Argo Trajectories in the Bothnian Sea, Baltic Sea. Front. Mar. Sci. 5:308. doi: 10.3389/fmars.2018.00308
Received: 13 March 2018; Accepted: 10 August 2018;
Published: 12 September 2018.
Edited by:
Elinor Andrén, Södertörn University, SwedenReviewed by:
Taavi Liblik, Tallinn University of Technology, EstoniaCopyright © 2018 Roiha, Siiriä, Haavisto, Alenius, Westerlund and Purokoski. This is an open-access article distributed under the terms of the Creative Commons Attribution License (CC BY). The use, distribution or reproduction in other forums is permitted, provided the original author(s) and the copyright owner(s) are credited and that the original publication in this journal is cited, in accordance with accepted academic practice. No use, distribution or reproduction is permitted which does not comply with these terms.
*Correspondence: Petra Roiha, cGV0cmEucm9paGFAZm1pLmZp
Disclaimer: All claims expressed in this article are solely those of the authors and do not necessarily represent those of their affiliated organizations, or those of the publisher, the editors and the reviewers. Any product that may be evaluated in this article or claim that may be made by its manufacturer is not guaranteed or endorsed by the publisher.
Research integrity at Frontiers
Learn more about the work of our research integrity team to safeguard the quality of each article we publish.