
95% of researchers rate our articles as excellent or good
Learn more about the work of our research integrity team to safeguard the quality of each article we publish.
Find out more
METHODS article
Front. Mar. Sci. , 20 August 2018
Sec. Coastal Ocean Processes
Volume 5 - 2018 | https://doi.org/10.3389/fmars.2018.00286
This article is part of the Research Topic Spatial and Temporal Variability of Seawater Chemistry in Coastal Ecosystems in the Context of Global Change View all 13 articles
 Tatsuki Tokoro*
 Tomohiro Kuwae
The capture of carbon by aquatic ecosystems and its sequestration in sediments has been studied as a potential method for mitigating the adverse effects of climate change. However, the evaluation of in situ atmospheric CO2 fluxes is challenging because of the difficulty in making continuous measurements over areas and for periods of time that are environmentally relevant. The eddy covariance method for estimating atmospheric CO2 fluxes is the most promising approach to address this concern. However, methods to process the data obtained from eddy covariance measurements are still being developed, and the estimated air-water CO2 fluxes have large uncertainties and differ from those obtained using conventional methods. In this study, we improved the post-processing procedure for the eddy covariance method to reduce the uncertainty in the measured air-water CO2 fluxes. Our procedure efficiently removes low-quality fluxes using a combination of filtering methods based on the received signal strength indicator of the eddy covariance sensor, the normalized standard deviation of atmospheric CO2 and water vapor concentrations, and a high-pass filter. The improved eddy covariance fluxes revealed diurnal and semi-diurnal cycles and a significant relationship with water fCO2, patterns that were not observed from the results before filtering. Although there were still differences with indirect conventional measurements like the bulk formula method, the methods used in this study should improve the accuracy of carbon flow estimates at sites with complex terrains like coastal areas.
Aquatic environments are considered critical to the mitigation of adverse climate change effects because of their ability to store atmospheric CO2. Previous studies have estimated that the ocean absorbs approximately one-fourth of the CO2 emitted by anthropogenic activities (IPCC, 2013). However, the effect of shallow aquatic ecosystems on atmospheric CO2 remains a controversial topic. Several previous studies, after taking into account carbon inputs from land, have concluded that shallow aquatic ecosystems are sources of atmospheric CO2 (e.g., Gazeau et al., 2005; Borges et al., 2006; Chen et al., 2013). In contrast, some autotrophic, shallow aquatic ecosystems have been reported to be net sinks for atmospheric CO2 (e.g., Schindler et al., 1997; Tokoro et al., 2014).
In situ measurements of atmospheric CO2 fluxes are necessary for precise analysis of carbon cycling in aquatic environments. CO2 fluxes in aquatic environments are difficult to determine because of the variability of several factors, including concentrations of CO2 in the water and air and the physical characteristics of the atmosphere and water surface. Several methods have been proposed for measuring in situ CO2 fluxes. Because each of these methods works best at a different combination of spatial and temporal scales and is associated with different costs and technical difficulties, a variety of methods have been applied to different aquatic environments (e.g., oceans, estuaries, and lakes) to assess rates of aquatic carbon cycling.
Methods of estimating air-water CO2 fluxes can be assigned to one of two categories: (1) indirect estimations based on CO2 concentration gradients just below the water surface (Lewis and Whitman, 1924) or from the renewal rate of a very small body of water (Danckwerts, 1951) and (2) direct estimations. With either of the indirect methods, the CO2 flux is calculated from the product of the difference in the CO2 fugacity (fCO2) between air and water, the CO2 solubility, and a physically regulated parameter called the transfer velocity. Because the transfer velocity cannot be estimated directly, empirical and hydrodynamic models for estimating transfer velocities have been proposed (Garbe et al., 2014).
At the present time, the empirical model is primarily used for evaluating aquatic CO2 fluxes because of the difficulty in applying the hydrodynamic model. In the empirical model, the regulating factor for transfer velocity has been identified from several direct CO2 measurements by using tracers such as 14C and SF6 (e.g., Broecker and Peng, 1982; Ho et al., 2014) or water-tank experiments (e.g., Komori et al., 1993). Based on these results, several empirical equations have been formulated manly for the open ocean fluxes. The wind speed above the water surface is a metric of one regulating factor (e.g., Liss and Merlivat, 1986; Wanninkhof, 1992; Ho et al., 2006). In the case of shallow systems, water velocity fields and depths also have been used to estimate the gas transfer velocity (O'Conner and Dobbins, 1958; Borges et al., 2004).
However, the relationship between the gas transfer velocity and such environmental parameters is affected by the topography (depth, bottom roughness, distance from the land, etc.) and is site-specific (e.g., Tokoro et al., 2008) especially at coastal area because the physical conditions near the water surface that unambiguously regulate the gas transfer velocity are functions of the topography, even under the same wind and current conditions. Furthermore, application of the empirical method is limited by its poor temporal and spatial coverage. Moreover, the determination in most previous studies of air-water CO2 fluxes as snapshots that did not account for diurnal changes or annual cycles resulted in considerable uncertainty and bias (Kuwae et al., 2016). In brackish environments in particular, temporal variability of water fCO2 is significant, and because the carbonate buffer effect is weak, fluctuations of fCO2 become very large (Zeebe and Wolf-Gladrow, 2001). Use of empirical methods to carry out a comprehensive analysis of dynamic carbon cycling in aquatic environments with large spatial and temporal variability would therefore be very costly and require much effort.
Another method for evaluating air-water CO2 fluxes is direct measurement of in situ fluxes. One such technique involves use of a chamber floating on the water surface (e.g., Frankignoulle, 1988; Tokoro et al., 2008). The floating chamber method is used to determine the air-water CO2 flux from continuous measurements of CO2 concentrations in the air inside a hollow, box-shaped device floating on the water surface. Although this method is the easiest of the direct methods to use in shallow coastal waters because of its relative simplicity, like the empirical method it is poorly suited for obtaining long-term measurements over wide areas.
Another direct measurement technique is the eddy covariance (EC) method, which is commonly used to determine mass and heat fluxes in terrestrial environments and has recently been used to estimate air-water fluxes of greenhouse gases (e.g., Tsukamoto et al., 2004). The determination of the EC CO2 flux is based on the micrometeorological behavior of atmospheric eddy diffusion and is calculated from the covariance of atmospheric CO2 concentrations and vertical wind speeds measured at high frequency (more than 10 Hz). Because EC measurements can be performed automatically and represent the flux over a large area, the EC method can be used to obtain a detailed analysis of CO2 fluxes.
Despite the promise of EC measurements, their application in aquatic environments remains challenging (Tsukamoto et al., 2004; Rutgersson and Smedman, 2010; Vesala, 2012; Blomquist et al., 2013; Ikawa and Oechel, 2014; Kondo et al., 2014; Landwehr et al., 2014). The main difficulty is that the air-water CO2 flux is small compared with the air-land CO2 flux (Vesala, 2012; Landwehr et al., 2014).
There are several other problems in addition to the small fluxes in using EC measurements in aquatic environments. The uncertainty of EC measurements has been attributed to the spatial and temporal heterogeneity of water (Mørk et al., 2014). The EC flux is calculated as the average within a measurement area called the “footprint,” which can range from several hundred meters to several kilometers windward from the measurement point (e.g., Schuepp et al., 1990). Therefore, EC fluxes at heterogeneous water sites are different from the fluxes determined by methods that estimate the CO2 flux in an area of only several square meters (e.g., the empirical method and floating chamber method). The inflow of terrestrial air can cause unnatural temporal changes in the atmospheric CO2 concentration and spatial heterogeneity at the measurement site. It is therefore necessary to account for the characteristics of the aquatic environment and carry out post-processing (Leinweber et al., 2009) to avoid large uncertainties or biases in EC flux calculations. Relevant procedures include use of a statistical test based on the short-term variance of CO2 and vertical wind speed and measurement of the integral turbulent characteristics of vertical wind and air temperature (Mauder and Foken, 2004).
In this study, we improved a post-processing procedure for aquatic EC measurements that excludes low-quality data and corrects unnatural changes in EC measurements by using a series of data-filtering steps. The improved process is based on the idea that the unnatural changes during flux measurements causes spikes, drifts, offsets, and long-term variation of the CO2 and H2O raw data. We compared the results calculated with our procedure to those obtained using conventional EC post-processing procedures along with an existing EC filtering procedure and a parameter of the indirect model. We then discuss the differences among these post-processing methods with respect to the regulating factors of aquatic CO2 fluxes.
Continuous EC measurement data were used for the evaluation of the post-processing procedure and analysis of atmospheric-aquatic ecosystem CO2 exchanges. The data were collected from a brackish lagoon in Japan (the Furen Lagoon, Figure 1) from 28 May to 21 October 2014, during which time the water surface was not frozen. Most of the study area (57.4 km2) was covered by seagrass meadows (mainly Zostera marina). The water was shallow (1–2 m), except in a channel that connected the eastern and western basins of the lagoon (approximately 5 m deep). Freshwater flows into the western basin through several rivers that run through the surrounding grass farms, and seawater is exchanged through the lagoon mouth, which opens to the Okhotsk Sea. A previous study has found that the air-water CO2 flux in the lagoon is affected by changes of salinity caused by the inflow of river water and tides as well as by changes of dissolved inorganic carbon resulting from biological processes such as photosynthesis (Tokoro et al., 2014). The measurement platform was built at the same site used in that previous study (43°19.775′ N, 145°15.463′ E); the effects of photosynthesis and changes in salinity are most notable at this location in the lagoon (Tokoro et al., 2014).
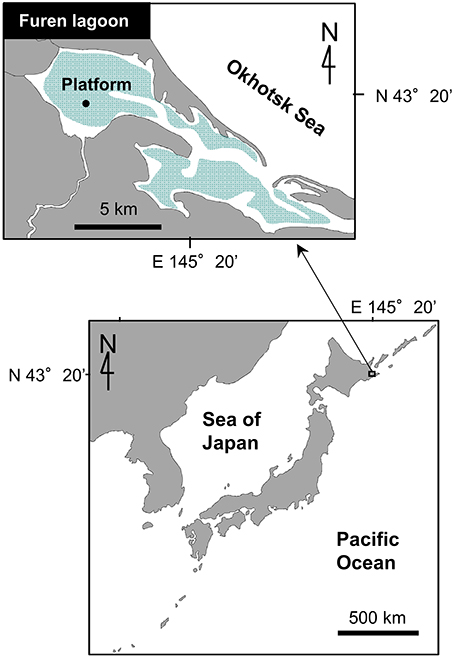
Figure 1. Location of the measurement site (Furen Lagoon, Hokkaido, Japan). The lagoon is shallow (1–2 m). Green area indicates seagrass meadows. Eddy covariance (EC) measurements were performed on the platform in 2014.
The EC devices used in this study were as follows. Atmospheric CO2 concentrations and water vapor were measured with an open-path sensor (LI-7500A, LI-COR, USA). The three-dimensional (3D) wind velocity, air temperature, and atmospheric pressure were measured with a 3D sonic anemometer (CSAT-3, Campbell Scientific, USA). The data were logged and managed by a SMARTFlux system (LI-COR, USA). The open-path sensor and the wind velocimeter were attached to the platform approximately 3.0–5.5 m above the water surface (the height varied with the tide). The sampling rate for all data was 10 Hz, and the fluxes (CO2, water vapor, and heat) were calculated as averages over 30-min intervals. Batteries and solar panels were attached to the platform as power sources. Battery replacement, data collection, and device maintenance were performed approximately every 2 weeks. Water temperature and salinity were measured continuously with a conductivity-temperature sensor (Compact-CT, Alec, Japan).
The conventional EC flux calculation method (hereafter PP1) is described in this section, for comparison with the proposed improved procedure introduced in the next section. The air-water CO2 flux (F) was calculated every 30 min using the following equation:
where the coefficients F1 and F2 are correction terms based on the transfer functions that correct for the frequency attenuation of the air-sea CO2 flux caused by the response time of the sensor, path-length averaging, sensor separation, signal processing, and flux-averaging time (Massman, 2000). The first term on the right-hand side of Eq. (1) is the product of F1 and the uncorrected air-sea CO2 flux calculated as the covariance of the CO2 density ρc and the vertical wind speed w (the bar and the prime indicate the mean and the deviation from the mean, respectively). The second and third terms are the Webb-Pearman-Leuning (WPL) correction of latent heat and sensible heat, respectively (Webb et al., 1980). The other variables in Eq. (1) are defined as follows: ρd is dry air density, ρv is water vapor density, Ta is air temperature, and μ is the ratio of the molar weight of dry air to that of water vapor. The footprint (measurement area) depends on several factors, including the measurement height, wind speed, atmospheric stability, and measurement site roughness (10−4 cm) (Schuepp et al., 1990; Kondo, 2000). This footprint was several hundred meters on the windward side of the measurement site.
The deviation of each parameter in Eq. (1) was calculated by subtracting the 30 min average from the instantaneous data after deleting obviously low-quality data (e.g., negative values of CO2 or water vapor concentration). Other corrections to the raw data included coordinate rotation of the 3D wind component (double rotation; Lee et al., 2004), time lag of the measurement due to the separation of the CO2 sensor and the wind velocimeter (covariance maximization; Lee et al., 2004), exclusion of wind data contaminated by the wind velocimeter frame, and correction of the measurement noise (Vickers and Mahrt, 1997) based on the default settings of the data management software (EddyPro 5.1.1, LI-COR, USA).
For comparison with our improved post-processing procedure described in the next section, a conventional post-processing was applied to the PP1 data. The conventional post-processing was the statistical test using the short-term variation of CO2 concentrations and vertical wind speeds, and the integral turbulent characteristics of vertical wind speed and air temperature (Mauder and Foken, 2004; hereafter, the test is designated the “TK2” from the software package). The TK2 test has been widely implemented in several software applications, including EddyPro. We used the optional EddyPro output with default setting.
After calculating the EC flux using conventional post-processing as described in Sect. 2.2 (PP1), we recalculated the EC flux using our improved post-processing procedure (called PP2 hereafter; Figure 2). The PP2 procedure is based mainly on excluding low-quality data and high-pass (HP) filtering. It is also focused on aquatic environments in which the spatial and temporal variations of atmospheric CO2 are large. The procedure combines a series of filtering methods based on the received signal strength indicator (RSSI) of the EC sensor, the normalized standard deviation (nSD) of the atmospheric CO2 and water vapor concentrations, and HP filtering detrending of the raw CO2 signal.
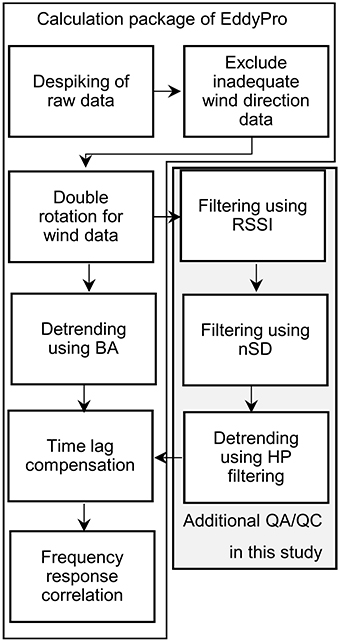
Figure 2. Post-processing methods for EC flux calculations. The EC CO2 flux was calculated by using conventional post-processing (PP1) in EddyPro. The corrections involved in PP1 have been described in previous publications (e.g., Lee et al., 2004). Detrending was performed by using block averaging (BA). Our new post-processing method (PP2) included two data-filtering steps based on the received signal strength indication of the CO2 sensor and the standard deviation of the CO2 and water vapor concentrations divided by the corresponding average standard deviation during the measurement period (nSD). Detrending in PP2 was performed by using high-pass filtering (Massman, 2000).
The RSSI, obtained from the CO2 sensor of the EC measurement instrumentation every 30-min, indicates the available signal strength of the sensor. This parameter has been used to assess the validity of the measurement. In this study, we used the RSSI to filter the CO2 data. First, data in the 30 min time series were excluded if their RSSI was low. The RSSI threshold for exclusion was set to 90% in this study because the number of data remaining after the RSSI filtering rapidly decreased at thresholds above this value (e.g., 91 and 78% of the data remained at RSSI thresholds of 90 and 95%, respectively).
Second, criteria for excluding low-quality fluxes were identified. Low-quality fluxes were identified from unnatural discontinuous change in the CO2 and vapor data, which might cause the interference to CO2 measurement. Such data were excluded based on the normalized standard deviation (nSD), calculated as follows: (1) calculate the SD of 10 Hz CO2 and vapor concentration for every 30 min measurement; (2) divide each CO2 and vapor SD by the mean RSSI-filtered CO2 and vapor concentration during the entire measurement period (CO2: 16.02 mmol m−3, water vapor: 548.10 mmol m−3), respectively; and (3) take the larger value of the divided CO2 or vapor SD for every 30 min measurement. For the determination of the threshold, we checked the ten most extreme outliers of the CO2 fluxes, which were probably low-quality, and we confirmed whether they were actually low-quality or not by visual confirmation of whether there were unnatural discontinuous change, or extreme values (negative concentration or values that differed from natural values by more than a factor of 1000). We found that the nSD threshold eliminated all of the actually low-quality data among these top ten outliers. In this case, we set the nSD threshold value to the lowest value among the ten low-quality data (0.050).
Finally, HP filtering was applied to detrend the raw concentration deviations in Eq. (1), in place of simple mean subtraction used in the PP1 procedure. This procedure corrected relatively long-term (several minutes to 30 minutes) variations in CO2 or water vapor concentrations that were independent of eddy fluctuations and were caused by the temporal and spatial heterogeneity of the atmospheric mass. HP filtering is often applied to measurements in a complex environment; however, incorrect application of HP filtering results in underestimation of fluxes (Lee et al., 2004). HP filtering was applied by using an exponential moving average as follows:
where xi and xi′ are an instantaneous datum and filtered datum for PP2 at time i, respectively. The latter parameter is plugged in the Eq. (1) as the deviation from the mean. The parameter τ is the time constant of the exponential moving average, which was determined to be 150 s in a previous study (McMillen, 1988). This value means 1, 50, and 99% of the CO2 fluxes (cospectrum of CO2 and vertical wind speed) are reduced at frequencies lower than 1/15, 1/150, and 1/1,500 Hz, respectively (Massman, 2000). Therefore, the effect of long-term variation of CO2 in each measurement (during 30 min = 1/1,800 Hz) could be excluded. HP filtering was applied to all of the measured instantaneous data (i.e., 3D wind velocity, air temperature, CO2 and water vapor concentrations, and atmospheric pressure). The parameter f is the sampling frequency (10 Hz).
In the indirect model, flux is calculated as the product of the gas transfer velocity, the CO2 solubility in water, and the difference in CO2 fugacity between air and water (Lewis and Whitman, 1924). However, the method of estimating the gas transfer velocity has varied and should probably be site-specific in coastal areas, as described above. The estimation should be inaccurate at our site, in particular, where the water depth was very shallow and seagrass was abundant. We therefore decided to compare the difference in CO2 fugacity (Δf CO2) with EC data as a theoretical regulating factor of air-water CO2 flux.
The measurements were performed during the daytime on 29 May, 15 July, and 21 September 2014 for comparison with the EC measurements. The water samples used to determine CO2 fugacity in water (f CO2water) were collected just below the water surface (up to 20 cm below the water surface) to measure the concentration of CO2 where direct gas exchange with air occurs. The sampling was performed within the EC footprint (estimated from Schuepp et al., 1990) for purposes of comparing the CO2 fugacity and EC fluxes. The sampling points were determined from the wind direction and the distance from the platform measured using a hand-held GPS unit (Venture HC, Garmin, USA; see Table S1). The water f CO2 was determined from the total alkalinity and the dissolved inorganic carbon content of the water sample using a batch-type carbonate measurement system (ATT-05, Kimoto electrics, Japan) and the CO2SYS program (Pierrot et al., 2006). The CO2 fugacity in air (f CO2air) was calculated from the CO2 concentration, air temperature, pressure, and humidity measured by the EC devices.
During the deployment period, 4,464 flux data points corresponding to 2,232 h were obtained; 1971 of those data points (44%) were excluded as low-quality data after PP1 application. The mean and SD of the EC CO2 fluxes were−1.93 and 52.4 μmol m−2 s−1, respectively. Figure 3A shows the retained CO2 flux data.
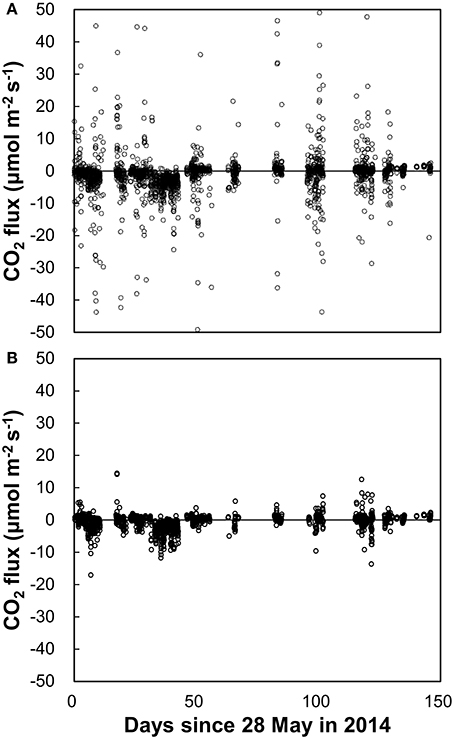
Figure 3. EC CO2 fluxes with (A) PP1 (mean: −1.93 μmol m−2 s−1, SD: 52.4 μmol m−2 s−1, n = 2,502) and with (B) PP2 (mean: −0.54 μmol m−2 s−1, SD: 2.2 μmol m−2 s−1, n = 1,833). Several data points in panel (A) are off the scale and not shown for comparison with (B), in which all data are shown.
Examples of PP1 measurements were some extremely high values of the CO2 fluxes. The largest positive CO2 flux (release to atmosphere) was 156.51 μmol m−2 s−1 at 2:00 on 23 June (day 56). The largest negative CO2 flux (uptake of atmospheric CO2) was −217.93 μmol m−2 s−1 at 22:00 on 4 October (day 129). These fluxes were more than three orders of magnitude larger than the average of the measured EC fluxes. Figure 4 shows the instantaneous atmospheric CO2 concentration, water vapor concentration, and the cumulative covariance between CO2 and vertical wind speed during the times when the CO2 fluxes were most positive or most negative. Among the most positive data, spikes and discontinuities were observed in the atmospheric CO2 and water vapor concentrations, despite the prior correction applied by the PP1 processing. On the other hand, shifts of atmospheric CO2 and vapor were observed during the first 5 min for the most negative data. On the other hand, shifts of atmospheric CO2 and vapor were observed during the first 5 min for the most negative data, leading to two unnatural fluctuations in the flux during the first 5 min. This fluctuation in the computed flux was caused by the cross-sensitivity (interference between CO2 and vapor measurement) given the unnatural change of vapor and the inverse correlation between CO2 and vapor. The cumulative covariance indicated that the covariance at certain periods (0–5 min) contributed significantly to the total cumulative covariance.
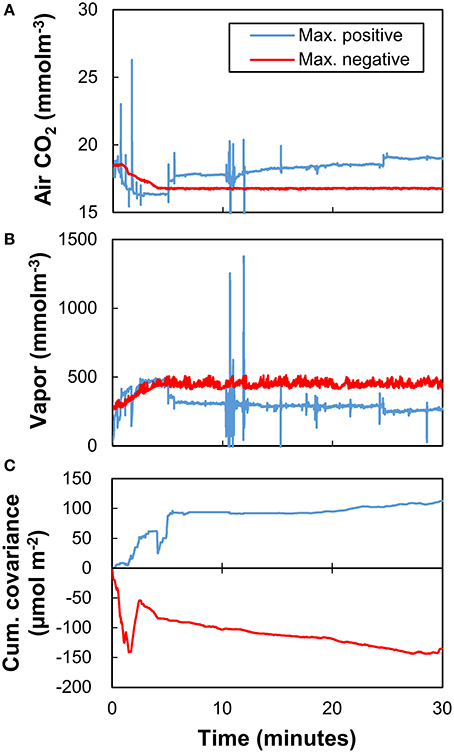
Figure 4. Instantaneous values of (A) atmospheric CO2 concentration, (B) water vapor (atmospheric H2O) concentration, and (C) cumulative covariance of atmospheric CO2 concentration and vertical wind speed calculated with PP1 when the CO2 fluxes showed the largest positive value (156.5 μmol m−2 s−1; blue) and the largest negative value (−217.9 μmol m−2 s−1; red). Note that the covariance was not equal to the CO2 flux because there was no Webb-Pearman-Leuning correction.
The TK2 test flagged the best quality data (flagged “0” in the EddyPro output), the general quality data (flagged “1”), and wrong data that should be discarded (flagged “2”). The mean and SD after removal of the data flagged “2” from PP1 were −2.53 and 57.2 μmol m−2 s−1, respectively (196 data removed). The mean and SD after removal of the data flagged “1” and “2” from PP1 (only data flagged “0” were retained) were −2.15 and 4.48 μmol m−2 s−1, respectively (1395 data removed).
Figure 3B shows the EC CO2 flux data subjected to PP2 (RSSI, nSD, and HP filtering). Of the 2,493 total data points remaining after PP1, approximately 234 (9%) were excluded by RSSI filtering. Subsequent nSD filtering removed 426 additional data points (17%); approximately 73% of the measurement data remained after this filtering. The mean and SD of the EC CO2 flux after PP2 were −0.54 and 2.2 μmol m−2 s−1, respectively. For comparison, the mean and SD obtained by block averaging, not HP filtering, were −1.02 and 2.74 μmol m−2 s−1, respectively.
The number of data remaining after PP2 was almost the same during the day and night, but the average value of the flux shifted to positive in the daytime. This shift was observed after HP filtering in PP2 but not after excluding data with the nSD (Figure 5). Cumulative fluxes showed an influx in the summer season and an efflux in autumn and winter (Figure 6). The trend was the same between PP1 and PP2 data, but a large jump at around 30 days was absent from the PP2 data.
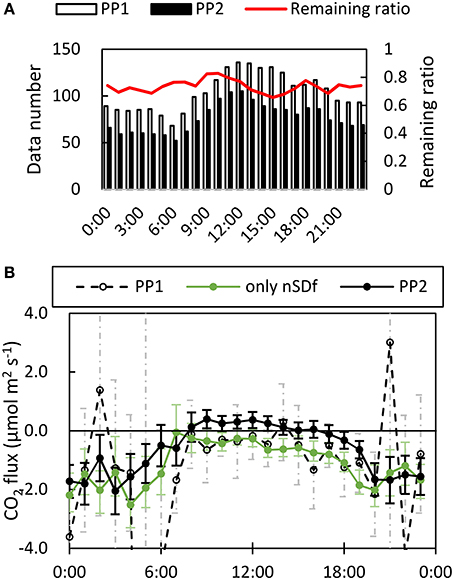
Figure 5. Changes in (A) the number of data points and (B) average value of diurnal flux by filtering. Some plots of data after PP1 were omitted for clarity. The remaining ratio of the flux data after PP2 (red line) was almost the same between daytime and nighttime. In contrast, the average value in the daytime shifted to positive (efflux). The shift was caused by high-pass filtering (black solid line and closed circles), not the filtering using nSD (dashed line and open circles to green data). The error bars mean the 95% confidential limit.
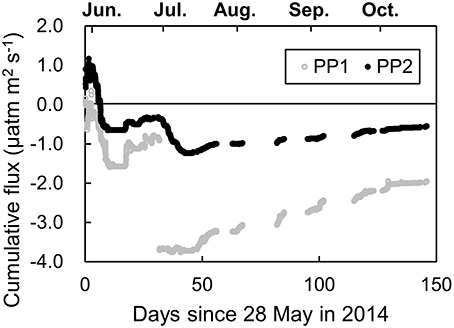
Figure 6. Cumulative EC flux after PP1 and PP2. The data during the gap period due to bad weather conditions were not counted. The seasonal trends of the fluxes were roughly the same, except for the large change around 30 days after the measurements started. This comparison shows that the PP2 did not bias the seasonal trend and improved the continuity.
Figure 7 shows the nSD for the EC CO2 flux data. There was no significant relationship between the nSD and atmospheric parameters (air temperature, water vapor, atmospheric CO2 concentration, wind speed and wind direction; the multiple correlation coefficient was 0.23) and water parameters (salinity, water temperature and water depth; r = 0.25). However, a nSD of more than 0.3 was observed only when atmospheric conditions were relatively stratified and humid. Water vapor around the EC devices may therefore have contaminated the CO2 measurement.
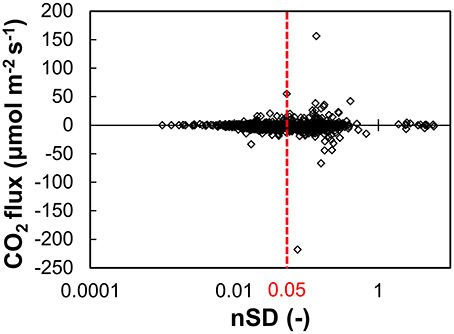
Figure 7. Comparison between the effects of the filtering parameter and the CO2 flux after the RSSI filtering procedure. The threshold (broken red line) was determined so as to remove the confirmed low-quality data. Normalized standard deviation (nSD) is the standard deviation over 30-min interval divided by the average during the entire measurement period (threshold = 0.05; 74% of data retained).
The nSD and TK2 test produced consistent results. Among the best quality data based on the TK2 test (flagged “0” in EddyPro), the nSD was the lowest and equal to 0.043 ± 0.133 (average ± SD, n = 1,098). In contrast, the nSD was 0.062 ± 0.209 (n = 1,199) among the general qualified data (flagged “1”) and was the highest, 0.090 ± 0.340 (n = 512), among wrong qualified data (flagged “2”). Meanwhile, the nSD after PP1 and PP2 were 0.057 ± 0.207 (n = 2,493) and 0.024 ± 0.011 (n = 1,833), respectively. However, the large SD showed that the TK2 test and the nSD filtering were not completely consistent.
Figure 8 shows an example of the results in which the difference of CO2 fluxes between before and after HP filtering was a maximum (measured at 8:00 on day 84, August 21). These data were not excluded by the RSSI and nSD filtering (RSSI = 100%, nSD = 2.07 × 10⁻²), thus it was not thought to be low-quality in spite of the spikes in the raw data and co-spectrum. The trend showed by the concentration of atmospheric CO2 over the 30-min time interval indicated that the block average could not extract appropriate eddy movements from the time-series data. The normalized cospectrum of CO2 concentration and vertical wind speed showed that the cospectrum density at low frequency before HP filtering was very large and not convergent. The implication is that the measurement was not appropriate, because the average flux value should have changed if the measurement period was shorter or longer than 30 min. However, the density after HP filtering was reduced and convergent. The filtering thus successfully excluded the effect caused by the variation of atmospheric CO2 concentrations.
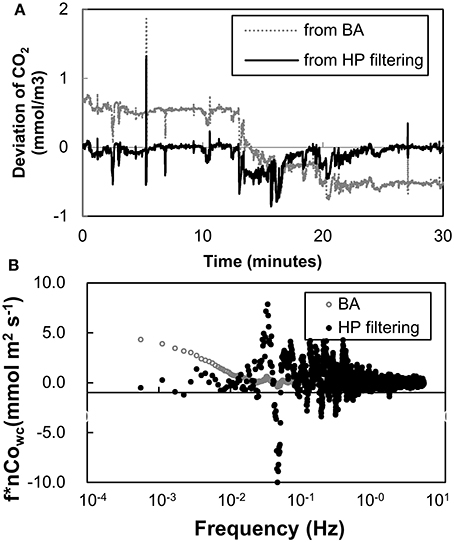
Figure 8. Examples of the deviation calculations of atmospheric CO2 concentration (A) and the cospectrum of atmospheric CO2 concentration and vertical wind speed (B). The cospectrum density was normalized by each covariance of CO2 and vertical wind speed.
The measured differences in CO2 fugacity showed spatial and seasonal variations (see Table S1). The means and SDs were 469.21 ± 732.29 μatm (n = 18) on 29 May (day 1), 2890.51 ± 1013.98 μatm (n = 18) on 15 July (day 48), and −247.73 ± 53.49 μatm (n = 10) on 21 September (day 115). The correlation of the fCO2 was insignificant with PP1 data (P>0.4) while was significant with PP2 data (P < 10−3).
Identifying and removing bad parameters is a longstanding issue in the application of direct EC flux measurements. This paper presents two methods for identifying low-quality flux values and a high-pass filtering procedure for detrending low-frequency variability in the raw data prior to computing covariance.
Our filtering method, PP2, successfully excluded low-quality fluxes. The SD was decreased by a factor of 24 (52.4 μmol m−2 s−1 in PP1 to 2.2 μmol m−2 s−1 in PP2). While the atmospheric CO2 uptake rate calculated via PP1 measurements (−1.93 μmol m−2 s−1) was reduced in magnitude by 72% after PP2 to −0.54 μmol m−2 s−1.
Removing only the wrong data (flagged “2”) with the TK2 test was inadequate for the comparison because the SD was almost the same as before filtering. Given the complex situation at the measurement site, only the best quality data (flagged “0”) should be used for the comparison with the PP2 procedure (mean and SD were −2.15 and 4.48 μmol m−2 s−1, respectively). The largest difference between the flagged “0” data and PP2 data was the mean CO2 flux during the measurement period. Unfortunately, there was not a large difference between these data during the water f CO2 measurement period. It was therefore difficult to evaluate which data were reliable by the indirect model or other flux estimation. However, the uptake rate based on the PP2 data would be more consistent with the range of atmospheric CO2 uptake rates reported in previous coastal studies by the indirect method and the direct measurement using the floating chamber method (e.g., Borges et al., 2005; Chen et al., 2013; Laruelle et al., 2013); the most negative CO2 flux ever reported was −1.08 μmol m−2 s−1 during spring in the Baltic Sea (Chen et al., 2013). In addition, the data in Figure 4, which were the largest positive and negative flux after PP1 should also support the validity of PP2. The data has unnatural spikes and fluctuations by the cross-sensitivity and was removed by PP2 while the data was flagged “1” by TK2 and passed by usual application of TK2. This is an example of higher accuracy of PP2 than that of TK2 in this study. These results indicate that the thresholds of the RSSI and nSD in this study were valid although they determined by arbitral criteria. Given that the theoretical identification of signal and noise is still discussing in many field like informatics, the PP procedure in this study should be practical and basically applicable to the EC flux at several coastal area.
The diurnal and seasonal variations during the measurement period were not affected by the RSSI and HP filtering (Figures 5, 6). In the case of the diurnal cycle, the positive shift in the daytime was caused by HP filtering, not by excluding low-quality data based on the RSSI and nSD. This positive shift is inferred because HP filtering did not affect the WPL terms in Eq. 1, which were based on heat fluxes and usually positive, relative to the covariance term of CO2 and vertical wind. In contrast, the similar trend of the seasonal cycles showed that the PP2 did not bias monthly temporal variations. Rather, PP2 improved the continuity of the seasonal trend by removing the large jump at about 30 days.
Even after the exclusion of low-quality outliers by PP2, no significant relationship between CO2 fluxes and environmental parameters could be discerned, in similar to the case with the nSD (r = 0.23 and 0.33 for atmospheric and water parameters). On the other hand, filtering contributed to the time-series analysis. The normalized power spectrum of the EC CO2 fluxes after PP1 displayed large, noise-like fluctuations at high frequencies (Figure 9), and thus any suggestion of peaks in the time series was obscured. After PP2, however, the noise-like fluctuations were smaller, and two peaks associated with semi-diurnal (~12.5 h) and diurnal (~24 h) time intervals were apparent. On the other hand, such peaks were obscure in the spectrum from TK2 “0” data. The f CO2 variations in the lagoon, which are among the parameters that regulate air-water CO2 fluxes, have been confirmed to be related to mixing of lagoon water with freshwater coming from rivers and with biological processes such as photosynthesis (Tokoro et al., 2014). Given that the former and latter phenomena are caused by the semi-diurnal tidal cycle and diel changes of irradiance, respectively, the peaks in the power spectrum are consistent with the results of Tokoro et al. (2014). This consistency is a good demonstration of the utility of the PP2. The positive value of the average CO2 flux in the daytime (Figure 5) indicates that the effect of mixing with freshwater was larger than the effect of photosynthesis during the measurement period. This was because the average water depth was the shallowest around noon due to the tidal condition at the site in spring and summer when most of the experiment was performed.
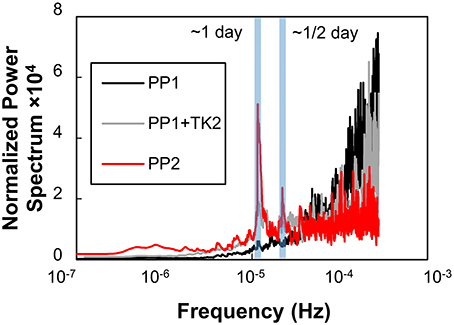
Figure 9. Power spectra of CO2 flux with PP1 (black line), PP1 with TK2 (blue line) and PP2 (red line). The spectra were normalized using the variances of CO2 flux for the entire measurement period after each calculation. The shaded areas indicate the frequency around the 24 h diurnal cycle (left) and 12.5 h tidal cycle (right). Average CO2 flux data during the entire measurement period were used to replace missing CO2 flux data.
The most of EC data that were inconsistent with Δf CO2 in terms of their signs (plus or minus) were excluded by PP2 (Figure 10). Although EC data and Δf CO2 cannot be compared directly, the sign should be consistent, because other parameters in the indirect model (the gas transfer velocity and solubility) are always positive. Furthermore, the linear relationship between the EC data and Δf CO2, which is suggested in the indirect model, was highly significant (P < 10−3) after PP2 but was insignificant (P > 0.4) only after PP1. However, the EC fluxes estimated with PP2 did not always agree with the estimation by the indirect model. Because the f CO2water is theoretically never negative, a theoretical maximum negative flux can be calculated by arbitrarily setting f CO2 equal to zero and using the largest estimation of the gas transfer velocity. The maximum negative flux calculated in this way with the gas transfer velocity estimated in several studies (Wanninkhof, 1992; Borges et al., 2004; Mørk et al., 2014) was −6.16 μmol m−2 s−1 at 15:00 on 30 May (day 2), when the maximum wind speed was recorded (11.9 m s−1). Forty-seven EC flux data points (3% of all data) indicated even lower fluxes. Because the maximum negative value was the theoretical limit with the indirect model, some of the EC fluxes cannot be explained by only the indirect model.
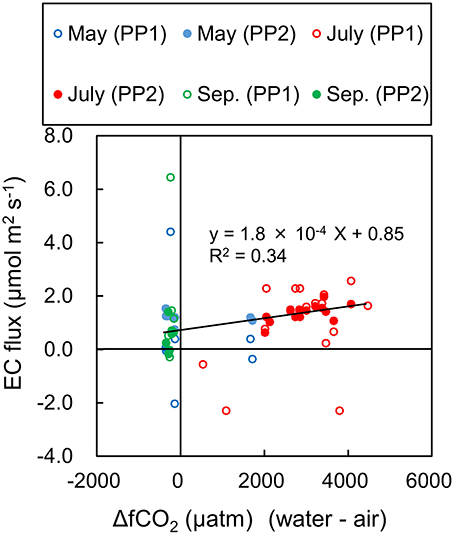
Figure 10. Comparison of ΔfCO2 (water minus air), EC flux with PP1 and EC flux with PP2. Significant linear relationship (solid line; P < 10−3) was observed after PP2, but not after PP1 (P > 0.4).
Similar inconsistencies between air-water CO2 fluxes calculated with the EC method and other conventional methods have been reported in several studies (e.g., Tsukamoto et al., 2004; Rutgersson and Smedman, 2010). In the case of coastal measurements, water side convection due to vertical temperature gradients within the water column has been postulated to enhance the gas transfer velocity (Rutgersson and Smedman, 2010). However, such an enhancement has not been previously observed with direct flux measurements using a floating chamber at our site (Tokoro et al., 2014). Because the very shallow water depth (less than 2 m) at our site cannot explain any enhancement by the Rutgersson's model, we suspect that water side convection was not the main reason for the inconsistency of the fluxes.
On the assumption that the EC fluxes obtained with PP2 were valid, the discrepancy between the EC and the indirect estimation was also postulated to reflect the limitations of the indirect model. One consideration with respect to the limitations of the indirect model is that seagrass leaves, which reached the water surface during low tide at the study site, might have affected the physical and chemical conditions at the water surface (Watanabe and Kuwae, 2015). The indirect model assumes that the CO2 flux is caused by the CO2 concentration gradient just below the water surface. The indirect model should therefore not be applied when seagrass is present on the water surface. A previous study that investigated the radiocarbon isotopic signatures of seagrass at the study site indicated that of the total CO2 assimilated by the seagrass, 0–40% (mean = 17%) originated from the atmosphere and the rest from the water (Watanabe and Kuwae, 2015). The implication is that there is enhanced uptake of atmospheric CO2 (rather than uptake through the water column) by seagrass when seagrass leaves are on the water surface. Atmospheric CO2 is therefore directly taken up within a thin film of water over the seagrass leaves, but this seagrass-driven CO2 flux is not included in the indirect model using the gas transfer velocity.
In summary, we attribute the discrepancy between the EC and conventional indirect model to (1) major technical uncertainties in both methods and (2) limitations of the indirect model related to the presence of vegetation on the water surface (Table 1). The latter one may cause the actual CO2 flux to be larger than the indirect estimation in aquatic systems that have large amounts of vegetation. Determination of the contribution of aquatic ecosystems to mitigating the adverse effects of climate change will require consideration of all processes related to atmosphere-aquatic ecosystem exchange. For this purpose, the EC CO2 flux should be a more robust indicator than the indirect estimation, which includes only processes related to air-water exchanges. Improving the EC method and the post-processing procedure are therefore essential for a re-evaluation of atmosphere-aquatic ecosystem CO2 gas exchanges and comprehensive analyses of the contributions of aquatic environments to mitigating the adverse effects of climate change.
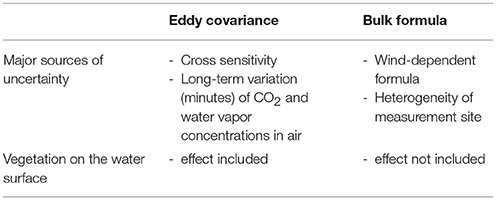
Table 1. Summary of the differences in fluxes calculated by the eddy covariance and bulk formula methods.
TT associated main part of the measurement and the analysis. TK supported the field measurement, and discussed with TT about the analysis of this study.
The authors declare that the research was conducted in the absence of any commercial or financial relationships that could be construed as a potential conflict of interest.
We thank K. Watanabe, H. Moki, E. Miyoshi, and S. Montani for help with the field work and F. Kondo and H. Ikawa for helpful comments. This study was supported by a Grant-in-Aid for Challenging Exploratory Researches (no. 24656316 and 26630251) from the Japan Society for the Promotion of Science and a Strategic R&D Area Project (S-14) of the Environmental Research and Technology Development Fund (Strategic Research on Global Mitigation and Local Adaptation to Climate Change).
The Supplementary Material for this article can be found online at: https://www.frontiersin.org/articles/10.3389/fmars.2018.00286/full#supplementary-material
Blomquist, B. W., Huebert, B. J., Fairall, C. W., Bariteau, L., Edson, J. B., Hare, J. E., et al. (2013). Advances in air-sea CO2 flux measurement by eddy correlation. Bound. Lay. Meteorol. 152, 245–276. doi: 10.1007/s10546-014-9926-2
Borges, A. V., Delille, B., and Frankignoulle, M. (2005). Budgeting sinks and sources of CO2 in the coastal ocean: diversity of ecosystems counts. Geophys. Res. Lett. 32:L11460. doi: 10.1029/2005GL023053
Borges, A. V., Schiettecatte, L. S., Abril, G., Delille, B., and Gazeau, F. (2006). Carbon dioxide in European coastal waters. Estuar. Coast. Shelf Sci. 70, 375–387. doi: 10.1016/j.ecss.2006.05.046
Borges, A. V., Vanderborght, J. P., Schiettecatte, L. S., Gazeau, F., Ferrón-Smith, S., Delille, B., et al. (2004). Variability of the gas transfer velocity of CO2 in a macrotidal estuary (the Scheldt). Estuaries 27, 593–603. doi: 10.1007/BF02907647
Broecker, W. S., and Peng, T.-H. (1982). Tracers in the Sea, the Lamont-Doherty Geological Observatory. New York, NY: Eldigio Press.
Chen, C. T. A., Huang, T. H., Chen, Y. C., Bai, Y., He, X., and Kang, Y. (2013). Air-sea exchanges of coin the world's coastal seas. Biogeosciences 10, 6509–6544. doi: 10.5194/bg-10-6509-2013
Danckwerts, P. V. (1951). Significant of liquid-film coefficient in gas absorption. Ind. Eng. Chem. 43, 1460–1467.
Garbe, C. S., Rutgersson, A., Boutin, J., de Leeuw, G., Delille, B., Fairall, W., et al. (2014). Open-Atmosphere Interaction of Gases and Particles. Heidelberg: Springer, 55–122.
Gazeau, F., Duarte, C. M., Gattuso, J. P., Barrón, C., Navarro, N., Ruiz, S., et al. (2005). Whole-system metabolism and CO2 fluxes in a Mediterranean Bay dominated by seagrass beds (Palma Bay, NW Mediterranean). Biogeosciences 2, 43–60.doi: 10.5194/bg-2-43-2005
Ho, D. T., Ferrón, S., Engel, V. C., Larsen, L. G., and Barr, J. D. (2014). Air-water gas exchange and CO2 flux in a mangrove-dominated estuary. Geophys. Res. Lett. 41, 108–113.doi: 10.1002/2013GL058785
Ho, D. T., Law, C. S., Smith, M. J., Schlosser, P., Harvey, M., and Hill, P. (2006). Measurement of air-sea gas exchange at high wind speeds in the Southern Ocean: implications for global parametrization. Geophys. Res. Lett. 33:L11661. doi: 10.1029/2006GL026817
Ikawa, H., and Oechel, C. (2014). Temporal variations in air-sea CO2 exchange near large kelp beds near San Diego, California. J. Geophys. Res. Oceans 120, 50–63.doi: 10.1002/2014JC010229
IPCC (2013). Climate Change 2013: The Physical Science Basis. eds T. F. Stocker, D. Qin, G. K. Plattner, M. Tignor, S. K. Allen, J. Boschung, A. Nauels, Y. Xia, V. Bex and P. M. Midgley (Cambridge, UK; New York, NY: Cambridge University Press).
Komori, S., Nagaosa, R., and Murakami, Y. (1993). Turbulent structure and heat and mass transfer mechanism at a gas-liquid interface in a wind-wave tunnel. Appl. Sci. Res. 51, 423–427.
Kondo, F., Ono, K., Mano, M., Miyata, A., and Tsukamoto, O. (2014). Experimental evaluation of water vapor cross-sensitivity for accurate eddy covariance measurement of CO2 flux using open-path CO2/H2O gas analysers. Tellus B 66:23803.doi: 10.3402/tellusb.v66.23803
Kuwae, T., Kanda, J., Kubo, A., Nakajima, F., Ogawa, H., Sohma, A., et al. (2016). Blue carbon in human-dominated estuarine and shallow coastal systems. Ambio 45, 290–301. doi: 10.1007/s13280-015-0725-x
Landwehr, S., Miller, S. D., Smith, M. J., Saltzman, E. S., and Ward, B. (2014). Analysis of the PKT correction for direct CO2 flux measurements over the ocean. Atmos. Chem. Phys. 14, 3361–3372. doi: 10.5194/acp-14-3361-2014
Laruelle, G. G., Dürr, H. H., Lauerwald, R., Hartmann, J., Slomp, C. P., Goossens, N., et al. (2013). Global multi-scale segmentation of continental and coastal waters from the watersheds to the continental margins. Hydrol. Earth. Syst. Sci. 17, 2029–2051. doi: 10.5194/hess-17-2029-2013
Lee, X., Massman, W., and Law, B. (eds) (2004). Handbook of Micrometeorology-A Guide for Surface Flux Measurement and Analysis, Dordrecht: Kluwer Academic Publishers.
Leinweber, A., Gruber, N., Frenzel, H., Friederich, G. E., and Chavez, F. P. (2009). Diurnal carbon cycling in the surface ocean and lower atmosphere of Santa Monica Bay, California. Geophys. Res. Lett. 36:L08601. doi: 10.1029/2008GL037018
Liss, P. S., and Merlivat, L. (1986). The Role of Air-Sea Exchange in Geochemical Cycling. Boston, MA: Reidel, 113–129.
Massman, W. J. (2000). A simple method for estimating frequency response corrections for eddy covariance systems. Agr. Forest Meteorol. 104, 185–198. doi: 10.1016/S0168-1923(00)00164-7
Mauder, M., and Foken, T. (2004). Documentation and Instruction Manual of the Eddy Covariance Software Package TK2. Bayreuth: University of Bayreuth.
McMillen, R. T. (1988). An eddy correlation technique with extended applicability to non-simple terrain. Bound. Lay. Meteorol. 43, 231–245.
Mørk, E. T., Sørensen, L. L., Jensen, B., and Sejr, M. K. (2014). Air-Sea CO2 gas transfer velocity in a shallow estuary. Bound. Lay. Meteorol. 151, 119–138. doi: 10.1007/s10546-013-9869-z
O'Conner, D. J., and Dobbins, W. E. (1958). Mechanism of reaeration in natural streams. Trans. Am. Soc. Civ. Eng. 123, 641–684.
Pierrot, D., Lewis, E., and Wallace, D. W. S. (2006). MS Excel Program Developed for CO2 System Calculations. Oak Ridge, TN: Oak Ridge National Laboratory.
Rutgersson, A., and Smedman, A. (2010). Enhanced air-sea CO2 transfer due to water-side convection. J. Mar. Sys. 80, 125–134. doi: 10.1016/j.jmarsys.2009.11.004
Schindler, D. E., Carpenter, S. R., Cole, J. J., Kitchell, J. F., and Pace, M. L. (1997). Influence of food web structure on carbon exchange between lakes and the atmosphere. Science 277, 248–251.
Schuepp, P. H., Leclerc, M. Y., MacPherson, J. I., and Desjardins, R. L. (1990). Footprint prediction of scalar fluxes from analytical solutions of the diffusion equation. Bound. Lay. Meteorol. 50, 355–373.
Tokoro, T., Hosokawa, S., Miyoshi, E., Tada, K., Watanabe, K., Montani, S., et al. (2014). Net uptake of atmospheric CO2 by coastal submerged aquatic vegetation. Glob. Change Biol. 20, 1873–1884. doi: 10.1111/gcb.12543
Tokoro, T., Kayanne, H., Watanabe, A., Nadaoka, K., Tamura, H., Nozaki, K., et al. (2008). High gas-transfer velocity in coastal regions with high energy-dissipation rates. J. Geophys. Res. Oceans 113:C11006. doi: 10.1029/2007JC004528
Tsukamoto, O., Takahashi, S., Kono, T., Yamashita, E., Murata, A., and Ishida, H. (2004). “Eddy covariance co2 flux measurements over open ocean,” in Paper Presented at the 13th Symposium on the Interaction of the Sea and Atmosphere (Boston, MA: American Meteorological Society), 8–13.
Vesala, T. (2012). “Eddy covariance measurements over lakes,” in Eddy Covariance: A Practical Guide to Measurement and Data Analysis, eds M. Aubinet, T. Vesala, and D. Papale (Dordrecht: Springer), 365–376.
Vickers, D., and Mahrt, L. (1997). Quality control and flux sampling problems for tower and aircraft data. J. Atmos. Ocean. Tech. 14, 512–526.
Wanninkhof, R. (1992). Relationship between wind speed and gas exchange over the ocean. J. Geophys. Res. 97, 7373–7382.
Watanabe, K., and Kuwae, T. (2015). Radiocarbon isotopic evidence for assimilation of atmospheric CO2 by the seagrass Zostera marina. Biogeosciences 12, 6251–6258.doi: 10.5194/bg-12-6251-2015
Keywords: CO2 flux, eddy covariance, post-processing, aquatic ecosystems, indirect conventional method
Citation: Tokoro T and Kuwae T (2018) Improved Post-processing of Eddy-Covariance Data to Quantify Atmosphere–Aquatic Ecosystem CO2 Exchanges. Front. Mar. Sci. 5:286. doi: 10.3389/fmars.2018.00286
Received: 27 March 2018; Accepted: 27 July 2018;
Published: 20 August 2018.
Edited by:
Yuichiro Takeshita, Monterey Bay Aquarium Research Institute, United StatesReviewed by:
Melissa Ward, University of California, Davis, United StatesCopyright © 2018 Tokoro and Kuwae. This is an open-access article distributed under the terms of the Creative Commons Attribution License (CC BY). The use, distribution or reproduction in other forums is permitted, provided the original author(s) and the copyright owner(s) are credited and that the original publication in this journal is cited, in accordance with accepted academic practice. No use, distribution or reproduction is permitted which does not comply with these terms.
*Correspondence: Tatsuki Tokoro, dG9rb3JvLXRAcGFyaS5nby5qcA==
Disclaimer: All claims expressed in this article are solely those of the authors and do not necessarily represent those of their affiliated organizations, or those of the publisher, the editors and the reviewers. Any product that may be evaluated in this article or claim that may be made by its manufacturer is not guaranteed or endorsed by the publisher.
Research integrity at Frontiers

Learn more about the work of our research integrity team to safeguard the quality of each article we publish.