 Lumi Haraguchi
 Hans H. Jakobsen
 Nina Lundholm
 Jacob Carstensen
- 1Department of Bioscience, Aarhus University, Roskilde, Denmark
- 2National History Museum of Denmark, University of Copenhagen, Copenhagen, Denmark
Phytoplankton plays a key role as primary producers and mediating biogeochemical cycles in the water column. The understanding of the temporal dynamic of primary grazers channeling energy and carbon from primary producers is important for evaluating aquatic ecosystems functioning. This study investigates the coupling between phytoplankton and ciliates from live samples collected with approximately daily frequency during an almost 2-year cycle. The study site is a nutrient-rich temperate estuary, Roskilde Fjord (Denmark). Our aim is to evaluate the importance of protist grazers, especially ciliates, as predators on phytoplankton and to evaluate differences among multiple nutritional strategies through different seasons. The phytoplankton community, was mostly dominated by small organisms (<20 μm) with few observations of diatoms. In most of observations, heterotrophic dinoflagellates biomass was smaller than biomass of ciliates (<10%), indicating that ciliates are the main component of microzooplankton. Except for the spring 2016, the ciliate community closely followed the phytoplankton community, showing a tight coupling between the primary producers and grazers during all seasons. This somehow contradicts the general assumption that ciliate dominance is restricted to periods of nutrient limitation dominated by the microbial food web and suggests a year-round key role of ciliates as consumers of phytoplankton biomass. Biomasses of ciliates increased during spring and were highest during summer. Relative importance of mixotrophs were high due to occurrence of Mesodinium rubrum blooms as well as other mixotrophic ciliates in late spring/early summer. M. rubrum biomass had the opposite pattern of the cryptophyte prey Teleaulax spp., and the coupling between the two populations was very strong in late spring. Ciliates that grazed on selected phytoplankton, had a smaller potential grazing impact regarding their biomasses, likely due to food limitation; conversely ciliates that feed on diverse prey items were less constrained by food limitation, and their seasonality appear to be driven by other factors. These findings suggest that the ciliate community structure and dynamics is important in structuring the phytoplankton community on short and seasonal scale.
Introduction
Phytoplankton primary production supports higher trophic levels and fuels microbial remineralization (Azam et al., 1983; Sherr and Sherr, 1988). The dominant pelagic grazers of phytoplankton are typically associated with distinct operating modes of the food web compartments and nutrient cycling. Heterotrophic protist grazers and microzooplankton dominance is usually associated with the microbial loop and regenerated production; while mesozooplankton is associated with a linear food chain and export production (Fenchel, 1988; Buitenhuis et al., 2006). Grazing on particulate primary production in the global ocean surface is ~10–15% for mesozooplankton and 59–75% for microzooplankton (Behrenfeld and Falkowski, 1997; Calbet, 2001; Landry and Calbet, 2004; Buitenhuis et al., 2010), with estimates for coastal and estuarine systems usually in the a lower range (Landry and Calbet, 2004).
Ciliates constitute an important component of the microzooplankton community with preference for small-sized preys, in contrast to mesozooplankton, and many ciliate species are also grazed by mesozooplankton (Hansen et al., 1997). Thus, ciliates can be an important link between small cells and higher trophic levels (Nielsen and Kiørboe, 1994). Besides their significant role in carbon transfer, ciliates are also considered high quality food, as a source of proteinaceous compounds with a low C:N ratio in comparison to phytoplankton (Stoecker and Capuzzo, 1990; Gifford, 1991).
Although many ciliates are heterotrophs, a number of pelagic species are mixotrophic, combining both phagotrophic and phototrophic nutrition (Stoecker, 1998). The recognition of mixotrophy in the marine plankton food web has challenged the classical understanding of pelagic food webs, as autotrophy and heterotrophy are not necessarily two distinct functional compartments (Flynn et al., 2013). Classical understanding of ecological interactions among plankton, such as competition for nutrients, indicates that nutrient uptake affinity decreases with organism size (Edwards et al., 2012), favoring smaller sizes under resource limiting conditions. Mixotrophy is advantageous to organisms under nutrient limited conditions, allowing them to reduce direct competition by grazing on smaller prey and increase direct ingestion of nutrients (Mitra et al., 2014). Modeling results suggest that mixotrophy favors larger organisms, and therefore enhances trophic transfer efficiency (Mitra et al., 2014; Ward and Follows, 2016). On top of that, mixotrophy appears to be important over both, space and time, in marine systems (Leles et al., 2017), stressing the need for ecological field studies to further elucidate the role of mixotrophy.
Today, the importance of ciliates in the marine environment, including coastal and estuarine systems, is well recognized (Calbet and Landry, 2004). However, the role of ciliate nutrition mode and its impacts on ecosystem productivity is understudied for a number of reasons. One is that most plankton monitoring programs focus on analyzing phytoplankton and mesozooplankton only and similarly, many field studies do not include analyses of ciliates. Second, fixation can destroy cells and change their characteristics, such as color, size, and shape (Choi and Stoecker, 1989; Stoecker et al., 1994), constraining the distinction between mixotrophs and heterotrophs. In addition, even if ciliates are properly recorded, many studies employ monthly sampling, which hampers the investigation of ecosystem trophodynamics due to the fast growth responses of ciliates and phytoplankton.
The use of in-flow systems (e.g., flow cytometry) have routinely been used to assess plankton communities, including different size fractions (Dashkova et al., 2017). Using these technologies in high frequency monitoring of plankton has demonstrated that short-term events can be easily missed with sampling frequencies typically employed for monitoring (Thyssen et al., 2008; Campbell et al., 2013; Dugenne et al., 2014). Furthermore, in-flow systems allow analysis of live samples, avoiding loss and shrinkage of cells due to fixation (Jakobsen and Carstensen, 2011; Haraguchi et al., 2017). Thus, the use of in-flow systems can improve our knowledge on the coupled dynamics of phytoplankton and ciliates, by allowing a large number of samples to be analyzed in relatively short time.
This study aims to assess the temporal coupling between phytoplankton and its protist grazers in a temperate mesohaline estuary (Roskilde Fjord, Denmark), evaluating differences in potential grazing rates of distinct trophic strategies over different time scales. More specifically, this study seeks to answer the following questions: (1) Are ciliates the dominant pelagic grazers in Roskilde Fjord? (2) Do mixotrophic ciliates comprise a significant proportion of the total ciliate biomass and thereby contribute significantly to the transfer of energy to higher trophic levels?
Materials and Methods
Study Area and Sampling
Roskilde Fjord (RF; see Figure S1 for a map of the study area and sampling pier) is a mesohaline, shallow and well-mixed estuary with a long residence time (up to 2 years) due to low river discharge and low tidal influence (Kamp-Nielsen, 1992). The estuary consists of two larger broads connected by a long narrow channel oriented in a south-north direction. It receives relatively high nutrient inputs due to dominance of agriculture in the RF catchment, which enhance primary production (Staehr et al., 2017).
Surface water (2 L) was sampled with a bucket from the Risø pier (55°41′30.19″N, 12° 4′55.24″E; Figure S1) almost every day from 15 February 2016 until 01 November 2017. Samples were delivered to the laboratory for immediate analysis within 10 to 20 min after sampling. Temperature and salinity were measured with an YSI Professional Plus multiparameter handheld meter (YSI, USA). Phytoplankton was analyzed with a pulse shape recording flow cytometer, whereas ciliates were analyzed by a color FlowCAM IV (see below).
Laboratory Analysis
Nutrients
Dissolved inorganic nutrient samples were stored frozen in 30 ml acid-washed plastic bottles. The samples were analyzed on a San ++ Continuous Flow Analyser (Skalar Analytical B.V, Breda, NL) as previously described (Grasshof, 1976; Kaas and Markager, 1998). Detection limits were 0.04, 0.1, and 0.3 μmol L−1 for , , . Dissolved inorganic nitrogen (DIN) concentrations were calculated as the sum of the concentrations of , , and .
FlowCAM
Ciliate abundances and body volumes were analyzed from live samples using a color FlowCAM IV (Fluid Imaging Technologies, USA), following Calbet et al. (2014). From 15 March 2016 until 20 February 2017, samples were analyzed using a 4x objective and a flow cell FC300, whereas samples from 21 February until 1 November 2017 were analyzed using a 10x objective and a flow cell FC100x2. User calibration with standard beads (polymer microspheres of 50 μm, Thermo scientific™) were done for both magnification to validate counts and volumes calibration. The instrument was run in auto image-mode for both magnifications, capturing all particles in the range of 15–1,000 μm. The analysis time for each sample was ca. 40 min. (4x) or ca. 3 h (10x), corresponding to the analyzed volume of 20 and 10 ml, respectively. During analysis, samples were gently stirred (approx. 3.14 rad s−1) and kept under dim light at room temperature (about 15–20°C). We assumed that cell loss during the analysis was insignificant, as no differences were observed between cell numbers recorded at the start and end of the runs. After sample processing, recorded images were manually sorted into ciliate morphotypes and dinoflagellate trophy, based on features such as cell size, color, and general morphology. Equivalent Spherical Diameter (ESD) and body volume were estimated by the software package VISP 3.17 (FluidImagine™). Cell size was estimated by the area based diameter (ABD) algorithm of VISP 3.17 (Jakobsen and Carstensen, 2011), except for tintinnids. This group of loricated ciliates can have their volumes overestimated from FlowCAM images, thus their individual volume was calculated as a prolate spheroid with diameter equal to the lorica width, and the length as 120% of width. Carbon biomass was obtained by converting volume to biomass using a generic protist volume-to-carbon conversion formula (Menden-Deuer and Lessard, 2000). The higher magnification allowed for identification of more morphotypes, which were grouped when necessary to match the 4x morphotypes. In all samples non-identified blurred images of ciliates were present, however these accounted for <5% of the observations in all samples.
Flow Cytometer
We employed a pulse-shape recording flow cytometer (PFCM) (CytoSense, Cytobuoy, NL) to analyse phytoplankton. This technique is suitable for rapid analysis of the phytoplankton size spectra, providing cell counts comparable to those obtained with traditional microscopy and more reliable information for picoplankton (Haraguchi et al., 2017). Additionally, it also provides information on cell size and morphology due to its capacity to store the optical profile for each particle, recorded as they travel through the flow cell. The instrument has a 488 nm laser, fluorescence sensors (yellow/green ~550 nm, orange ~ 600–650 nm and red ~650–700 nm) and two scatter sensors, for light scattered parallel (forward scatter) and orthogonal (sideward scatter) to the incident laser beam. All the optical sensors are duplicated (except for the forward scatter) but set to different sensitivity for precise recording of both larger and smaller particles. Optical particle profiles from live samples (500–1000 μL, sampled at a flow rate of 8 μL s−1) were collected using the software CytoUSB (cytobuoy.com), with a lower threshold of 30 mV for the high sensitivity red fluorescence sensor. This trigger was set to include only particles containing chlorophyll a (phytoplankton cells). Recorded cells were clustered according to similarities in their optical properties [length and total Forward Scatter (FWS), total red fluorescence (FLR); total orange fluorescence (FLO); total Sideward Scatter (SWS)], using the software CytoClus3 (cytobuoy.com). Particles were assigned to one cluster only and the same clustering algorithm was employed for all samples. Taxonomical information was obtained for some of the clusters based on their optical characteristics and photos taken by the equipment, which were cross-referenced with qualitative information obtained from live samples examined by light microscopy. Carbon biomass was obtained by converting total FWS to volume by applying the empirical formula in Haraguchi et al. (2017) and then converting volume to biomass using a generic protist volume-to-carbon conversion formula (Menden-Deuer and Lessard, 2000). Note that for some characteristic and/or abundant groups (e.g., chains, pico-eukaryotes, Teleaulax spp.) group-specific clusters were identified based on cells characteristics (size, shape, fluorescence). Other clusters, like nano-flagellates and micro-phytoplankton, comprised multiple species with lower relative abundance and no specific clusters could be drawn. For those, cluster definition was based on general functional features such as size and fluorescence levels.
Ciliates Potential Grazing Rates
Ciliate Trophic Strategy Definitions
During the study, 13 different ciliate morphotypes were identified (Figure 1). Heterotrophs were divided into three groups: (i) herbivores that were always observed with the same type of food in vacuole; (ii) herbivores with varying food content; and (iii) carnivores (ciliates that can also feed on other ciliates). Mixotrophs were identified as ciliates with a strong colouration and chloroplasts located throughout the cell periphery, and were assigned into two different groups following Mitra et al. (2016). Based on compiled information from the literature (Table 1), the ciliate morphotypes were grouped into five trophic strategies:
1. Specialist Non-Constitutive Mixotroph (SNCM): ciliates that acquire their chloroplasts and obtain them from specific prey.
2. General Non-Constitutive Mixotroph (GNCM): ciliates that acquire their chloroplasts and obtain them from multiple prey.
3. Selective herbivore (SH): heterotrophs that ingest a narrow range of prey.
4. Generic herbivore (GH): heterotrophs that ingest a broad range of prey.
5. Carnivore (Cv): heterotrophs that ingest a broad range of prey, including other ciliates.
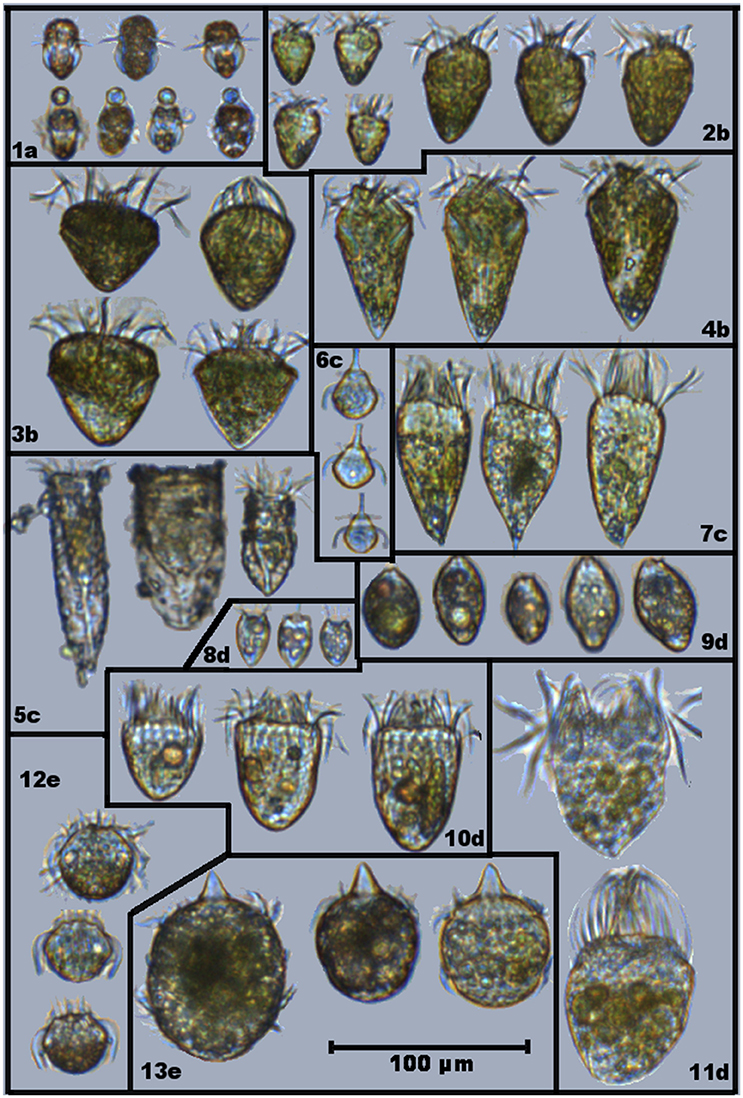
Figure 1. Selected images showing different ciliates morphotypes found in Roskilde Fjord during the study period: (1) Mesodinium rubrum; (2) Strombidium spp; (3) Strombidium cf. capitatum; (4) Strombidium cf. conicum; (5) Tinitinnids; (6) Mesodinium cf. velox; (7) cf. Pelagostrobilidium; (8) Balanion comatum; (9) cf. Urotricha; (10) Choreotrichida; (11) Oligotrichida; (12) Askenasia; and (13) Didinium. Assigned trophy strategies are displayed as letters, accompanying the morphotypes numbers: (a) Specialist Non-Constitutive Mixotroph (SNCM); (b) General Non-Constitutive Mixotroph (GNCM); (c) Selective phagotroph (SP); (d) Generic phagotroph (GP); and (e) Carnivore (Cv). Note that some of displayed cells of M. rubrum (1a) are grabbing particles that are not their preferential prey (Teleaulax spp).
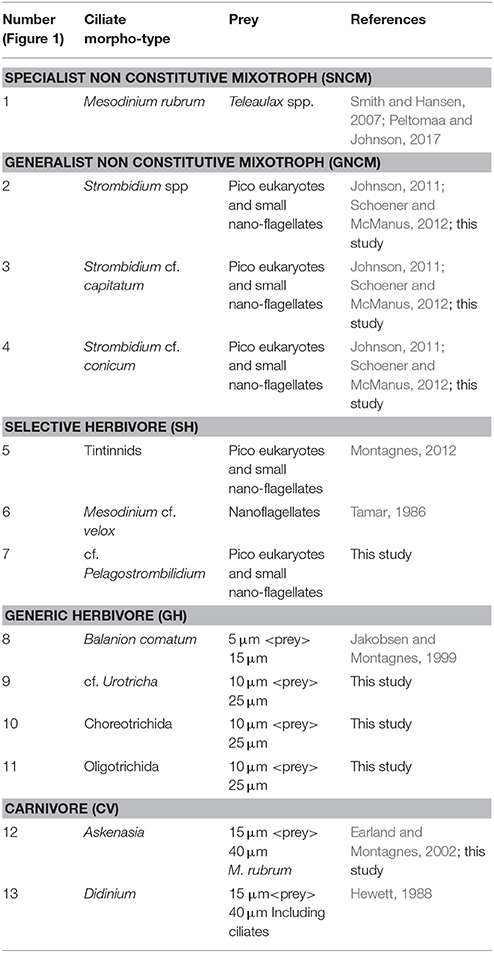
Table 1. Ciliate morpho-types, trophy mode, their assigned potential preys in this study and references used to support preys assignment.
Prey Definition
FlowCAM IV allowed for identification of different ciliate morphotypes, and for the identification of prey items inside many of the ciliates. Food items were identified from food vacuoles, and based on their characteristics (size, shape, color), they were related to phytoplankton groups when possible. While some morphotypes were always observed with similar food vacuoles, others were observed with food vacuoles of different shapes, colors and sizes, indicating selective or generic prey preferences among ciliates types (Figure 1). Potential prey items used in the modeled grazing rates were assigned to each ciliate morphotype based on FlowCAM images (Figure 1; Table 1).
Potential Grazing
The potential grazing of different ciliate groups were estimated by calculating ingestion and clearance rates (see Table 2 for nomenclature) following Hansen et al. (1997), with the exception of Mesodinium rubrum (see below). Generic maximum ingestions and clearance rates (normalized to predator volume) at standard temperature of 20°C were estimated from the volume of the ciliate cell using parameters from Hansen et al. (1997).
From these, the half-saturation food density was found
equivalent to 0.710 ppm. Cell-specific ingestion rates for the different ciliate groups were subsequently calculated as a function of food density of preferred prey (d) and water temperature (T) using the overall average Q10 = 2.8 from Hansen et al. (1997).
The ingestion rate for the entire ciliate group was found by summation across all cells within the group and accounting for the sampling volume
This volume-specific ingestion rate was subsequently converted into carbon units with a scaling factor (rC:V), which was calculated from the volume-to-carbon conversion formula (f()) of Menden-Deuer and Lessard (2000) applied to the sample distribution of prey cell volumes (Vprey)
When prey densities (d) were smaller than the half-saturation food density (Km), potential food limitation is indicated. When food-limitation is observed, the prey ingested by a given ciliate is smaller than what it could potentially ingest based on its body volume, thus resulting grazing rates are smaller than expected for that ciliate.
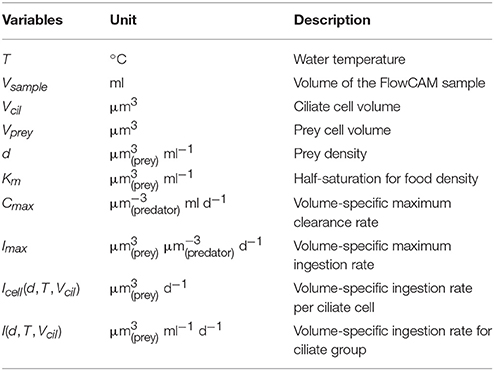
Table 2. Variables used for estimating ciliate grazing rates in Eq. 1–6.
For M. rubrum, potential grazing was defined based on cell counts, as daily specific prey intake has previously been reported to vary between 0.4 and 5 Teleaulax cells for each Mesodinium (Smith and Hansen, 2007). Three potential ingestion scenarios were estimated based on minimum (0.4 cryptophyte cells Mesodinium−1 day−1), maximum (5 cryptophyte cells Mesodinium−1 day−1), and average (2.7 cryptophyte cells Mesodinium−1 day−1). Daily intake rates (min, average, and max in cells L−1 d−1) were calculated by scaling the cell-specific rates with the observed M. rubrum cell density. Finally, these daily intake rates were converted into carbon units by multiplying with the average individual cryptophyte C biomass of that particular sampling day.
Statistical Analysis
To evaluate the seasonality of the different ciliate morphotypes, a linear mixed model was fitted to quantify the biomass variation across months. Biomass observations were log-transformed to account for scale-dependent variability. The model included a random factor for the seasonal variation between the years and residual variation included an autoregressive process AR(1) to account for potential autocorrelation between the daily samples. The mixed effect models were fitted in R (R Core Team, 2017), using the nlme package (Pinheiro et al., 2017).
Prey-predator biomasses dynamics were quantified as the distance between consecutive observations, as the distance is proportional to differences in biomasses of both prey and predator. The distances were calculated as the Euclidean distance of log-transformed biomass data of phytoplankton and ciliates, which were separated according to the ciliates trophic strategies and their assigned preys (Table 1). Therefore, the Euclidean distance was used as a descriptor of the prey-predator dynamics, with longer distances associated with more variability in the biomasses of prey-predator pairs. As the study does not encompasses two full year cycles, differences between years were assessed considering only the productive season (15 March until 1 November).
To summarize the potential C flux through ciliates, simplified estimates of prey C biomass and potential grazing by the different trophic strategies were calculated as daily average for the productive season of each year.
Results
Physical Environment
Water temperature in the study area varied seasonally from ~4°C in winter to 20°C during summer, whereas salinity variation did not exhibit any consistent seasonal pattern, except for a small decrease during winter (Figure 2A). Although the 2 years appeared similar, subtle differences were observed: (i) spring warming was faster and summer temperatures remained at maximum level longer in 2016 than in 2017 (Figure 2A); (ii) salinity was lower in 2016 (Figure 2A). DIN varied seasonally, from >20 μM in winter to <2 μM in summer, as well as inter-annually with 2-fold higher winter concentrations observed in 2016 in comparison to 2017 (Figure 2A).
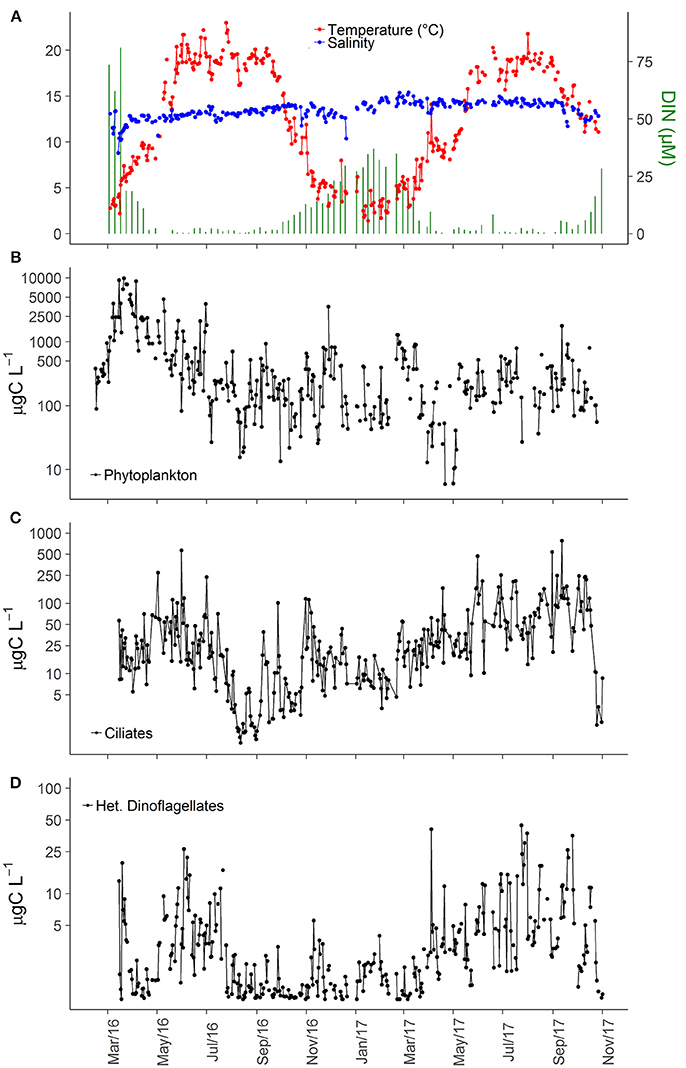
Figure 2. Time series of abiotic variables (A), carbon biomass of all phytoplankton cells (B), all ciliate cells (C), and all heterotrophic dinoflagellates cells (D) in inner Roskilde Fjord during the study period.
Phytoplankton and Microzooplankton Overall Dynamics
Interannual variations were observed, with considerably higher phytoplankton biomass in 2016 (Figure 2B), and higher ciliate biomass in 2017 (Figure 2C). The low phytoplankton biomass in 2017, compared to 2016, was mainly associated with lower abundance of cryptophytes, small nano-flagellates, and pico-eukaryotes in 2017 (data not shown). The average ciliate biomass for the entire study period was 22.3 μg C L−1, and the average biomass during the productive season (March–November) was 12.3 and 55.8 μg C L−1 in 2016 and 2017, respectively. Heterotrophic dinoflagellates were also more important in 2017 than in 2016 with average biomass during the productive season of 4.45 and 2.37 μg C L−1, respectively. Overall, heterotrophic dinoflagellate biomass was much smaller than ciliate biomass, averaging 2.72 μg C L−1 for the entire period, although biomass peaks could reach up to 40 μg C L−1 (Figure 2D). Higher summer biomasses of heterotrophic dinoflagellates were associated with increased abundance of large-sized heterotrophic dinoflagellates, such as Polykrikos, Protoperidinium, and Warnowiids.
The higher ciliate biomass in 2017 was associated with increasing abundance of representatives of all trophic strategies (Table 1). The dominance of heterotrophs (herbivores + carnivores) was higher during spring and summer of 2016, while 2017 was characterized by slightly varying high biomass for most of the year (Figure 3A). Biomass of GNCM (mixotrophs excluding M. rubrum) was generally higher in 2017 than in 2016, with values peaking in late spring and summer for both years (Figure 3B). The biomass proportion between GNCM and heterotrophic ciliates was variable and higher contributions (up to 90% of the ciliates biomass, excluding M. rubrum, in 2017) of GNCM were recorded in summer (Figure 3C). Biomass of M. rubrum was also higher in 2017 and generally above 10 μg C L−1 from April to October (Figure 3D).
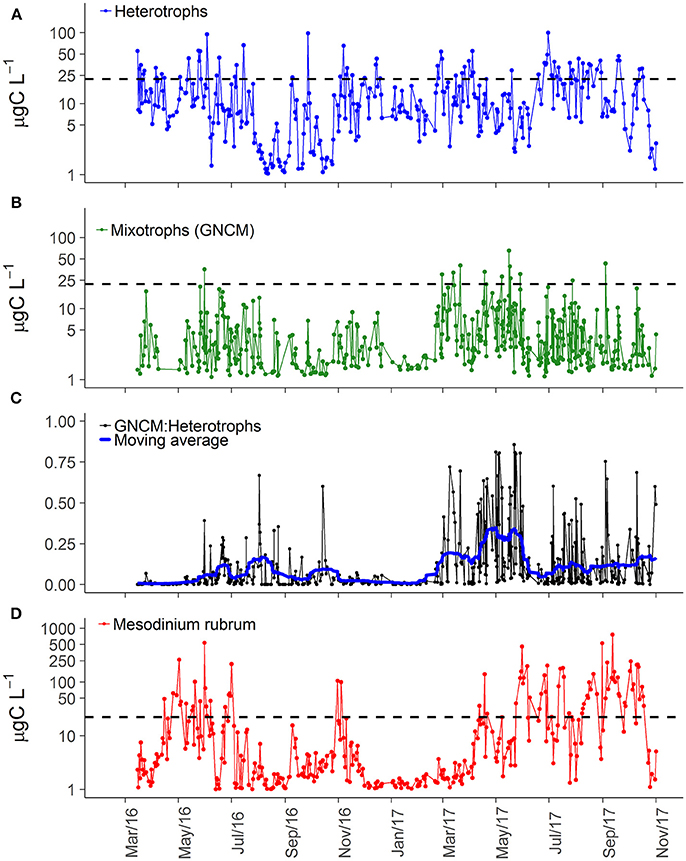
Figure 3. Carbon biomass of three main ciliate groups in Roskilde Fjord (A, B, D) and the biomass proportion between GNCM and heterotrophic ciliates (C). The black dashed horizontal lines in panels (A, B, D) represent the average of total ciliate biomass (22.26 μg C L−1) over the entire study period. The thick blue line in panel c represents the centered moving average, using a 15 days window.
Seasonality of Ciliate Morphotypes
Some ciliate morphotypes exhibited distinctive and recurring seasonal pattern (Table 3). cf. Pelagostrombilidium occurred during winter at temperatures <10°C, whereas Askenasia and Strombidium cf. capitatum were associated with higher temperatures, mainly during late spring and summer (Figures 4A–C). Other ciliate morphotypes exhibited distinct seasonal patterns of high biomass, although their presence was not restricted to a specific seasonal window. S. cf. conicum and tinitinnids were most abundant during late spring and summer, but also found during autumn (Figures 4D,E). Other morphotypes, such as cf. Urotricha (Figure 4F), did not display any pronounced recurring seasonal pattern despite of the high temporal variability. In spite of the significant differences among months (Table 3), some ciliates (Didinium, Mesodinium cf. velox, and Choreotrichida) did not have any clear occurrence pattern over the study period.
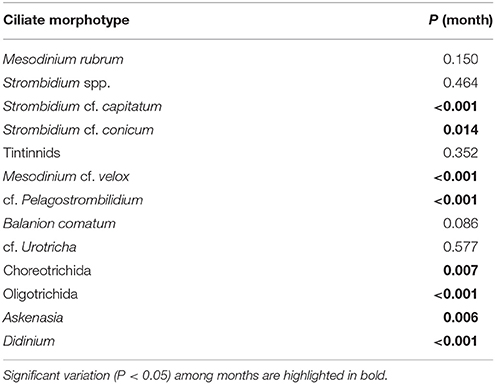
Table 3. Seasonality test for the log-transform of carbon biomass of different ciliate morphotypes.
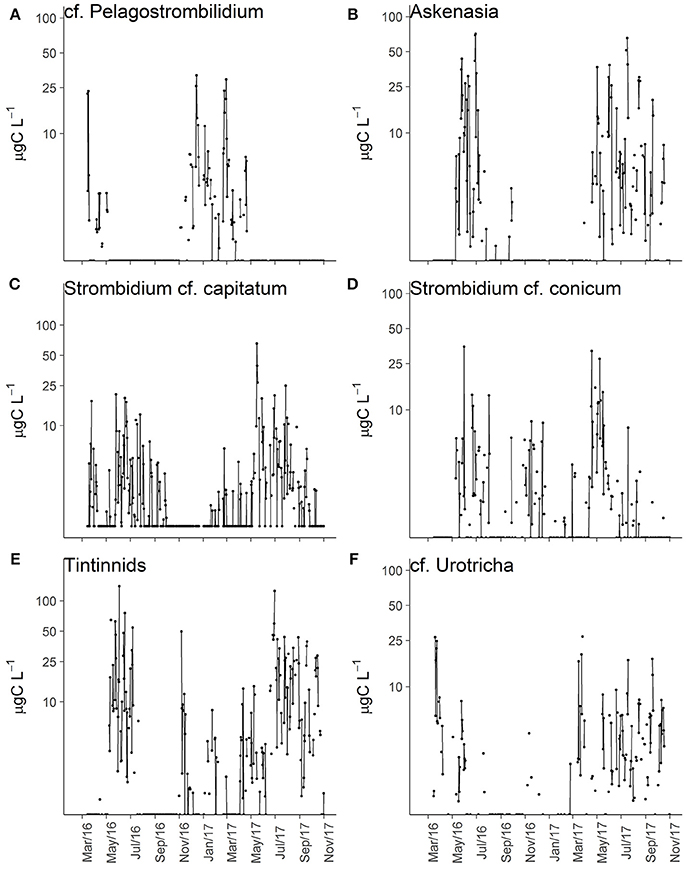
Figure 4. Biomass variations over time for selected ciliates morphotypes: cf. Pelagostrombilidium (A), Askenasia (B), Strombidium cf. capitatum (C), S. cf. conicum (D), Tintinnids (E), and cf. Urotricha (F).
Potential Grazing by Ciliates
Potential grazing varied broadly over time for the five trophic strategies of ciliates and their associated preys (Table 1), displaying highly variable patterns of potential food limitation (Figure 5).
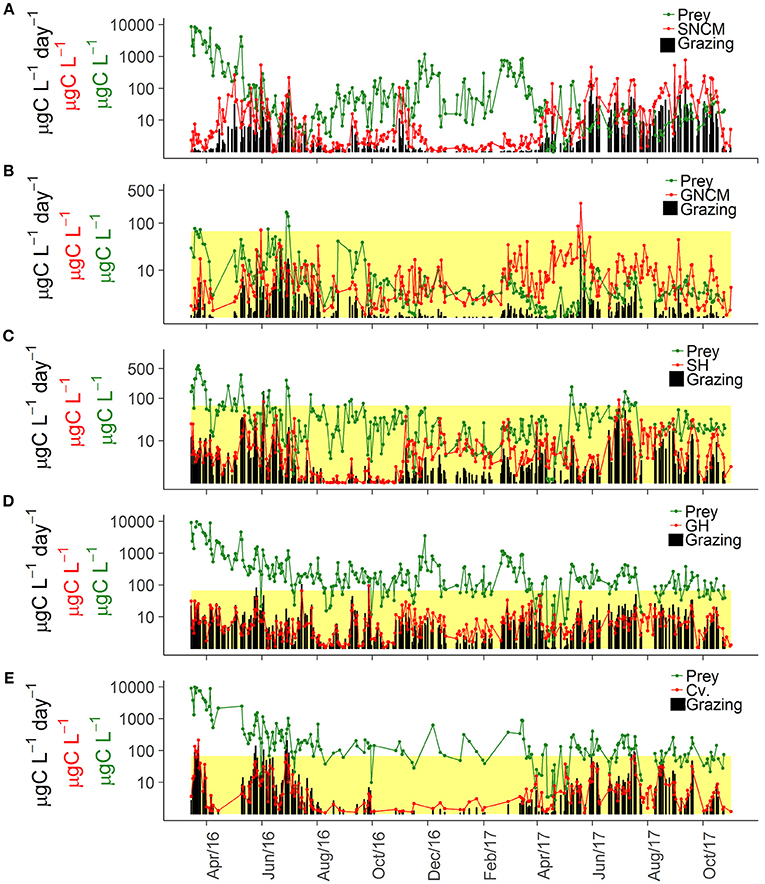
Figure 5. Temporal dynamics of assigned phytoplankton prey, ciliate biomass, and potential grazing rates for the different trophic strategies: SNCM, Specialist Non Constitutive Mixotroph (A), GNCM, Generalist Non Constitutive Mixotroph (B), SH, Selective Herbivore (C), GH, Generic Herbivore (D), and Cv, Carnivore (E). The upper limits of the yellow colored area indicate the half-saturation constant for food density (Km), thus when prey concentrations are smaller than Km (within the yellow area) it indicates potential food limitation. As SNCM potential grazing (A) was estimated in a distinct way, the Km criteria was not used for this trophic strategy. For further details on Km definition and calculation, see “Potential Grazing” in the section Materials and Methods.
Temporal variations in biomass of M. rubrum (SNCM) and its cryptophyte prey were inversely related (Figure 5A). Teleaulax spp. was most abundant in winter when SNCM biomass was low, and decreased in late spring and summer when blooms of M. rubrum occurred. The seasonal pattern in SNCM biomass also shifted between the 2 years; the biomass was low in summer 2016, whereas it remained high from mid-April until late October in 2017.
GNCM ciliates attained similar biomass levels in 2016 and 2017, but their potential ingestion was lower in 2017 due to stronger food-limitation (Figure 5B), which was observed in 98% of the occasions in 2016 and in all observations in 2017. Consequently, biomass and potential ingestion observations were decoupled for this group. On the other hand, it also indicates strong grazing pressure on small phytoplankton cells by these ciliates during spring and summer (Figure 5B).
SH ciliates were often food limited (82% of observations), even during winter and spring (Figure 5C). SH grazing impact varied interannually and was most intense from May to July in 2016, and from June to October in 2017. SH food limitation was observed more frequently in 2017 than in 2016 (60 and 77% of the observations in 2016 and 2017, respectively).
GH ciliates were food limited in 49 and 66% of the observations in 2016 and 2017, respectively (Figure 5D). The potential grazing for this group of ciliates seemed to be more intense in autumn 2017 compared to autumn 2016, and potential food limitation appeared to have started earlier in 2017 (around April) than 2016 (around June). A shift in the most abundant morphotype was observed between years, with Choreotrichida being the main GH morphotype in 2016, and cf. Urotricha in 2017. Together with SH, these ciliates appeared to be the main grazers during the winter period.
The carnivore ciliates (Cv) had high grazing rates during summer (Figure 5E), associated with high biomass of Askenasia (Figure 4B), but carnivores grazing can also be high in other periods, such as the spring bloom with high abundance of Didinium (Figure 5E). During 2016, potential grazing had higher peaks, observed in distinct periods of the year, while potential grazing rates had lower maximum values in 2017 but were consistently higher throughout a longer period (until autumn). Food limitation was observed in 32% of the observations (14% in 2016, and 55% in 2017), and as for the other trophic strategies, more frequent in 2017.
Interannual Differences in Prey-Predator Dynamics
Dynamics of prey-predator biomasses were analyzed for the productive season (15 March to 01 November) of each year (Figure 6). The arrows represent the distance between observations, and longer arrows can be used as a proxy for higher variability in the prey-predator relationships.
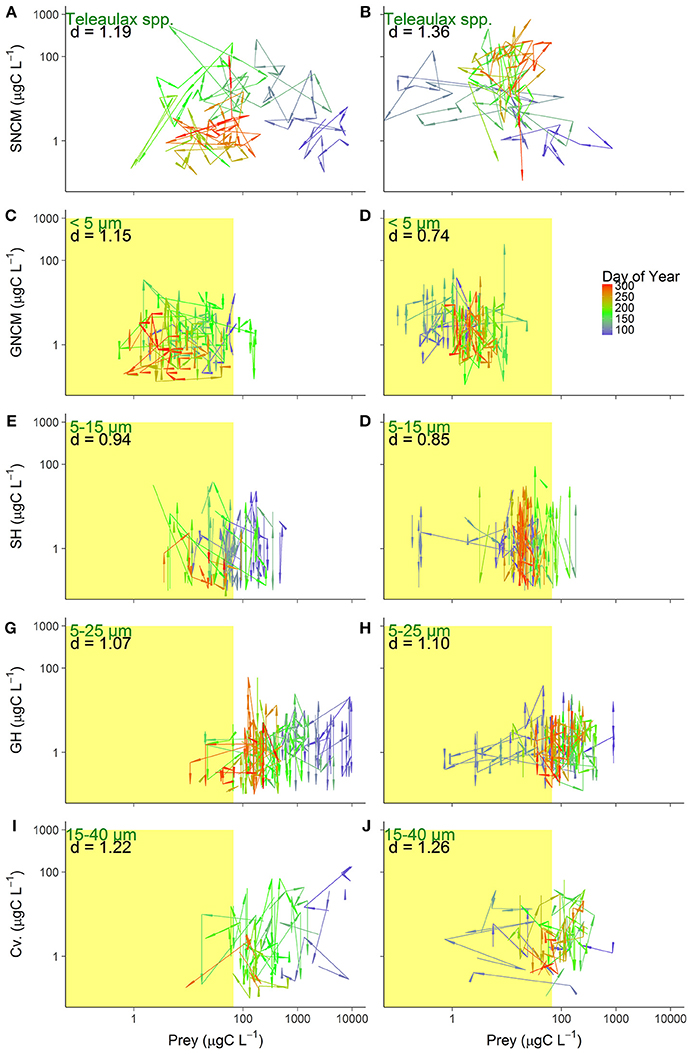
Figure 6. Prey-predator biomass dynamics for the five trophic strategies in 2016 (left) and 2017 (right): SNCM, Specialist Non Constitutive Mixotroph (A,B), GNCM, Generalist Non Constitutive Mixotroph (C,D), SH, Selective Herbivore (E,F), GH, Generic Herbivore (G,H), and Cv, Carnivore (I,J). Arrows represent the distance between observations (Euclidean distance) and color gradient indicate the day of year. Text depicts the phytoplankton prey assigned for each predator group (green), and the average Euclidean distance (d) between observation in the productive season of each year (black). Right limits of the yellow colored area indicate the half-saturation constant of food density (Km), and the observations to the left, within the colored area, indicate potential food limitation (except for SNCM, see explanation in Figure 5).
For the SNCM-prey coupling, the average distance between observations was lower in 2016 (d = 1.19) than in 2017 (d = 1.36), indicating higher variability in 2017. For this pair, variation between sampled days were higher (41% higher than the rest of productive season) during late spring to summer (day of year 110–200) in 2016 (Figure 6A). Distances in 2017 were more evenly distributed, with the distances found in late spring to summer, being only 8% longer than for the rest of the productive season (Figure 6B).
For GNCM-prey and SH-prey pairs, average distance between observations were higher in 2016 than in 2017, with d2016 = 1.48 and d2017 = 0.74 for GNCM; and d2016 = 0.94 and d2017 = 0.85 for SH (Figures 6C–F).
GH-prey dynamics did not appear to differ between years, with d = 1.07 and d = 1.10 for 2016 and 2017, respectively (Figures 6G,H). Similarly, Cv.-prey observations average distance did not vary between years (d2016 = 1.22 and d2017 = 1.26), however differences over specific periods of the productive season were observed for this group (Figures 6I,J). From spring to early summer (day of year 75–160) in 2016, distances were about 15% longer than for the rest of the period, while in 2017, distances in the same period were 58% longer than the rest of the productive season.
A simplified scheme (Figure 7) summarizes the daily average biomass for each group of phytoplankton preys and the potential daily C intake for the different ciliate trophic strategies during the productive season of each year. In 2016, biomasses of all phytoplankton prey groups were higher than in 2017, except for nano-flagellates (5–15 μm). The intake by ciliates was generally lower in 2016, with an overall relative removal of about 9% of phytoplankton daily standing biomass (Figure 7A). The potential grazing impact over the phytoplankton varied among the different trophic strategies, being low for SNCM and GH (~3% of C prey biomass being grazed) and higher for GNCM and SH (about 19 and 14% of C prey biomass being grazed, respectively). In 2017, phytoplankton standing biomasses were modest when compared to the previous year, and potential grazing was higher for most ciliate trophic strategies (Figure 7B). The relative impact of grazing by the ciliates was about 31% of phytoplankton standing biomass in 2017, with GH being able to remove 12% of its prey biomass, while GNCM and SNCM being able to graze 37 and 46% of their preys standing biomasses daily.
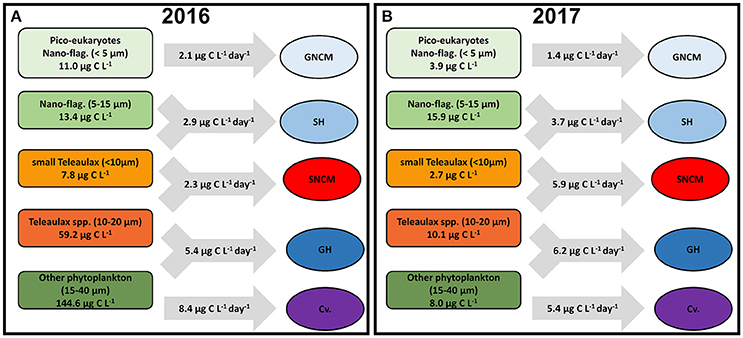
Figure 7. Simplified scheme showing the daily average biomass of each phytoplankton prey group and the average grazing rates of each ciliate trophic strategy in 2016 (A) and 2017 (B). Averages calculated only for the productive season (March to November).
Discussion
Our results underline that microzooplankton, especially ciliates, can be an important component of the pelagic food web in temperate nutrient-rich estuaries at all times. On top of that, we also demonstrate that different components of the heterotrophic protist plankton have distinct ecological strategies, each affecting the phytoplankton community in its own way. Even though our results are based on standing biomasses and do not include any direct rate measurement (neither primary production nor grazing), we believe that the high temporal resolution data on both phytoplankton and microzooplankton support our findings. Furthermore, our results explore the diets of different ciliates in detail, revealing the existence of various prey-predator couplings that are likely to influence the community functioning in distinct ways. Additionally, we structured potential grazing calculations as proposed by Hansen et al. (1997), following the Michaelis-Menten kinetics, in contrast to the rectilinear model approach suggested by other authors, e.g., Zervoudaki et al. (2009). The Michaelis-Menten kinetics allow grazing estimation at varying prey concentrations, whereas a rectilinear model assumes a linear increase in ingestion rate until food saturation is reached, which can overestimate the potential grazing.
Classically, the relative importance of trophic pathways of phytoplankton primary production in any specific ecosystem is highly dependent on the balance between nutrient inputs and recycling, with increasing dominance of larger phytoplankton species and mesozooplankton in areas with higher input of new nutrients (Azam et al., 1983; Fenchel, 1988; Buitenhuis et al., 2006). Although Roskilde Fjord (RF) is a nutrient rich system (Staehr et al., 2017), its inner portion, which is also the area of interest in this study, has always been dominated by small phytoplankton organisms (<20 μm), not diatoms, evidenced by the long term monitoring data. Besides microzooplankton, potential consumers of phytoplankton in RF are pelagic mesozooplankton and benthic filter feeders; however, benthic grazers were not sampled in this study, therefore we cannot compare directly the relative importance of pelagic vs. benthic grazing. We also acknowledge that protozooplankton grazing in RF was only calculated for larger protozooplankton (ciliates and heterotrophic dinoflagellates). Other organisms, such heterotrophic nano-flagellates and small heterotrophic dinoflagellates (<15 μm), were not properly recorded by any of the methods used in this study, and likely increase the real contribution of protozooplankton grazing.
Heterotrophic dinoflagellates can be an important component of microzooplankton and microbial food webs (Sherr and Sherr, 2007), but their importance in RF seems low compared to ciliates. Heterotrophic dinoflagellates biomass was less than 10% of ciliate biomass in most samples, even though it was higher in a few instances. On top of that, dinoflagellates have lower growth and grazing rates than ciliates (Hansen, 1992; Jakobsen and Hansen, 1997), which indicates a minor role of this group for carbon cycling in RF. Seasonality of heterotrophic dinoflagellates was marked by the increased occurrence of large sized cells during summer. The observed increase in size of heterotrophic dinoflagellates is in agreement with what has previously been described for other open areas, such as Kattegat and Kiel Bight (Smetacek, 1981; Hansen, 1991), and might reflect an adaptation in the dinoflagellate assembly to the larger prey items. However, summer is also characterized by higher biomass of ciliates, and the increasing proportion of large heterotrophic dinoflagellates might indicate a change in ecological strategy which aims to avoid competition with ciliates that graze on smaller phytoplankton.
Salinity variations are mainly associated with freshwater discharges during winter, enhancing dissolved inorganic nitrogen (DIN) concentrations that are mainly consumed by phytoplankton during spring (Staehr et al., 2017). Although inter-annual differences in salinity were modest, DIN inputs were higher in 2016. This could explain the intense spring bloom observed in 2016 compared to the modest one in 2017, but it cannot explain entirely the consistently higher biomass of all ciliate types and heterotrophic dinoflagellates in 2017 compared to 2016. Differences in phytoplankton biomass could be due to the higher microzooplankton biomass in 2017 compared to 2016, indicating a more intense grazing in 2017. Thus, it is likely that phytoplankton is top-down controlled by microzooplankton in RF, and that due to fast turnover rates of both communities, primary production is higher despite relatively lower phytoplankton biomasses. Additionally, it is likely that the high DIN inputs in the winter of 2016 disrupted the coupling between phytoplankton and their ciliate predators that was better depicted in 2017. DIN concentrations were depleted to similar levels after the spring bloom in both years, indicating that higher concentrations in the winter of 2016 probably supported the larger bloom observed in this year. This large perturbation in the prey-predator coupling at the beginning of the productive season probably shaped also the rest of the year, causing interannual differences in prey-predator coupling, and reduced the number of observations with food-limitation in 2016. The prey-predator coupling varied among trophic strategies, resulting in the following contrasts between the studied years: (1) larger variation in the coupling in 2016 than in 2017 (for GNCM and SH); (2) differences in the timing when variations were observed during the productive season (SNCM and Cv.); and (3) changes in the dominance of the main morphotype (GH).
Previous studies have described various seasonal dynamics of ciliates in coastal and estuarine areas, and their importance in the trophic energy transfer. In Gulf of Maine, distinct ciliate assemblages were dominant at specific seasons, with larger ciliates found in spring, associated with larger preys, and smaller ciliates in other periods, when available prey were smaller (Montagnes et al., 1988). Conversely, ciliates in Coos Bay were reported to control small-sized phytoplankton throughout the year (Cowlishaw, 2004). In our study, ciliate biomass and their estimated potential grazing rates were in the same range as biomass of phytoplankton prey, especially for sizes <15 μm and cryptophytes, indicating selective pressure by ciliates grazing on small phytoplankton cells. The phytoplankton groups with lower standing biomass in 2017 compared to 2016 (cryptophytes, pico-eukaryotes, and small nano-flagellates) were subject to intense grazing pressure by different ciliate morphotypes, which probably substituted each other over the year in succession. These ciliate morphotypes also tended to be more food limited (GNCM and SH). Furthermore, as potential ingestion rates were modeled from standing biomass and not directly measured, it is likely that our grazing rates, especially for 2017, are underestimated due to intense grazing that resulted in low standing biomass of some phytoplankton groups. Yet, they provide valuable information on potential impact of ciliates, suggesting that ciliate grazing is an important driver for the phytoplankton succession, and that the microbial loop is a key pathway in the RF food web, despite of the high new nutrient input from land, which was assumed to promote the short-chain food web (Azam et al., 1983). Thus, ciliates might be a key player in the overall trophic transfer in RF, as an intermediate step between small-sized phytoplankton and mesozooplankton (Calbet and Saiz, 2005) and benthic filter feeders (Zeldis et al., 2004).
Organism with acquired phototrophy, including ciliates, are considered to have an increased gross growth efficiency, and therefore enhancing carbon export and nutrient cycling (Stoecker et al., 2009, 2017; Mitra et al., 2016). Experimental studies have shown that among non-constitutive mixotrophs, the acquired capability of photosynthesis can increase the specific growth rates. However, this should not be generalized, as specific growth rate varies among species, and for some mixotrophs, it can still be low compared to autotrophs or heterotrophs (Jakobsen et al., 2000; Jakobsen and Strom, 2004; Schoener and McManus, 2012). Despite the fact that these organisms can often dominate microzooplankton communities and be responsible for a considerable proportion of primary production and/or grazing, in situ ecological data describing processes and importance of those organisms are still sparse (Stoecker et al., 2017). It is hypothesized that autotrophic and heterotrophic organisms dominate during the developmental phase of the ecosystems, while mixotrophs dominate in mature systems, benefiting from a flexible nutrition (Mitra et al., 2014). Our study shows that mixotrophic nutrition is increasingly important at the decline of spring bloom and during summer, when the system shifts from net autotrophy to net heterotrophy (Staehr et al., 2017). Additionally, our results demonstrated that mixotrophs (SNCM and GNCM, and even morphotypes among GNCM) have distinct temporal dynamics, reflecting different ecological strategies.
Mesodinium rubrum acquires its chloroplasts from specific prey (Teleaulax spp.), taking strong control over the photosynthetic apparatus of its prey, and being able to survive at low prey concentrations (Smith and Hansen, 2007; Peltomaa and Johnson, 2017). These organisms have been the focus of many ecophysiological studies. Blooms of M. rubrum are common in coastal areas and have been associated with occurrence of cryptophytes (Johnson et al., 2013; Hamilton et al., 2017; Lips and Lips, 2017). Our data shows that periods with high M. rubrum biomass are associated with low cryptophyte biomass, except for the spring bloom (March–April). Even though high biomass of M. rubrum occur around summer, M. rubrum was present in most (>95%) of samples during all seasons. Using the higher magnification of FlowCAM in 2017 allowed us to observe cell discolouration and size reduction of M. rubrum individuals during late summer/autumn, coinciding with the period of higher temperatures and low DIN in RF. At the same time, cells of M. rubrum were observed capturing particles other than cryptophytes with their oral tentacles (see Figures 1,1a-lower row). This emphasizes that the ecological flexibility of M. rubrum remains poorly understood, but that the flexibility could also explain the apparent success of M. rubrum in many environments and, in the case of RF, over the entire year.
In contrast to M. rubrum, oligotrichids that retain chloroplasts (GNCM), do not seem to be able to maintain them and need to feed at higher rates than M. rubrum, to replace aging plastids at higher rate (Jakobsen and Strom, 2004; Schoener and McManus, 2012). The plastid turnover rate depends on the availability of the plastid source, and GNCM usually use plastids of different origin, although they have a preferred type, depending on the species (Stoecker et al., 1988; Stoecker and Silver, 1990; Schoener and McManus, 2012). Under controlled conditions, Strombidium rassoulzadegani had newly acquired plastids positioned at the cell periphery within 30 min after being offered new prey, and it replaced all plastids after 2–3 days, yielding a plastid turnover rate slower than other Strombidium species (Stoecker and Silver, 1990; Schoener and McManus, 2012). Thus, GNCM can ingest phytoplankton prey at similar rates as heterotrophic ciliates (Jakobsen and Strom, 2004; Schoener and McManus, 2012), having a potential impact on carbon cycling, especially when larger species are present. GNCM in our study were composed of different species, with higher biomasses being associated with the proliferation of large morphotypes (Strombidium cf. conicum and S. cf. capitatum). These morphotypes were usually found during spring and summer, but higher biomasses were observed mainly in late spring. As those ciliates were food limited in most occasions (<95% of observations), their estimated grazing rates were around 10 times smaller than their potential ingestion based on cell volume. This indicates that despite of having a strong presence in RF, grazing imposed by mixotrophs is lower than by heterotrophic ciliates. On the other hand, mixotrophic nutrition supports their survival until suitable prey is encountered.
High volatility in the dominance of different types of ciliates was observed in this study. The temporal dynamics of the different trophic strategies demonstrated that mixotrophs (SNCM and GNCM) and carnivores exhibited strong seasonality in their occurrence and potential impact, predominating during summer. Conversely, herbivores (SH and GH) appeared to be widely distributed throughout the year, but apparently with different ecological strategies. GH types are present in low concentrations in most of the samples; whereas SH types occur with variable importance over the annual cycle (cf. Pelagostrobilidium in winter and tintinnids in summer), but together covering different seasons. This illustrates how complex and flexible ciliate communities can be, showing a great potential to control and drive changes of phytoplankton. We also observed a gradient in the prey-predator coupling among trophic strategies of ciliates, in which the more selective ciliates tend to be more efficient in removing their prey and are more often food limited, while the opposite is observed for ciliates that have a wider prey range, with exception of SNCM. However, those patterns are subjected to variability introduced by exogenous forcing (i.e., nutrient loads).
Conclusion
The use of in-flow techniques supports the analysis of phytoplankton and their microzooplankton grazers with high frequency. Additionally, the use of live samples further allows exploring trophic characteristics of ciliates, providing insights to the trophic strategies and specific prey classification. Ciliates are likely the main pelagic grazers in RF and probably play an essential role in the food web, linking primary production of small-celled organisms to higher trophic levels. Although ciliates are most abundant during summer, they are still important in other seasons. This is due to the range of different ecological strategies within the diverse ciliate community, combining different trophic strategies with different physiological adaptations. Thus, the ciliate community structure is highly complex and most likely an important driver for structuring the phytoplankton community.
Author Contributions
LH, HJ, JC, and NL contributed conception and design of the study; LH and HJ collected the data and organized the database; LH, HJ, and JC performed the data analysis; LH wrote the first draft of the manuscript. All authors contributed to manuscript writing, revision, read and approved the submitted version.
Funding
LH was supported by a grant from the Brazilian program Science without Borders/CAPES (Grant No. 13581-13-9). This study is a contribution from the BONUS COCOA project (grant agreement 2112932-1) supported by Innovation Fund Denmark and the European Union.
Conflict of Interest Statement
The authors declare that the research was conducted in the absence of any commercial or financial relationships that could be construed as a potential conflict of interest.
Supplementary Material
The Supplementary Material for this article can be found online at: https://www.frontiersin.org/articles/10.3389/fmars.2018.00272/full#supplementary-material
Figure S1. Map showing the sampled station location (red star) at Roskilde Fjord (Denmark).
References
Azam, F., Fenchel, T., Field, J., Gray, J., Meyer-Reil, L., and Thingstad, F. (1983). The ecological role of water-column microbes in the sea. Mar. Ecol. Prog. Ser. 10, 257–263. doi: 10.3354/meps010257
Behrenfeld, M. J., and Falkowski, P. G. (1997). Photosynthetic rates derived from satellite-based chlorophyll concentration. Limnol. Oceanogr. 42, 1–20. doi: 10.4319/lo.1997.42.1.0001
Buitenhuis, E., Le Quéré, C., Aumont, O., Beaugrand, G., Bunker, A., Hirst, A., et al. (2006). Biogeochemical fluxes through mesozooplankton. Global Biogeochem. Cycles 20:GB2003. doi: 10.1029/2005GB002511
Buitenhuis, E. T., Rivkin, R. B., Séailley, S., and Le Quéré, C. (2010). Biogeochemical fluxes through microzooplankton. Global Biogeochem. Cycles 24:GB4015. doi: 10.1029/2009GB003601
Calbet, A. (2001). Mesozooplankton grazing effect on primary production: a global comparative analysis in marine ecosystems. Limnol. Oceanogr. 46, 1824–1830. doi: 10.4319/lo.2001.46.7.1824
Calbet, A., and Landry, M. R. (2004). Phytoplankton growth, microzooplankton grazing, and carbon cycling in marine systems. Limnol. Oceanogr. 49, 51–57. doi: 10.4319/lo.2004.49.1.0051
Calbet, A., and Saiz, E. (2005). The ciliate-copepod link in marine ecosystems. Aquat. Microb. Ecol. 38, 157–167. doi: 10.3354/ame038157
Calbet, A., Sazhin, A. F., Nejstgaard, J. C., Berger, S. A., Tait, Z. S., Olmos, L., et al. (2014). Future climate scenarios for a coastal productive planktonic food web resulting in microplankton phenology changes and decreased trophic transfer efficiency. PLoS ONE 9:e94388. doi: 10.1371/journal.pone.0094388
Campbell, L., Henrichs, D. W., Olson, R. J., and Sosik, H. M. (2013). Continuous automated imaging-in-flow cytometry for detection and early warning of Karenia brevis blooms in the Gulf of Mexico. Environ. Sci. Pollut. Res. 20, 6896–6902. doi: 10.1007/s11356-012-1437-4
Choi, J. W., and Stoecker, D. K. (1989). Effects of fixation on cell volume of marine planktonic protozoa. Appl. Environ. Microbiol. 55, 1761–1765.
Cowlishaw, R. J. (2004). Seasonal coupling between ciliate and phytoplankton standing stocks in the South Slough of Coos Bay, Oregon. Estuaries 27, 539–550. doi: 10.1007/BF02803545
Dashkova, V., Malashenkov, D., Poulton, N., Vorobjev, I., and Barteneva, N. S. (2017). Imaging flow cytometry for phytoplankton analysis. Methods 112, 188–200. doi: 10.1016/j.ymeth.2016.05.007
Dugenne, M., Thyssen, M., Nerini, D., Mante, C., Poggiale, J.-C., Garcia, N., et al. (2014). Consequence of a sudden wind event on the dynamics of a coastal phytoplankton community: an insight into specific population growth rates using a single cell high frequency approach. Front. Microbiol. 5:485. doi: 10.3389/fmicb.2014.00485
Earland, K. A., and Montagnes, D. J. S. (2002). Description of a new marine species of askenasia blochmann, 1895 (ciliophora, haptoria), with notes on its ecology. J. Eukaryot. Microbiol. 49, 423–427. doi: 10.1111/j.1550-7408.2002.tb00222.x
Edwards, K. F., Thomas, M. K., Klausmeier, C. A., and Litchman, E. (2012). Allometric scaling and taxonomic variation in nutrient utilization traits and maximum growth rate of phytoplankton. Limnol. Oceanogr. 57, 554–566. doi: 10.4319/lo.2012.57.2.0554
Fenchel, T. (1988). Marine plankton food chains. Annu. Rev. Ecol. Syst. 19, 19–38. doi: 10.1146/annurev.es.19.110188.000315
Flynn, K. J., Stoecker, D. K., Mitra, A., Raven, J. A., Glibert, P. M., Hansen, P. J., et al. (2013). Misuse of the phytoplankton–zooplankton dichotomy: the need to assign organisms as mixotrophs within plankton functional types. J. Plankton Res. 35, 3–11. doi: 10.1093/plankt/fbs062
Gifford, D. J. (1991). The protozoan-metazoan trophic link in pelagic ecosystems. J. Protozool. 38, 81–86. doi: 10.1111/j.1550-7408.1991.tb04806.x
Hamilton, M., Hennon, G. M. M., Morales, R., Needoba, J., Peterson, T. D., Schatz, M., et al. (2017). Dynamics of Teleaulax -like cryptophytes during the decline of a red water bloom in the Columbia river estuary. J. Plankton Res. 39, 589–599. doi: 10.1093/plankt/fbx029
Hansen, J. (1991). Quantitative importance and trophic role of heterotrophic dinoflagellates in a coastal pelagial food web. Mar. Ecol. Prog. Ser. 73, 253–261.
Hansen, J., Bjornsen, P. K., and Hansen, B. W. (1997). Zooplankton grazing and growth: scaling within the 2-2,000-mm body size range. Limnol. Oceanogr. 42, 687–704.
Hansen, P. J. (1992). Prey size selection, feeding rates and growth dynamics of heterotrophic dinoflagellates with special emphasis on Gyrodinium spirale. Mar. Biol. 114, 327–334. doi: 10.1007/BF00349535
Haraguchi, L., Jakobsen, H., Lundholm, N., and Carstensen, J. (2017). Monitoring natural phytoplankton communities: a comparison between traditional methods and pulse-shape recording flow cytometry. Aquat. Microb. Ecol. 80, 77–92. doi: 10.3354/ame01842
Hewett, S. W. (1988). Predation by Didinium Nasutum: effects of predator and prey size. Ecology 69, 135–145.
Jakobsen, H. H., and Carstensen, J. (2011). FlowCAM: sizing cells and understanding the impact of size distributions on biovolume of -planktonic community structure. Aquat. Microb. Ecol. 65, 75–87. doi: 10.3354/ame01539
Jakobsen, H. H., and Hansen, J. (1997). Prey size selection, grazing and growth response of the small heterotrophic dinoflagellate Gymnodinium sp. and the ciliate Balanion comatum-a comparative study. 158, 75–86.
Jakobsen, H. H., Hansen, P. J., and Larsen, J. (2000). Growth and grazing responses of two chloroplast-retaining dinoflagellates: effect of irradiance and prey species. Mar. Ecol. Prog. Ser. 201, 121–128. doi: 10.3354/meps201121
Jakobsen, H. H., and Montagnes, D. J. S. (1999). A redescription of balanion comatum wulff, 1919 (prorodontida, ciliophora), with notes on its cultivation and behaviour. J. Eukaryot. Microbiol. 46, 198–205. doi: 10.1111/j.1550-7408.1999.tb04604.x
Jakobsen, H. H., and Strom, S. L. (2004). Circadian cycles in growth and feeding rates of heterotrophic protist plankton. Limnol. Oceanogr. 49, 1915–1922. doi: 10.4319/lo.2004.49.6.1915
Johnson, M. D. (2011). Acquired phototrophy in ciliates: a review of cellular interactions and structural adaptations1. J. Eukaryot. Microbiol. 58, 185–195. doi: 10.1111/j.1550-7408.2011.00545.x
Johnson, M. D., Stoecker, D. K., and Marshall, H. G. (2013). Seasonal dynamics of Mesodinium rubrum in chesapeake Bay. J. Plankton Res. 35, 877–893. doi: 10.1093/plankt/fbt028
Kaas, H., and Markager, S. (1998). Technical Guidelines for Marine Monitoring. Available online at: http://bios.au.dk/raadgivning/fagdatacentre/fdcmarintny/tekniske-anvisninger-nova-1998/
Kamp-Nielsen, L. (1992). “Benthic-pelagic coupling of nutrient metabolism along an estuarine eutrophication gradient,” in Sediment/Water Interactions, eds B. T. Hart and P. G. Sly (Dordrecht: Springer), 457–470.
Landry, M. R., and Calbet, A. (2004). Microzooplankton production in the oceans. ICES J. Mar. Sci. 61, 501–507. doi: 10.1016/j.icesjms.2004.03.011
Leles, S. G., Mitra, A., Flynn, K. J., Stoecker, D. K., Hansen, P. J., Calbet, A., et al. (2017). Oceanic protists with different forms of acquired phototrophy display contrasting biogeographies and abundance. Proc. Biol. Sci. 284:20170664. doi: 10.1098/rspb.2017.0664
Lips, I., and Lips, U. (2017). The importance of mesodinium rubrum at post-spring bloom nutrient and phytoplankton dynamics in the vertically stratified baltic sea. Front. Mar. Sci. 4:407. doi: 10.3389/fmars.2017.00407
Menden-Deuer, S., and Lessard, E. J. (2000). Carbon to volume relationships for dinoflagellates, diatoms, and other protist plankton. Limnol. Oceanogr. 45, 569–579. doi: 10.4319/lo.2000.45.3.0569
Mitra, A., Flynn, K. J., Burkholder, J. M., Berge, T., Calbet, A., Raven, J. A., et al. (2014). The role of mixotrophic protists in the biological carbon pump. Biogeosciences 11, 995–1005. doi: 10.5194/bg-11-995-2014
Mitra, A., Flynn, K. J., Tillmann, U., Raven, J. A., Caron, D., Stoecker, D. K., et al. (2016). Defining planktonic protist functional groups on mechanisms for energy and nutrient acquisition: incorporation of diverse mixotrophic strategies. Protist 167, 106–120. doi: 10.1016/j.protis.2016.01.003
Montagnes, D. J. S. (2012). “Ecophysiology and Behavior of Tintinnids,” in The Biology and Ecology of Tintinnid Ciliates, eds J. R. Dolan, D. J. S. Montagnes, S. Agatha, D. W. Coats, and D. K. Stoecker (Chichester: John Wiley and Sons, Ltd), 85–121.
Montagnes, D. J. S., Lynn, D. H., Roff, J. C., and Taylor, W. D. (1988). The annual cycle of heterotrophic planktonic ciliates in the waters surrounding the Isles of Shoals, Gulf of Maine: an assessment of their trophic role. Mar. Biol. 99, 21–30. doi: 10.1007/BF00644973
Nielsen, T. G., and Kiørboe, T. (1994). Regulation of zooplankton biomass and production in a temperate, coastal ecosystem. 2. Ciliates. Limnol. Oceanogr. 39, 508–519. doi: 10.4319/lo.1994.39.3.0508
Peltomaa, E., and Johnson, M. (2017). Mesodinium rubrum exhibits genus-level but not species-level cryptophyte prey selection. Aquat. Microb. Ecol. 78, 147–159. doi: 10.3354/ame01809
Pinheiro, J., Bates, D., DebRoy, S., and Sarkar, D. (2017). nlme: Linear and Nonlinear Mixed Effects Models. Available online at: https://cran.r-project.org/package=nlme
R Core Team (2017). R: A Language and Environment for Statistical Computing. Available online at: http://www.r-project.org/
Schoener, D., and McManus, G. (2012). Plastid retention, use, and replacement in a kleptoplastidic ciliate. Aquat. Microb. Ecol. 67, 177–187. doi: 10.3354/ame01601
Sherr, E. B., and Sherr, B. F. (2007). Heterotrophic dinoflagellates: a significant component of microzooplankton biomass and major grazers of diatoms in the sea. Mar. Ecol. Prog. Ser. 352, 187–197. doi: 10.3354/meps07161
Sherr, E., and Sherr, B. (1988). Role of microbes in pelagic food webs: a revised concept. Limnol. Oceanogr. 33, 1225–1227. doi: 10.4319/lo.1988.33.5.1225
Smetacek, V. (1981). The annual cycle of protozooplankton in the Kiel Bight. Mar. Biol. 63, 1–11. doi: 10.1007/BF00394657
Smith, M., and Hansen, P. (2007). Interaction between Mesodinium rubrum and its prey: importance of prey concentration, irradiance and pH. Mar. Ecol. Prog. Ser. 338, 61–70. doi: 10.3354/meps338061
Staehr, P. A., Testa, J., and Carstensen, J. (2017). Decadal changes in water quality and net productivity of a shallow danish estuary following significant nutrient reductions. Estuaries Coasts 40, 63–79. doi: 10.1007/s12237-016-0117-x
Stoecker, D., Johnson, M., deVargas, C., and Not, F. (2009). Acquired phototrophy in aquatic protists. Aquat. Microb. Ecol. 57, 279–310. doi: 10.3354/ame01340
Stoecker, D. K. (1998). Conceptual models of mixotrophy in planktonic protists and some ecological and evolutionary implications. Eur. J. Protistol. 34, 281–290. doi: 10.1016/S0932-4739(98)80055-2
Stoecker, D. K., and Capuzzo, J. M. (1990). Predation on protozoa: its importance to zooplankton. J. Plankton Res. 12, 891–908. doi: 10.1093/plankt/12.5.891
Stoecker, D. K., Gifford, D. J., and Putt, M. (1994). Preservation of marine planktonic ciliates: losses and cell shrinkage during fixation. Mar. Ecol. Prog. Ser. 110, 293–299. doi: 10.3354/meps110293
Stoecker, D. K., Hansen, P. J., Caron, D. A., and Mitra, A. (2017). Mixotrophy in the marine plankton. Ann. Rev. Mar. Sci. 9, 311–335. doi: 10.1146/annurev-marine-010816-060617
Stoecker, D. K., and Silver, M. W. (1990). Replacement and aging of chloroplasts in Strombidium capitatum (Ciliophora: Oligotrichida). Mar. Biol. 107, 491–502. doi: 10.1007/BF01313434
Stoecker, D. K., Silver, M. W., Michaels, A. E., and Davis, L. H. (1988). Obligate mixotrophy in Laboea strobila, a ciliate which retains chloroplasts. Mar. Biol. 99, 415–423. doi: 10.1007/BF02112135
Tamar, H. (1986). Four marine species of Mesodinium (Ciliophora: Didiniidae). I. Mesodinium velox n. sp. Trans. Am. Microsc. Soc. 105, 130–140. doi: 10.2307/3226385
Thyssen, M., Mathieu, D., Garcia, N., and Denis, M. (2008). Short-term variation of phytoplankton assemblages in Mediterranean coastal waters recorded with an automated submerged flow cytometer. J. Plankton Res. 30, 1027–1040. doi: 10.1093/plankt/fbn054
Ward, B. A., and Follows, M. J. (2016). Marine mixotrophy increases trophic transfer efficiency, mean organism size, and vertical carbon flux. Proc. Natl. Acad. Sci. U.S.A. 113, 2958–2963. doi: 10.1073/pnas.1517118113
Zeldis, J., Robinson, K., Ross, A., and Hayden, B. (2004). First observations of predation by New Zealand Greenshell mussels (Perna canaliculus) on zooplankton. J. Exp. Mar. Bio. Ecol. 311, 287–299. doi: 10.1016/j.jembe.2004.05.019
Keywords: phytoplankton community, ciliates, grazing rates, mixotrophy, trophic strategies
Citation: Haraguchi L, Jakobsen HH, Lundholm N and Carstensen J (2018) Phytoplankton Community Dynamic: A Driver for Ciliate Trophic Strategies. Front. Mar. Sci. 5:272. doi: 10.3389/fmars.2018.00272
Received: 27 April 2018; Accepted: 18 July 2018;
Published: 07 August 2018.
Edited by:
Riina Klais, University of Tartu, EstoniaReviewed by:
Urania Christaki, Université du Littoral Côte d'Opale, FranceSai Elangovan S, National Institute of Oceanography (CSIR), India
Copyright © 2018 Haraguchi, Jakobsen, Lundholm and Carstensen. This is an open-access article distributed under the terms of the Creative Commons Attribution License (CC BY). The use, distribution or reproduction in other forums is permitted, provided the original author(s) and the copyright owner(s) are credited and that the original publication in this journal is cited, in accordance with accepted academic practice. No use, distribution or reproduction is permitted which does not comply with these terms.
*Correspondence: Lumi Haraguchi, bHVoQGJpb3MuYXUuZGs=