- 1German Centre for Marine Biodiversity Research (DZMB), Senckenberg Research Institute, Wilhelmshaven, Germany
- 2Marine Biodiversity Research, Institute for Biology and Environmental Sciences, Carl von Ossietzky University Oldenburg, Oldenburg, Germany
Recently, MALDI-TOF mass spectrometry has been used to reliably identify taxonomically difficult harpacticoid copepods from sediment samples. In agreement with former studies, a negative impact of short storage periods was stated. Other studies reported inferior mass spectra quality from samples fixated in varying ethanol concentrations. Therefore, sediment samples from a mudflat sampling site in the North Sea were stored under different temperature conditions to explore possible storage effects. Samples were fixated with either 70 or 100% ethanol and specimens were measured using MALDI-TOF mass spectrometry after 1, 2, 3, 5, 7, and 12 weeks. The changes in number of peaks per species and the ability to identify specimens based on mass spectra were analyzed quality measurements. We show that storage temperature had a major impact on data quality, as for some species a loss of up to 50% of mass peaks and an increase of failed measurements to over 70% was observed. However, the effect of different ethanol concentrations on data quality was negligible. Concluding from these results, storage of metazoan samples in general and, particularly, of sediment samples at low temperatures of around −25°C is recommended to receive high-quality mass spectra for specimen identification.
Introduction
Due to their small size, enormous abundances, and high diversity (Coull et al., 1977), species identification of harpacticoid copepods is very difficult and time-consuming. Nonetheless, assessing species compositions for certain areas in ecological studies (e.g., Gollner et al., 2010; George et al., 2014; Plum et al., 2015; Schmidt and Martínez Arbizu, 2015) is very important and identifications are still mostly carried out by morphology only. Most studies do not focus only on single sampling sites but on various sites with several sample replicates. Thus, they demand the identification of several 1,000 specimens and a rapid and reliable, yet cost-efficient, species identification method would be a great advantage for meiofaunal research.
Over the last decades, DNA barcoding, using a fragment of cytochrome c oxidase subunit I (COI) was introduced (Hebert et al., 2003a,b) and found wide application for specimen identification. Large public data repositories were established and deposited data was used in different studies from all over the world (e.g., Kress et al., 2015). Hence, COI-barcoding has become one of the most important methods for species identification. However, it requires several processing steps and taxa-specific primers for DNA amplification, resulting in high costs between 5 and 15 Euro per specimen. Furthermore, COI-barcoding is relatively time-consuming with several days to weeks from DNA extraction to a final identification.
Because of high costs per specimen, studies using specimen-by-specimen barcoding remain an exception in meiofauna biodiversity assemblies. If applied, often only voucher specimens of morphospecies are analyzed (e.g., Avó et al., 2017). In fact, identification of only voucher specimens by barcoding may largely underestimate true diversity. Tang et al. (2012) for instance, showed molecular markers like COI reveal higher diversity than assessed by morphology. This is also emphasized by findings of Fontaneto et al. (2009), describing extreme cryptic diversity in microscopic rotifers, indicating the need to identify all assessed specimens.
Metabarcoding is a cheap alternative to COI-barcoding and has become of increasing interest and use in biodiversity research (e.g., Taberlet et al., 2012; Yu et al., 2012; Leray and Knowlton, 2015). Samples are analyzed sample wise and several can be processed and sequenced simultaneously. Furthermore, it benefits from data provided in public repositories by former barcoding studies. However, metabarcoding, yet, only produces qualitative data, while for many questions, quantitative data is desirable.
Matrix-assisted laser desorption/ionization time-of-flight mass spectrometry (MALDI-TOF MS), on the other hand, provides a reliable and fast alternative for specimen-by-specimen identification. Based on a so-called proteome fingerprint, this technique is commonly used in species identification for fungi (e.g., Chalupová et al., 2014), viruses (e.g., La Scola et al., 2010), and bacteria (e.g., Singhal et al., 2015). For several groups of metazoans like insects (Feltens et al., 2010; Kaufmann et al., 2011b), fish (Volta et al., 2012), or calanoid copepods (Riccardi et al., 2012; Laakmann et al., 2013), pilot studies showed the successful use of this method. Furthermore, Bode et al. (2017) and Kaufmann et al. (2011a) already demonstrated its usability in field studies. Advantages of this technique are species-level identifications on the day of measurement and the low expenses of < 50 €-cent per sample. Hence, it allows comprehensive specimen-by-specimen identifications for entire studies with several 100 specimens.
Recently, the first study confirming the successful application of MALDI-TOF for species identifications of tiny harpacticoid copepods from sediment samples was carried out (Rossel and Martínez Arbizu, 2018). However, alongside former studies on Metazoa (Karger et al., 2012; Dieme et al., 2014; Yssouf et al., 2014; Mathis et al., 2015), authors reported a possible impact of short storage periods at room temperature, as the number of peaks between groups from different fixation methods differed strongly. Furthermore, Dvorak et al. (2014) suggested an effect of different ethanol concentrations on resulting mass spectra quality.
To investigate the impact of fixation and storage on protein mass spectra, we carried out the hitherto largest MALDI-TOF MS study on metazoans. Within a period of 3 months, over 2,000 specimens of 10 different copepod species from sediment samples were analyzed, in order to answer the following questions: (A) Does the storage temperature of sediment samples have an impact on the number of peaks? (B) Do different ethanol concentrations have an influence on mass spectra quality?
Materials and Methods
Sampling, Sample Storage, and Processing
Mudflat sediment samples were taken from the littoral on 18th July 2016 by bucket at N53°30′32.76″ and E8°7′26.687″, in proximity to the processing site at the laboratory, preventing any impact of transport or some hours of uncontrolled storage. Fresh material was measured prior to and after centrifugation to confirm the widely used extraction by density-gravity-centrifugation (McIntyre and Warwick, 1984) had no impact on spectra quality.
Samples for analyses were stored in kautex jars filled with 50% sediments and 50% ethanol. To eliminate residual water content, ethanol was exchanged with fresh ethanol at the correspondent concentration after 24 h storage under respective conditions (−25°C or RT).
To evaluate a possible storage effect, three different storage approaches were tested: (i) Fixation with 70% ethanol and storage for up to 12 weeks at room temperature (RT) (ii) Fixation with 70% ethanol and storage for up to 12 weeks at −25°C and (iii) Fixation with absolute ethanol and storage for up to 12 weeks at −25°C.
For all treatments, six samples per approach were stored and one sample measured respectively after 1, 2, 3, 5, 7, and 12 weeks. In the respective weeks, samples were sieved through a 40 μm sieve and density-gravity-centrifuged. All samples were sorted on ice.
Species Selection
The most abundant species from the samples were used for analyses. These were: Microarthridion fallax (Perkins, 1956), Microarthridion littorale (Poppe, 1881), Enhydrosoma propinquum (Brady, 1880), and Harpacticus flexus (Brady and Robertson, 1873), which were easily identifiable at the dissecting microscope for the library. Specimens from the family Ectinosomatidae were chosen randomly and species delimitation was supported using DNA barcoding.
Species Excluded From Examination
Ectinosomatidae spec. 2–6 and H. flexus were excluded from further examination of recorded peak numbers because too few specimens for statistical relevant analyses were measured. Data and figures on these species can be accessed in the supplementary Material (Supplementary Figures 1, 2; Supplementary Table 1).
Specimen Processing For MALDI-TOF MS
Individual specimens were sorted and separated into 1.5 ml Eppendorf microcentrifuge tubes with up to 0.5 μl ethanol. Before preparation, ethanol was evaporated at room temperature and evaporation checked for each specimen at a dissecting microscope. Individuals were incubated in 4 μl matrix solution, containing α-Cyano-4-hydroxycinnamic acid (HCCA) as a saturated solution in 50% acetonitrile, 47.5% LC-MS grade water, and 2.5% trifluoroacetic acid. After 5 min the solution was applied to a spot on a target plate. Up to 24 specimens were prepared simultaneously.
Protein mass spectra were measured from 2 to 20k Dalton on a Microflex LT/SH System (Bruker Daltonics) using method MBTAutoX 50-60. Mass peak range between 2 and 10k Dalton was analyzed using a centroid peak detection algorithm, a signal to noise threshold of 2 and a minimum intensity threshold of 600, with a peak resolution higher than 400 for mass spectra evaluation. Proteins/Oligonucleotide method was employed for fuzzy control with a maximal resolution 10 times above the threshold. For a sum spectrum, 240 satisfactory shots were summed up.
DNA Barcoding of Selected Species
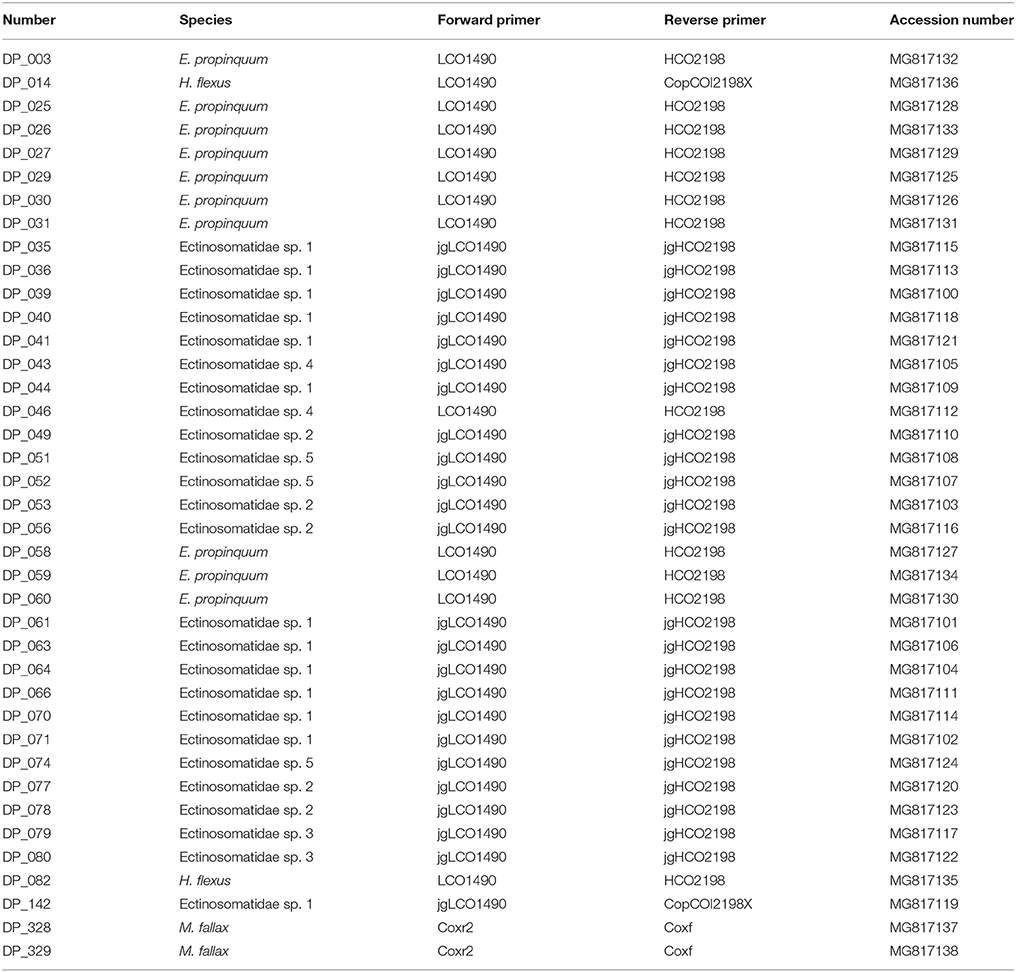
In order to support species identification of selected species (Table 1), we amplified a COI gene fragment using a selection of primers (Table 2) and obtained mass spectra from the same individual specimens. Only a potential nuclear mitochondrial pseudogene was amplified for M. littorale. The species was therefore not included in further genetic analyses. No specimen of Ectinosomatidae spec. 6 for DNA extraction was available.
After morphological identification, animals were cut into prosome and urosome body portions. The prosome of a single specimen was incubated in 2 μl HCCA and further processed for MALDI-TOF MS as stated above. The remaining urosome was used for DNA extraction in 20 μl of InstaGene matrix (Bio-Rad Laboratories, Munich, Germany) in a vapo.protect Mastercycler pro S (Eppendorf, Hamburg, Germany). Cycler settings were 56°C for 50 min and 96°C for 10 min.
Mitochondrial COI fragments were amplified using a vapo.protect Mastercycler pro S using AccuStart II PCR ToughMix (QuantaBio, Beverly, Massachusetts, USA). The amount of employed DNA ranged between 2 and 5 μl in a reaction amount of 20 μl containing 10 μl AccuStart II PCR ToughMix and 0.2 μl of primers (20 pmol/μl). It was filled up to the final reaction volume with molecular grade water. Cycler settings for amplification were the following: an initial step at 94°C for 5 min, a denaturation step at 94°C for 45 s, annealing at 45°C for 75 s, and elongation at 72°C for 75 s. After 40 repeats of the latter three steps, final elongation was carried out for 4 min at 72°C.
Negative control samples were used in all amplification runs. Of the PCR product, 2 μl were used to verify size conformity by electrophoresis in a 1% agarose gel stained with GelRED™ using commercial DNA size standards.
PCR products were purified and sequenced at a contract sequencing facility (Macrogen Europe, Amsterdam, Netherlands). Resulting trace files were assembled with SeqTrace (Stucky, 2012) and aligned using SeaView (Gouy et al., 2010). Sequences were checked for the amplification of the correct gene fragment by Blast search (Morgulis et al., 2008, Zhang et al., 2000). A neighbor-joining analysis was carried out in Seaview using Jukes-Cantor distances (Jukes and Canthor, 1969) (JC69).
Based on DNA sequences, species were delimitated using Automatic Barcode Gap Discovery (ABGD) online application (Puillandre et al., 2012) with JC69 distance measure, Pmin = 0.001, Pmax = 0.1, 10 steps, a relative gap width of 1.5 and 20 Nb of bins.
Data Processing
Mass spectrometry data was processed in R (version 3.2.3, R Development Core Team, 2008) using packages “MALDIquant” (Gibb and Strimmer, 2012) and “MALDIquantForeign” (Gibb, 2015). Protein mass spectra were trimmed to an identical range from 3,000 to 15,000 m/z and smoothed with the Savitzky-Golay method (Savitzky and Golay, 1964). The baseline was removed based on SNIP baseline estimation method (Ryan et al., 1988) and spectra were normalized using the TIC method implemented in MALDIquant. Noise estimation was carried out using a signal to noise ratio (SNR) of 6. Peaks were repeatedly binned using “binpeaks” from MALDIquant with a tolerance of 0.002, in a strict approach. The number of peaks for the whole data set was reduced from over 12,000 peaks to 1,221 peaks. The resulting intensity matrix was Hellinger transformed (e.g., Legendre and Gallagher, 2001) for further analyses.
A hierarchical cluster analysis with Ward's D clustering algorithm (Ward, 1963), Euclidean distances and 1,000 bootstrap repeats was carried out for some specimens that were measured by MALDI-TOF MS exclusively, with specimens for which molecular and proteomic data were evaluated simultaneously.
Random Forest Analyses
Several Random Forest (RF) (Breiman, 2001) analyses were carried out to optimize the model for specimen classifications. The main settings for all analyses were 2,000 generated trees with 35 used variables at every tree split. To avoid overestimation of specimen-rich species, the model was adjusted to the number of specimens available for the most infrequent species.
Random Forest analyses were carried out cumulatively: A model was calculated for fresh samples and checked for morphologically misidentified specimens, using the post-hoc test based on RF probabilities of assignment (POA) described by Rossel and Martínez Arbizu (2018). The function rf.post.hoc is available from package RFtools at https://github.com/pmartinezarbizu/RFtools (doi: 10.5281/zenodo.1188436). While authors used only the 5% quantile as a boundary for correct classification of artificially generated specimens, we additionally tested the 1% quantile. Specimens with a POA within the 95%/99% quantile of the empirical beta distribution in the model were considered true positive (tp; correct) classifications. Specimens were considered incorrectly classified when their POA either fell within the 5%/1% quantile (fp; false positive) or below it (tn; true negatives).
Putative misidentified specimens were checked at the light microscope, false annotations were corrected and unintentionally contained species discarded.
Specimens from week 1 of the refrigerated sample series were classified by RF using the corrected model. Correctly identified specimens were kept and added to the data set for generating a new model to predict species for the specimens from week 2 of the refrigerated samples. This procedure was carried out respectively for chilled samples from weeks 3, 5, 7, and 12.
The final model, containing 1,639 correctly classified specimens, was used for species prediction for specimens stored at room temperature. For the classified specimens, the post-hoc test was carried out. Incorrectly classified specimens were separated from the data and recorded as misidentified. In a tsne plot (Maaten and Hinton, 2008), calculated using R package “tsne” (Donaldson, 2016), correctly classified specimens were visualized based on the RF POA.
Measures of Data Quality
Former studies implied that poorly stored samples showed fewer peaks on average. Figure 1 depicts the impact of 3 months of storage at room temperature on the mass spectrum of an adult Enhydrosoma propinquum (SRM_2486) compared to a specimen (SRM_445) measured directly after sampling. The signal intensity of the freshly measured spectrum (108 recorded masses) is 10 times higher than from the stored specimen (25 recorded masses) and shows more distinct mass peaks. While RF was still able to classify the specimen correctly, the post-hoc rejected the classification.
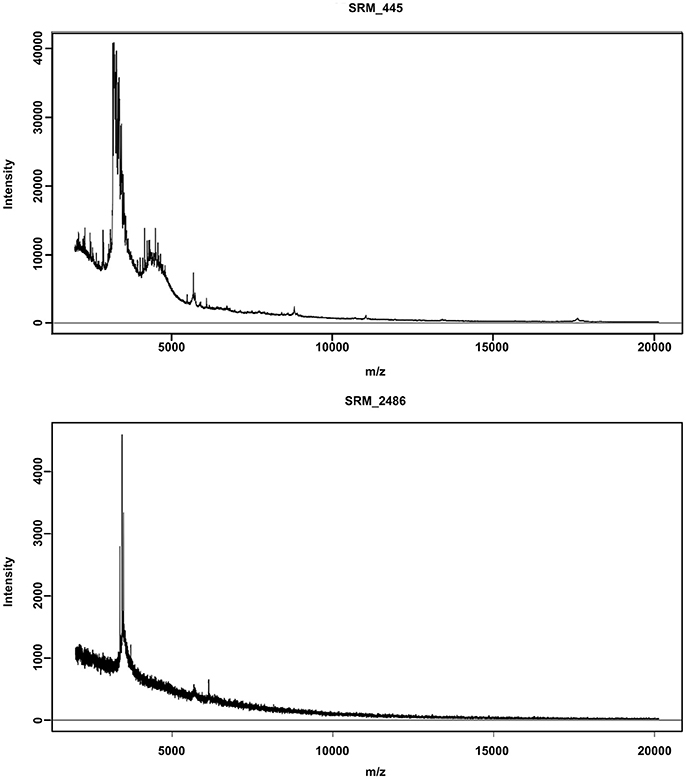
Figure 1. Differences in spectra quality. Both spectra show a protein fingerprint of an adult Enhydrosoma propinquum specimen. The upper graph depicts a high-quality spectrum of a fresh specimen (measured immediately after taking the samples) while the lower graph shows the spectrum of a specimen from a sediment sample stored for 12 weeks in 70% ethanol at room temperature. The difference in signal quality resulted in a massive loss in recorded peaks and also prevented the correct classification by Random Forest after application of the post-hoc test.
Consequently, as quality measures for protein mass spectra (a) the average number of peaks per species and (b) the number of unidentifiable specimens per species after applying the post-hoc test on RF classifications, were used.
Data Analysis
To test the influence by different ethanol concentrations, pairwise U-tests (Mann and Whitney, 1947) were carried out on recorded number of protein masses for respective species and sampling times between time series stored at −25°C. Effect of temperature was tested using pairwise U-tests between data from respective species fixated in 70% ethanol at different temperatures.
Mann-Kendall (MK) test (Kendall, 1975), implemented in the R-package “Kendall” (McLeod, 2011), was used on median peaks per species and storage approach, to find a storage influence over time. A significant result of MK would prove a constant change over time with a slope deviating from 0, which is assumed for no change over time. In that case, regressions were calculated and analyzed using Theil–Sen estimator (TS) (Theil, 1950; Sen, 1968), implemented in the R-package “trend” (Pohlert, 2018).
Missing data for the times in between the measurements would lead to incorrectly steeper slopes. To account for this in MK and TS analyzes, data for weeks 4, 6, and 8 to 11 was imputed by Kalman Smoothing (Kalman, 1960), using StructTS model from the R-package “imputeTS” (Moritz and Bartz-Beielstein, 2015).
Results
MALDI-TOF MS Measurements
In total 2,424 attempts to measure specimens using MALDI-TOF MS were carried out, of which 108 (4.45%) failed to provide a resulting mass spectrum. Of the successful attempts (n = 2,316), 2,204 (95.16%) were correctly classified by RF, approved by the post-test and visualized in a tsne plot (Figure 2). Further 39 (1.68%) specimens were used for simultaneous MALDI-TOF MS analysis and amplification of the COI barcode fragment. However, 73 (3.15%) were misclassified or classifications were rejected by the post-test.
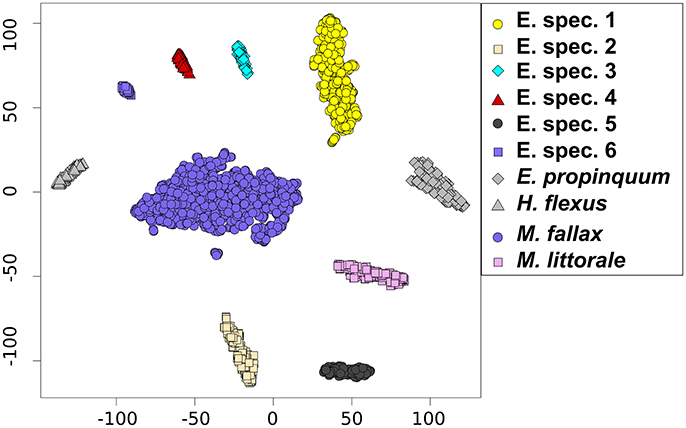
Figure 2. TSNE plot depicting the species clusters based on the votes from the Random Forest model, containing all correctly classified specimens.
Pre-test: Influence of Density-Gravity-Centrifugation
We tested 105 specimens prior to density-gravity-centrifugation and found an average of 110.93 peaks per specimen. The measurement of 95 specimens after centrifugation resulted in 110.66 peaks on average. A RF model based on these 200 specimens resulted in a class error of 0 for all species.
Comparison of these two data sets by U-test revealed no significant difference (W = 4963.5, p = 0.9541). Only for M. fallax, a weakly significant difference was found comparing uncentrifuged specimens to specimens after centrifugation (W = 590.5, p = 0.0208) (Figure 3). However, there was no influence on the ability to correctly identify the specimens using RF.
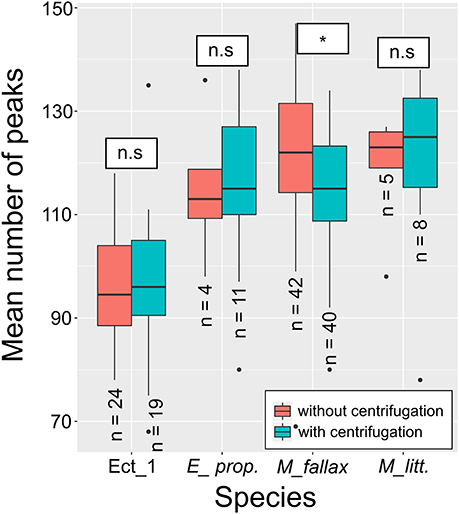
Figure 3. Results of the pre-test for effect of centrifugation on resulting MALDI-TOF MS data. Asterisks indicate a significant difference between average mass peaks of uncentrifuged and centrifuged specimens. M. fallax was the only species found to show a significant difference.
A) Impact of Storage Temperature
In Figure 4, the number of peaks over time for the four species discussed in more detail is depicted. U-tests were carried out for species from refrigerated samples preserved in 70% ethanol (green, n = 713) and samples stored at RT. Because the 1% threshold approach of the post-test was less stringent, it showed a better specimen coverage (blue, n = 564) compared to the 5% threshold (purple, n = 413) for all weeks and was used for comparison of storage temperatures.
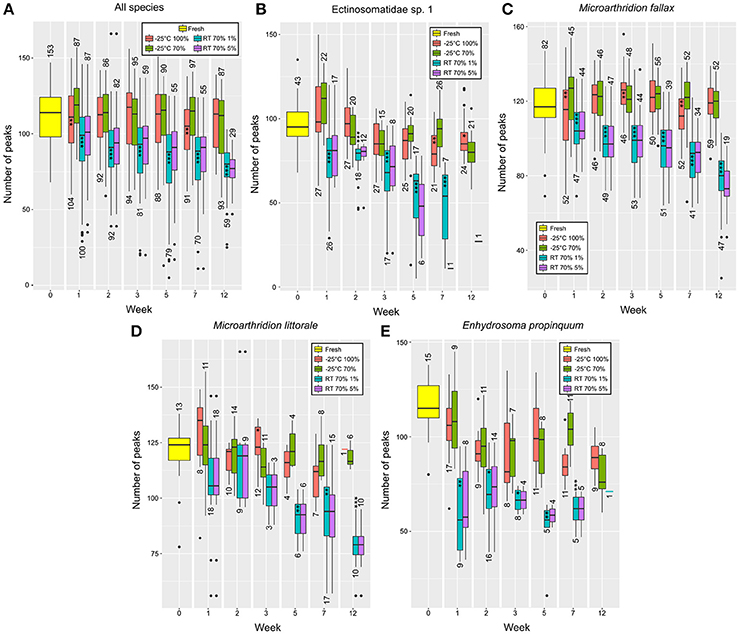
Figure 4. Number of average peaks per species and treatment measured weekly. For specimens from (A) all species; (B) Ectinosomatidae sp. 1; (C) M. fallax; (D) M. littorale; (E) E. propinquum. Depicted above/underneath the boxes is the number of specimens successfully measured. Asterisks indicate significant differences to the treatment stored at −25°C in 70% ethanol. *P < 0.05, **P < 0.01, ***P < 0.001.
U-tests for the combined species data sets (Figure 4A), Ectinosomatidae spec. 1 (Figure 4B) and Microarthridion fallax (Figure 4C) showed highly significant differences (p < 0.001) for all weeks. With fewer specimens per week, for M. littorale (Figure 4D) and E. propinquum (Figure 4E), still, significant differences were found between compared storage temperatures for most of the weeks.
Measurements of all species from refrigerated samples were successful. In contrast to this, the number of failed measurements from samples stored at RT increased with storage time (Figure 5, red line). With 3.62% failed measurements in week 1, the number of unsuccessful approaches for the combined species data set increased to 33.90% (n = 40) in week 12 (Figure 5A). After 3 months of storage, 68% (n = 34) of the attempted measurements for ectinosomatid specimens failed (Figure 5B). For E. propinquum only 25% (n = 2) of the measurements were successful (Figure 5C). However, for M. fallax (Figure 5D) and M. littorale (data not shown), no fails were recorded.
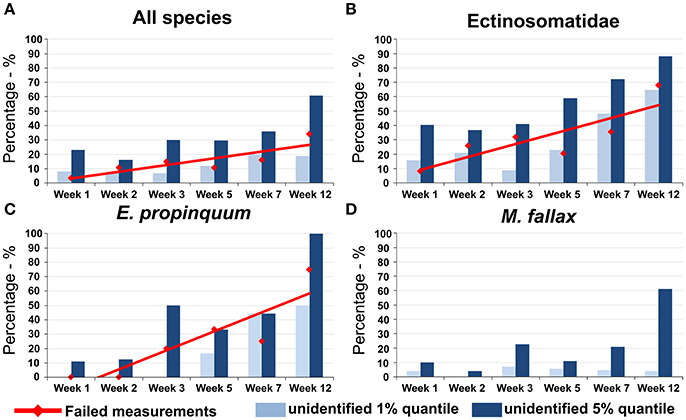
Figure 5. Number of failed measurements (red line) and unidentifiable specimens under the 1% quantile (light blue) and the 5% quantile (dark blue) of recorded for specimens of (A) all species together (B) the family Ectinosomatidae (C) the species E. propinquum (D) the species M. fallax. While for M. fallax all measurements were successful and the number of not identifiable specimens was comparably low, for Ectinosomatidae and E. propinquum up to 100% of specimens were unidentifiable after 12 weeks of storage at room temperature.
Percentage of unidentifiable specimens increased with storage time at RT (Figure 5A). Of successfully measured E. propinquum, only 50% (n = 1) were reliably identified after 3 months using the 1% threshold in the post-test. In Ectinosomatidae, for 11 (68.75%) specimens, spectra were insufficient for identifications.
Success rate decreased using the stricter 5% threshold. Classifications for all E. propinquum specimens and over 90% (n = 15) of measured Ectinosomatidae were rejected by the post-test (Figures 5B,C).
The number of unidentifiable specimens was comparably lower for the other species. In weeks 7 and 12, respectively, classifications for one specimen of M. littorale were rejected by the post-test. Only a few incorrect RF classifications across all weeks were discovered for M. fallax using the 1% threshold. However, less than 40% of RF classifications were approved by the post-test using the 5% threshold (Figure 5D).
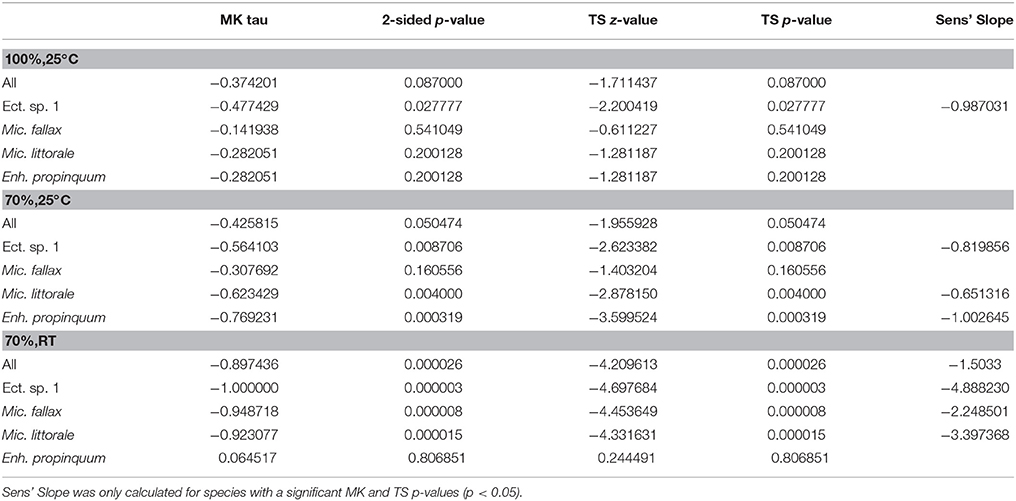
MK analysis found no significant deviation from zero for the combined species data set from refrigerated samples but supported an adverse effect of RT storage. The combined species data set from RT storage showed a highly significant p-value with a negative slope estimated of −1.50 (Table 3). Significant p-values and steep slopes, ranging from −4.89 to −2.25 (Table 3), were found for all species, except for E. propinquum.
However, significant MK p-values were also detected for Ectinosomatidae spec. 1, M. littorale and E. propinquum from refrigerated samples. Nevertheless, these showed distinctly flatter slopes estimated, ranging from −1.00 to −0.65 (Table 3).
B) Effect of Different Ethanol Concentrations
From samples preserved in 100% ethanol (red), 727 specimens were compared with 713 specimens from 70% ethanol samples (green), to test an effect of different ethanol concentrations for fixation.
Differences were never as highly significant as found for the different storage temperatures and only detected for few comparisons. M. fallax (Figure 4C) in weeks 1, 3, and 7, Ectinosomatidae spec. 1 in week 7 (Figure 4B) and combined species data sets in week 1 and 7 showed significant differences with p < 0.01. More weakly significances (p < 0.5) were found for Ectinosomatidae spec. 1 in week 12 and M. littorale in week 3 (Figure 4D). No further significant differences were detected.
The MK test showed no significant deviation from zero for data from specimens preserved in 100% ethanol, except for Ectinosomatidae spec. 1 (Table 3). From 70% ethanol samples, negative slopes were found for Ectinosomatidae spec. 1, M. littorale and E. propinquum. However, this was not the case for all species combined (Table 3). In general, slopes estimated for data from cooled samples were rather flat, barely exceeding −1.00.
Congruence of DNA and MALDI-TOF MS Data
All mass spectra of specimens with simultaneous COI fragment amplification were correctly classified by RF and identifications were supported by the post-hoc test. In an additional cluster analysis, these specimens grouped into distinct clusters with fresh specimens and specimens from samples stored at RT or −25°C for 3 months (Figure 5). Species' clusters based on mass spectra (Figure 6) were conforming to the species' clusters of the neighbor-joining and ABGD approaches based on molecular data (Figure 7).
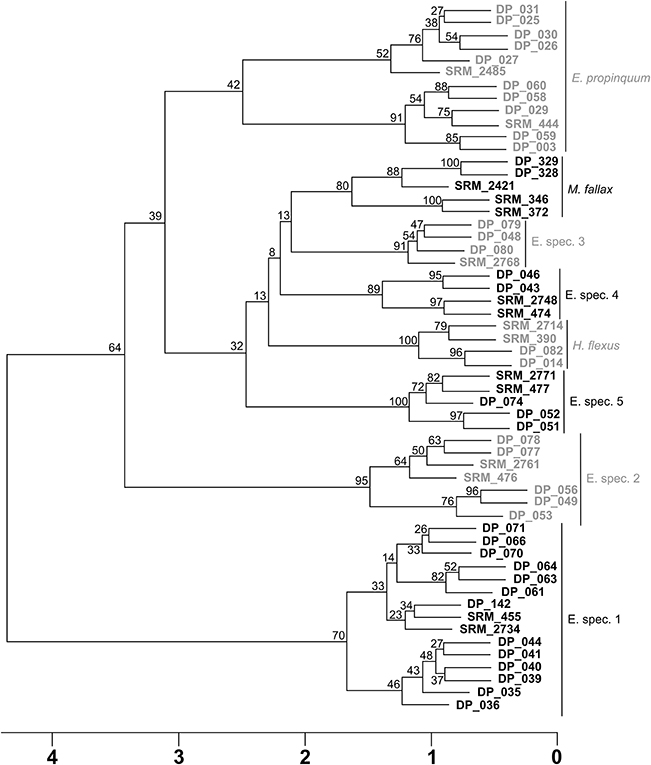
Figure 6. Cluster analysis based on mass spectra data, showing the DNA extracted specimens in concordance with the MALDI-TOF exclusive measurements. This illustrates that species in this study supported by DNA, are also recognizable species by the protein fingerprint.
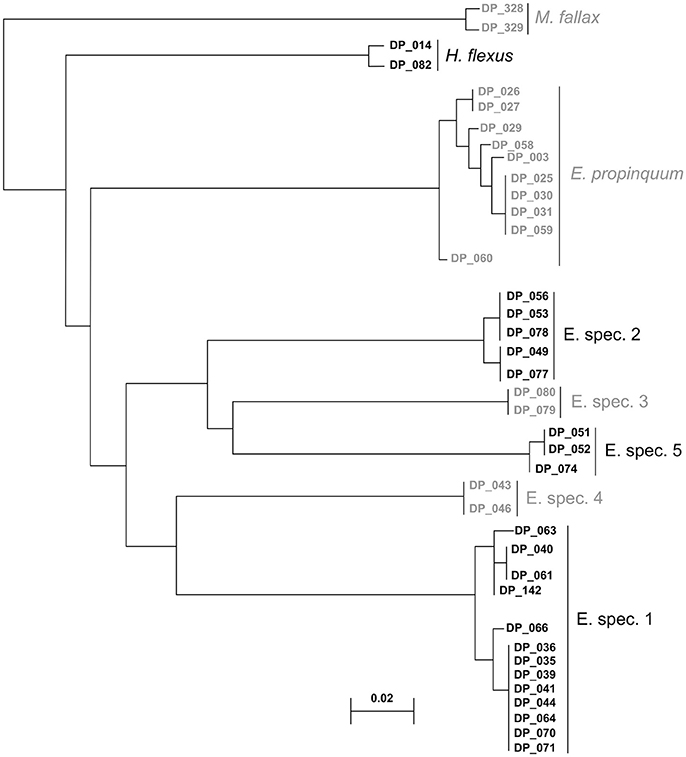
Figure 7. Neighbor-joining tree of 39 DNA sequences from eight different species, as recognized by ABGD, which were resolved accordingly with MALDI-TOF MS.
Discussion
Pre-test: Influence of Density-Gravity-Centrifugation
Regarding all species, no general effect of centrifugation was observed. Some species gained peaks on average and others showed a loss of recorded protein masses after centrifugation. Significantly different numbers of peaks measured prior to and after centrifugation were only found for M. fallax.
We assume these small differences in the number of peaks were due to natural variation between individuals. This is supported by a non-significant U-test (W = 10362, p = 0.29) for uncentrifuged specimens of M. fallax (n = 42, avg. peaks: 121.10) compared to all M. fallax from refrigerated samples. These were centrifuged as well and showed no decrease in MK analyses (n = 547, avg. peaks: 119.25). Furthermore, the significant difference for M. fallax was without effect on the ability to identify specimens using RF classifier. In addition, no failed measurements were recorded, which would have implied a severe negative effect of centrifugation. Therefore, an effect of density-gravity-centrifugation was not supported.
A) Impact of Storage Temperature
U-tests showed significant differences for almost all comparisons of the examined species and the combined species data sets. Hence, storage temperature had a major impact on data quality for sediment fixated samples. This is also supported by the increasing number of failed measurements found especially for ectinosomatid species and E. propinquum. Besides, the decrease in mass spectra quality also resulted in an increasing number of RF classifications rejected by the post-test.
MK results showed a stronger decline of median peaks for all RT stored species compared to refrigerated samples, implying an increasing influence of storage temperature over time. The positive estimated slope for E. propinquum was caused by a slight increase of measured peaks in week 7, resulting in increasing values estimated by “imputeTS.” Because the number of failed measurements strongly increased at the same time, this does not contradict the results for other species but is rather a relic of data imputation.
In biting midges (Diptera), Kaufmann et al. (2011b) reported a decrease in number of recorded masses after 2 h of storage at room temperature. However, even after 102 days, successful species identification was still possible. Studies on calanoid copepods by Laakmann et al. (2013) and Bode et al. (2017) employing MALDI-TOF MS even showed successful species identification of specimens stored at room temperature between a few months and up to 8 years. Nevertheless, authors did not state differences in mass spectra quality at all. Hence, it is unclear if storage had an adverse effect on measured peaks that was not mentioned.
As stated before, a negative effect of storage at room temperature was also observed by Kaufmann et al. (2011a), Dieme et al. (2014) and Yssouf et al. (2014), which, in concordance with our results, shows the demand for proper sample storage at low temperatures to receive high-quality mass spectra.
Based on their research on the thermodynamics of protein denaturation, Brandts and Hunt (1967) stated, above RT ethanol acts as a “rather strong denaturing agent,” while at temperatures below 10°C, it acts “as a rather strong stabilizing agent.” Our data supports this with generally high-quality mass spectra from chilled samples. In contrast, RT storage resulted in a severe mass spectra quality decrease and an increase of failed measurements after short storage periods.
However, Kaufmann et al. (2011a) reported a loss of signal from samples, which were stored in 70% ethanol at 4°C for over 2 years. This implies, even cool storage cannot prevent degeneration over time completely. Although samples were still measurable and identifiable, a negative trend was detectable, emphasizing the demand for even lower temperatures for sample storage.
B) Effect of Different Ethanol Concentrations
A general adverse effect by ethanol concentration was not supported by our results. Only some species showed significant differences in measured peak numbers. These were not found in all weeks but were scattered across the different time series. MK analyses supported this without significant p-values for combined species data sets and M. fallax, which had the best specimen coverage for all weeks. However, species with significant deviations from zero showed distinctly flatter slopes of only up to −1. Compared to slopes from RT samples, this is almost negligible.
A negative effect caused by higher concentrations of ethanol as reported by Dvorak et al. (2014) could not be confirmed since our chilled treatments showed very similar results. After 3 months of storage, no striking differences in peak intensity or peak resolution were found. In this context, Dvorak et al. (2014) mentioned an influence of higher ethanol concentrations on co-crystallization of the matrix because of a higher content of organic solvent. This might also have resulted from an incomplete evaporation of ethanol from the samples, rather than from the absolute ethanol content.
Congruence of DNA and MALDI-TOF MS data
Providing data on the congruence of molecular determinations and MALDI-TOF MS identifications is very important. Nevertheless, only a few studies support their MALDI-TOF MS specimen identifications using genetic markers additionally to morphological examinations (e.g., Müller et al., 2013; Steinmann et al., 2013; Mathis et al., 2015; Bode et al., 2017). Our results show species identification using MALDI-TOF MS is congruent with morphological identifications and molecular species delimitation based on COI barcode fragment. This supports the discriminative power of this technique for identification of metazoan species.
Conclusion
Storage of Sediment Samples for MALDI-TOF MS Analyses
In concordance with findings of other studies, our results emphasize the importance of low-temperature storage around −25°C to receive high-quality mass spectra.
Although we found only minor differences for samples preserved in 70 and 100% ethanol, we recommend using absolute ethanol for fixation of sediment samples. Residual water content may dilute the added fixative and prevent fixation of proteins by dehydration. For the same reason, we recommend fast extraction of specimens from sediment samples.
Classification Using Random Forest and the Post-hoc Test
Random forest in combination with the post-hoc test worked excellent on the classification of unknown, partly degenerated data. Because exuviae of measured specimens were retained, morphological re-examination of specimens was still possible. Thus, we were able to review if rejected classifications were morphologically misidentified, or excluded by a too stringent test.
The 1% quantile of the post-test rejected less morphologically correct classifications than the 5% threshold. Therefore, we found the 1% threshold more useful to discover misclassifications by RF. However, erroneously rejected classifications must be accepted to retain a high likelihood of recognizing false positives, which are likely to remain undiscovered in approaches like hierarchical clustering (Collins and Cruickshank, 2013).
Data Sets Are in a Publicly Accessible Repository
The MALDI-TOF MS data set analyzed for this study can be found in Dryad digital repository (10.5061/dryad.1md2jq1). The COI Sequences can be found in BOLD in the project Time Series MALDI-TOF MS Harpacticoida (code: TSMH) and uploaded to GenBank.
Author Contributions
SR and PM: designed the study; SR: carried out sampling, measurements, and analyses of the data. Both authors contributed to the writing of the manuscript.
Funding
SR was supported by a grant of Graduate School IBR from the Ministry for Science and Culture of Lower Saxony (IBR B7).
Conflict of Interest Statement
The authors declare that the research was conducted in the absence of any commercial or financial relationships that could be construed as a potential conflict of interest.
The reviewer JL and handling Editor declared their shared affiliation.
Acknowledgments
This is publication no 5 of Senckenberg am Meer Proteome Laboratory and publication no 55 of Senckenberg am Meer Metabarcoding and Molecular Laboratory. We would like to thank C. Schmidt, K. Uhlenkott, B. Ucket, and the reviewers for helpful comments on the manuscript.
Supplementary Material
The Supplementary Material for this article can be found online at: https://www.frontiersin.org/articles/10.3389/fmars.2018.00149/full#supplementary-material
References
Avó, A. P., Daniell, T. J., Neilson, R., Oliveira, S., Branco, J., and Adão, H. (2017). DNA barcoding and morphological identification of benthic nematodes assemblages of estuarine intertidal sediments: advances in molecular tools for biodiversity assessment. Front. Mar. Sci. 4:66. doi: 10.3389/fmars.2017.00066
Bode, M., Laakmann, S., Kaiser, P., Hagen, W., Auel, H., and Cornils, A. (2017). Unravelling diversity of deep-sea copepods using integrated morphological and molecular techniques. J. Plankton Res. 39, 600–617. doi: 10.1093/plankt/fbx031
Brandts, J. F., and Hunt, L. (1967). Thermodynamics of protein denaturation. III. Denaturation of ribonuclease in water and in aqueous urea and aqueous ethanol mixtures. J. Am. Chem. Soc. 89, 4826–4838.
Chalupová, J., Raus, M., Sedlárová, M., and Šebela, M. (2014). Identification of fungal microorganisms by MALDI-TOF mass spectrometry. Biotechnol. Adv. 32, 230–241. doi: 10.1016/j.biotechadv.2013.11.002
Cheng, F., Wang, M., Sun, S., Li, C., and Zhang, Y. (2013). DNA barcoding of Antarctic marine zooplankton for species identification and recognition. Adv. Polar Sci. 24, 119–127. doi: 10.3724/SP.J.1085.2013.00119
Collins, R. A., and Cruickshank, R. H. (2013). The seven deadly sins of DNA barcoding. Mol. Ecol. Resour. 13, 969–975. doi: 10.1111/1755-0998.12046
Coull, B., Ellison, R., Fleeger, J., Higgins, R. P., Hope, W. D., Tietjen, J. H., et al. (1977). Quantitative estimates of the meiofauna from the deep sea off North Carolina, USA. Mar. Biol. 39, 233–240. doi: 10.1007/BF00390997
Dieme, C., Yssouf, A., Vega-Rúa, A., Berenger, J.-M., Failloux, A.-B., Raoult, D., Parola, P., et al. (2014). Accurate identification of Culicidae at aquatic developmental stages by MALDI-TOF MS profiling. Parasit. Vectors 7:544. doi: 10.1186/s13071-014-0544-0
Donaldson, J. (2016). tsne: T-Distributed Stochastic Neighbor Embedding for R (t-SNE). Available online at: https://CRAN.R-project.org/package=tsne
Dvorak, V., Halada, P., Hlavackova, K., Dokianakis, E., Antoniou, M., and Volf, P. (2014). Identification of phlebotomine sand flies (Diptera: Psychodidae) by matrix-assisted laser desorption/ionization time of flight mass spectrometry. Parasit. Vectors 7:21. doi: 10.1186/1756-3305-7-21
Feltens, R., Görner, R., Kalkhof, S., Gröger-Arndt, H., and von Bergen, M. (2010). Discrimination of different species from the genus Drosophila by intact protein profiling using matrix-assisted laser desorption ionization mass spectrometry. BMC Evol. Biol. 10:1. doi: 10.1186/1471-2148-10-95
Folmer, O., Black, M. B., Hoeh, W., Lutz, R., and Vrijenhoek, R. (1994). DNA primers for amplification of mitochondrial cytochrome c oxidase subunit I from diverse metazoan invertebrates. Mol. Mar. Biol. Biotechnol. 3, 294–299.
Fontaneto, D., Kaya, M., Herniou, E. A., and Barraclough, T. G. (2009). Extreme levels of hidden diversity in microscopic animals (Rotifera) revealed by DNA taxonomy. Mol. Phylogenet. Evol. 53, 182–189. doi: 10.1016/j.ympev.2009.04.011
Geller, J., Meyer, C., Parker, M., and Hawk, H. (2013). Redesign of PCR primers for mitochondrial cytochrome c oxidase subunit I for marine invertebrates and application in all-taxa biotic surveys. Mol. Ecol. Resour. 13, 851–861. doi: 10.1111/1755-0998.12138
George, K. H., Veit-Köhler, G., Martínez Arbizu, P., Seifried, S., Rose, A. H., et al. (2014). Community structure and species diversity of Harpacticoida (Crustacea: Copepoda) at two sites in the deep sea of the Angola Basin (Southeast Atlantic). Organ. Diver. Evol. 14, 57–73. doi: 10.1007/s13127-013-0154-2
Gibb, S. (2015). MALDIquantForeign: Import/Export Routines for MALDIquant. A package for R. Available onlne at: https://CRAN.R-project.org/package=MALDIquantForeign
Gibb, S., and Strimmer, K. (2012). MALDIquant: a versatile R package for the analysis of mass spectrometry data. Bioinformatics 28, 2270–2271. doi: 10.1093/bioinformatics/bts447
Gollner, S., Riemer, B., Martínez Arbizu, P., Le Bris, N., and Bright, M. (2010). Diversity of meiofauna from the 9 50′ N East Pacific Rise across a gradient of hydrothermal fluid emissions. PLoS ONE 5:e12321. doi: 10.1371/journal.pone.0012321
Gouy, M., Guindon, S., and Gascuel, O. (2010). SeaView version 4: a multiplatform graphical user interface for sequence alignment and phylogenetic tree building. Mol. Biol. Evol. 27, 221–224. doi: 10.1093/molbev/msp259
Hebert, P. D., Cywinska, A., Ball, S. L., and deWaard, J. R. (2003a). Biological identifications through DNA barcodes. Proc. R. Soc. Lond. B 270, 313–321. doi: 10.1098/rspb.2002.2218
Hebert, P. D., Ratnasingham, S., and deWaard, J. R. (2003b). Barcoding animal life: cytochrome c oxidase subunit 1 divergences among closely related species. Proc. Biol. Sci. 270 (Suppl. 1), S96–S99. doi: 10.1098/rsbl.2003.0025
Jukes, T., and Canthor, C. (1969). “Evolution of protein molecules,” in Mammalian Protein Metabolism, ed H. N. Munro, (New York, NY: Academic Press), 21–132.
Kalman, R. E. (1960). A new approach to linear filtering and prediction problems. J. Basic Eng. 82, 35–45. doi: 10.1115/1.3662552
Karger, A., Kampen, H., Bettin, B., Dautel, H., Ziller, M., Hoffmann, B., Süss, J., et al. (2012). Species determination and characterization of developmental stages of ticks by whole-animal matrix-assisted laser desorption/ionization mass spectrometry. Ticks Tick Borne Dis. 3, 78–89. doi: 10.1016/j.ttbdis.2011.11.002
Kaufmann, C., Schaffner, F., Ziegler, D., Pflueger, V., and Mathis, A. (2011a). Identification of field-caught Culicoides biting midges using matrix-assisted laser desorption/ionization time of flight mass spectrometry. Parasitology 139, 248–258. doi: 10.1017/S0031182011001764
Kaufmann, C., Ziegler, D., Schaffner, F., Carpenter, S., Pflüger, V., and Mathis, A. (2011b). Evaluation of matrix-assisted laser desorption/ionization time of flight mass spectrometry for characterization of Culicoides nubeculosus biting midges. Med. Vet. Entomol. 25, 32–38. doi: 10.1111/j.1365-2915.2010.00927.x
Kendall, M. (1975). Rank Correlation Methods, 4th Edition Vol, 8. San Francisco, CA: Charles Griffin Book Series.
Kress, W. J., Garcia-Robledo, C., Uriarte, M., and Erickson, D. L. (2015). DNA barcodes for ecology, evolution, and conservation. Trends Ecol. Evol. 30, 25–35. doi: 10.1016/j.tree.2014.10.008
Laakmann, S., Gerdts, G., Erler, R., Knebelsberger, T., Martínez Arbizu, P., and Raupach, M. J. (2013). Comparison of molecular species identification for North Sea calanoid copepods (Crustacea) using proteome fingerprints and DNA sequences. Mol. Ecol. Resour. 13, 862–876. doi: 10.1111/1755-0998.12139
La Scola, B., Campocasso, A., N'Dong, R., Fournous, G., Barassi, L., Flaudrops, C., et al. (2010). Tentative characterization of new environmental giant viruses by MALDI-TOF mass spectrometry. Intervirology 53, 344–353. doi: 10.1159/000312919
Legendre, P., and Gallagher, E. D. (2001). Ecologically meaningful transformations for ordination of species data. Oecologia 129, 271–280. doi: 10.1007/s004420100716
Leray, M., and Knowlton, N. (2015). DNA barcoding and metabarcoding of standardized samples reveal patterns of marine benthic diversity. Proc. Natl. Acad. Sci. U.S.A. 112, 2076–2081. doi: 10.1073/pnas.1424997112
Maaten, L. V. D., and Hinton, G. E. (2008). Visualizing data using t-SNE. J. Mach. Learn. Res. 9, 2579–2605. doi: 10.1007/s10479-011-0841-3
Mann, H. B., and Whitney, D. R. (1947). On a test of whether one of two random variables is stochastically larger than the other. Anna. Math. Stat. 18, 50–60. doi: 10.1214/aoms/1177730491
Mathis, A., Depaquit, J., Dvovrák, V., Tuten, H., Bañuls, A.-L., Halada, P., Zapata, S., et al. (2015). Identification of phlebotomine sand flies using one MALDI-TOF MS reference database and two mass spectrometer systems. Parasit. Vectors 8:266. doi: 10.1186/s13071-015-0878-2
McIntyre, A., and Warwick, R. (1984). “Meiofauna techniques,” in Methods for the Study of Marine Benthos, ed Eleftheriou (Oxford: Blackwell), 217–244.
McLeod, A. I. (2011). Kendall: Kendall rank correlation and Mann-Kendall trend test. R package version 2.2. Available online at: https://CRAN.R-project.org/package=Kendall
Morgulis, A., Coulouris, G., Raytselis, Y., Madden, T. L., Agarwala, R., and Schäffer, A. A. (2008). Database indexing for production MegaBLAST searches. Bioinformatics 24, 1757–1764. doi: 10.1093/bioinformatics/btn322
Moritz, S., and Bartz-Beielstein, T. (2015). Imputets: Time Series Missing Value Imputation. R package version 0.4.
Müller, P., Pflüger, V., Wittwer, M., Ziegler, D., Chandre, F., Simard, F., et al. (2013). Identification of cryptic Anopheles mosquito species by molecular protein profiling. PLoS ONE 8:e57486 doi: 10.1371/journal.pone.0057486
Plum, C., Gollner, S., Martínez Arbizu, P., and Bright, M. (2015). Diversity and composition of the copepod communities associated with megafauna around a cold seep in the Gulf of Mexico with remarks on species biogeography. Marine. Biodiversity. 45, 419–432. doi: 10.1007/s12526-014-0310-8
Pohlert, T. (2018). trend: Non-Parametric Trend Tests and Change-Point Detection. R package version 1.1.0. Available online at: https://CRAN.R-project.org/package=trend
Puillandre, N., Lambert, A., Brouillet, S., and Achaz, G. (2012). ABGD, Automatic Barcode Gap Discovery for primary species delimitation. Mol. Ecol. 21, 1864–1877. doi: 10.1111/j.1365-294X.2011.05239.x
Riccardi, N., Lucini, L., Benagli, C., Welker, M., Wicht, B., and Tonolla, M. (2012). Potential of matrix-assisted laser desorption/ionization time-of-flight mass spectrometry (MALDI-TOF MS) for the identification of freshwater zooplankton: a pilot study with three Eudiaptomus (Copepoda: Diaptomidae) species. J. Plankton Res. 34, 484–492. doi: 10.1093/plankt/fbs022
Rossel, S., and Martínez Arbizu, P. (2018). Automatic specimen identification of Harpacticoids (Crustacea:Copepoda) using Random Forest and MALDI-TOF mass spectra, including a post hoc test for false positive discovery. Methods. Ecol. Evol. doi: 10.1111/2041-210X.13000. [Epub ahead of print].
Ryan, C., Clayton, E., Griffin, W., Sie, S., and Cousens, D. (1988). SNIP, a statistics-sensitive background treatment for the quantitative analysis of PIXE spectra in geoscience applications. Nuclear Instrum. Methods Phys. Res. Sect. B 34, 396–402. doi: 10.1016/0168-583X(88)90063-8
Savitzky, A., and Golay, M. J. (1964). Smoothing and differentiation of data by simplified least squares procedures. Anal. Chem. 36, 1627–1639.
Schmidt, C., and Martínez Arbizu, P. (2015). Unexpectedly higher metazoan meiofauna abundances in the Kuril-Kamchatka Trench compared to the adjacent abyssal plains. Deep Sea Res. Part II Top. Stud. Oceanogr. 111, 60–75. doi: 10.1016/j.dsr2.2014.08.019
Sen, P. K. (1968). Estimates of the regression coefficient based on Kendall's tau. J. Am. Stat. Assoc. 63, 1379–1389.
Singhal, N., Kumar, M., Kanaujia, P. K., and Virdi, J. S. (2015). MALDI-TOF mass spectrometry: an emerging technology for microbial identification and diagnosis. Front. Microbiol. 6:791. doi: 10.3389/fmicb.2015.00791
Steinmann, I. C., Pflüger, V., Schaffner, F., Mathis, A., and Kaufmann, C. (2013). Evaluation of matrix-assisted laser desorption/ionization time of flight mass spectrometry for the identification of ceratopogonid and culicid larvae. Parasitology 140, 318–327. doi: 10.1017/S0031182012001618
Stucky, B. J. (2012). SeqTrace: a graphical tool for rapidly processing DNA sequencing chromatograms. J. Biomol. Tech. 23:90. doi: 10.7171/jbt.12-2303-004
Taberlet, P., Coissac, E., Pompanon, F., Brochmann, C., and Willerslev, E. (2012). Towards next-generation biodiversity assessment using DNA metabarcoding. Mol. Ecol. 21, 2045–2050. doi: 10.1111/j.1365-294X.2012.05470.x
Tang, C. Q., Leasi, F., Obertegger, U., Kieneke, A., Barraclough, T. G., and Fontaneto, D. (2012). The widely used small subunit 18S rDNA molecule greatly underestimates true diversity in biodiversity surveys of the meiofauna. Proc. Natl. Acad. Sci. U.S.A. 109, 16208–16212. doi: 10.1073/pnas.1209160109
Theil, H. (1950). “A rank-invariant method of linear and polynomial regression analysis, Part 3,” in Proceedings of Koninalijke Nederlandse Akademie van Weinenschatpen A (Amsterdam), Vol. 53, 1397–1412.
Volta, P., Riccardi, N., Lauceri, R., and Tonolla, M. (2012). Discrimination of freshwater fish species by Matrix-Assisted Laser Desorption/Ionization-Time of Flight Mass Spectrometry (MALDI-TOF MS): a pilot study. J. Limnol. 71:e17. doi: 10.4081/jlimnol.2012.e17
Ward, J. H. Jr. (1963). Hierarchical grouping to optimize an objective function. J. Am. Stat. Assoc. 58, 236–244. doi: 10.1080/01621459.1963.10500845
Yssouf, A., Socolovschi, C., Leulmi, H., Kernif, T., Bitam, I., Audoly, G., Almeras, L., et al. (2014). Identification of flea species using MALDI-TOF/MS. Comp. Immunol. Microbiol. Infect. Dis. 37, 153–157. doi: 10.1016/j.cimid.2014.05.002
Yu, D. W., Ji, Y., Emerson, B. C., Brent, C., Wang, X., Ye, C., et al. (2012). Biodiversity soup: metabarcoding of arthropods for rapid biodiversity assessment and biomonitoring. Methods Ecol. Evol. 3, 613–623. doi: 10.1111/j.2041-210X.2012.00198.x
Keywords: meiobenthos, proteome fingerprint, MALDI-TOF MS, species identification, machine learning tools, random forest, sample fixation
Citation: Rossel S and Martínez Arbizu P (2018) Effects of Sample Fixation on Specimen Identification in Biodiversity Assemblies Based on Proteomic Data (MALDI-TOF). Front. Mar. Sci. 5:149. doi: 10.3389/fmars.2018.00149
Received: 19 January 2018; Accepted: 12 April 2018;
Published: 30 April 2018.
Edited by:
Fengping Wang, Shanghai Jiao Tong University, ChinaReviewed by:
Jing Li, Shanghai Jiao Tong University, ChinaJian-Wen Qiu, Hong Kong Baptist University, Hong Kong
Copyright © 2018 Rossel and Martínez Arbizu. This is an open-access article distributed under the terms of the Creative Commons Attribution License (CC BY). The use, distribution or reproduction in other forums is permitted, provided the original author(s) and the copyright owner are credited and that the original publication in this journal is cited, in accordance with accepted academic practice. No use, distribution or reproduction is permitted which does not comply with these terms.
*Correspondence: Sven Rossel, sven.rossel@senckenberg.de
 Sven Rossel
 Pedro Martínez Arbizu