- 1Rubenstein Ecosystem Science Laboratory, University of Vermont, Burlington, VT, United States
- 2Joseph J. Zilber School of Public Health, University of Wisconsin-Milwaukee, Milwaukee, WI, United States
Cyanobacteria, the primary bloom-forming organisms in fresh water, elicit a spectrum of problems in lentic systems. The most immediate concern for people and animals are cyanobacterial toxins, which have been detected at variable concentrations in water and fish around the world. Cyanotoxins can transfer through food webs, potentially increasing the risk of exposure to people who eat fish from affected waters, yet little is known about how cyanotoxins fluctuate in wild fish tissues. We collated existing studies on cyanotoxins in fish and fresh water from lakes around the world into a global dataset to test the hypothesis that cyanotoxin concentrations in fish increase with water toxin concentrations. We limited our quantitative analysis to microcystins because data on other cyanotoxins in fish were sparse, but we provided a qualitative summary of other cyanotoxins reported in wild, freshwater fish tissues. We found a positive relationship between intracellular microcystin in water samples and microcystin in fish tissues that had been analyzed by assay methods (enzyme-linked immunosorbent assay and protein phosphatase inhibition assay). We expected microcystin to be found in increasingly higher concentrations from carnivorous to omnivorous to planktivorous fishes. We found, however, that omnivores generally had the highest tissue microcystin concentrations. Additionally, we found contrasting results for the level of microcystin in different tissue types depending on the toxin analysis method. Because microcystin and other cyanotoxins have the potential to impact public health, our results underline the current need for comprehensive and uniform detection methods for the analysis of cyanotoxins in complex matrices.
Introduction
Freshwater harmful algal blooms (HABs) are generally caused by cyanobacteria (Lopez et al., 2008). Large-scale blooms are considered unsightly and may cause foul odors (Watson et al., 2016), and many cyanobacteria may also produce toxic secondary metabolites (Wiegand and Pflugmacher, 2005). The negative effects of cyanobacterial toxins (cyanotoxins) have been observed for over a century (Francis, 1878) and, in terms of impacts to humans, include interruptions to municipal water supplies, closures of recreational sites, and illness (Griffiths and Saker, 2003; Bullerjahn et al., 2016; Svirčev et al., 2017).
Consumption of fish from waters affected by cyanobacteria blooms is an important route of human exposure to cyanotoxins (Ibelings and Chorus, 2007; Wilson et al., 2008; Peng et al., 2010; Poste et al., 2011). As much as 40% of global finfish production comes from fresh water (Lynch et al., 2016), and cyanotoxins have been detected in freshwater fish from around the world (Smith et al., 2008; Lee et al., 2017). Previous research has demonstrated that cyanotoxins move through food webs (Karjalainen et al., 2005; Smith and Haney, 2006; El Ghazali et al., 2010; Lance et al., 2014). Biomagnification of cyanotoxins in aquatic food webs is debated but may depend on the types of toxins and their chemical characteristics. The majority of studies have focused on the heptapeptides microcystins, which have been shown to accumulate in some fish tissues (Lance et al., 2014), primarily the liver, and in zooplankton (Hauser-Davis et al., 2015). Some studies have also shown trophic transfer of microcystins (Sotton et al., 2014), however, studies of biomagnification included only a limited number of observations from nature (e.g., Ibelings and Havens, 2008; Kozlowsky-Suzuki et al., 2012). Field studies are critical to uncover patterns that may not be detected in the laboratory setting, due to uncertainties in translating laboratory derived estimates of bioconcentration factors to those in the uncontrolled environment (Mackay et al., 2016).
The factors that influence cyanotoxin concentrations in fish likely include the concentration of the specific toxin(s) in the environment in combination with the period of exposure and fish metabolic processes (Jia et al., 2014; Gurbuz et al., 2016). Further, different cyanotoxin quantification methods could also introduce variability that may artificially enhance or inhibit detection of patterns in nature if toxin concentrations are over- or underestimated. One way to understand cyanotoxin concentrations in wild fish tissues is to determine how environmental exposure may influence toxin accumulation in the fish. For example, Amé et al. (2010) found a significant positive correlation between the dissolved microcystin in the water of Los Padres Lake (Argentina) and the microcystin concentration in the liver of the planktivore Odontesthes bonariensis, while intracellular microcystin was not correlated. Other studies have found high concentrations of cyanotoxins in fish tissues from systems with high concentrations in the water (Amrani et al., 2014; Jiao et al., 2014; Nchabeleng et al., 2014). Conversely, negative correlations have also been observed (Wilson et al., 2008; Bruno et al., 2009; Zhang et al., 2013a). While a consistent relationship is not evident among individual studies, a growing number of field studies have measured cyanotoxins in fish across a range of trophic levels and tissue types.
We used published data on cyanotoxin concentrations in fish and fresh water to better understand observed concentrations of cyanotoxins in wild fish. We gathered data from field studies which reported cyanotoxin concentrations in lentic, freshwater systems to examine cyanotoxin accumulation in freshwater fish across the globe. Our objectives were to (1) determine if cyanotoxin concentrations in fish are reflective of levels of cyanotoxins in the water in which the fish reside, and (2) identify any differences in the accumulation of toxins among tissue types and fish feeding mode (carnivorous, omnivorous, planktivorous). We hypothesized that on a global scale, cyanotoxin concentrations in fish tissues are positively correlated to cyanotoxin concentrations in the water. We expected a test at the global scale to reveal broad patterns in the way cyanotoxins accumulate in fish and to identify feeding groups that may be prone to higher accumulation of toxins. We further hypothesized that planktivorous fishes will have higher cyanotoxin concentrations than fish of other feeding modes because they may directly consume potentially toxic cyanobacteria or toxic zooplankton. High concentrations of microcystins have been previously reported in zooplankton (Ferrão-Filho and Kozlowsky-Suzuki, 2011). Zooplankton may take up dissolved toxins from the water (Karjalainen et al., 2005) and ingest toxins directly from cyanobacteria (Wilson et al., 2006). Additionally, fish that feed on potentially toxigenic cyanobacteria, have a direct path of cyanotoxin exposure that is presumably insignificant or nonexistent for carnivorous fish. Among the tissues, the concentrations of cyanotoxins, specifically microcystins, are often reported to be higher in liver, kidney, and intestine relative to concentrations in the muscle (Mekebri et al., 2009; Amrani et al., 2014; Ni et al., 2017). We expected the assembled data on fish tissues to parallel these observations.
Materials and Methods
To test our hypotheses, we conducted an extensive literature search to collect data from field studies in the primary and gray literature reporting concentrations of cyanotoxins in water and fish. Online searches through Web of Science, Google Scholar, and Academic Search Premier were conducted using relevant search terms. Key terms, “cyanotoxins” or “cyanobacteria toxins” and “fish,” in combination with other words, such as “harmful algal bloom,” “blue-green algae,” “lake,” “freshwater,” and the names of several cyanotoxins most commonly reported in the scientific literature (microcystin, nodularin, cylindrospermopsin, anatoxin, saxitoxin, and β-methylamino-L-alanine) were used to create a list of field studies measuring cyanotoxins in fish and fresh water concurrently. Truncation and wildcard symbols were used to expand the search results and allow variations in the format or spelling of different terms (for example, “microcystins” or “microcystin”). Search options were set to return results from all text associated with the source, including title, key words, the body of the article, and references. Research with paired observations of cyanotoxins in fresh water and fish were targeted and the search was limited to studies from lentic systems. Studies that did not provide water toxin concentrations, but reported toxin concentrations in fish were also included for comparisons of toxin levels among tissue types and fish feeding mode. The references of each study were thoroughly searched for additional sources.
From each study matching our search criteria, cyanotoxin data were gathered from text, tables, and figures. Cyanotoxin concentration values were extracted from figures using WebPlotDigitizer version 3.81 Non-detects or concentrations below the limit of detection were recorded as a concentration of zero. When concentrations were presented as a range, the midpoint was used. The methods used for quantification of cyanotoxins in water and fish tissues were also documented. We found several studies that analyzed cyanotoxins in fish stocked in cage or net enclosures in lakes. Data from such studies were excluded. Studies that provided insufficient detail regarding sample collection, processing or analyses were also excluded. The number of extraction and analysis methods used to identify cyanotoxins in tissues are variable, and extraction efficiencies can be poor (Ernst et al., 2005; Smith and Boyer, 2009). To control for variation in extraction efficiencies, statistical analyses were limited to data from studies that reported tissue extraction efficiencies >50% or used methods (such as homogenization with acidified methanol extraction) where previously reported recoveries were above this threshold.
As cyanotoxin data were reported in different units across studies, concentrations were first converted to μg/g or μg/L and grouped according to the fraction of the toxin measured in the water sample (intracellular, extracellular, and total, which was the sum of the intra- and extracellular toxins). Extracellular toxins were always reported in volumetric units (e.g., ng/L), but total and intracellular toxins were documented in both units per volume and units per biomass (e.g., μg/g), and usually as dry weight. Measurements of cyanobacterial biomass at the time of sampling, if available, were used as conversion factors to convert water toxin concentrations from μg/g to μg/L. Two studies presented intracellular toxin concentrations in fresh weight, so a factor of 10 (ratio of wet/dry weight) was used to obtain the dry weight equivalent (Messineo et al., 2009). Fish toxin concentrations were also reported in both units of dry and fresh weight (DW and FW, respectively). A factor of 0.31 (Poste et al., 2011) was used to convert fresh weight values to dry weight (Equation 1). Ibelings et al. (2005) provided cyanotoxin concentrations for smelt (Osmerus eperlanus), ruffe (Gymnocephalus cernua), and perch (Perca fluviatilis) livers in units of ash-free dry weight (AFDW). Estimates of percent fish liver ash reported in the literature were used to convert ash-free dry weight to dry weight. Łuczynska et al. (2016) found 1.66 (n = 7) and 1.36 (n = 6) percent ash in the livers of wild P. fluviatilis from two lakes in Poland. Using the average ash content in P. fluviatilis from both lakes (1.51% ash), we assumed 100 g of dry liver tissue contained 1.51 g of ash, or 0.0151 g ash per gram of dried fish liver. The ash-free mass of the tissue (MAFDW = 0.9849 g or 1 g dry tissue minus 0.0151 g ash) was used as a conversion factor for P. fluviatilis (Equation 2). Due to limited published data on percent ash in O. eperlanus and G. cernua liver tissue, a conversion factor was approximated from the average percent ash across a range of species, including P. fluviatilis (Łuczynska et al., 2016), Esox lucius, Salmo fario, Cyprinus carpio, Lota vulgaris (Atwater, 1891), and Macquaria australasica (Sheikh-Eldin et al., 1995). The resulting MAFDW for O. eperlanus and G. cernua was 0.9764 g (Equation 2).
All fish toxin concentration values were paired with a corresponding water toxin value from the respective system. When necessary, water toxin concentrations were averaged across the same time period and sample sites as the fish collection. The data did not conform to any parametric assumptions (normality, homoscedasticity) and sample sizes were sometimes low for subsets of the data. Consequently, we used non-parametric bootstraps to conduct our analyses. Data are available online (Flores et al., 2018).
We used Analysis of Covariance (ANCOVA) to test our hypothesis that cyanotoxin concentrations in fish were positively related to cyanotoxin concentrations in the water, and to also test for differences in tissue toxin concentrations among tissue types and fish feeding modes. Subsets of the data were created based on cyanotoxin class (microcystins, saxitoxin, etc.), cyanotoxin quantification method, and water sample type (intra- or extracellular and total). All statistical analyses were conducted separately on each resulting subset of the data. Separation of the data based on the fraction of toxin in the water allowed us to test for differences in accumulation assuming that different exposure routes may exist depending on the state of the toxin (i.e., in the cyanobacteria cell, dissolved in the water, or combined exposure). Data obtained using the enzyme-linked immunosorbent (ELISA) or activity-based (e.g., protein phosphatase inhibition) assays were analyzed separately from chromatographic analytical techniques because the assay and analytical approaches differ substantially in toxin variants targeted and in the principle of detection; results from the two method types do not always corroborate each other. For example, all ELISA data we obtained for microcystins used a polyclonal anti-body that cross-reacts with most microcystin congeners that have an intact ADDA residue. Conversely, data we obtained from studies using chromatographic methods for microcystin only allow for identification and quantification of toxins for which reference standards exist. The difference can be an issue, for example in microcystins, where many congeners are known but few analytical standards exist (Hu et al., 2017). For each data subset previously described, we generated a bootstrap sample by randomly selecting n paired observations (fish and water with associated tissue and feeding modes) from the original data (method 1), with replacement, where n was the number of observations in the data subset. The F-value of the covariate (water), independent variable (tissue type) and their interaction was calculated from this bootstrap sample. This process was repeated B = 10,000 times to create a bootstrap distribution of F-values for each variable. We calculated the 95th percentiles of the bootstrap distributions to compare the observed F-values from the ANCOVA of the original data. The observed F-value was significant if it fell above the 95th percentile of the bootstrap distribution of F-values. The process was repeated by randomly selecting B = 10,000 samples of the original data, but further randomizing the data so that fish samples were randomly assigned a water sample, tissue type, and feeding mode (method 2). In this way, we tested if the observed F-values from the model were significantly different from a distribution of randomly generated, and randomly sampled relationships. When the interaction effect was significant, we conducted a bootstrap two-way Analysis of Variance (ANOVA) on the residuals to remove the effect of the covariate (water toxin concentration) and tested for differences in toxin concentration among tissue types and fish feeding modes. In all other cases (when the interaction effect was not significant), a two-way ANOVA was used on the bootstrap data to test for toxin differences among tissues and feeding modes. In cases where only one fish feeding mode was available, only differences between tissues were tested (one-way ANOVA). Linear models were all assessed by comparing the F-value of the original data to the distribution of bootstrap F-values. Significant results were followed by pairwise comparisons of tissues and feeding modes. We generated 10,000 bootstrap samples using the same sampling method as was used for the significant ANOVAs. For each bootstrap sample we calculated the difference in means for each pairwise comparison and created a distribution of the difference. We calculated the difference for the same pairwise comparisons in the original data and compared the difference to each respective distribution of differences created in the bootstrap. Significance was determined if the difference of the original data was above the 97.5th or below the 2.5th percentiles of the distribution of differences. All statistical analyses were conducted in RStudio version 1.0.136 (R Core Team, 2016).
Results and Discussion
A total of 115 studies were examined from the primary and gray literature, of which 58 freshwater field studies (Supplementary Table 1) met our search criteria and were selected for the present analysis. Of these 58 studies, nearly 90% were on microcystins (MC), while the remainder included β-N-methylamino-L-alanine (BMAA), its isomer, 2,4-diaminobutyric acid dihydrochloride (DABA), anatoxin-a (ATX), cylindrospermopsin (CYN), and saxitoxin (STX; Table 1). The selected studies provided concentrations of cyanotoxins in fish tissues alone or paired with water samples that were collected during the same period as the fish sampling. The studies spanned 99 freshwater systems, including lakes, ponds and reservoirs, across 23 different countries (Figure 1).
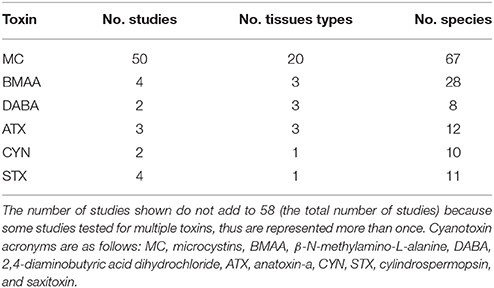
Table 1. The six cyanotoxin types represented in the literature that matched our search criteria are presented here with the number of studies, fish tissue types, and fish species sampled for each cyanotoxin.
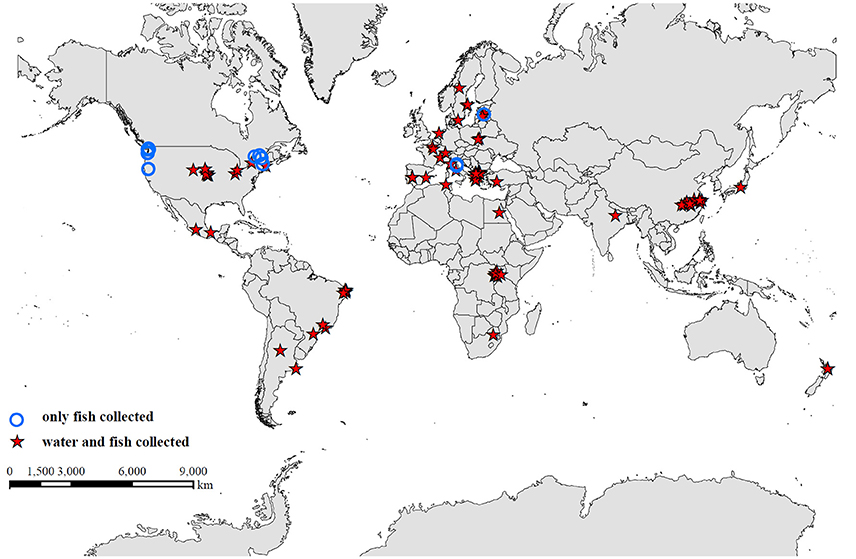
Figure 1. Global distribution of 99 freshwater systems, including lakes, ponds, and reservoirs, from studies used in the data synthesis. Studies that collected fish and water samples concurrently are identified by a red star, and studies that collected only fish samples are indicated by a blue circle.
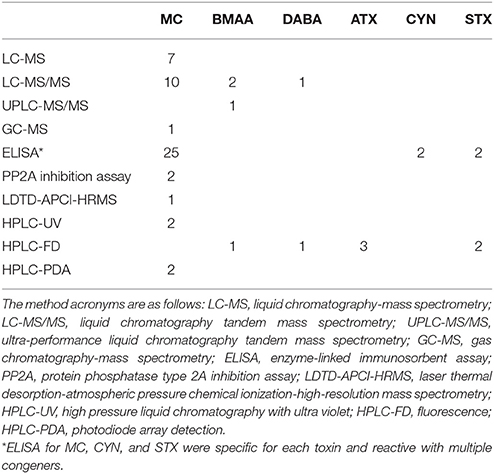
Cyanotoxin concentrations in water samples were highly variable. Water toxin concentrations ranged from undetected to over 7,000 μg/L in one case (intracellular MCs; dissolved MCs reached 13 μg/L). A water concentration of intracellular CYN was only reported in one study at 423.5 μg/g DW. Neurotoxins found in waters reached 25.3 μg/L BMAA, 21.1 μg/L DABA, 24.2 μg/L STX, and 35.0 μg/L ATX. Cyanotoxin concentrations in fish tissues were also highly variable (Table 2). Ten different types of analysis methods were used across all studies to analyze cyanotoxins in tissues (Table 3). Microcystins had the highest diversity of species and tissues tested for cyanotoxins (Tables 1, 2), and the greatest number of quantification methods (Table 3). The highest toxin concentration was MC in the liver of a planktivorous smelt (O. eperlanus) at 375.3 μg/g DW (Table 2).
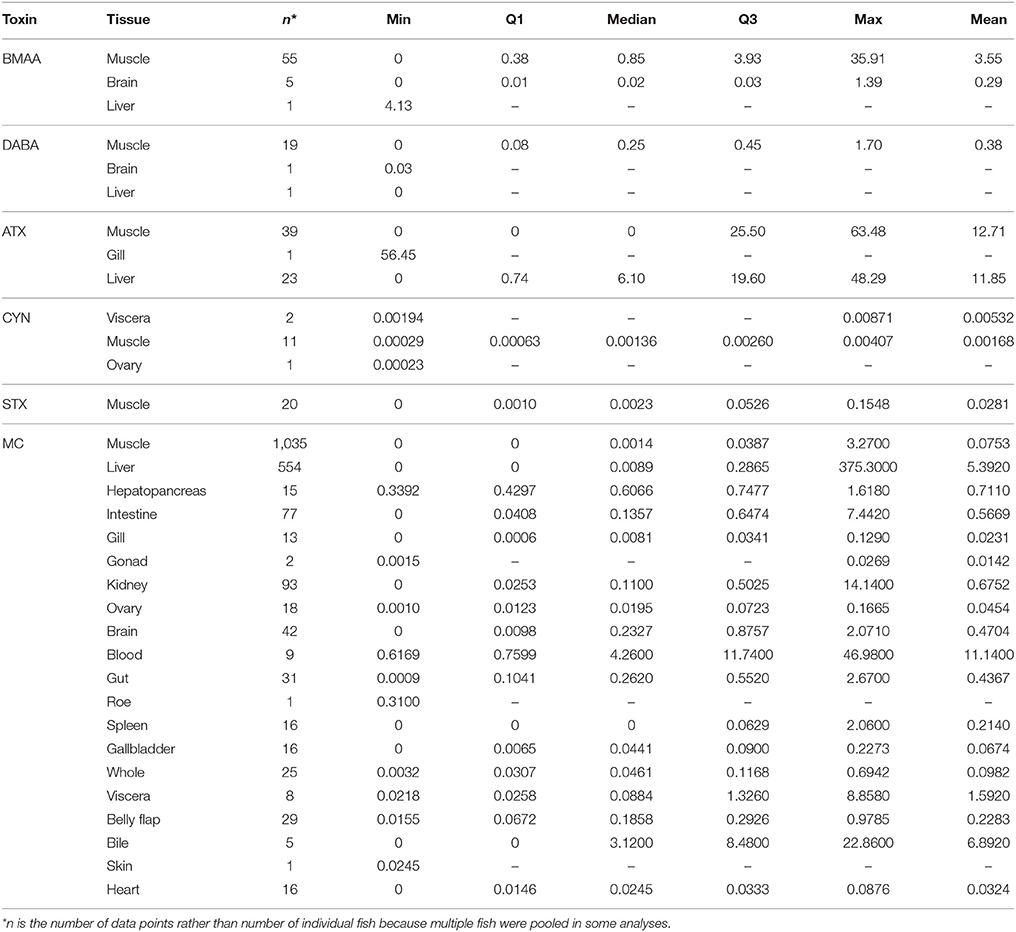
Table 2. Descriptive statistics for concentrations (μg/g DW) of each cyanotoxin class in wild, freshwater fish tissues, including the sample size (n), minimum value reported (min), first and third quartiles (Q1 and Q3, correspondingly), median, and the maximum (max) and mean values.
Due to the limited data for the other toxin classes, quantitative analyses could only be conducted on MCs. An analysis of MC congeners individually was not possible due to the limited number of studies providing congener-specific data in wild fish. Many studies (43%) used the ADDA-specific ELISA method for quantification of MCs (Table 3), which does not allow for identification of individual congeners. In addition, some studies which used analytical methods reported the sum of the different congeners detected (MCs or total MCs) or as “MC-LR equivalents.”
The bootstrap analyses did not indicate any significant relationships using bootstrap sampling method 1. However, sampling method 2 revealed positive relationships within the ELISA and PP2A (protein phosphatase type 2 inhibition assay) subsets. Intracellular MC concentration in the water was positively correlated with fish tissue MC concentration detected by ELISA (p < 0.0001; Figure 2) and PP2A (p = 0.0006; Figure 3). The high variability in MC concentrations in fish tissues may be due to effects from different MC congeners present in the data, or to differences in accumulation between tissue types or fish of different feeding modes. For example, the higher range of concentrations in the tissues of fish analyzed with PP2A (Figure 3) compared to ELISA (Figure 2) could be due to presence of other protein phosphatase inhibitors in the tissues. MC-LR recovery in the livers of rainbow trout (Oncorhynchus mykiss) using different detection methods were higher in the protein phosphatase assay (protein phosphatase type 1) compared to ELISA or HPLC (Ernst et al., 2005). Further, 30% more MCs were found in the muscle of tilapia (Oreochromis niloticus and Tilapia rendalli) with a type 2 protein phosphatase inhibition assay than the ELISA (Deblois et al., 2008). In both of these cases, the higher concentrations detected with the protein phosphatase inhibition assay were likely attributed to other non-MC compounds with phosphatase inhibiting activity (Ernst et al., 2005; Deblois et al., 2008). Pesticides, including endothall, cantharidin, and other algal metabolites such as some anabaenopeptins and oscillamides, occur in aquatic environments and have also been shown to inhibit protein phosphatases (Erdodi et al., 1995; Sano et al., 2001; Gkelis et al., 2006).
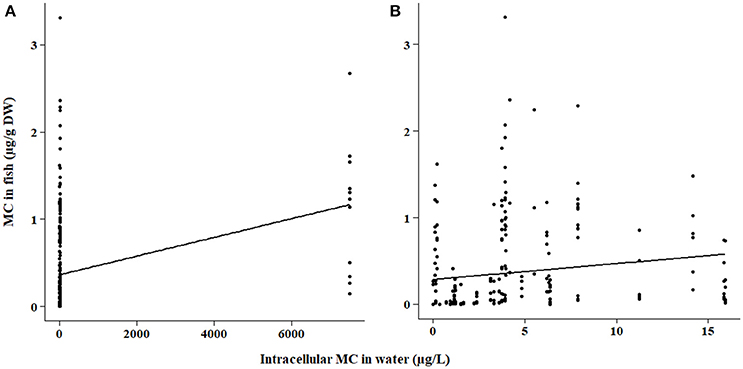
Figure 2. (A) Microcystin (MC) in fish tissues as a function of intracellular MC concentration in the water for samples quantified by the ELISA method. Fish tissues include all tissue types and fish feeding modes. (B) Same data as (A) but with focus on intracellular MC concentrations below 20 μg/L.
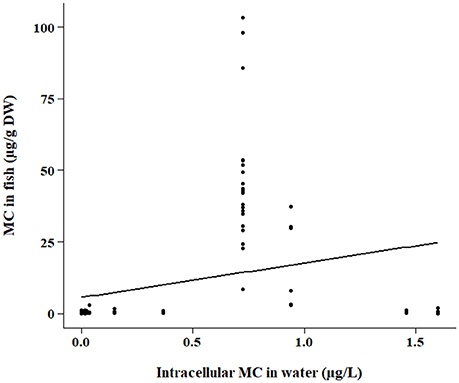
Figure 3. Same as Figure 2 except samples were quantified by the PP2A method.
We found a significant interaction effect between MC in fish tissues and MCs in the water analyzed by LC-MS and LC-MS/MS (p = 0.0025 and p = 0.0129, respectively). The LC-MS and LC-MS/MS subsets were further tested for differences in MC accumulation between tissue types and forage modes in a two-way ANOVA of the residuals, followed by pairwise comparisons. The LC-MS data subset by extracellular MCs in the water were significantly different in tissue MC concentrations (p < 0.0001), but the intracellular MC subset was not. Tissues were significantly different in toxin concentration for LC-MS/MS (p < 0.0001; intracellular MC subset). We also found differences in tissue types analyzed by other methods, however, the results were conflicting and will be summarized separately below.
We found that omnivores generally had higher MC concentrations than carnivores and planktivores across different MC analysis methods (ELISA, p < 0.0001; PP2A—only omnivores and carnivores tested due to a lack of planktivore data, p = 0.0001; LC-MS—only omnivores and planktivores tested due to limited carnivore data, p = 0.003; Figures 4–6, respectively). Planktivores were not significantly different than carnivores when sufficient data allowed us to test them together. However, data on planktivores (n = 126) were less abundant than for carnivores (n = 313) and omnivores (n = 767).
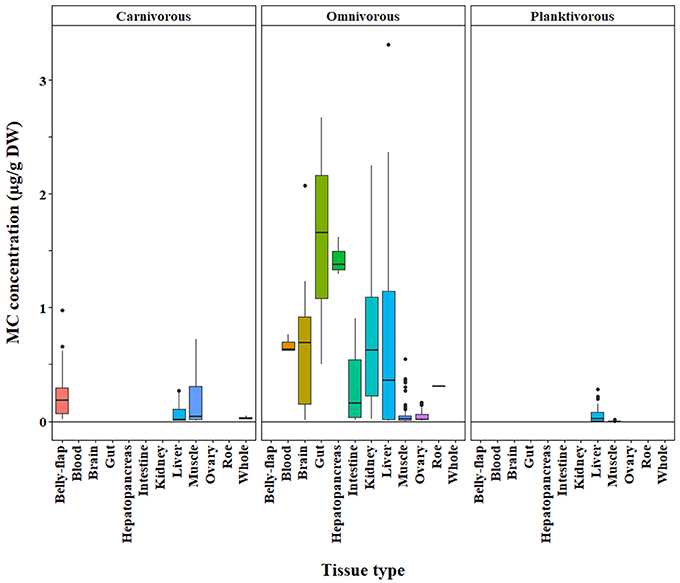
Figure 4. Microcystin (MC) concentrations in fish grouped by trophic level (carnivore, omnivore, planktivore) across a range of tissue types. Concentrations were quantified by the ELISA method. The raw data are shown.
The bootstrap analysis also indicated that MC concentrations were significantly different between tissue types, but the results differed depending on the analysis method. For example, liver MC concentrations were greater than muscle when measured by GC-MS (p = 0.0023; Figure 7), PP2A (p = 0.0001; Figure 5), and LC-MS (p = 0.0023; Figure 6), but not when measured by ELISA (Figure 4) and LC-MS/MS (Figure 8). We compared tissues common to all MC analysis methods where significant differences were detected between the tissues (ELISA, PP2A, LC-MS, LC-MS/MS, GC-MS; Table 4). GC-MS was only used to measure liver and muscle, so no further comparisons could be made for that method. Other than the liver and muscle, no differences were detected between tissue MC content by LC-MS. For LC-MS/MS, kidney samples had the highest MC concentrations while other tissues were not significantly different. The PP2A subset yielded liver as the tissue with the highest MC content, but other tissues analyzed by this method were also not significantly different from one another. For ELISA, gut, hepatopancreas, and brain ranked above the other tissues by MC concentrations, and the remaining tissues were not significantly different.
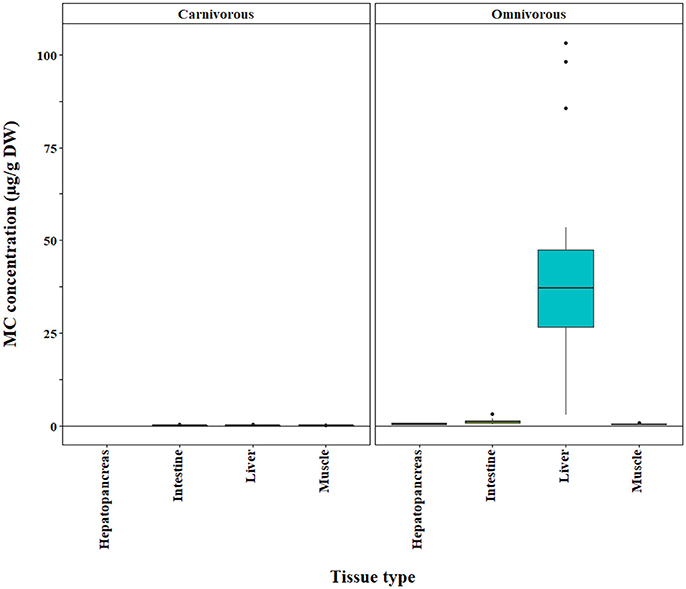
Figure 5. Microcystin (MC) concentrations in tissues of carnivorous and omnivorous fishes based on PP2A method. The raw data are shown.
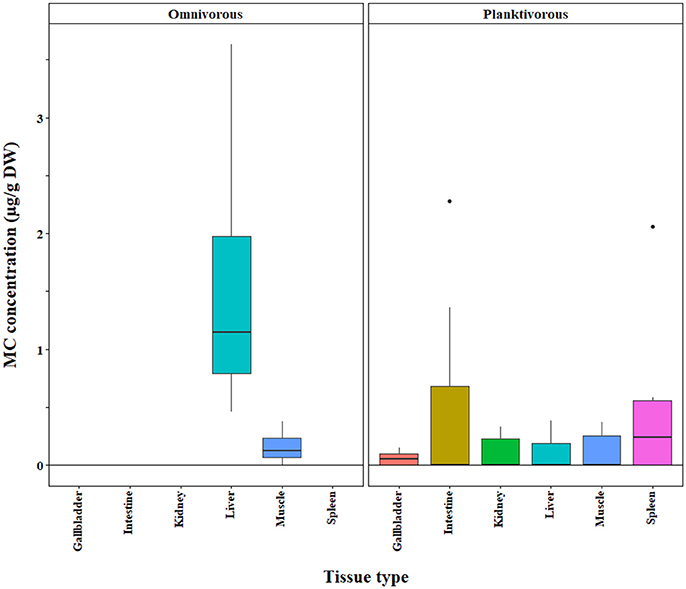
Figure 6. Microcystin (MC) concentrations in the tissues of omnivorous and planktivorous fish tissues quantified by LC-MS. A subset of the original, raw data is shown for which significant differences between tissue types and feeding groups were detected in a bootstrap analysis of the residuals.
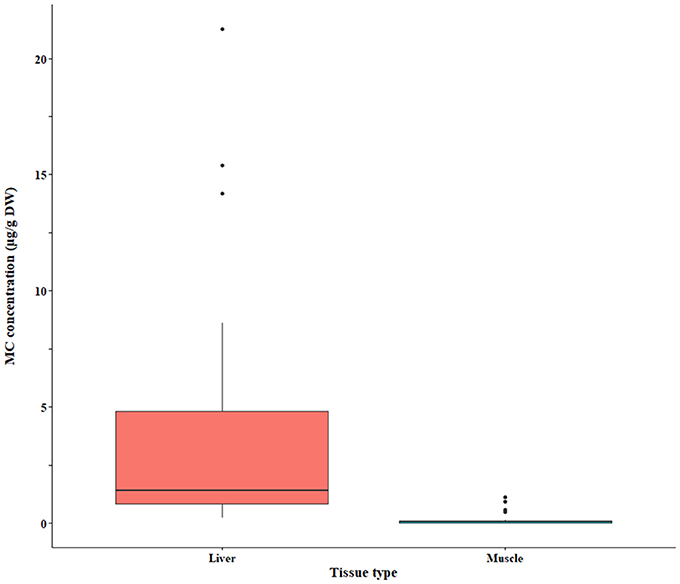
Figure 7. Microcystin (MC) concentrations in fish liver and muscle quantified by the GC-MS (MMPB) method. The raw data are shown.
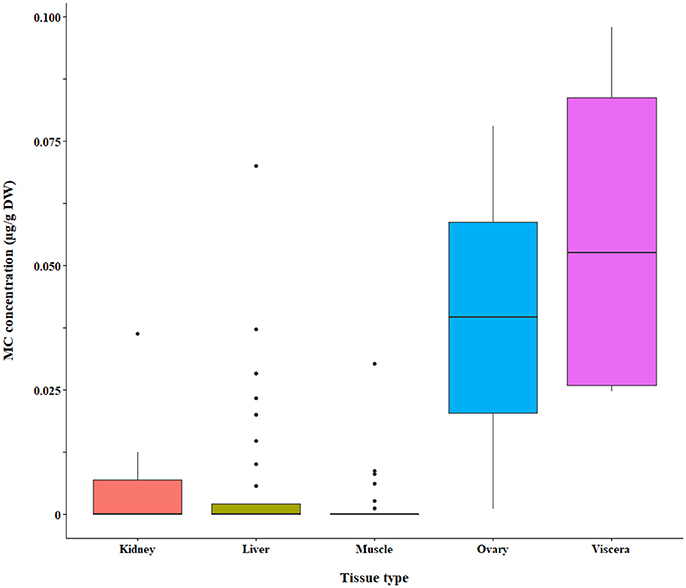
Figure 8. Microcystin (MC) in fish tissues quantified by LC-MS/MS. A subset of the raw data is shown for which significant differences between tissue types were detected by bootstrap analysis of the residuals.
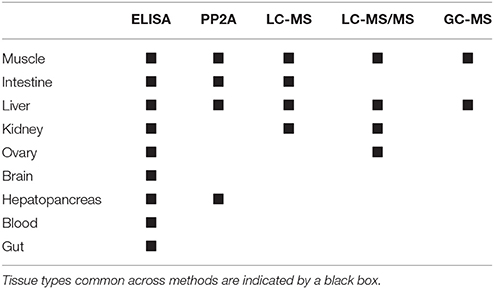
Table 4. Microcystin (MC) quantification methods for which significant differences in MC concentrations between tissue types were detected by bootstrap analyses.
To our knowledge, our synthesis is the most comprehensive representation of information available on cyanotoxins in wild, freshwater fish. We found that MCs compose the majority of studies on cyanotoxins in fish, a theme that parallels the field of cyanotoxin research. More than half of the primary literature addresses MC, relative to other types of cyanotoxins, and the areas of environmental and human health are understudied (Merel et al., 2013). The limited data for other classes of cyanotoxins in fish and water prevented us from conducting statistical tests on toxins other than MCs. Using bootstraps analyses, we found evidence of a positive correlation between intracellular MC in the water and MC in the tissues of fish, which suggests that increases in MC concentrations in lentic systems may result in higher MC concentrations in fish. MCs are often found at higher concentrations in intracellular form than extracellular, unless at the end of a bloom cycle (Cazenave et al., 2005). Fish and other organisms that feed on cyanobacteria may directly ingest MC. Upon bloom senescence, intracellular toxins may be released into the water. Systems with periods of higher intracellular MC concentrations, may be followed by periods of subsequent high extracellular MC concentration, which may directly expose aquatic biota to toxins. The dominant route of exposure to fish is unknown, but trophic transfer, and direct transfer via ingestion of cells and immersion in MC-contaminated water have been demonstrated in laboratory experiments (Soares et al., 2004; Smith and Haney, 2006; Sieroslawska et al., 2012). Contrary to our expectations, omnivores were the group with the highest cyanotoxin concentrations. Omnivorous fish can be exposed to toxins through almost any possible route, from immersion in a “toxic bath” of dissolved toxins in the water, to ingestion of plants, animals, or other potentially toxic matter. In any case, MCs are unlikely to cross cell membranes freely, but rather transported by organic transporting polypeptides as in human tissues (Fischer et al., 2010). Thus, the distribution of these receptors in fish tissues will dictate the most common exposure route. The number of potential exposure routes for omnivorous fish may help explain their high degree of toxin concentrations relative to other feeding modes. More data on wild fish of other feeding modes, especially planktivores, would help better define this relationship. Furthermore, tissue MC concentrations were difficult to compare due to the number of different methods used to analyze toxin concentrations, and the variability in tissue types tested by each method. Evidence for previously detected relationships, such as the greater concentrations of MC in liver than muscle, are supported, however relationships between other tissue types are not as clear and may depend on which methods are used for MC detection.
The analytical method used is likely extremely important in influencing the observed toxin concentration in fish. Different concentrations of MCs from the same sample have been previously detected with different analysis methods (e.g., Gkelis et al., 2006; Hardy et al., 2015). Comparison of MC concentrations in different organisms is difficult due to the variety of methods employed, protein binding affinity, and differences in pharmacokinetics in different organisms (Adamovskỳ et al., 2007; Zhang et al., 2013b). Analysis methods may be more comparable if they have similar extraction efficiencies, but many studies do not report this critical information. Out of the studies we analyzed, less than half conducted spike-recovery tests and reported extraction efficiencies. Isotopically labeled standards for select cyanotoxins have only recently become available commercially (e.g., Cambridge Isotope Laboratories, Inc.) to control for variability in extraction efficiencies. To make data more comparable in the absence of standardized analysis methods, future studies should conduct spike recovery tests to support the efficacy of the methods or use surrogate standards to estimate extraction efficiency. Our results emphasize the need for increased efforts to standardize cyanotoxin extractions from tissues and analytical methods (Smith and Boyer, 2009). Furthermore, only a handful of field studies on cyanotoxins other than MCs in freshwater systems exist, so relatively little is known regarding accumulation and presence of other cyanotoxins in wild fish. Cyanobacteria produce hundreds of secondary metabolites, many of which have been detected in natural systems (Rohrlack and Utkilen, 2007; Beversdorf et al., 2017). Co-occurrence of multiple cyanotoxins in wild fish have also been detected (Pawlik-Skowronska et al., 2012; Al-Sammak et al., 2014)—field studies on toxins other than MC are necessary to determine the risk of exposure to other bioactive products produced by cyanobacteria.
Our global synthesis includes the majority of studies that have been published on cyanotoxins in wild, freshwater fish. Much of what we know about cyanotoxin concentrations in fish comes from laboratory experiments and exposure studies. However, the growing number of field studies which analyze cyanotoxins in seafood is attributed to an equally growing concern for the transfer of toxins from food sources to people (Lee et al., 2017). We found toxin concentrations were highly variable across tissue types and fish feeding modes. Indeed, some of this variability may be attributed to the numerous methods that are used to quantify cyanotoxins. One of the major limitations of the present study was the large proportion of data coming from ELISA, and a general lack of congener-specific data. Due to matrix effects and cross-reactivity of ELISA with MC metabolites, ELISA can be considered a semi-quantitative method (Kopp et al., 2013; Schmidt et al., 2013). All currently available analysis methods have pros and cons (Foss and Aubel, 2015), and which method is used often depends on the purpose for testing. For quantitative analysis in fish tissues, however, LC-MS/MS appears to offer the greatest combination of sensitivity and specificity for congener—specific analysis (Kopp et al., 2013; Preece et al., 2015).
MCs covalently bind extensively to proteins (MacKintosh et al., 1995), and thus protein-bound MC fractions are important for understanding MC dynamics in fish tissues. The wide majority of MC analyses in wild fish have not used methods that can detect tissue-bound MCs, even though much of the total microcystin concentration can be bound to the tissues (Williams et al., 1997a,b; Lance et al., 2010; Greer et al., 2017). Covalently bound toxins may not be biologically available to consumers and/or unable to inhibit protein phosphatases, but proteolytic enzymes in the digestive system could free them from the tissues (Smith et al., 2010). The binding of MCs to protein phosphatases may, to some extent, be reversible (Miles et al., 2016). The consequences of the irreversible binding of MC to protein phosphatases is not well understood (Ibelings and Chorus, 2007; Smith et al., 2010), and conventional extraction methods may not be efficient for quantification of the protein-bound fraction of MCs in biological samples (Neffling et al., 2010). Covalently bound MCs are not considered toxic, but if they can be released from proteins under certain conditions, the covalently bound fraction may act as a secondary toxic pool whereby additional toxins can be released back into circulation of the organism (Miles et al., 2016). The 2-methyl-3-methoxy-4-phenylbutyric acid (MMPB) method, targets all MCs with an intact native ADDA residue and in most cases targets both protein and non-protein bound MCs. As such, this method in combination with LC-MS/MS may provide one analytical method for quantification of the total toxic MC pool in fish tissues. This would offer both the specificity and sensitivity of standard mass spectrometry methods and the ability to target all MCs with an intact native ADDA residue. The MMPB method has been significantly improved and standardized for water samples (Foss and Aubel, 2015), but further work is needed for complex matrices such as fish tissues.
Information about the accumulation of cyanotoxins in one fish species from different lakes or multiple species from the same lake is needed to understand and prevent the possible exposure of humans through consumption (Peng et al., 2010). Our large-scale analysis of cyanotoxins in fish and fresh water informs efforts to understand harmful cyanobacterial bloom impacts on globally important areas such as fisheries, human health and natural resource management. In addition, a global dataset on cyanotoxins in water and fish will streamline future research efforts by providing a baseline for research and management organizations to compare regional levels of cyanotoxin concentrations in water or fish to those from other locales. Because climate change and continued anthropogenic eutrophication are expected to increase the occurrence and severity of HABs (O'Neil et al., 2012), understanding cyanotoxin dynamics in fish and fresh water are becoming increasingly important for human health. Progress in this research area is currently hindered by analytical limitations, such as the lack of standardized extraction procedures and analytical standards for tissues (Hu et al., 2017). The analysis provided here shows that current and future research efforts should focus on standardized extraction and analysis methods for cyanotoxin in fish tissues as an important human exposure route. In addition, data on the occurrence of other cyanotoxins besides MCs in fish tissues are needed.
Author Contributions
NF: Conducted data mining, the statistical analysis, and manuscript writing; TM: Provided guidance on cyanotoxin analysis methods in the literature, statistical analysis, and comments on the manuscript; JS: Developed the idea for the paper and contributed guidance on the methods, statistical analysis and manuscript writing.
Funding
Support was provided by the Lintilhac Foundation, The Rubenstein School of Environment and Natural Resources at the University of Vermont, and the Vermont Water Resources and Lake Studies Center.
Conflict of Interest Statement
The authors declare that the research was conducted in the absence of any commercial or financial relationships that could be construed as a potential conflict of interest.
Acknowledgments
We would like to extend our thanks to Scott Merrill and Taylor Stewart for assistance with data analysis questions. We would also like to thank Benoît Sotton, Bastiaan Ibelings, and Greg Boyer for sharing data or providing responses for inquiries about their research.
Supplementary Material
The Supplementary Material for this article can be found online at: https://www.frontiersin.org/articles/10.3389/fmars.2018.00030/full#supplementary-material
Footnotes
References
Adamovskỳ, O., Kopp, R., Hilscherová, K., Babica, P., Palíková, M., Pašková, V., et al. (2007). Microcystin kinetics (bioaccumulation and elimination) and biochemical responses in common carp (Cyprinus carpio) and silver carp (Hypophthalmichthys molitrix) exposed to toxic cyanobacterial blooms. Chemistry 26, 2687–2693. doi: 10.1897/07-213.1
Al-Sammak, M., Hoagland, K., Cassada, D., and Snow, D. (2014). Co-occurrence of the cyanotoxins BMAA, DABA and anatoxin-a in Nebraska reservoirs, fish, and aquatic plants. Toxins 6, 488–508. doi: 10.3390/toxins6020488
Amé, M. V., Galanti, L. N., Menone, M. L., Gerpe, M. S., Moreno, V. J., and Wunderlin, D. A. (2010). Microcystin–LR, –RR, –YR and –LA in water samples and fishes from a shallow lake in Argentina. Harmful Algae 9, 66–73. doi: 10.1016/j.hal.2009.08.001
Amrani, A., Nasri, H., Azzouz, A., Kadi, Y., and Bouaïcha, N. (2014). Variation in cyanobacterial hepatotoxin (microcystin) content of water samples and two species of fishes collected from a shallow lake in Algeria. Arch. Environ. Contam. Toxicol. 66, 379–389. doi: 10.1007/s00244-013-9993-2
Atwater, W. O. (1891). The Chemical Composition and Nutritive Values of Food Fishes and Aquatic Invertebrates. Washington: US Government Printing Office.
Beversdorf, L., Weirich, C., Bartlett, S., and Miller, T. (2017). Variable cyanobacterial toxin and metabolite profiles across six eutrophic lakes of differing physiochemical characteristics. Toxins 9:62. doi: 10.3390/toxins9020062
Bruno, M., Melchiorre, S., Messineo, V., Volpi, F., Di Corcia, A., Aragona, I., et al. (2009). “Microcystin detection in contaminated fish from Italian lakes using ELISA immunoassays and LC-MS/MS analysis,” in Handbook on Cyanobacteria: Biochemistry, Biotechnology and Applications, eds P. M. Gault and H. J. Marler (New York, NY: Nova Science Publishers, Inc.), 191–210.
Bullerjahn, G. S., McKay, R. M., Davis, T. W., Baker, D. B., Boyer, G. L., D'Anglada, L. V., et al. (2016). Global solutions to regional problems: collecting global expertise to address the problem of harmful cyanobacterial blooms. A lake erie case study. Harmful Algae 54, 223–238. doi: 10.1016/j.hal.2016.01.003
Cazenave, J., Wunderlin, D. A., Bistoni, M., de los, Á., Amé, M. V., Krause, E., et al. (2005). Uptake, tissue distribution and accumulation of microcystin-RR in Corydoras paleatus, Jenynsia multidentata and Odontesthes bonariensis. Aquat. Toxicol. 75, 178–190. doi: 10.1016/j.aquatox.2005.08.002
Ferrão-Filho, A. d. S., and Kozlowsky-Suzuki, B. (2011). Cyanotoxins: bioaccumulation and effects on aquatic animals. Mar. Drugs 9, 2729–2772. doi: 10.3390/md9122729
Deblois, C. P., Aranda-Rodriguez, R., Giani, A., and Bird, D. F. (2008). Microcystin accumulation in liver and muscle of tilapia in two large Brazilian hydroelectric reservoirs. Toxicon 51, 435–448. doi: 10.1016/j.toxicon.2007.10.017
El Ghazali, I., Saqrane, S., Carvalho, A. P., Ouahid, Y., Del Campo, F. F., Vasconcelos, V., et al. (2010). Effect of different microcystin profiles on toxin bioaccumulation in common carp (Cyprinus carpio) larvae via Artemia nauplii. Ecotoxicol. Environ. Saf. 73, 762–770. doi: 10.1016/j.ecoenv.2009.12.015
Erdodi, F., Toth, B., Hirano, K., Hirano, M., Hartshorne, D. J., and Gergely, P. (1995). Endothall thioanhydride inhibits protein phosphatases-1 and−2A in vivo. Am. J. Physiol. Cell Physiol. 269, C1176–C1184. doi: 10.1152/ajpcell.1995.269.5.C1176
Ernst, B., Dietz, L., Hoeger, S. J., and Dietrich, D. R. (2005). Recovery of MC-LR in fish liver tissue. Environ. Toxicol. 20, 449–458. doi: 10.1002/tox.20131
Fischer, A., Hoeger, S. J., Stemmer, K., Feurstein, D. J., Knobeloch, D., Nussler, A., et al. (2010). The role of organic anion transporting polypeptides (OATPs/SLCOs) in the toxicity of different microcystin congeners in vitro: a comparison of primary human hepatocytes and OATP-transfected HEK293 cells. Toxicol. Appl. Pharmacol. 245, 9–20. doi: 10.1016/j.taap.2010.02.006
Flores, N. M., Miller, T. R., and Stockwell, J. D. (2018). Concentrations of cyanotoxins in fresh water and fish. Environmental Data Initiative doi: 10.6073/pasta/0c250018ee7732d984be74e2043b84b4
Foss, A. J., and Aubel, M. T. (2015). Using the MMPB technique to confirm microcystin concentrations in water measured by ELISA and HPLC (UV, MS, MS/MS). Toxicon 104, 91–101. doi: 10.1016/j.toxicon.2015.07.332
Gkelis, S., Lanaras, T., and Sivonen, K. (2006). The presence of microcystins and other cyanobacterial bioactive peptides in aquatic fauna collected from Greek freshwaters. Aquat. Toxicol. 78, 32–41. doi: 10.1016/j.aquatox.2006.02.001
Greer, B., Maul, R., Campbell, K., and Elliott, C. T. (2017). Detection of freshwater cyanotoxins and measurement of masked microcystins in tilapia from Southeast Asian aquaculture farms. Anal. Bioanal. Chem. 409, 4057–4069. doi: 10.1007/s00216-017-0352-4
Griffiths, D. J., and Saker, M. L. (2003). The Palm Island mystery disease 20 years on: a review of research on the cyanotoxin cylindrospermopsin. Environ. Toxicol. 18, 78–93. doi: 10.1002/tox.10103
Gurbuz, F., Uzunmehmetoglu, O. Y., Diler, Ö., Metcalf, J. S., and Codd, G. A. (2016). Occurrence of microcystins in water, bloom, sediment and fish from a public water supply. Scie. Total Environ. 562, 860–868. doi: 10.1016/j.scitotenv.2016.04.027
Hardy, F. J., Johnson, A., Hamel, K., and Preece, E. (2015). Cyanotoxin bioaccumulation in freshwater fish, Washington State, USA. Environ. Monit. Assess. 187:667. doi: 10.1007/s10661-015-4875-x
Hauser-Davis, R. A., Lavradas, R. T., Lavandier, R. C., Rojas, E. G. A., Guarino, A. W., and Ziolli, R. L. (2015). Accumulation and toxic effects of microcystin in tilapia (Oreochromis niloticus) from an eutrophic Brazilian lagoon. Ecotoxicol. Environ. Saf. 112, 132–136. doi: 10.1016/j.ecoenv.2014.10.036
Hu, X., Ye, J., Zhang, R., Wu, X., Zhang, Y., and Wu, C. (2017). Detection of free microcystins in the liver and muscle of freshwater fish by liquid chromatography-tandem mass spectrometry. J. Environ. Sci. Health Part B 52, 770–776. doi: 10.1080/03601234.2017.1356670
Ibelings, B. W., Bruning, K., de Jonge, J., Wolfstein, K., Pires, L. M., Postma, J., et al. (2005). Distribution of microcystins in a lake foodweb: no evidence for biomagnification. Microb. Ecol. 49, 487–500. doi: 10.1007/s00248-004-0014-x
Ibelings, B. W., and Chorus, I. (2007). Accumulation of cyanobacterial toxins in freshwater “seafood” and its consequences for public health: a review. Environ. Pollut. 150, 177–192. doi: 10.1016/j.envpol.2007.04.012
Ibelings, B. W., and Havens, K. E. (2008). “Cyanobacterial toxins: a qualitative meta–analysis of concentrations, dosage and effects in freshwater, estuarine and marine biota,” in Cyanobacterial Harmful Algal Blooms: State of the Science and Research Needs (New York, NY: Springer), 675–732.
Jia, J., Luo, W., Lu, Y., and Giesy, J. P. (2014). Bioaccumulation of microcystins (MCs) in four fish species from Lake Taihu, China: assessment of risks to humans. Sci. Total Environ. 487, 224–232. doi: 10.1016/j.scitotenv.2014.04.037
Jiao, Y., Chen, Q., Chen, X., Wang, X., Liao, X., Jiang, L., et al. (2014). Occurrence and transfer of a cyanobacterial neurotoxin β-methylamino-l-alanine within the aquatic food webs of Gonghu Bay (Lake Taihu, China) to evaluate the potential human health risk. Sci. Total Environ. 468–469, 457–463. doi: 10.1016/j.scitotenv.2013.08.064
Karjalainen, M., Reinikainen, M., Spoof, L., Meriluoto, J. A., Sivonen, K., and Viitasalo, M. (2005). Trophic transfer of cyanobacterial toxins from zooplankton to planktivores: consequences for pike larvae and mysid shrimps. Environ. Toxicol. 20, 354–362. doi: 10.1002/tox.20112
Kopp, R., Palíková, M., Adamovský, O., Ziková, A., Navrátil, S., Kohoutek, J., et al. (2013). Concentrations of microcystins in tissues of several fish species from freshwater reservoirs and ponds. Environ. Monit. Assess. 185, 9717–9727. doi: 10.1007/s10661-013-3285-1
Kozlowsky-Suzuki, B., Wilson, A. E., and Ferrão-Filho, A. (2012). Biomagnification or biodilution of microcystins in aquatic foodwebs? Meta-analyses of laboratory and field studies. Harmful Algae 18, 47–55. doi: 10.1016/j.hal.2012.04.002
Lance, E., Neffling, M.-R., Gérard, C., Meriluoto, J., and Bormans, M. (2010). Accumulation of free and covalently bound microcystins in tissues of Lymnaea stagnalis (Gastropoda) following toxic cyanobacteria or dissolved microcystin-LR exposure. Environ. Pollut. 158, 674–680. doi: 10.1016/j.envpol.2009.10.025
Lance, E., Petit, A., Sanchez, W., Paty, C., Gérard, C., and Bormans, M. (2014). Evidence of trophic transfer of microcystins from the gastropod Lymnaea stagnalis to the fish Gasterosteus aculeatus. Harmful Algae 31, 9–17. doi: 10.1016/j.hal.2013.09.006
Lee, J., Lee, S., and Jiang, X. (2017). Cyanobacterial toxins in freshwater and food: important sources of exposure to humans. Annu. Rev. Food Sci. Technol. 8, 281–304. doi: 10.1146/annurev-food-030216-030116
Lopez, C. B., Jewett, E. B., Dortch, Q., Walton, B. T., and Hudnell, H. K. (2008). Scientific Assessment of Freshwater Harmful Algal Blooms. Washington, DC: Interagency Working Group on Harmful Algal Blooms, Hypoxia, and Human Health of the Joint Subcommittee on Ocean Science and Technology.
Łuczynska, J., Tonska, E., Krejszeff, S., and Zarski, D. (2016). Comparison of fatty acids in the muscles and liver of pond-cultured and wild perch, Perca fluviatilis (L.), in Poland. Turkish J. Fish. Aquat. Sci. 16, 19–27. doi: 10.4194/1303-2712-v16_1_03
Lynch, A. J., Cooke, S. J., Deines, A. M., Bower, S. D., Bunnell, D. B., Cowx, I. G., et al. (2016). The social, economic, and environmental importance of inland fish and fisheries. Environ. Rev. 24, 115–121. doi: 10.1139/er-2015-0064
Mackay, D., Celsie, A. K. D., Arnot, J. A., and Powell, D. E. (2016). Processes influencing chemical biomagnification and trophic magnification factors in aquatic ecosystems: implications for chemical hazard and risk assessment. Chemosphere 154, 99–108. doi: 10.1016/j.chemosphere.2016.03.048
MacKintosh, R. W., Dalby, K. N., Campbell, D. G., Cohen, P. T., Cohen, P., and MacKintosh, C. (1995). The cyanobacterial toxin microcystin binds covalently to cysteine-273 on protein phosphatase 1. FEBS Lett. 371, 236–240. doi: 10.1016/0014-5793(95)00888-G
Mekebri, A., Blondina, G. J., and Crane, D. B. (2009). Method validation of microcystins in water and tissue by enhanced liquid chromatography tandem mass spectrometry. J. Chromatogr. A 1216, 3147–3155. doi: 10.1016/j.chroma.2009.01.095
Merel, S., Walker, D., Chicana, R., Snyder, S., Baurès, E., and Thomas, O. (2013). State of knowledge and concerns on cyanobacterial blooms and cyanotoxins. Environ. Int. 59, 303–327. doi: 10.1016/j.envint.2013.06.013
Messineo, V., Melchiorre, S., Di Corcia, A., Gallo, P., and Bruno, M. (2009). Seasonal succession of Cylindrospermopsis raciborskii and Aphanizomenon ovalisporum blooms with cylindrospermopsin occurrence in the volcanic Lake Albano, Central Italy. Environ. Toxicol. 25, 18–27.
Miles, C. O., Sandvik, M., Nonga, H. E., Ballot, A., Wilkins, A. L., Rise, F., et al. (2016). Conjugation of microcystins with thiols is reversible: base-catalyzed deconjugation for chemical analysis. Chem. Res. Toxicol. 29, 860–870. doi: 10.1021/acs.chemrestox.6b00028
Nchabeleng, T., Cheng, P., Oberholster, P., Botha, A.-M., Smit, W., and Luus-Powell, W. (2014). Microcystin-LR equivalent concentrations in fish tissue during a postbloom Microcystis exposure in Loskop Dam, South Africa. Afr. J. Aquat. Sci. 39, 459–466. doi: 10.2989/16085914.2014.973830
Neffling, M.-R., Lance, E., and Meriluoto, J. (2010). Detection of free and covalently bound microcystins in animal tissues by liquid chromatography–tandem mass spectrometry. Environ. Pollut. 158, 948–952. doi: 10.1016/j.envpol.2009.10.023
Ni, W., Zhang, J., and Luo, Y. (2017). Microcystin accumulation in bighead carp (Aristichthys nobilis) during a Microcystis-dominated bloom and risk assessment of the dietary intake in a fish pond in China. Environ. Sci. Pollut. Res. 24, 8894–8902. doi: 10.1007/s11356-015-4974-9
O'Neil, J. M., Davis, T. W., Burford, M. A., and Gobler, C. J. (2012). The rise of harmful cyanobacteria blooms: the potential roles of eutrophication and climate change. Harmful Algae 14, 313–334. doi: 10.1016/j.hal.2011.10.027
Pawlik-Skowronska, B., Toporowska, M., and Rechulicz, J. (2012). Simultaneous accumulation of anatoxin-a and microcystins in three fish species indigenous to lakes affected by cyanobacterial blooms. Oceanol. Hydrobiol. Stud. 41, 53–65. doi: 10.2478/s13545-012-0039-6
Peng, L., Liu, Y., Chen, W., Liu, L., Kent, M., and Song, L. (2010). Health risks associated with consumption of microcystin-contaminated fish and shellfish in three Chinese lakes: significance for freshwater aquacultures. Ecotoxicol. Environ. Saf. 73, 1804–1811. doi: 10.1016/j.ecoenv.2010.07.043
Poste, A. E., Hecky, R. E., and Guildford, S. J. (2011). Evaluating microcystin exposure risk through fish consumption. Environ. Sci. Technol. 45, 5806–5811. doi: 10.1021/es200285c
Preece, E. P., Moore, B. C., Swanson, M. E., and Hardy, F. J. (2015). Identifying best methods for routine ELISA detection of microcystin in seafood. Environ. Monit. Assess. 187:12. doi: 10.1007/s10661-014-4255-y
R Core Team (2016). R: A Language and Environment for Statistical Computing. R Foundation for Statistical Computing, Vienna. Available online at: URL https://www.R-project.org
Rohrlack, T., and Utkilen, H. (2007). Effects of nutrient and light availability on production of bioactive anabaenopeptins and microviridin by the cyanobacterium Planktothrix agardhii. Hydrobiologia 583, 231–240. doi: 10.1007/s10750-006-0536-y
Sano, T., Usui, T., Ueda, K., Osada, H., and Kaya, K. (2001). Isolation of new protein phosphatase inhibitors from two cyanobacteria species, Planktothrix spp. J. Nat. Prod. 64, 1052–1055. doi: 10.1021/np0005356
Schmidt, J., Shaskus, M., Estenik, J., Oesch, C., Khidekel, R., and Boyer, G. (2013). Variations in the microcystin content of different fish species collected from a eutrophic lake. Toxins 5, 992–1009. doi: 10.3390/toxins5050992
Sheikh-Eldin, M., De Silva, S. S., Anderson, T. A., and Gooley, G. (1995). Physical characteristics, and proximate composition of oocytes, liver and muscle of wild caught and tank-reared Macquarie perch. Aquac. Int. 3, 172–185. doi: 10.1007/BF00118099
Sieroslawska, A., Rymuszka, A., Velisek, J., Pawlik-Skowronska, B., Svobodova, Z., and Skowronski, T. (2012). Effects of microcystin-containing cyanobacterial extract on hematological and biochemical parameters of common carp (Cyprinus carpio L.). Fish Physiol. Biochem. 38, 1159–1167. doi: 10.1007/s10695-011-9601-1
Smith, J. L., and Boyer, G. L. (2009). Standardization of microcystin extraction from fish tissues: a novel internal standard as a surrogate for polar and non-polar variants. Toxicon 53, 238–245. doi: 10.1016/j.toxicon.2008.11.007
Smith, J. L., Boyer, G. L., and Zimba, P. V. (2008). A review of cyanobacterial odorous and bioactive metabolites: impacts and management alternatives in aquaculture. Aquaculture 280, 5–20. doi: 10.1016/j.aquaculture.2008.05.007
Smith, J. L., and Haney, J. F. (2006). Foodweb transfer, accumulation, and depuration of microcystins, a cyanobacterial toxin, in pumpkinseed sunfish (Lepomis gibbosus). Toxicon 48, 580–589. doi: 10.1016/j.toxicon.2006.07.009
Smith, J. L., Schulz, K. L., Zimba, P. V., and Boyer, G. L. (2010). Possible mechanism for the foodweb transfer of covalently bound microcystins. Ecotoxicol. Environ. Saf. 73, 757–761. doi: 10.1016/j.ecoenv.2009.12.003
Soares, R. M., Magalhães, V. F., and Azevedo, S. M. F. O. (2004). Accumulation and depuration of microcystins (cyanobacteria hepatotoxins) in Tilapia rendalli (Cichlidae) under laboratory conditions. Aquat. Toxicol. 70, 1–10. doi: 10.1016/j.aquatox.2004.06.013
Sotton, B., Guillard, J., Anneville, O., Maréchal, M., Savichtcheva, O., and Domaizon, I. (2014). Trophic transfer of microcystins through the lake pelagic food web: evidence for the role of zooplankton as a vector in fish contamination. Sci. Total Environ. 466–467, 152–163. doi: 10.1016/j.scitotenv.2013.07.020
Svirčev, Z., Drobac, D., Tokodi, N., Mijović, B., Codd, G. A., and Meriluoto, J. (2017). Toxicology of microcystins with reference to cases of human intoxications and epidemiological investigations of exposures to cyanobacteria and cyanotoxins. Arch. Toxicol. 91, 621–650. doi: 10.1007/s00204-016-1921-6
Watson, S. B., Monis, P., Baker, P., and Giglio, S. (2016). Biochemistry and genetics of taste- and odor-producing cyanobacteria. Harmful Algae 54, 112–127. doi: 10.1016/j.hal.2015.11.008
Wiegand, C., and Pflugmacher, S. (2005). Ecotoxicological effects of selected cyanobacterial secondary metabolites a short review. Toxicol. Appl. Pharmacol. 203, 201–218. doi: 10.1016/j.taap.2004.11.002
Williams, D. E., Craig, M., Dawe, S. C., Kent, M. L., Andersen, R. J., and Holmes, C. F. (1997a). 14C-labelled microcystin-LR administered to Atlantic salmon via intraperitoneal injection provides in vivo evidence for covalent binding of microcystin-LR in salmon livers. Toxicon 35, 985–989.
Williams, D. E., Dawe, S. C., Kent, M. L., Andersen, R. J., Craig, M., and Holmes, C. F. (1997b). Bioaccumulation and clearance of microcystins from salt water mussels, Mytilus edulis, and in vivo evidence for covalently bound microcystins in mussel tissues. Toxicon 35, 1617–1625.
Wilson, A. E., Gossiaux, D. C., Höök, T. O., Berry, J. P., Landrum, P. F., Dyble, J., et al. (2008). Evaluation of the human health threat associated with the hepatotoxin microcystin in the muscle and liver tissues of yellow perch (Perca flavescens). Can. J. Fish. Aquat. Sci. 65, 1487–1497. doi: 10.1139/F08-067
Wilson, A. E., Sarnelle, O., and Tillmanns, A. R. (2006). Effects of cyanobacterial toxicity and morphology on the population growth of freshwater zooplankton: meta-analyses of laboratory experiments. Limnol. Oceanogr. 51, 1915–1924. doi: 10.4319/lo.2006.51.4.1915
Zhang, D., Deng, X., Xie, P., Chen, J., and Guo, L. (2013a). Risk assessment of microcystins in silver carp (Hypophthalmichthys molitrix) from eight eutrophic lakes in China. Food Chem. 140, 17–21. doi: 10.1016/j.foodchem.2013.01.124
Keywords: cyanobacteria, harmful algal blooms, cyanotoxins, freshwater, fish, human health
Citation: Flores NM, Miller TR and Stockwell JD (2018) A Global Analysis of the Relationship between Concentrations of Microcystins in Water and Fish. Front. Mar. Sci. 5:30. doi: 10.3389/fmars.2018.00030
Received: 11 November 2017; Accepted: 22 January 2018;
Published: 09 February 2018.
Edited by:
Valéria Freitas Magalhães, Universidade Federal do Rio de Janeiro, BrazilReviewed by:
Anna Sieroslawska, The John Paul II Catholic University of Lublin, PolandKonstantinos Ar. Kormas, University of Thessaly, Greece
Copyright © 2018 Flores, Miller and Stockwell. This is an open-access article distributed under the terms of the Creative Commons Attribution License (CC BY). The use, distribution or reproduction in other forums is permitted, provided the original author(s) and the copyright owner are credited and that the original publication in this journal is cited, in accordance with accepted academic practice. No use, distribution or reproduction is permitted which does not comply with these terms.
*Correspondence: Natalie M. Flores, bmF0YWxpZS5mbG9yZXNAdXZtLmVkdQ==
 Natalie M. Flores
 Todd R. Miller
 Jason D. Stockwell