
95% of researchers rate our articles as excellent or good
Learn more about the work of our research integrity team to safeguard the quality of each article we publish.
Find out more
ORIGINAL RESEARCH article
Front. Mar. Sci. , 30 January 2018
Sec. Marine Ecosystem Ecology
Volume 5 - 2018 | https://doi.org/10.3389/fmars.2018.00005
Three plankton collection methods were used to gather plankton samples in the Celtic Sea in October 2016. The Plankton Image Analysis (PIA) system is a high-speed color line scan-based imaging instrument, which continuously pumps water, takes images of the passing particles, and identifies the zooplankton organisms present. We compared and evaluated the performance of the PIA against the Continuous Automatic Litter and Plankton Sampler (CALPS) and the traditional ring net vertical haul. The PIA underestimated species abundance compared to the CALPS and ring net and gave an image of the zooplankton community structure that was different from the other two devices. There was, however, good agreement in the spatial distribution of abundances across the three systems. Our study suggests that the image capture and analysis step rather than the sampling method was responsible for the discrepancies noted between the PIA and the other two datasets. The two most important issues appeared to be differences in sub-sampling between the PIA system and the other two devices, and blurring of specimen features due to limited PIA optical depth of field. A particular advantage of the CALPS over more traditional vertical sampling methods is that it can be integrated within existing multidisciplinary surveys at little extra cost without requiring additional survey time. Additionally, PIA performs automatic image acquisition and it does remove the need to collect physical preserved samples for subsequent analysis in the laboratory. With the help of an expert taxonomist the system in its current form can also integrate the sampling and analysis steps, thus increasing the speed, and reducing the costs for zooplankton sampling in near real-time. Although the system shows some limitation we believe that a revised PIA system will have the potential to become an important element of an integrated zooplankton monitoring program.
In pelagic ecosystems, zooplankton occupy a central position in the food web, often controlling smaller organisms by grazing and providing food for many important larval and adult fish and ultimately seabirds (Pitois et al., 2012; Lauria et al., 2013). Their short life cycle render zooplankton sensitive to environmental changes (Edwards and Richardson, 2004; Beaugrand et al., 2010; Harris and Edwards, 2014; Serranito et al., 2016), and their position in the food chain between primary producer (bottom-up control) and fish (top-down control), make them a prerequisite for an understanding of ecosystem approach to management. Therefore, changes in their abundance, biomass, community, and size structure are important indicators of overall ecosystem health (Gorokhova et al., 2016). Zooplankton, however, have not received the same amount of research attention as the phytoplankton and fish communities within ecosystem studies (Mitra et al., 2014), and thus, our knowledge of their biomass, size composition, and rates of production in many shelf seas remains fragmented. Furthermore, zooplankton are difficult to simulate in ecosystem models and the lack of data hinders calibration of such models.
In Europe, zooplankton are also relevant to the Marine Strategy Framework Directive (MSFD, European Union, 2008). The main objective of this environmental legislature is to ensure that the use of marine resources is compatible with the conservation of ecosystems. To this effect, member States are required to put in place the necessary management measures to achieve Good Environmental Status (GES) in their marine waters by 2020, and establish and implement monitoring programmes to measure progress toward GES. For GES to be achieved, zooplankton must be present and “occur at levels that are within acceptable ranges that will secure their long-term viability and functioning” and the “distribution and abundance of species are in line with prevailing physiographic, geographic, and climatic conditions” (Borja et al., 2013).
The traditional collection of zooplankton samples, using nets followed by taxonomic analysis of the preserved samples using microscopes by a trained specialist, is a labor intensive and time-consuming process (Wiebe and Benfield, 2003; Benfield et al., 2007). It is also error-prone, as working with a microscope for long periods of time can lead to fatigue of the operator (Culverhouse, 2015), with error-rates varying from one taxonomist to the next (Culverhouse et al., 2014). Furthermore, while the number of taxonomic experts has been in decline over the last 50 years, the demand for skilled analysts is now escalating (MacLeod et al., 2010; Culverhouse, 2015). These factors contribute to the limitation of both the availability and quality of zooplankton data and resulting information.
While, there is a need to increase the flow of zooplankton data, resources and budgets for monitoring are always limited. It is therefore desirable to develop cost-efficient methods (Danovaro et al., 2017) and increase the time and space resolution of sampling, by integrating zooplankton monitoring into multipurpose surveys (Shephard et al., 2015). Such methods will need to combine cost effectiveness with quality of scientific data, sufficient to provide effective observational platforms for monitoring the planktonic ecosystem in relation to the environment, and produce the necessary evidence base to support management decisions. The incentive to reduce sample processing time has led to the development of automated plankton imaging systems (Benfield et al., 2007); and in particular, advances over the past decade in computer-based identification mean that some classes of identification are now possible with no or little human operator intervention in routine analysis (Culverhouse, 2015; Uusitalo et al., 2016). Such systems include the Zooscan digital imaging system (www.hydroptic.com), based on image analysis and pattern recognition methods to count, measure, and classify zooplanktonic organisms (Grosjean et al., 2004; Gorsky et al., 2010; Vandromme et al., 2012). However, the ZooSCAN uses a flatbed scanner to digitalize fixed wet net samples, and as such cannot be used on a moving vessel. A more recent system has been developed by Fluid Imaging Technologies Inc. (www.fluidimaging.com) that allows continuous imaging technology: the FlowCAM® Macro (Le Bourg et al., 2015). However, this tool is limited by a flow rate of 750 ml/min. Such a low rate of sampling it is neither appropriate for use underway over large spatial scales, or adequate for counts of low abundance planktonic classes (e.g., Wong et al., 2017), and would lead to high statistical error associated with the abundance results. Deployable and towed instruments exist that can collect and identify in-situ images of plankton. Examples of such system comprise the VPR (Davis et al., 1992), SIPPER (Remsen et al., 2004), ISIIS (Cowen and Guigand, 2008), and UVP (Stemmann et al., 2008). However, these cannot be operated in all sea conditions and their operation is labor intensive, thus preventing their routine use as part of a low-cost routine integrated monitoring program. At the same time, the incentive to integrate sampling of zooplankton as part of integrated monitoring program has led to the development of automated sampling systems, such as the Continuous Underway Fish Eggs Sampler (CUFES, Checkley et al., 1997) and the Continuous Automated Litter and Plankton Sampler (CALPS, Pitois et al., 2016). Both systems operate continuously and under nearly all sea conditions, providing estimates of the volumetric abundance of particles at pump depth, and are thus particularly suitable for assessing aggregated distributions. However, both sample collection and processing are labor intensive tasks, and in order to optimize the acquisition of zooplankton information, there is a need to develop a method capable of integrating both tasks into an all-in-one set-up. The Linescan Zooplankton Analyser-Plankton Image Analyser (LiZA-PIA) system (Culverhouse et al., 2015) was developed with this in mind and was able to deliver autonomously acquired and processed data, in or near real-time, so that data are immediately available without the need for significant amounts of post-cruise sample processing and analysis. A new machine, known as the Plankton Image Analyser (PIA) has been designed to improve imaging quality and water flow rates when compared to the LiZA-PIA instrument. These improvements are described in the Materials and Methods section.
Our main objective is to evaluate the routine use of the PIA system, as part of an integrated monitoring programme. The system should be able to provide robust scientific data for the study of the mesozooplankton component of planktonic ecosystems, and the evidence base to support management decisions. For this purpose, we aim to follow-up from our previous study on the comparison between the CALPS and widely used method of vertical haul using a ring net at a single point location (Pitois et al., 2016). Specifically, we aim to:
(i) Compare, characterize and evaluate the performance of the PIA system against another underway semi-automatic system (CALPS, Pitois et al., 2016), and the traditional ring net deployed vertically at a single point location, in term of sampling efficiency and selectivity.
(ii) Carry out the same comparison between the data obtained from the CALPS and those obtained from the ring net, to validate the results obtained in our previous study (Pitois et al., 2016).
The abundances of zooplankton collected from the CALPS and the PIA were compared with data collected with a ring net hauled from the seabed to the surface during the PELTIC 2016 survey (PELagic ecosystem in the western English Channel and eastern CelTIC Sea, ICES, 2015). This was one of five integrated yearly monitoring surveys (2012–2016) conducted during the autumn. PELTIC 2016 was carried out from the 3rd to the 19th October on board the RV “Cefas Endeavour.” Zooplankton samples and images were collected at 40 stations during night time (Figure 1). All data collected from the three devices are freely available from the Cefas Data Hub (accession number doi: 10.14466/CefasDataHub.35).
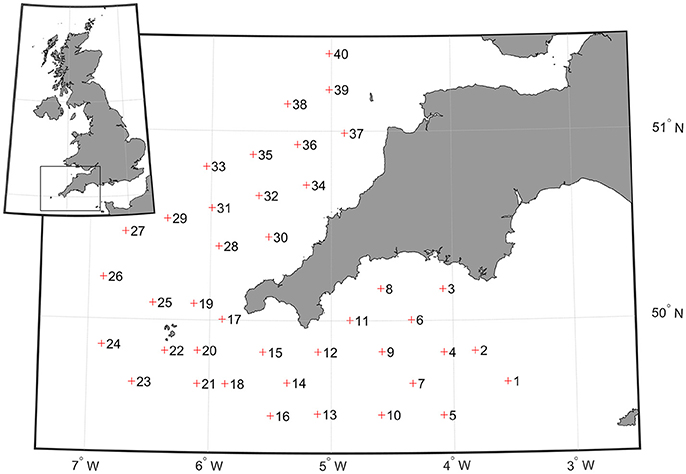
Figure 1. Location of the 40 points where zooplankton were sampled using both ring net vertical deployment and CALPS, and images were collected using the PIA.
Depth-integrated vertical hauls were made at the 40 stations, with the aim of sampling from 3 m above the seabed to the surface. Due to the absence of real time depth information, to attempt to achieve this the amount of cable used was 3 m less than the water depth. During periods of slack water this was relatively successful, but due to the strong tides at certain times and locations, some samples did not sample the full water column. An 80-μm-mesh net was used, mounted on a 0.5 m-diameter ring frame equipped with a General Oceanics mechanical flowmeter (model 2030RC, which includes a mechanism to prevent the rotor from turning backwards) mounted in the center of the aperture of the net. A mini-CTD (SAIV) was attached to the bridle recording pressure (depth), temperature, and salinity. The mesh size was chosen to reliably sample many of the smaller copepod species that are important grazers; it did not show any sign of clogging throughout the survey. The net was hauled to the surface at a speed of 0.5 m/s. This resulted in a volume filtered ranging from 8.03 to 61.25 m3 per sample. The net was washed down and the end bag thoroughly rinsed with sea water before preserving the sample in 4% formaldehyde. Position, date, time, seabed depth, and sampled depth (from CTD attached to net) were recorded and the volume filtered was calculated from the flowmeter readings.
The CALPS consists of a pump system and additional elements fitted onto the research vessel. The additional elements include a water inlet of 20 cm diameter, a flowmeter, six-cylinder traps, and associated valves and level detectors to prevent overflowing (Figure 2). When activated, the system pumps sea water from a depth of 4 m at rates of ~40 L/min and distributes the water into one or more of the six possible traps. Each trap consists of a PVC cylinder (height: 73.3 cm, diameter: 28.0 cm) containing a plankton net (length 66.0 cm and diameter 26.5 cm) of chosen mesh size. During the current survey, the samples were filtered through an 80-μm-mesh net, identical to that of the ring net. The volume of water filtered was measured with an electronic flowmeter, so that zooplankton abundance (m−3) could be determined for each sample. The CALPS system had to run for at least an hour to obtain a sufficiently large plankton sample for comparison with the deployment of the vertical ring net. To achieve this without delaying vessel operations, sampling started while steaming at a fixed vessel speed of 10 knots, 20 min before arrival at the ring net station, continued during the deployment of the ring net at station (~20 min), and was stopped 20 min after leaving the station at 10 knots vessel speed. The starting time and position, as well as end time, position, and volume filtered were recorded for each station, the latter ranging from 1.9 to 2.6 m3 of seawater filtered per sample.
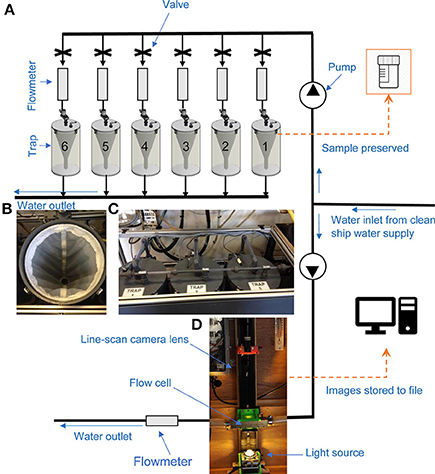
Figure 2. Illustration showing the setup of the Continuous Automated Litter and Plankton Sampler (CALPS) and Plankton Image Analyser (PIA) on-board RV Cefas Endeavour during the PELTIC 2016 survey. (A) Schematic illustration of the CALPS system. (B) Photograph of the plankton net inside each trap on the trap system (C) from (A). (D) Photograph of the PIA system.
Samples collected with the ring net and CALPS system were analyzed using the Zooscan Imaging system (Hydroptic v2.0). The samples preserved in 4% formaldehyde solution were first rinsed with deionized water. When high densities of zooplankton were present, sub-sampling was applied using a Folsom splitter, with the aim to include between 800 and 1200 objects, thus maximizing sample size while reducing the risk of specimens overlapping. The subsampling ensured that a minimum of 200 zooplankton were identified. The sub-sample was then poured into the scanning cell and overlapping objects were separated using needles. The scanned image was processed using the Zooprocess and Plankton Identifier software (Grosjean et al., 2004; Gorsky et al., 2010). A learning set based on a subset of vignettes from plankton samples collected during the current and previous years' surveys was used to automatically categorize the specimens into different taxonomic groups. Finally, an expert taxonomist manually validated the classifications. A series of metrics including size were automatically exported. A total of 33 taxonomic groupings were identified across all samples. Calanoid and cyclopoid copepods were identified as far as possible to genus level. The exception was the Para-pseudocalanus taxonomic group, which also included all species of Paracalanus, Pseudocalanus, Ctenocalanus, Clausocalanus, and Microcalanus. These genera could not consistently be distinguished and separated from the vignettes.
The PIA is a high-speed color line scan-based imaging instrument; Figure 2 illustrates its setup on RV Cefas Endeavour during the 2016 PELTIC survey. The flow cell is 25 mm brass tube that has two quartz optical windows halfway along its length. The flow cell at the windows is square, with the same cross-sectional area as the 25 mm tube. A Basler 2048-70kc camera, sampling at 70 K lines per second, images the water running through the flow cell. The flow rate is monitored by a Bell electro-magnetic flow meter and set to 34–40 L/min. Color images are captured using an EPIX E4 frame store. Image processing is as described in Culverhouse et al. (2015). Essentially, RGB composite images are constructed by joining consecutive lines together, thresholding and extracting a region of interest ROI, or vignette, that is saved to hard drive as a TIF file. Each TIF image is time-stamped and named in the Zooscan convention of date+imageID.tif. Raw images are stored to maximize dynamic range of the captured particles. These are converted to 8-bit resolution through a process of scaling and conversion from 12 to 8 bit resolution, for viewing and for subsequent processing. The PIA was in operation continuously throughout the survey and thus acquiring images of all particles passing through the flow-cell. For the purpose of consistency, the PIA was operated at the same time as the CALPS, and from the same pumped clean water supply, thus providing zooplankton information on the same body of water. In order to reproduce the sub-sampling procedure used for physical samples (as collected with the CALPS and ring net), two thousand images, were randomly selected as a subsample (each sample contained between 3,300 and over 200,000 images of particles, see Supplementary Material for details), analyzed with the PIA for taxonomic data and then identified and validated by an expert taxonomist manually (also providing a new source of training data for future use by the machine learning PIA image recognition algorithm). Three of the 40 stations had to be removed from the analysis because of high numbers of bubbles passing through the PIA system and hindering the capture of zooplankton images; 37 data points and associated datasets were therefore used for comparison with the ring net and CALPS devices. For convenience of analysis, the same taxonomic groupings were used throughout. These were defined by routine Zooscan analysis (Grosjean et al., 2004; Gorsky et al., 2010). Although PIA is capable of automatic classification of the image data, insufficient color image training data were available at the time. Consequently, the PIA just provided automatic image taking, generated and stored vignettes, and extracted taxonomic features (such as Equivalent Spherical Diameter) for statistical analysis off-line.
Abundance values (numbers per m3) were transformed (log10(x + 1)) to reduce the asymmetry of the data. To test for differences among abundances resulting from three gear types, the transformed abundances of the dominant taxa (i.e., those contributing to at least 1% of the total zooplankton abundance) and total zooplankton, at each sampling location, were plotted and compared visually. To enable a taxon-by-taxon comparison of the abundances collected by each device and with each other, the ratios of abundances CALPS:PIA, RingNet:PIA, and RingNet:CALPS for these dominant taxa were calculated for each station with positive abundances for the three datasets. For each set of comparisons, an overall mean ratio was also calculated with associated standard deviation. From then on, we will use these three symbols (i.e., CALPS:PIA, RingNet:PIA, and RingNet:CALPS) to refer to ratios of abundance between two specific devices.
To test for differences in the raw, non-normally distributed abundance values from the three gear types at each station, the non-parametric Wilcoxon Signed Rank test was used (Wilcoxon, 1945). Correlation coefficients were calculated on log10(x + 1) abundance data to determine which taxa were displaying good synchrony across the 40 sampling locations. The Pearson's coefficient was selected, assuming that zooplankton abundances collected by two different devices with different catchabilities increase or decrease in the same direction and at the same rate, therefore linearly, under ideal conditions (i.e., plankton homogeneously distributed in the water).
Bray–Curtis similarity coefficients between individual sample estimates of log10(x + 1) transformed species abundance and species composition (proportion contributed by each taxon to total abundance) were calculated using the PRIMER-7 software (Plymouth Routines In Multivariate Ecological Research, Clarke and Warwick, 1994). Analyses of similarities (ANOSIM, SIMPER) were performed to test for differences between all samples both the two gears under comparison with respect to species abundance and composition, and multi-dimensional scaling (MDS) plots were produced for the species composition similarity matrices.
The most abundant taxa recorded from the PIA were, in decreasing order, Unidentified copepods, Para/pseudocalanus spp. doliolids, Calanus spp. copepod nauplii, Centropages spp. Radiolaria, Corycaeus spp. Oithona spp. and Acartia spp. altogether representing 96.4% of the total abundance. Figure 3 shows a range of examples of image captured using the PIA on this survey.
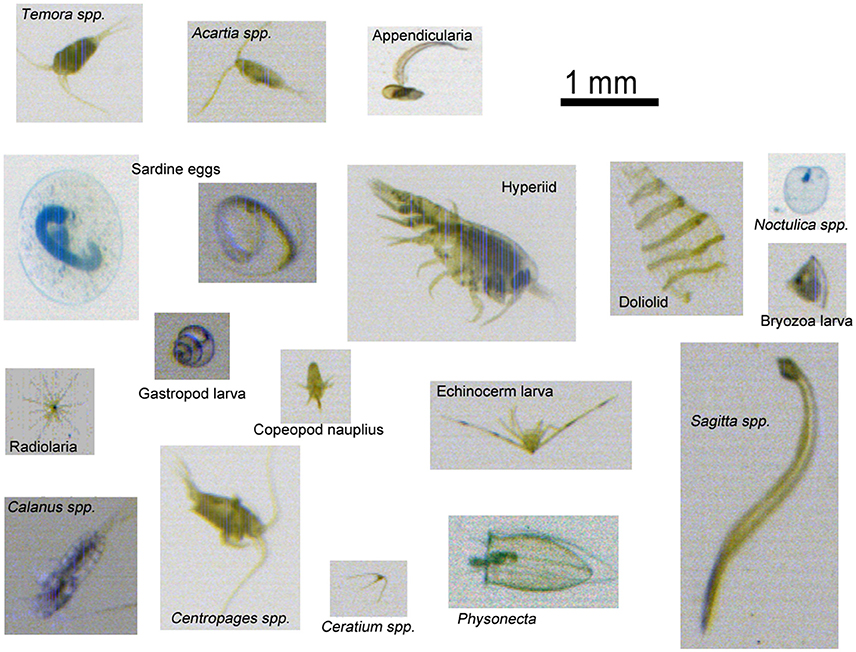
Figure 3. Images of plankton taken using the PIA during the survey. Particles imaged in the water flow are sized prior to storage, with particles smaller than 240 μm being rejected.
The most abundant taxa recorded from ring net sampling were, in decreasing order, Para/pseudocalanus spp. bivalve larvae, Oithona spp. unidentified copepods, doliolids, Oncaea spp. gastropod larvae, copepod nauplii, appendicularia, Calanus spp. Corycaeus spp. Centropages spp. chaetognatha, Acartia spp. and harpacticoid copepods, altogether representing 96.8% of the total zooplankton abundance. The most abundant taxa recorded from the CALPS were, in decreasing order, Para/pseudocalanus spp. unidentified copepods, Oithona spp. copepod nauplii, bivalve larvae, Centropages spp. Oncaea spp. Corycaeus spp. Calanus spp. gastropod larvae, Acartia spp. harpacticoid copepods, and doliolids, altogether representing 96.6% of the total zooplankton abundance (Table 1 for full details).
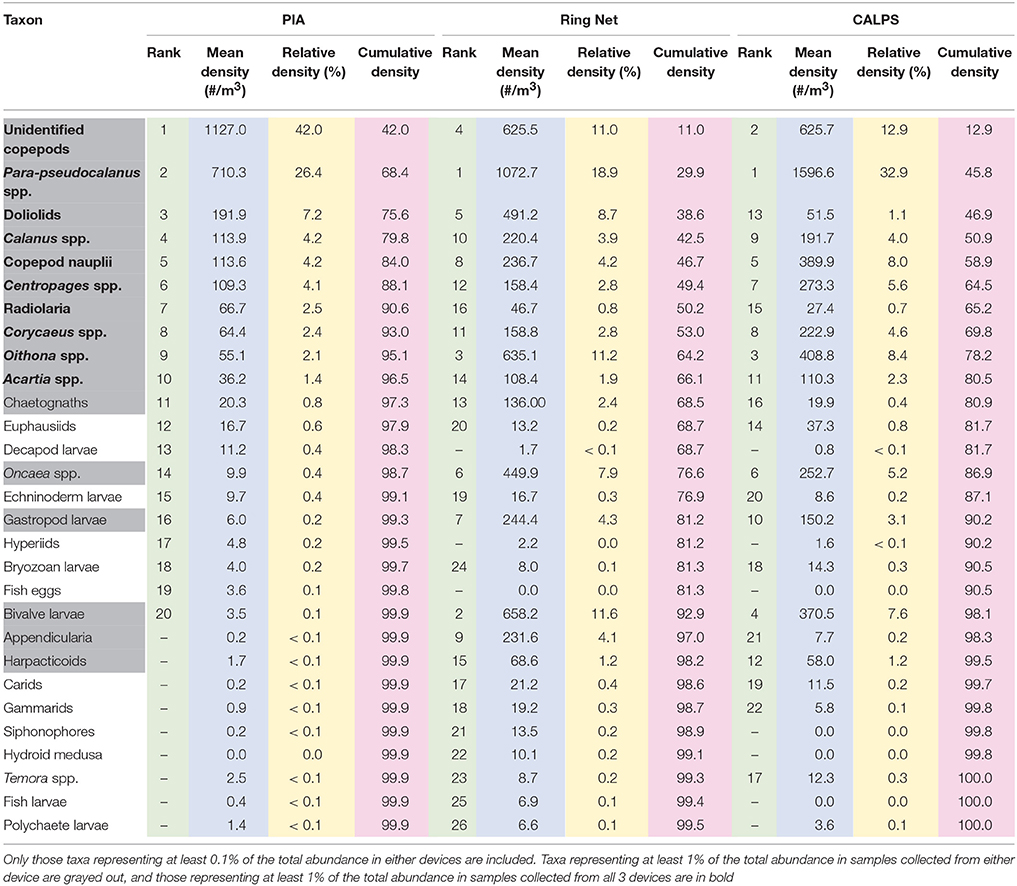
Table 1. Average abundances and proportions of taxa collected by the PIA, CALPS, and Ring Net, across all stations.
Unidentified copepods, Para-pseudocalanus spp. doliolids, Calanus spp. copepod nauplii, Centropages spp. Corycaeus spp. Oithona spp. and Acartia spp. all contributed at least 1% of the total zooplankton abundance recorded with each device. Differences were noted for radiolaria (>1% contribution in PIA dataset only); chaetognatha, appendicularia (>1% contribution in ring net dataset only), Oncaea spp. harpacticoid copepods, and gastropod and bivalve larvae (>1% contribution in ring net and CALPS datasets). The most striking differences, in terms of relative densities, were for Oncaea spp. harpacticoid copepods, and gastropod and bivalve larvae. These four taxa, seemingly well-sampled by the ring net and CALPS devices, were not well-represented in the PIA dataset; while appendicularia and chaetognatha were well-recorded from the ring net but neither from the PIA or CALPS devices. Unidentified copepods and radiolaria were the only two taxonomic groups that were on average more abundant in the PIA dataset than in the ring net or CALPS, while doliolids were slightly more abundant in the PIA than the CALPS but their number was much higher in ring net samples (Table 1).
Differences in total abundance were apparent between the three devices (Figure 4). While there did not seem to be any tendency for increased overall catchability by the ring net compared to the CALPS (out of 40, 22 stations showed higher total zooplankton abundance recorded by the ring net), it is clear that the PIA recorded lower abundances of zooplankton than the ring net and CALPS at most stations (i.e., 31 and 36 out of 37 respectively, Figures 4B,E). This is reflected in the total zooplankton abundances recorded from the ring net which were on average 1.34 higher than those recorded from the CALPS and 3.15 higher than those recorded from the PIA; while these were 2.39 higher from the CALPS compared to the PIA (Table 2).
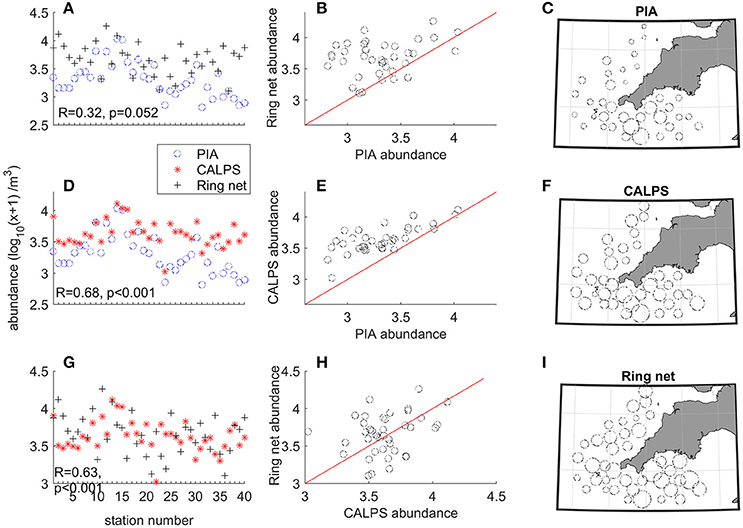
Figure 4. Comparison of the total zooplankton abundances recorded by the PIA, CALPS, and ring net sampling devices. Column 1: Total zooplankton abundance [individuals m−3, with log10 (x + 1) transformation] at all stations for (A) PIA and ring net; (D) PIA and CALPS; and (G) CALPS and ring net. Column 2: Total zooplankton abundance for one gear vs. another one, with red line representing Gear 1 = Gear 2. (B) ring net vs. PIA, (E) CALPS vs. PIA, and (H) ring net vs. CALPS. Column 3: distribution of total zooplankton collected with (C) PIA, (F) CALPS, and (I) ring net, at all stations plotted using the same scale.
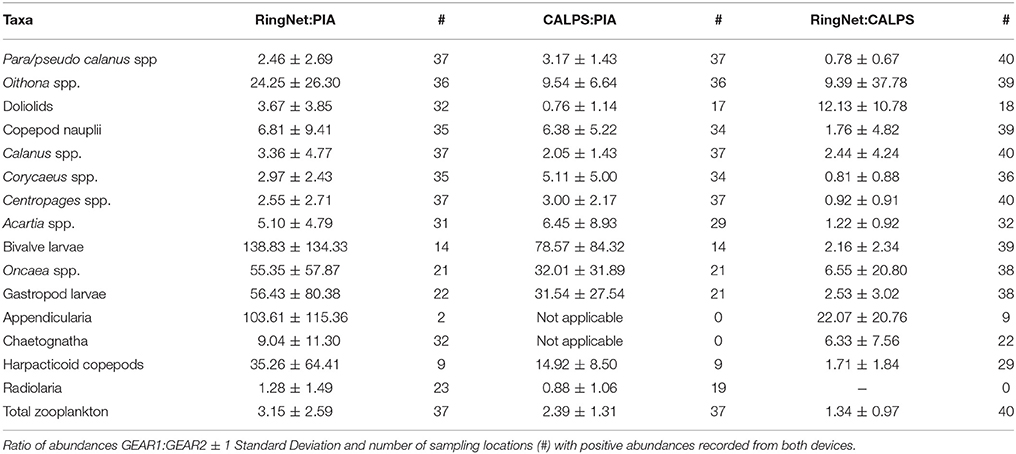
Table 2. Comparison of the abundances of the main zooplankton taxa collected from the PIA, CALPS, and ring net devices.
Taxon-specific ratios of abundance RingNet:CALPS, RingNet:PIA, and CALPS:PIA were also calculated for the dominant taxa, and these were highly variable in the three comparisons. RingNet:CALPS ratios varied between 0.78 for Para-pseudocalanus spp. and 22.07 for appendicularia, RingNet:PIA between 1.28 for radiolaria and 138.83 for bivalve larvae, and CALPS:PIA ranged from 0.76 for doliolids and 78.57 for bivalve larvae (Table 2, also see Supplementary Material for taxon specific values at each station). The largest discrepancies were recorded for bivalve and gastropod larvae with RingNet:PIA and CALPS:PIA (ranging from 31.54 to 138.83), while RingNet:CALPS ratios were low and around two for both taxa. A similar pattern was seen for harpacticoid copepods (i.e., high RingNet:PIA and CALPS:PIA of 35.26 and 14.92 respectively combined with low RingNet:CALPS ratio of 1.71) and to a lesser extent, for copepod nauplii (RingNet:PIA = 6.81, CALPS:PIA = 6.38, RingNet:CALPS = 1.76). Oncaea spp. and Oithona spp. were poorly captured by the CALPS and PIA compared to the ring net, but the effect was more pronounced for the PIA (RingNet:PIA = 55.35 and 24.25, CALPS:PIA = 32.01, and 9.54, RingNet:CALPS = 6.55 and 9.39 respectively). Appendicularia and chaetognath were poorly recorded by both the PIA and CALPS compared to the ring net (RingNet:PIA = 103.61 and 9.04, RingNet:CALPS = 22.07 and 6.33 respectively).
Absolute abundances were variable between the three datasets, but differences between the three systems were not consistent. In the case of ring net vs. CALPS datasets, analysis of paired zooplankton counts obtained from the two devices revealed significant differences (Wilcoxon test: P < 0.05) for over half of the taxonomic groups, while correlation coefficients above 0.5 suggest that relationships exist between the variability of zooplankton recorded by the two sampling devices. Even if over half of the taxonomic groups in Table 3 show significant positive relationships, only six of these showed no significant difference between the datasets from both devices. A one-way ANOSIM analysis showed that although sample similarities between individual taxa abundance from the CALPS and ring net groups were different to sample similarities within groups, these differences were small (R = 0.337, P = 0.001). Analysis of paired zooplankton counts obtained from the PIA vs. RingNet and PIA vs. CALPS revealed significant differences for all taxonomic groups, except for radiolaria in the case of PIA vs. ring net. When it comes to relationships between the variability of zooplankton recorded by two devices, 9 taxa out of 14, and 6 out of 16, showed such positive relationship between the PIA and CALPS and PIA and ring net respectively (Table 3). These results suggest that, in the case of PIA vs. CALPS, even if significant differences of absolute abundances exist between the two datasets, these generally follow a similar variability across stations. A one-way ANOSIM analysis confirmed the above results showing significant differences between the two groups that were higher for PIA vs. ring net (R = 0.842, P = 0.001) than CALPS vs. PIA (R = 0.731, P = 0.001). We performed a SIMPER analysis to test for the contribution of each taxonomic group to the dissimilarities in abundance obtained from the different gears. The results supported the ANOSIM and showed that the noted differences were mostly due (in decreasing order) to differences in the abundance levels of appendicularia, bivalve larvae, Oncaea spp. gastropod larvae (PIA vs. ring net); and of bivalve larvae, Oncaea spp. gastropod larvae, doliolids (PIA vs. CALPS).
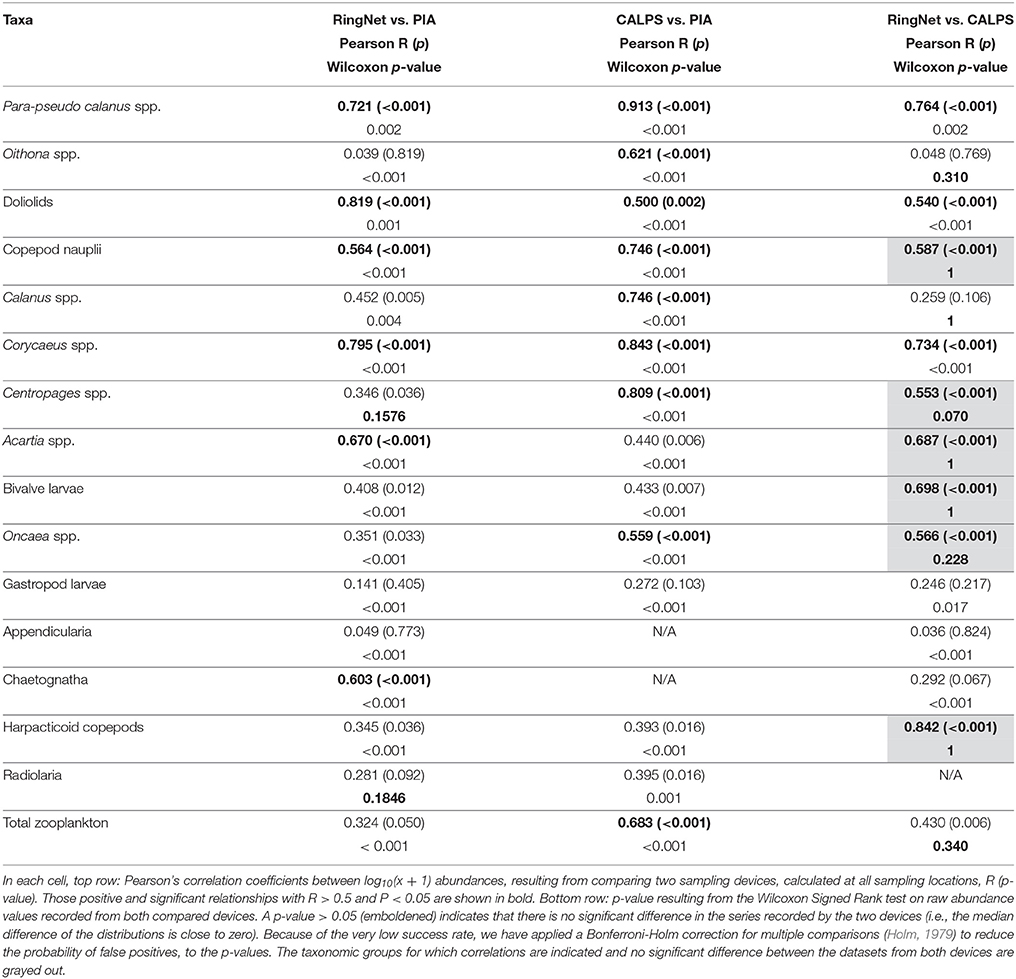
Table 3. Relationships between the abundances of the main zooplankton taxa collected from the PIA, CALPS, and ring net devices.
To test whether water column depth affected the sample size and the abundance of the organisms collected by the PIA and CALPS compared to the ring net, we looked at the relationships between depth and volume filtered as well as with species-specific RingNet:CALPS and RingNet:PIA ratios (Figure 5). Pearson's correlations were also calculated. A weak and significantly positive relationship was found between depth sampled and volume filtered (R = 0.47, P = 0.003), and weak but significant negative relationships were found between depth and total zooplankton abundance ratios (i.e., RingNet:PIA: R = −0.56, p < 0.001; RingNet:CALPS: R = −0.40, p = 0.01), suggesting that as the depth sampled and sample size increased, the differences in abundances from the ring net and either of the CALPS or PIA decreases, or that zooplankton tended to be located closer to the surface at the time of sampling.
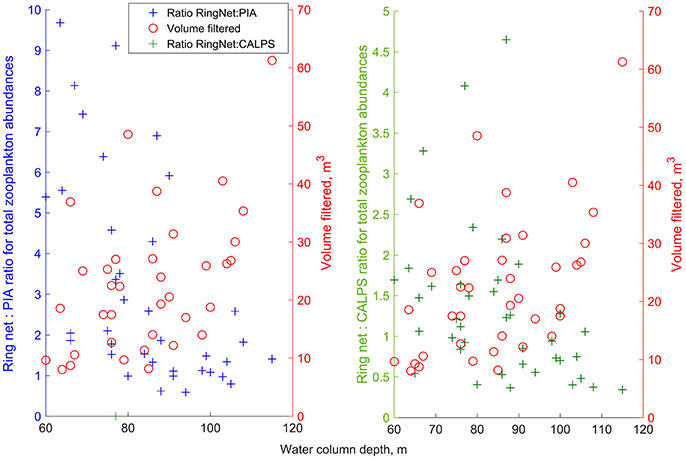
Figure 5. RingNet:PIA and RingNet:CALPS ratios for the total abundance of zooplankton and volume filtered by the ring net as a function of depth of the water column sampled at all data points. Abundance ratios at each station were calculated as described in the Materials and methods part, and are available in the Supplementary Material.
The MDS analysis performed on the similarity matrices of relative abundances for the ring net and CALPS devices and associated plot (Figure 6A) showed no obvious separation of similarity coefficients. Combined with the results from a one-way ANOSIM analysis (Global R = 0.201, P = 0.1), this suggest that although differences in absolute zooplankton abundances were noticeable between the two datasets, the taxonomic groups captured by each device were similar. In the other two comparisons (i.e., PIA vs. CALPS and PIA vs. ring net), the same MDS analysis (Figures 6B,C) showed some obvious separation of similarity coefficients. As evidenced by the ANOSIM analysis, this separation was only slightly higher for ring net vs. PIA (Global R = 0.754, P < 0.001, Figure 6C) than for CALPS vs. PIA (Global R = 0.695, P < 0.001, Figure 6C). This suggests that the picture of the zooplankton community from data collected by the PIA is different than that from the ring net and CALPS devices.
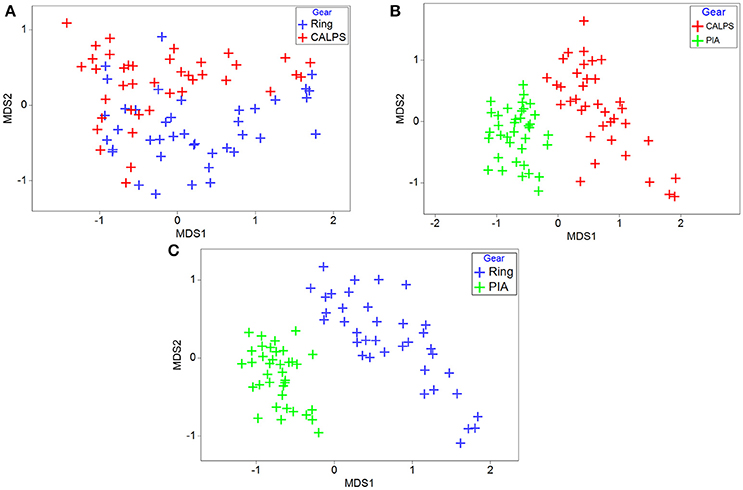
Figure 6. Differences in zooplankton community structure between ring Net, CALPS, and PIA datasets. Relative abundances contributed by individual taxa to total abundance from samples taken with the ring net, CALPS and PIA. Non-metric MDS scatter plot of all samples collected with two gears based on the rank order of sample similarities. (A) CALPS vs. ring net, (B) PIA vs. CALPS, (C) PIA vs. ring net.
The above results showed that the PIA recorded lower total zooplankton abundances than the ring net and the CALPS. These were mostly due to the poor efficiency of the PIA at capturing bivalve and gastropod larvae and to a lesser extent, harpacticoid copepods and copepod nauplii. The small cyclopoids copepods Oithona spp. and Oncaea spp. were poorly captured by the PIA and the CALPS, but this effect was more pronounced for the PIA. Appendicularia and chaetognaths were almost absent in both the CALPS and the PIA samples. While the taxonomic communities recorded by the CALPS and ring net were similar, differences were noticeable between the PIA and CALPS and even more so between the PIA and ring net. In the following sections, we are trying to identify and explain the sources of such differences.
We have replicated the comparative study of zooplankton information collected by the CALPS and ring net gears performed using the previous PELTIC survey of 2014 (Pitois et al., 2016). Both sets of results showed that the CALPS and ring net datasets illustrate a similar zooplankton community, and the spatial distribution of the total zooplankton abundance estimated with the two sampling methods is also similar (Figure 4). There were, however, some clear differences between the results obtained in 2014 (previous study, Pitois et al., 2016) and 2016 (present study); notably in the taxonomic groups recorded. Para-pseudocalanus spp. Acartia spp. harpacticoids copepods and nauplii were much less abundant in 2016 compared with 2014, whereas Oncaea spp. bivalve larvae, doliolids, appendicularia, and Calanus spp. seemed to be more abundant in 2016. Such inter-annual differences in community composition is bound to have impacted on the results of our comparison because gear selectivity is species specific; and this could have resulted in the slightly stronger “gear effect” in 2016, as illustrated by the MDS and ANOSIM analysis of community structure. This selectivity is evidenced by the range of RingNet:CALPS ratios varying between 0.78 for Para-pseudocalanus spp. and 22.07 for appendicularia. However, these species-specific ratios of abundances were mostly similar and/or remained within their standard error in 2014 and 2016. The only exception is for Oithona spp. which displayed a high variability in 2016 (Table 2 of this study and Table 1 in Pitois et al., 2016).
The spatial distribution of the total zooplankton abundance estimated with the three sampling methods was similar, with higher densities generally recorded in the southern area (Figure 4). There was good agreement in abundance series recorded by the three devices for most individual taxa, with 9 taxonomic groups, representing at least 1% of the total zooplankton abundance, common to all three datasets (Table 1). However, the abundance and rank of the taxa sampled differed from one dataset to the other, and densities recorded by the ring net and CALPS were clearly higher than those recorded by the PIA (Figure 4).
Overall, larger differences were found between the PIA and the ring net than between PIA and the CALPS: There were 9 out of 15 taxa specific significant positive relationships (Pearson's correlations) between the PIA and CALPS, and only 6 out of 17 between the PIA and ring net (Table 3). However, the Wilcoxon test showed substantial differences in the absolute abundances recorded by the PIA compared to the other two devices, but a less so between the time-series recorded by the CALPS and ring net devices. This emphasizes the lower capture efficiency of the PIA compared to the other two devices, but the similarity in the PIA and CALPS sampling designs leading to similar variabilities of the series recorded by these two gears (i.e., they sampled the same water mass). While the data from the ring net and CALPS resulted in a similar picture of the zooplankton community sampled, the data from the PIA led to a community structure difference to that of either the CALPS and ring net datasets (Figure 6).
There are several factors that could be responsible for the observed dissimilarities. Factors such as spatial area sampled, depth sampled, volume filtered, sampler and associated sampler design, were previously discussed in detail in our comparative study between CALPS and ring net sampling (Pitois et al., 2016). To summarize, we discussed the effects of horizontal integration of samples over the distance covered by the ship in 1-h of sampling (i.e., ~7 nautical miles) compared to a single stationary point and concluded that this was unlikely to affect substantially the composition of the zooplankton community. The effect of vertical integration of sample using a ring net, was also expected to be minimal because we sampled at night when the zooplankton tends to rise toward the surface. Currents associated with tides and weather tend to pull the ring net frame away from the ship as it is lowered, resulting in variable volumes of water filtered by the net, especially in deeper waters and/or high winds. Furthermore, an added potential issue is the accuracy of flowmeters when the net is not stable in the water. Regarding the sampler and associated sampling design, we explained how filtration pressure, and associated extrusion, was potentially higher on the ring net compared to the CALPS, due to higher volumes of water filtered over shorter periods of time. However, none of the effects associated with extrusion were observed (i.e., in ring net we would expect: reduced abundances of smaller organisms, truncation toward the lower end of size spectra, consistent across taxa, and poorer condition of organisms). Finally, we explained how passive and active avoidance of the CALPS inlet (and that of the PIA) was likely to be the main factor responsible for the observed difference in sampling efficiency. Avoidance results from hydrodynamic effects associated with the bow wave created by the ship as it travels, the smaller aperture of the water inlet for the CALPS (and the PIA) compared to the opening of the ring net.
These factors only apply to the comparison ring net sampling with either of the other two surface sampling devices. Because the CALPS and PIA were operated at the same time and pumped water from the same water inlet at a similar flow rate, it is fair to say that these two systems sampled the same body of water and can be regarded as replicates. It is possible that the exact arrangement of the pumped water supply, to PIA and CALPS, could favor CALPS with more zooplankton, although the mechanism is not known. A probable potential difference lies at the enumeration step. CALPS and ring net showed similar catchability and a similar image of the zooplankton community sampled, and samples collected with these two gears were all analyzed using the Zooscan method, while the CALPS and PIA use the same sampling method. This suggests that the large discrepancies between PIA and the other two datasets are caused at the image capture and analysis step rather than the sampling method. There are several possible reasons for these discrepancies: sub-sampling differences, the depth of field of the PIA camera system, the limit of detection of camera system and the orientation of particles within flow cell.
It is known that the manual identification process of sub-sampling can over-estimate abundances (Longhurst and Seibert, 1967). Using the present data on average samples processed manually and using PIA, the CALPS sub-sampled-reported abundances were approximately twice those reported by PIA analysis (Total zooplankton abundance in ring net: 5674 individual m−3, CALPS: 4726 m−3, and PIA: 2682 m−3). This is consistent with reports in the literature. For example, previous work showed that sub-sample replicates using Zooscan gave total abundances between 1457 to 3259 across 16 replicates using a Motoda splitter (Figure 5 in Grosjean et al., 2004), while specimen density variations, when using a sub-sampling splitter, can give rise to a factor of two or more difference in abundances between machine calculated abundance and a manual calculation (Table 1 in Culverhouse et al., 2016). In this study, a sub-sample threshold of at least 200 zooplankton identified was set, to ensure consistency with microscope analysis. This threshold was selected as a pragmatic balance between time for the analyses and error introduced. We also note that the same value is used in long standing existing protocols. Larger subsamples would have required more time spent on validation and was prohibitively time consuming. As the system develops, larger subsamples will be possible.
The limited depth of field of the PIA camera system blurs some specimens such they are unrecognizable. This is due, in part, to the white light LED array light source not being collimated, since collimation reveals the individual LED elements in the array. A trade-off was made during the design, to maximize flow-rate at cost of focus, as it was deemed acceptable for much of the mesozooplankton size range (0.2–20 mm). This has impacted on the ecological analysis of smaller mesozooplankton. At times, passing particles are so blurred that they appear as “blobs” and their identification is not possible (Figure 7). These are classified as “non-biota,” and could explain the lower capture efficiency of the PIA compared to the Zooscan system and thus the other two devices, where organisms are laid flat on a scanner and where camera focus is not an issue. This physical effect on sample quality affected about 10% of the images from PIA samples (estimated by manual inspection of one 24-h period of samples during the cruise). Because the impact of blurring affects taxonomic groups differently on how well they can be taxonomically identified, this ultimately can have a large impact on the absolute and distribution of many taxa. It is thought that the smaller specimens will suffer greater ambiguity of identification than others, since the taxonomic features that can be seen through stereo microscopy will not be available in the optically blurred specimens. Indeed, our study shows that the smallest organisms, such as bivalve and gastropod larvae were the most poorly captured by the PIA. Other small copepods (i.e., harpacticoids, nauplii, Oncaea spp. and Oithona spp.) were also poorly captured by the PIA. Organisms with regular shapes and/or few distinguishable features (bivalve and gastropod larvae, Figure 3) seemed to be particularly affected because the difficulty of identifying a blurred object of regular shape, whose image quickly become “blobs.” Whereas small organisms with distinguishable features such as the copepod nauplii become unidentifiable in the more extreme out-of-focus cases, and the other small copepods are likely to still be recognized at the higher taxonomic level as “unidentified copepod.” This explains the higher number of “unidentified copepod” taxonomic group captured by the PIA. At the same time, the distinctive features of the radiolaria (Figure 3), which remain apparent on blurred images, make them one of the easiest organisms to identify, explaining why these were the only identified organisms that were equally well-sampled by the PIA compared to the ring net. Oncaea spp. and Oithona spp. were poorly captured by both the CALPS and PIA compared to the ring net, but the effect was more pronounced for the PIA, this is likely to be a consequence of both a difference of catchability between vertical and surface samplers as reported in our previous study (Pitois et al., 2016) as well as the PIA's inefficiency. Appendicularia and chaetognaths were poorly recorded by both the PIA and CALPS compared to the ring net. Appendicularia are very fragile organisms and likely to be damaged beyond recognition by the pump system, as reported in our previous study (Pitois et al., 2016) and others comparing pump systems with ring net deployment (Møhlenberg, 1987); while chaetognaths (Figure 3) are active swimmers likely to be able to avoid the pump intake (Dixon and Robertson, 1986; Pitois et al., 2016). Doliolids (Figure 3) were still numerous in the PIA and CALPS but much less so than in the ring net dataset. It is thought that these gelatinous organisms are also damaged by the pump system as was evidenced by the images recorded. As a rule, we only counted those specimen that were at least 50% whole. Gelatinous species are also known to be damaged by the formaldehyde preservative, and such damage is likely to be accentuated on animals that are already pump-damaged; thus, explaining the lower number of doliolids in the CALPS samples compared to the PIA.
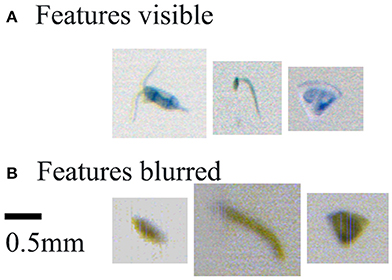
Figure 7. PIA images of specimens of similar size, but with features used for class identification (A) Features visible: from left to right, Paracalanus/Pseudocalanus, appendicularia, and bryozoan. (B) Features blurred: for images that lack distinguishing features, the taxonomist observes the triangular object, although bryozoan-looking, is most likely detritus as the internal structures cannot be seen.
The taxa that were the most poorly captured by the PIA system also happened to form an important component of the zooplankton communities sampled by the ring net and CALPS devices i.e., bivalve (11.6% contribution to total zooplankton abundance in ring net samples) and gastropod larvae (4.31% contribution), Oncaea spp. (7.93% contribution), and appendicularia (4.08% contribution), and were also mostly responsible for the differences in recorded absolute abundances. This confirms that discrepancies at the analysis step rather than the sampling method that is responsible for the differences noted in this study between the PIA and the other two devices.
The PIA had a processing limitation that resulted in very small objects being ignored. A 10-pixel length or width was set as the lower limit of detection for PIA. Due to the Bayer color encoding method used in the camera, 10 pixels equals 240 μm (although these are post-processed to interpolate to 120 μm). Thus, specimens below 240 μm length or width were rejected by the PIA_Sample software in real-time this has a good correspondence with CALPS and ring net data, with measurements of specimen lengths revealing a lower measurement limit of 300 μm for all specimens.
The water flow-rates through the PIA flow cell were calculated to have intermediate Reynolds Numbers, suggesting that there is some turbulence in the flow stream. This turbulence could rotate objects such that they were not photographed side-on but end-on (in the case of elongated objects), causing problems with their identification. This issue is not relevant to the use of Zooscan system because once laid on the flat bed, it is possible to re-position the organisms so that they are well-oriented. It appears from inspection of PIA images, that the majority of specimens were photographed from their side-view, such that most copepods were imaged with antennae and bodies in plan view. This suggests that specimens are generally aligning to the flow direction according to their 3D profile and this is a not a significant problem with the flow cell design and the water flow rates.
The two most important issues appear to be differences in sub-sampling between the PIA system and the other two devices, and blurring of specimen features due to limited PIA optical depth of field. The depth of field of the optics is a linear relationship between illumination and camera iris setting. A higher depth of field requires the camera to behave more like a pin-hole camera, and this means either the light source must be commensurately more intense, or the sample rate must be slowed down to increase the light integration time in the camera. The option of slowing the flow down is not compatible with sampling sufficient water volume in a reasonable time to image low abundance plankton taxa. For this reason, there are two practical solutions to this, the first is to increase the light intensity, the second is to construct a wider flow-cell that is twice the width, but then half the depth. We are addressing both optical issues in the next revision of PIA. Sub-sampling results in approximately a two-fold difference in abundances reported in CALPS and PIA. If it is assumed that sub-sampling errors and PIA errors are consistent between cruises, then these issues can be discounted from subsequent uses of the data output from cruise analysis.
Despite some differences resulting from the changes in community composition from 2014 to 2016, we have confirmed that the CALPS is suited to describe broad geographic patterns in zooplankton community structure and diversity. However, there are currently clear limitations to the system, and the quality of the information obtained from PIA is currently not on par with that obtained from the Zooscan image recognition system. This is due mostly to optical issues in the camera system and to a lesser extent sub-sampling differences. These identified issues are being addressed and improvements will translate into higher quality images that are easier for the image identification software to recognize and thus a higher overall identification rate which should then be on par with the Zooscan system.
It is unquestionable that no plankton sampler, or combination of plankton samplers, can provide a true estimate of abundance for all components of the plankton at any given time (Batten et al., 2013). This is because zooplankton cover a wide range of diversity of organisms in term of size, shape, and behavior. Therefore, each sampling system will be biased toward a specific component of the plankton. A particular advantage of the CALPS, over more traditional vertical sampling methods, is that it can be integrated within existing multidisciplinary surveys at little extra cost and without requiring additional survey time. The biggest advantage of using the PIA, in addition to those associated with using the CALPS, is that it removes the need to collect physical preserved samples for subsequent analysis in the laboratory. Provided a taxonomist is present on-board, the system in its current form can integrate the sampling and analysis steps, thus increasing the speed, and cutting down substantially on the cost, of obtaining zooplankton information. Another clear advantage is that the captured images are available in near real-time; a simple internet connection would allow images of zooplankton to be seen remotely as the ship is underway.
Although PIA is capable of automatic classification of the image data, insufficient color image training data were available at the time of the survey and data analysis to operate in this mode, and hence the PIA just provided automatic image taking, vignette generating and storage, and taxonomic feature extraction (such as Equivalent Spherical Diameter) for statistical analysis off-line. As the image library builds up and the image recognition machine learning algorithm matures, we anticipate the PIA capabilities in relation to zooplankton classification and accuracy levels will become on par with other existing systems such as the ZooProcess and Plankton Identifier developed for the ZooSCAN (Gorsky et al., 2010; Gasparini and Antajan, 2013). However, the resulting identifications from using these tools require validation by a human operator for all objects processed and as such they are most commonly used as a computer-assisted identification system (Faillettaz et al., 2016). To be practical for use on very large numbers of images collected, such as with the PIA, sub-sampling needs to be applied, with the associated consequences discussed above. Latest developments in deep learning and neural network for application to object recognitions offer new opportunities for new generations of effective zooplankton classification systems. For example, ZooplanktoNet offers an accuracy of 93.7% in zooplankton classification, using a deep learning architecture based on Convolutional Neural Network (Dai et al., 2016).
PIA is operated in-flow during a cruise, either underway or on-station, and provides a low-cost sampling instrument that is neither deployed or towed. There are no other instruments that are ship-borne, and sample water at a rate more than 1 L/min (PIA sampled at 34 and 40 L/min in this study), which is approaching the sampling water volumes of ring nets, albeit at a fixed seawater inlet depth. With the aforementioned improvements, the PIA system has therefore a high potential to become an important element of an integrated monitoring program for the measurement of zooplankton.
SP has led the work on the application of the PIA system on-board RV Cefas Endeavor. She has obtained funding for this part of the work, managed the project, organized the field work, participated into the field work, led the data analysis part and led on writing the manuscript. JT is the lead software developer for the PIA system. He has participated in the field work and contributed to the data collection and management. PB has participated in the field work and led on the zooplankton taxonomic classification part of the PIA analysis software. He has been responsible for the data management aspect. HC and SB were the principal taxonomist for zooplankton samples and contributed to the data collection and zooplankton taxonomic classification. PC is the lead scientist responsible for the development of the PIA technology. He has also contributed to the writing of the manuscript.
This study was funded by Cefas Seedcorn funding (Project DC006, “Innovations in zooplankton monitoring”), with additional support, for fieldwork and access to RV Cefas Endeavour, from project POSEIDON, DEFRA grant MF1112 (Pelagic Ocean Science: Ecology and Interconnectivity of Diverse Ocean Networks).
The authors declare that the research was conducted in the absence of any commercial or financial relationships that could be construed as a potential conflict of interest.
We acknowledge the considerable efforts of the officers and crew of RV Cefas Endeavor involved in the PELTIC survey in October 2016.
The Supplementary Material for this article can be found online at: https://www.frontiersin.org/articles/10.3389/fmars.2018.00005/full#supplementary-material
Batten, S. D., Edwards, M., and Beaugrand, G. (2013). All plankton sampling systems underestimate abundance: response to “Continuous plankton recorder underestimates zooplankton abundance” by J.W. Dippner and M. Krause. J. Mar. Syst. 128, 240–242. doi: 10.1016/j.jmarsys.2013.05.003
Beaugrand, G., Edwards, M., and Legendre, L. (2010). Marine biodiversity, ecosystem functioning, and carbon cycles. Proc. Natl. Acad. Sci. U.S.A. 107, 10120–10124. doi: 10.1073/pnas.0913855107
Benfield, M. C., Grosjean, P., Culverhouse, P. F., Irigoien, X., Sieracki, M. E., Lopez-Urrutia, A., et al. (2007). RAPID: research on automated plankton identification. Oceanography 20, 172–187. doi: 10.5670/oceanog.2007.63
Borja, A., Elliott, M., Andersen, J. H., Cardoso, A. C., Carstensen, J., Ferreira, J. G., et al. (2013). Good Environmental Status of marine ecosystems: what is it and how do we know when we have attained it? Mar. Pollut. Bull. 76, 16–27. doi: 10.1016/j.marpolbul.2013.08.042
Checkley, D. J., Ortner, P. B., Settle, L. R., and Cummings, S. R. (1997). A continuous, underway fish egg sampler. Fish. Oceanogr. 6, 58–73. doi: 10.1046/j.1365-2419.1997.00030.x
Clarke, K. R., and Warwick, R. M. (1994). Similarity-based testing for community pattern: the two-way layout with no replication. Mar. Biol. 118, 167–176. doi: 10.1007/BF00699231
Cowen, R. K., and Guigand, C. M. (2008). In situ ichthyoplankton imaging system (ISIIS): system design and preliminary results. Limnol. Oceanogr. Methods 6, 126–132. doi: 10.4319/lom.2008.6.126
Culverhouse, P. F. (2015). Biological Oceanography needs new tools to automate sample analysis. J. Mar. Biol. Aquacult. 1, 1–2. doi: 10.15436/2381-0750.15.e002
Culverhouse, P. F., Gallienne, C., Williams, R., and Tilbury, J. (2015). An instrument for rapid mesozooplankton monitoring at ocean basin scale. J. Mar. Biol. Aquacult. 1, 1–11. doi: 10.15436/2381-0750.15.001
Culverhouse, P. F., Macleod, N., Williams, R., Benfield, M. C., Lopes, R. M., and Picheral, M. (2014). An empirical assessment of the consistency of taxonomic identifications. Mar. Biol. Res.10, 73–84. doi: 10.1080/17451000.2013.810762
Culverhouse, P. F., Williams, R., Gallienne, C. P., Tilbury, J., and Wall-Palmer, D. (2016). Ocean-scale monitoring of mesozooplankton on atlantic meridional transect 21. J. Mar. Biol. Aquacult. 2, 1–13. doi: 10.15436/2381-0750.16.018
Dai, J., Wang, R., Zheng, H., Ji, G., and Qiao, X. (2016). “ZooplanktoNet: deep convolutional network for zooplankton classification,” in OCEANS 2016, Vol. 10 (Shanghai), 1–6.
Danovaro, R., Carugati, L., Berzano, M., Cahill, A. E., Carvalho, S., Chenuil, A., et al. (2017). Implementing and innovating marine monitoring approaches for assessing marine environmental status. Front. Mar. Sci. 3:213. doi: 10.3389/fmars.2016.00213
Davis, C. S., Gallager, S. M., Berman, M. S., Haury, L. R., and Strickler, J. R. (1992). The video plankton recorder (VPR): design and initial results. Arch. Hydrobiol. Beih. 36, 67–81.
Dixon, P., and Robertson, A. I. (1986). A compact, self-contained zooplankton pump for use in shallow coastal habitats: design and performance compared to net samples. Mar. Ecol. Prog. Ser. 32, 97–100. doi: 10.3354/meps032097
Edwards, M., and Richardson, A. J. (2004). Impact of climate change on marine pelagic phenology and trophic mismatch. Nature 430, 881–884. doi: 10.1038/nature02808
European Union. (2008). Directive 2008/56/EC of the European Parliament and of the Council of 17 June 2008 Establishing a Framework for Community Action in the Field of Marine Environmental Policy (Marine 339 Strategy Framework Directive).
Faillettaz, R., Picheral, M., Luo, J. Y., Guigand, C., Cowen, R. K., and Irisson, J.-O. (2016). Imperfect automatic image classification successfully describes plankton distribution patterns. Methods Oceanogr. 15–16, 60–77. doi: 10.1016/j.mio.2016.04.003
Gasparini, S., and Antajan, E. (2013). PLANKTON IDENTIFIER: a Software for Automatic Recognition of Planktonic Organisms. Available online at: http://www.obs-vlfr.fr/~gaspari/Plankton_Identifier/index.php
Gorokhova, E., Lehtiniemi, M., Postel, L., Rubene, G., Amid, C., Lesutiene, J., et al. (2016). Indicator properties of Baltic Zooplankton for classification of environmental status within Marine Strategy Framework Directive. PLoS ONE 11:e0158326. doi: 10.1371/journal.pone.0158326
Gorsky, G., Ohman, M. D., Picheral, M., Gasparini, S., Stemmann, L., Romagnan, J.-B., et al. (2010). Digital zooplankton image analysis using the ZooScan integrated system. J. Plankton Res. 32, 285–303. doi: 10.1093/plankt/fbp124
Grosjean, P., Picheral, M., Warembourg, C., and Gorsky, G. (2004). Enumeration, measurement, and identification of net zooplankton samples using the ZOOSCAN digital imaging system. ICES J. Mar. Sci. 61, 518–525. doi: 10.1016/j.icesjms.2004.03.012
Harris, V., and Edwards, M. (2014). Multidecadal Atlantic climate variability and its impact on marine pelagic communities. J. Mar. Syst. 133, 55–69. doi: 10.1016/j.jmarsys.2013.07.001
Lauria, V., Attrill, M. J., Brown, A., Edwards, M., and Votier, S. C. (2013). Regional variation in the impact of climate change: evidence that bottom-up regulation from plankton to seabirds is weak in parts of the Northeast Atlantic. Mar. Ecol. Prog. Ser. 488, 11–22. doi: 10.3354/meps10401
Le Bourg, B., Cornet-Barthaux, V., Pagano, M., and Blanchot, J. (2015). FlowCAM as a tool for studying small (80–1000 μm) metazooplankton communities. J. Plankton Res. 37, 666-670. doi: 10.1093/plankt/fbv025
Longhurst, A. R., and Seibert, D. L. R. (1967). Skill in the use of Folsom's plankton sample splitter. Limnol. Oceanogr. 12, 334–335. doi: 10.4319/lo.1967.12.2.0334
MacLeod, N., Benfield, M., and Culverhouse, P. (2010). Time to automate identification. Nature 467, 154–155. doi: 10.1038/467154a
Mitra, A., Castellani, C., Gentleman, W. C., Jónasdóttir, S. H., Flynn, K. J., Bode, A., et al. (2014). Bridging the gap between marine biogeochemical and fisheries sciences; configuring the zooplankton link. Prog. Oceanogr. 129, 176–199. doi: 10.1016/j.pocean.2014.04.025
Møhlenberg, F. (1987). A submersible net-pump for quantitative zooplankton sampling; comparison with conventional net sampling. Ophelia 27, 101–110. doi: 10.1080/00785236.1987.10422014
Pitois, S. G., Bouch, P., Creach, V., and Van Der Kooij, J. (2016). Comparison of zooplankton data collected by a continuous semi-automatic sampler (CALPS) and a traditional vertical ring net. J. Plankton Res. 38, 931–943. doi: 10.1093/plankt/fbw044
Pitois, S. G., Lynam, C. P., Jansen, T., Halliday, N., and Edwards, M. (2012). Bottom-up effects of climate on fish populations: data from the Continuous Plankton Recorder. Mar. Ecol. Prog. Ser. 456, 169–186. doi: 10.3354/meps09710
Remsen, A., Hopkins, T. L., and Samson, S. (2004). What you see is not what you catch: a comparison of concurrently collected net, Optical Plankton Counter, and Shadowed Image Particle Profiling Evaluation Recorder data from the northeast Gulf of Mexico. Deep Sea Res. Part I: Oceanogr. Res. Pap. 51, 129–151. doi: 10.1016/j.dsr.2003.09.008
Serranito, B., Aubert, A., Stemmann, L., Rossi, N., and Jamet, J.-L. (2016). Proposition of indicators of anthropogenic pressure in the Bay of Toulon (Mediterranean Sea) based on zooplankton time-series. Cont. Shelf Res. 121, 3–12. doi: 10.1016/j.csr.2016.01.016
Shephard, S., van Hal, R., de Boois, I., Birchenough, S. N. R., Foden, J., O'Connor, J., et al. (2015). Making progress towards integration of existing sampling activities to establish Joint Monitoring Programmes in support of the MSFD. Mar. Policy 59, 105–111. doi: 10.1016/j.marpol.2015.06.004
Stemmann, L., Hosia, A., Youngbluth, M. J., Søiland, H., Picheral, M., and Gorsky, G. (2008). Vertical distribution (0–1000m) of macrozooplankton, estimated using the Underwater Video Profiler, in different hydrographic regimes along the northern portion of the Mid-Atlantic Ridge. Deep Sea Res. Part II: Top. Stud. Oceanogr. 55, 94-105. doi: 10.1016/j.dsr2.2007.09.019
Uusitalo, L., Fernandes, J. A., Bachiller, E., Tasala, S., and Lehtiniemi, M. (2016). Semi-automated classification method addressing marine strategy framework directive (MSFD) zooplankton indicators. Ecol. Indic. 71, 398–405. doi: 10.1016/j.ecolind.2016.05.036
Vandromme, P., Stemmann, L., Garcìa-Comas, C., Berline, L., Sun, X., and Gorsky, G. (2012). Assessing biases in computing size spectra of automatically classified zooplankton from imaging systems: A case study with the ZooScan integrated system. Methods Oceanogr. 1-2, 3-21. doi: 10.1016/j.mio.2012.06.001
Wiebe, P. H., and Benfield, M. C. (2003). From the Hensen net toward four-dimensional biological oceanography. Prog. Oceanogr. 56, 7–136. doi: 10.1016/S0079-6611(02)00140-4
Keywords: plankton collection methods, underway sampling, image analysis, mesozooplankton, integrated monitoring, line-scan camera
Citation: Pitois SG, Tilbury J, Bouch P, Close H, Barnett S and Culverhouse PF (2018) Comparison of a Cost-Effective Integrated Plankton Sampling and Imaging Instrument with Traditional Systems for Mesozooplankton Sampling in the Celtic Sea. Front. Mar. Sci. 5:5. doi: 10.3389/fmars.2018.00005
Received: 29 September 2017; Accepted: 10 January 2018;
Published: 30 January 2018.
Edited by:
Xabier Irigoien, King Abdullah University of Science and Technology, Saudi ArabiaReviewed by:
Patrizio Mariani, Technical University of Denmark, DenmarkCopyright © 2018 Pitois, Tilbury, Bouch, Close, Barnett and Culverhouse. This is an open-access article distributed under the terms of the Creative Commons Attribution License (CC BY). The use, distribution or reproduction in other forums is permitted, provided the original author(s) and the copyright owner are credited and that the original publication in this journal is cited, in accordance with accepted academic practice. No use, distribution or reproduction is permitted which does not comply with these terms.
*Correspondence: Sophie G. Pitois, c29waGllLnBpdG9pc0BjZWZhcy5jby51aw==
Disclaimer: All claims expressed in this article are solely those of the authors and do not necessarily represent those of their affiliated organizations, or those of the publisher, the editors and the reviewers. Any product that may be evaluated in this article or claim that may be made by its manufacturer is not guaranteed or endorsed by the publisher.
Research integrity at Frontiers

Learn more about the work of our research integrity team to safeguard the quality of each article we publish.