 Thorsten J. S. Balsby
 Preben Clausen
 Dorte Krause-Jensen
 Jacob Carstensen
 Jesper Madsen
95% of researchers rate our articles as excellent or good
Learn more about the work of our research integrity team to safeguard the quality of each article we publish.
Find out more
ORIGINAL RESEARCH article
Front. Mar. Sci. , 10 January 2017
Sec. Marine Ecosystem Ecology
Volume 3 - 2016 | https://doi.org/10.3389/fmars.2016.00285
This article is part of the Research Topic Bridging the Gap Between Policy and Science in Assessing the Health Status of Marine Ecosystems View all 31 articles
Seagrasses in coastal areas have substantial importance for the marine environment and also serve as food for herbivorous waterbirds. We investigated potential relationships between the autumn population of herbivorous waterbirds and eelgrass (Zostera marina) abundance in the EU protected area, Nibe-Gjøl Bredning, a broad of the Limfjorden estuarine complex in Denmark.This is an important site for migratory herbivorous waterbirds such as mute swan (Cygnus olor), coot (Fulica atra), brent goose (Branta bernicla), and wigeon (Anas penelope). We explored long-term (27 years) changes in eelgrass and bird-populations and relationships between eelgrass- and bird abundance. We applied trend- and correlative analyses of yearly monitoring data on eelgrass and waterbirds between 1989 and 2015 coupled with estimates of the potential grazing pressure exerted by the birds. Around 1990 eelgrass was abundant in this area covering more than 40 km2, but eelgrass coverage and biomass declined drastically around 1995 and remained low until 2011 when natural recolonization accelerated and by 2015 had restored the lost meadows. The number of herbivorous waterbirds also fluctuated substantially during the monitoring period with large abundance until the mid-end 1990s followed by reduced abundance in the 2000s and recovery after 2010. The number of bird-days showed a positive relationship with the same year's eelgrass abundance in the 1–2 m depth stratum. For the 0–1 m depth stratum, where the eelgrass meadows are most exposed to bird grazing but also to physical control from e.g., wind and ice, only a particularly detailed eelgrass data set available for a subset of the study period, showed a significant relationship with bird grazing. The potential waterbird consumption of eelgrass, estimated by multiplying average intake rate and number of bird-days for each species, ranged from less than 16% of the eelgrass biomass in most years to more than 40% of the eelgrass biomass in years with extremely sparse eelgrass populations. Hence, the study suggests that dense eelgrass populations stimulate herbivorous waterbirds whereas top-down control is only likely when abundant bird populations graze on sparse eelgrass populations.
Seagrass meadows are important features of coastal ecosystems (Hemminga and Duarte, 2000) and are increasingly recognized for their vital role as ecosystem engineers, because their structure and biomass reduce hydrodynamic energy (e.g., Bouma et al., 2005), increase sedimentation (e.g., Gacia et al., 2003; Bos et al., 2007) and stabilize sediments (Fonseca, 1989), preventing coastal erosion (e.g., Adriano et al., 2005) and increasing water clarity (Maxwell et al., 2016). Moreover, seagrass meadows constitute significant carbon stocks (Duarte et al., 2013), serve as habitats and hatching/nursery areas for a wealth of organisms, and are an important source of food for herbivores such as non-breeding herbivorous waterbirds (Baldwin and Lovvorn, 1994; Ganter, 2000; Heck and Valentine, 2006). However, seagrass meadows have declined in many parts of the world over the past decades (Waycott et al., 2009) in response to stressors such as eutrophication and sediment load from land (Orth et al., 2006), threatening ecosystem services provided by the meadows.
Eelgrass meadows in the temperate zone can be of considerable ecological importance for migratory waterbirds. They stage during autumn or spring migration or during winter for several months in areas with eelgrass meadows. This is indeed also the case in Denmark where thousands of swans, brent geese, dabbling ducks and coots congregate during autumn, winter and spring (Laursen et al., 1997). In most areas they feed on Zostera or other rooted macrophyte resources, especially Ruppia spp. Potamogeton pectinatus and Charophytes (Clausen and Percival, 1998; Madsen, 1998a; Holm, 2002; Meltofte and Clausen, 2011).
The availability of eelgrass as grazing resource is thus of significance for numerous migratory waterbirds, many of which are protected under international conventions and legislation. In Denmark a consequence of this is that a national comprehensive reserve network has been designed specifically to include important seagrass meadows as feeding habitats for these birds in Special Protection Areas under EU legislation designated for them (Madsen et al., 1998). If waterbirds follow an aggregative response (Hassell and May, 1973; Sutherland, 1983), where birds gather at sites with large food densities, then one would expect that herbivorous waterbirds would follow changes in eelgrass cover and distribution.
When the birds graze on seagrasses and other macrophytes it is evident that they can remove substantial amounts of biomass. Dos Santos et al. (2015 and references therein) reports values between 20 and 80% of the standing biomass, and comparable values have been found in Danish studies (Kiørboe, 1980; Madsen, 1988). Such grazing pressures could potentially, in turn, affect macrophyte cover leading to a top-down control of macrophytes by birds in addition to a potential bottom-up control of birds by macrophyte abundance. However, lack of combined long-term data on waterbirds and macrophyte abundance has limited the number of studies investigating such relations with a few exceptions, which has found positive relations between the abundance of herbivorous waterbirds and macrophytes (e.g., Petersen et al., 2008; Meltofte and Clausen, 2011). Bird grazing could potentially also affect nutrient cycling in shallow bays by removing the nutrients contained in the grazed eelgrass biomass, while bird droppings are a source of nutrients.
We studied long-term changes in the abundance of eelgrass meadows and herbivorous waterbirds and potential relationships between them in Nibe-Gjøl Bredning (Limfjorden, Denmark) over a period of 27 years encompassing large fluctuations in both eelgrass and bird populations. We hypothesized that abundant bird populations related to rich eelgrass meadows, whereas birds could exert top-down control on sparse eelgrass meadows. We further hypothesized that potential effects of birds on nutrient fluxes are insignificant relative to nutrient loadings from land. We acknowledge that several other factors also affect eelgrass and herbivorous waterbirds. Hence, physical exposure to e.g., wave action affects eelgrass cover particularly in shallow areas and renders it highly variable, whereas light availability is a major regulating factor at greater depth (Krause-Jensen et al., 2000, 2003). Human disturbances and change in the flyway population may also affect the number of waterbirds. Such disturbance factors may disrupt a relation between eelgrass and waterbirds, but as the majority of these factors only affect either eelgrass or waterbirds, but not both, it is unlikely to drive the relationship between the two. Ice cover is an exception that may affect both eelgrass- and bird abundance, but it is only an issue from mid-December after most of the bird counts have been conducted. We tested the hypotheses based on trend-and correlative analyses of yearly monitoring data on eelgrass and waterbirds between 1989 and 2015 supplemented with estimates of the potential consumption of eelgrass by birds. First we describe the development in eelgrass cover and biomass, and the number of bird-days over the years. Then we compare the estimated eelgrass cover and biomass in Nibe-Gjøl-Bredning with the estimated consumption of eelgrass biomass by waterbirds. Finally we explore relationships between eelgrass and bird abundance in different depth strata. We analyzed the 0–1 m and the 1–2 m depth strata separately, because most bird species only graze eelgrass in the shallow stratum, which is also more exposed to wave action and ice scouring during winter, as opposed to the deeper meadows (Frederiksen et al., 2004). The deeper eelgrass meadows may further serve as a buffer zone stabilizing the shallow part of the eelgrass population (Olesen et al., 2016).
Nibe-Gjøl Bredning is situated in the eastern part of the large Danish Limfjorden estuarine complex (57°02′N, 9°37′E). It is the core area of the “Ulvedybet and Nibe Bredning” European Union Special Protection Area No. 1 and Ramsar site No. 7 in Denmark (Skov-og Naturstyrelsen, 1996). Most of this internationally protected area is situated in the Limfjorden, but adjacent saltmarshes, the brackish lake Ulvedybet with surrounding wetlands, and some agricultural areas in the upland are also protected. Most of the study area consists of shallow (<2 m deep) brackish estuarine waters (Figure 1), which around 1990 supported one of the largest known eelgrass Zostera marina beds in Europe. At this time, eelgrass covered almost the entire shallows, with dense populations at depths ranging from approx. 25 cm and down to around 2 m, totaling ~45 km2 (Madsen, 1998a). Eelgrass populations experienced major decimation by the wasting disease in the 1930s and again due to eutrophication peaking in the 1980s (e.g., Krause-Jensen et al., 2012). Adjacent saltmarshes are typical Danish Juncus gerardi, Festuca rubra, and Puccinellia maritima dominated meadows (sensu Vestergaard, 1998), of which 52.9% were classified as well-managed by livestock grazing or hay-cutting in 2008 (Clausen et al., 2013a).
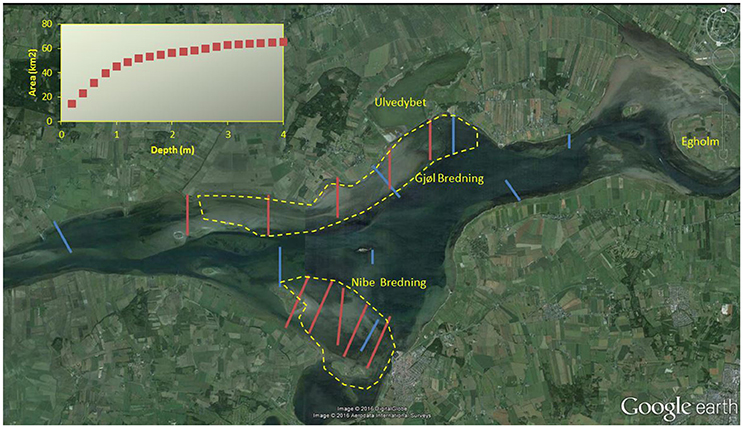
Figure 1. Aerial photo of Nibe-Gjøl Bredning in 2014, with transects used for Zostera mapping in the NOVANA programme (blue) and by Madsen (1998b, red), with a few other mentioned site names. Inserted figure shows the cumulative area with substrate suitable for eelgrass for each 0.2 m interval. Stippled yellow lines encircles the main feeding areas for wigeon in the early 1990s, the herbivorous species in the study site that has the shortest neck and thus is most dependent on shallow water Zostera (redrawn from Madsen, 1998b).
A comprehensive baseline study of impacts of humans on staging waterbirds in the area was conducted during 1985–1988 (Madsen, 1998a). A following study examined the effects of banning or regulating the two primary sources of human disturbance (hunting and windsurfing) within the experimental reserves implemented during 1989–1992, and the establishment of a permanent reserve regulating both these activities from 1993 onwards (Madsen, 1998b; Clausen et al., 2014). The reserve establishment led to massive increases in numbers of staging waterbirds, especially quarry species, notably in the years 1990–93 (Madsen, 1998b), but after the late 1990s, bird numbers fell dramatically (Clausen et al., 2014).
Three of the numerically most important bird species found in the area are herbivores, i.e., mute swan Cygnus olor, light-bellied brent goose Branta bernicla hrota and Eurasion wigeon Anas penelope, and although the similarly common Eurasian coot Fulica atra is an omnivore, we know from direct observations and distributional analysis from the area that all four species have a strong preference for feeding on Zostera in the study site (Madsen, 1998a; Clausen et al., 2013b), because it represents the most energetically favorable and easily accessible food source (e.g., Brunckhort, 1996; Clausen et al., 2013c).
Staging waterbirds have been counted in the area on an annual basis during 1985–2015. Intensive count coverage, involving one or more counts per month during August-November/December was established during the baseline-experimental reserve study years from 1985 to 1993 (Madsen, 1998a,b), and in conjunction with national reserve monitoring programmes in the years 1994–2003 and 2008–2010 (Clausen et al., 2014). During the years 2004–2007 and 2011–2015, the site was only counted in October as part of the annual national dabbling duck and brent goose count of the Danish National Monitoring and Assessment Program for the Aquatic and Terrestrial Environments (NOVANA)(Holm et al., 2015), when observers were also instructed to count swans and coots. The majority of counts were land-based total counts of waterbirds, where flocks of birds were identified, counted and drawn onto field-maps using 20–60 × telescopes from a number of observation points in the upland, in some years supplemented with counts from observation towers (details in Madsen, 1998a; Clausen et al., 2014). Some counts were carried out by two observers from single-engine Piper or Cessna airplanes, using the “total count” method (Pihl and Frikke, 1992).
Annual autumn estimates of bird-days, i.e., the total number of birds observed multiplied by the numbers of days they were present, were calculated for the four herbivorous species. This was estimated by multiplying the mean count per month by the number of days in the month, and then summed for August-November for each year of the periods with intensive counts. For the remaining years, we used October counts as a predictor of total number of bird-days in the autumn, because October counts showed a significant positive linear regression with high explanatory power (R2 > 0.83) with the total number of bird-days per year in the years with intensive counts (Table 1). Based on this regression we estimated the total number of bird-days for the years where only October counts had been conducted, except for 2004–2007 where only wigeon and brent geese were counted, and estimates for mute swans and coot could not be made.
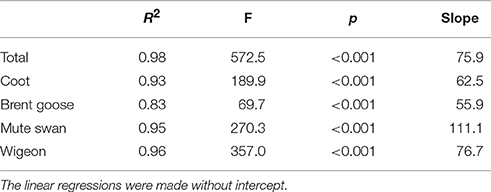
Table 1. Relationships between October counts and total number of bird-days for herbivorous waterbirds in Nibe-Gjøl Bredning.
The regional monitoring authorities conducted the eelgrass surveys in accordance with national guidelines for survey of eelgrass cover as part of the NOVANA programme. During all surveys, eelgrass cover at specific depths along transect lines was estimated visually in the field by divers or subsequently in the laboratory from underwater videos. In Nibe-Gjøl Bredning, a total of 9 different transects were surveyed over the period 1989–2015. Between 1989 and 1997 only 2 transects were surveyed, whereas 4 transects were surveyed between 1998 and 2001, and 5 to 9 transects were surveyed per year from 2002 until 2015. Before 2001 eelgrass cover was estimated as an average for depth intervals along the transect lines, whereas estimates after 2001 were given as point observations recorded continuously along the transect lines with information on water depth for each point. For the analysis we divided the eelgrass in two strata 0–1 m and 1–2 m, relative to the normal water level (DVR90).
Additional detailed data on seagrass coverage were collected along 10 transects in Nibe Bredning and Gjøl Bredning (Madsen, 1998b and unpublished). These transects differed in geographical position and extent from the NOVANA transects mentioned above (Figure 1). Transects were surveyed in August in 1988–1997 and 2001 (except 5 transects in Gjøl Bredning, where monitoring started in 1989). The cover and distribution of Zostera marina and Ruppia spp. (R. maritima and R cirrhosa, combined) were estimated at points with 100 m intervals along the transects with a radius of approx. 8 m from a boat using a large Aquascope Underwater Viewer. The position of stations was determined using a Decca (until 1992) or a GPS navigator (since 1993). We used these data to validate the less detailed eelgrass cover estimates from the NOVANA surveys prior to 1998. The eelgrass cover at 0–1 m depth estimated from the NOVANA survey showed a significantly positive relationship with the eelgrass cover estimated from the surveys by Madsen (1998b) (General linear model, R2 = 0.427, F(1, 8) = 5.96, p = 0.041, slope = 0.679). On this basis we use the long-term NOVANA data throughout the study to describe eelgrass abundance in Nibe-Gjøl Bredning. However, as these transect were located within the known areas where herbivorous water birds foraged and since there was some variation between the two eelgrass surveys, we decided to also test these in relation to bird-days and consumption.
Based on the eelgrass cover data, we estimated the eelgrass biomass (g dry weight per square meter) using the empirical model by Carstensen et al. (2016). This model predicts eelgrass biomass from Secchi depth and depth-specific eelgrass cover. We used a Secchi depth of 2.9 m, which is the mean Secchi depth measured over several years in Nibe-Gjøl Bredning by the regional monitoring authorities. Model parameters were adopted from Carstensen et al. (2016). By combining the depth-specific cover estimate with the area of each 0.5 m depth interval with suitable eelgrass substrate (i.e., soft and sandy substratum) we estimated the potential eelgrass biomass per year in the entire Nibe-Gjøl Bredning in October. This estimate assumes that all the substrate suitable for eelgrass was colonized by the percent eelgrass cover estimated for each year. However, observations confirm that the actual area colonized varied markedly over the study period. In 1993 about 45 km2 was colonized by eelgrass whereas only 4.6 km2 of the suitable area was colonized in 2001 (Figure 2). The estimates of eelgrass biomass are influenced by the variation in the area colonized by eelgrass. However, as we lacked annual data to quantify this variation we used assessments of the proportions of the suitable area being colonized by the eelgrass.
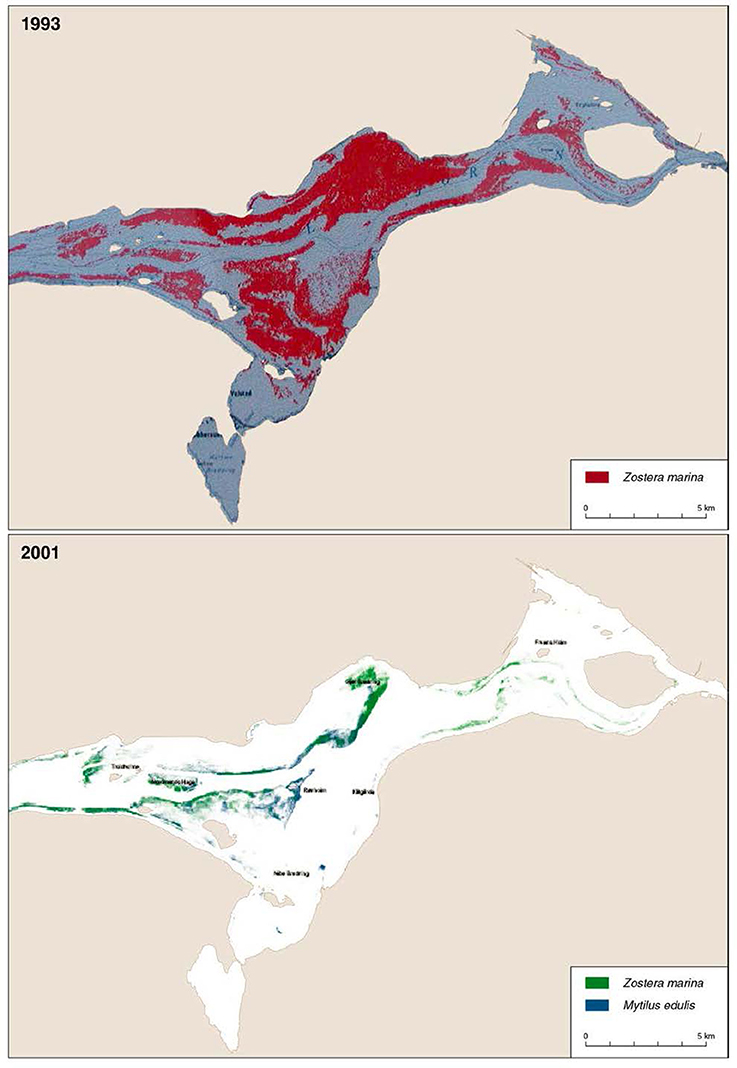
Figure 2. Distribution of eelgrass in Nibe-Gjøl Bredning in 1993 and 2001, both based on aerial photography analysis. Blue mussel distribution in 2001 is also shown. Sources 1993: Limfjordsovervågningen (no year), and 2001: Jacobsen and Christensen (2002). The coarse character of the pictures is due to low resolution originals. Redrawn from Clausen et al. (2014).
For non-diving herbivorous waterbirds such as mute swan and brent goose, and poorly diving species such as coot, the water level determines, which areas are available for foraging (Clausen et al., 1996; Clausen, 2000). The same is true for the non-diving wigeon, which often feed on spilled plant-materials from foraging swans or coot (Holm and Clausen, 2009 and references therein). Fluctuations in water level are therefore important to quantify, in order to assess foraging abilities in Nibe-Gjøl Bredning. The water level at Nibe-Gjøl Bredning is mainly affected by wind. Winds from west push North Sea water into the Limfjorden through the opening at Thyborøn. With a tidal amplitude around 20 cm, lunar tides have marginal effect on the water level in the Limfjord, but wind surges often affects water levels and will occasionally invoke water levels below −50 cm (easterly winds) and above +150 cm (westerlies)(Clausen, 1998).
Water level has been measured at two nearby locations Øland/Attrup and Nibe. The Nibe station and the Attrup station are located on the south and north side of the Bredning, respectively. However, none of the stations cover the full duration of the study period (Øland/Attrup 522327 observations; from 19/4/1996 to 31/12/2013; Nibe: 364894 observations; from 5/2/1993 to 8/8/2007). Due to absence of data we could not assess water-levels effect on potential foraging days during 1989-1992 and 2014-2015. Nibe is the station closest to many of the observed areas, and missing water level data for Nibe were estimated using a regression between Nibe and Attrup water level measures in August to December 1996 to 2007, when both stations were active. This relationship was linear for water levels between −50 cm and 100 cm relative to the normal water level (DVR90, Danish vertical reference 1990. www.sdfe.dk). To estimate missing water level data for Nibe at extreme (and rare) water levels below −50 cm or above 100 cm at the Attrup station, we used the associated mean water level of the extreme water levels at Nibe in the years where in the years where it had been monitored.
We estimated Zostera consumption by the four waterbirds using standard methods based on body mass, daily energetic needs and known digestion rates. We used body mass estimates from Cramp and Simmons (1977, 1980) for wigeon (0.70 kg) and coot (0.76 kg) and an average autumn mass of 1.6 kg for light-bellied brent goose (from Clausen et al., 2012), and subsequently estimated the birds daily energy expenditure, DEE in kJ/day by three different allometric relationships. The first is from Drent et al. (1978/79):
where BMR is the birds basal metabolic rate. The BMR was estimated after the allometric regression for non-passerines in Lasiewski and Dawson (1967): BMR = 78.3*Mb 0.723 in kcal/day < = > BMR = 327.6*Mb 0.723 in kJ/day, where Mb is the birds body mass in kg.
The second relationship follows Walsberg (1983):
where Mb is the birds body mass in g.
The third relationship follows Nagy (1987; allometric regression for non-passerines):
where Mb is the birds body mass in g, and the common logarithm log10 is used for computations.
These estimates of DEE give slightly different values for the three species, and it is not obvious from the most recent paper or associated literature whether the one or the other is the more appropriate value. We therefore used the average value of the three DEE-computations for our estimates. The energy content of the food, Ef, was set at 14.154 kJ/kg dry weight for Zostera marina leaves (Christensen et al., 1994).
The birds' daily Zostera food intake, DFI, in kg dry weight, to cover their daily energetic needs was then estimated as:
where D is the birds' digestion rate in % and PP is the proportion of the birds' food that we expect is derived from plant materials. Leaf-eating birds' digestion rates are generally relatively low (typically 25–40%), and we used a value of 36% for brent goose (average of 37% given by Drent et al., 1978/79, and 35% by Madsen, 1988), 46% for wigeon (Madsen, 1988), and 27% for coot (Hurter, 1979). The lower value for coot is probably explained by their mixed diet and shorter gut. For wigeon and brent goose we assumed a 100% seagrass diet, whereas for coot we used a value of 50%, as reported for coot feeding in a Danish estuary (Christensen et al., 1994). The resulting daily consumption estimates (dry weight/day) are 233 g for brent goose, 130 g for wigeon and 93 g for coot.
For mute swan we used a comprehensive study on the nutritional energetics of a seagrass-dependent and molting swan population in eastern Denmark in 1993–1995 providing a best estimate of daily seagrass consumption of 487.7 g dry weight/day (range 352.2–620.0 g dry weight/day, Clausen et al., 1996). Most of the variation of the estimate is caused by the fact that estimated daily energy expenditure for a 10.75 kg bird is quite different and lower if based on computations by Walsberg (1983), but higher if based on Drent et al. (1978/79) or Nagy (1987), whereas values for the other species are almost identical. The largest uncertainty in these calculations thus remains with the swan consumption.
Estimates of daily consumption rates and bird-days were multiplied to estimate consumption estimates for the autumn. In order to infer potential effects of bird-grazing on nitrogen (N)-dynamics we used literature data on the N-content of eelgrass biomass.
We used mixed models to estimate the least square mean eelgrass cover per year in Nibe-Gjøl Bredning where year was a fixed factor and transect was a random factor. The mixed model allowed us to account for variation in the number of transects surveyed per year by including transect as a random factor in the model. We estimated the average eelgrass cover for the depth interval 0–1 m, with potential large grazing effects, and for the 1–2 m depth interval, which is less accessible for bird grazing except for mute swan. We choose to not use deeper strata as the eelgrass below 2 m would never be accessible to non-diving waterbirds.
The least square means for eelgrass estimates for all of Nibe-Gjøl Bredning for cover and for potential eelgrass biomass (estimated on basis of the cover) were related to the number of bird-days and total consumption per year. We used general linear models and mixed models to test the relations between eelgrass and herbivorous waterbirds. The model tested the relation between number of bird-days and eelgrass cover for both the 0–1 m and the 1–2 m depth intervals. We used both bird-days and estimated consumption to describe and quantify the potential relationships with eelgrass abundance, because species differ in consumption rates so some species would have larger potential impact than others. This analysis also included the number of bird-days and consumption from the gap-years, which were estimated using regression.
All tests have been conducted in SAS 9.3 (SAS Institute, Cary, NC) using proc glm and proc mixed.
Nibe-Gjøl Bredning consists of extensive shallow areas with substrate suitable for eelgrass. The majority of the suitable area is less than 1 m deep and covers 45 km2 (65.5%) of our study area (Figure 1). Of the remaining area suitable for eelgrass, 10.6 km2 (15.4%) occurs between 1 and 2 m depth, 9.1 km2 (13.2%) between 2 and 4 m, and the remaining 4.1 km2 (5.9%) at greater depths.
A mute swan can feed down to 1.15 meters below the surface (Clausen et al., 1996) and a brent goose to 40 cm (Clausen, 2000). Analysis of the fluctuations in water levels in Nibe-Gjøl Bredning between August and December 1993 to 2013 showed that on average 50% of days had water levels below 0 (relative to normal), and another 30% in the range 0–0.20 m, whereas there were only 12.7 (range 3–24) days per autumn with water levels higher than 0.5 m. Assuming that eelgrass shoots typically are 0.5–1 m long (as found by Clausen et al., 1996; Clausen, 2000), this means that swans could reach the entire 0–1 m stratum most days, and even the deeper stratum out to at least 2 meters during some days. The other species feed at shallower depths, or by diving (coot) or by association with the swans (wigeon and brent geese). Fluctuations in water level did not cause major changes in accessibility of eelgrass in Nibe-Gjøl Bredning. So if all the suitable area were colonized by eelgrass, the majority of the eelgrass would be available to herbivorous waterfowl during staging between August and December.
In Nibe-Gjøl Bredning, eelgrass cover of the depth strata 0–1 m and 1–2 m varied hugely over the period 1989–2015 (Figures 2, 3). The period 1989–2000 was characterized by wide fluctuations in both strata with peaks of about 45% cover in the shallow stratum around 1989 and 1998 and a peak of about 90% cover in the deeper stratum in 1993. From 2000, there followed a period with relatively stable low eelgrass cover of 10–20% at 0–1 m and 30–40% at 1–2 m until around 2010. Since then eelgrass cover has increased steeply in both strata to the current levels of about 90% at 0–1 m and 75% at 1–2 m depth (Figure 3). Since 2000, eelgrass at 0–1 m depth has followed a similar trend to eelgrass at 1–2 m, whereas before 2000 the two strata showed opposite trends, i.e., when eelgrass cover increased in the 1–2 m stratum, it decreased in the 0–1 m stratum and vice versa (Figure 3). Although the eelgrass cover within the two strata was correlated (Pearson correlation r26 = 0.40, p = 0.041) there were substantial differences between the two strata. Overall the eelgrass cover was significantly lower in the 0–1 m stratum compared to the 1–2 m stratum (paired t-test t25 = 4.58, p < 0.001).
Figure 3. The upper figure gives mean eelgrass cover per year for the 0–1 m stratum and the 1–2 m stratum measured along the NOVANA transects. The lower figure gives estimated potential eelgrass biomass at the 0–1 m stratum and the 1–2 m stratum when all available substrate was colonized with eelgrass. Eelgrass cover values were least square means estimates from a mixed model with transect as a random factor. The eelgrass cover used for these estimates was based on transects with a 0.5 m stratification. Note that these estimates of eelgrass biomass assume that all suitable areas have been colonized. However, for several years only parts of the suitable area was colonized.
The potential eelgrass biomass per year in the 0–1 m stratum followed the pattern described for the eelgrass cover; whereas fluctuations in biomass were much smaller for the 1–2 m stratum, reflecting that the area of the suitable habitat is much smaller at 1–2 m compared to 0–1 m (Figure 3).
The herbivorous waterfowl species coot, mute swan and wigeon all exhibited the highest number of bird-days before 1995, whereas brent goose peaked in 1998. The total number of autumn bird-days peaked in 1993 at 2.3 mio bird-days. The number of bird-days then declined steadily until 2002/2003, after which it remained low until at least 2011 (Figure 4). The peaks of wigeon, coot, and mute swan bird-days in 1993 and 1995 were 1–2 orders of magnitude larger than for other herbivorous species, but after 2000 the total for all species declined to less than 86,000 bird-days.
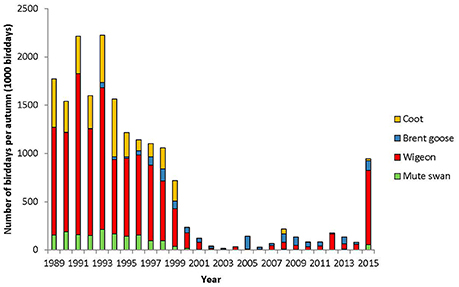
Figure 4. Number of bird-days per autumn for each species. Note that for 2004–2007 only brent geese and wigeon were counted, hence bird-days could not be estimated for mute swan and coot.
The October counts followed the same pattern as described for the number of bird-days per autumn until 2011. Interestingly, a steep increase in the number of mute swans and especially wigeon was observed in Nibe-Gjøl Bredning in 2015 (Figure 5), whereas coot did not increase as steeply.
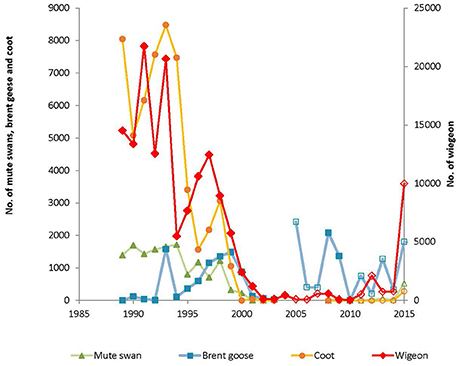
Figure 5. Peak number of mute swan, brent goose, wigeon and coot in Nibe-Gjøl Bredning in autumn 1989–2015. Closed symbols are from years with intensive count programs, with one or more counts per month throughout August to November/December (1989–2003 and 2008–2010). Open symbols denote years when only October counts were conducted (2004–2007 and 2011–2015).
The number of bird-days estimated from counts of herbivorous bird species and the associated estimated consumption of eelgrass (ton dry weight per year) related positively to the eelgrass cover at the 1–2 m stratum, with bird numbers and estimated bird consumption explaining 28 and 42% of the variation in eelgrass cover, respectively (Figure 6, Table 2). However, in the 0–1 m stratum, which is primarily exposed to grazing, the bird-days and estimated consumption did not relate to the eelgrass cover (Figure 6, Table 2).
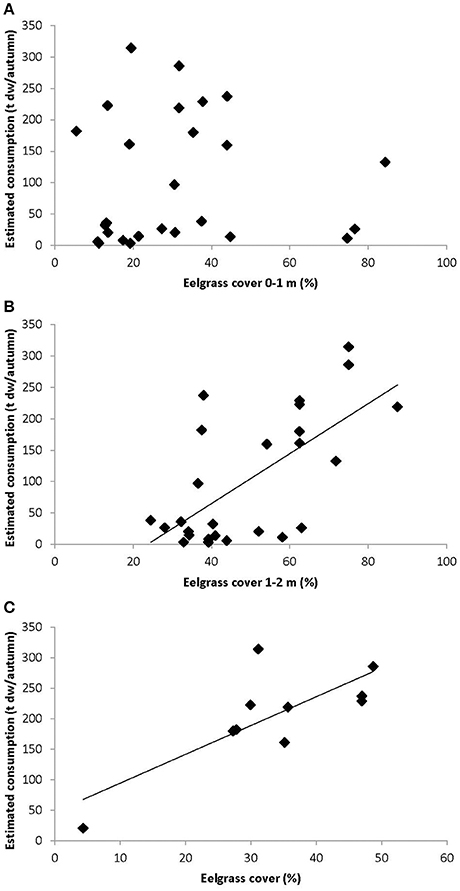
Figure 6. Eelgrass cover estimates vs. estimated consumption of eelgrass for the 0–1 m strata (A) and 1–2 m strata (B) NOVANA transects, and non-NOVANA transects (C). Eelgrass cover estimates was calculated as least square means. Lines represent regression lines.
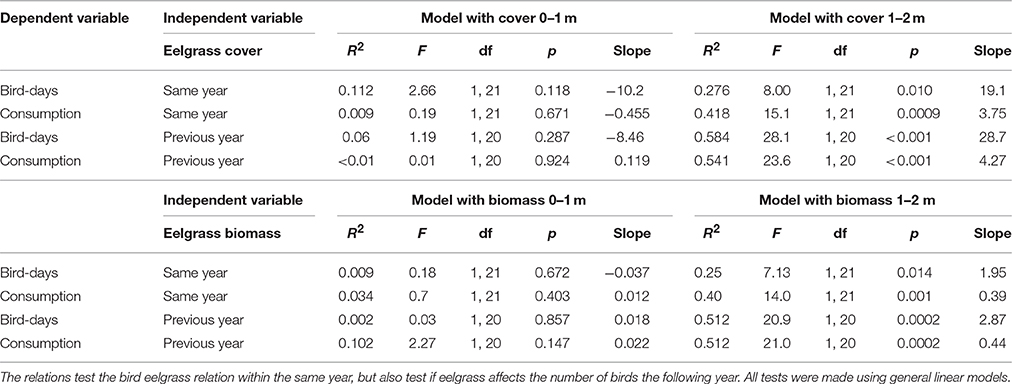
Table 2. Relations between bird days, consumption and eelgrass cover and estimated eelgrass biomass.
Bird-days, however, showed a significant positive relation with the more detailed eelgrass cover survey encompassing 5–10 transects in 1988–1997 and 2001 [General linear model, Bird-days: R2 = 0.62, F(1, 8) = 12.9, p = 0.007, slope = 36.7; Consumption: R2 = 0.60, F(1, 8) = 11.9, p = 0.009, slope = 4.7] (Figure 6). These eelgrass transects were mainly located in the shallow areas with less than 1 m depth, and within the primary feeding distributions of the observed herbivorous birds (Figure 1, see Figure 9 also).
Likewise, the number of bird-days and the related eelgrass consumption showed a significantly positive relation to the estimated total eelgrass biomass at the 1–2 m stratum (Table 2), while there was no significant relationship for the 0–1 m stratum (Table 2). It should be noted that the estimated total eelgrass biomass assume that all suitable area would be colonized, which as previously mentioned was not the case in all years.
Repeating the above analyses by relating bird abundance and grazing to the previous year's eelgrass abundance, i.e., assuming a one-year lag in the birds' response, did improve the relationships slightly (Table 2).
The estimated eelgrass consumption by herbivorous water birds decreased from around 200 tons dry weight/year in the beginning of the study period to <40 tons dry weight/year, between 2000 and 2014 (Figure 7).
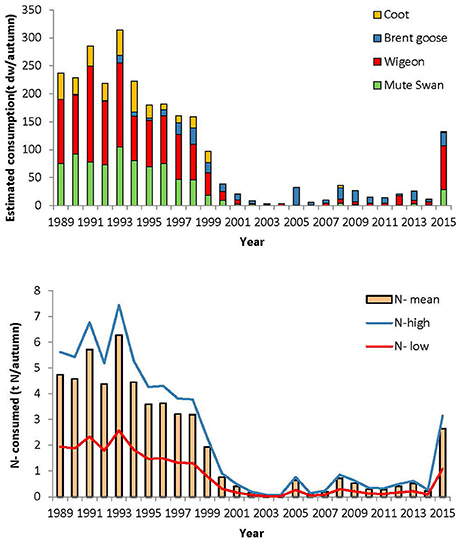
Figure 7. Estimated eelgrass consumption per autumn (ton dry weight/autumn) for each of the herbivorous species (upper) and estimated amount of eelgrass leaf N (t dry weight/autumn) removed from the eelgrass per autumn (lower). The upper and lower amount of N depends on the age of the eelgrass leaves (Pedersen and Borum, 1992).
The consumption of eelgrass can mobilize and recycle a substantial amount of N. An estimate of the N content is 2.37% of the dry weight in new leaves and 0.82% in old leaves (Pedersen and Borum, 1992). Using these estimates, the N removed by eelgrass consuming herbivorous waterbirds varied from as little as 0.03–0.08 tons N per year in the period 2000–2014 up to a maximum of 2.57–7.44 T N per year in 1993, the range reflecting the variability in eelgrass N-content with age (Figure 7).
If we assume that all the suitable area is colonized by eelgrass and that at least the mute swan could reach the eelgrass down to 1.5 m, then the herbivorous waterfowl consumed between 0.2 and 9.4% of the available biomass in the area (Figure 8). The highest consumption occurred in 1993 and 1994, where we know at least in 1993 that most of the suitable habitat was indeed covered by eelgrass (Figure 2). However, during the years with declining and low eelgrass cover it is unlikely that all the suitable area was colonized by eelgrass. Furthermore, aerial photos suggest that the areas colonized by eelgrass went through substantial reductions in this period. Therefore, we estimated the available eelgrass biomass with scenarios where smaller proportions of the suitable area had been colonized (Figure 8). For the period with sparse eelgrass meadows exemplified by 1996 then the herbivorous waterbirds could consume up to 73% of the available biomass if only 20% of the suitable area had been colonized by eelgrass, and if they only foraged on eelgrass; and if 50% of the suitable area had been colonized, then the grazing pressure would reach up to 29% of the available biomass. However, for all years since 1998 the grazing pressure is less than 16% of the standing biomass if eelgrass colonized between 20 and 100% of the suitable area (Figure 8).
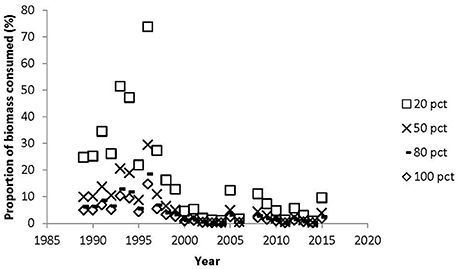
Figure 8. Proportion of eelgrass biomass consumed by herbivorous waterbirds at 20, 50, 80, 100% colonization of the suitable area in Nibe-Gjøl bredning. The eelgrass biomass assumed to be available for grazing was between 0 and 1.5 m.
This study demonstrates major fluctuations in abundances of eelgrass and herbivorous waterbirds over a 27-year period in the protected area Nibe-Gjøl Bredning. The data suggests that dense eelgrass meadows may stimulate the populations of herbivorous birds, even though our correlative approach does not document a causal relationship. On the other hand, the results indicate that during periods when large bird populations forage on sparse eelgrass meadows, the birds may exert top-down control with a grazing pressure of up to 73% of the standing biomass if eelgrass meadows colonized only 20% of the available area and a grazing pressure of up to 29% of the biomass if the meadows colonize 50% of the available area.
Our study demonstrates that the number herbivorous waters birds show a strong relation the availability of eelgrass in Nibe-Gjøl Bredning. Similar positive relationships between numbers of herbivorous waterbirds and benthic vegetation have also been demonstrated at other sites involving different species of birds and aquatic plants (Nienhuis, 1992; Petersen et al., 2008; Meltofte and Clausen, 2011).
Overall, the number of bird-days showed a positive relationship to the eelgrass cover at 1–2 m depth, but not to eelgrass cover at the most heavily grazed 0–1 m depth stratum for the NOVANA data. The number of bird-days and consumption showed a positive relation to the additional detailed eelgrass cover estimates made on the shallow foraging areas (Figures 1, 7). This relation existed despite only 9 years of observations of eelgrass cover.
The lack of a relationship for the 0–1 m depth stratum for the NOVANA data may have several causes. One may be that the regression assumes that the relation between eelgrass cover and number of waterbirds is the same throughout the time series and this may not be the case, as birds could exert top-down control during periods with sparse eelgrass populations. Eelgrass meadows at 0–1 m are also more affected than those at 1–2 m by physical disturbances from ice scour in winter, wave action (Krause-Jensen et al., 2003) and possibly also from drifting macroalgae and burrowing fauna which may hamper the establishment of seedlings (Valdemarsen et al., 2010). As eelgrass meadows become sparse they also loose resilience, and feed-back mechanisms may act to maintain the state of reduced cover, e.g., through increased sediment resuspension (Maxwell et al., 2016). The temporal mismatch between the measure of eelgrass cover (generally monitored in August-September) and the grazing pressure, which peaks later in the season, may further reduce the chance of identifying potential relationships between the two factors. Large year-to-year variations in numbers of our four focal waterbird species also affect the relationship to eelgrass cover, with numbers of mute swans and coot in Denmark being heavily influenced by variations in mortality reflecting winter severity (Holm et al., 2015), numbers of wigeon being influenced by large annual variations in breeding success (Fox et al., 2016), and numbers of brent geese being affected by both these factors (Clausen et al., 1998). Hunting also add to the variability of bird populations because 1989, the first year in our time-series, was also the first year with a reserve, and there could be some initial lag-responses from the bird populations on the new reserve (Madsen, 1998b).
The location of the NOVANA transects relative to the feeding areas in the early study years could also be part of, and perhaps even the best explanation for the lack of a relation. This is so because the non-NOVANA transects surveyed in the shallow areas where birds were observed to forage did show a positive relation (Figure 6). This stress the importance of vicinity between eelgrass transects and the areas used by the herbivorous waterbirds.
The deeper eelgrass meadows, on the other hand, showed positive relationships to bird populations probably because these meadows were less at risk of top-down control, and also less affected by variability caused by physical exposure. The reduced physical stress and lower grazing pressure at 1–2 m depth where light is still available may also explain why eelgrass populations at this depth were more stable than the shallower populations, with average cover values never declining below 25%. The more stable populations at 1–2 m depth may serve as a buffer for the shallow populations by attenuating waves and by producing seeds that may facilitate recolonization (Olesen et al., 2016).
The steep increase in eelgrass cover since 2011 was not immediately reflected in increased numbers of herbivorous waterbirds, but the newest data from 2015 document the largest populations of herbivorous birds for 17 years. Hence, there seems to be a time lag in the birds' response to altered foraging possibilities, reflecting that the waterbird populations need time to discover and respond to the recovered eelgrass meadows. The eelgrass decline from the mid-end 1990s was followed by a decline in number of waterbirds a few years later, also suggesting a lagged response to the eelgrass decline. Introducing a general lag-phase of 1 year in the analysis of the birds' response to eelgrass abundance improved the relationships for the 1–2 m strata slightly, but had no effect on the 0–1 m strata (Table 2). This suggests that birds may learn and return to favorable foraging sites during migration in the following years. However, the birds' response time probably differs depending on species-specific habitat preferences and associated availability of alternative sources of food, or on Zostera beds outside our study area. Indeed, in 2008–2010, during the period with sparse eelgrass, brent geese and wigeon were more frequently observed foraging on neighboring salt marshes, or on Zostera beds near Egholm 5–10 km east of our study area (Figure 9, Clausen et al., 2014). The mute swans rarely and the coots only to a lesser extent use salt marshes as alternative feeding habitats, and have in the to a larger extent abandoned the overall site including the fjord habitats around Egholm (Clausen et al., 2014), just as it has been the case in Ringkøbing Fjord, where declines in numbers of these two species are more prominent than for brent geese and dabbling ducks during a period with reduced aquatic vegetation (Meltofte and Clausen, 2011).
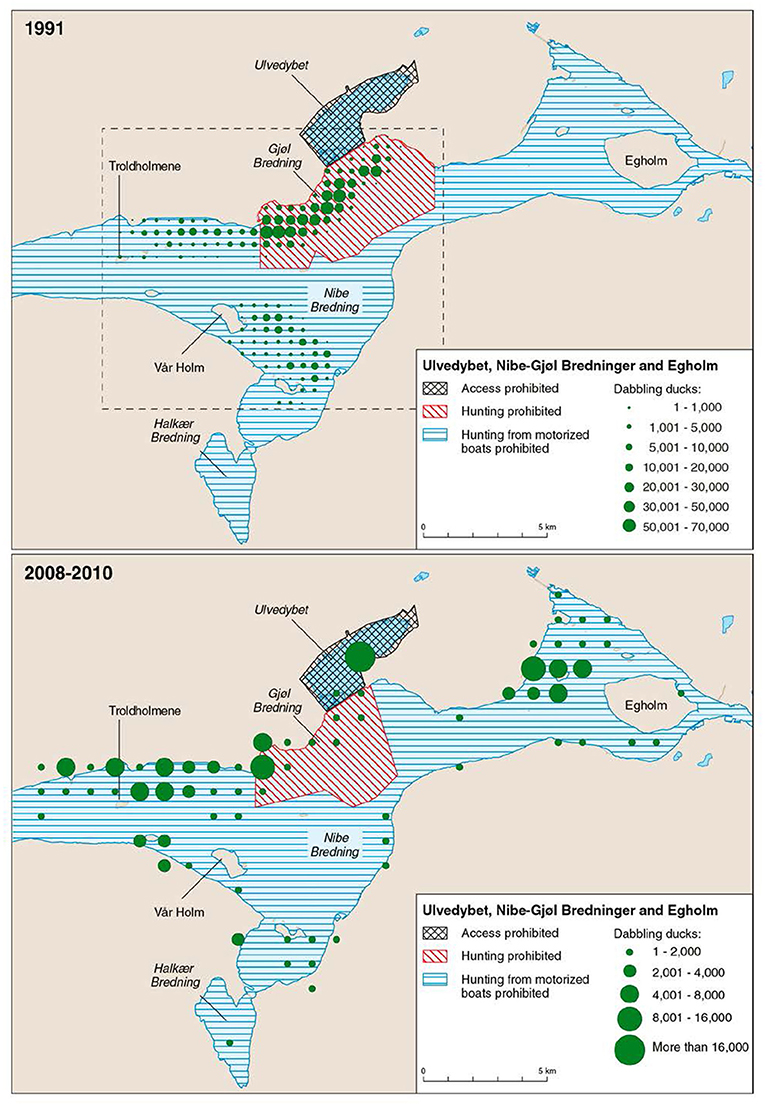
Figure 9. Two maps showing the relative distribution of wigeon, the most numerous herbivore, in our study site in 1991 (redrawn from Madsen, 1998b where maps for three other years are given), and 2008–2010 (average for 3 years, from Clausen et al., 2014). Note the different scales, and that the birds are plotted in a 500 m × 500 m grid for 1991, but in a 1 × 1 km grid for 2008–2010. Far more ducks were present in 1991. Reserve regulations are highlighted. In 1991 systematic mapped counts were only carried out in the area within the stippled rectangle, but gray-literature and citizen science portal data from Ulvedybet and the area west of Egholm suggest numbers in these areas were low during the 1990s, and most birds used the reserve in Gjøl Bredning (Clausen et al., 2014).
Already in 1992 and 1993 the local authorities reported brown or dead patches of eelgrass in shallow areas of Nibe-Gjøl Bredning as well as reduced depth limits in the broad and hypoxia in deeper Limfjord basins (Agger et al., 1994). Subsequently, in the mid-end 1990s the meadows of Nibe-Gjøl Bredning went through major declines (Figures 2, 3), in line with the generally poor conditions of eelgrass populations in the eutrophic Limfjorden at the time (Krause-Jensen et al., 2012). Hence, it is evident that the eelgrass populations were unhealthy and that their marked decline was not caused by waterbird grazing. However, from 1995 to 1998 when the eelgrass meadows were under decline a substantial number of birds still foraged in Nibe-Gjøl Bredning. Although these may have foraged partly on tasselweed Ruppia sp., which temporarily showed increased cover in the area between 1994 and 1996 (Madsen, 1998b), it remains possible that the herbivorous waterbirds may have exerted a level of grazing pressure that could have accelerated the decline of the already weakened eelgrass population, since our analyses suggest a grazing pressure up to 73% of the standing biomass during this period.
For the 2000's when the eelgrass populations remained poor and bird populations were reduced, our analyses showed that the potential eelgrass consumption by waterbirds amounted to less than 16% of the standing eelgrass biomass, making it unlikely that grazing by waterbirds could hinder the recovery of the eelgrass population in general. Also the cumulative production of eelgrass biomass in Danish waters is 2.5 to 3.6 times the maximum biomass in a year (Sand-Jensen, 1975; Olesen and Sand-Jensen, 1994a), so the proportion of the production grazed was much less than the 16%.
The steep increase in eelgrass cover from 2011 to 2015 documents that substantial seed-based recolonization suddenly took place. Such fast recolonization can only have happened with the involvement of successful seed dispersal and establishment, as vegetative dispersal solely results in linear rates of expansion averaging 0.16 m per year from the edge of existing patches (Olesen and Sand-Jensen, 1994b). Evidence from aerial photos further documents the extremely fast spread of eelgrass in Nibe-Gjøl Bredning from 2011 to 2014 (http://arealinformation.miljoeportal.dk/distribution/).
Between 2012 and 2015, the eelgrass cover in the 0–1 m strata exceed the eelgrass cover observed in 1991 and earlier, whereas the eelgrass cover at the 1–2 m strata is within the range of earlier observations. The abundance of herbivorous waterbirds have not yet returned to the Nibe-Gjøl area in such numbers witnessed in the early 1990's, which may explain why the eelgrass at the 0–1 m stratum has reached such high coverage. Hence, it may be expected that if numbers of herbivorous waterbirds increase in Nibe-Gjøl Bredning, we may see a decline in eelgrass coverage at the 0–1 m strata. Such a decline may not necessarily imply that the eelgrass population is in a bad state, but may instead indicate that the ecosystem is approaching equilibrium between the standing crop and production of the eelgrass and numbers of grazing herbivorous waterbirds.
Several other studies have documented that grazing by herbivorous waterbirds affect the submerged vegetation in terms of leaf length, and below ground biomass (Bortolus et al., 1998), and above ground biomass (Rivers and Short, 2007; Dos Santos et al., 2015) but temporal removal of plant material does not necessarily have a permanent impact on the plants. Some aquatic plants such as Potamogeton pectinatus are in fact extremely “tolerant” to intense and annual grazing by swans, and may overcompensate and thus produce better in the presence of grazing (Nolet, 2004). In addition to removal of eelgrass, grazing also affects nutrient cycling. The birds remove nitrogen along with their removal of the biomass. While the waterbirds retain a proportion of the N they consume from the eelgrass, only a relatively modest proportion of the consumed N will be released immediately for recycling in the environment. Assuming digestability of soluble protein in eelgrass is comparable to meadow grasses, 61–80% will be digested by the birds (Buchsbaum et al., 1986) and used either as an energy source or to build tissue. Only the remaining 20–39% will discarded as uric acid or undigested plant fragments in the feces. The amount of N consumed may amount up to 6 T per year, which is likely insignificant in comparison with the 1649–2438 tons of N supplied from the contributing catchment (Windolf et al., 2013).
In conclusion, the study area has undergone substantial fluctuations in abundance of both eelgrass and herbivorous waterbirds over the past 27 years. Our results suggest that dense eelgrass populations stimulate the number of herbivorous waterbirds, whereas the waterbirds may exert top-down control when eelgrass meadows are sparse and waterbird populations are large.
TB, DK, PC, and JC analyzed the data and drafted the manuscript. JM started the bird counts and the eelgrass survey that was not part of the NOVANA survey. All authors contributed to writing the paper.
The authors declare that the research was conducted in the absence of any commercial or financial relationships that could be construed as a potential conflict of interest.
The reviewer JF and handling Editor declared their shared affiliation, and the handling Editor states that the process nevertheless met the standards of a fair and objective review.
We would like to thank Jens Sund Laursen for finding the latest data on eelgrass in Nibe-Gjøl Bredning, Svend Aage Berntsen and Kirsten Elisabeth Broch, Naturstyrelsen for providing data on water level, the many observers counting waterbirds at Nibe-Gjøl Bredning, but especially Jens Peder Hounisen, Ebbe Bøgebjerg, Henrik Haaning Nielsen and Jørgen Peter Kjeldsen. We would like to thank Tony Fox for constructive comments on an earlier version of the manuscript and Jesper Bladt for assistance with ARCGIS. TB, DK, and JC received support from the DEVOTES project funded under the EC 7th framework program (grant agreement no. 308392). DK and JC also received support from the BONUS COCOA project funded jointly by the EC and the Danish Research Council, and DK also from the NOVAGRASS project funded by the Danish Council for Strategic Research. PC was part funded by the Danish Nature Agency.
Adriano, S., Chiara, F., and Antonio, M. (2005). Sedimentation rates and erosion processes in the lagoon of Venice. Environ. Int. 31, 983–992. doi: 10.1016/j.envint.2005.05.008
Agger, C. T., Kaas, H., Knipschildt, F., Brodersen, K., Dahl, K., Rasmussen, B., et al. (1994). Marine Områder: Fjorde, kyster og åbent hav. Vandmiljøplanens Overvågningsprogram 1993. Faglig rapport fra DMU no. 117. Danmarks Miljøundersøgelser, Afdeling for Havmiljø og Mikrobiologi og Afdeling for Ferskvandsøkologi.
Baldwin, J. R., and Lovvorn, J. R. (1994). Expansion of seagrass habitat by the exotic Zostera japonica, and its use by dabbling ducks and brant in Boundary Bay, British Columbia. Mar. Ecol. Prog. Ser. 103, 119–127. doi: 10.3354/meps103119
Bortolus, A., Iribarne, O. O., and Martínez, M. M. (1998). Relationship between Waterfowl and the Seagrass Ruppia maritima in a Southwestern Atlantic Coastal Lagoon. Estuaries 21, 710–717. doi: 10.2307/1353275
Bos, A. R., Bouma, T. J., de Kort, G. L. J., and van Katwijk, M. M. (2007). Ecosystem engineering by annual intertidal seagrass beds: sediment accretion and modification. Estuar. Coast. Shelf Sci. 74, 344–348. doi: 10.1016/j.ecss.2007.04.006
Brunckhort, H. (1996). “Ôkologie und Energetik der Pfeifente (Anas penelope, L. 1758),” im Schleswig-holsteinischen Wattenmeer. (Hamburg: Verlag Dr. Kovac), 141.
Buchsbaum, R., Wilson, J., and Valiela, I. (1986). Digestibility of plant constituents by Canada geese and Atlantic brant. Ecology 67, 386–393. doi: 10.2307/1938581
Carstensen, J., Krause-Jensen, D., and Balsby, T. J. S. (2016). Biomass-Cover relationship for eelgrass meadows. Estuar. Coast. 39, 440–450. doi: 10.1007/s12237-015-9995-6
Christensen, P. B., Møhlenberg, F., Krause-Jensen, D., Jensen, H. S., Rysgaard, S., Clausen, P., et al. (1994). Stoftransport og stofomsætning i Kertinge Nor/Kerteminde Fjord. - Havforskning fra Miljøstyrelsen no. 43. Miljøstyrelsen.
Clausen, K. K., Clausen, P., Fælled, C. C., and Mouritsen, K. N. (2012). Energetic consequences of a major change in habitat use: endangered Brent Geese Branta bernicla hrota losing their main food resource. Ibis 154, 803–814. doi: 10.1111/j.1474-919X.2012.01265.x
Clausen, K. K., Clausen, P., Fox, A. D., Fælled, C. C., and Madsen, J. (2013c). Varying energetic costs of Brent Geese along a continuum from aquatic to agricultural habitats: the importance of habitat-specific energy expenditure. J. Orn. 154, 155–162. doi: 10.1007/s10336-012-0881-8
Clausen, K. K., Clausen, P., Hounisen, J. P., Vissing, M. S., and Fox, A. D. (2013b). Foraging range, habitat use and minimum flight cost of East Atlantic Light-bellied Brent Geese Branta bernicla hrota in their Danish spring staging areas. Wildfowl Special Issue 3, 26–39.
Clausen, K. K., Stjernholm, M., and Clausen, P. (2013a). Grazing management can counteract the impacts of climate change-induced sea level rise on salt marsh-dependent waterbirds. J. Appl. Ecol. 50, 528–537. doi: 10.1111/1365-2664.12043
Clausen, P. (1998). Choosing between feeding on Zostera and salt marsh: factors affecting habitat use by brent geese in spring. Nor. Polarinst. Skr. 200, 269–286.
Clausen, P. (2000). Modelling water level influence on habitat choice and food availability for Zostera feeding brent geese Branta bernicla in non-tidal areas. Wildl. Biol. 6, 75–87.
Clausen, P., Holm, T. E., Therkildsen, O. R., Jørgensen, H. E., and Nielsen, R. D. (2014). Rastende fugle i det Danske Reservatnetværk 1994-2010. Del 2: De enkelte Reservater. Videnskabelig rapport fra DCE - Nationalt Center for Miljø og Energi no. 132. Aarhus Universitet, DCE – Nationalt Center for Miljø og Energi, 236 s. Available online at: http://dce2.au.dk/pub/SR132.pdf
Clausen, P., Kahlert, J., Andersen-Harild, P., and Nilsson, L. (1996). Base-Line Investigations of Moulting Mute Swans around Saltholm, 1993-1995: Results and Conclusions. Commissioned report to Øresundskonsortiet. National Environmental Research Institute.
Clausen, P., Madsen, J., Percival, S. M., O'Connor, D., and Anderson, G. Q. A. (1998). Population development and changes in winter site use by the Svalbard Light-Bellied Brent Goose, Branta bernicla hrota 1980-94. Biol. Cons. 84, 157–165. doi: 10.1016/S0006-3207(97)00097-9
Clausen, P., and Percival, S. M. (1998). Changes in distribution and habitat use of Svalbard light-bellied brent geese Branta bernicla hrota 1980-95: driven by Zostera availability? Nor. Polarinst. Skr. 200, 245–268.
Cramp, S., and Simmons, K. E. L. (1977). The Birds of the Western Palearctic, Vol. I. Ostrich to Ducks. Oxford: Oxford University Press.
Cramp, S., and Simmons, K. E. L. (1980). The Birds of the Western Palearctic, Vol. II, Hawks to Bustards. Oxford: Oxford University Press.
Dos Santos, V. M., Matheson, F. E., Pilditch, C. A., and Elger, A. (2015). Is black swan grazing a threat to seagrass? Indications from an observational study in New Zealand. Aquat. Bot. 100, 41–50. doi: 10.1016/j.aquabot.2012.03.009
Drent, R., Ebbinge, B., and Weijand, B. (1978/79). Balancing the energy budgets of arctic-breeding geese throughout the annual cycle: a progress report. Verhandl. Orn. Ges. Bayern 23, 239–264.
Duarte, C. M., Losada, I. J., Hendriks, I. E., Mazarrasa, I., and Marbà, N. (2013). The role of coastal plant communities for climate change mitigation and adaptation. Nat. Clim. Change 3, 961–968. doi: 10.1038/nclimate1970
Fonseca, M. S. (1989). Sediment stabilisation by Halophila decipiens in comparison to other seagrasses. Estuar. Coast. Shelf Sci. 29, 501–507. doi: 10.1016/0272-7714(89)90083-8
Fox, A. D., Dalby, L., Christensen, T. K., Nagy, S., Balsby, T. J. S., Crowe, O., et al. (2016). Seeking explanations for recent changes in abundance of wintering Eurasian Wigeon Anas penelope in northwest Europe. Ornis Fennica 93, 12–25.
Frederiksen, M., Krause-Jensen, D., Holmer, M., and Laursen, J. S. (2004). Long-term changes in area distribution of eelgrass (Zostera marina) in Danish coastal waters. Aquat. Bot. 78, 167–181. doi: 10.1016/j.aquabot.2003.10.002
Gacia, E., Duarte, C. M., Marba, N., Terrados, J., Kennedy, H., Fortes, M. D., et al. (2003). Sediment deposition and production in SE-Asia seagrass meadows. Estuar. Coast. Shelf Sci. 56, 909–919. doi: 10.1016/S0272-7714(02)00286-X
Ganter, B. (2000). Seagrass (Zostera spp.) as food for brant geese (Branta bernicla): an overview. Helgol. Mar. Res. 54, 63–70. doi: 10.1007/s101520050003
Hassell, M. P., and May, R. M. (1973). Stability in insect host-parasite models. J. Anim. Ecol. 42, 693–726.
Heck, K. L., and Valentine, J. F. (2006). Plant–herbivore interactions in seagrass meadows. J. Exp. Mar. Biol. Ecol. 330, 420–436. doi: 10.1016/j.jembe.2005.12.044
Holm, T. E. (2002). Habitat use and activity patterns of mute swans at a molting and wintering site in Denmark. Waterbirds 25 (Special Publication 1), 183–191.
Holm, T. E., and Clausen, P. (2009). Kleptoparasitism as an important feeding strategy for migrating Wigeon Anas penelope. Wildfowl Special Issue 2, 158–166.
Holm, T. E., Clausen, P., Nielsen, R. D., Petersen, I. K., Laursen, K., Bregnballe, T., et al. (2015). Fugle 2014. NOVANA. Videnskabelig rapport fra DCE - Nationalt Center for Miljø og Energi no. 169. Aarhus Universitet. DCE – Nationalt Center for Miljø og Energi. Available online at: http://www2.dmu.dk/Pub/SR169.pdf
Hurter, H. (1979). Nahrungsökologie des Blässhuhns Fulica atra an den ûbervinterungsgewässern im nördlichen Alpenvorland. Orn. Beob. 76, 257–288.
Jacobsen, A., and Christensen, J. (2002). Nibe og Gjøl bredning. Kortlægning af ålegræs og blåmuslinger, 2001. Notat. Limfjordsovervågningen v/ Ringkjøbing, Viborg og Nordjyllands Amter.
Kiørboe, T. (1980). Distribution and production of submerged macrophytes in Tipper grund (Ringkøbing fjord, Denmark), and the impact of waterfowl grazing. J. App. Ecol. 17, 675–687. doi: 10.2307/2402646
Krause-Jensen, D., Markager, S., and Dalsgaard, T. (2012). Benthic and pelagic primary production in different nutrient regimes. Estuar. Coasts 35, 527–545. doi: 10.1007/s12237-011-9443-1
Krause-Jensen, D., Middelboe, A. L., Sand-Jensen, K., and Christensen, P. B. (2000). Eelgrass, Zostera marina, growth along depth gradients: upper boundaries of the variation as a powerful predictive tool. Oikos 91, 233–244. doi: 10.1034/j.1600-0706.2001.910204.x
Krause-Jensen, D., Pedersen, M. F., and Jensen, C. (2003). Regulation of Eelgrass (Zostera marina) Cover along depth gradients in Danish coastal waters. Estuaries 26, 866–877. doi: 10.1007/BF02803345
Lasiewski, R. C., and Dawson, W. R. (1967). A re-examination of the relation between standard metabolic rate and body weight in birds. Condor 69, 13–23. doi: 10.2307/1366368
Laursen, K., Pihl, S., Durinck, J., Hansen, M., Skov, H., Frikke, J., et al. (1997). Numbers and distribution of waterbirds in Denmark 1987-1989. Dan. Rev. Game Biol. 15, 1–181.
Madsen, J. (1988). Autumn feeding ecology of herbivorous wildfowl in the Danish Wadden Sea, and impact of food supplies and shooting on movements. Dan. Rev. Game Biol. 13, 1–32.
Madsen, J. (1998a). Experimental refuges for migratory waterfowl in Danish wetlands. I. Baseline assessment of the disturbance effects of recreational activities. J. Appl. Ecol. 35, 386–397.
Madsen, J. (1998b). Experimental refuges for migratory waterfowl in Danish wetlands: II Test of hunting disturbance effects. J. Appl. Ecol. 35, 398–417.
Madsen, J., Pihl, S., and Clausen, P. (1998). Establishing a reserve network for waterfowl in Denmark. A biological evaluation of needs and consequences. Biol. Cons. 85, 241–255. doi: 10.1016/S0006-3207(97)00172-9
Maxwell, P., Eklöf, J., van Katwijk, M. M., O'Brien, K., de la Torre-Castro, M., Boström, C., et al. (2016). The fundamental role of ecological feedback mechanisms for the adaptive management of seagrass ecosystems – a review. Biol. Rev. Camb. Philos. Soc. doi: 10.1111/brv.12294. [Epub ahead of print].
Meltofte, H., and Clausen, P. (2011). Svømmefuglene på Tipperne 1929-2007. Dansk Orn. Foren. Tidsskr. 105, 1–120.
Nagy, K. A. (1987). Field metabolic rate and food requirement scaling in mammals and birds. Ecol. Monogr. 57, 111–128. doi: 10.2307/1942620
Nienhuis, P. H. (1992). Eutrophication, water management, and the functioning of Dutch estuaries and costal lagoons. Estuaries 15, 538–548. doi: 10.2307/1352396
Nolet, B. A. (2004). Overcompensation and grazing optimization in a swan-pondweed system. Freshw. Biol. 49, 1391–1399. doi: 10.1111/j.1365-2427.2004.01275.x
Olesen, B., Krause-Jensen, D., and Christensen, P. B. (2016). Depth-related changes in reproductive strategy of a cold-temperate Zostera marina meadow. Estuar. Coast. doi: 10.1007/s12237-016-0155-4. [Epub ahead of print].
Olesen, B., and Sand-Jensen, K. (1994a). Demography of shallow eelgrass (Zostera Marina) populations - shoot dynamics and biomass development. J. Ecol. 82, 379–390.
Olesen, B., and Sand-Jensen, K. (1994b). Patch dynamics of eelgrass Zostera marina. Mar. Ecol. Prog. Ser. 106, 147–156.
Orth, R. J., Carruthers, T. J. B., Dennison, W. C., Duarte, C. M., Fourqurean, J. W., Heck, Jr. K. L., et al. (2006). A global crisis for seagrass ecosystems. BioScience 56, 987–996. doi: 10.1641/0006-3568(2006)56[987:AGCFSE.0.CO;2]10.1641/0006-3568(2006)56[987:AGCFSE]2.0.CO;2
Pedersen, M. F., and Borum, J. (1992). Nitrogen dynamics of eelgrass Zostera marina during a late summer period of high growth and low nutrient availability. Mar. Ecol. Prog. Ser. 80, 65–73. doi: 10.3354/meps080065
Petersen, J. K., Hansen, J. W., Laursen, M. B., Clausen, P., Carstensen, J., and Conley, D. J. (2008). Regime shift in a coastal marine ecosystem. Ecol. Appl. 18, 497–510. doi: 10.1890/07-0752.1
Pihl, S., and Frikke, J. (1992). “Counting birds from aeroplane,” in Manual for Aeroplane and Ship Surveys of Waterfowl and Seabirds, eds J. Komdeur, J. Bertelsen, and G. Cracknell, G. Danmarks Miljøundersøgelser, Afdeling for Flora- og Faunaøkologi (Kalø, IWRB Special Publication No. 19), 8–23.
Rivers, D. O., and Short, F. T. (2007). Effect of grazing by Canada geese Branta canadensis on an intertidal eelgrass Zostera marina meadow. Mar. Ecol. Prog. Ser. 333, 271–279. doi: 10.3354/meps333271
Sand-Jensen, K. (1975). Biomass, net production, and growth dynamics in an eelgrass (Zostera marina L.) population in Vellerup Vig, Denmark. Ophelia 14, 185–201. doi: 10.1080/00785236.1975.10422501
Skov-og Naturstyrelsen (1996). EF-fuglebeskyttelsesområder og Ramsarområder. Kort og områdebeskrivelser. Miljø-og Energiministeriet, Skov-og Naturstyrelsen, 273.
Sutherland, W. J. (1983). Aggregation and the ‘Ideal Free’ Distribution. J. Anim. Ecol. 52, 821–828. doi: 10.2307/4456
Bouma, T. J., de Vries, M. B., Low, E., Peralta, G., Tanczos, C., van de Koppel, J., et al. (2005). Trade-offs related to ecosystem engineering: a case study on stiffness of emerging macrophytes. Ecology 86, 2187–2199. doi: 10.1890/04-1588
Valdemarsen, T., Canal-Verges, P., Kristensen, E., Holmer, M., Kristiansen, M. D., and Flindt, M. R. (2010). Vulnerability of Zostera marina seedlings to physical stress. Mar. Ecol. Prog. Ser. 418, 119–130. doi: 10.3354/meps08828
Vestergaard, P. (1998). Vegetation ecology of coastal meadows in Southeastern Denmark. Opera Bot. 134, 1–69.
Walsberg, G. E. (1983). “Avian ecological energetics,” in Avian Biology, Vol. 7, eds D. S. Farner and J. R. King 7 (New York, NY: Academic Press), 161–220.
Waycott, M., Duarte, C. M., Carrouthers, T. J., Orth, R. J., Dennison, W. C., Olyarnik, S., et al. (2009). Accelerating loss of seagrasses across the globe threatens coastal ecosystems. Proc. Natl. Acad. Sci. U.S.A. 106, 12377–12381. doi: 10.1073/pnas.0905620106
Windolf, J., Timmermann, A., Kjeldgaard, A., Bøgestrand, J., Larsen, S. L., and Thodsen, H. (2013). Landbaseret Tilførsel af kvælstof og Fosfor til Danske fjorde og Kystafsnit, 1990–2011. Teknisk rapport fra DCE - Nationalt Center for Miljø og Energi no. 31 Aarhus Universitet, DCE – Nationalt Center for Miljø og Energi. Available online at: http://dce2.au.dk/pub/TR31.pdf
Keywords: eelgras, herbivore waterbirds, plant herbivore interactions, eelgrass consumption, eelgrass biomass, eelgrass cover, waterbird consumption
Citation: Balsby TJS, Clausen P, Krause-Jensen D, Carstensen J and Madsen J (2017) Long-term Patterns of Eelgrass (Zostera marina) Occurrence and Associated Herbivorous Waterbirds in a Danish Coastal Inlet. Front. Mar. Sci. 3:285. doi: 10.3389/fmars.2016.00285
Received: 16 June 2016; Accepted: 19 December 2016;
Published: 10 January 2017.
Edited by:
Maria C. Uyarra, AZTI Tecnalia, SpainReviewed by:
Anna R. Armitage, Texas A&M University at Galveston, USACopyright © 2017 Balsby, Clausen, Krause-Jensen, Carstensen and Madsen. This is an open-access article distributed under the terms of the Creative Commons Attribution License (CC BY). The use, distribution or reproduction in other forums is permitted, provided the original author(s) or licensor are credited and that the original publication in this journal is cited, in accordance with accepted academic practice. No use, distribution or reproduction is permitted which does not comply with these terms.
*Correspondence: Thorsten J. S. Balsby, dGhiYUBiaW9zLmF1LmRr
Disclaimer: All claims expressed in this article are solely those of the authors and do not necessarily represent those of their affiliated organizations, or those of the publisher, the editors and the reviewers. Any product that may be evaluated in this article or claim that may be made by its manufacturer is not guaranteed or endorsed by the publisher.
Research integrity at Frontiers
Learn more about the work of our research integrity team to safeguard the quality of each article we publish.