 Luis Puelles
- Department of Human Neuroanatomy and Psychobiology, School of Medicine, University of Murcia, and Pascual Parrilla Institute of Biomedical Research, Murcia, Spain
This review summarizes and illustrates the assumptions, structure, and updates that apply to the prosomeric model of brain development. The anteroposterior structure is summarized in terms of tagmata, proneuromeres, and neuromeres. The primary dorsoventral structure relates to the four longitudinal zones of His: the floor, basal, alar, and roof plates. There exists a secondary microzonation of these primary longitudinal zones, and the alar plate domains of the neuromeres seem to show in some cases an anteroposterior tripartition. Topological consideration of the axial bending of the brain and practical consequences as regards section planes is presented. The midline, a fundamental reference, is described in detail in terms of floor, roof, and acroterminal components and landmarks. Finally, the relationship of axonal tracts and blood vessels to the subdivisions in the model is briefly treated.
1 Introduction
The prosomeric model was initially postulated on the basis of a handful of mouse embryonic gene expression results (Bulfone et al., 1993; Puelles and Rubenstein, 1993; Rubenstein et al., 1994). These data were interpreted as revealing various transverse interneuromeric boundaries within a somewhat heterodox but realistic conception of the bent longitudinal axis of the neural tube (red line in Figure 1A). This analysis disagreed with the forebrain axial assumptions of the long-established columnar brain model of Herrick (1910), Kuhlenbeck (1927, 1954, 1973), and Swanson (2012, 2018), who did not take into consideration the marked cephalic flexure, nor the end of the notochord. Note that the axis postulated ends rostrally in the hypothalamus under the suprachiasmatic area (SCH), not in the telencephalon. This is the main assumption of this model and underpins interpretation of what is longitudinal versus transversal in the brain. According to it, the interneuromeric boundaries (thicker black lines in Figure 1A) are orthogonal to the axis (transverse), irrespective where they are in the deformed brain.
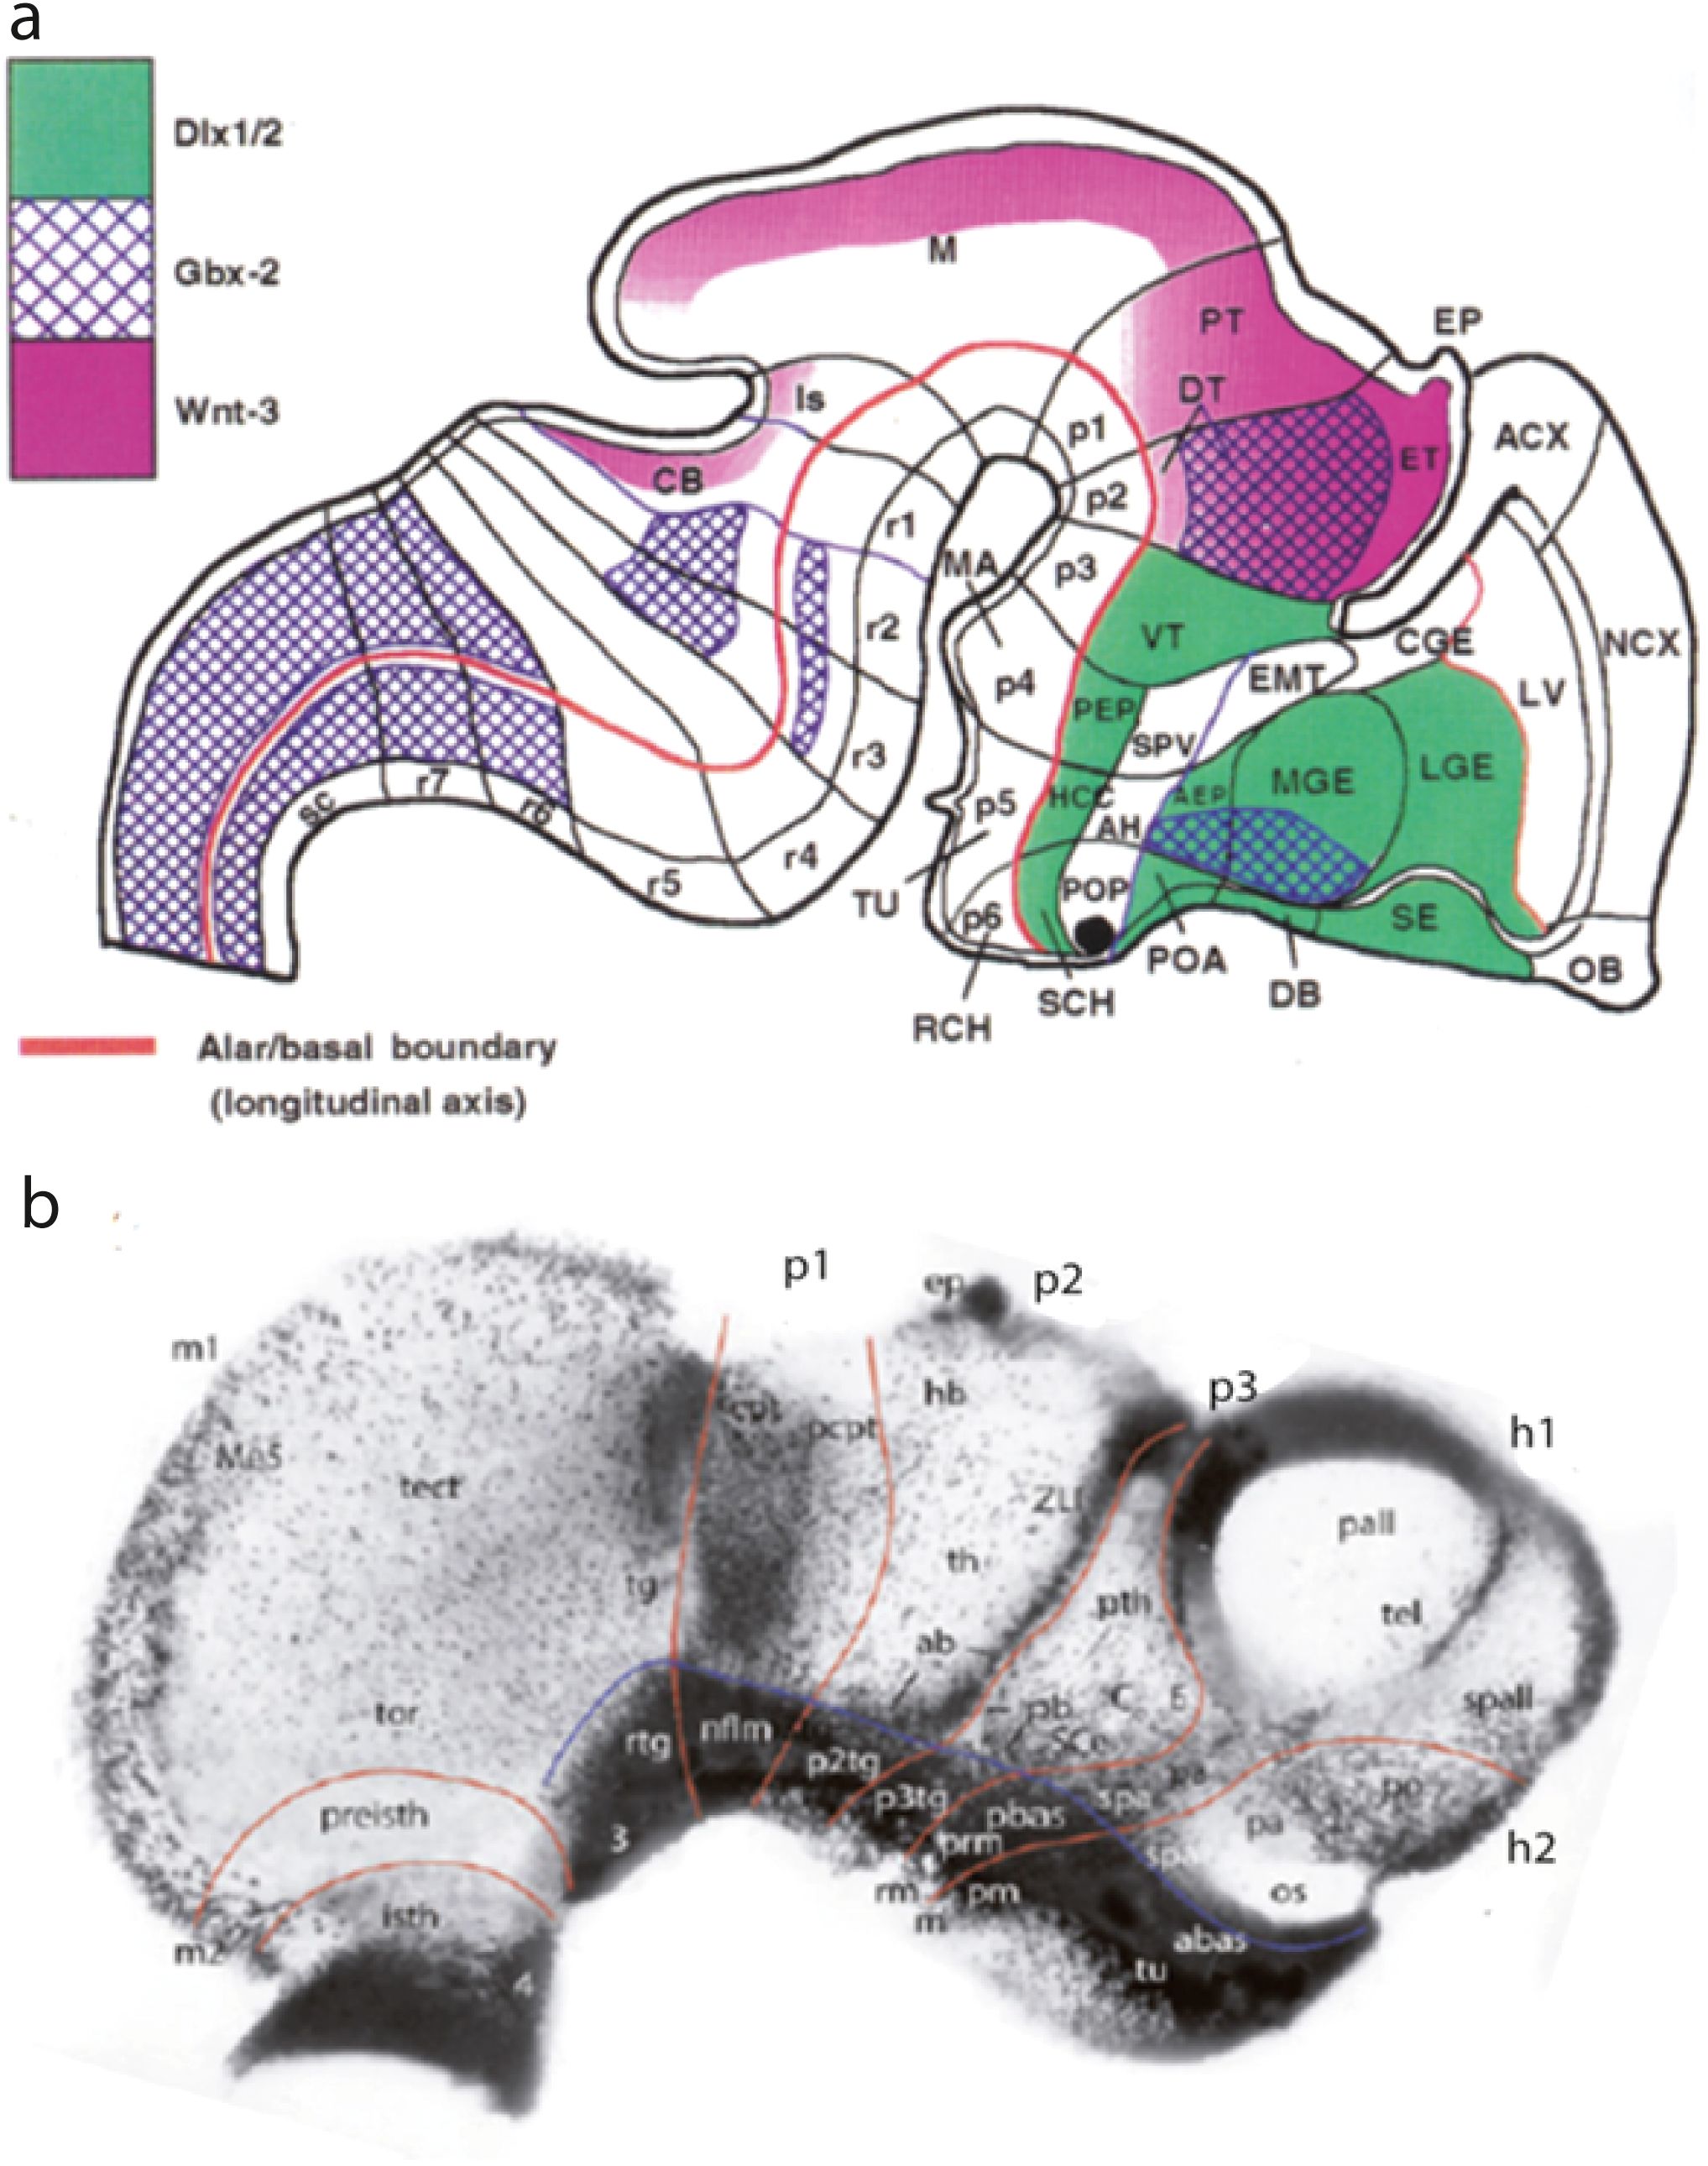
Figure 1. (A) Initial prosomeric model of Bulfone et al. (1993), showing maps of the expression of three genes (see color code). Postulated interneuromeric boundaries are drawn as black lines topologically orthogonal to the brain axis; the latter is presented as read along the alar–basal boundary (red line). Note that this earliest version postulated three diencephalic (p1–p3) and three hypothalamic prosomeres (p4–p5) and did not count the midbrain as a part of the forebrain. This pattern was revised later, reaching the neuromeric structure proposed by Puelles et al. (2012a) in the presently used “updated prosomeric model” (see Figures 11A, B). AEP, anterior entopeduncular area; AH, anterior hypothalamic area; CB, cerebellum; CGE, caudal ganglionic eminence; DT, dorsal thalamus; DV, diagonal band; EMT, eminentia thalami; EP, epiphysis; ET, epithalamus; HCC, hypothalamic cell cord; Is, isthmus; LGE, lateral ganglionic eminence; LV, lateral ventricle; M, midbrain; MGE, medial ganglionic eminence; PEP, posterior entopeduncular area; POA, anterior preoptic area; POP, posterior preoptic area; PT, pretectum; sc, spinal cord; SCH, suprachiasmatic area; SE, septum; SPV, subparaventricular area; VT, ventral thalamus; ACX, allocortex; NCX, neocortex; OB, olfactory bulb; p1–p6, prosomeres 1–6; RCH, retrochiasmatic area; r1–r7, rhombomeres 1–7. (B) Wholemount of a dissected embryonic chick forebrain (peeled of skin and meninges; optic vesicles eliminated -at os) reacted for AChE at stage HH20 (nearly 3 days incubation) and transparentized. AChE signal appears mainly in newborn neurons (progenitors are negative, except at singular places with glial expression, like the commissural pretectum -cpt-, the epiphysis-ep-, and the zona limitans intrathalamica -ZLI). The piece contains the forebrain plus an attached prepontine (isthmic) part of the hindbrain. Note the precociously developed basal plate neuronal population, which shows a sharp longitudinal boundary with the larger but retarded alar plate (blue line) and is interrupted at the isthmo-mesencephalic boundary. This alar–basal boundary falsates the columnar thesis for the forebrain, particularly the thesis that thalamus and prethalamus are longitudinal columns, since they clearly turn out to be transversal neuromeres. The interneuromeric limits are traced as red lines orthogonal to the blue line. Note likewise the negative floor plate, due to its lack of neurogenesis. At earlier stages, each neuromeric sector of the basal plate emerges in a heterochronic and non-lineal pattern (e.g., first nflm, second abas). From Amat et al. (2022). See also Puelles et al. (1987). 3, oculomotor nucleus; 4, trochlear nucleus; ab, anterobasal thalamic area; abas, anterobasal area; C, central prethalamus; cpt, commissural pretectal area; E, eminential prethalamic area; ep, epiphysis; h1, h2, hypothalamo-telencephalic prosomeres 1, 2; hb, habenular area; isth, isthmus; m, mamillary area; m1, m2, mesomeres 1–2; Me5, mesencephalic trigeminal nucleus; nflm, area of the medial longitudinal fascicle nucleus; os; optic stalk; p1–p3, diencephalic prosomeres 1–3; p2tg, tegmental area of p2; p3tg, tegmental area of p3; pa, paraventricular area; pall, pallium; pb, posterobasal prethalamic area; pbas, posterobasal area; pcpt, precommissural pretectal area; pm, perimamillary area; po, preoptic area; preisth, preisthmus; prm, periretromamillary area; pth, prethalamus area; rm, retromamillary area; rtg, rostral tegmental area; SCe, subcentral prethalamus; spa; subparaventricular area; spall, subpallium; tect, optic tectum (sup.coll); tel, telencephalon; tg, tegmental area; th, thalamus area; tor, torus semicircularis (inf.coll); tu, tuberal area.
The morphologic analysis leading to this brain model was strongly inspired by previous wholemount acetylcholinesterase mappings of chick neurogenesis, which already indicated a neuromeric pattern related to a bent axis, manifested in this case by the sharp contrast between the precociously differentiated (bent) basal plate and the neurogenetically retarded alar plate (Puelles et al., 1987, 2015); see the recent review and comparative analysis of such material in chick, lizard, and rat embryos in Amat et al. (2022), representing much delayed publication of Amat’s (1986) doctoral thesis (Figure 1B). The mouse collaborations initiated with J.L.R. Rubenstein (UCSF) in the early ‘90s led to the cited publications revealing that gene expression patterns support a forebrain neuromeric model (Bulfone et al., 1993; Puelles and Rubenstein, 1993; Rubenstein et al., 1994; Puelles, 1995). We expanded subsequently into a diversity of studies, sometimes in collaboration with other laboratories, on the development and comparative structure of the diencephalon, midbrain, hindbrain, hypothalamus, and telencephalon across vertebrates. This research guided several revisions of the initial model as additional molecular evidence was gathered, and we acquired better morphological and causal insights.
This molecularly based neuromeric concept was consistent with antecedent neuromeric neuroembryological descriptions across vertebrates, whose occasional technical or interpretive defects were resolved (e.g., Orr, 1887; Locy, 1895, Figure 2; McClure, 1890; Neal, 1898; Hill, 1899; von Kupffer, 1906; Ziehen, 1906; Tello, 1923, 1934; Rendahl, 1924, Figure 3A; Bergquist, 1932; Bergquist and Källén, 1954, Figure 3B; Coggeshall, 1964; Vaage, 1969, 1973; Keyser, 1972; Gribnau and Geijsberts, 1985; Puelles et al., 1987; Redies et al., 2000). Personal recollections on the development of this first molecular neuromeric model were published (Puelles, 2021).
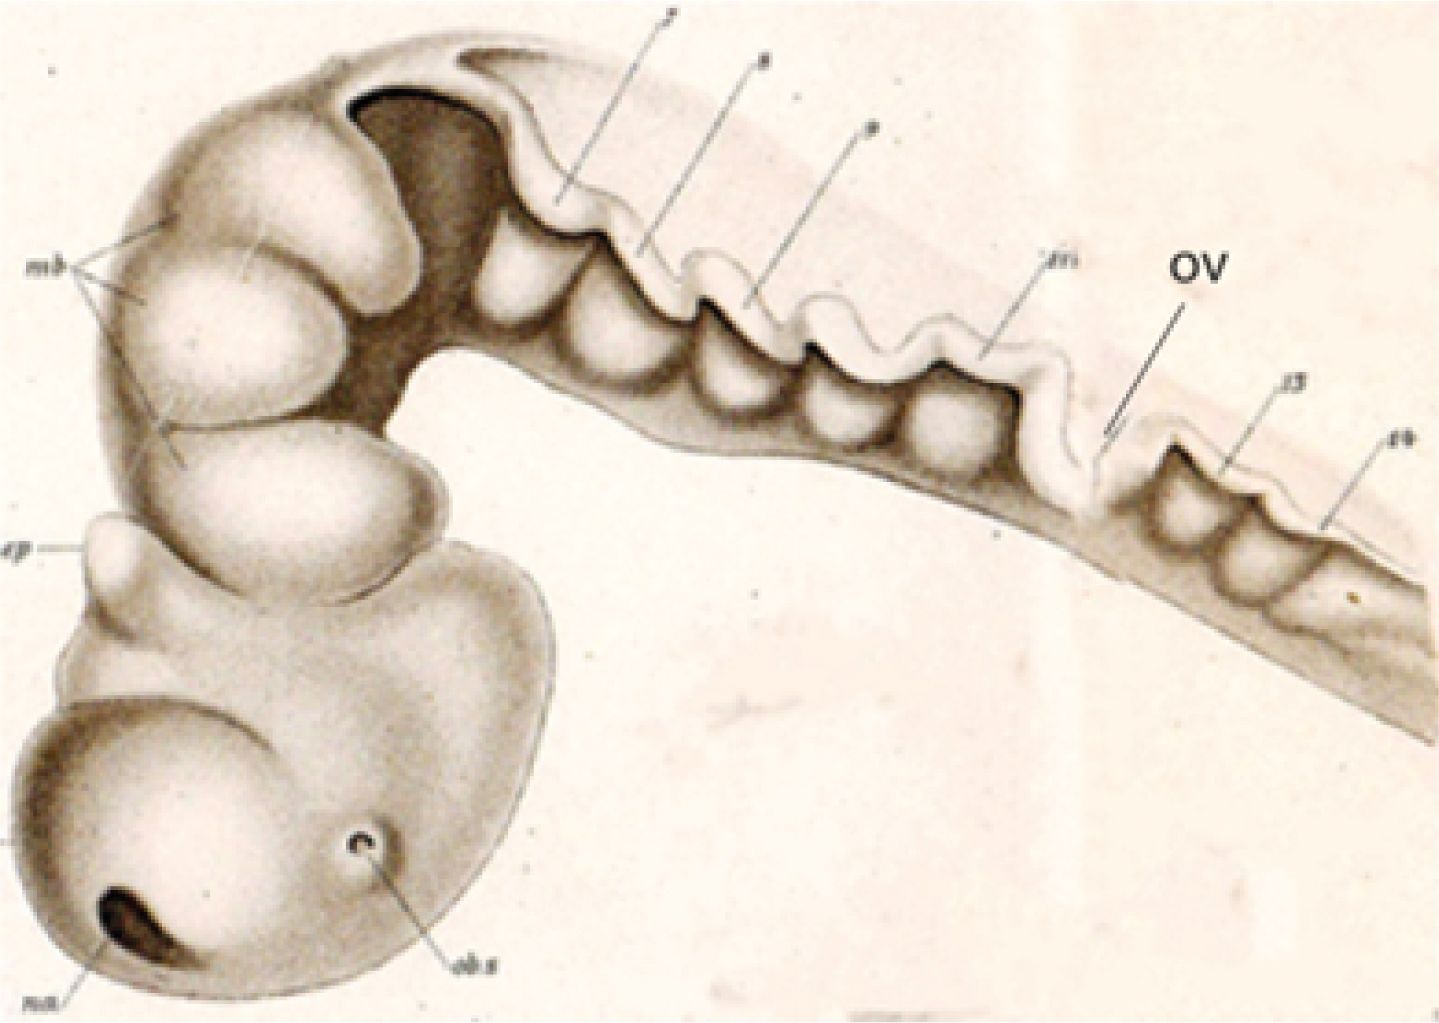
Figure 2. Neuromeric bulges of the neural tube visualized in the larval shark Squalus acanthias by Locy (1895). Nowadays, we interpret the three bulges labeled “midbrain” (mb) as the three diencephalic prosomeres (p1–p3). Rostrally to them, we can see the hypothalamo-telencephalic secondary prosencephalon complex that forms the end of the neural primordium. The true midbrain lies at the apex of the cephalic flexure and separates the diencephalon from the typical present-day five preotic hindbrain rhombomeres r0–r4. Caudally to the open otic vesicle (ov) we see the bulging rhombomeres r5 and r6, preceding the begin of the medullary region (where we now identify molecularly and experimentally a number of additional cryptic neuromeres). Note the still open rostral neuropore (na) at the roof of the secondary prosencephalon. The epiphysis (ep) is apparently wrongly identified (it should be in p2). 7–9, neuromeres 7–9; 11, neuromere 11; 13–14, neuromeres 13–14; ep, epiphysis; mb, midbrain; na, anterior neuropore; ob.s, optic stalk; ov, otic vesicle (invaginating).
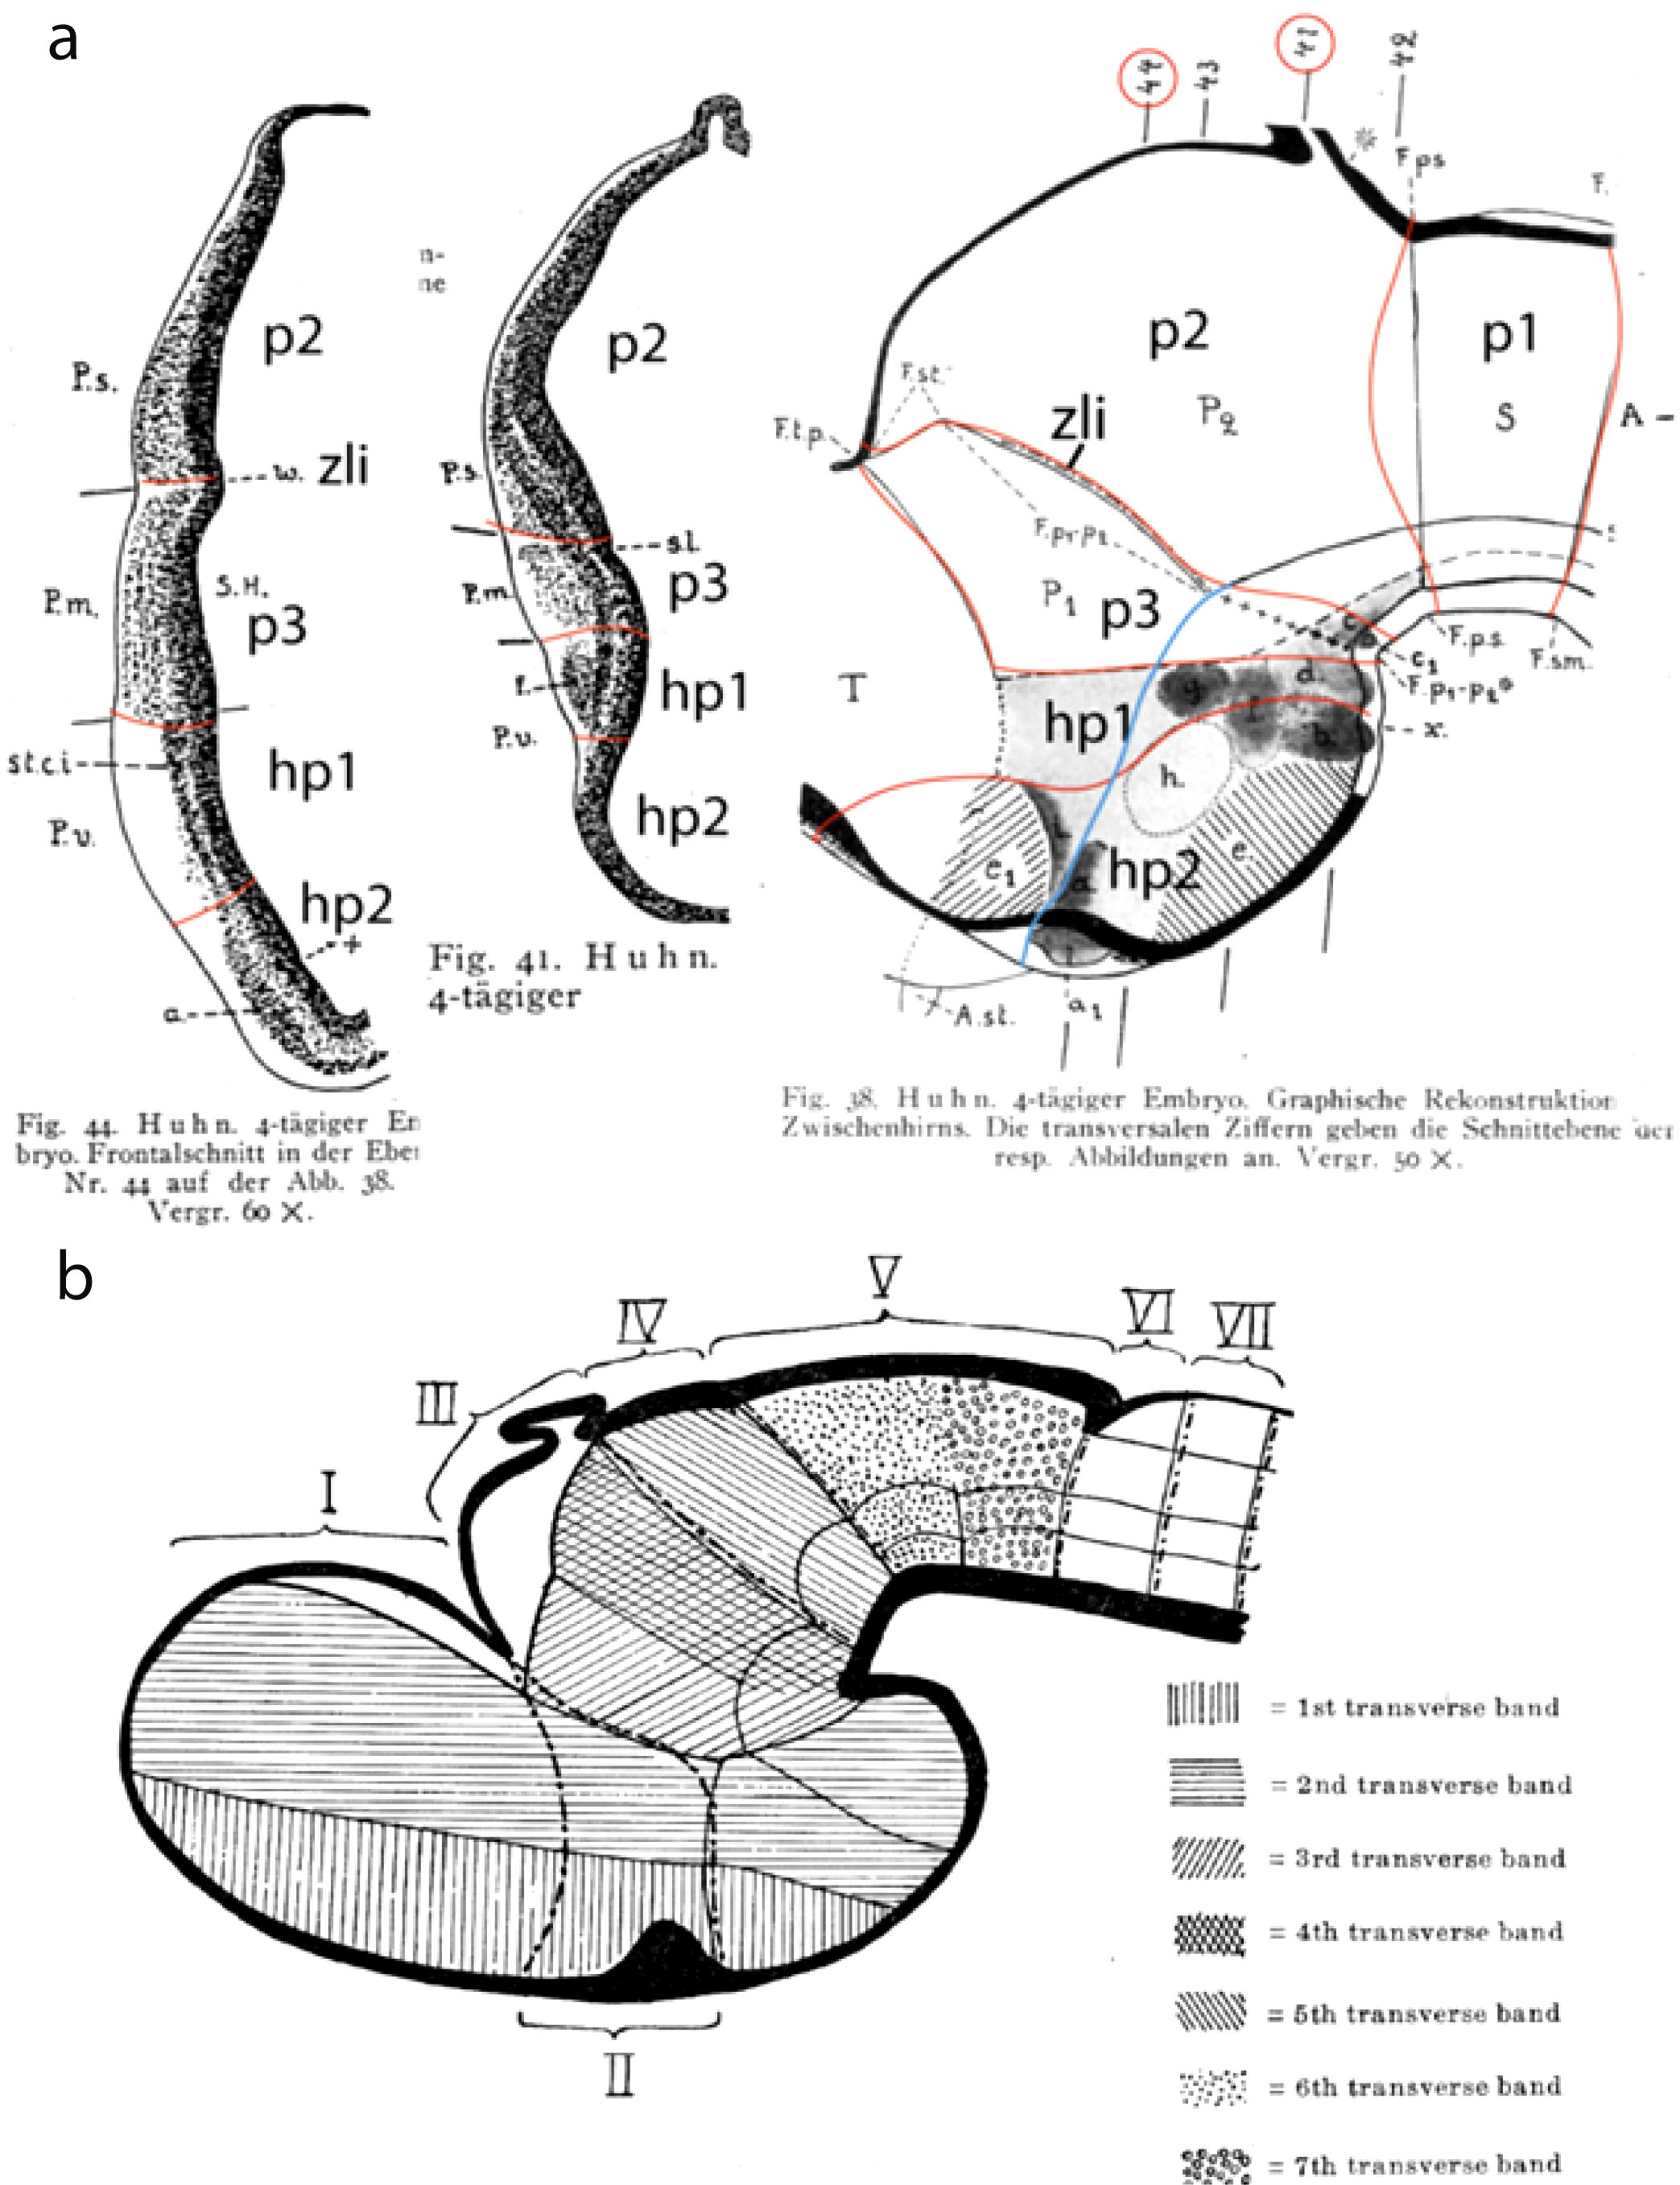
Figure 3. (A) Two diencephalic cross sections (actually nearly horizontal sections) showing diencephalic interneuromeric boundaries, correlative changing cytoarchitecture, and a graphic reconstruction of the diencephalic wall in a 4-incubation-day-old chick embryo, modified from the doctoral thesis of Rendahl (1924). The added large-size alpha-numeric tags reinterpret the identity and limits (with added identifying red lines) of the neuromeres visualized, in accordance with the updated prosomeric model (Puelles et al., 2012a; image reproduced from Puelles, 2021). The longitudinal (axial) alar–basal boundary was prolongated into the hypothalamus as a blue line (note all interneuromeric boundaries drawn as red lines—supported by the two cytoarchitectonic sections—are topologically orthogonal to this longitudinal landmark; cytoarchitectonic boundaries also are evident in the hypothalamus, where peduncular and terminal h1 and h2 portions can be distinguished). Note that both sections start in the alar plate and end in the basal plate. The levels of the two sections are indicated in the reconstruction by the red-circled section numbers. Due to the axial bending, the neuromeric territories are shorter near the floor plate. a, a1, cell group “a” (anterobasal nucleus); A, midbrain; A.st, optic stalk; b, cell group “b” (mamillary n.); c, cell group “c”; e1, cell group “e1” (alar terminal area); d, cell group “d” (retromamillary area); e, cell group “e” (tuberal median eminence area); f, cell group “f” (posterior hypothalamus); F.p1–p2*, ventral part of F.p1–p2; F.p1–p2, interparencephalic fissure; F.ps, parencephalo-synencephalic fissure; F.sm, synencephalo-mesencephalic fissure; F.tp, teloparencephalic fissure; g, cell group “g” (subthalamic n.); h, cell group “h” (ventromedial n.)?; hp1, hp2, updated hypothalamo-telencephalic prosomeres hp1–hp2; P.s., pars medialis; P.s., pars superior; P.s., pars ventralis; P1, anterior parencephalon (p3); p1–p3, updated diencephalic prosomeres p1–p3; P2, posterior parencephalon (p2); S, synencephalon (p1); S.H., segmental cavity of parencephalon anterius (p3); s.l., sulcus limitans (alar–basal boundary); T, telencephalon; w, interparencephalic limiting ridge (zli); x, intermamillary sulcus; zli, interthalamic zona limitans (= w). (B) Generalized neuromeric schema of Bergquist and Källén (1954) of the structure of the vertebrate forebrain (including the midbrain), representing on one hand their ‘transverse bands’ (i.e., neuromere precursors; see code list) and on the other their “neuromeres” (identified by Roman numbers). The pattern of the transverse bands agrees substantially with the “updated prosomeric model” (compare Figure 16; only the intrahypothalamic limit between the first and second transverse bands fails to find the mamillary/retromamillary boundary, revealing a misconceived concept of the forebrain floor plate). The pattern of their “neuromeres” instead disagrees in several aspects with the modern prosomeres (particularly I–III) since their limits imply admittance of the arbitrary columnar axis ending in the telencephalon and postulate an inexistent floor underneath them (instead of our acroterminal domain, AT). This causes neuromeres I and II of Bergquist and Källén (1954) to lie exclusively in what we identify as the alar plate, contradicting the definition of a neuromere. I–VII, neuromeres I–VII.
In the period of more than 30 years lapsed since its conception, the prosomeric model has shown significant capacity to integrate and even predict numerous accruing molecular and experimental patterning data in the growing field of brain evo-devo, consistently providing morphological meaning to such results across amniote and anamniote vertebrate species (Puelles, 1995; Puelles et al., 1996; Wullimann et al., 1999; Wullimann and Puelles, 1999; Puelles, 2001, 2013, 2017, 2018; Redies et al., 2000; Díaz and Puelles, 2020) down to cyclostomes (Pombal and Puelles, 1999; Pombal et al., 2009; Martínez-de-la-Torre et al., 2011) and cephalochordates (Albuixech-Crespo et al., 2017; Ferran et al., 2022). It is presently the prevalent model used in developmental and comparative neurobiology and is increasingly presented in neuroanatomic or neuroembryologic atlases, textbooks and treatises (Striedter, 2005; Puelles et al., 2007, 2008, 2019a; Watson et al., 2010; Nieuwenhuys and Puelles, 2016; Ten Donkelaar et al., 2018, 2023; Ten Donkelaar, 2020; Striedter and Northcutt, 2020; Schröder et al., 2020; Carsten, 2024).
In the meantime, the model has evolved via occasional updates, which added or corrected details on the basis of accrued evidence, thus progressing in consistency (see below); the rationale for most of these changes has been explained (e.g., Bulfone et al., 1993, 1995; Puelles, 1995; Puelles and Rubenstein, 1993, 2003, 2015; Rubenstein et al., 1994; Puelles et al., 2012a; Puelles, 2013, 2016, 2017, 2018, 2019; Ferran et al., 2015; Tomás-Roca et al., 2016; Díaz and Puelles, 2020; Amat et al., 2022; Puelles and Hidalgo-Sánchez, 2023).
The aim of the present account is to summarize succinctly the updated tenets, assumptions and morphologic explanations of this model, preparatory to a detailed description in ulterior publications of the adult structures that are held to derive from the individual neuromeres (considering descriptive embryologic studies, fate-mapping experiments and transgenic studies of progeny).
A basic notion is that the prosomeric model postulates a causally underpinned concept of the topologic axial and dorsoventral dimensions and subdivisions of the neural primordium, irrespective of their eventual morphogenetic deformations. This is consistent with evidence for progressive anteroposterior (AP) partitioning, first into large tagmata (forebrain, hindbrain, and spinal cord), then into proneuromeres (for instance, the forebrain divides into hypothalamus, diencephalon, midbrain, etc.), and finally the proneuromeres divide into a fixed number of neuromeres, which can be overt (visible as bulges) or cryptic, that is, only delimited molecularly (see Puelles, 2018; Figure 4). The neuromeres are thus the smallest complete AP segments (anteroposterior complete transverse parts) of the neural tube. They are held to result from anteroposterior patterning triggered during gastrulation by the prechordal plate and the node, complemented by signals from secondary organisers (Puelles, 2017). Each of these transverse parts obtains a unique molecular profile that establishes its prospective histologic fate; the resulting boundaries are permanent (i.e., are still present in the adult brain, irrespective of morphogenetic deformations or tangential cell migrations, being best identifiable by molecular or experimental mappings; Figures 5A–F, 6, 7, 8A, and 9.
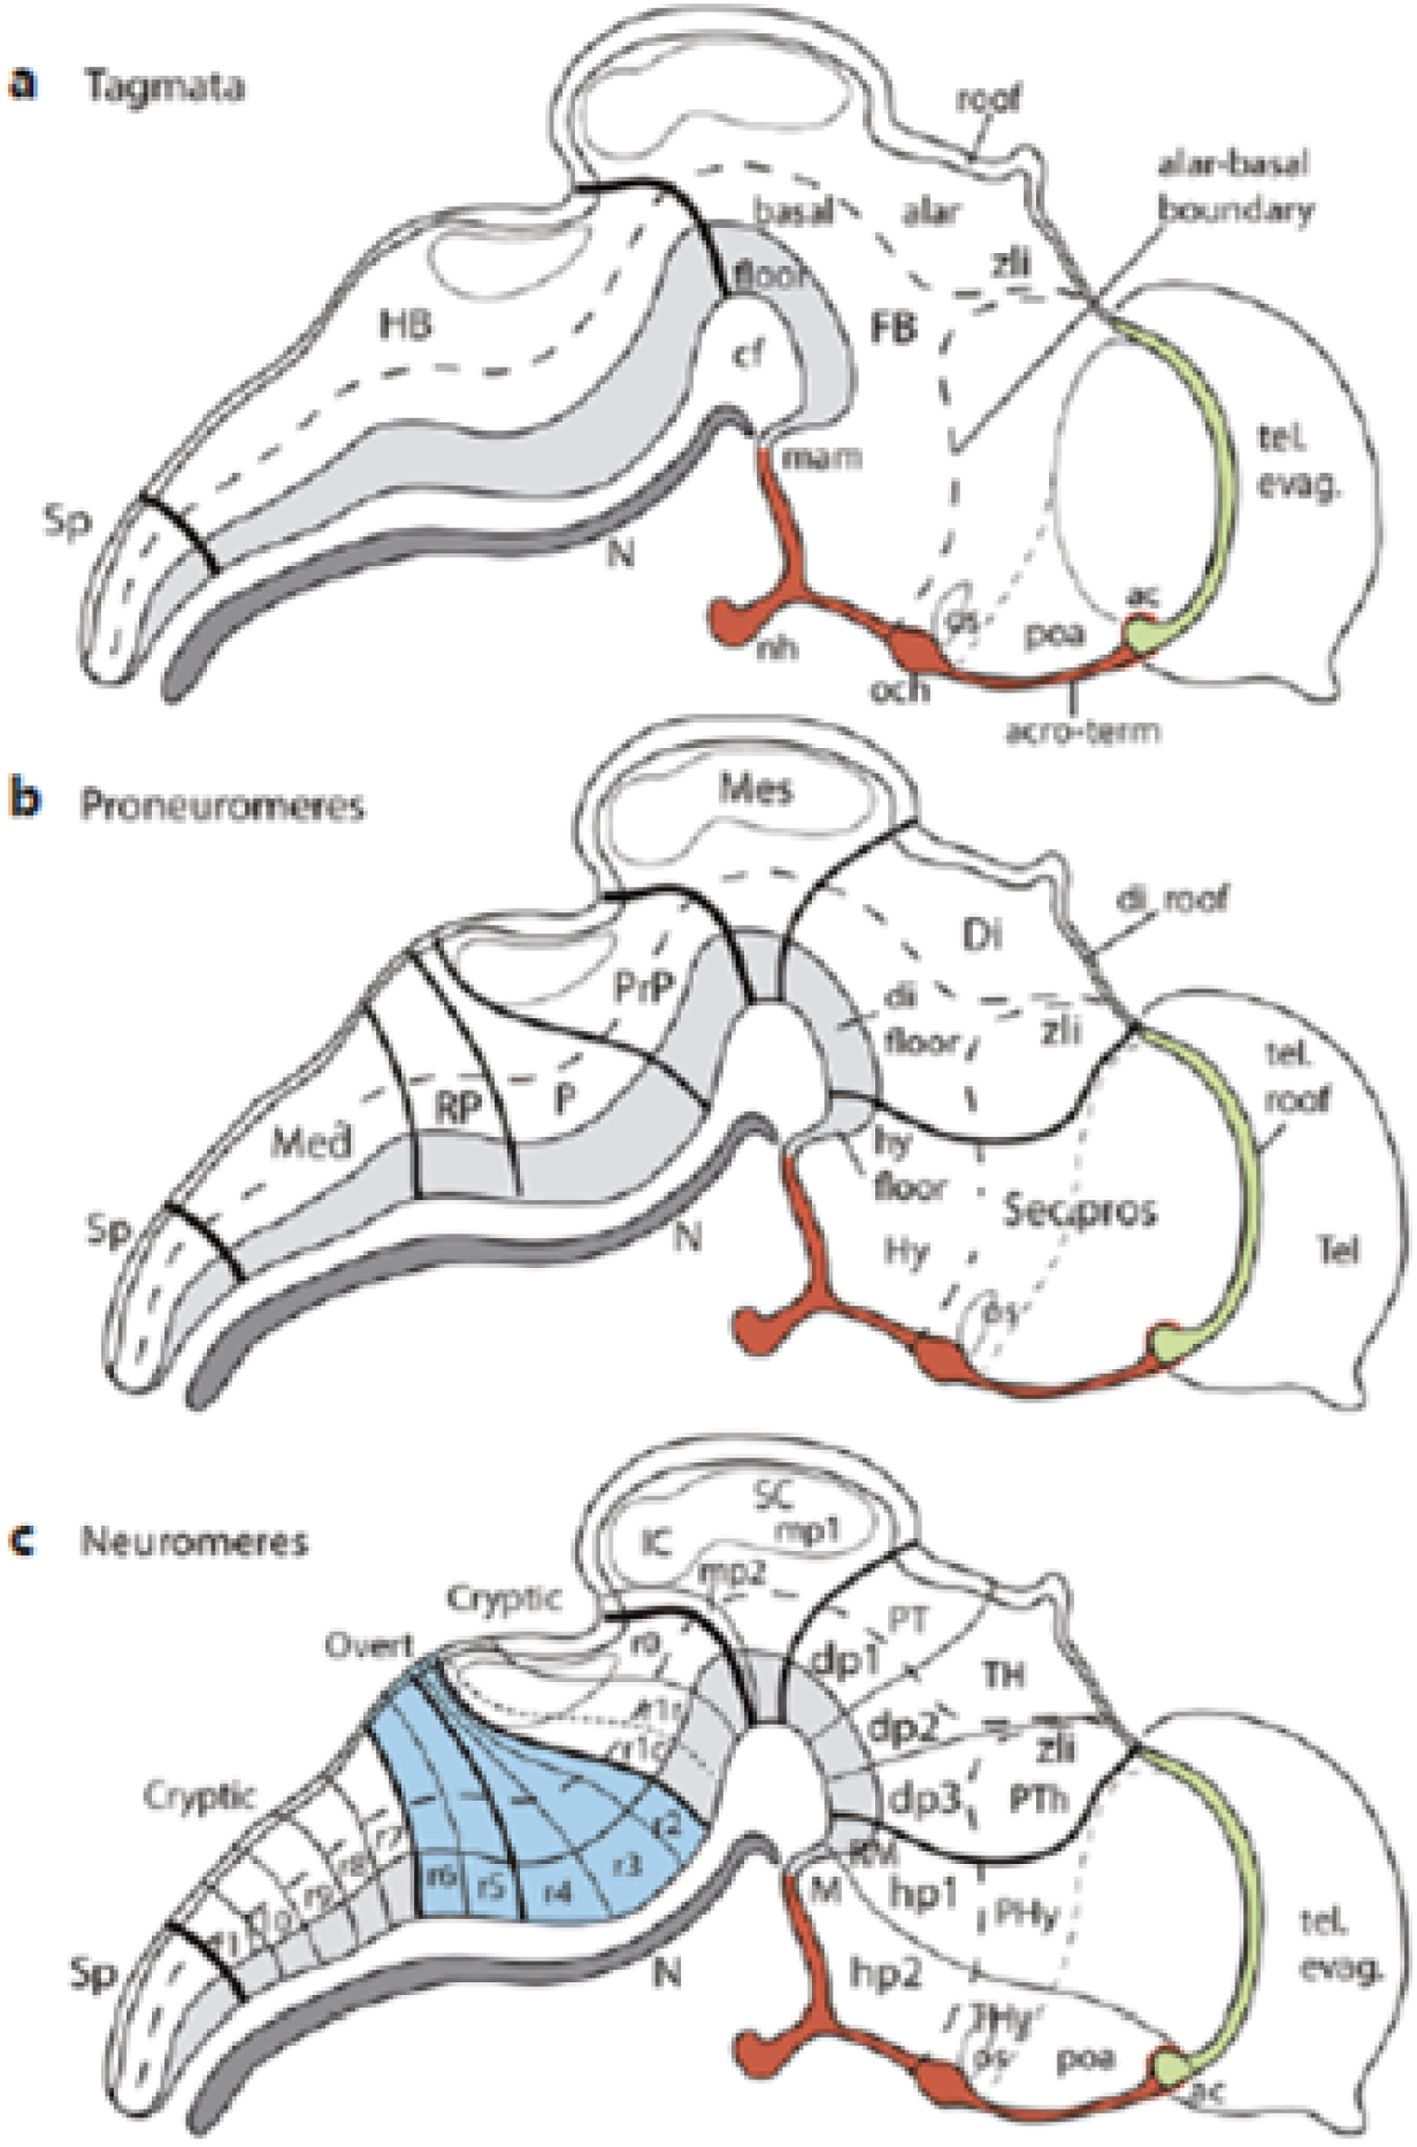
Figure 4. Schematic delimitation (taken from Puelles, 2018) of tagmata [(A), thick black boundaries], proneuromeres (B) medium-thick black limits), and neuromeres [(C), thin black lines; note some are overt—blue block in c—and others are cryptic—only distinguishable molecularly; see molecular evidence in Tomás-Roca et al., 2016]. The alar–basal boundary is represented by a large-dash line (the small-dash line is the hypothalamo-telencephalic limit). The floor plate has a light gray background, while the notochord appears in dark gray. A red background characterizes the rostromedian AT, representing the topological rostral end of the neural tube, extending from the rostralmost floor (mamillary body, M, light gray) to the hypothalamic roof (in green; anterior commissure, ac; compare same area in Figure 14). All the boundaries represented are permanent and can be identified molecularly (or by other means) in all adult vertebrate brains. ac, anterior commissure; acro-term, acroterminal area; cf, cephalic flexure; di, diencephalic floor; Di, diencephalic FB proneuromere; evag, evagination; FB, forebrain; HB, hindbrain; hp1, hp2, hypothalamo-telencephalic prosomeres 1–2; hy, hypothalamic floor; Hy, hypothalamus; IC, inferior colliculus; M, mamillary area; Med, medullary HB proneuromere; Mes, midbrain FB proneuromere; mp1, mp2, mesomeres 1–2; dp1–dp3, diencephalic prosomeres 1–3; N, notochord; nh, neurohypophysis; och, optic chiasma; os, optic stalk; P, pontine HB proneuromere; PHy, peduncular hypothalamus; poa, preoptic area; PrP, prepontine HB proneuromere; PT, pretectum; PTh, prethalamus; r0–r11, rhombomeres 0–11; RM, retromamillary área; RP, retropontine HB proneuromere; SC, superior colliculus; Sec.pros., secondary prosencephalon FB proneuromere; Sp, spinal cord; tel, telencephalon; TH, thalamus; THy, terminal hypothalamus; zli, interthalamic zona limitans.
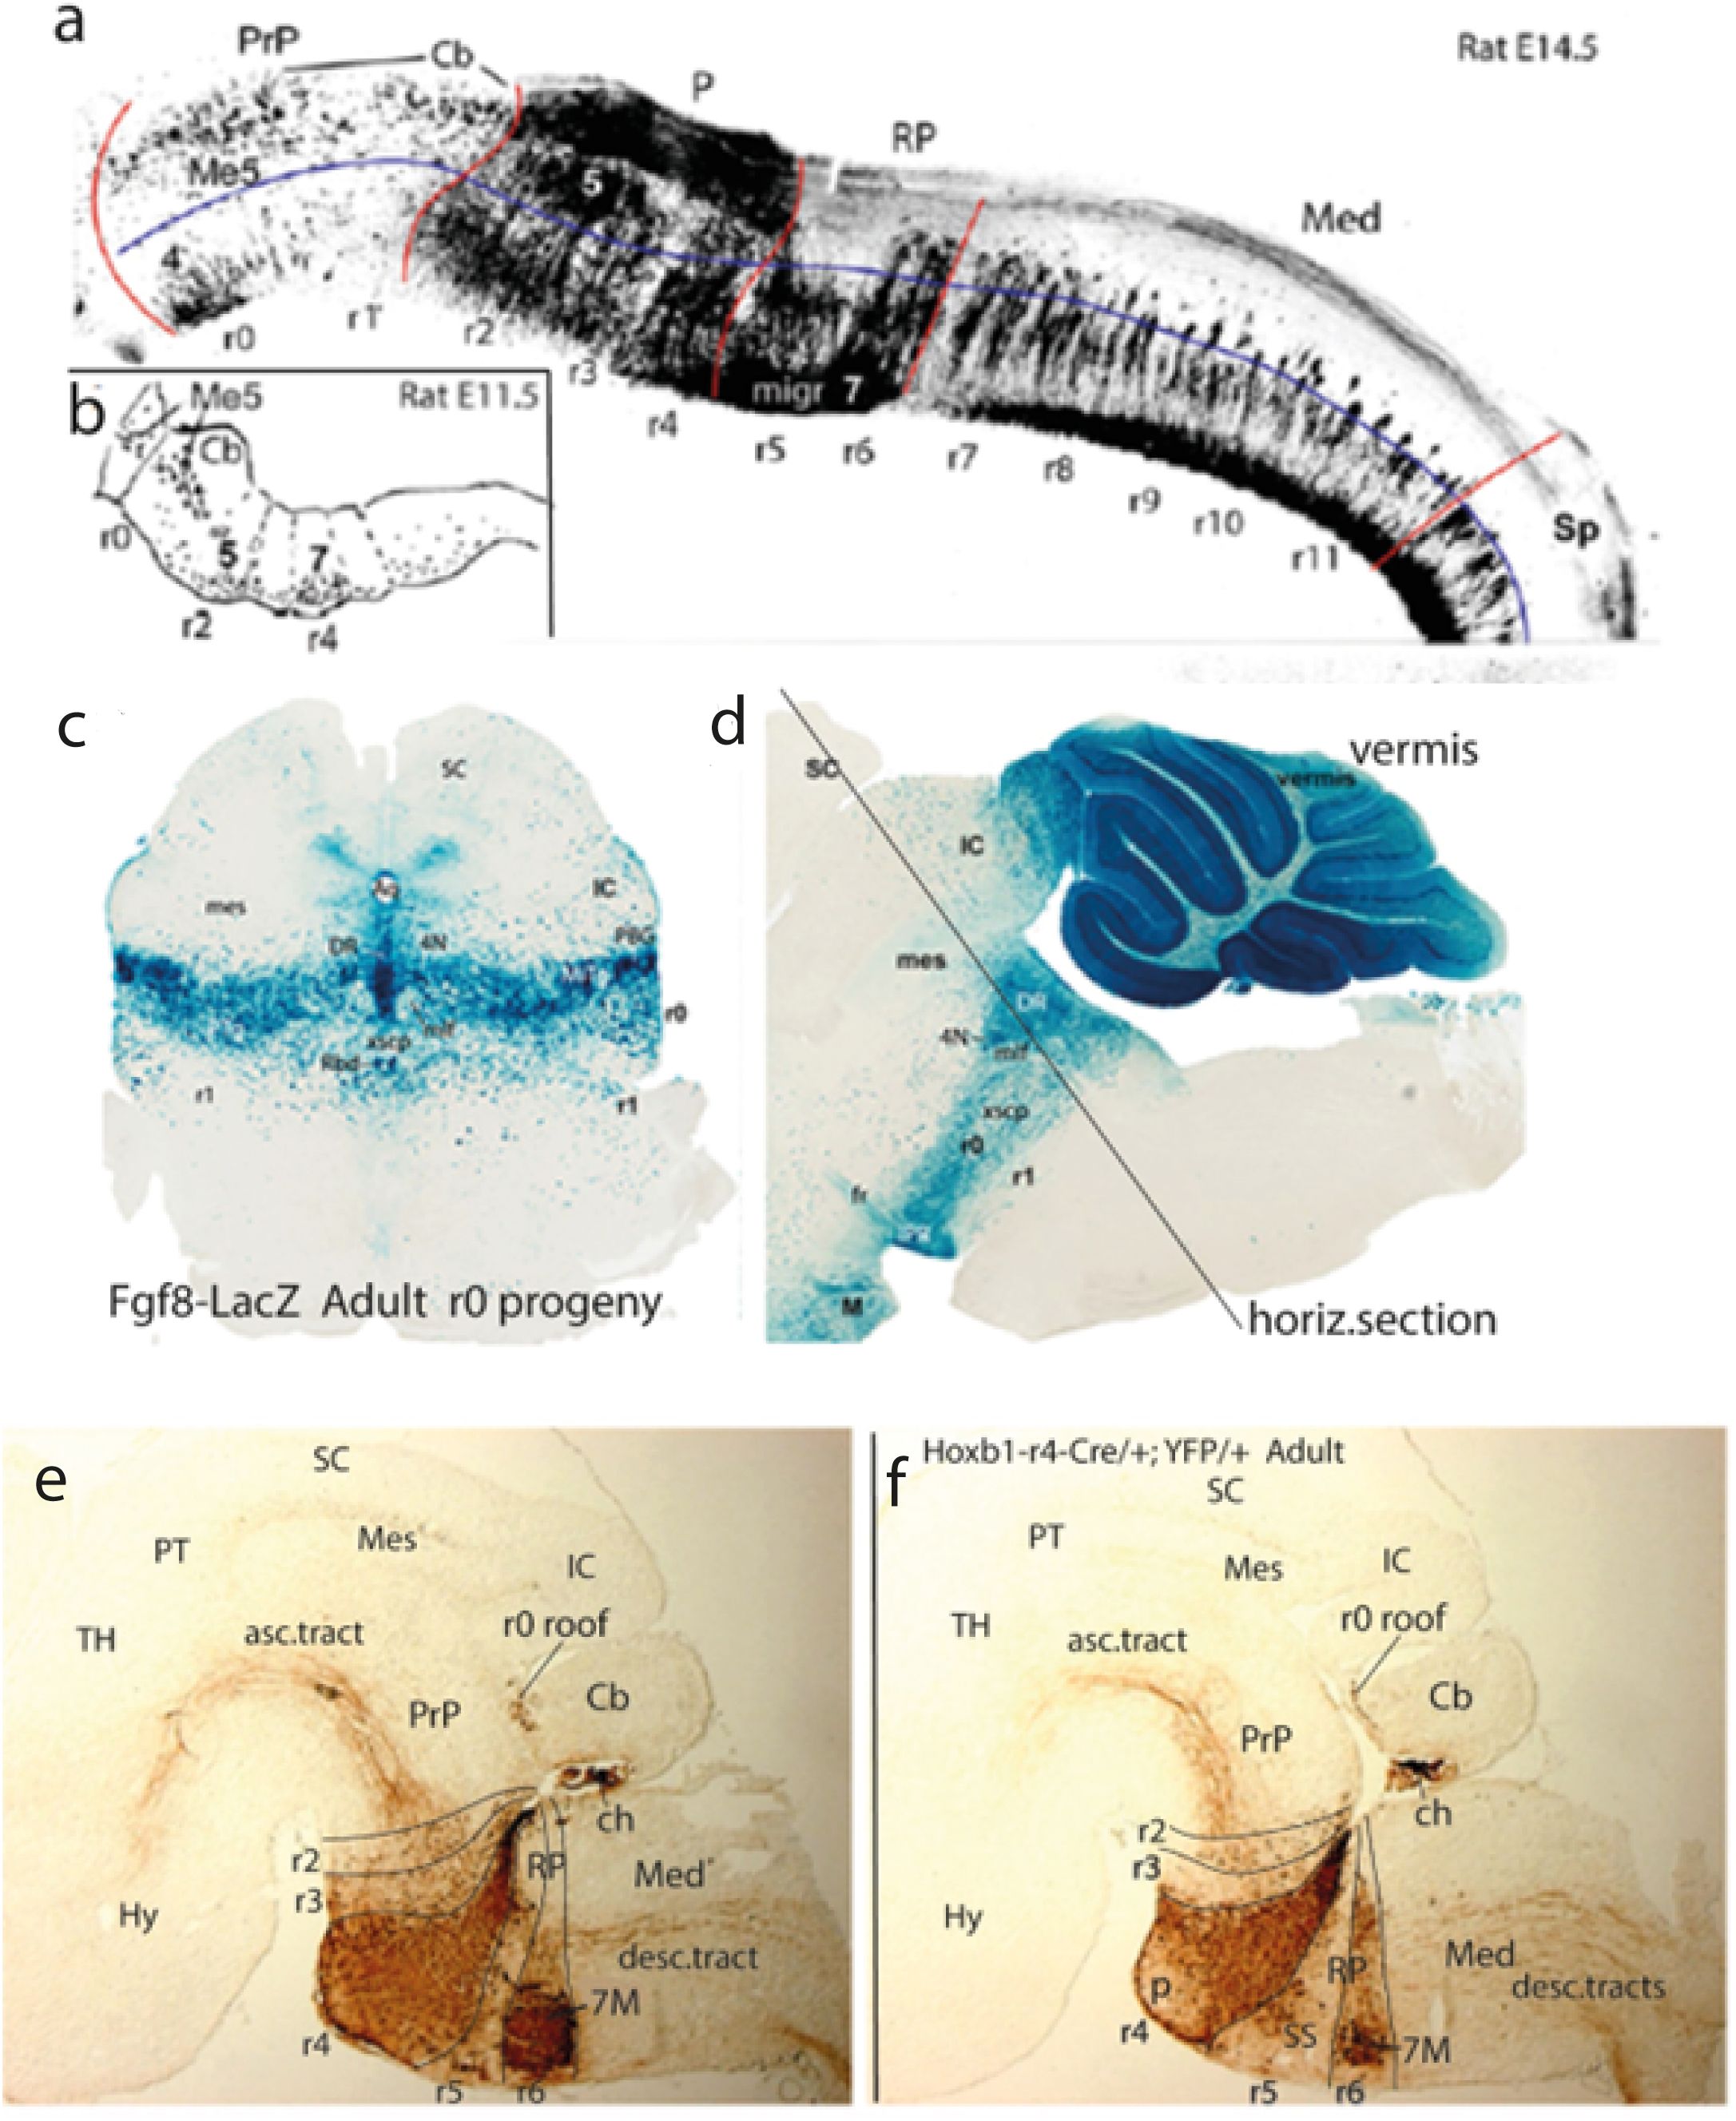
Figure 5. (A, B) AChE-reacted wholemounts of rat embryonic hindbrain (rostral to the left; from Amat et al., 2022). (A), Lateral view of the rat hindbrain at E14.5. The proneuromeres PrP, P, RP, and Med are limited by red lines; the rhombomeres are identified underneath; the estimated alar–basal boundary is represented by a blue line. At PrP levels (isthmocerebellum), neurogenesis is retarded; the trochlear motor nucleus (4) appears in the isthmic (r0) basal plate, which appears very sparsely populated in r1. In the alar plate, there are Me5 cells migrated from the midbrain and the earliest cerebellar neurons in r1 (Cb); they correspond to the prospective cerebellar nuclei. At P levels (r2–r4), we see the most advanced part of the hindbrain, particularly in the paired rhombomeres r2 and r4. Note that these three units also show advanced alar neurogenesis. The trigeminal motor nucleus population (5) has already finished its migration into the alar plate. The facial motor nucleus cells that originated in basal r4 are in the process of migrating caudalward across r5 and advancing through basal r6 into alar r6 (migr 7). The latter neuromere has some alar neurons, similarly as all the rhombomeric units composing the Med region (r7–r11). Inside the basal plate, “ventral” and “ventrolateral” neurogenetic zones can be distinguished (not marked). In all rhombomeres except r0 and r1 many neurons seem to be moving between the basal and alar domains of the hindbrain, particularly at r2 and r4. Note difficulty to detect the cryptic interrhombomeric boundaries in Med. (B) This is a drawing from an E11.5 rat hindbrain AChE-reacted specimen viewed laterally. The precocious basal plate cell groups in r2 and r4 (presumably the future 5 and 7 motor nuclei) are seen. The migration of Me5 cells into r0 and r1 is in course. 4, trochlear motor nucleus; 5, trigeminal motor nucleus; 7, facial motor nucleus; Cb, cerebellum; Me5, mesencephalic trigeminal nucleus; migr 7, migration of facial motoneurons; P, pontine proneuromere; Prp, prepontine proneuromere; r0–r11, rhombomeres 0-11; RP, retropontine proneuromere; Med, medullary proneuromere; Sp, spinal cord tagma. (C, D) Coronal (C) and sagittal (D) brain sections through the rhombo-mesencephalic boundary region in adult transgenic mouse specimens carrying a Fgf8-LacZ construct. The beta-galactosidase tag -LacZ- allows histochemical visualization in blue color of the progeny derived from the selectively Fgf8-expressing isthmic (r0) prepontine rhombomere (from Watson et al., 2017). The section plane used in (C) is shown in (D). Irrespective of minor migratorily dispersed cell populations, the cryptic transverse boundaries of the original embryonic neuromere are distinct in the adult. Similar mappings of overt rhombomeres are shown in (E, F) and Figure 6. Note r0 includes dorsally the whole mouse cerebellar vermis (but not the r1 hemispheres), as demonstrated previously by experimental fate-mapping in the chick. In (D), rostral is to the left. 4N, trochlear motor nucleus; DR, dorsal raphe nucleus; fr, retroflex tract; IC, inferior colliculus; M, mamillary body; mes; mesencephalon; mlf, medial longitudinal fascicle; PBG, parabigeminal nucleus; PTg, pedunculotegmental nucleus; r0–r1, rhombomeres 0–1; Rbd, rhabdoid nucleus; SC, superior colliculus; VTg, ventral tegmental nucleus; xscp, decussation of the superior cerebellar peduncle. (E, F) Two parasagittal sections through the hindbrain of an adult transgenic mouse carrying a Hoxb1r4-Cre/+;YFP/+ construct, brown-immunoreacted for YFP. The labelled cells and fibers thus correspond selectively to derivatives of r4 that selectively express Hoxb1 early on (progeny of r4). Note the entire dorsoventral extent of r4 (from chorioidal roof caudal to the cerebellum to the ventral pontine bulge) is labeled, but not so the basilar pontine nuclei themselves, which are migrated from a more caudal rhombic lip origin and thus remain unlabeled. The facial motor nucleus appears strongly labeled (indicating its r4 origin) but appears displaced caudalwards into alar r6, due to its migration there. Its stretched efferent axons trace the migration path and first course radially within r6 into the knee around the abducens (which lies in the basal plate of negative r5), and thereafter reach r4, where they course lateralwards into the facial root (not visible in these images). Ascending r4-thalamic and descending r4-spinal tracts originated from r4 neurons are also labeled (from Di Bonito et al., 2017). 7M, facial motor nucleus (migrated to r6); ch, chorioidal plexus (IV ventricle); Hy, hypothalamus; IC, inferior colliculus; Med, medullary proneuromere; p, pontine nucleus; PrP, prepontine proneuromere; PT, pretectum; r0, isthmic rhombomere 0; r2–r6, rhombomeres 2–6; RP, retropontine proneuromere; SC, superior colliculus; SS, superior salivatory nucleus; TH, thalamus.
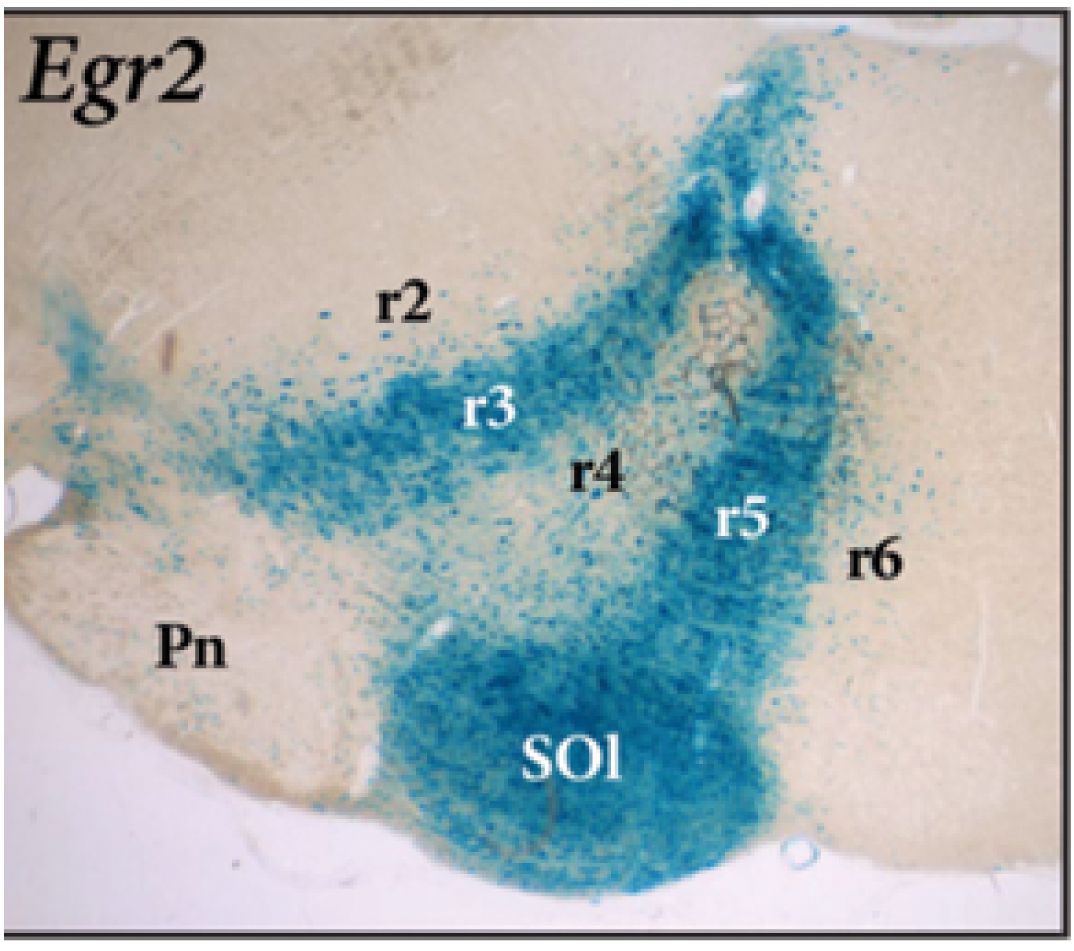
Figure 6. Parasagittal section through the hindbrain of an adult transgenic mouse carrying a r3 + r5-expressed Egr2-LacZ construct, reacted for beta-galactosidase (blue reaction product; from Watson et al., 2019). Note the inclusion of the whole superior olivary complex -SOl- within the r5 rhombomere-derived domain. The migrated basilar pontine nuclei in r3–r4 -Pn- are unlabeled. Rostral is to the left. Pn, pontine nuclei; r2–r6, rhombomeres 2–6; SOl, superior olivary nucleus.
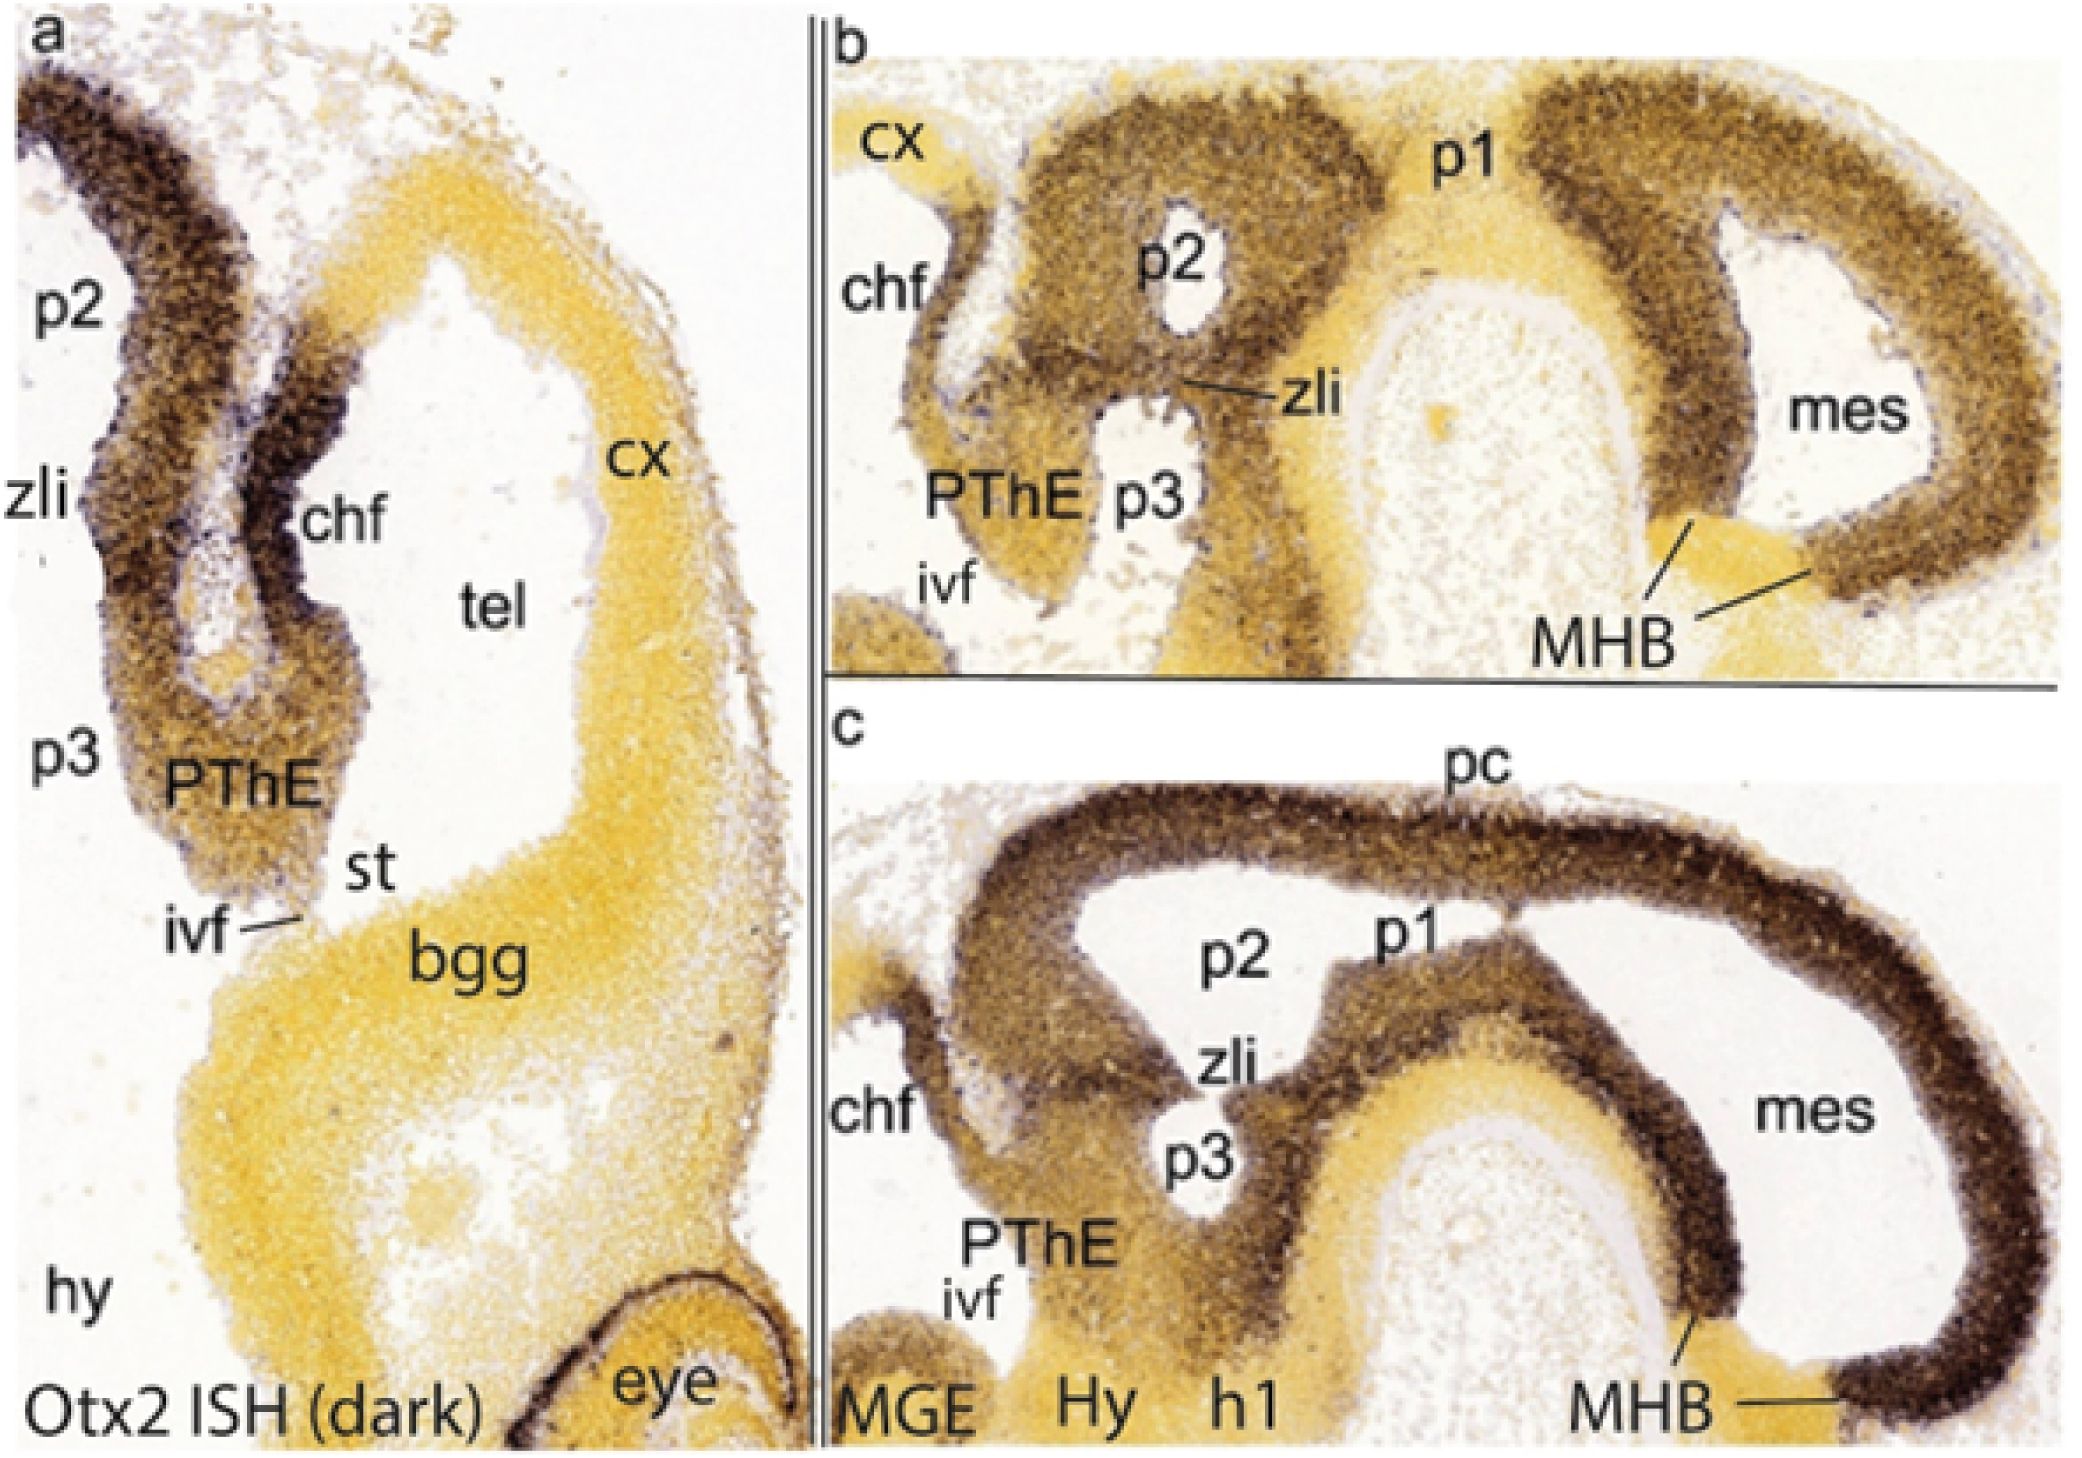
Figure 7. Otx2 ISH reaction (data downloaded from the Allen Developing Mouse Brain Atlas) in E11.5 mouse embryos cut coronally (A) or sagittally (B, C), illustrating labeling of the ventricular zone of the diencephalon and mesencephalon (note the sharp caudal end of the forebrain tagma expression in front of the isthmus; B, C). These images also show the diencephalic subdivision into prosomeres p1 [pretectum, under the posterior commissure (pc; C)], p2 (thalamus) and p3 (prethalamus). All three images show as well the prethalamic eminence (PThE), that is, the ventricular bulge made by the evaginated rostrodorsal part of the prethalamus at the back of the interventricular foramen (ivf; A; also seen in B, C); the PThE ends “dorsally” at the thinner prospective chorioidal fissure (chf; A–C). The marked interprosomeric boundary ridge separating the prethalamus from the thalamus is the zona limitans intrathalamica, labelled zli (note that, accordingly, the thalamus is separated from the telencephalon by the whole prethalamus -the classic literature says they contact, because the prethalamus was wrongly included in the thalamus). Note similar interneuromeric ventricular ridges limit p1 in c. The hypothalamo-prethalamic boundary is visible in c as a transversally oriented interruption of the alar prethalamic Otx2 signal. bgg, basal ganglia; chf, chorioidal fissure primordium; cx, cortex; h1, hypothalamo-telencephalic prosomere 1; hy,Hy, hypothalamus; ivf, interventricular foramen; mes, mesencephalon; MGE, medial ganglionic eminence; MHB, midbrain-hindbrain boundary; p1–p3, diencephalic prosomeres 1–3; pc, posterior commissure; PThE, prethalamic eminence; st, sulcus terminalis; tel, telencephalon; zli, interthalamic zona limitans.
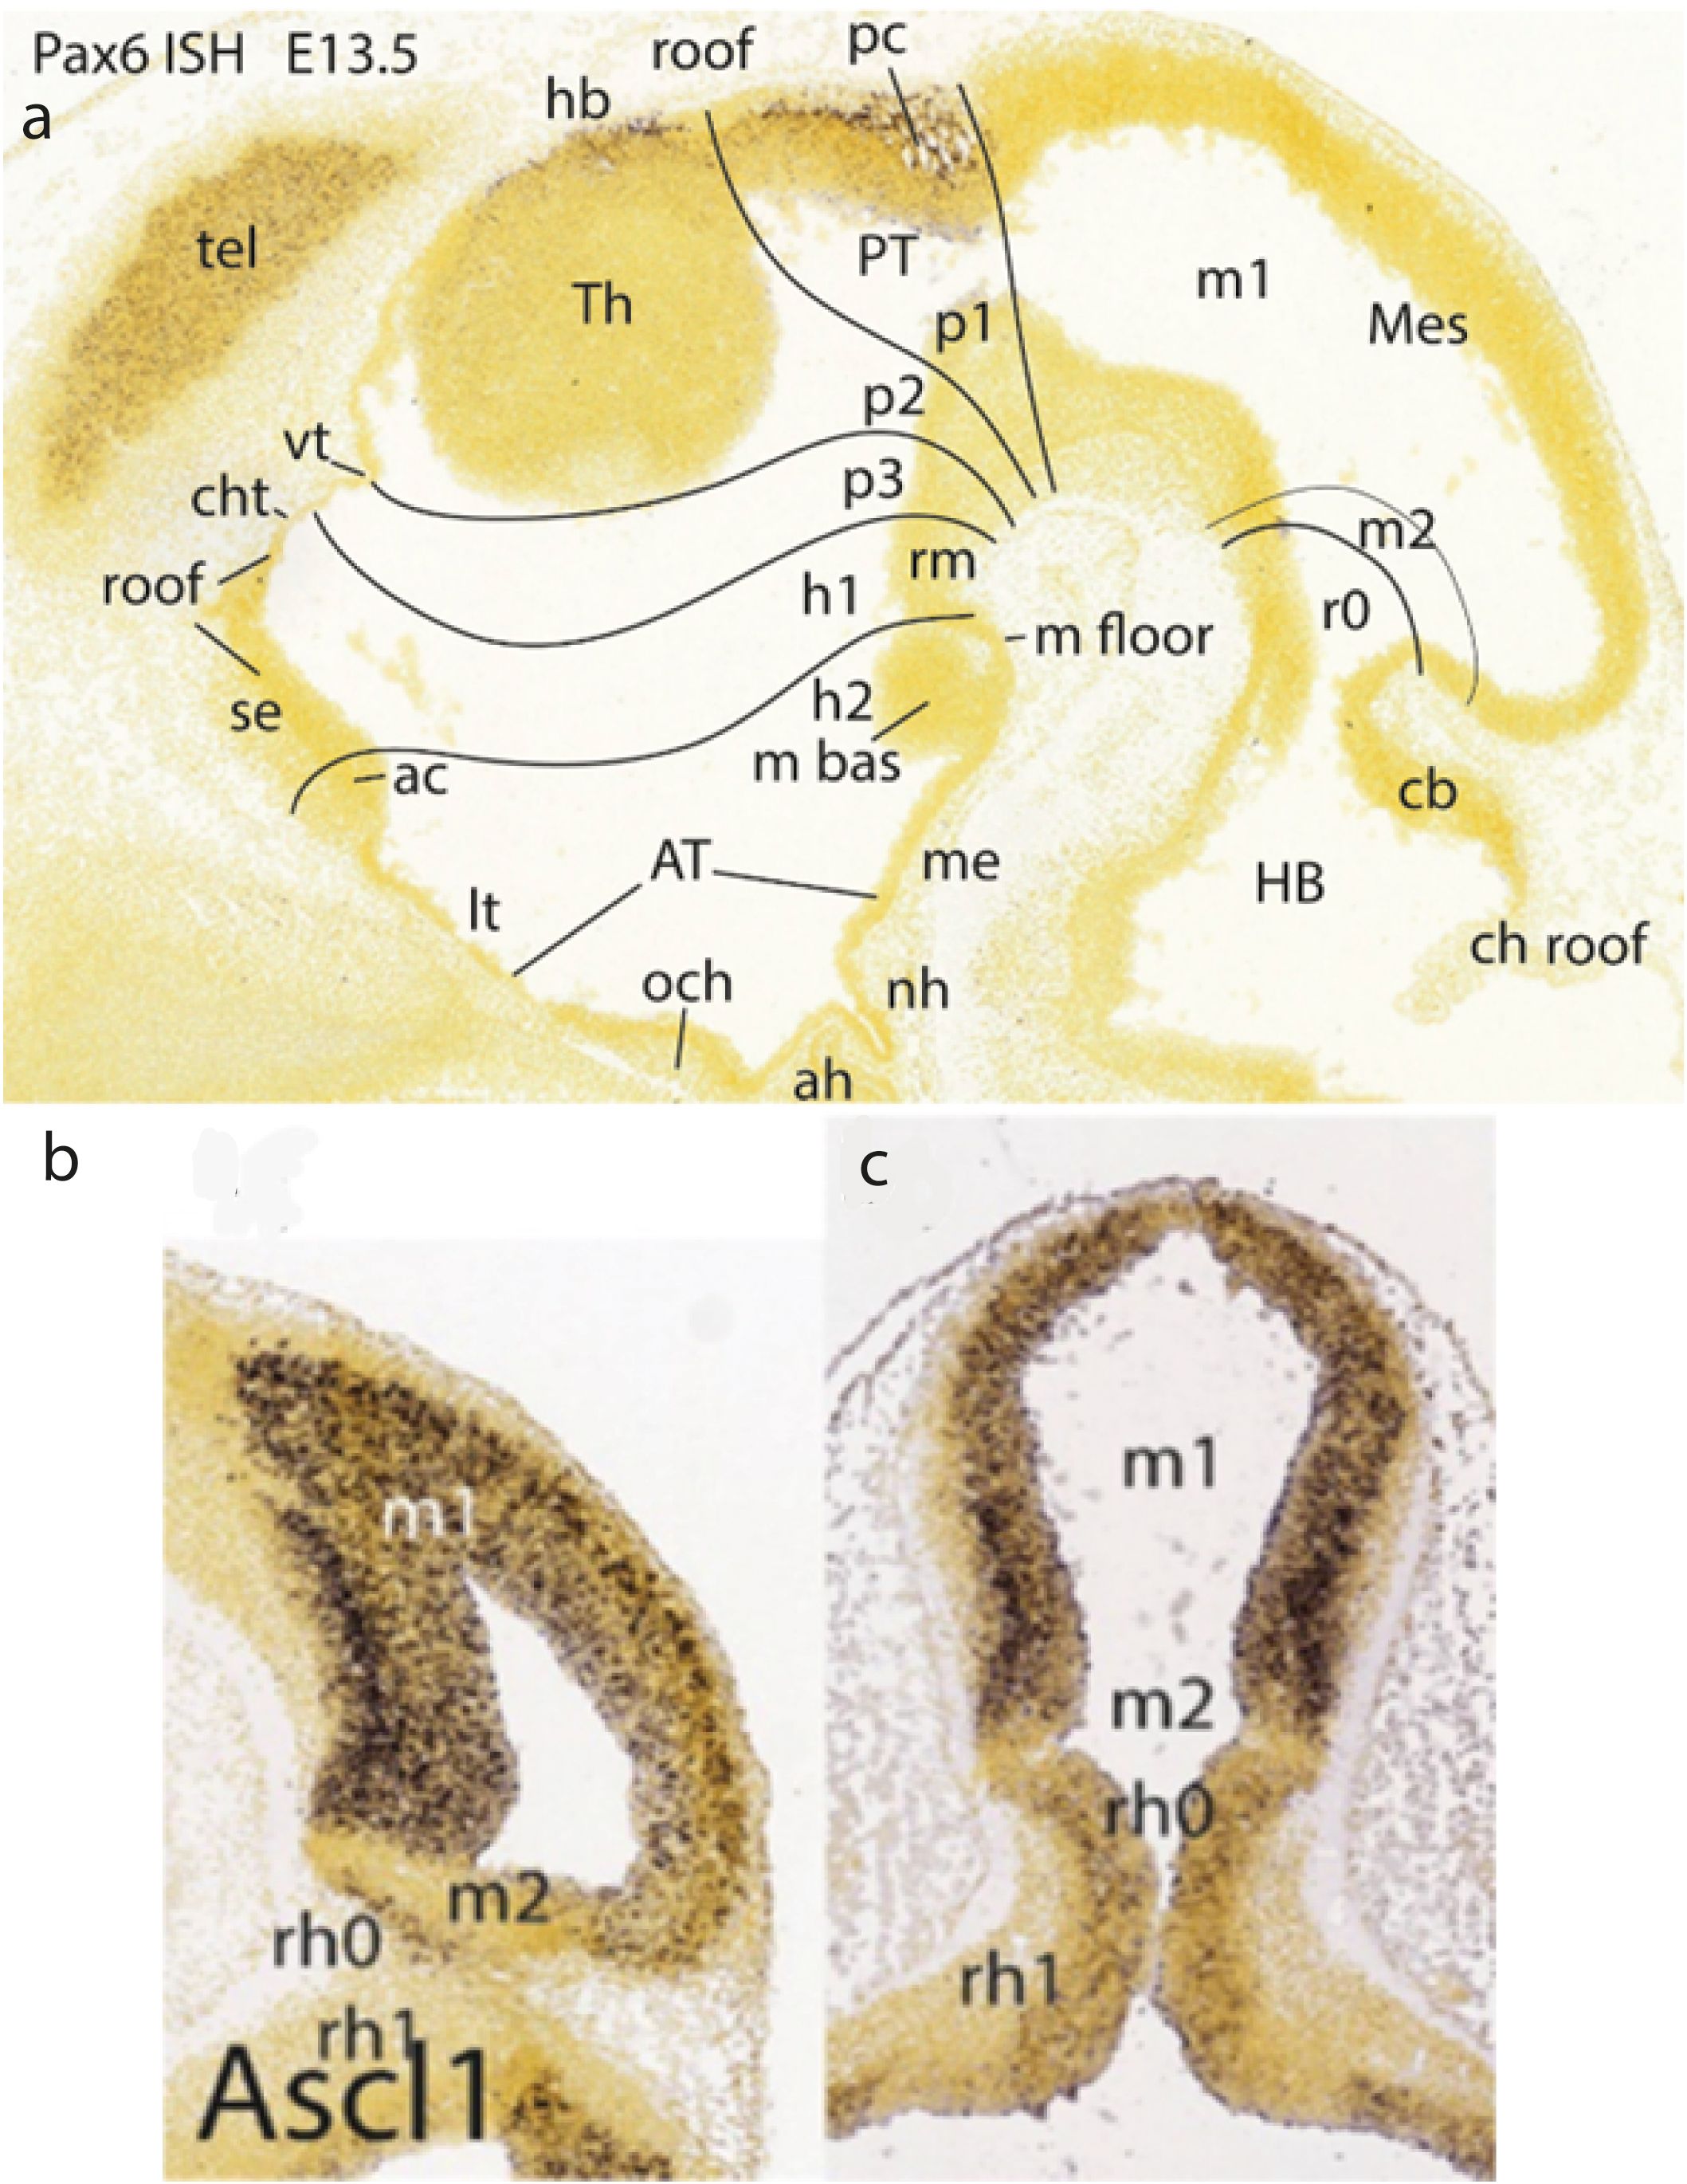
Figure 8. (A) Pax6 ISH-reacted E13.5 paramedian sagittal section (downloaded from the Allen Developing Mouse Brain Atlas), showing the caudal diencephalic limit p1/m1 just caudal to the pretectal posterior commissure (pc; note packets of white fibers mixed with pretectal cells that express Pax6). Expression seen at the top of the rounded thalamic mass corresponds to the habenula. The alar midbrain as well as the floor plate are wholly free of this signal. Note the velum transversum chorioidal fold is visible in the forebrain roof in front of the thalamus (vt; compare with Figure 24), and the mamillary floor plate (MF) appears separate from the rounded basal plate component of the mamillary body. ac, anterior commissure; ah, adenohypophysis; AT, acroterminal area; cb, cerebellum; ch roof, chorioidal roof; cht, chorioidal tela; h1,h2, hypothalamo-telencephalic prosomeres 1,2; hb, habenular area (Th); HB, hindbrain; lt, lamina terminalis; m bas, mamillary basal part; m floor, mamillary floor; m1, m2, mesomeres 1, 2; me, median eminence (tuber); Mes, mesencephalon; nh, neurohypophysis; och, optic chiasma; p1–p3, diencephalic prosomeres 1–3; pc, posterior commissure; PT, pretectum; r0, rhombomere 0 (isthmus); rm, retromamillary area; se, septum; tel, telencephalon; Th, thalamus; vt, velum transversum. (B, C) Ascl1 ISH-reacted sagittal (B) and horizontal (C) sections (downloaded from the Allen Developing Mouse Brain Atlas; extracted from Puelles and Hidalgo-Sánchez, 2023) illustrating the division of the midbrain proneuromere into a large rostral m1 neuromere, which encompasses the future superior and inferior colliculi (plus the rostral tectal gray formation—not detected at this stage; see TG in Figure 13A), and a rather tiny caudal m2 neuromere (Ascl1-negative), which is the precursor of the (retrocollicular/retrorubral) preisthmic region of the midbrain. This region limits caudalwards with the isthmus (r0) of the prepontine hindbrain (r0 + r1). m1, m2, mesomeres 1–2; rh0, rh1, rhombomeres 0–1.
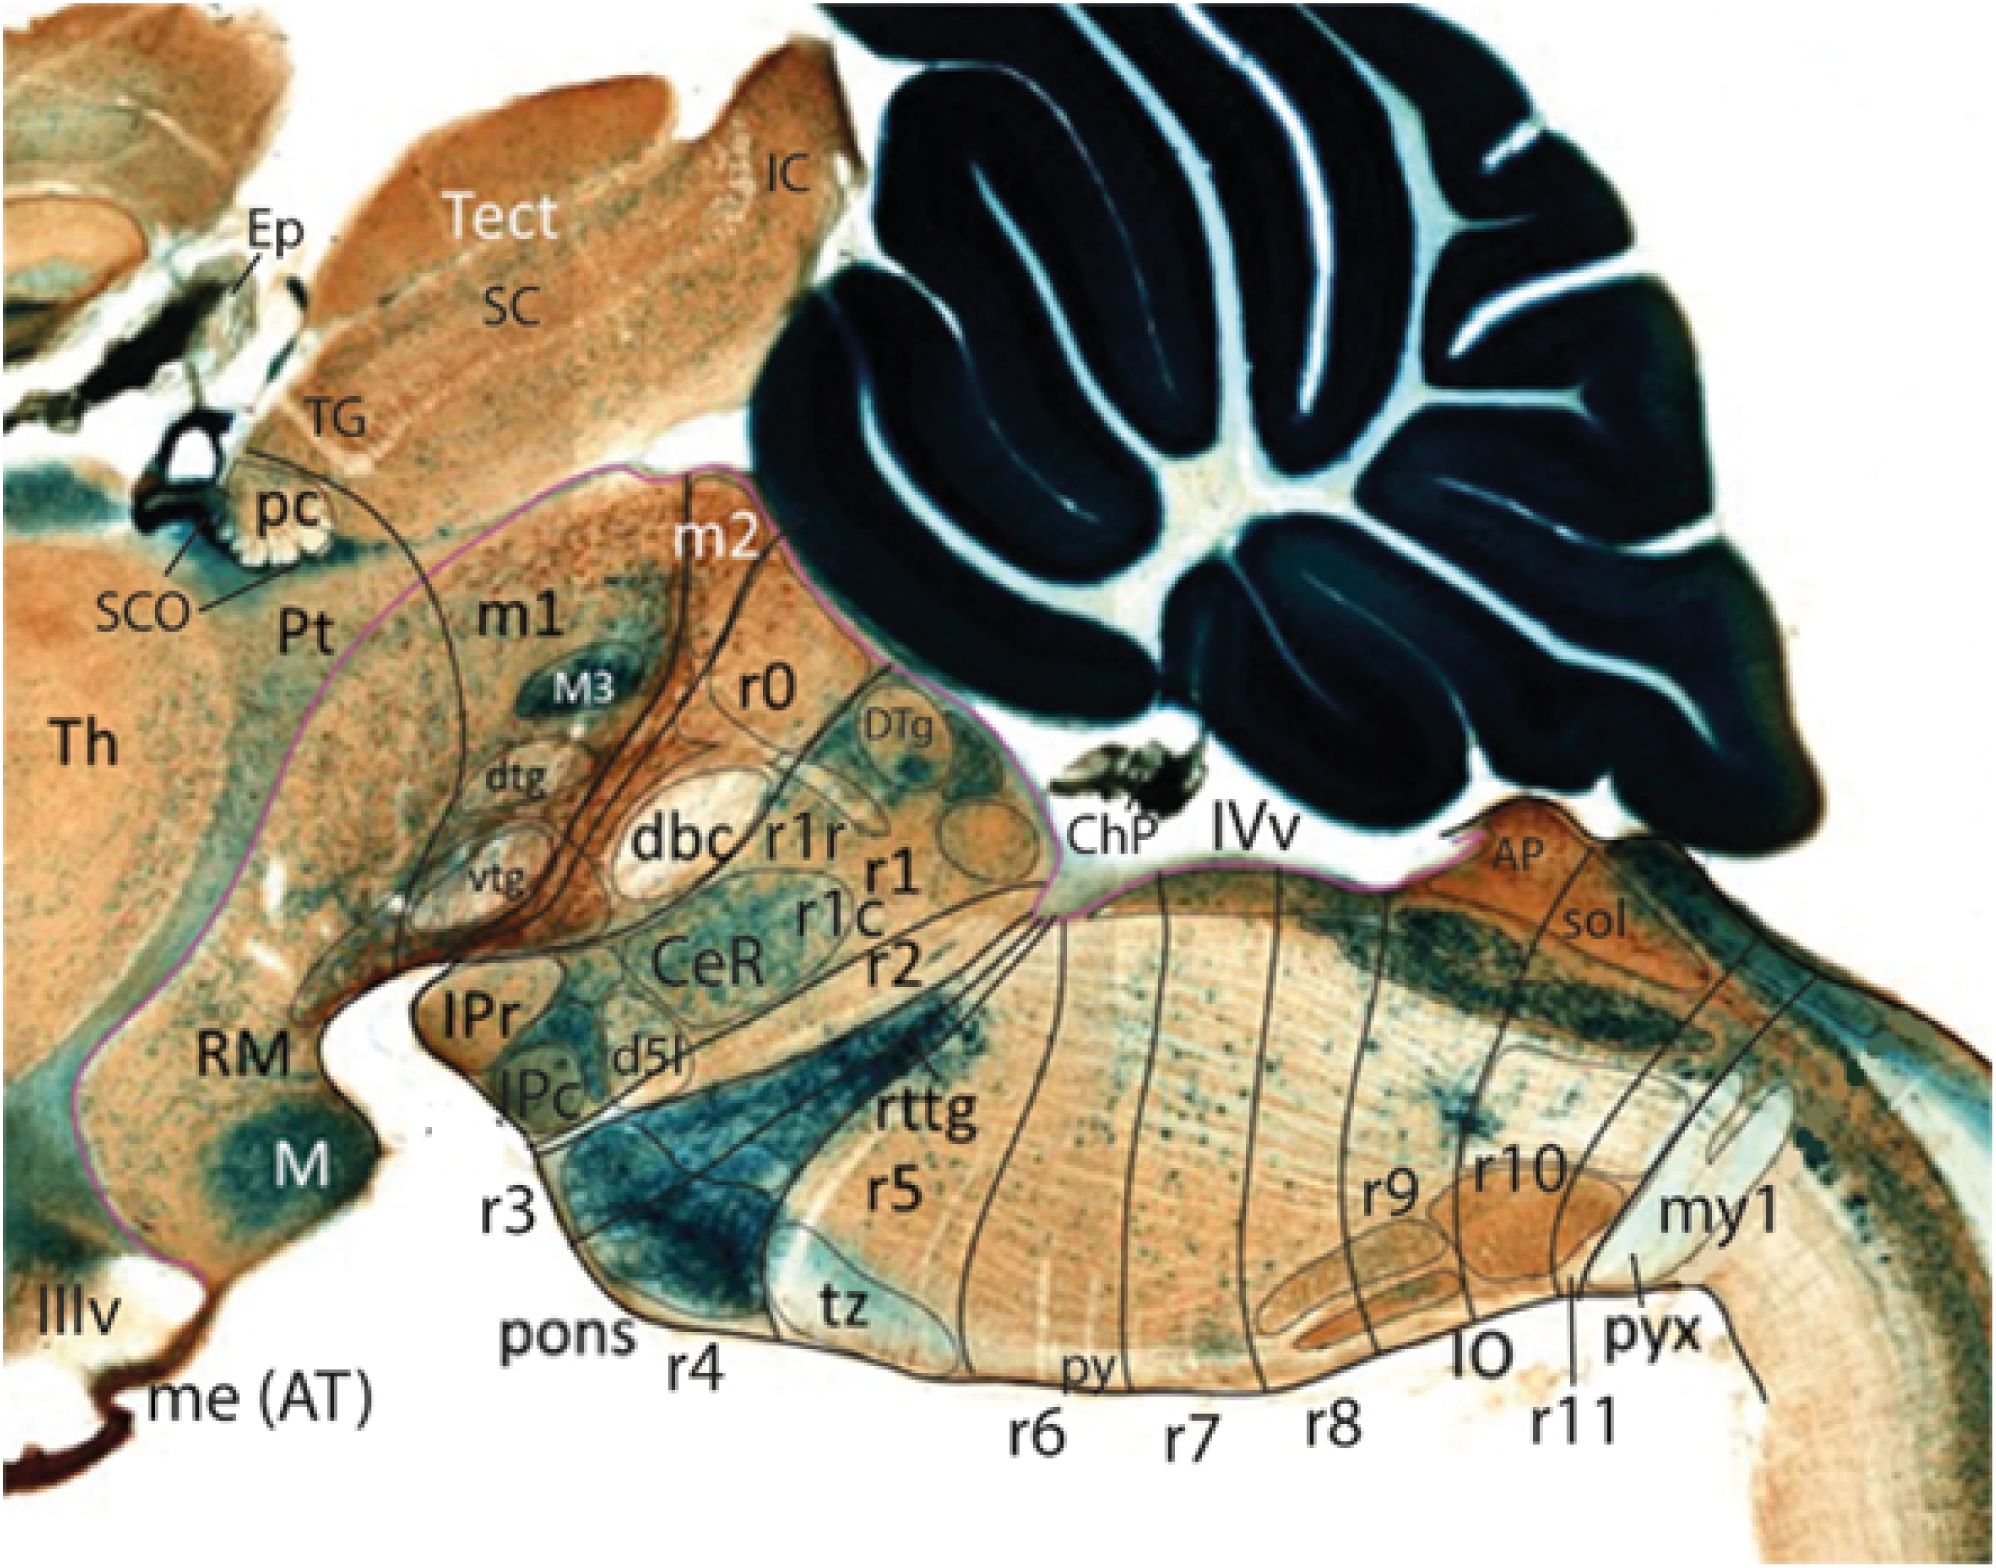
Figure 9. Midsagittal section through an adult transgenic mouse carrying an Azin2-LacZ construct, which identifies various characteristic floor and roof structures in the brain (material extracted from Martínez-de-la-Torre et al., 2018). The section is counterstained by immunoreaction for tyrosine hydroxylase (TH; brown reaction product), which produces staining at the mesodiencephalic ventral tegmental area (partly extending into the isthmus -r0). Note the thin m2 floor gap separating isthmus from the oculomotor nucleus (M3 in m1). The main rostral and caudal IP nuclei are marked differentially with Azin2-LacZ product (IPr, IPc in r1r, r1c, respectively), and the isthmic decussation of the brachium conjunctivum (dbc) is distinctly negative, as is the pretectal posterior commissure (pc), that covers the intensely blue coextensive subcommissural organ (SCO). The blue-labeled basilar pontine nuclear population extends into the depth of r3 and r4 through the reticulotegmental nucleus (rttg) (note practically no pontine caudal overhang over r5 in the adult mouse). The trapezoid decussation (tz) can be easily delineated at the surface of r5. The inferior olive is distinguished by its TH terminal labeling across r8–r11, rostrally to the decussation of the pyramidal tract (pyx), which lies within the my1 neuromere of the spinal cord. Some radially penetrating paramedian arteries can be seen in negative at r5–r6 levels (as landmarks they guide the course of the interneuromeric borders). The cerebellum is massively positive for Azin2-LacZ. AP, area postrema; CeR, central raphe nucleus; ChP, chorioidal plexus; bc, decussation of brachium conjunctivum (sup. cb. peduncle); d5l, decussation of the trigeminal lemniscus; dtg, dorsal tegmental decussation; DTg, dorsal tegmental nucleus (r1r); Ep, epiphysis; IC, inferior colliculus; IIIv, third ventricle; IVv, fourth ventricle; IO, inferior olivary nucleus (r8–r11); IPc, caudal interpeduncular nucleus (in r1c); IPr, rostral interpeduncular nucleus (in r1r); M, mamillary body; m1, m2, mesomeres 1, 2; M3, oculomotor nucleus; me (AT), median eminence (AT); my1, myelomere 1; pc, posterior commissure with subcommissural organ (blue); Pt, pretectum (caudal diencephalon); pyx; pyramidal decussation (in my1); r0–r11, rhombomeres 0–11; RM, retromamillary area; rttg, reticulotegmental pontine nucleus; SC, superior colliculus; SCO, subcommissural organ; sol, solitary column; Tect, tectal plate of midbrain (TG, SC, IC); TG, tectal gray; Th, thalamus; tz, trapezoid decussation; vtg, ventral tegmental decussation.
Within neuromeres, there is also an overall dorsoventral subdivision of the neural wall, primarily into the four longitudinal zones of His (1893, 1904; floor, basal, alar, and roof plates). This division is caused by vertical induction of the floor and basal plate domains by notochordal ventralizing signals antagonized by roof plate dorsalizing signals. This interplay specifies the variant floor, alar, basal, and roof plate properties. Later a secondary pattern emerges with molecularly distinct alar and basal dorsoventral microzonal subdivisions within each neuromere (review in Puelles, 2013; Nieuwenhuys and Puelles, 2016; Nieuwenhuys, 2017). These final partitions subdivide the longitudinal zones of His into smaller progenitor microzones, each able to produce several singular types of neurons (Puelles and Nieuwenhuys, 2024). Secondary microzonal subdivision also occurs in the anteroposterior dimension of the neuromeres, in the form of a partly described tripartite anteroposterior microzonal division of the alar plate domains (Puelles and Nieuwenhuys, 2024; note this insures, according to theoretical analysis, that alar progenitors acquire univocal differential characterization of their anteroposterior position within the neuromere, important for the needed genomic regulations).
All this partitioning reveals significant molecular regionalization of the neural wall neuroepithelium occurring coherently with gradual morphogenetic deformation of the brain axis into a bent configuration (and consequent complex morphogenesis of some parts). The motor of this constant though variably marked axial deformation (it also varies according to the species; see Figure 10) is the differential larger surface growth of the alar plates (where proliferation is protracted, and neurogenesis is delayed; see Figure 1B) compared to the basal plates [where neurogenesis occurs precociously, and proliferation slows down early (Figure 1B; see Amat et al., 2022)]. Since the alar and basal compartments are mutually attached, their differential growth in surface and thickness leads to mechanistic morphogenetic distortions without topologic alteration of the invariant internal molecular boundaries. Such global deformation forces the morphologist to examine the developing neural primordium from a topologic perspective, rather than using a naïve topographic viewpoint (a frequent shortcoming of embryology or neuroanatomy textbooks). The identity and homology of structures is not indicated by their apparent topography (position) but by their mutual relative relationships. This is a crucial point for proficient usage of the prosomeric model. On the other hand, topologic brain analysis considerably helps comparative studies among vertebrates.
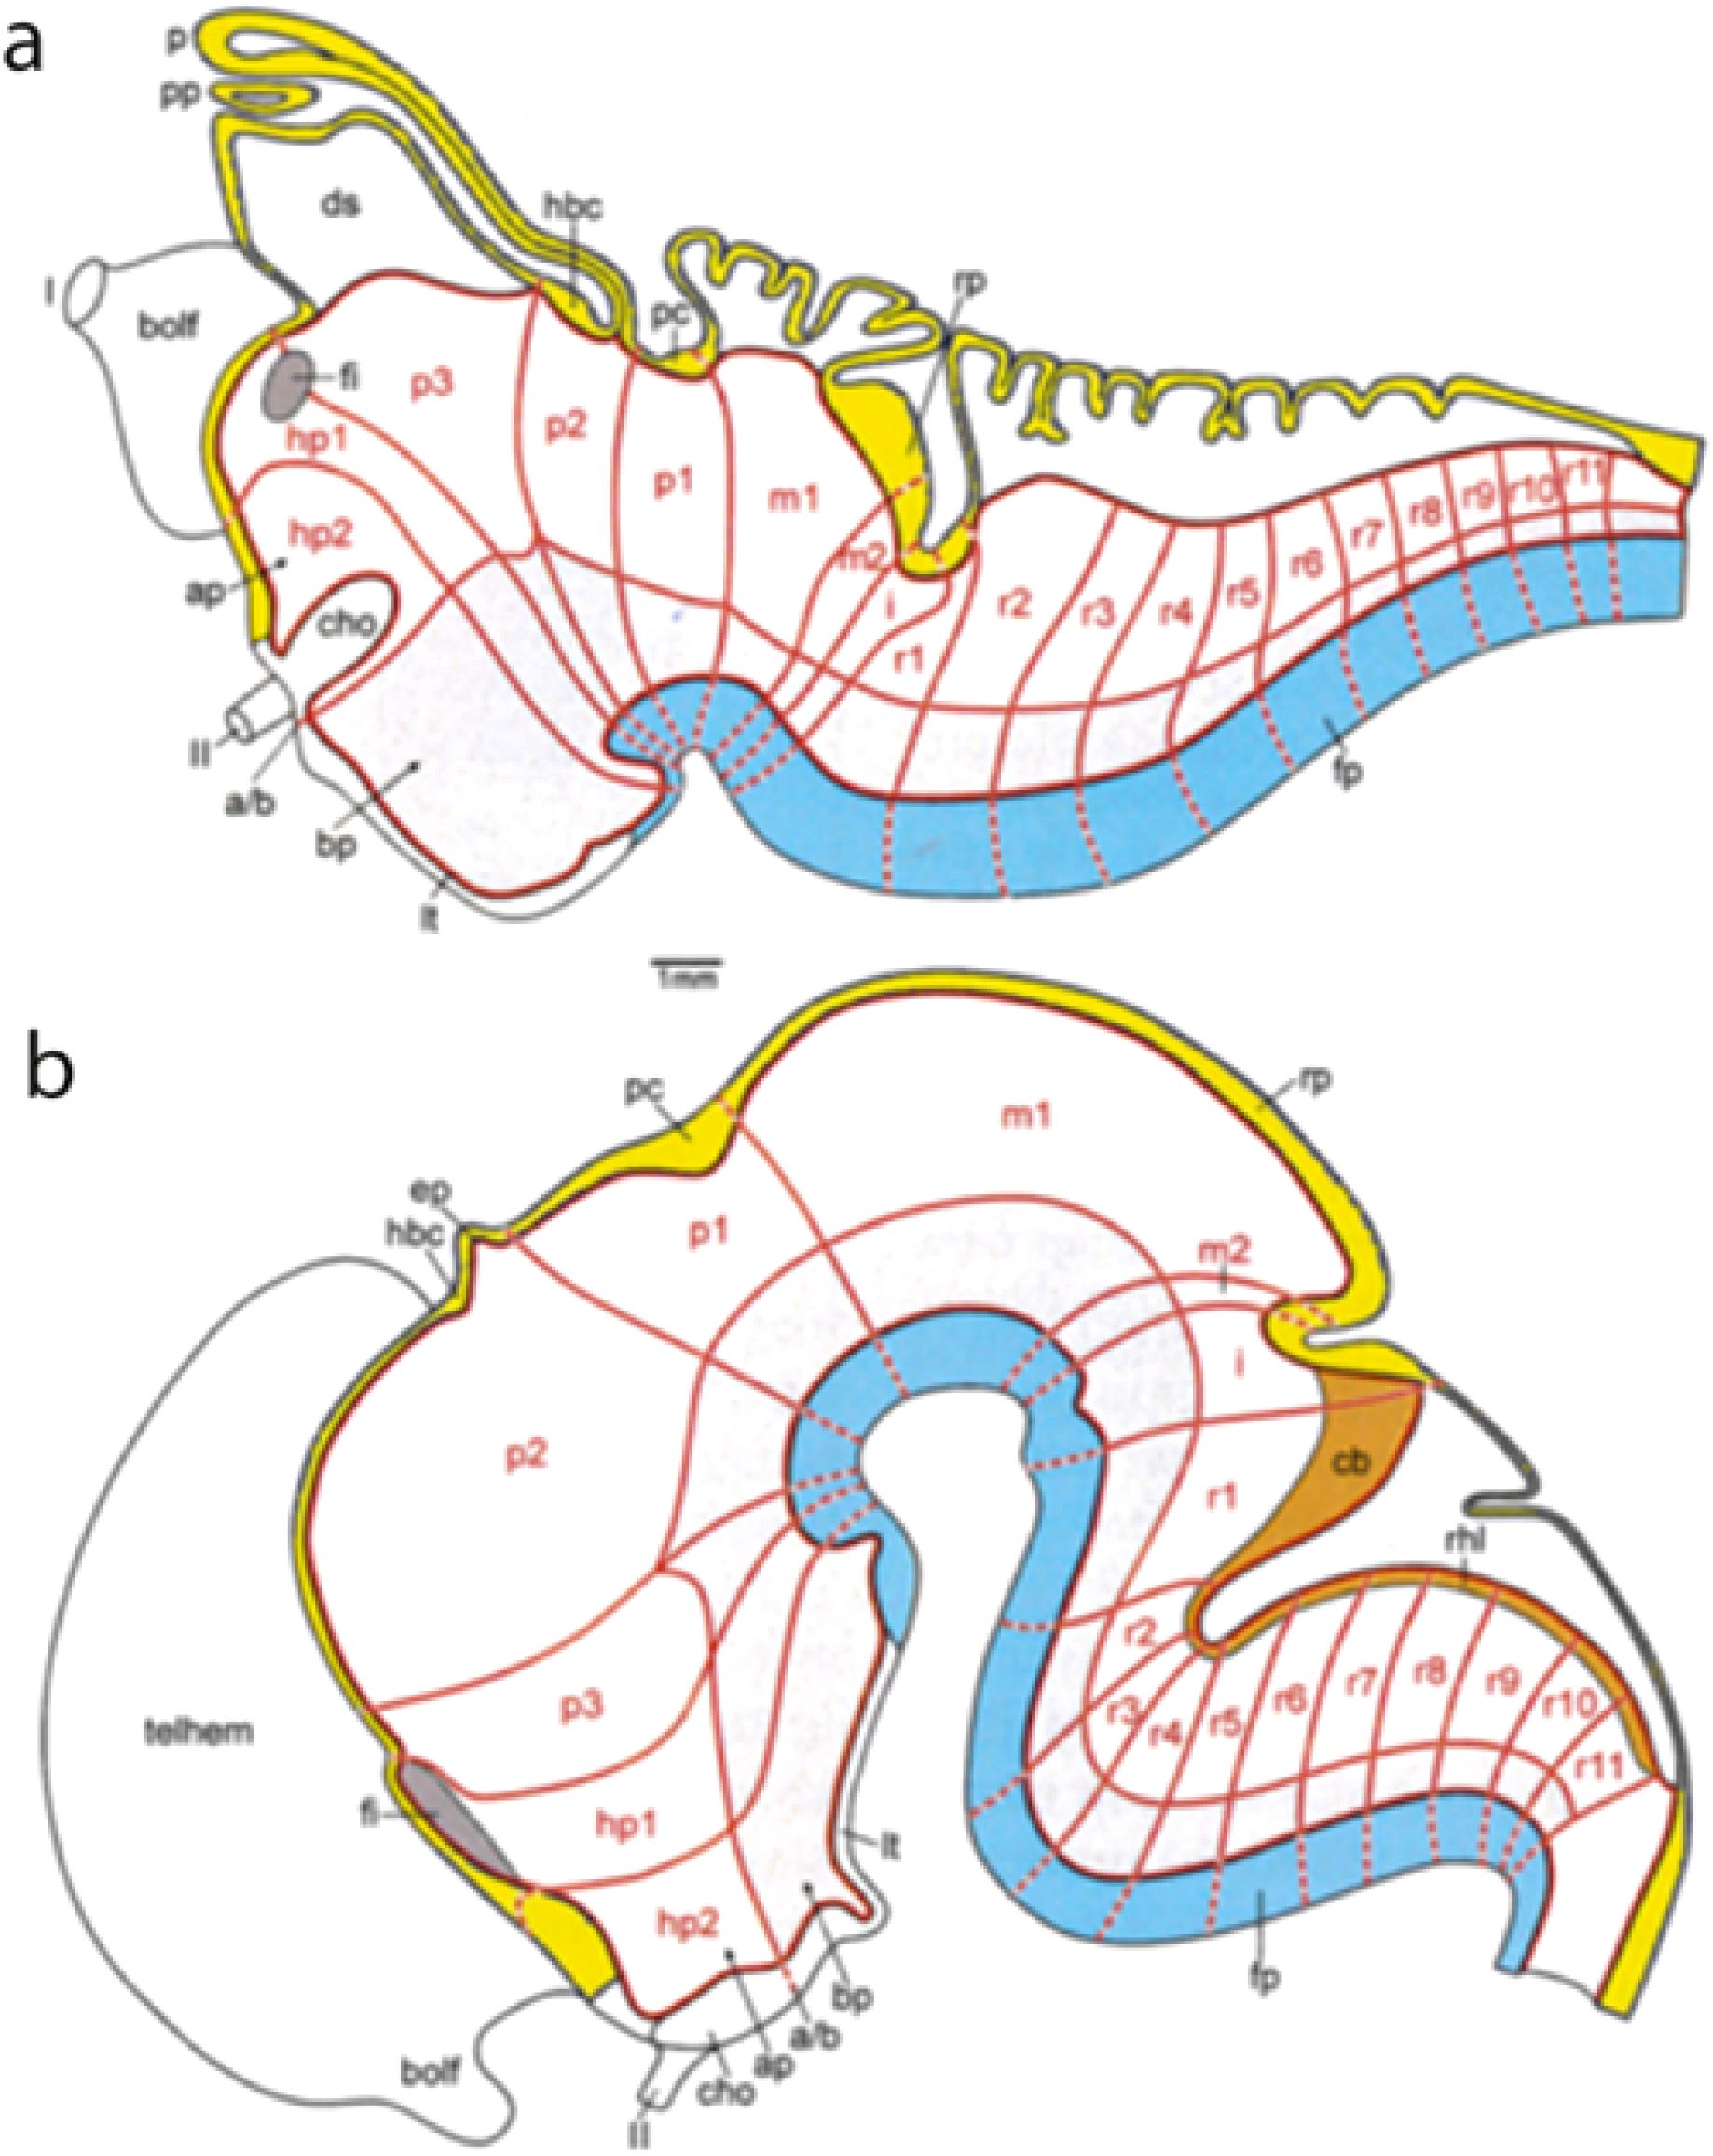
Figure 10. Diagrams illustrating examples of different degrees of axial bending of the brain in the cases of the lamprey (A) and of an embryonic mammalian brain (B) (extracted from Nieuwenhuys and Puelles, 2016). The blue floor plate and the yellow roof plate already indicate the degree of axial bending, as results corroborated by the conservative alar–basal boundary (longitudinal red line) limiting the light gray basal plate. Irrespective of the species and its degree of axial curvature, the system of neuromeric subdivisions remains topologically invariant in their orthogonality relative to the axis, particularly as regards the positions where interneuromeric borders intersect specific midline landmarks (hence, the insistence below on users learning all the midline landmarks). The AT (uncolored) is always strictly comparable. The orange-colored cerebellum and rhombic lip domain of tetrapods [in (B)] is not distinguishable morphologically in the lamprey, though some gene markers suggest its cryptic molecular presence (A). The lamprey forebrain displays an extra midbrain chorioidal roof domain (just caudal to the posterior commissure, pc) that is absent in tetrapods. The telencephalic vesicle is clearly relatively much smaller in the lamprey, the olfactory bulb -bolf- representing about half of it [relatively much smaller in (B)]. a/b, alar–basal boundary; ap, alar plate (preoptic part); bolf, olfactory bulb; bp, basal plate; cb, cerebellum; cho, optic chiasma; ds, dorsal chorioidal sack; ep, epiphysis (pineal organ); fi, foramen interventriculare; fp, floor plate; hbc, habenular commissure; hp1, hp2, hypothalamo-telencephalic prosomeres 1, 2; I, isthmus (rhombomere 0); II, optic nerve; lt, lamina tuberalis (median eminence); m1, m2, mesomeres 1, 2; p, pineal organ; p1–p3, diencephalic prosomeres 1–3; pc, posterior commissure; pp, parapineal organ; r1–r11, rhombomeres 1–11; rhl, rhombic lip; rp, roof plate (midbrain level); telhem, telencephalic hemisphere.
The prosomeric model was initially presented as a forebrain model (this explains its “prosomeric” name, originally referring to prosencephalic neuromeres or “prosomeres”). It was however soon expanded into a model of the complete brain, without enduring the name change one would have expected. “The neuromeric model” would have been a more correct name, but there was the risk of confusion with several other neuromeric models of the past, while the “prosomeric model” name was starting to become known. So, the initial name was retained.
1.1 Tagmatic, proneuromeric, and neuromeric subdivisions
The model presently visualizes the whole brain as comprising three molecularly and structurally distinct large sectors, characterized as tagmata (Figure 4A). These are the forebrain, hindbrain, and spinal cord parts. The Greek term “tagma” (plural: “tagmata”) refers to a large army body, for example, a battalion that subdivides into a hierarchy of smaller units. This term started to be used in biology applied to the head, thorax, and abdomen regions of insect bodies, each of which subdivides into corresponding head, thoracic, or abdominal segments. These sets of segments have properties typical of the tagma to which they belong. Indeed, in the brain of vertebrates, each of the cited three tagmatic brain sectors divides early on first into a few proneuromeric territories or proneuromeres (permanent intermediate units), that next subdivide each into several individual neuromeres (Puelles, 2018; Figures 4B, C; Figures 11A, B). The set of neuromeres composing a tagma shares some general molecular characteristics (later translated into fates) that distinguish this set of units from those of the other tagmata, and the same happens to a smaller degree with the larger proneuromeric territories. The proneuromeres continue to be distinct parts of the adult brain even after the appearance of the neuromeres (e.g., brain regions such as hypothalamus, midbrain, or pons, are originally proneuromeres), though each subdivides at some point into several neuromeres, known respectively as prosomeres, mesomeres, rhombomeres, and myelomeres (see Puelles, 2013, 2018, 2021; Amat et al., 2022).
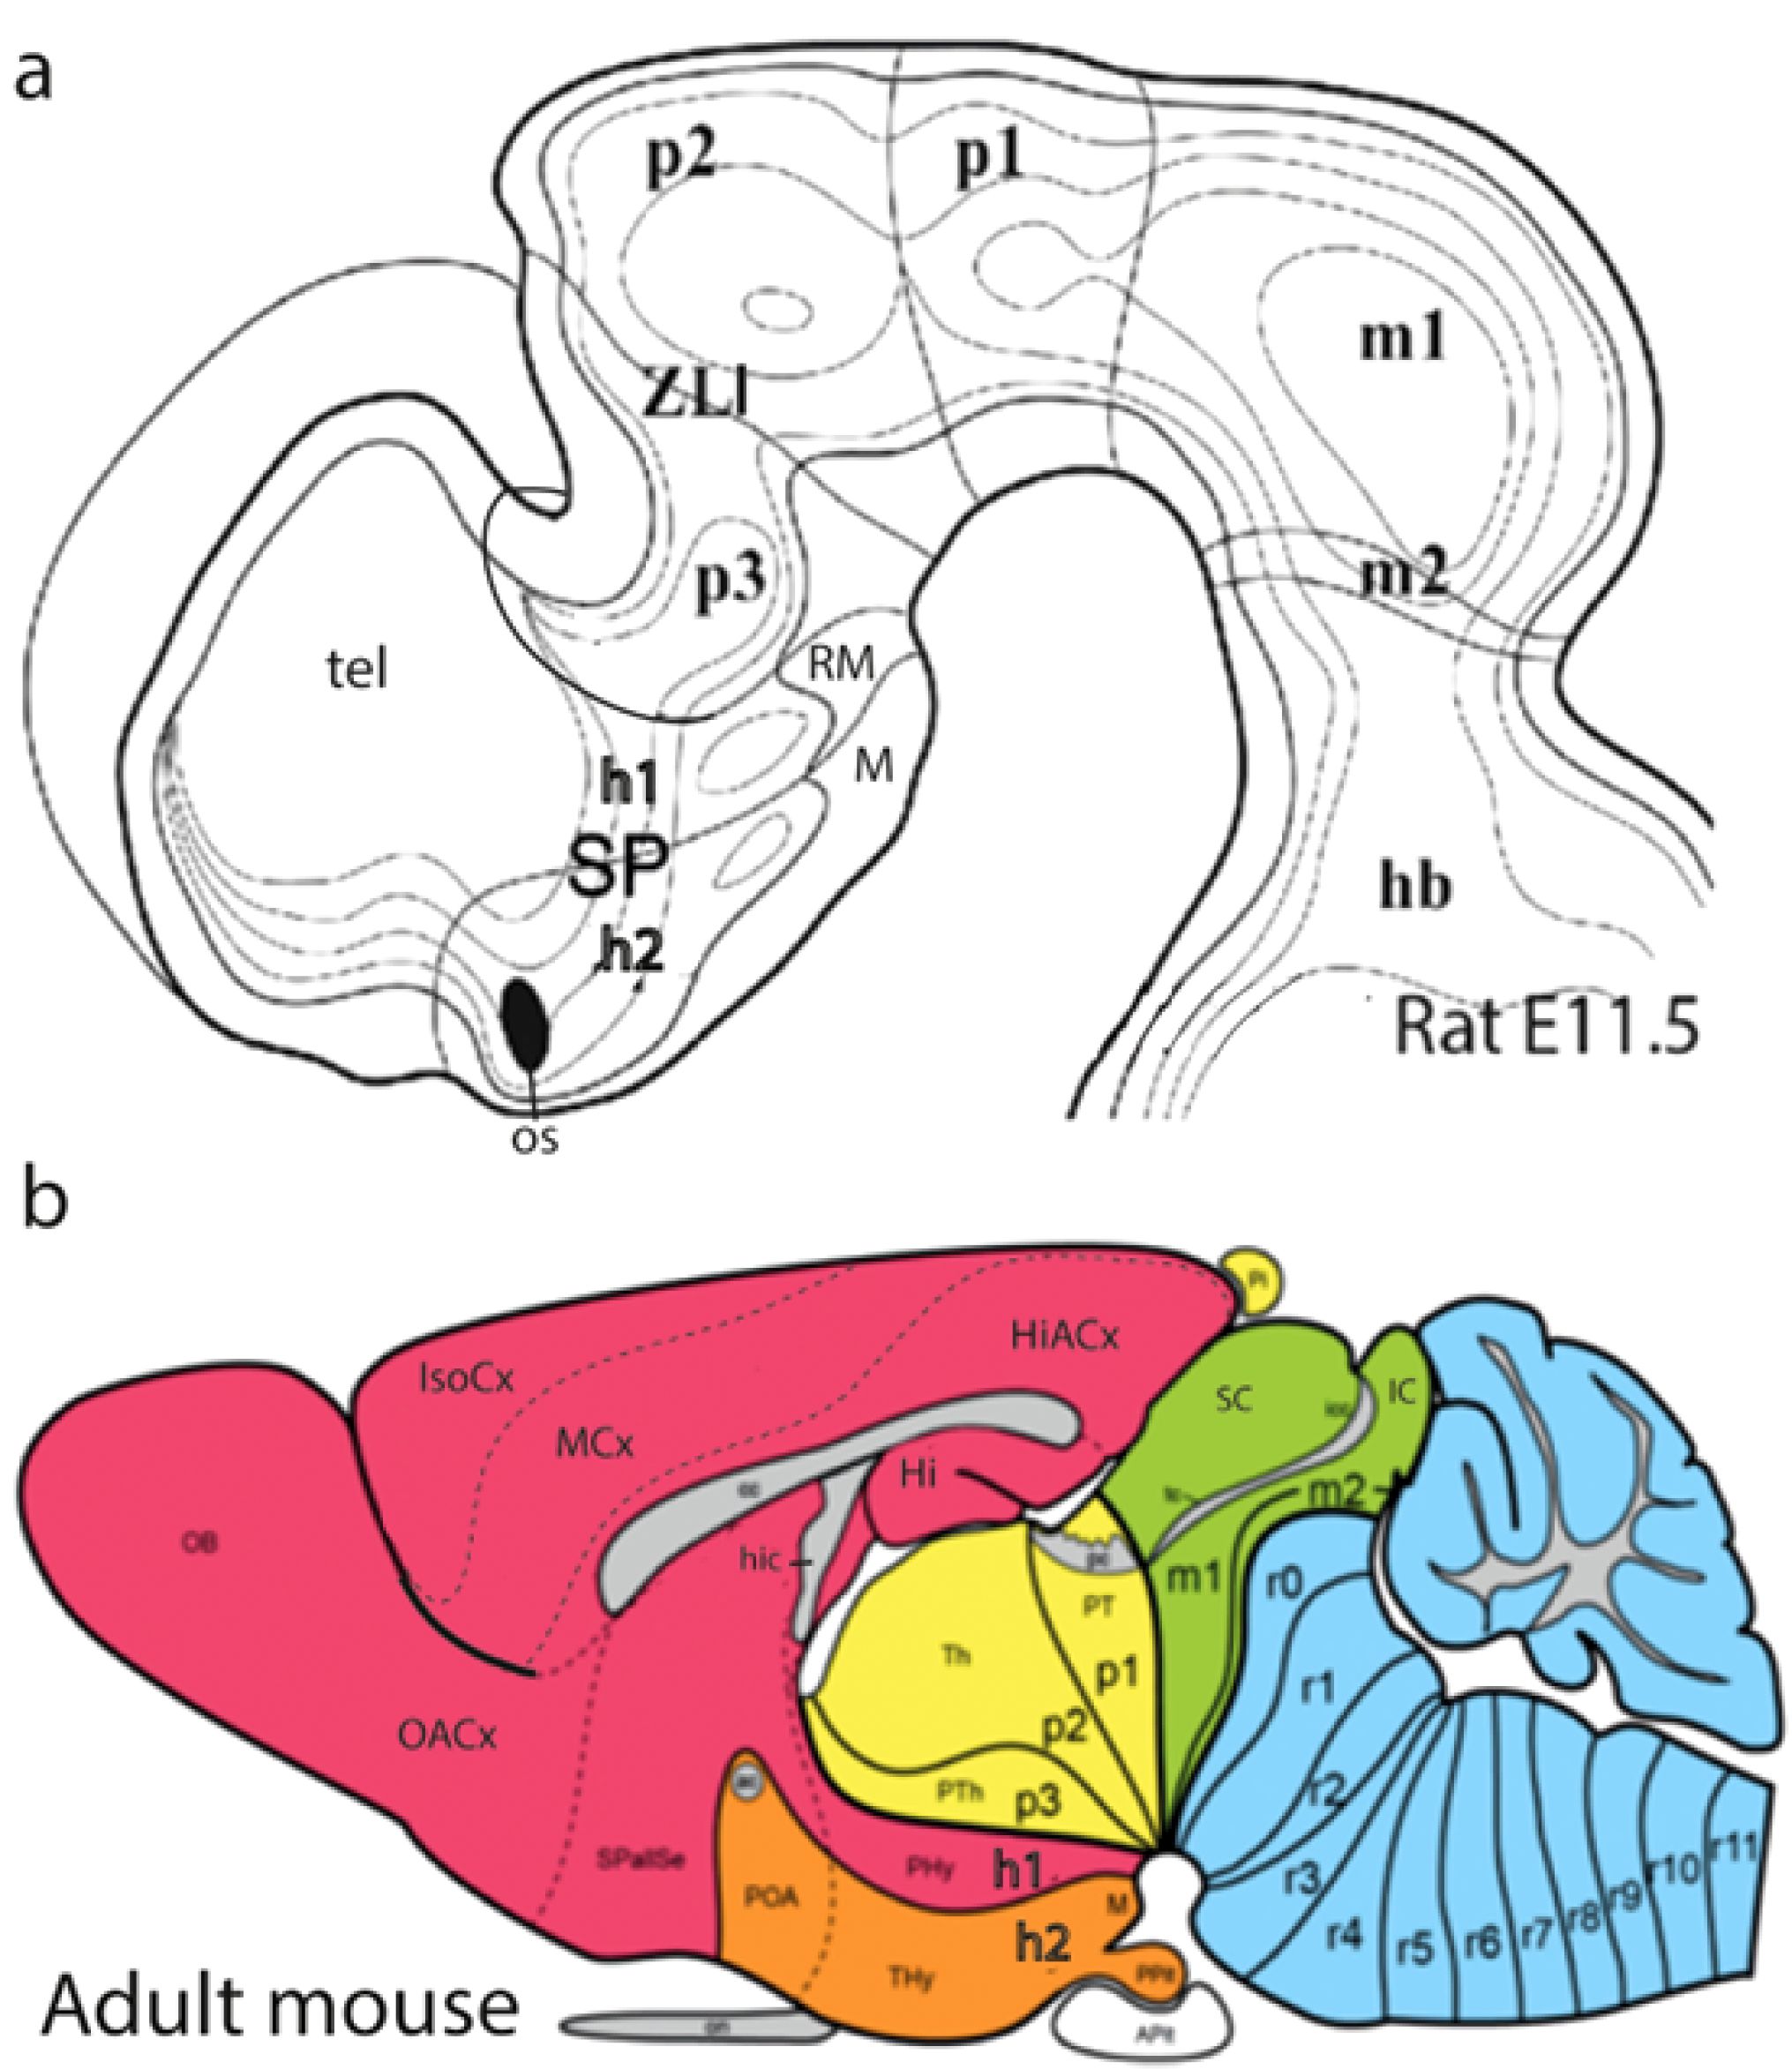
Figure 11. (A) Graphic reconstruction of the ventricular relief of the right half of the rat embryonic forebrain out of a series of semithin sections, displaying the concavities caused by the outwardly bulging neuromeres, and (B) a color schema of the adult pattern of brain areas derived from these neuromeres. Note h1 and h2 form hypothalamo-telencephalic units within the SP; the unevaginated preoptic telencephalon and the mamillary floor (POA, M; orange domain in B) belong to h2, while the whole evaginated telencephalon (red domain in B) derives from h1; note its floor is retromamillary in topography (the columnar literature confusingly identifies the retromamillary area as “supramamillary”). The dorsal bulges separated by transverse constrictions of the diencephalon (p3, p2, p1) represent the primordia of its alar domains, the prethalamus (PTh), the thalamus (Th), and the pretectum (PT), respectively [diencephalon = yellow domain in (B); note also the yellow pineal gland -Pi in (B)- belonging to the p2 roof]. The wedge-shaped midbrain appears in green (B), caudally to the pretectal posterior commissure (pc), and rostral to the hindbrain in blue. Reproduced, respectively, from Puelles et al. (2015) (A) and Puelles (2021) (B). APg, anterior pituitary gland (adenohypophysis); cc, corpus callosum; h1–h2, hypothalamo-telencephalic prosomeres 1–2; hb, hindbrain; Hi, hippocampus; HiACx, hippocampal allocortex; hic, hippocampal commissure; Hy, peduncular hypothalamus; IC, inferior colliculus; IsoCx, isocortex; M, mamillary body; m1–m2, mesomeres 1–2; MCx, mesocortex; p1–p3, diencephalic prosomeres 1–3; pc, posterior commissure; OB, olfactory bulb; os, optic stalk; OACx, olfactory allocortex; Pi, pineal gland (epiphysis); POA, preoptic area; PPg, posterior pituitary gland (neurohypophysis); PT, pretectum; PTh, prethalamus; r0–r11, rhombomeres 0–11; RM, retromamillary area; SC, superior colliculus; SP, secondary prosencephalon; SPallSe, subpallial septum; tel, telencephalon; Th, thalamus; THy, terminal hypothalamus; VPall, ventral pallium (olf.allocx); zli, interthalamic zona limitans.
1.1.1 Forebrain
The forebrain tagma is the rostralmost one and ends caudally at the isthmic constriction or isthmo-mesencephalic boundary (this aspect was incorporated into the model relatively recently, by Puelles et al., 2012a, after noting the sharing of a common basic molecular pattern among all its parts, which include the midbrain). This pattern is led by expression of Shh not only in the floor but also in the basal plate; this positions a unique longitudinal band of Nkx2.2 along the alar–basal boundary (see Figure 12B), with associated other genes such as Ptch1; the molecular alar–basal limit and the basal plate are different in the hindbrain and spinal cord tagmata; this explains that the former produces dopaminergic neurons throughout down to the isthmus, while the hindbrain produces serotonergic neurons; histaminergic neurons only are produced in the basal hypothalamus). The forebrain tagma divides early on into three proneuromeres. These represent in rostrocaudal order, first, the classic hypothalamus (Hy; Figures 12, 11A, B, including the eyes and the telencephalic vesicles as hypothalamic outgrowths, this forms jointly the so-called “secondary prosencephalon”), second, the diencephalon proper (without hypothalamus, but including the whole pretectum; D, Figures 12, 11A, B) and third, the midbrain (with boundaries subtly redefined compared to the very rough classic concept; M; Figures 12, 11A, B; see discussion in Puelles, 2016, 2019). The inclusion of the midbrain in the forebrain (one of the corrections introduced secondarily in the model) is unusual in the literature but is consistent with the shared dorsoventral molecular patterns described in this tagma (e.g., shared pattern of genes delimiting the basal and alar plates mentioned above) as well as with present experimental knowledge on how the forebrain evolved at the chordate–vertebrate transition [see Albuixech-Crespo et al., 2017 for evidence that thalamus, pretectum, and midbrain first emerged jointly in the first vertebrates, whereas chordates (e.g., amphioxus) already have a hypothalamus devoid of evaginations and a hindbrain primordium, but no caudal diencephalon or midbrain]. There is also gene expression evidence characterizing as a whole our expanded forebrain tagma from early neural plate stages onwards into the adult (e.g., general forebrain Otx2 expression stopping at the isthmus; MHB, Figures 12A, 7B, C). Note the brain floor plate can be distinguished molecularly by its general expression of Ntn1 and Nrg2 genes (Figures 12C, D).

Figure 12. Characteristic gene markers shared within the updated forebrain tagma of the prosomeric model (A, Otx2; B, Nkx2.2; C, Ntn1). All the panels illustrate the three forebrain proneuromeres (Hy, hypothalamus; D, diencephalon; M, Midbrain or mesencephalon), ending caudally at the isthmo-mesencephalic or midbrain–hindbrain constriction (MHB; leading into the hindbrain tagma, where extra Otx2 appears in basal r1 -untagged in (A). Their topologically transverse boundaries (black lines) diverge dorsalward because the brain axis is sharply bent at the cephalic flexure (present in all the images) and the alar domains are larger than the basal ones. The neural tube roof and floor plates (labeled selectively in A and C, D, respectively) represent parallel landmarks of the bent axis, as does also the positive neuroepithelial longitudinal band expressing Nkx2.2 along the alar–basal boundary (in B; note in the alar plate above this limit the ventricular cavities of the developing neuromeres that subdivide the D: p1, p2, and p3). The telencephalic vesicles (tel) partly seen in (A, B) are dorsal outgrowths out of the Hy. Note in (A, C, D) the rostral end of the forebrain roof at the primordium of the anterior commissure (ac), and that of the floor at the mamillary body (mam). A rostral forebrain wall connects these two landmarks, representing the AT, divided into alar and basal parts by the Nkx2.2 band (B). All these annotated data were downloaded originally from the Allen Developing Mouse Brain Atlas and have been extracted from Puelles et al. (2012a) and Puelles and Rubenstein (2015). ac, anterior commissure; D, diencephalon; Hy, hypothalamus; M, midbrain; mam, mamillary body; MHB, midbrain-hindbrain boundary; p1–p3, diencephalic prosomeres 1–3; tel, telencephalon; zl, interthalamic zona limitans.
Accordingly, the prosomeric forebrain limits directly with the hindbrain (rhombencephalon) at the molecular isthmo-mesencephalic boundary, close to the anatomic isthmic constriction. This boundary (possibly the earliest established in the brain, between predominantly prechordally versus nodally influenced brain parts) corresponds in sagittal brain sections at late embryonic, postnatal, and adult stages to the limit separating the narrow retrorubral m2 transverse gap from the isthmus domain, that is the oculomotor and trochlear nuclei, or the mesencephalic dorsal and ventral tegmental decussations from the isthmic decussation of the brachium conjunctivum (dbc; Figure 13A).
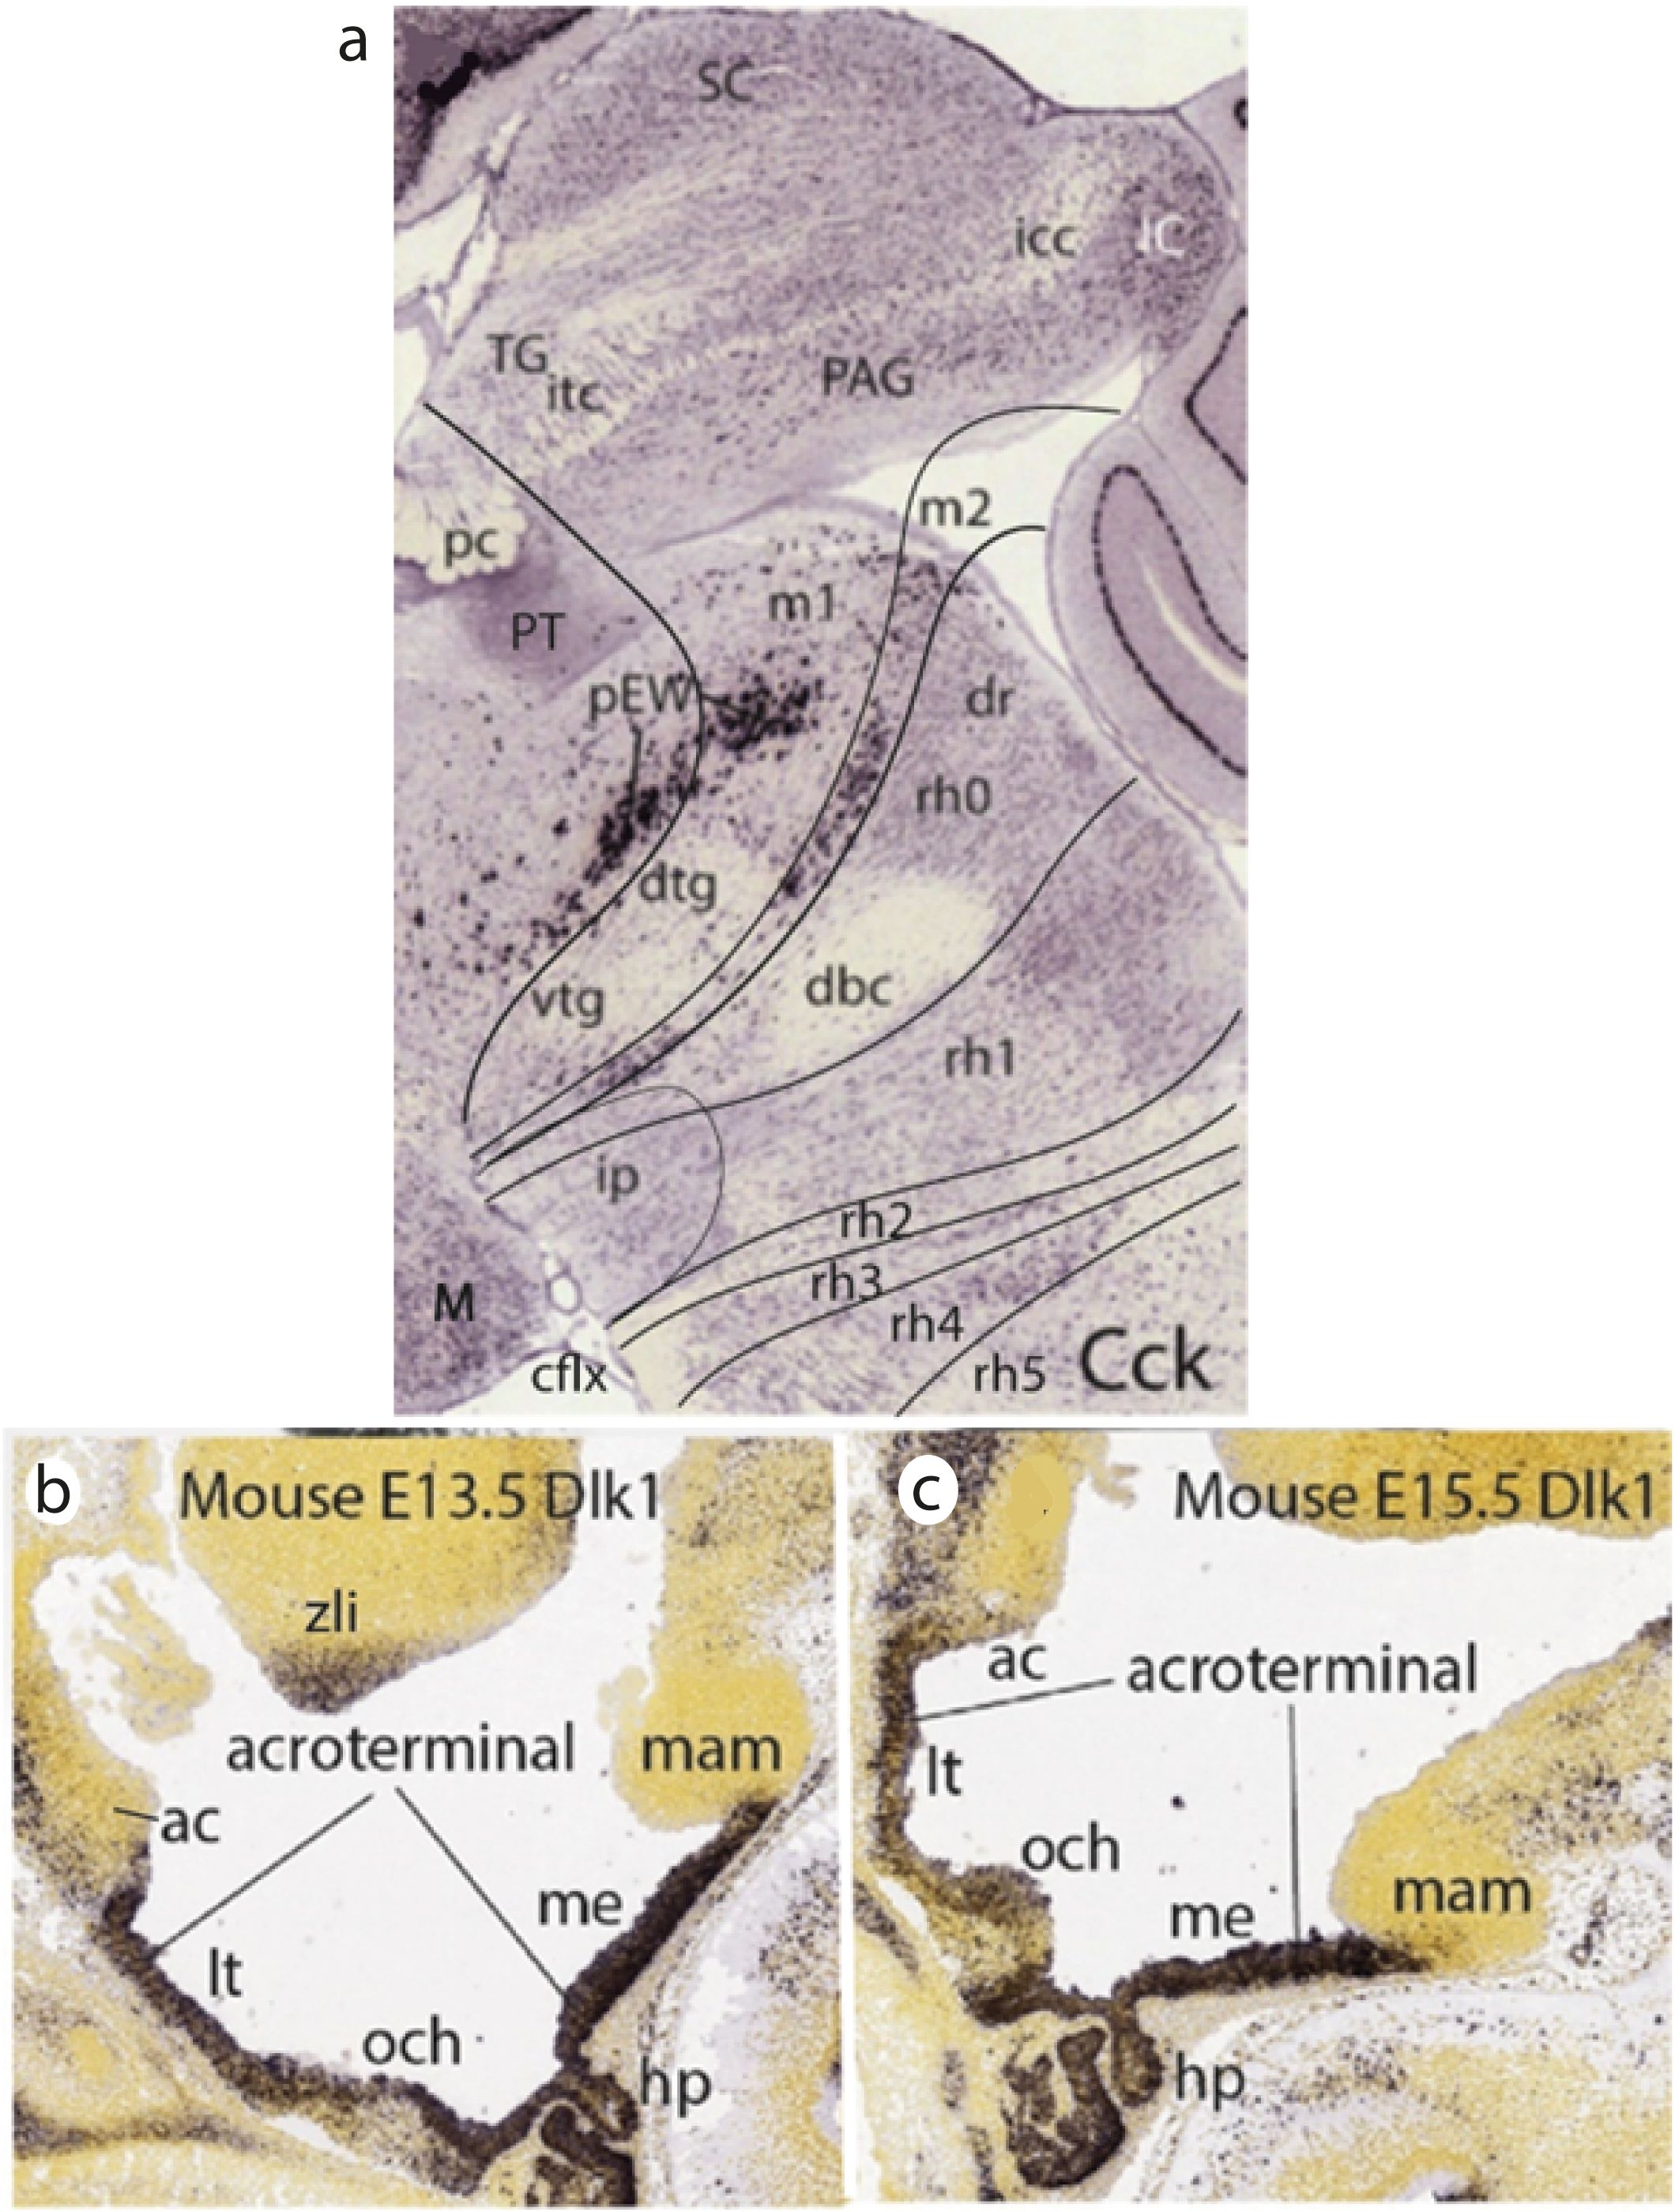
Figure 13. (A) Midsagittal section through the intertagmatic midbrain–hindbrain boundary in an adult mouse hybridized in situ for Cck (darkly stained cells; Allen Developing Mouse Brain Atlas data, extracted from Puelles and Hidalgo-Sánchez, 2023). There is a thin transverse (so far un-named) retrorubral group of Cck-labeled cells along the mesomere 2 (m2) midline floor mantle, ending ventrally in front of the prepontine interpeduncular nucleus (ip), which lies in r0 + r1. The midbrain mesomere 1 (m1) tegmentum displays the well-known dorsal and ventral tegmental decussations (dtg, vtg), under the labeled longitudinal pre-Edinger-Westphal tegmental nucleus (pEW), which continues rostralwards into the pretectum, under the pretectal posterior commissure (pc). The oculomotor complex would appear in a neighboring parasagittal section, adjacent to pEW, just over the dtg. The prepontine hindbrain tegmentum displays the decussation of the brachium conjunctivum (dbc), which crosses the midline through the isthmic neuromere (r0). Parasagittally, we should see here, caudally to the oculomotor nucleus, the trochlear motor nucleus. Note that the cephalic flexure is partially visible, separating the interpeduncular nucleus from the mamillary body (M; lower left corner). Data from the Allen Developing Mouse Brain Atlas. Abbreviations: cflx, cephalic flexure; dbc, decussation of the brachium conjunctivum (sup.cb.peduncle); dr, dorsal raphe nucleus; dtg, dorsal tegmental decussation; IC, inferior colliculus; icc, intercollicular commissure; ip, interpeduncular nucleus; itc, intertectal commissure (tectal gray + tectal commissures); M, mamillary body; m1, m2, mesomeres 1–2; PAG, periaqueductal gray; pc, posterior commissure (p1); pEW, pre-Edinger-Westphal nucleus; PT, pretectum (p1); rho–rh5, rhombomeres 0–5; SC, superior colliculus; TG, tectal gray (m1); vtg, ventral tegmental decussation. (B, C) – Midsagittal sections illustrating Dlk1 expression at the acroterminal hypothalamic domain (B, E13.5; C, E15.5). Note the AT begins dorsally under the anterior commissure (ac; end of roof plate) and finishes ventrally in front of the mamillary body (mam; end of the floor plate). This singular median area is dorsoventrally patterned, being divided into an alar portion (encompassing the preoptic lamina terminalis -lt- and optic chiasma -och- areas) and a basal portion containing the tuberal median eminence (me), infundibulum and neurohypophysis (hp) and the tuberomamillary transition area. The adenohypophysis (not tagged) also expresses Dlk1. Data from the Allen Developing Mouse Brain Atlas. Abbreviations: ac, anterior commissure; hp, neurohypophysis; lt, lamina terminalis; mam, mamillary body; me, median eminence; och, optic chiasma; zli, interthalamic zona limitans.
The hypothalamus forms the rostral end of the forebrain tagma (and of the neural tube), and it also encompasses the eye and telencephalic evaginations among its alar derivatives (secondary prosencephalon; Díaz and Puelles, 2020). There is a unique closed terminal midline of the hypothalamus (starting under the closed rostral neuropore (anterior commissure) and ending ventrally at the mamillary body; see Figures 4, 12, 13B, 11, 14, 15A, D. This midline terminal wall connects dorsoventrally the rostral ends of the roof and floor plates (see below). It represents the newly recognized acroterminal domain or AT (Figures 13B, 15A; a secondary addition in the updated prosomeric model; see Puelles et al., 2012a; Puelles and Rubenstein, 2015; Puelles, 2018; Díaz and Puelles, 2020; Amat et al., 2022).
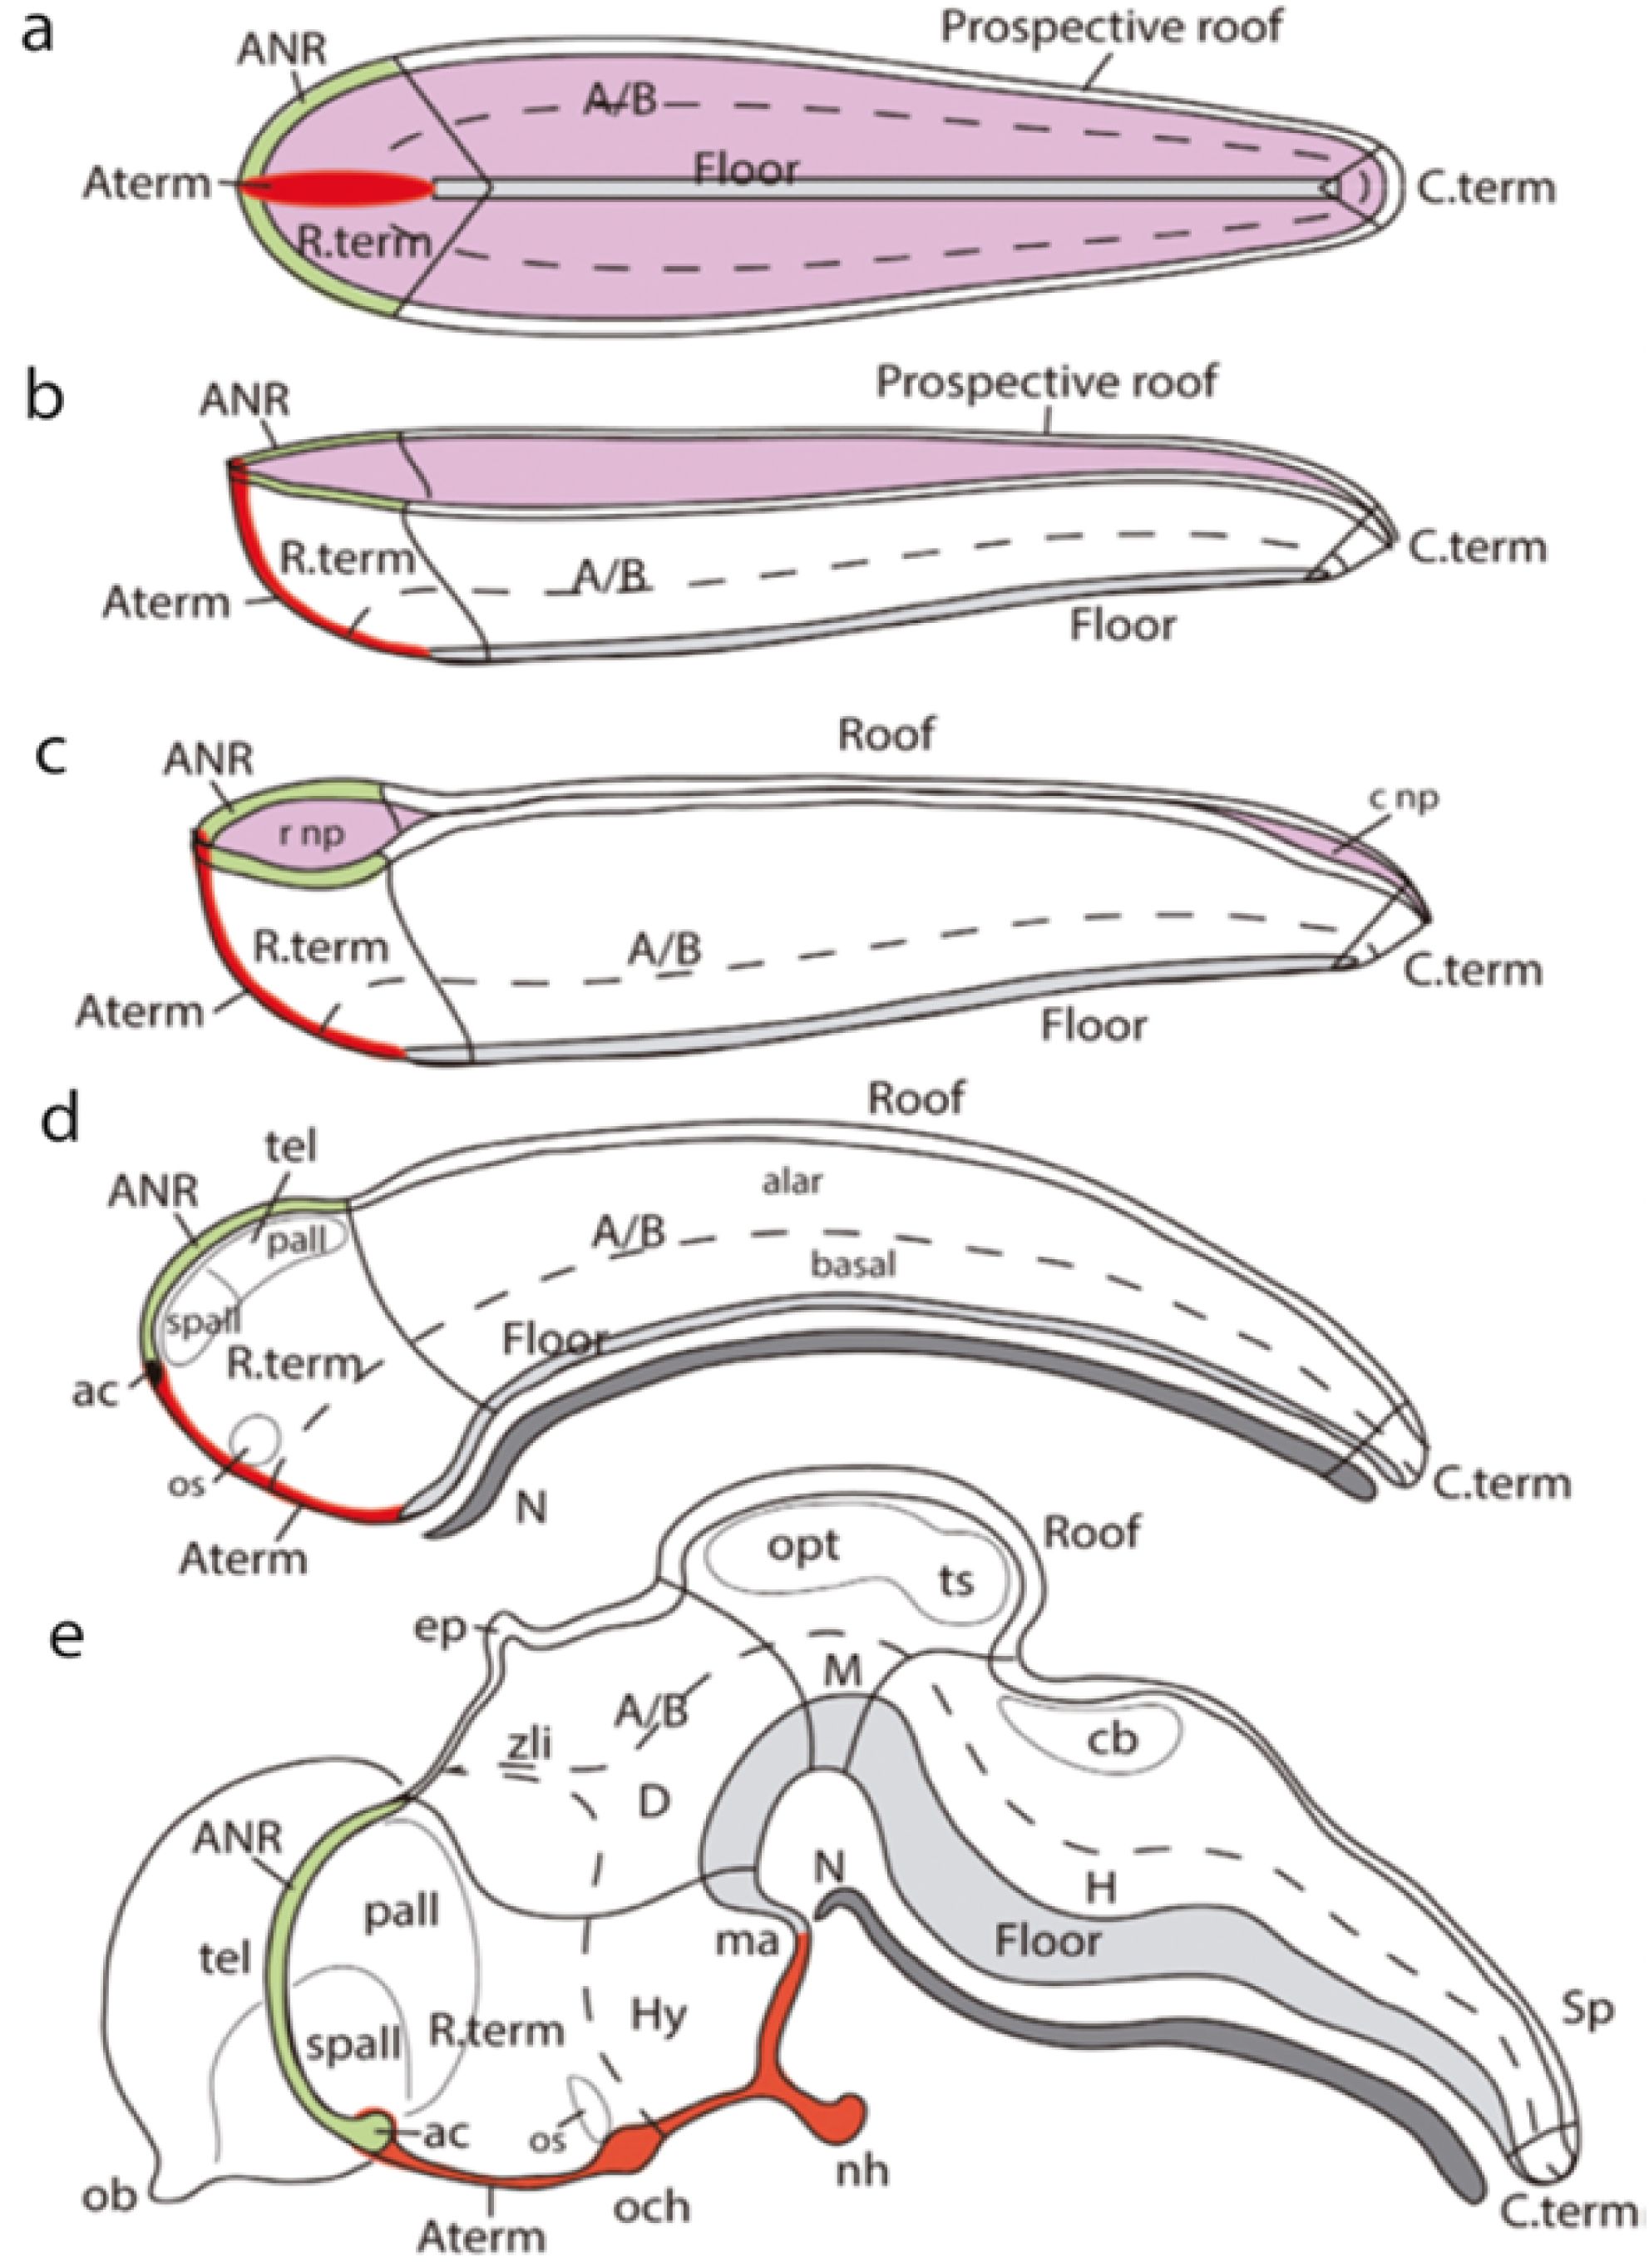
Figure 14. Schematic five steps of the neurulation process, keeping track of various characteristic prospective structures (from Puelles, 2018). (A) The open neural plate, featuring a median floor plate primordium (gray bar) coextensive with the underlying notochord (not shown), that does not reach either the rostral or caudal ends of the neural plate (rostral to the left). The prospective roof plate is represented by the entire ridge that borders the neural plate (the neural/non-neural border); a distinct anterior sector of this ridge (labelled here in green) represents the anterior neural ridge (ANR), known to have important patterning roles; it produces no neural crest cells, and is related by fate and induction to the prospective telencephalon. (B) The “canoe” shape stage at the beginning of neurulation, seen from the side (rostral to the left). Using as a hinge the floor plate, the bilateral halves of the neural plate rise, forming transiently this fully open configuration; note the rostral and caudal terminal regions (Rterm, Cterm) likewise rise. There is now much less future ventricular surface visible (pink). Note the invariant floor plate (gray) and similar prospective roof and ANR domains, as well as the now elevated AT (Aterm, in red), forming the median prow of the canoe. (C) At this stage of advanced neurulation, we see the rostral and caudal neuropores (r np; c np) as the only sites where we can still look into the neural ventricular surface (pink). This change is due to the extensive midline fusion of the roof plate ridges (Roof). Note that the halves of the ANR (green) have not fused yet. Once fusion ends, the canoe will have transformed into a closed “submarine-like” shape. Note that the neuropores do not represent really the anterior and caudal ends of a “neural tube,” as this term suggests; they are just late fusing parts of the roof plate. (D) Once neurulation ends, the neural “tube” is a closed fluid-filled shape that has separated from the neural crest and other cutaneous neighbors. At this stage, the axial notochordal rod (N; dark gray) strictly parallels the extent of the floor plate (light gray), both clearly ending now under the secondary prosencephalon (Rterm). The dorsalmost area of Rterm contains the telencephalic primordium (tel), subdivided into a rostral subpallium and a caudal pallium, with the ANR forming the fused hypothalamic midline roof domain (green), which ends rostrally at the primordium of the anterior commissure (ac; black spot), also representing the dorsalmost part of the Aterm (in red). (E) As development proceeds, differential growth sets in, causing an important ventralwards axial bending (the cephalic flexure, seen above the notochordal tip). The different characteristic morphologic zones we have been following nevertheless retain their mutual topologic relationships, as seen by the colored coding (ANR, green; Aterm, red; floor plate, light gray; notochord, dark gray; alar–basal boundary, dash line; A/B: alar–basal boundary, dash line). Rostral is to the left. Abbreviations: A/B, alar–basal limit; ac, anterior commissure; ANR, anterior neural ridge; Aterm, acroterminal area; cnp, caudal neuropore; C.term, caudal terminal region; cb, cerebellum; D, diencephalon; ep, epiphysis; H, hindbrain; Hy, hypothalamus; M, midbrain; ma, mamillary area; N, notochord; nh, neurohypophysis; ob, olfactory bulb; och, optic chiasma; opt, optic tectum (sup.coll.); os, optic stalk; pall, pallium field; rnp, rostral neuropore; R.term, rostral terminal region; Sp, spinal cord; spall, subpallium field; tel, telencephalon; ts, torus semicircularis (inf.coll.); zli, interthalamic zona limitans.
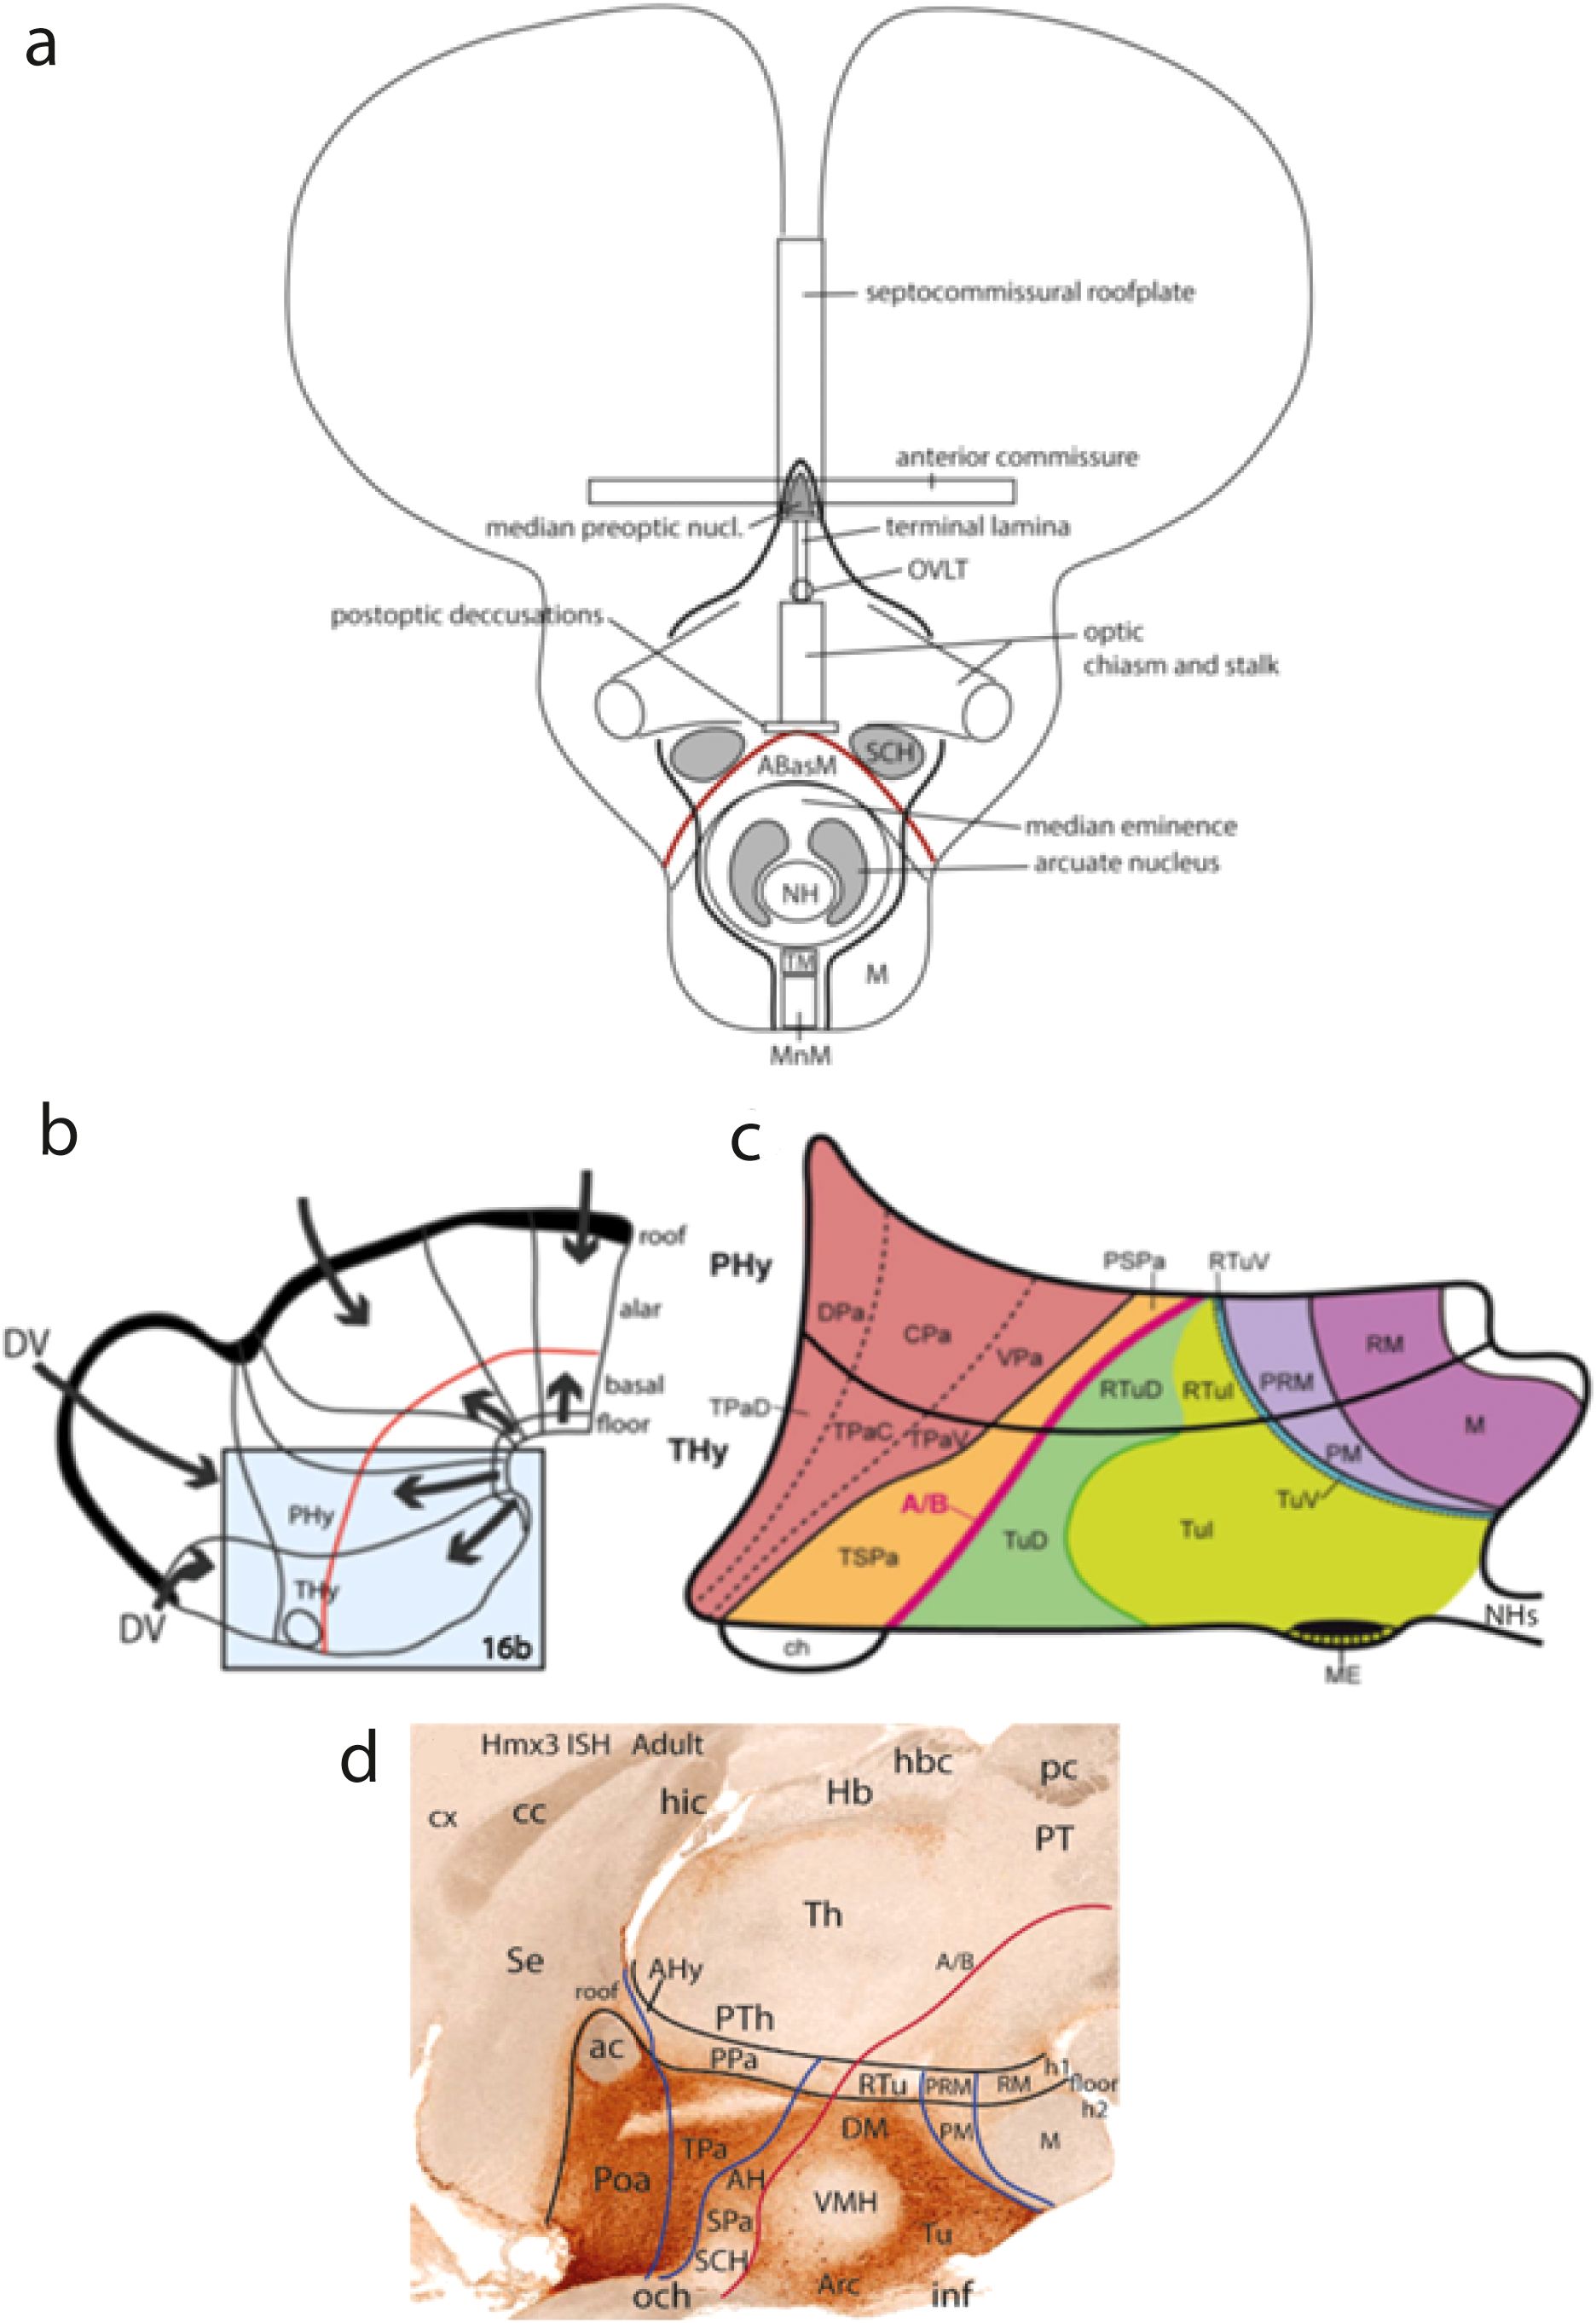
Figure 15. (A) Schematic frontal view of the AT of vertebrates (contained by the right and left thick black lines). It displays diverse subregions, separated into alar and basal domains by the alar–basal boundary (red line); extracted from Puelles and Rubenstein (2015). Abbreviations: ABasM, medial anterobasal nucleus (dorsal tuberal); M, mamillary área; MnM, median mamillary área; NH, neurohypophysis; OVLT, organum vasculosum laminae terminalis; SCH, suprachiasmatic nucleus; TM, tuberomamillary área (ventral tuberal). (B–D): (B) Schematic division of the hypothalamus into peduncular and terminal parts (PHy, THy) belonging respectively to the h1 and h2 hypothalamo-telencephalic prosomeres, in the context of anteroposterior neuromeric subdivisions and dorsoventral (floor and roof derived) patterning signals (arrows in B, and note red alar–basal boundary, indicating the axial direction in B, C; from Puelles and Rubenstein (2015). (C) Enlarged schema of the area boxed in B, showing adult genoarchitectonic map aspects of the dorsoventral alar and basal subdivisions through the PHy and THy moieties (separated by the transverse black intrahypothalamic boundary. The alar domain divides dorsoventrally into the paraventricular (Pa; brown) and the subparaventricular (SPa; orange) longitudinal areas. The basal domain also contains a dorsoventral pattern sequence across PHy and THy: first, the dorsal, intermediate and ventral tuberal/retrotuberal areas (TuD/RTuD; dark green; TuI/RTuI; light green; TuV/RTuV; blue); second, the perimamillary/periretromamillary area (PM/PRM; light lilac), and the mamillary/retromamillary area (M/RM; dark lilac). The hypophysis is cut at its infundibular stalk (HPs). Note the AT was not reproduced in this schema, for simplicity. (D) Adult parasagittal section ISH-reacted for Hmx3 showing an example of molecular delineation of h1 versus h2 (note Hmx3 is expressed exclusively in h2, rather extensively in its alar plate, including the preoptic telencephalic derivative -Poa-, as well as in its tuberal basal region (with exception of the suprachiasmatic and ventromedial nuclei -SCH, VMH-, and leaves unlabeled the perimamillary and mamillary regions. See the anterior commissure -ac- as an integral component of the terminal (h2) roof plate. Downloaded from the Allen Mouse Brain Atlas. Abbreviations: A/B, alar–basal boundary; AH, anterior hypothalamic nucleus; AHy, amygdalo-hypothalamic corridor; Arc, arcuate nucleus; cc, corpus callosum; ch, optic chiasma; CPa, central paraventricular area; cx, cortex; DPa, dorsal paraventricular area; DV, topologic dorsoventral direction; DM, dorsomedial nucleus; h1, h2, hypothalamo-telencephalic prosomeres 1,2; Hb, habenular area; hbc, habenular commissure; hic, hippocampal commissure; HS, hypophyseal stalk; inf, hypophysary infundibulum; M, mamillary area; ME, median eminence; NHs, neurohypophysis stalk; och, optic chiasma; pc, posterior commissure; PHy, peduncular hypothalamus; PM, perimamillary area; PPa, peduncular (h1) paraventricular area; PRM, periretromamillary area; PT, pretectum; PTh, prethalamus; RM, retromamillary area; RTu, retrotuberal region; RTuD; dorsal retrotuberal area; RTuI, intermediate retrotuberal area; RTuV, ventral retrotuberal area; SCH, suprachiasmatic nucleus; Se, septum; SPa, subparaventricular area; Th, thalamus; THy, terminal hypothalamus; TPa, terminal (h2) paraventricular area; TPaC, central terminal paraventricular area; TPaD, dorsal terminal paraventricular area; TPaV, ventral terminal paraventricular area; TSPa, terminal subparaventricular area; Tu, tuberal region; Pos, preoptic area; PSPa, peduncular subparaventricular area; TuD, dorsal tuberal area; TuI, intermediate tuberal area; TuV, ventral tuberal area; VMH, ventromedial hypothalamic nucleus; VPa, ventral paraventricular area.
The forebrain divides into three proneuromeres: (1) the secondary prosencephalon (SP) or hypothalamo-telencephalic complex (plus the evaginated eye vesicles), (2) the diencephalon, and (3) the midbrain (Figures 12A, B; 11A, B). There are seven forebrain neuromeres, known as prosomeres, generally named caudo-rostrally. As shown in Figures 11A, B, they include 2 hypothalamo-telencephalic units, hp1, hp2 (abbreviated h1, h2), which jointly form the classic “secondary prosencephalon” (SP). There are three diencephalic units, dp1, dp2, dp3 (abbreviated p1–p3; see Figures 12B; 11A, B), and two midbrain units, mp1, and the minute mp2 (abbreviated m1, m2; Figures 11A, B; m1 and m2 are named in rostrocaudal order, for historical reasons, that is, they initially were not thought to be part of the forebrain). In this essay the abbreviated names will be used, for simplicity. The resulting rostrocaudal sequence is accordingly: h2, h1, p3, p2, p1, m1, m2 (Figures 11A, B). Note that all these prosomeres uniformly extend from the floor into the roof of the neural tube and are orthogonal to the longitudinal axial molecular landmarks illustrated in Figure 12 (floor, alar–basal boundary, roof) as well as the alar and basal plates shown in Figures 1B, 7B, C, 10, 12B, 16, 17. The h2 unit ends rostrally at the closed AT (Figures 11A, B, 12, 13B).
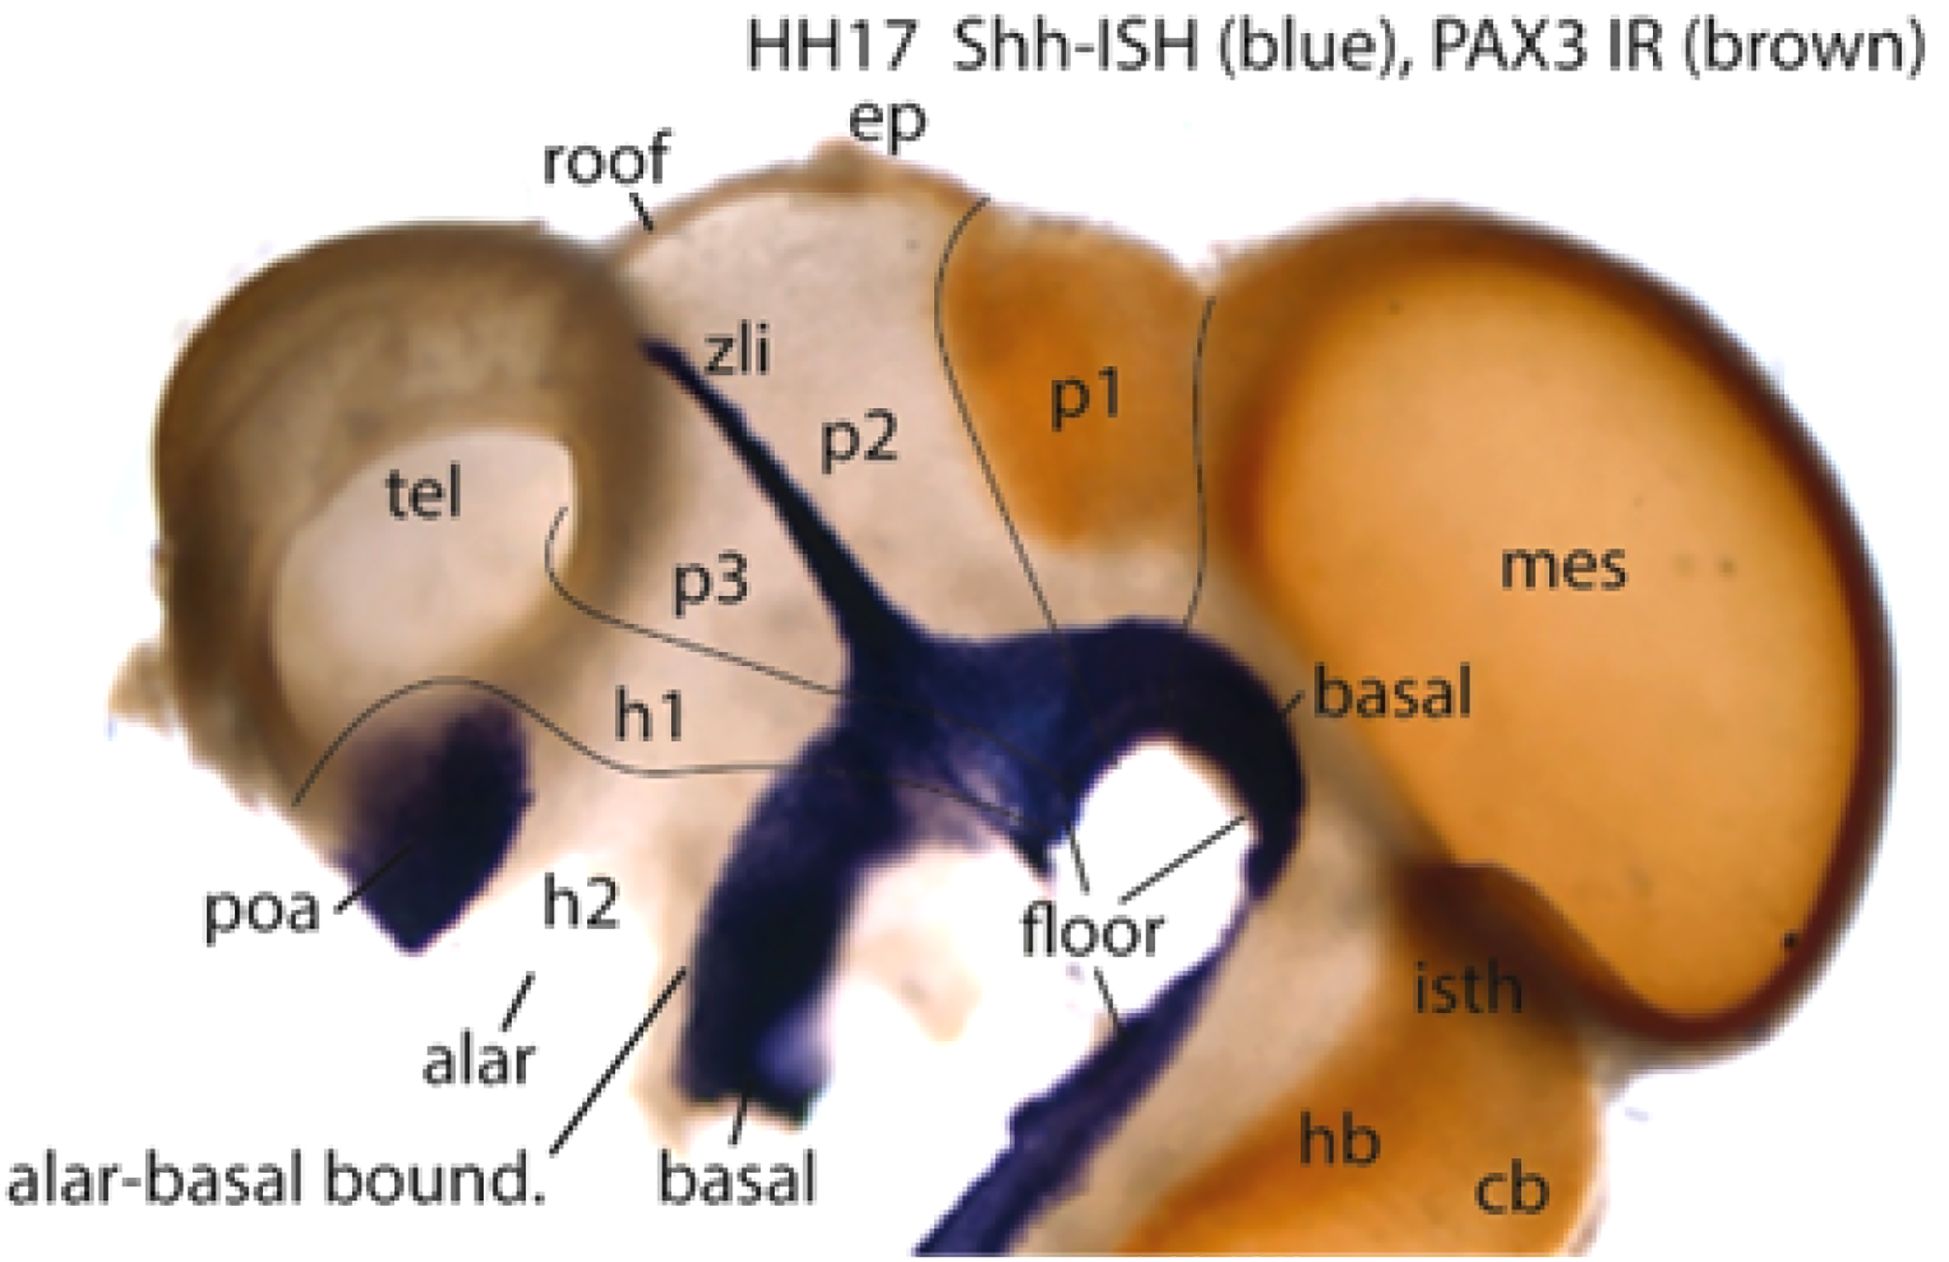
Figure 16. Wholemount chick embryo at stage HH17 reacted by in situ hybridization for Shh transcripts (blue signal) and PAX3 immunoreaction (brown signal) (from Puelles, 2021). The Shh marker is related to notochordal axial induction of the whole neural floor domain by diffusion of secreted chordal SHH protein, and induction of floor Shh expression, which activates secondary Shh expression in the forebrain basal plate (but not in the hindbrain -HB- or spinal tagmata; note a part of the acroterminal tuberal and mamillary hypothalamus -tu, M- loses secondarily its earlier Shh expression due to inhibition caused by the neighboring adenohypophysis; compare Figure 13C); there are extra Shh expression sites: in the transverse zona limitans spike (zli) ascending into the diencephalic alar plate (along the p3/p2 interneuromeric boundary; compare ZL in Figures 1B, 12B, 11A), as well as in the telencephalic preoptic area (Poa); these are due to alternative enhancers activating the Shh gene, but unrelated to notochordal induction (see Andreu-Cervera et al., 2019). The transcription factor PAX3 is restricted to the hindbrain alar plate and alar territories of the midbrain and the caudal diencephalic pretectal region (alar p1; it stops rostrally at the p2/p1 interneuromeric boundary). Abbreviations: cb, cerebellum; ep, epiphysis; h1, h2, hypothalamo-telencephalic prosomeres 1,2; hb, hindbrain; mes, mesencephalon; p1–p3, diencephalic prosomeres 1–3; poa, preoptic area; tel, telencephalon; zli, interthalamic zona limitans.
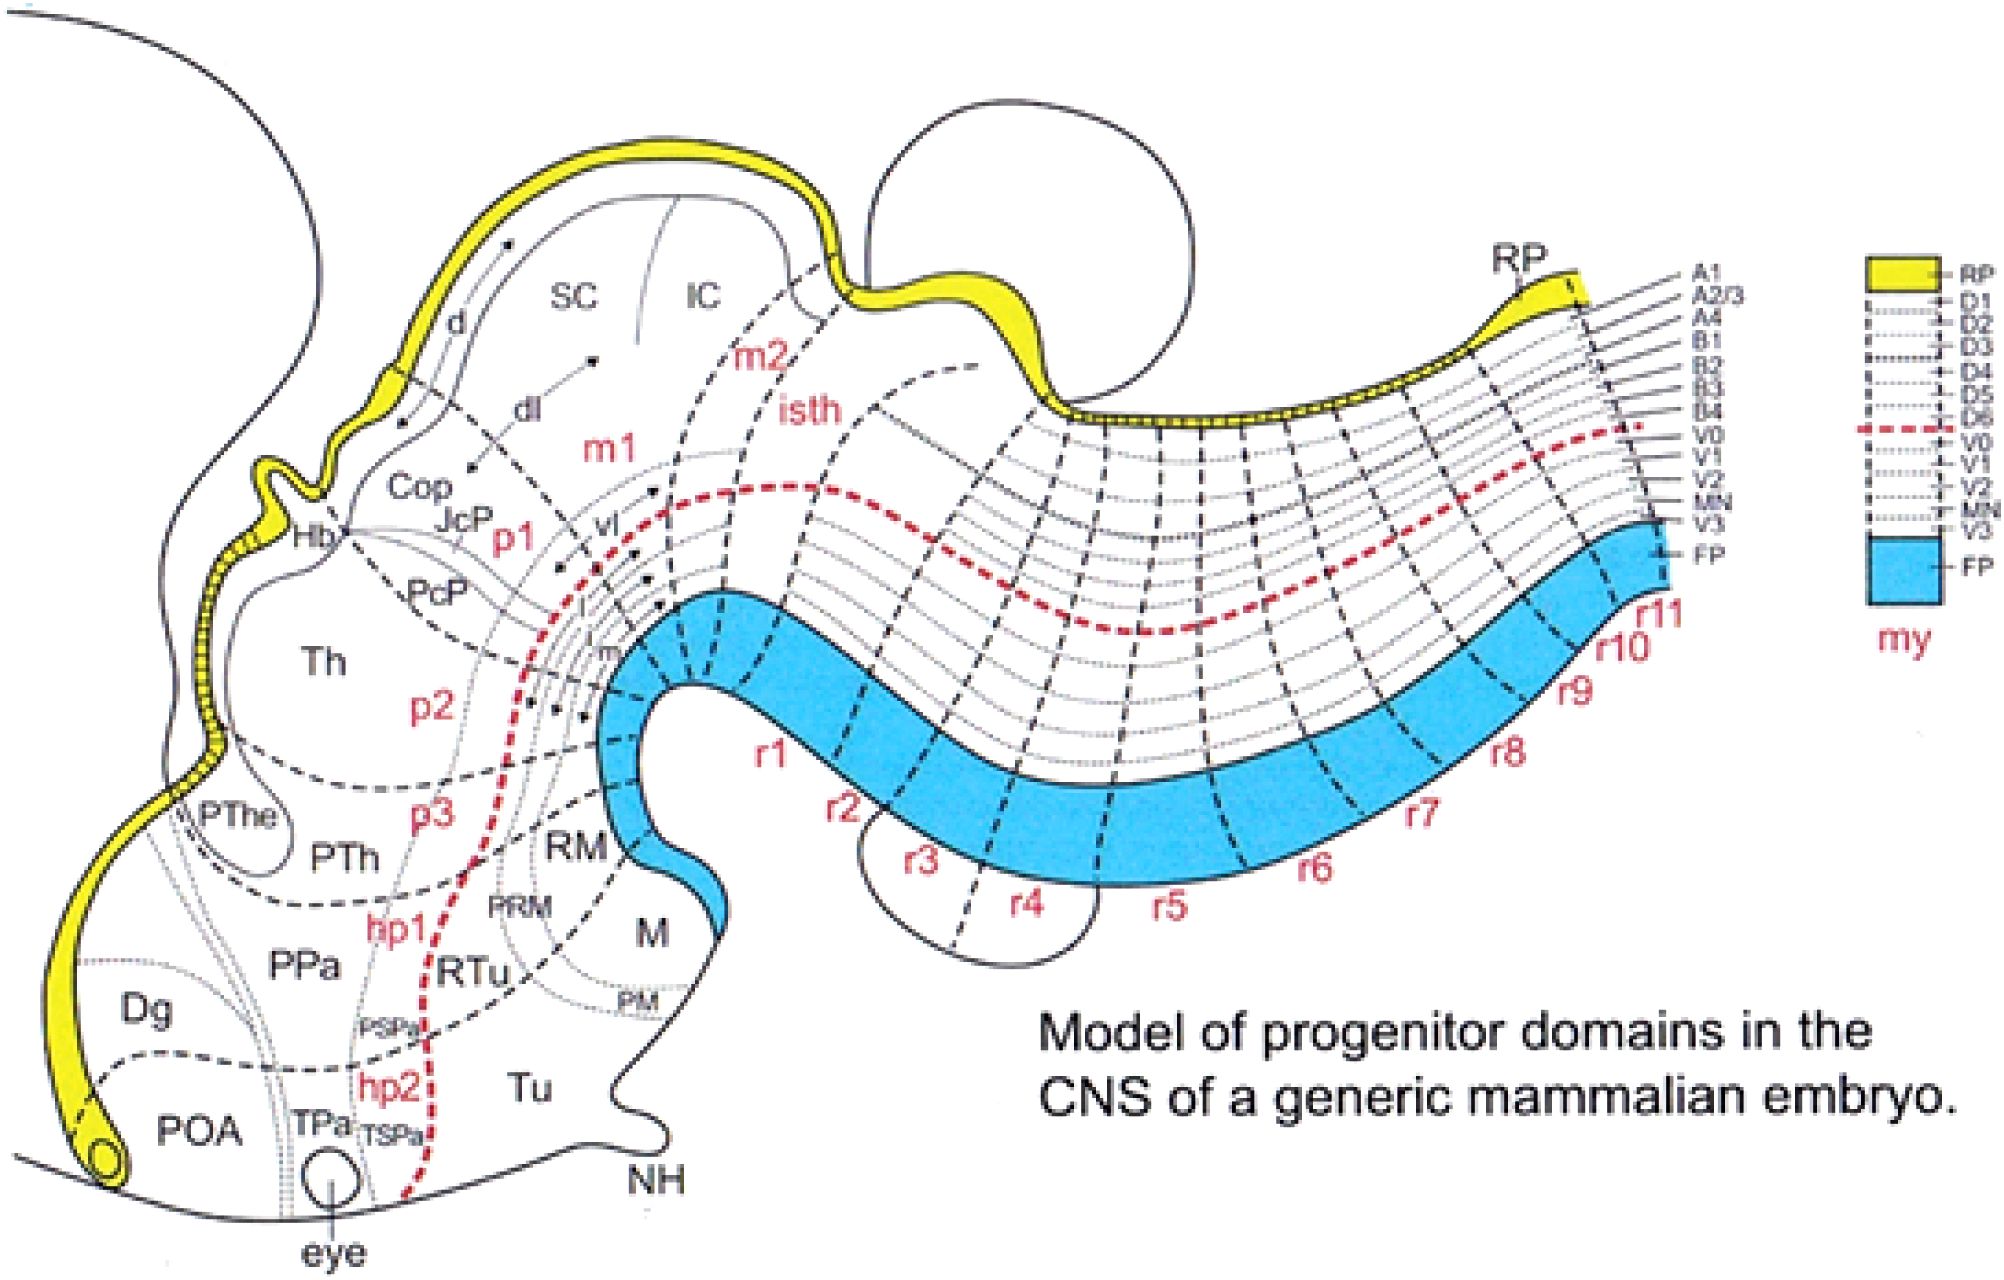
Figure 17. Schematic mapping upon the updated prosomeric model of published data on secondary dorsoventral and anteroposterior microzonation of diverse basal and alar domains (from Nieuwenhuys and Puelles, 2016). The schema is still incomplete in several brain parts due to lack of specific data. It is expected that further studies may still reveal more sites where such subdivisions emerge. There is nevertheless some indication of a shared general pattern in the number of such subdivisions (for instance, we already know that the basal hypothalamus across h1 and h2 presents five microzonal subdivisions, similarly as the hindbrain and spinal cord basal plate. According to available data, each microzone is specified with a singular molecular profile, which confers to it the capacity to generate a handful of unique neuronal types. Such secondary regionalization occurs also significantly within the telencephalic vesicle, where a diversity of pallial and subpallial areas have been described, each producing subtly distinct cell populations. The produced cell types may remain where they are born or migrate away, later incorporating at more or less distant sites (e.g., the inhibitory subpallial interneurons that colonize the cerebral cortex and other pallial areas). On the other hand, some very extensive areas, such as the cerebellum or the neural retina, do produce sequentially a diversity of neuron types, and may show some regional specializations, but hardly subdivide strictly into microzonal areas (see Puelles and Nieuwenhuys, 2024). A1–A4, alar microzones A1–A4; B1–B4, alar microzones B1–B4; CoP, commissural pretectum; d, dorsal alar domain; Dg, diagonal area (subpallium); dl, dorsolateral alar domain; Hb, habenula; hp1, hp2, hypothalamo-telencephalic prosomeres 1,2; i, intermediate basal domain; IC, inferior colliculus; isth, rhombomere 0; JcP, juxtacommissural pretectum; l, lateral basal domain; M, mamillary area; m, medial basal domain; m1, m2, mesomeres 1,2; MN, motoneuron-producing basal microzone MN; my, myelomere (example); NH, neurohypophysis; p1–p3, diencephalic prosomeres 1–3; PcP, precommissural pretectum; PM, perimamillary area; POA, preoptic area (subpallium); PPa, peduncular paraventricular area; PRM, periretromamillary area; PSPa, peduncular subparaventricular area; PTh, prethalamus; PThe, prethalamic eminence; r1–r11, rhombomeres 1–11; RM, retromamillary area; RP, roof plate; RTu, retrotuberal area; SC, superior colliculus; Th, thalamus; TPa, terminal paraventricular area; TSPa, termina subparaventricular area; Tu, tuberal area; V0–V3, basal microzones V0–V3; vl, ventrolateral alar domain.
1.1.2 Hindbrain
The hindbrain tagma extends between the isthmo-mesencephalic boundary and the rhombo-spinal boundary (Figures 4, 11, 12, 13A). It divides into four early proneuromeres (partly identified first by Vaage, 1969). These are the prepontine, pontine, retropontine, and medullary proneuromeres (Prp, P, RP, Med; Figures 4A, 5A). Note the four modern proneuromeric divisions of the hindbrain substitute for the inexact old metencephalon and myelencephalon concepts, derived from human adult neuroanatomy, and considered by us imprecise and lacking explanatory potential (they are difficult to correlate precisely with the rhombomeres) and thus now obsolete. The classic adult-human-based bipartition of the hindbrain is inconsistent with the real neuromeric structure. It involves among other errors the wrong ascription of the entire prepontine hindbrain to the midbrain (a point now clearly falsated by many gene expression and experimental findings, apart corroborative comparative results; note that non-mammals normally do not have a pons bulge even when they have a small primordium of pontine nuclei), and the classic met-myelencephalic border cuts obliquely across rhombomeres r4–r6.
As shown in Figures 4, 5A, 11B, there are 12 hindbrain rhombomeres (counted rostrocaudally as r0–r11). The prepontine proneuromere contains two units [r0–r1]. The r0 unit represents the classic isthmus rhombencephali, first recognized by His (1893); it lies largely rostral to the cerebellum but participates in the latter’s dorsomedian vermis. There is evidence suggesting that the extra-large r1 segment subdivides into rostral and caudal halves -r1r, r1c- which increases the list to 13 members (Vaage, 1969, 1973; Alonso et al., 2012). The cerebellar hemisphere and the floccule belong to r1. The term “isthmo-cerebellum” is often used, comprising the pair r0 and r1 [actually r0, r1r, r1c]; this complex displays the interpeduncular nuclear complex along its entire ventral midline. The pontine proneuromere comes next; it holds three rhombomeric units [r2–r4], which encompass the whole macroscopic pontine bulge; there is the peculiarity that the pontine nuclei only occupy the r3–r4 basilar domains, whereas r2 contains exclusively pontocerebellar crossed fibers targeting the cerebellum in r1 and r0; these pontocerebellar fibers (forming the middle cerebellar peduncle) surround the mixed root of the trigeminal nerve in r2, which thus seems to arise out of the pons (Figure 18A; see Watson et al., 2019). The underlying retropontine proneuromere shows two rhombomeres [r5–r6], which classically were wrongly appended to the pons. The r5 unit is the site of the abducens motor nerve origin and displays likewise the superior olivary complex (SOl in Figure 6) and related trapezoid body decussation (Figure 9). The r6 unit is the locus of the alar migrated facial motor nerve (Figure 8) and shows laterally the root of the glossopharyngeal nerve (9n; Figure 8). Both r5 and r6 participate with rhombomeres r2–r4 in the trigeminal, cochlear, and vestibular sensory columns. Finally, the medullary proneuromere divides into five rhombomeric units [r7–r11] (Med; Figures 5A, 10, 11B, 17). The latter are cryptic neuromeres, meaning their limits are not visible externally as constrictions separating bulges, as happens with overt neuromeres r2–r6 (see Figures 2, 4C), but are detectable molecularly and by experimental fate mapping (Cambronero and Puelles, 2000; Marín et al., 2008; Tomás-Roca et al., 2016). The r0/r1 and r6/r7 boundaries are also cryptic. Recent studies have suggested that boundary cells at the interrhombomeric boundaries develop peculiar molecular properties typical of stem cell niches (thus regulating neuromere growth and boundary establishment) and produce planar signals causing downregulation of Fgf3 in the rhombomere centers (activity of this gene persists at the boundaries, which thus would become secondary organizers secreting FGF3 protein). This molecular profile change might bring immature rhombomeres into a new differentiative phase of development with continuing proliferation (Sela-Donenfeld et al., 2009; Weisinger et al., 2012; Peretz et al., 2016; Hutchings et al., 2024).
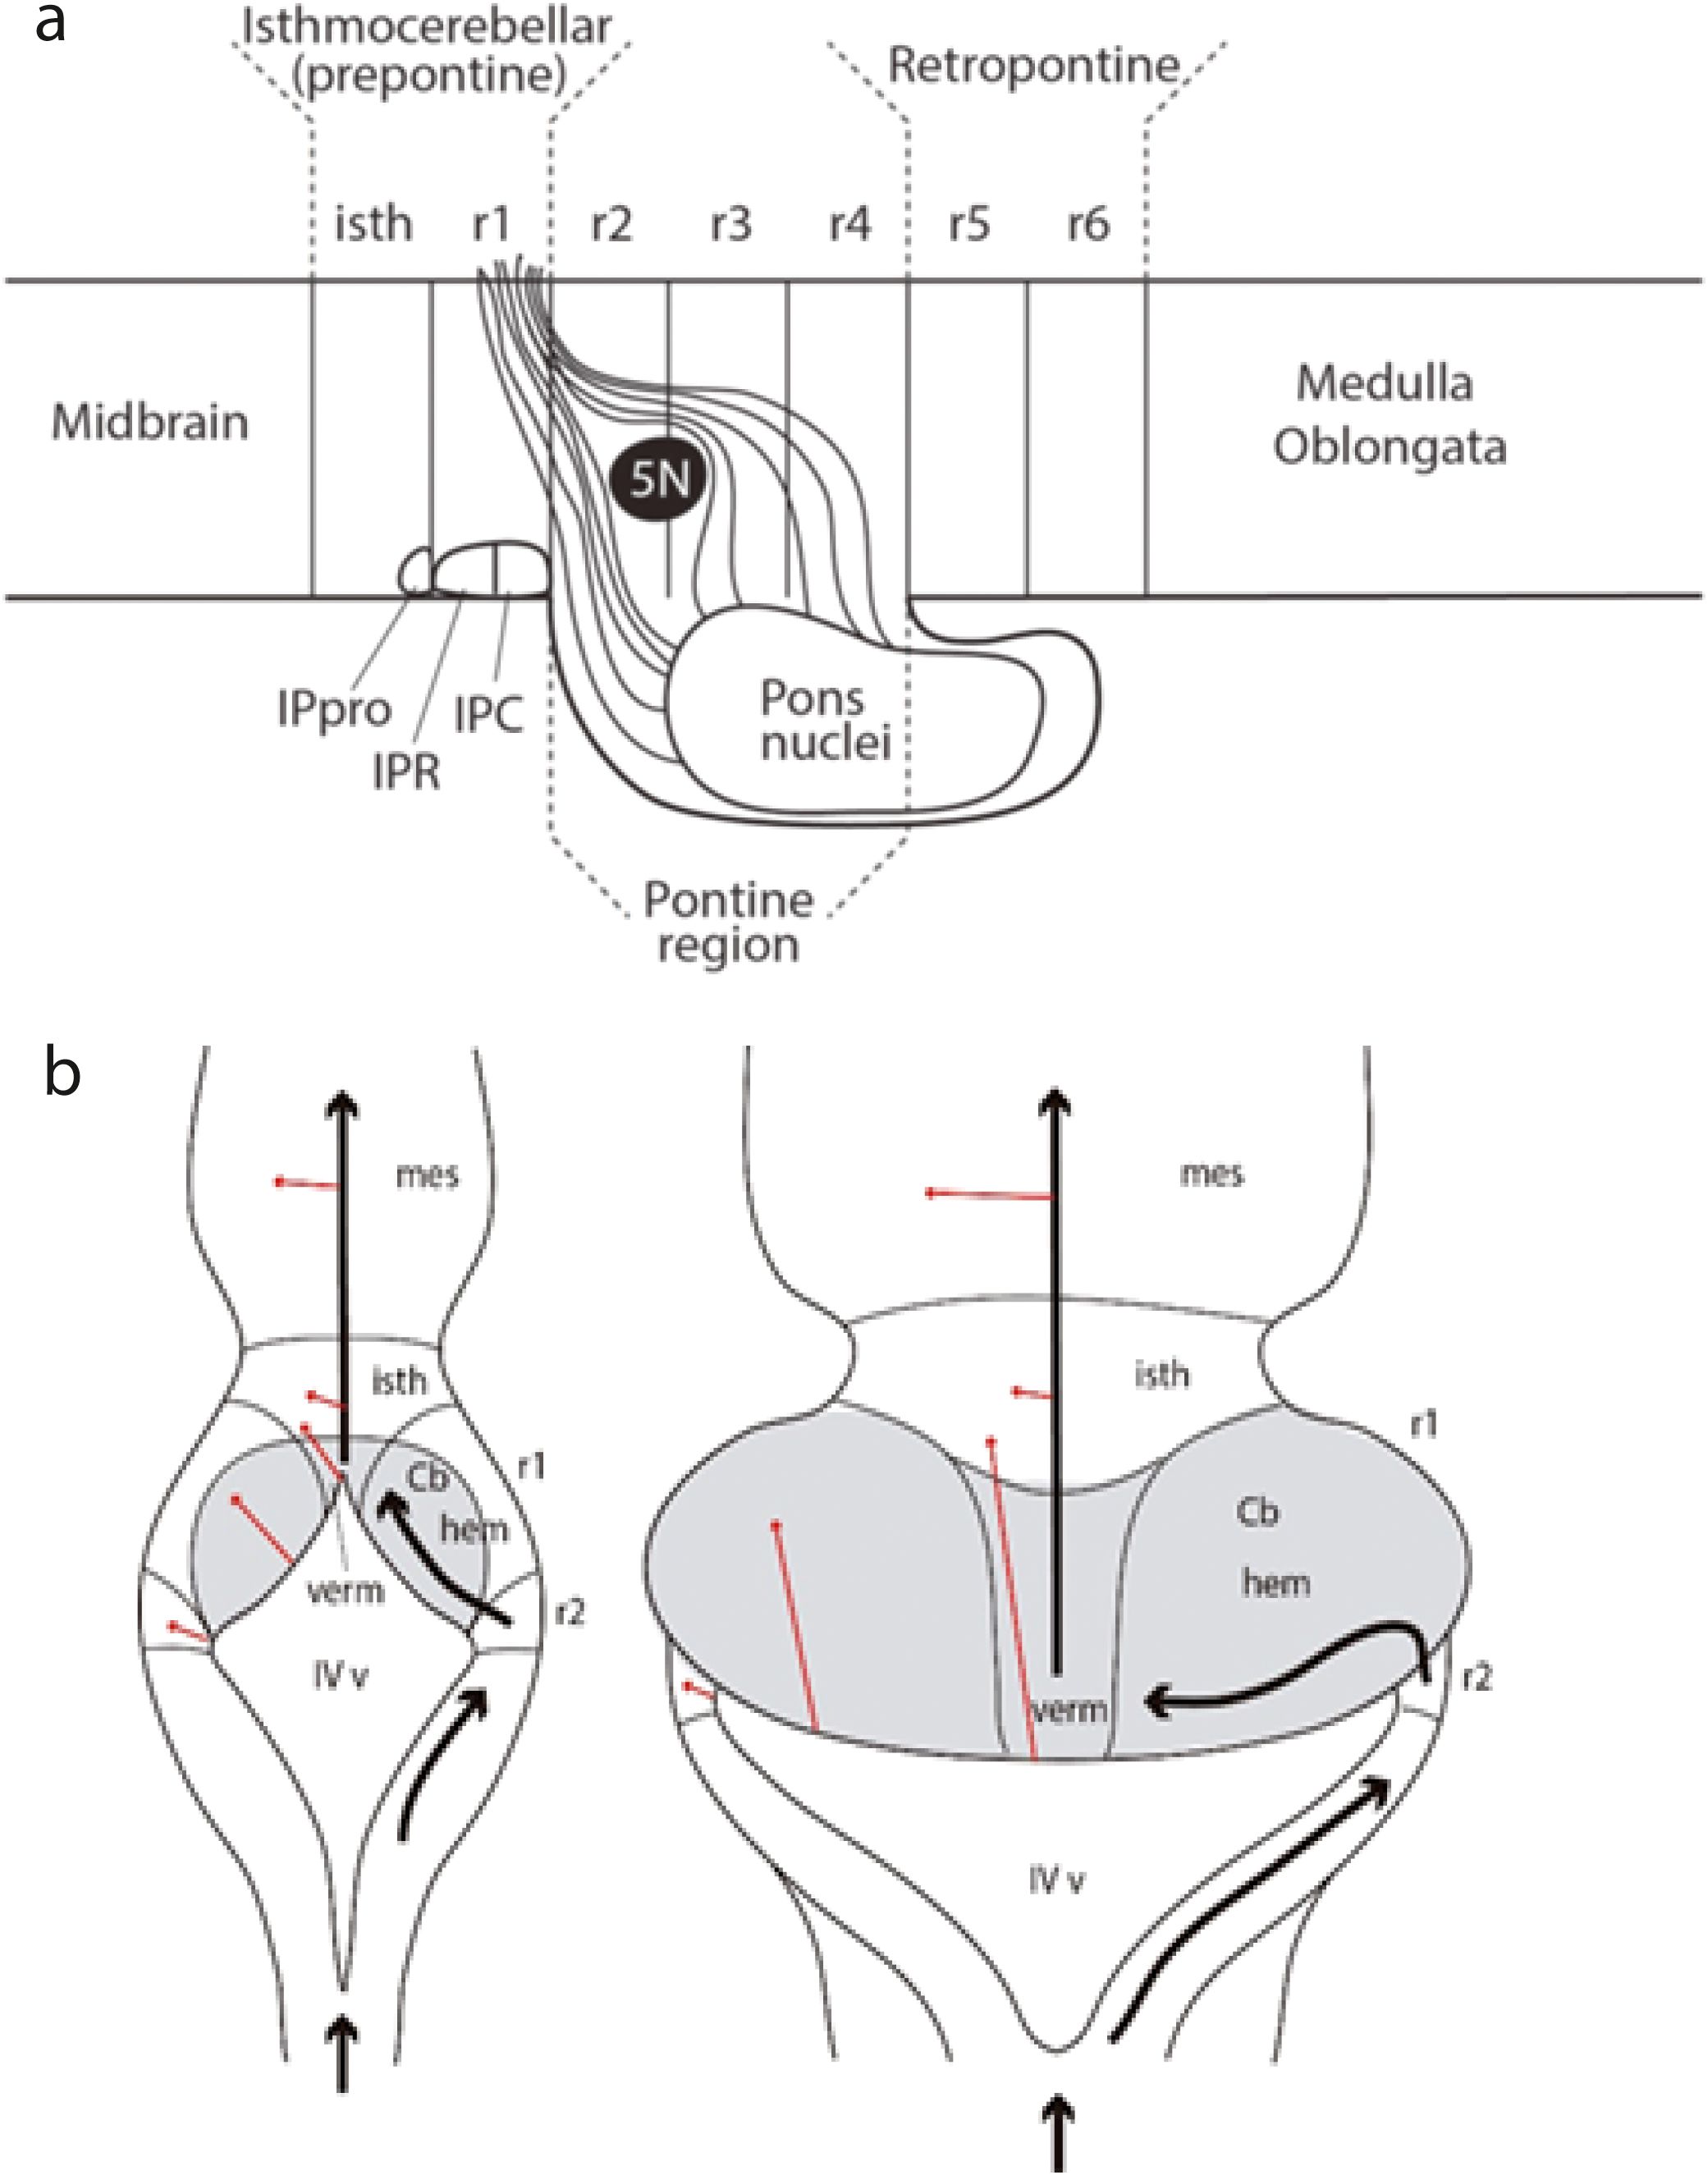
Figure 18. (A) Schema from Watson et al. (2019) of a sagittal neuromeric view of prepontine, pontine and retropontine hindbrain levels, illustrating the relationships of the pontine basilar nuclei and the course of their crossed cerebellopetal efferents (the middle cerebellar peduncle) relative to the root of the trigeminal nerve (5N) and the prepontine interpeduncular nuclear complex (IPpro, isthmic prodromal IP component; IPR, IPC, rostral and caudal main IP nuclei in r1r and r1c, respectively; compare Figure 9). Note this schema refers particularly to the human pons, in which, as a deformation of r3–r4, the basilar pontine nuclei bulge and overhang importantly caudalwards in front of r5 and r6 (which strictly result hidden but are unaffected). This apparent “descent” of the pons in front of the trapezoid body in r5, and apparently approaching the inferior olive in r8 (as usually drawn in human neuroanatomy texts) is less marked in other mammals with a smaller pons (see mouse pons in Figure 9). The roots of the facial and vestibulocochlear nerves would lie at the laterodorsal part of alar r4 that is devoid of pontine efferents. Note that the classic neuroanatomic division into metencephalon and myelencephalon classifies the hidden r5–r6 rhombomeres as lying in the pontine metencephalon (though the glossopharyngeal nerve originating in r6 is described in the medulla). The facial and vestibulocochlear nerve roots are placed at an irreal boundary sulcus between metencephalon and myelencephalon. The prosomeric medullary proneuromere (r7–r11) thus does not coincide precisely with the classic myelencephalon. Abbreviations: isth, isthmus (r0); IPpro, interpeduncular nucleus, prodromal part; IPR, rostral interpeduncular nucleus (r1r); IPC, caudal interpeduncular nucleus (r1c); 5N, trigeminal nerve root; r1–r6, rhombomeres 1–6. (B) — Diagrams illustrating at two theoretic developmental stages the invariant topologic relationships of the cerebellar plate (in gray) relative to the r0, r1, and r2 rhombomeres and the neural or chorioidal roof plate (from Nieuwenhuys and Puelles, 2016). At the less deformed early stage the rhombic chorioidal tela begins in r0 (prospective vermis -verm) and continues across r1 (prospective cerebellar hemispheres -hem) into its lateral angles in r2. The red arrows indicate what would be the dorsoventral direction starting from the deformed roof plate. The black arrows mark the deformed longitudinal rostralward direction along the rhombic lip into the isthmic and midbrain roof. At the second diagram at a more advanced stage all the previous topologic relationships persist, but increased growth-related morphogenetic deformations cause the vermis to apparently reach a more caudal position (false), and the lateral chorioidal angles in r2 now seem to lie lateral to the whole cerebellum (equally false: this is the topological caudalmost part of the cerebellum, the flocculus, which obviously results pushed into this apparent far lateral position). The primitive rostral angle of the chorioidal rhombic roof is now hidden under the mass of the vermal cerebellum (see Figures 15B, 19). Cb, cerebellum; hem, hemisphere; isth, isthmus (r0); IVv, fourth ventricle; mes, mesencephalon; verm, vermis.
1.1.3 Spinal cord
The spinal cord tagma divides into five proneuromeres, which can be called pretrematic, superior trematic, intertrematic, inferior trematic and post-trematic proneuromeres (Watson and Sidhu, 2009; “trema” is Greek for “limb”). The spinal proneuromeres seem to relate to the code of Hox genes (see developmental data given by Puelles, 2013; Sengul and Watson, 2012). The rhombo-spinal boundary lies behind the inferior olive and just above the decussation of the pyramidal tracts (Figure 9; Tomás-Roca et al., 2016; this implies a transverse plane that bisects the fifth vertebral body, as determined in the chick; Cambronero and Puelles, 2000). The number of spinal myelomeres is species-variable (there are roughly as many as vertebrae or spinal nerves; they are over 30 in the human case, over 200 in some serpents). There are also species differences in the relative number of myelomeres in particular spinal proneuromeres, for example, the chick has 14 pretrematic (cervical) myelomeres, while the swan has 25. Some dinosaurs reached 76 cervical segments, whereas most mammals including both us and whales have only 7 (Portmann, 1959). This spinal variability relates to the fact that the spinal cord grows by rostrocaudal clonal elongation, which varies quantitatively in different species (variable activity of the tail bud growth center), whereas the forebrain and hindbrain arise by direct neural induction and ulterior subdivision (Mathis and Nicolas, 2000a, b).
The major argument for the existence of myelomeric segments of the spinal cord is the well-established clinical experience on dermatomes and myotomes, showing in practice that corresponding unitary transverse sectors of the spinal cord deal functionally with topologically transverse skin and muscular peripheral fields, being connected to them by specific spinal nerves (the anterior and posterior rootlet bundles of these nerves define morphologically the limits of each myelomere). Molecular evidence of myelomeres is less precise, being centered so far on the analysis of Hox family genes, the expression of whose paralogues is known to start systematically at the caudal spinal tip and ascend to a precise transversal end at different spinal or hindbrain levels, separating two myelomeres or rhombomeres. If the Hox system is valid for rhombomeres, perhaps it is also valid for myelomeres. This evidence may relate more to spinal proneuromeres (pretrematic, upper and lower trematic, intertrematic, post-trematic) than to neuromeres proper. We apparently do not know yet enough genes to delimit molecularly all myelomeres, but there are various gene families which have not yet been explored sufficiently in this direction, perhaps due to the opinion of Lim et al. (1991) that myelomeres are secondary to somites. This opinion is based on the observation that if you cool the embryos beyond a given point then the somites cease to form and the spinal cord lacks periodic bulges with nerve pairs (myelomeres). However, the interpretation that somites cause the appearance of myelomeres may be faulty reasoning, since the failure of myelomeres after cooling may be due to direct effect of cooling on the spinal cord, without necessarily implying a somitic influence. I am not aware of any other adduced evidence for this point. As regards the AChE-stained spinal cord, it looks similar to the caudal medullary part of the hindbrain, where r6–r11 tend to be undistinguishable one from another (Figure 5A). Cell number increases at the cervical and lumbar thickenings. Some specific spinal cell types are only present in selected sets of myelomeres (e.g., Clarke’s column cells, the preganglionic sympathetic ones, or the urinary motor ones, similarly to what happens in the hindbrain).
1.2 Overt and cryptic neuromeres
Classically the neuromeres were defined by the bulge they overtly form (transiently) at the lateral brain wall. Classic authors thus basically counted the number of such overt bulges in the forebrain or the hindbrain (e.g., Figure 2). However, in recent times, it was discovered that there are species variations in the amount of bulging that neuromeres produce, including cases in which they practically do not bulge at all, while keeping all the other typical characteristics, including cytoarchitectonic boundaries, relationships with nerve roots and tracts, unique molecular profiles and types of neuronal derivates (cell fates). These flat and thus morphologically indistinct but still molecularly distinct transverse units of the neural tube were called first “pseudoneuromeres” (Cambronero and Puelles, 2000) and later, more precisely, “cryptic neuromeres” (Puelles, 2013; this renaming was suggested by R.Nieuwenhuys—personal communication—who correctly argued these were just “hidden neuromeres,” rather than “false neuromeres” as implied by the “pseudo” prefix; see Nieuwenhuys and Puelles, 2016; Nieuwenhuys, 2017). Adding the cryptic neuromeres to the overt ones achieves a more consistent list of such units, since in this way, all hindbrain transverse cytoarchitectonic boundaries can be explained (Figures 4, 5A). Fate-mapping experiments and molecular maps in the chick (Aroca et al., 2006; Marín et al., 2008) or mouse (Tomás-Roca et al., 2016) detected no significant differences in the morphologic properties and typical-derived structures of overt and cryptic neuromeres, and both show strict correlation with different Hox gene paralogs (Marín et al., 2008; Tomás-Roca et al., 2016). A progeny study of the cryptic isthmic rhombomere (r0) in the mouse identified a completely standard neuromeric derived territory in the adult brain (Figures 5C, D, 13A; Watson et al., 2017). The list of cryptic neuromeres includes h1 and h2 in the hypothalamus (but see the basal ventricular cavities in Figure 11A), plus r0, r1 [r1r, r1c], and r6–r11 in the hindbrain. See Figures 7 and 8B for the early delimitation of the m1 and m2 prosomeres.
1.3 Axial definitions
An essential aspect of the prosomeric model is its attention to the theoretic concept and practical visualization of the brain length axis. This is because the tagmata, proneuromeres, and neuromeres by definition are serial transverse partitions formed by patterning orthogonal to the neural axis, irrespective whether the neural tube bends or not (actually, it always bends; there is apparently no vertebrate with a completely straight neural tube). All earlier versions of the brain axis that were merely drawn schematically as a virtual (arbitrary) line through the middle of the neural ventricular space should be disregarded, for lack of proper landmarks and causal underpinning. Our chosen prosomeric brain axis courses through the neural tube wall and may be visualized redundantly at three different dorsoventral positions: floor, alar–basal boundary, and roof. The alar–basal boundary approximates the old “sulcus limitans” proposal of His (1893, 1895, 1904), though we use molecular limits rather than His’s limiting alar–basal sulcus, whose relief was usually variable and sometimes absent. Recent updates of the prosomeric model further underpin the brain axis by its parallelism with the notochord and corresponding induced gene patterns (i.e., we nowadays refer to an epichordal extent of the whole neural tube axis, as was already pointed out by His; note the early versions of the prosomeric model did not yet contain this important conclusion (epichordal and prechordal parts of the brain were conceived, as done before by other authors). These mistaken notions were corrected in Puelles et al. (2012a); Puelles and Rubenstein (2015), Puelles (2018); Puelles and Nieuwenhuys (2024). The modern notion highlights as relevant for tracing the axis the fundamental early process of chordal-induced dorsoventral neural patterning (in antagonistic relationship with roof-derived signals). This general mechanism produces throughout the tube the consistent dorsoventral organization into floor, basal, alar and roof longitudinal zones, first discovered and emphasized by His (1893), who however did not know its causes. This now amply experimentally corroborated causal conclusion implies that the axial dimension can be molecularly visualized variously: (1) along the ventral floor (Figures 12C, D, 16), (2) along the lateral alar–basal boundary (Figure 12B), or (3) along the dorsal median roof of the neural tube or the adult brain (Figure 12A). These molecularly definable longitudinal landmarks are all topologically parallel one to another, as well as to the underlying notochord, and can be already visualized at neural plate stages, much earlier than His’s limiting sulcus, which only emerges at best secondary to precocious neurogenesis in the basal plate (Figures 1B, 5A, B; Sánchez-Arrones et al., 2009; Puelles et al., 2012a; Puelles and Rubenstein, 2015; Puelles, 2017, 2018; Amat et al., 2022).
Indeed, after gastrulation the notochord underlies throughout the prospective brain floor and exerts vertical ventralizing inductive effects via dorsalward diffusion of SHH protein (plus other signals). This ventralizing effect antagonizes the contrary effects of WNT and BMP dorsalizing morphogens diffusing ventralwards from the roof plate; this DV patterning process induces first the differentiation of the floor plate, followed by that of the basal plate (both upregulate the Shh gene in the forebrain tagma, in contrast with the hindbrain and spinal cord tagmata that only express Shh in the floor plate; Figure 16). This DV antagonism further results in consequent regionalization of the neural wall into the four primary longitudinal zones of His (1893, 1904): the floor, basal, alar, and roof plates (see also Figures 1B, 4, 12). These domains and their boundaries jointly define both the axial dimension and the dorsoventral pattern of the whole neural tube. These four longitudinal zones all reach rostrally the hypothalamic AT, as well as caudally the spinal tip. In contrast to these DV vertical chordal effects, the prechordal plate, representing dorsal pharyngeal endoderm gastrulated before the notochord and forming the roof of the mouth and pharynx endodermal primordium, transiently establishes direct contact with the prospective AT of the hypothalamus in front of the notochordal tip (i.e., in the prospective tuberoinfundibular region, above the submamillary end of the notochord – see Ferran et al., 2022; their Figures 2A, 4, 12A–C). The prechordal plate thus represents a source of anteroposterior inducing signals, experimentally shown to be fundamental for the induction and differential AP partition of the entire forebrain down to the isthmus (e.g., García-Calero et al., 2008; note the malformative holoprosencephaly syndrome displaying median fusion of the eyes, nose and forebrain and loss of the mamillary body) is an alteration of prechordal signaling mechanisms affecting mainly the hypothalamus, eyes, and telencephalon (i.e., the rostral end of the brain; see Lagutin et al., 2003; García-Calero et al., 2008).
The resulting neural axial dimension thus can be visualized equally in all three tagmata via three parallel longitudinal landmarks placed at different dorsoventral levels (Figure 14):
(1) The floor plate, directly induced by the underlying notochord throughout the brain, which ends rostrally under the mamillary pouch [the updated prosomeric model is the only brain model so far that highlights the significant morphologic meaning of this classic observation of His (1893), later corroborated by experimental AP patterning results, by consistently interpreting the mamillary body next to the notochordal tip as the rostralmost ventral part of the brain, rather than as a “caudal part of the hypothalamus,” as is conventionally assumed in columnar-based interpretations].
2) The roof plate, derived from the dorsomedian fusion of the longitudinal border ridges of the neural plate during neurulation. The rostral neuropore closes rostrally at the locus of the later appearing anterior commissure (Figure 14), as determined by consistent fate-mapping in amphibians, birds, and mammals (Jacobson, 1959; Eagleson, 1990, 1995; Puelles et al., 1987; Inoue et al., 2000; Cobos et al., 2001; Puelles, 2018).
3) The alar–basal boundary is traceable molecularly along the lateral walls of the neural tube already from neural plate stages onwards by maps of Nkx2.2, Ptch1, or Pax7 expression (Figure 12B; see review in Puelles, 2013). These transcription factors, leaving out alar Pax7, are activated downstream of high-SHH protein levels obtaining across floor and basal zones (only in the forebrain); Shh signal characterizes instead only the hindbrain and spinal floor plate and thus these downstream signals mark instead in these tagmata the floor-basal limit (this pattern change is one of the reasons why the midbrain is ascribed to the forebrain in the prosomeric model). At the hindbrain and spinal tagmata, the alar–basal border is marked for instance by the ventral limit of alar plate Pax7 expression (similar to PAX3 in Figure 16), which extends also along the midbrain and caudal diencephalon, thus allowing cross correlation with the forebrain-exclusive markers (review in Puelles, 2013; see also Puelles et al., 2019a). Interestingly, the pretectum and midbrain (p1, m1, m2) participate of both DV patterning mechanisms, thus connecting the two alar–basal molecular boundaries. The alar–basal border ends rostrally at the AT, between the alar optic chiasma + postoptic decussations and the basal tuberal region (more precisely, the dorsal tuberal or anterobasal area of Puelles et al., 2012a; Figures 15A, B).
Note that none of the limiting landmarks mentioned, and particularly the molecular alar–basal boundary, is an a-dimensional or conceptual line. They all represent thin bands of neuroepithelium, which may even produce specific neuronal derivatives that migrate radially or tangentially (at least in the case of Nkx2.2 at the forebrain alar–basal boundary; see Figure 12B and Puelles et al., 2012a). A full study of these boundary derivatives, mapping them in the adult brain, is still lacking (see some Nkx2.2 data in Puelles et al., 2012a and 2021).
In contrast to our molecular definitions of the axial dimension based on notochordal/roof antagonistic DV patterning (starting at neural plate stages), the morphologic classic sulcal definition of this limit by means of the sulcus limitans of His (likewise with other longitudinal sulci) underlines a tridimensional feature that appears much later in the closed neural tube (this sulcus emerges secondary to the massive early differentiation of basal plate neurons; compare Figure 1B; see Amat et al., 2022). Remarkably, His’s (1893) original interpretation of the course of this sulcus in several vertebrate species closely agrees with our subsequent reference to differential molecular specification, which obviously precedes and causes the precocious neurogenetic pattern of the basal plate (a minor discrepancy is that His thought the sulcus limitans ends rostrally at the preoptic recess, above the chiasma, while the molecular limit clearly ends under it, i.e., at the postoptic recess, thus coherently leaving the optic chiasma within the alar plate, as expected of a visual sensory system; the columnar model has the optic tract entering the forebrain across its ‘diencephalic floor and basal plate’ without a single comment in more than 100 years; discussion in Puelles, 2021).
1.4 Dorsoventral pattern
As a result of the complete anteroposterior longitudinal zonation of the neural tube into floor, basal, alar and roof sectors of its walls (a DV pattern), it follows that all transverse neural tube subdivisions (the tagmata, proneuromeres and neuromeres) share a common intrinsic (invariant) dorsoventral structural plan, which is not altered by the variable morphogenetic bending of the neural tube’s axial dimension (Figures 10, 17). This is also the basis of a general metamery (i.e., common fundamental structure) of all neuromeres, since they all share serially repeated aspects of their basic DV organization, irrespective of tagmatic, proneuromeric or neuromeric molecular differences and fate peculiarities.
1.5 Rostral end of the brain
The rostral end of the brain does not correspond to the rostral neuropore, as used to be assumed in earlier literature (e.g., von Kupffer, 1906). I have argued (see Figure 14; Puelles, 2018) that the rostral and caudal neuropores are transient (diminishing) openings in the prospectively fused roof plate. The rostral neuropore accordingly is topologically a rostro-dorsal roof structure, rather than a rostral pole of the neural tube. The true rostral end of the neural tube corresponds to the acroterminal wall of the hypothalamus (Aterm, Figures 4, 13B, 14), which ranges from the epichordal rostral end of the floor (at the mamillary pouch; Figures 12C, D) to the terminal end of the fused anterior neuropore (fate-mapped at the anterior commissure; Figures 12A, D, 13B). This acroterminal wall is already present molecularly (but is not salient histologically in contrast with the prospective floor) in the rostral neural plate (Figures 4, 14A; Puelles, 2018). It partly correlates topographically with the prechordal plate under it, lying topologically in front of the rostral tip of the notochord (Ferran et al., 2022; their Figure 2A). The acroterminal neural tube wall is a singular median locus where the rostral ends of the left and right basal and alar plates are continuous with each other from the start of their formation (Figure 19; no fusion occurs at this locus, though some literature mistakenly postulates it; see Puelles et al., 1987; Figures 14, 15A). In a flat map of the neural plate (as in Figures 14A and 19) both the prospective roof plate and the lateral neural wall (alar and basal plates) literally continue from right to left across the front of the brain, whereas the floor has a sharp rostral mamillary end positioned by the underlying tip of the notochord.
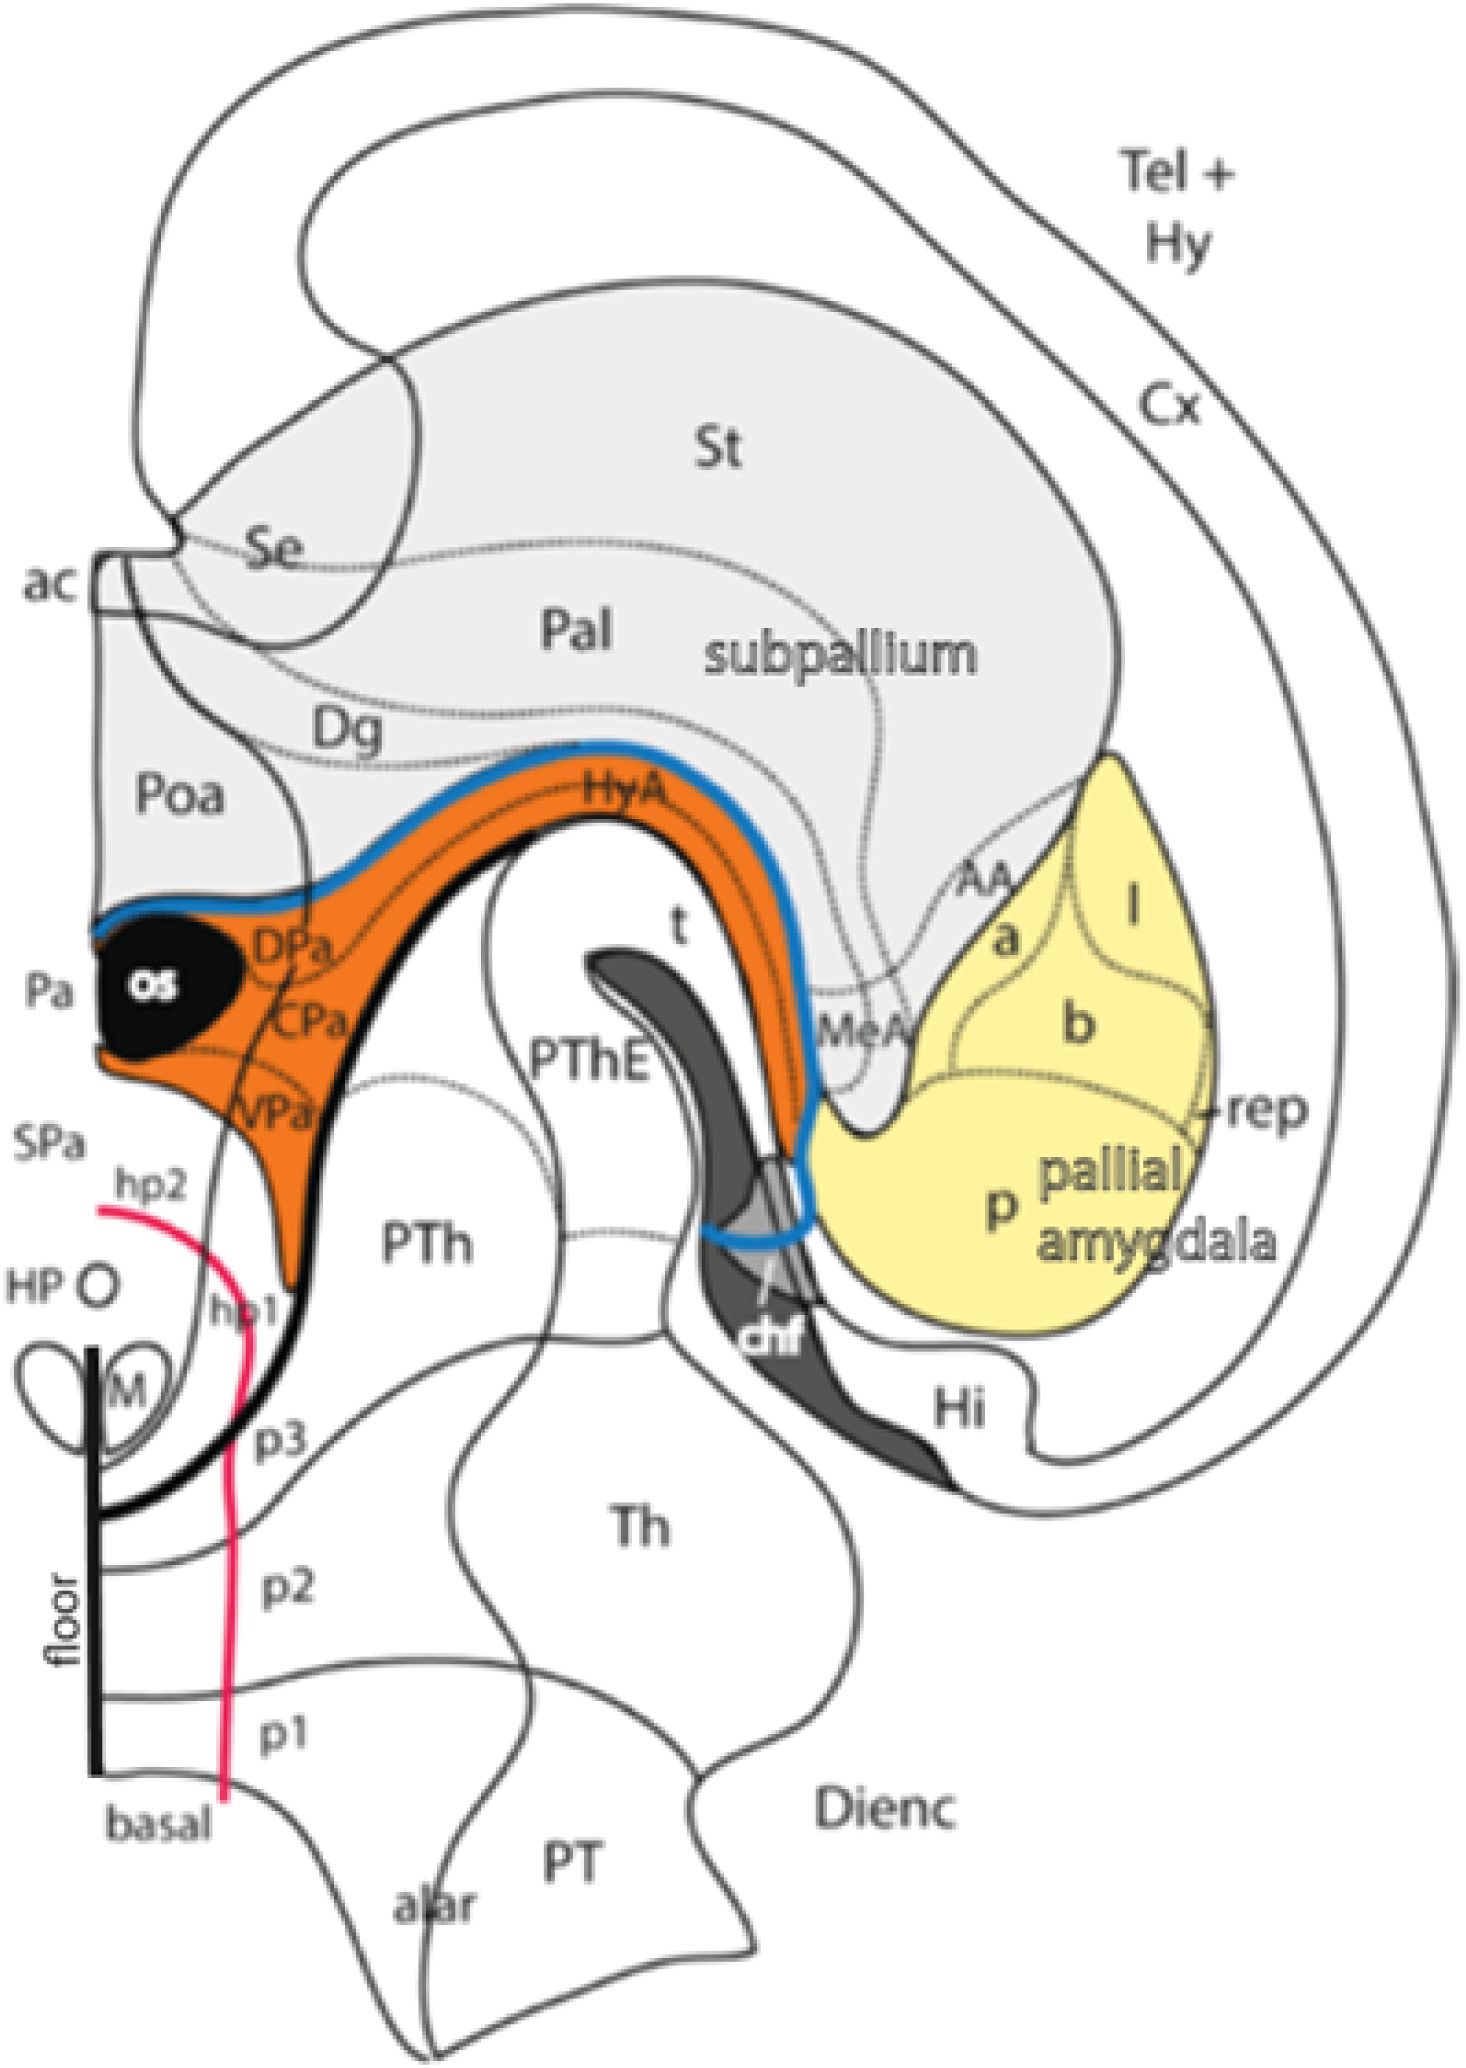
Figure 19. Diagram illustrating the complex relationships between diencephalic prethalamus (PTh, p3), paraventricular alar hypothalamus (DPa, CPa, VPa; highlighted in orange), telencephalic subpallium connected to the septum (light gray) and the pallial amygdala (yellow). The drawing presents a dorsal view after opening the roof of the brain with a horizontal section plane, so that we look from above into the diencephalic and hypothalamo-telencephalic parts of the forebrain ventricular surface including the interventricular foramen (the sectioned cortex -Cx- and diencephalon wall -PThE, PTh, Th, PT- remain white). The transverse hypothalamo-prethalamic boundary is drawn with a thick black line orthogonal to the red alar–basal boundary (which arches rostrally into the AT). The longitudinal hypothalamo-subpallial boundary appears as a thick blue line. We see also part of the medial wall of the evaginated hemisphere (in dark gray), displaying the end of the chorioidal fissure (chf; intermediate gray thin membrane bisected by the blue limit, note it connects caudally with the fimbria of the hippocampus -Hi). Note the prethalamic eminence (PThE) bends outwards at the caudal part of the interventricular foramen, extending into the medial wall of the hemisphere (its evaginated “telencephalic” part is labeled “t”), reaching likewise an attachment with the chorioidal fissure, in the neighborhood of the pallial amygdala (yellow domain). The paraventricular hypothalamic extension in contact with the blue subpallium limit line runs finally along the bottom of the terminal sulcus, forming the newly distinguished “hypothalamo-amygdalar corridor,” HyA (while the stria terminalis tract, not visible, runs subependymally along the diagonal—Dg—part of the subpallium, i.e., distant from the true eminential insertion of the chorioidal tela). Note the diverse light gray subpallial sectors—St, Pal, Dg, Poa—extending from the subpallial amygdala—AA, MeA—into the septum (Se). Original drawing extracted from García-Calero et al. (2021). Abbreviations: a, pallial amygdala, anterior radial domain; AA, anterior amygdala (subpallium); ac, anterior commissure; b, pallial amygdala, basal radial domain; chf, chorioidal fissure; CPa, central parencephalic subarea; Cx, cortex; Dg, diagonal subpallium; Dienc, diencephalon; DPa, dorsal parencephalic subarea; Hi, hippocampus (+ fimbria); HP, neurohypophysis; hp1, hp2, hypothalamo-telencephalic prosomeres 1, 2; Hy, hypothalamus; HyA, hypothalamo-amygdalar corridor, dorsal extension of Pa; l, pallial amygdala, lateral radial domain; M, mamillary body; MeA, medial amygdala (subpallium); os, optic stalk; p, pallial amygdala, posterior radial domain; p1–p3, diencephalic prosomeres 1–3; Pa, hypothalamic alar paraventricular area (across hp1, hp2); Pal, pallidal subpallium; Poa, preoptic subpallium; PT, pretectum; PTh, prethalamus; PThE, prethalamic eminence; rep, pallial amygdala, retroendopiriform radial domain; Se, alar septum; SPa, hypothalamic alar subparencephalic area; St, striatal subpallium; t, evaginated “telencephalic” rostrodorsal flap of PThE bent into the medial telencephalic wall; Tel, telencephalon; Th, thalamus; VPa, ventral parencephalic subarea.
The acroterminal area was long wrongly interpreted classically as the “floor” of the diencephalic hypothalamus (e.g., Swanson, 2012, 2018), but it cannot be a floor plate because it lacks the necessary notochordal inductor underneath, and its genoarchitecture shows it is dorsoventrally patterned (i.e., restricted basal expression of Shh—Figure 16—and alar expression of Zic family genes—not shown; see also Figure 15D). Due to its standard DV pattern (implying rostromedian floor versus roof antagonism), the acroterminal area thus differentiates into standard alar and basal portions (Figure 19).
As shown in Figure 15A, the acroterminal area (the rostral end of the h2 prosomere) divides at basal plate levels into median mamillary (MnM), tuberomamillary (TM), neurohypophysial (NH), median eminence, and dorsal tuberal (medial anterobasal nucleus; ABasM) tuberal areas (check Figures 15C, D). On the other hand, at alar acroterminal levels, we have first the median optic chiasma with the postoptic decussations, next the paramedian acroterminal parts of the alar subparaventricular hypothalamus [including the suprachiasmatic nucleus (SCH) and the paraventricular supraoptic nucleus (untagged; contoured by the black limit line curving above the optic nerve root)], and then the medial preoptic area with the lamina terminalis, which ends at the anterior commissure (rostralmost roof) (Figures 15A, C, D).
The name “acroterminal domain” (AT; the Greek prefix “acro” means “foremost”) for this topologically singular median region was suggested by Puelles et al. (2012a; recently I discovered a previously unnoticed precedent, the term “acrencephalic region” referring to the forebrain area induced by the prechordal plate, used by the Belgian embryologist Dalcq, 1947, as cited by Waddington, 1952). Though this domain is median, it is bilaterally symmetric widthwise (left–right symmetry; Figure 15A), and it is patterned molecularly consistently with a dorsoventral alar/basal partition (Figure 12B), thus sharing a general molecular dorsoventral pattern with the transverse and bilateral lateral wall of the forebrain prosomeres (Figure 19; see Puelles and Rubenstein, 2015; Puelles, 2017, 2018). Accordingly, it cannot be interpreted as a longitudinal floor region, as was done within the columnar model (e.g., Swanson, 2004, 2012, 2018). The gene Dlk1 remarkably delineates precisely the full AT extent at early embryonic stages (Figure 13B; see Allen Developing Mouse Brain Atlas for E11.5, E13.5, and E15.5; developingmouse.brain-map.org).
This novel prosomeric concept of the rostral end of the brain (which returns now with molecular evidence to the old one of His, 1893, 1904) obviously excludes the conventional interpretation of the telencephalon as lying rostral to the rest of the forebrain (a basic but essentially unfounded columnar model tenet), since the secondarily evaginated hemisphere strictly represents a dorsal non-acroterminal outgrowth of the h1 hypothalamic alar plate, caudally to the h2 prosomere and its AT, and expanding dorsolaterally at both sides of the axial roof plate (Figures 14D, E, 19). The preoptic area, the eye vesicles, and dorsal alar parts of hypothalamus accordingly lie topologically rostral to the evaginated hemisphere (Poa, os, Pa in Figure 19), since they bulge early on out of the alar acroterminal hypothalamic domain, a “rostralmost” position (Figures 15A, D). In fact, there is an early joint primordium of both eyes at neural plate stages, the median eye field, which bridges the acroterminal midline (the cephalochordate Amphioxus lacking evaginated eyes still shows a median eye spot at the same acroterminal locus; Ferran et al., 2022; their Figure 2B). Median prechordal plate signals are apparently involved in repressing the formation of median optic or telencephalic structures (though these do appear as malformations in cases of cyclopy or holoprosencephaly, in which prechordal signaling functions are handicapped or absent).
1.6 Hypothalamic and telencephalic parts
The rostral hypothalamic h2 prosomere produces the terminal hypothalamus (THy) plus the singular AT that closes rostrally the neural tube (this is why this hypothalamic portion was called “terminal”; Puelles et al., 2012a). The THy extends dorsally into the molecularly telencephalic (but non-evaginated) preoptic area (POA, Poa; Figures 11A, 15D, 19). Alar THy includes under the preoptic area the thin terminal paraventricular hypothalamic area (TPa) ending rostrally at the optic stalk and the molecularly distinct alar subparaventricular neighborhood (SPa or TSPa), associated to the optic chiasma (Figures 15B–D, 19). The TSPa is also approximately alevel with the postoptic decussations and the initial course of the optic tract (the TSPa encompasses in addition the suprachiasmatic and anterior hypothalamic nuclei, at least the former being acroterminal by its rostral position (Figures 15A, D) and selective Six3 expression: see Figure 2C in Puelles, 2022). The basal THy includes, ventrally to the alar–basal boundary marked by thin bands of Ptch1 and Nkx2.2 signal, the tuberoinfundibular region (Tu) and the subjacent perimamillary (PM) and mamillary (M) regions (see Figure 15D); the median acroterminal part of Tu is represented by the median eminence with the arcuate nucleus and the neurohypophysis, a stalked rostromedian outgrowth (Figures 15A, D). Both Tu and M are dorsoventrally subdivided regions (Figures 15C, D; see Puelles et al., 2012a for details on individual hypothalamic nuclei). The THy basal plate is by far the dorsoventrally most extensive basal domain in the entire brain, a possible growth effect of the locally contacting prechordal plate.
The transverse interprosomeric limit between h1 and h2 (Figures 15C, D, 20) was designated the intrahypothalamic boundary (Puelles et al., 2012a). It is paralleled on the h1 side by the dorsoventral hypothalamic course of the fornix tract, all the way from the back of the anterior commissure in the roof to its final retromamillary floor decussation (fornix; Figure 20); shortly before reaching its h1 ventral end, the tract releases the collaterals that penetrate the mamillary body within h2 (Puelles et al., 2012b; Puelles and Rubenstein, 2015).
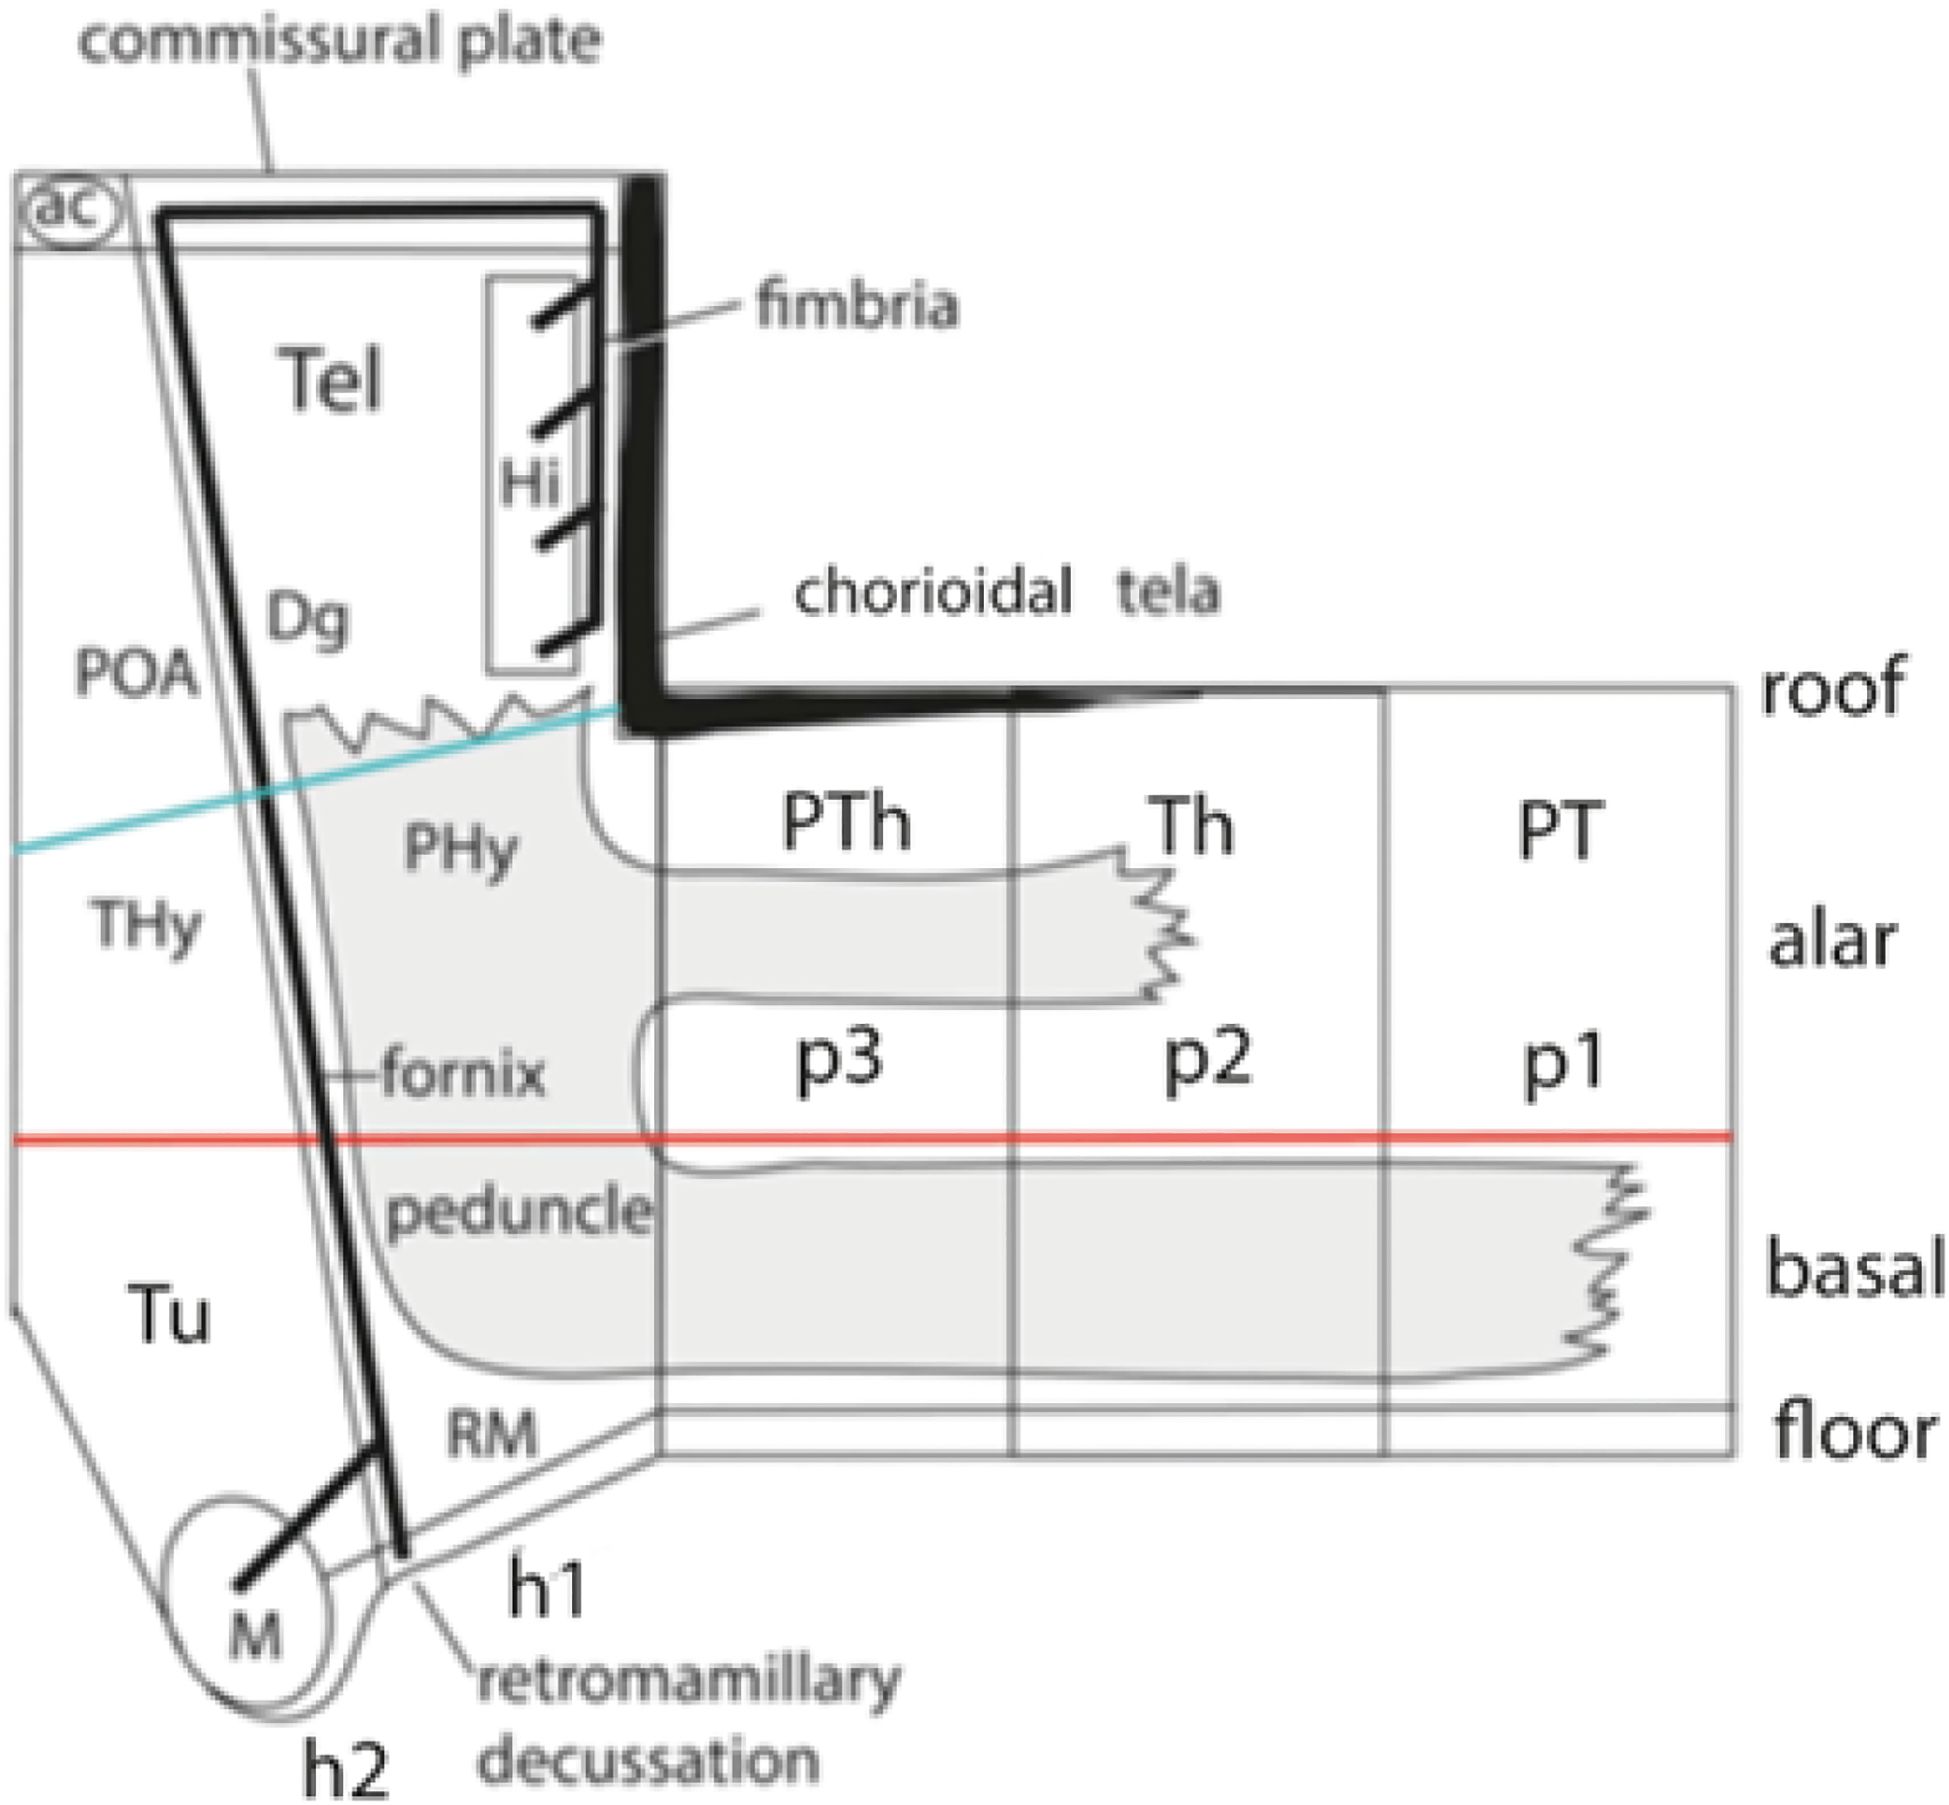
Figure 20. Schema of hypothalamic and diencephalic neuromeres (rostral to the left; dorsal up), illustrating the dorsoventral transverse course of the fornix tract originated from the hippocampus (Hi), which courses parallel and just behind the caudal aspect of the intrahypothalamic boundary that separates the hypothalamo-telencephalic prosomeres h1 and h2 (or the PHy from THy hypothalamic moieties; from Puelles and Rubenstein, 2015). The unlabeled forebrain floor plate at the bottom ends rostrally at the mamillary body (M). Blue line: tel-hypothalamic boundary. Red line: general longitudinal alar–basal boundary. See also the course of the fornix fibers inside the telencephalon, showing parallelism with roof plate formations (chorioidal tela and septal commissural plate, as long as they course strictly within one neuromere -h1-, before reorienting over 90° across a decision point after they contact the intrahypothalamic boundary with h2, just behind the anterior commissure). Note the cerebral peduncle (the sum of the medial and lateral forebrain bundles) adopts a dorsoventral course (parallel to that of the fornix tract) relative to the equally transverse hypothalamo-diencephalic boundary of h1, before it bends in the basal plate into its longitudinal caudally oriented tegmental course (the peduncle also communicates with the alar diencephalon via the orthogonal bidirectional thalamo-telencephalic connections). These are all clear examples of the remarkable multiple correlation of axonal guidance with prosomeric boundaries (but devoid of an explanation within the alternative columnar model). Abbreviations: ac, anterior commissure; Dg, diagonal subpallium; Hi, hippocampus; h1, h2, hypothalamo-telencephalic prosomeres 1–2; M, mamillary body; p1–p3, diencephalic prosomeres 1–3; PHy, peduncular hypothalamus; POA, preoptic subpallium; PT, pretectum; PTh, prethalamus; RM, retromamillary area; Tel, telencephalon; Th, thalamus; Thy, terminal hypothalamus; Tu, tuberal region.
The caudal hypothalamic h1 prosomere gives rise to the peduncular hypothalamus (PHy; Figures 11A, B, 15B, D), plus the whole dorsally evaginated telencephalic vesicle (Figures 11A, B, 19). This hypothalamic territory was named “peduncular” by Puelles et al. (2012a), because it contains next to its caudal boundary with the diencephalon the dorsoventral hypothalamic course of the cerebral peduncle, before the latter turns 90° into its ulterior longitudinal course along the tegmental basal plate of the diencephalon, midbrain, and hindbrain (Figure 20; visualize this terrain in Figure 19).
1.7 Diencephalon and midbrain parts
Caudally to the hypothalamus there appears the diencephalic proneuromere, which subdivides into prethalamic (p3), thalamic (p2), and pretectal (p1) diencephalic prosomeres (note the numbering is caudorostral, as applied to the hypothalamus, but not as in the midbrain). The hypothalamo-diencephalic or hypothalamo-prethalamic boundary lies behind the transversal sector of the peduncle (Figure 20) and separates Otp/Sim1-positive hypothalamic alar and basal derivatives from diencephalic alar Otx2-positive domains (Figure 7C) or Dlx- or Tbr1-positive prethalamic areas (not shown; see the Allen Developing Mouse Brain Atlas; Puelles et al., 2021). Note this boundary reaches dorsally the bottom of the interventricular foramen and thereafter penetrates the caudal telencephalon along the sulcus terminalis at the floor of the lateral ventricle, ending at the chorioidal fissure (this implies that a dorsorostral part of the prethalamus known modernly as “prethalamic eminence” (less precisely named previously “thalamic eminence”; PThE in Figures 7A–C, 19) evaginates together with the hp1 telencephalic vesicle, forming a small part of its adult caudomedial wall rostral to the chorioidal fissure, caudal to the interventricular foramen, and medial to the sulcus terminalis (Figure 7; “t” in Figure 19). This prethalamic ventricular surface accordingly limits the caudal part of the interventricular foramen, and protrudes there markedly, forming the so-called prethalamic eminence [PThE; Figures 7A–C and 19; this landmark was classically misidentified as “thalamic eminence,” due to absence of a clear concept of “prethalamus” (see Puelles and Rubenstein, 2003)]; nevertheless, the prethalamus is clearly separated from the thalamus by a transverse ventricular ridge, the zona limitans intrathalamica, or zli, first described by Rendahl, 1924 and since well corroborated molecularly in all vertebrates; see zli in Figures 3A, 4, 7, 12b, 16).
The caudal boundary of the diencephalon passes behind the posterior commissure in the roof and is marked molecularly in all vertebrates examined by the end of diencephalic expression of Pax6 (apart other gene markers; pc; Figures 7C, 8A; see Ferran et al., 2008, 2009). This contradicts the classic columnar thesis holding that the pretectum is divided between diencephalon and midbrain (a way not to admit it forms a distinct neuromere). The molecularly delimited p1 pretectal region is exclusively diencephalic (see Ferran et al., 2008, where chick and mouse are compared). In fact, there is experimentally demonstrated antagonism between diencephalic and midbrain AP patterning mechanisms which does not allow a pretectal molecular phenotype developing within the alar midbrain (though the midbrain basal plate does contain some Pax6-positive cells, perhaps migrated). The prosomeric pretectum (p1) lying caudal to the thalamus (p2) accordingly limits caudally with the midbrain m1 unit along a transverse plane passing dorsally caudal to the pretectal posterior commissure (Figure 8A, 9, 11A,B, 13A) and ventrally just rostral to the dorsal and ventral midbrain decussations (Figure 13A) and the root of the oculomotor nerve (3n in Figure 21; this boundary plane also separates in the tegmentum the pretectal parvicellular and midbrain magnocellular parts of the nucleus ruber).
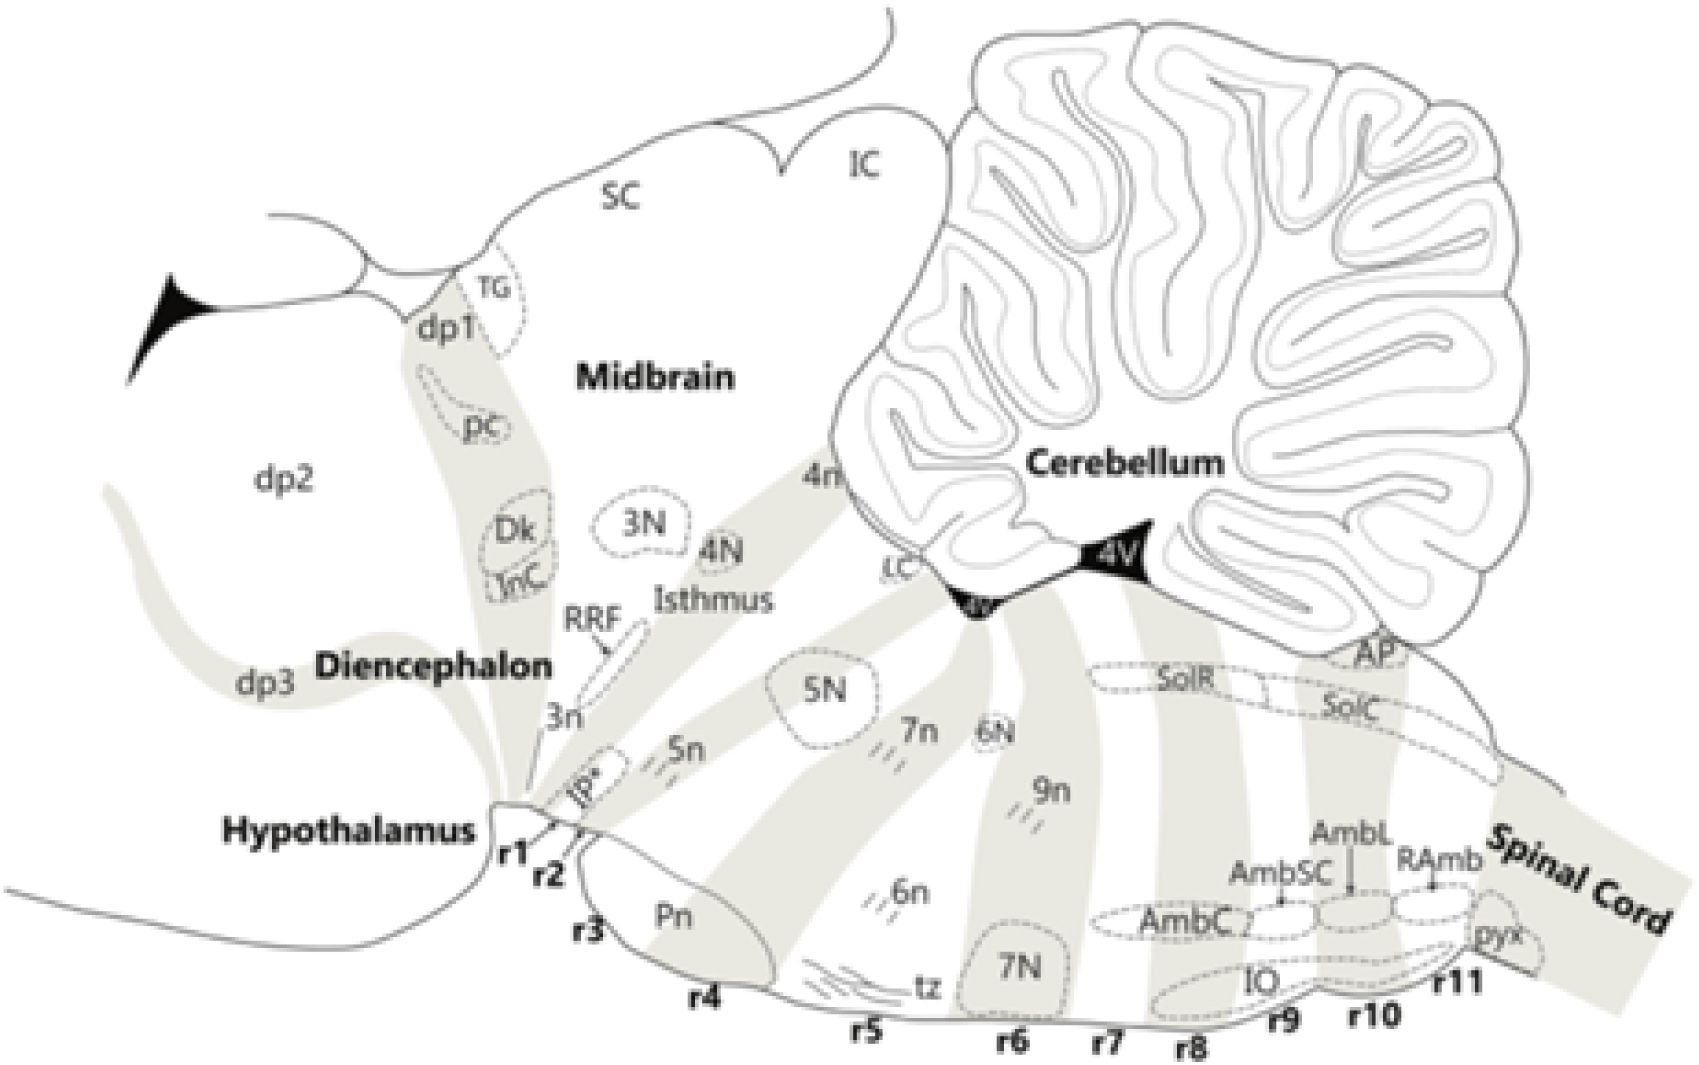
Figure 21. Schematic neuromeric map of the rodent hindbrain reproduced from Watson et al. (2019), with rhombomeric localization of some characteristic motor nuclei (3N, 4N, 5N, 6N, 7N, Amb subdivisions), sensory nuclei (SolR, SolC, AP), migrated masses (IP, Pn, IO), landmark tracts (tz, pyx), and nerve roots (5n, 6n, 7n, 9n). 3n, oculomotor nerve root; 3N, oculomotor nucleus; 4n, trochlear nerve root (crossed); 4N, trochlear nucleus; 5N, trigeminal motor nucleus (r2,r3); 5n, trigeminal nerve root; 6n, abducens nerve root; 6N, abducens nucleus; 7n, facial nerve root; 7N, facial nucleus; 8n, glossopharyngeal nerve root; AmbC, ambiguous nucleus, compact part; AmbL, ambiguous nucleus, loose part; AmbSC, ambiguous nucleus, semicompact part; AP, area postrema; Dk, nucleus of Darkschewitsch; dp1–dp3, diencephalic prosomeres 1–3; IC, inferior colliculus; Inc, interstitial nucleus of Cajal; IO, inferior olive; IP, interpeduncular complex (r0–r1); LC, locus coeruleus; pc, posterior commissure; Pn, basilar pontine nuclei (r3, r4); pyx; decussation of the pyramidal tract; r1–r11, rhombomeres 1–11; RAmb, retroambiguus nucleus; RRF, retrorubral formation; SC, superior colliculus; SolC, solitary column, caudal part (viscerosensory); SolR, solitary column, rostral part (gustatory nucleus); TG, tectal gray; tz, trapezoid decussation.
The midbrain shows a large rostral midbrain prosomere, the m1 “mesomere,” that forms the whole collicular tectal plate (both superior and inferior colliculi plus the rostral tectal gray; see TG in Figures 9, 13A, 21) and encompasses basally the oculomotor nucleus complex and the magnocellular red nucleus. It is followed caudally by a short preisthmic mesomere m2, which lacks motoneuronal derivatives (m2; Figures 8B, 9, 11A, B, 13A). The latter is still largely unknown, being disregarded systematically in neuroanatomic works, though it was first postulated more than 100 years ago in several vertebrates (von Kupffer, 1906; Palmgren, 1921), was corroborated by Vaage (1969, 1973) in the chick, and was finally identified molecularly in the chick and mouse (Hidalgo-Sánchez et al., 2005; Puelles and Hidalgo-Sánchez, 2023).
Note the dopaminergic and GABAergic neuronal populations constituting the substantia nigra compacta and reticulata, plus the ventral tegmental area, form a plurineuromeric complex extending through the whole diencephalon (p1–p3), the whole midbrain (m1, m2) and the adjoining hindbrain isthmus domain (r0), as is now generally accepted by students of its molecular development, though much classic literature wrongly ascribes it only to the midbrain (review in Puelles, 2016, 2019a).
1.8 Hindbrain parts
The prepontine hindbrain proneuromere was misidentified in classical neuroanatomy (and also in the columnar model) as a caudal part of the midbrain (review in Puelles, 2016, 2019a, that is, the midbrain was wrongly thought to limit directly with the pons; this assumption rather than thesis—nobody ever defended it with any argument—resulted sharply corrected with the discovery of the role as secondary organiser of the isthmo-mesencephalic or isthmic boundary zone, later supported by observation of the systematic embryonic, postnatal and adult caudal border of Otx2 expression at this locus; Figure 7; see reviews in Hidalgo-Sánchez et al., 2022 and Puelles and Hidalgo-Sánchez, 2023). The prepontine proneuromere represents a rostral isthmo-cerebellar hindbrain region comprising rhombomeres 0 and 1 (r0–r1; Figures 5A,B, 8B, 9, 10, 11B, 17, 18A,B, 21), which lie rostral to the pontine proneuromere (r2–r4; see below) and caudal to the midbrain preisthmus (m2). The isthmus was initially regarded as a separate neuromere by His (1893, 1895, 1904) but was thereafter long interpreted as a rostral part of r1 in neuromeric studies (or a part of the midbrain in columnar studies), due to its cryptic delimitation (r0; Figures 8C, D). Recently its cryptic neuromeric character was demonstrated by transgenic analysis of its progeny, based on its selective early expression of Fgf8, the gene that codes for FGF8, its secreted morphogen as a secondary organizer (Aroca and Puelles, 2005; Watson et al., 2017; Figure 5B). The isthmus contains the trochlear motor nucleus, misidentified as “mesencephalic” practically in all classic literature (4 in Figure 5A; 4N in Figure 21).
The isthmus is numbered as r0 because historically it used to be included within r1; once it was distinguished as a separate and molecularly distinct unit, numbering it as “r1” would have forced changing the numbering of all other 11 rhombomeres; it thus became “r0” to evade that undesired consequence (and r1 just became smaller). Importantly, neither r0 or r1 express Hox genes, which are characteristic of the remaining rhombomeres and all myelomeres (see Marín et al., 2008; Tomás-Roca et al., 2016). The isthmocerebellum (r0 + r1) develops under differential control of the isthmic organiser and its bipolar gradientally decreasing FGF8 morphogen signal, which patterns anteroposteriorly both the midbrain and the prepontine or isthmocerebellar hindbrain region (Figures 1A, 4–13A, 5A, C, D, 14, 8A, B).
As mentioned above, the cerebellum develops as a dorsal outgrowth of both caudodorsal alar r0 (grown disproportionately to form the cerebellar median vermis) and the whole r1 (forming the cerebellar hemisphere and floccular lobule). Note all peduncles of the cerebellum thus enter or exit it essentially through r0 (superior peduncle) or r1 (middle and inferior peduncles). The arcuate course of the superior cerebellar peduncle fibers (so-called brachium conjunctivum) and their median floor decussation (dbc) occurs largely within the caudal part of r0 (dbc: Figures 13A and 8B). This places the hodologic stalk of the cerebellum in the prepontine hindbrain (also a modern idea, since before it was thought generally that the cerebellar stalk relates to the pons). However, now we know that the pontine basilar nuclei lie more caudally in r3–r4 (Figures 21, 18A), and the roof of the pontine neuromeres r2–r4 is strictly chorioidal (Figures 5E, F).
The prepontine proneuromere contains medioventrally the similarly bineuromeric interpeduncular nuclear complex (correlative with the last (rhombencephalic) part of the interpeduncular fossa, caudally to the oculomotor nerve roots. This important though still functionally badly understood complex also used to be ascribed to the midbrain but results from singular convergence of diverse hindbrain neuronal basal and alar migratory streams into a superficial median and paramedian locus across r0 and r1r, r1c (Figure 18A; see Lorente-Cánovas et al., 2012). Other typical prepontine migratory formations are the so-called “mesencephalic trigeminal nucleus” (mes5) and the locus coeruleus (LCoe), both best developed at r1 levels and sharply ending at the r1/r2 boundary, also extending less importantly into r0. The mes5 population originates strictly in the midbrain (both m1 and m2, apparently) but displays in the mouse (probably in all mammals) a partial caudalward migration into r0 and r1 (Figures 5A, B), so that the adult brain shows characteristic grape-shaped mes5 neurons spread longitudinally over the caudal midbrain and the prepontine r0 and r1 domains (both wrongly supposed to be “midbrain” in classic neuroanatomy). The “mesencephalic” descriptor of mes5 is thus strictly true as regards the origin of this population, but erroneous as regards part of its adult topography (r0, r1). A caudalward mes5 migration does not occur in the chick, nor apparently in other non-mammalian tetrapods [unpublished personal observations; however, the chick shows a migration of melanocytes (of possibly similar midbrain neural crest origin) into the isthmus; Puelles and Gil, 1978]. The locus coeruleus noradrenergic cell population is also peculiar in that it originates in the overlying r0–r1 subcerebellar alar plate, and its cells subsequently translocate into the neighboring lateral prepontine basal plate (Aroca et al., 2006), coming to be placed periventricularly medially to the mes5 population.
Note the so-called “subcoeruleus” population of noradrenergic neurons actually lies caudal to locus coeruleus (in pontine levels r2, r3) rather than “under” the LCoe in r1. A classic problem with the prepontine region is that most cartographers have interpreted cross sections through these levels as if they were transversal, when actually they represent oblique sections rather approximating horizontal sections (e.g., Figure 8B, shown at the Allen Developing Mouse Brain Atlas as a “coronal” section, being in fact a perfect horizontal section; compare sagittal Figure 8A). Thus, relatively caudal structures (such as the pons or the subcoeruleus cells) are conventionally misinterpreted as “ventral structures under” the cerebellum (or, worse, “under” the midbrain, a logical impossibility). The true nearly horizontal disposition of this region results because it belongs to the sector of the brain axis lying behind the cephalic flexure, as is best observed in sagittal sections (Figure 8; see also spatial orientation of transverse boundaries in Figure 13A and Alonso et al., 2012; their Figure 3).
The second, pontine hindbrain proneuromere divides into the rhombomeres r2–r4, which contain within the basal domain of r3 and r4 the migrated and superficially bulging basilar pontine nuclei (Figures 21, 18A; these nuclei derive and migrate tangentially into the basilar pons from the rhombic lip of r6–r8). The r2 territory lacks basilar nuclei but also participates in the pontine bulge because it contains a large part of the crossed middle cerebellar peduncle as it ascends obliquely through r2 and r1 into the cerebellum (this path surrounds the trigeminal nerve root, which largely exits/enters via the r2 alar plate; Figure 18A). The r2 rhombomere is indeed characterized in all vertebrates by the large root of the mixed trigeminal nerve, whose fibers enter or sort out from the r2 alar plate rostral to the basilar pons proper, passing through the ponto-cerebellar or middle cerebellar peduncle (note the root forms earlier than the cerebellar peduncles; Figures 5A, B).
The modular trigeminal motor and principal sensory nuclei lie within r2 and r3 (Figure 21; note the branchiomotor trigeminal motor nucleus neurons originate in the basal plate but migrate early on along their previously formed axons into the alar plate of these two rhombomeres; Ju et al., 2004; Puelles et al., 2019b; Figures 5A, B).
The r4 rhombomere similarly originates basally the branchiomotor facial motor nucleus, whose motoneurons, after sending off their axons through the r4 root alar exit locus, secondarily translocate their cell bodies away from their axons via basal r5 and r6 into the alar plate of r6 (Figures 5A, B, E, F, 21). This singular migration, which only starts after peripheral innervation has occurred (a relatively unknown rule for motoneuron migrations pronounced by Ramón y Cajal, 1909), forms the so-called “facial knee” around the abducens nucleus in basal r5 with the passively elongated axons (Figures 5E, F; see also migr 7 in Figure 5A).
The r4 rhombomere accordingly displays at its alar plate (the caudal portion of which is not covered by the ponto-cerebellar peduncle ascending obliquely into r1; Figure 18A) the mixed root of the facial nerve, accompanied dorsally by the joined roots of the sensory vestibulocochlear nerve (see Martínez-de-la-Torre et al., 2018). The pontine alar plate contains trigeminal, vestibular, and cochlear sensory modules, but no part of the cerebellum. The roof of the whole pontine proneuromere is chorioidal Figures 5E, F (rostrally to the roof of r2 the rhombic chorioidal tela inserts into the cerebellar rhombic lip which courses lateromedially from the topologically caudal flocculus (r1) along the rhombic lip of the cerebellar hemisphere into the rostromedian vermal nodule (r0) (Figure 18B).
The retropontine hindbrain proneuromere is composed of the r5 and r6 rhombomeres, which lie topologically caudal to the pons (r2–r4) and rostral to the medulla (r7-r11), the latter being marked by its ventrolateral inferior olives (Figures 5E, F, 6, and 21). This proneuromere also has a purely chorioidal roof continuing the pontine counterpart. The r5 region contains the abducens motor nucleus and its ventral nerve root, which crosses the auditory trapezoid body decussation leading from the cochlear nuclei and the superior olivary nuclei into the ascending contralateral lateral lemniscus (tz; Figures 21 and 9). The superior olivary complex aggregates within r5 (SOl; Figure 6). The r5 alar region includes segmental modules of the trigeminal and cochleovestibular sensory columns.
The r6 rhombomere displays superficially within its ventral alar plate the migrated facial motor nucleus (it remains unlabeled within a blue field in a transgenic mouse whose Pax7-expressing alar progeny was labeled blue; Puelles et al., 2019b); more dorsally, the root of the mixed glossopharyngeal nerve emerges (Figure 21). Note the cochlear nuclear column extends along the pontine and retropontine regions (r2–r6), while the cochlear and vestibular nerve roots enter strictly through alar r4, generating therefore ascending and descending branches within the respective sensory columns. The efferents of the modular cochlear column into the lateral lemniscus somehow converge into r5 (navigational aspect not yet described in detail) and then cross the midline jointly with superior olivary efferents via the trapezoid body in r5. There is an interstitial basal trapezoid nucleus before the crossing.
The medullary hindbrain proneuromere or medulla oblongata is the caudalmost hindbrain sector, limiting caudally with the spinal cord. It contains the r7–r11 rhombomeres, wherein the inferior olive only occupies the r8–r11 subregion (Figure 21; Tomás-Roca et al., 2016). In r7 there begins the alar gustatory nucleus (included in SolR in Figure 21), which receives input from the facial, glossopharyngeal, and vagus nerves, which respectively enter via r4, r6, and r7–r11, and jointly form the solitary tract. The r7–r11 units relate to the multiple segmental roots of the vagus, medullary accessory, and hypoglossal nerves, and contain the respective motor or sensory nuclei (plus the somatosensory dorsal column nuclei receiving direct input from the spinal ganglia via the spinal dorsal column). The subpially migrated inferior olives (originated at the ipsilateral r8–r11 rhombic lip) are characteristic medullary formations, jointly with the similarly originated and migrated lateral reticular (LRt), linear reticular (LnRt) and external cuneate nuclei (Ecu; all originated at the rhombic lip). They represent cerebellopetal populations (their axons course into the cerebellum before their migration, via the inferior cerebellar peduncle). These diverse rhombic lip populations then migrate subpially ventralwards and cross or not (case of the inferior olive) the floor plate into final contralateral ventrolateral (LnRt, LRt) or dorsolateral (ECu) positions (see Watson, 2012; Watson et al., 2019). The rostral pole of the inferior olive reportedly lies within r8 (it extends thus over r8–r11), so that r7 is devoid of this component (Figure 21).
In addition to the well-known derivatives mentioned above within the hindbrain, there are the sensory columns (trigeminal somatosensory column, solitary viscerosensory column, vestibular column, and cochlear column), which are distributed dorsoventrally (and stratified also from the pial surface into the depth of the alar plate) across multiple rhombomeres, where each of these columns has a molecularly distinct module (Tomás-Roca et al., 2016). Modern studies have suggested that none of these columns exist in the prepontine domain (where alar isthmic, lateral lemniscal, paralemniscal, and parabrachial nuclei predominate instead, jointly with various characteristic basal [tegmental] nuclei). The vestibular, cochlear, and trigeminal columns all start rostrally at the pontine r2 (note in our early publications, e.g., Marín and Puelles, 1995, we wrongly included r1 parts). The cochlear column ends in r6 (r2–r6), while the caudal end of the vestibular column has not been precisely assessed yet (possibly r9 or r10; see Tomás-Roca et al., 2016). The vestibular column is massive and occupies periventricular, intermediate and superficial mantle domains, and lies medial (but topologically ventral) to the cochlear nuclei, and dorsal to the trigeminal column. Its rostralmost r2 modular vestibular components (superior nucleus and part of medial vestibular nuclei) lie close “under” the cerebellar nuclei in r1 (that is, caudal to them, vide supra). This column apparently ends at r8 (Tomás-Roca et al., 2016). The superficial trigeminal column displays its main sensory nucleus and the ascending sensory tract in r2–r3, and the descending column through r4–r11 (García-Guillén et al., 2021). The descending trigeminal sensory tract is placed superficially in a relatively ventral part of the alar plate, next to the migrated branchiomotor facial and ambiguous nuclei (see García-Guillén et al., 2021); this descending root courses through all rhombomeres below r2 and also provides input to the marginal stratum of the cervical dorsal horn down to myelomere 6 level (the trigeminal column also receives ascending spinal afferents, as well as some facial, glossopharyngeal, and vagal afferents). Finally, the viscerosensory column of the solitary tract includes at its rostral end the gustatory nucleus starting in r7 but with unknown caudal end. The solitary column ends at r11 level, where it deviates dorsalward into the paramedian roof area caudal to the area postrema, forming its “commissural” dorsomedian portion, associated to the commissura infima of the solitary tract. The position of the solitary column is largely periventricular, strictly deep to the trigeminal column, except at its aberrant caudal end. It would seem that the somatosensory and viscerosensory columns are mapped by nature as a single ventral alar radial domain divided into contiguous superficial versus deep subdomains (respectively), ventrally to the vestibular column.
1.9 Spinal cord parts
The structure of spinal myelomeres is relatively repetitive, though its main components (the ventral and dorsal horns of the gray matter) are particularly developed quantitatively at superior and inferior trematic levels (limb-related thickenings; Watson and Sidhu, 2009). The ventral horn is the basal plate derivative, while the lateral horns (where they exist, mainly at cervical levels) and the dorsal horns are alar-derived. The dorsomedial column of Clarke receiving muscular proprioceptive input (analogously as the ECu medullary nucleus) extends mainly through the intertrematic (thoracic) myelomeres. These levels are also the sites where the most abundant preganglionic sympathetic efferent neurons develop. They originate in the basal plate and subsequently translocate tangentially into the ventral alar plate.
2 Coordinates and section planes
The different mantle derivatives of the brain and their boundaries or subdivisions can be best described and mapped morphologically by reference to a set of natural non-Cartesian (or non-Euclidean) coordinates, represented by systems of curved reference lines or planes. This point has been treated particularly by Nieuwenhuys (2017; see also Nieuwenhuys and Puelles, 2016). This author distinguishes three sorts of such curved (morphogenetically deformed) references (Figures 22A–C): (1) curved radial reference lines course across the mantle parallel to more or less deformed radial glial processes and radially penetrating blood vessels; they connect the ventricular surface with the pial surface (Figure 22B) curved stratigraphic planes delimit strata or layers parallel to the ventricular and pial surfaces (note these planes can be flattened graphically, producing so-called flat maps); (3) transverse interneuromeric planes lie orthogonal to the local incurvation of the bent axis (Figure 22C).
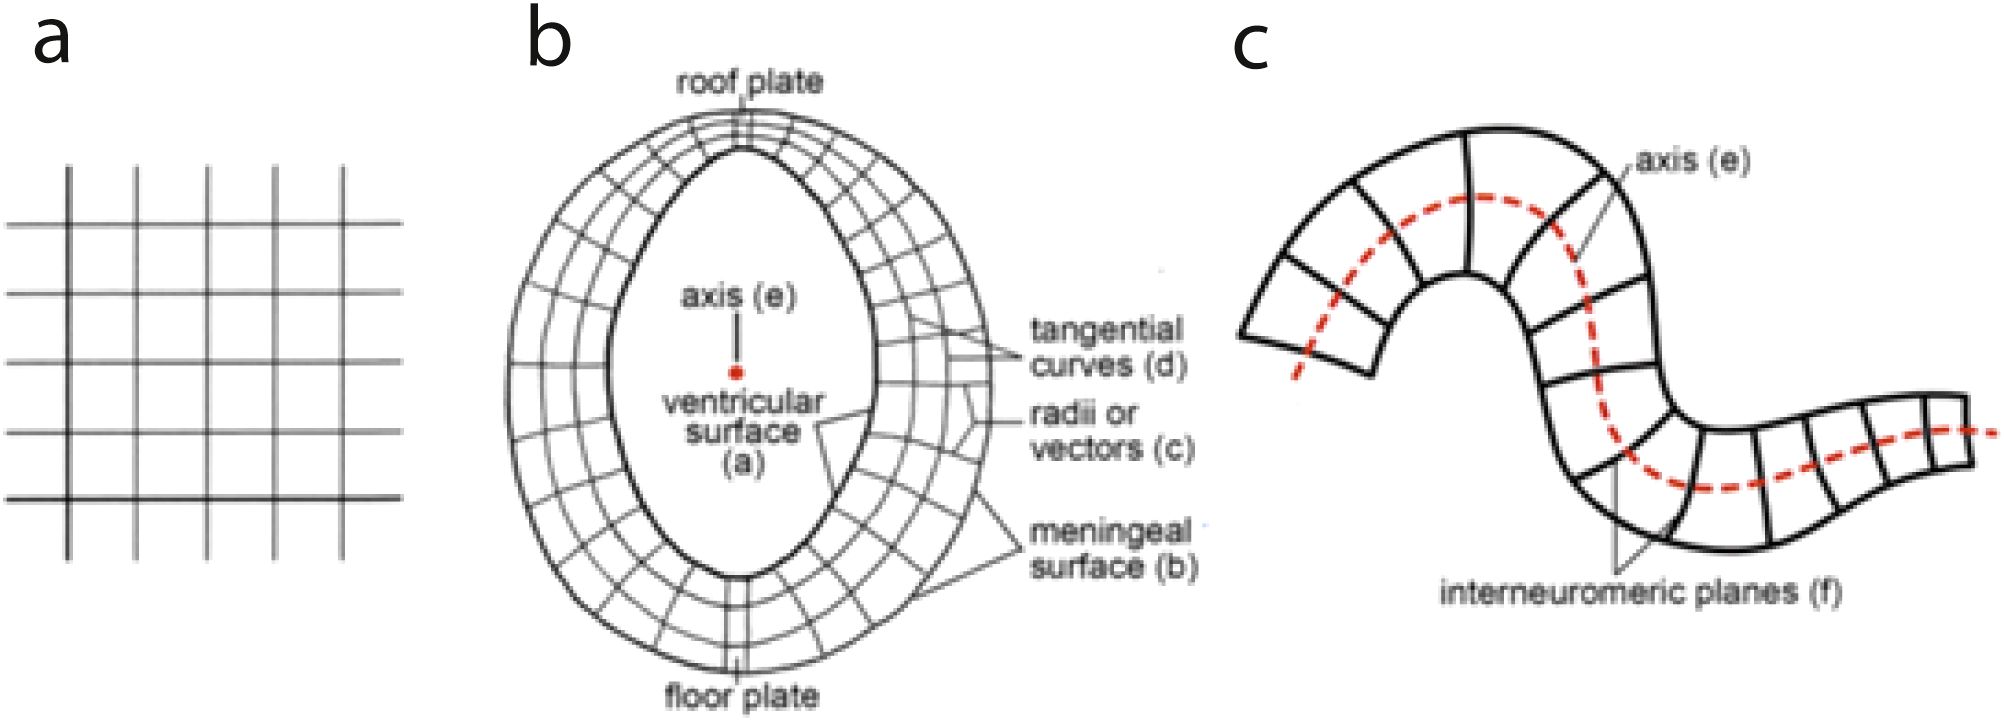
Figure 22. Diagrams illustrating Cartesian coordinates (A), non-Cartesian curved coordinates with concentric tangential curves parallel to the ventricular and pial surfaces and topologically orthogonal radii or vectors (B), and an example of topologically transversal interneuromeric boundaries (black cross-sections) relative to a bent axis (red dash-line; (C) (from Nieuwenhuys and Puelles, 2016).
The transverse boundaries can be best observed in sagittal or ad hoc horizontal sections, that is, designed for each separate sector of the axis according to its curvature (as in Figure 8C). Due to axial bending, a species-variable and developmental-stage-variable brain feature of which we must be always conscious, the neuromeric boundaries tend to be unclear in coronal sections, since the axial inflexions of the neural tube impose confusing sectioning obliquities (cervical, pontine, and cephalic flexures in the normal case; Figure 22C). This is frequently a problem when comparing brains from separated embryonic stages or evolutionarily distant vertebrate species (Figure 10).
In general, boundaries in the brain are best distinguished in e.g., examine sections oriented orthogonally to their topologic disposition (e.g., examine longitudinal zones in transverse sections and neuromeres in horizontal sections; sagittal sections may be convenient for both cases, but their mediolateral differences become blurred). That is the reason why methodic morphologists (and good brain atlases) like to compare at least these three section planes. Modern use of stereotaxic brain atlases has perhaps contributed to spread the unsound idea that the brain axis is straight, but this just confuses the axis of the stereotactic bases with that of the brain. It is a good exercise to examine sagittal atlas plates while identifying the real brain axis (using relevant landmarks), which serves to realize how far and how often the usual atlas Cartesian “coronal” and “horizontal” reference planes may be oblique to the real non-Cartesian brain boundaries (Figure 10).
2.1 Partial more detailed neural maps
Going beyond the generalities covered above, the prosomeric model allows much more precise analysis of the structure and development of any of the neuromeric basal or alar subareas, which is where most neural derivatives are found (note some floor or roof areas also have neuronal derivatives). Actually, most of the brain derives from the alar plates, because these continue proliferating for a longer time, in some places even postnatally. The basal plate domain differentiates precociously and thus ends its neurogenetic and growing period rather early. Its derivatives accordingly represent much less total volume in the adult brain than those of the more prolific alar domains.
Secondary DV and AP patterning effects subdivide the primary basal and alar domains into so-called microzones (Figure 17). In contrast with DV microzonal subdivisions, which affect in a similar way both basal and alar plates (review in Puelles, 2013), advanced AP subdivisions appear to be restricted to the alar plate domains, usually producing three molecularly distinct alar AP subdomains in each neuromere (see in Figure 17, e.g., the pretectal p1 case studied by Ferran et al., 2007, 2008, 2009, including recent unpublished data on the mouse pretectum; similar phenomena occur in the prethalamus, thalamus and the midbrain; Puelles et al., 2021; Puelles and Hidalgo-Sánchez, 2023; Figure 17). Advanced DV patterning in the alar plate generates normally 5-6 alar DV microzones, whereas in the basal plate there usually emerge 5 basal DV microzones. The added molecular limits arise by antagonistic interaction between different pairs of genes expressed either ventrally or dorsally (review in Puelles, 2013).
Detailed maps of the neuromeric units thus can describe precise molecular maps of dorsoventral and anteroposterior microzonal partitions of the corresponding alar or basal plates. The microzones supposedly represent the final set of molecularly distinct progenitor domains. Each of them is apparently capable of producing over time several different sorts of neurons (this applies clearly also at the extreme cases of the very large cerebellum or retina). The different neuronal cell types will become variously integrated into the collective mantle zone (compactly in nuclear masses or cell layers or in a variously dispersed fashion), or may alternatively migrate away, in part or as a whole, invading other brain areas where they apparently integrate into local circuitry (functionally inefficient neurons tend to atrophy). Every microzonal progenitor domain identified molecularly and topographically can accordingly be described in detail as regards the neuronal types it produces clonally in homogeneous or salt-and-pepper (intermixed) polyclonal fashion over time, extending into the migration streams in which its diverse cell types participate, and their final locations (or functional integration sites). These patterns frequently vary across vertebrates.
The diverse neuronal and glial derivatives of each microzone differentiate in the developing mantle layer, where they may accumulate in various locally specified patterns, either as outside-in, inside-out, or mixed radial patterns forming diverse periventricular, intermediate or superficial mantle strata (e.g., see the serotonergic plurisegmental raphe populations studied by Alonso et al., 2012). They also can disaggregate into dispersed reticular populations or aggregate into relatively compacted nuclear populations or laminar cortical formations. As stated above, they may give rise to migratory streams that translocate some neuronal subpopulations into diverse target positions beyond the original areal boundaries, with or without final mixing with other cell populations (see López-González et al., 2021 for a hypothalamic migrated nucleus including diverse neuronal subpopulations that do not intermix with cells of the receiving area; the nearby migrated subthalamic nucleus also enters into this class). At some sites, multiple migration streams coming from different progenitor microzones converge into a particular nuclear primordium (e.g., see the work on the prepontine interpeduncular complex by Lorente-Cánovas et al., 2012). Obviously, the local mantle of any microzonal area may receive migrating neurons coming from other progenitor domains (most of the cells in the olfactory bulb are immigrated ones). This imposes that structural studies interested in cellular detail need to establish the identity of locally produced versus migrated and immigrated components at every corner of the brain. This task is still largely uncompleted and is not facilitated by the morphological vagueness of modern single-cell transcriptomic works (Puelles and Nieuwenhuys, 2024).
Modern reports inquiring into precise mappings of neurons, tracts, or projections may center on an entire neuromere, or on a group of neuromeres (e.g., the bineuromeric hypothalamus taken as a whole; Shimogori et al., 2010; Puelles et al., 2012a; Díaz and Puelles, 2020) or the plurineuromeric substantia nigra studied across isthmic, midbrain, and diencephalic neuromeres (Puelles, 2013). Otherwise, attention can be centered strictly on the alar domain of a neuromere (for instance, our studies of the avian pretectum—alar p1; Ferran et al., 2007, 2008, 2009, wherein over 20 derived nuclei were identified, or of the mouse prethalamus -alar p3; Puelles et al., 2021). Thalamic structural studies also belong to this class. Alternatively, the attention may be centered on a particular stratum of a DV series of microzones [e.g., our recent analysis of the lateral hypothalamus (intermediate stratum of alar and basal h1) in Díaz et al., 2023, or the neighboring entopeduncular nuclei (superficial stratum of alar h1) in Puelles et al., 2023). Many studies have been dedicated to the cerebellum, which is only a bineuromeric dorsal large microzone of the prepontine alar plate (r0–r1), or to the superior or inferior colliculi, similarly dorsal AP microzonal parts of the respective alar plate domain of the m1 prosomere (Figure 17). As regards the telencephalic vesicle, which is already as a whole a dorsal microzonal part of the h1 peduncular hypothalamic alar plate (Figure 19), one may examine therein profitably the complexities of its subpallial subdivisions (e.g., Flames et al., 2007; Puelles et al., 2000, 2013, 2016) or its amygdalar and cortical pallial subdivisions (Puelles et al., 2000, 2014, 2019, 2024). We have devoted particular attention recently to the histogenetic complexity of the pallial amygdala (Figure 19), considered as derived from a set of amygdalar microzones distinct in several ways from the cortical pallium counterparts (García-Calero and Puelles, 2020, 2021; García-Calero et al., 2020, 2021).
In all these cases, the conceptual topology of the locus of attention within the ample tridimensional framework of the prosomeric model leads to consistence in the descriptive topologic reasoning (what is dorsal, ventral, rostral, or caudal; what is longitudinal or transverse; what is local or migrated; what is mixed in origins and properties), as well as, most importantly, in causal thinking (AP vs. DV patterning). There are many cases in the literature in which these fundamental dimensions are confused or described in a meaningless topographic or simplistic fashion. For instance, what is the true direction of the diffused signals of the hippocampal cortical hem acting upon the cortex? Are these signals opposed spatially to the so-called “anti-hem” signals coming from the pallio-subpallial boundary? The prosomeric model will tell you that hem signals diffuse strictly in a dorsoventral direction, irrespective of the apparent topography in brain sections, since the hem is topologically always a border between the chorioidal roof and the neural alar-derived pallium: roof into alar is always dorsoventral; the supposed “anti-hem” signals do not seem to advance in the topologically contrary direction. An example of patterning analysis considering a larger causal framework was presented in Puelles et al. (2019a), where ring-shaped cortical pallial domains were related to subpallial domains, as well as to the topology of the amygdala and hypothalamus, keeping track of sources of AP and DV patterning signals affecting the whole forebrain domain, divided into anteroposterior prosomeres and their AP and DV microzonal subregions.
3 The midline of the brain
Prosomeric analysis of the brain usually starts by attending first to the midline structures and their mutual relationships. These provide useful information about axial landmarks (i.e., the floor and roof plates), the rostral end of the brain (the AT), and some intertagmatic, interproneuromeric and interneuromeric boundaries, expected to be transverse limits orthogonal to the axial dimension, but usually deformed morphogenetically into curved planes. Such deformation is to be expected particularly in the more highly deformed mammalian brains (particularly primate and human specimens). The midline landmarks remain constant guiding elements of the vertebrate brain Bauplan (see Figures 10A, B) and therefore represent a good starting point for gross recognition of tagmata, proneuromeres, and neuromeres. Once we identify confidently the midline details (a glance is sufficient, after we have gained experience), we can proceed to divide the field of interest into specific neuromeres and their fundamental roof, alar, basal or floor areas, before we search for the smaller sized AP or DV microzonal components and individual cell types. As explained above, detailed morphological analysis attending to the prosomeric model requires attention to the section planes used. This hierarchical classification process should be systematically critical, checking permanently whether the model predictions are corroborated or not (can you find an instance of the retroflex tract not limiting thalamus from pretectum?). It will be found that generally the prosomeric predictions are corroborated, but, if you happen to use new molecular or functional markers, or new technological approaches, novelty may step in at any point. We want to be able to detect that scenario when it appears. It is important not to convert the eminently useful prosomeric model into a blinding dogma.
The transverse interneuromeric limits are orthogonal to the curved axis, whose incurvations should be clear to you from the beginning, in order to predict where these limits most probably are, consistently with roof or floor landmarks, when not with fiber tracts or significant cell masses (all the illustrations in this essay aim to familiarize you with these deformations, which always accompany brain studies). That is why I recommend to start to study a new brain material with sagittal sections, which are less prone to lead you astray than the other section planes, and particularly much easier to interpret than the redoubtable coronal sections (cross sections; they are much loved by all those naïve morphologists that believe the brain axis is straight). Often the boundaries of interest relate clearly to the sagittally cut brain commissures and decussations, or to other anatomic details of the midline (parts of chorioidal telae, epiphysis, hypophysis, bulges, recesses, etc.). Most of these landmarks lie in the midsagittal sections, though fiber tracts and nerve roots lying outside of the midline are also useful, providing additional orienting landmarks. As you see, conscious selection of the section plane by the researcher is absolutely recommendable in neuroanatomy. It is suicidal to give your brain specimen to a laboratory technician and let him/her do what “normally is done with them,” following ancient instructions from past researchers. The plane of section decides what you are going to detect, so it had better be a conscious decision agreeable to your interests, rather than making do with what you somehow get (see again Figures 10A, B and reflect on the notion that you only will see clearly in sections the boundaries that are orthogonal to your section plane; try out mentally different planes). If you do not have particular interests at the beginning, then explore several orthogonal options, always including sagittal sections, and you will soon discover which material helps the most.
After initial sagittal assessment of the neuromeric position of the anatomic elements of interest, we can re-examine their position in any other section plane, preferably oriented precisely relative to the local topography of the relevant neuromeres and their AP or DV subdivisions (that is, relative to what is topologically rostrocaudal, dorsoventral or lateromedial in specific neuromeres of interest; i.e., think about any bidimensional map area as a tridimensional volume with six faces or boundaries you need to keep in mind). As you can imagine, each problem (and each area of the neuromeres) has its optimal section planes. We want to evade sectioning obliquity as much as possible, because it induces confusion and makes given boundaries invisible. For instance, the alar–basal boundary is difficult to see in horizontal sections, because these are in principle parallel to it, but this depends on where you are along the bent axis. Better identify your area optimally in sagittal sections (for an overview of several neuromeres) and later look for dorsoventral patterns in ad hoc transversal sections designed for one or two neuromeres. You may want some oblique sectioning for special reasons at a more advanced stage of the study, once you already can visualize a tridimensional model of the object of interest and its relationships with the prosomeric boundary framework (for example, comparisons between reptilian, avian and mammalian homologs may benefit from oblique section planes in some cases, due to the differential degrees of morphogenetic deformation that occur). You may need to try out several angles of obliquity until you find the optimal one. See for instance our recent search for the optimal sectioning plane for radial units in the mouse amygdala (García-Calero et al., 2021) or previous work looking for radial glia traversing the developing mouse claustrum (Puelles, 2014).
3.1 The floor plate
3.1.1 Hypothalamic floor
As stated above, embryonic gene patterns (Figures 12C, D) induce us to expect the brain floor plate to start rostrally at the midline raphe-like structure that separates the right and left mamillary bodies (h2 floor), from where it extends caudalwards into the retromamillary area (h1 floor) and continues along the rest of the brain (diencephalon, midbrain, hindbrain, spinal cord). Brain atlases usually do not show perfect sagittal sections through this rostralmost floor locus. The medialmost sections illustrated habitually show some amount of the paramedian mamillary body, which indicates that the section is slightly parasagittal (Figure 8A shows separate floor and basal parts of the M area). Horizontal and transverse sections through the mamillary region show that there is indeed a median fibrillar floor raphe at the mamillary midline (which is strictly the h2 floor; the mamillary neurons themselves are in the adjacent basal plate; see Figure 19). Caudally to the mamillary locus, the retromamillary area (h1) shows typically in adult myelin preparations the presence of a retromamillary fiber decussation which corresponds partly to the decussating terminal fibers of the fornix tract, but also possibly includes other elements (some serotonergic raphe axons seem to cross there). This floor locus typically appears perforated by several radially penetrating blood vessels; this corresponds to the rostral end of the posterior perforated space in the interpeduncular fossa (Figures 23A, B).
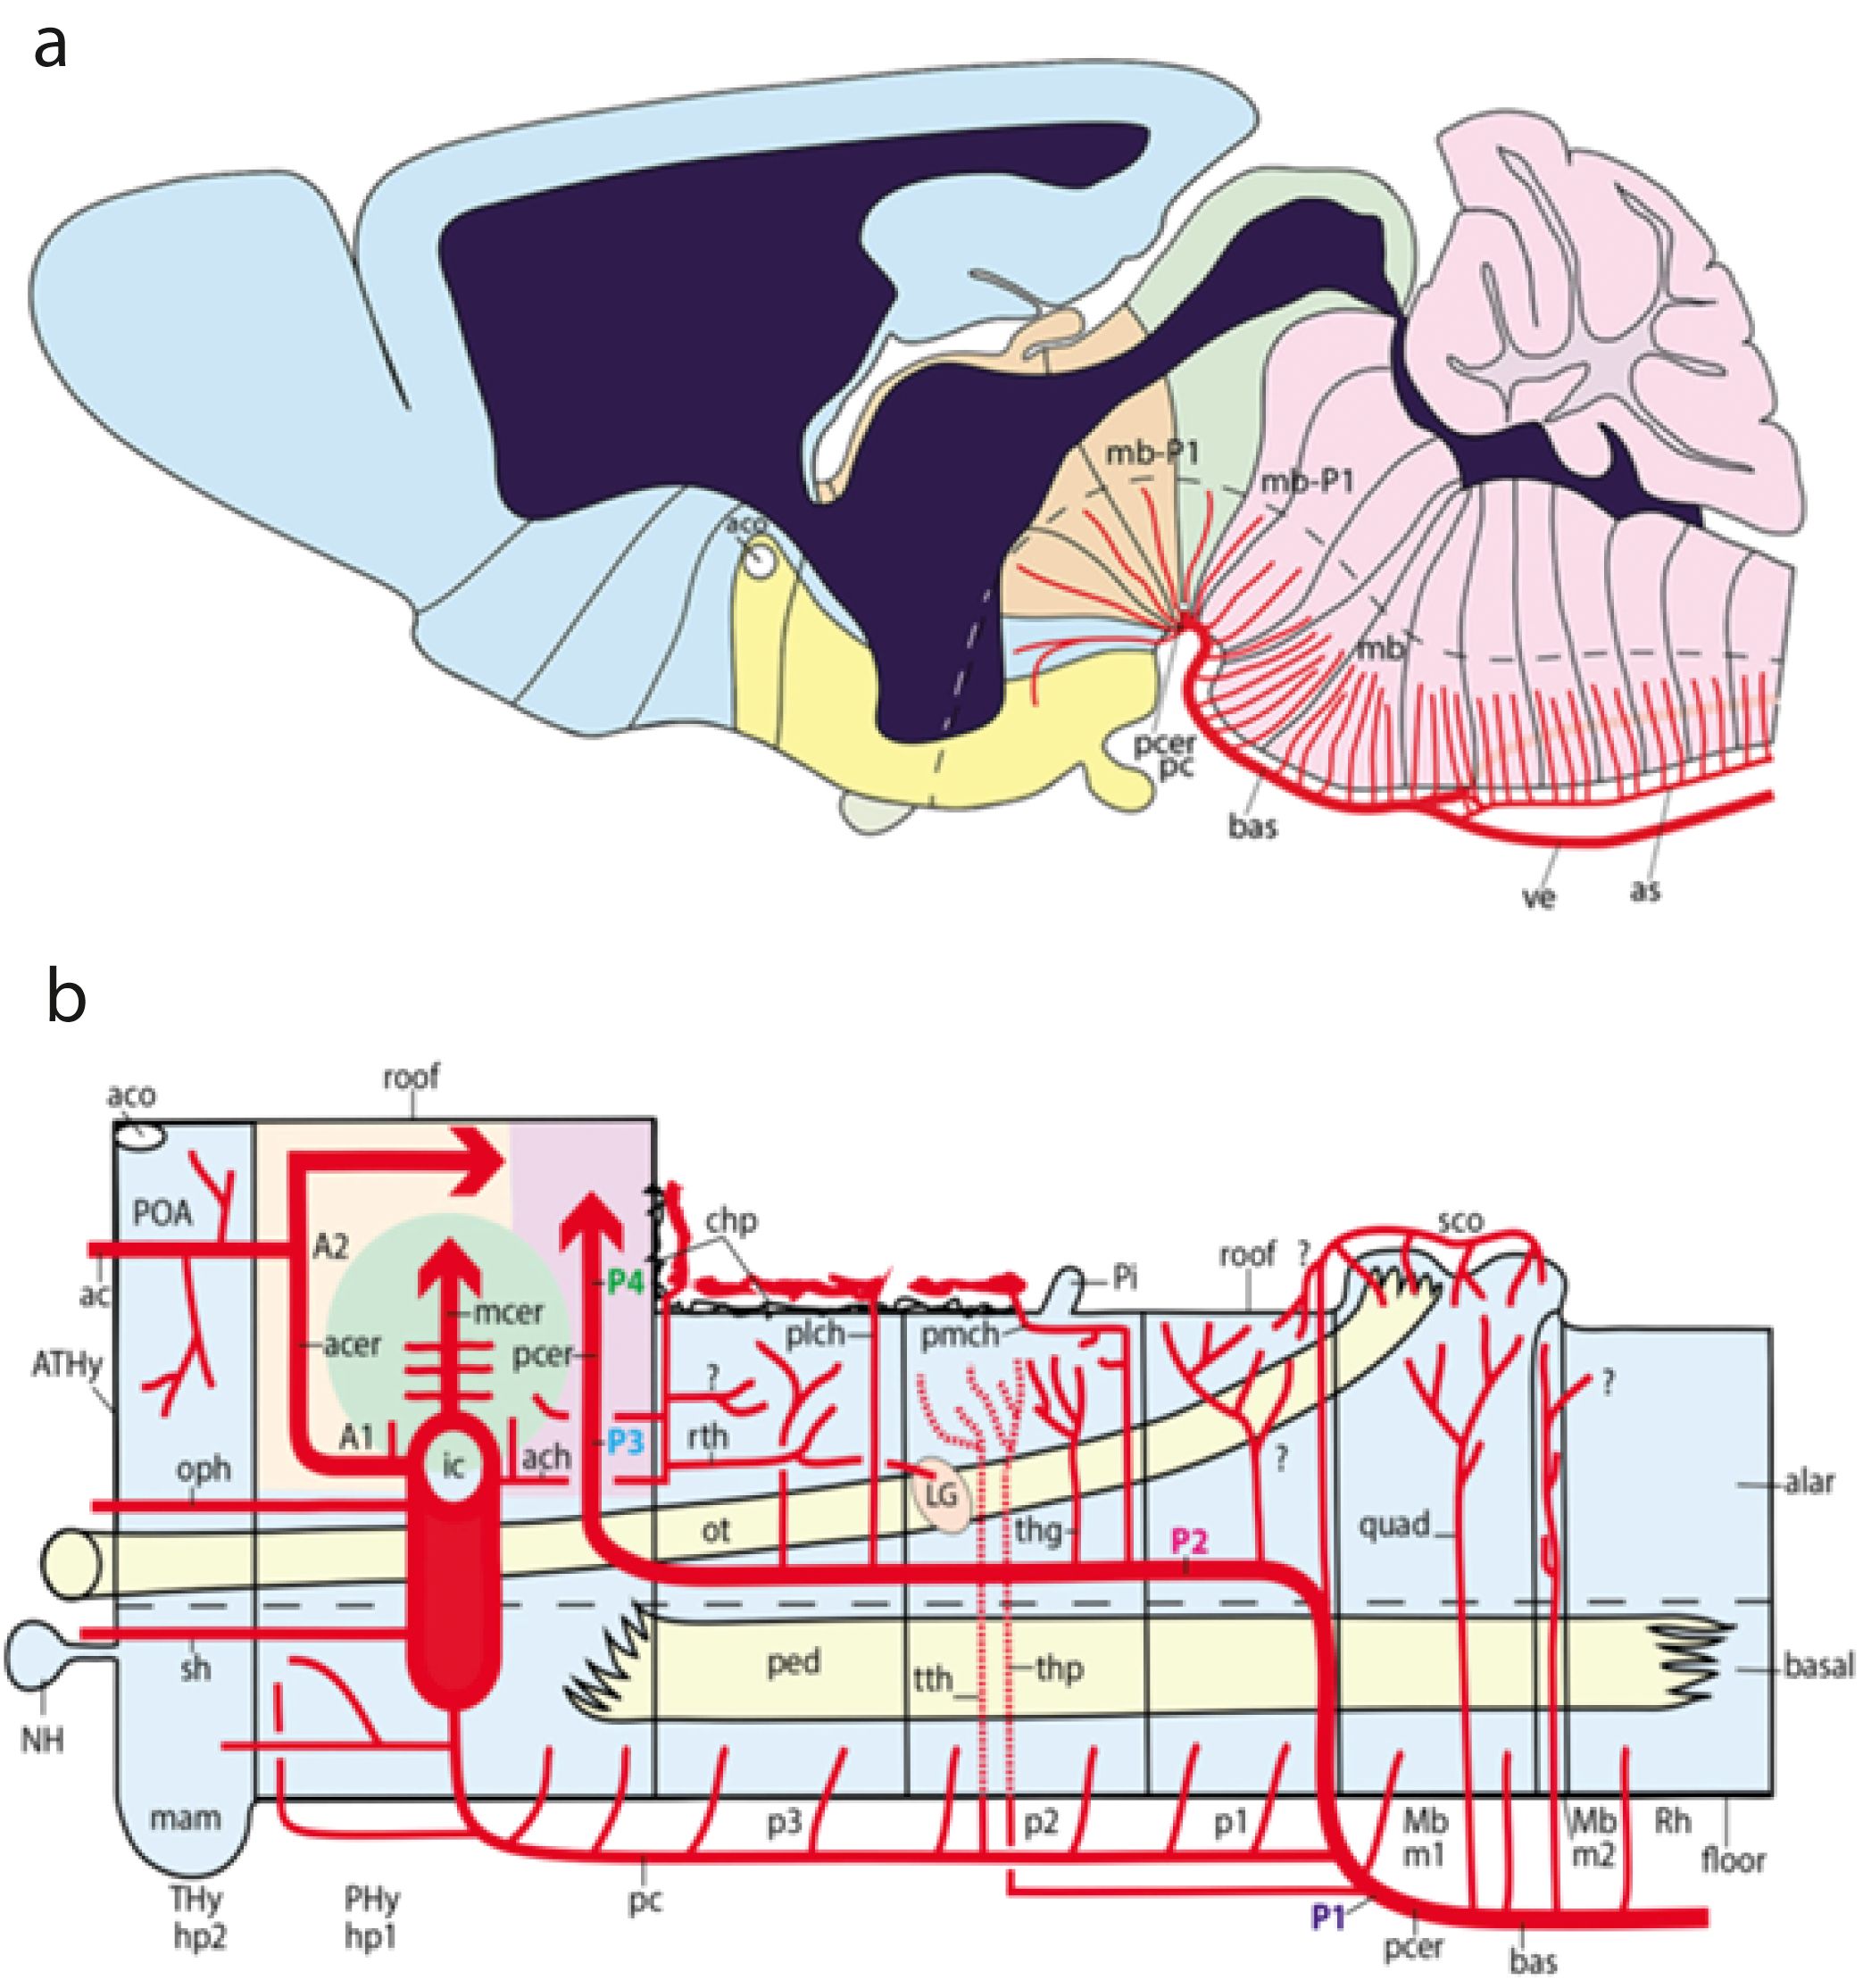
Figure 23. (A) Diagram illustrating the pattern of radial paramedian penetrating arterial branches that characterize the brain floor plate (from Puelles et al., 2019c). The rostralmost penetrating vessels are branches of the posterior communicating artery and the posterior cerebral artery (pcer, pc) that enter radially through the retromamillary area of the interpeduncular fossa (labeled in light blue). (B) Schematic topologic representation of known or newly identified forebrain arterial vessels mapped upon the forebrain prosomeric model (hypothalamo-telencephalic, diencephalic, and mesencephalic sectors). As regards the topologic forebrain map, the axial dimension has been straightened [elimination of the cephalic flexure, generating a straight floor, straight alar–basal boundary (dash line), nearly straight roof; the latter has a step as the evaginated telencephalon is reached, for clarity, but even this might be straightened out], and, accordingly, the basal and alar plates also are straight. Reference structures such as the tegmental cerebral peduncle (ped) and the alar optic tract (ot) are straight or nearly straight. All neuromeres and interneuromeric borders are orthogonally transversal to the axial dimension and parallel to each other (their true topologic nature). In these conditions, it is possible to represent faithfully spatially oriented structures such as the arteries. Dorsal is the direction into the roof, while ventral directs into the brain floor, rostral lies to the left, and caudal to the right. The main subarachnoidal vessels serving this territory derive from the internal carotid (ic), posterior communicating (pc), posterior cerebral (pcer), and basilar (bas) arteries. The topologic course of the main arterial trunks is either longitudinal or transversal (largely ventrodorsal), and they normally group into the specific prosomeres they serve. The posterior cerebral artery shows two transversal sectors (P1 and P3) separated by a longitudinal sector (P2), implying successive changes of vascular elongation direction at specific neuromeric loci. The ic courses transversally in ventrodorsal direction next to the PHy (crossing orthogonally the optic tract, ot). Its major terminal branches entering transversally into the telencephalon overhead are the anterior cerebral (acer) and middle cerebral (mcer) vessels, positioned in the map as corresponds after flattening the hemisphere (there is a yellow/green color code for the respective irrigated cerebral fields). The posterior telencephalic field is covered by the final, similarly transversal, P3 segment of the pcer (pale violet code). The thicker arrows in each case represent pallial arborizations, whereas central branches to the subpallium appear as thinner collaterals. The acer also gives out the anterior communicating (ac) artery which importantly serves the preoptic (POA) and septal regions. The median front of the forebrain is represented by the acroterminal preopto-hypothalamic domain (ATHy). The posterior communicating (pc) vessel arises from the ic. First, it descends topologically along the PHy and then bends caudalwards into a longitudinal para-tegmental course until it meets the pcer near its origin from the bas artery. Our topologic straightening of the normally bent length dimension causes the pc to appear as long as it topologically is, though this is not observed in the unstraightened (bent) real brain, where we see instead a short transhypothalamic course. The pcer continues bilaterally the median basilar (bas) artery but changes its relative position by crossing dorsalward the peduncle (P1 in front of the midbrain) into a ventral alar level, which it then uses to extend rostralward along the whole alar diencephalon (P2; longitudinally) until it reaches the secondary prosencephalon and enters the telencephalon (P3; again transversally). The midbrain appears as a transitional caudal forebrain domain where the vascular patterns gradually change from typical hindbrain features to typical diencephalic characteristics. This again apparently changes when we arrive at the secondary prosencephalon, where our analysis was less detailed. One pattern that is pretty clear is that the brain basal plate is irrigated separately from the larger alar plate. A multiplicity of mediobasal or laterobasal arteries enter the basal tegmentum at all neuromeric levels, as predicted originally by His (1895, 1904) and as is expected in the prosomeric model. These basal plate vessels arise sequentially from several primary arteries. An exception is represented by the peculiar thalamic perforant arteries (tuberculo-thalamic or tth, thalamo-perforant or thp; seen by transparency with dash courses), which first behave as basal vessels, but then extend intramurally from the basal p2 tegmentum into the overlying alar domain. In contrast, normally selective alar arteries address the hindbrain, midbrain, and diencephalic alar plate. The singular perforant thalamic arteries perhaps may be correlated with the observed initial delay in direct alar vascularization of the thalamus domain. The midbrain also has dedicated alar arteries that arise from the bas or pcer P1. The map shows that the diencephalic alar plate is covered by successive neuromeric alar branches of the pcer, some of which have chorioidal roof branches in p2 and p3. The caudal rhombo-mesencephalic pattern thus has changed by moving the bas-like pcer bilaterally to a longitudinal course which is displaced to an alar topology. The diencephalic basal branches largely originate from the pc artery. The map also places the route and ending sites of the posteromedial and posterolateral chorioidal arteries (pmch and plch), in contrast with the anterior chorioidal artery (ach), which produces a singular recurrent thalamic branch (rth) that extends longitudinally backward, into at least the prethalamus and the thalamus. A1, A1 sector of the anterior cerebral artery; A2, A2 sector of the anterior cerebral artery; ac, anterior communicating artery; acer, anterior cerebral artery; ach, anterior chorioidal artery; aco, anterior commissure; ATHy, acroterminal hypothalamus; bas, basilar artery; chp, posterior chorioidal artery; hp1, hp2, hypothalamo-telencephalic prosomeres 1,2; ic, internal carotid; LG, lateral geniculate body; m1, m2, mesomeres 1,2; Mb, midbrain; mcer, middle cerebral artery: NH, neurohypophysis; oph, ophthalmic artery; ot, optic tract; P1, P2, P3, P4, sectors P1–P4 of the posterior cerebral artery; p1–p3, diencephalic prosomeres 1–3; pc; posterior communicating artery; pcer, posterior cerebral artery; ped, peduncle (longitudinal tegmental part); PHy, peduncular hypothalamus; Pi, pineal gland (epiphysis); plch, posterolateral chorioidal artery; pmch, posteromedial chorioidal artery; POA, preoptic area; quad, quadrigeminal artery; Rh, rhombencephalon; rth, recurrent thalamic artery; sco, supracollicular artery; sh, superior hypophysial artery; thg, thalamo-geniculate artery; thp, thalamo-perforant artery; THy, terminal hypothalamus; tth, tuberculo-thalamic perforant artery.
3.1.2 Diencephalic and midbrain floor
Caudal to the retromamillary floor, the diencephalic midline floor raphe becomes gradually thicker, and the floor shows a maximal radial extent at midbrain levels (orange and green domains; Figure 23A). This floor portion is also perforated throughout by paramedian radial penetrating blood vessels (representing the posterior interpeduncular perforated space at the apex of the cephalic flexure; Figures 23A, B). The whole posthypothalamic forebrain floor relates to the dopaminergic cells of the mesodiencephalic ventral tegmental area, which apparently extends into the isthmic floor, in front of the interpeduncular nucleus (first pink rhombomere in Figure 23A). The intertagmatic rhombo-mesencephalic boundary is marked at the aqueductal ventricular floor by the isthmic fossa, a median ventricular recess whose bottom marks the caudal end of midbrain Otx2 expression (Figures 7B, C). The length of the rather short midbrain floor portion (m1, m2; Figure 11B) roughly correlates with the length of the roots of the oculomotor nerve, which come out in slightly paramedian sagittal sections, at both sides of the floor. Within the longer diencephalic part of the floor (due to its three neuromeres p1–p3; Figure 11B) there are decussating myelinated fiber packets marking the prethalamic (p3) and pretectal (p1) prosomeric floor parts (the prethalamic and pretectal tegmental decussations). The thalamic floor domain (p2) apparently is devoid of such decussating fiber elements. The midbrain floor domain shows at m1 levels the better known dorsal and ventral tegmental decussations (see vtg and dtg in Figures 13A and 9; Puelles et al., 2012b; Puelles and Hidalgo-Sánchez, 2023). The ventral tegmental decussation contains the crossed rubrospinal tract fibers, whereas the dorsal one carries the crossed tectobulbar and tectospinal tracts. The floor corresponding to the small preisthmic prosomere (m2) is very narrow and corresponds to the cell-poor retrorubral gap that separates the oculomotor nucleus in m1 from the trochlear nucleus in the isthmus (r0) (Figures 13A and 9; RRF in Figure 21).
3.1.3 Hindbrain floor
The prepontine floor (r0, r1) lies behind the median isthmic fossa (at embryonic stages it often seems to protrude into the midbrain, because the isthmic boundary strongly curves back, and the caudal midbrain overhangs it; see Figures 8A and 24 and Puelles and Hidalgo-Sánchez, 2023; this relationship straightens out in the adult; see m2, r0 in Figure 9). This floor domain is quite thick and is largely occupied superficially by the median interpeduncular complex (the latter has isthmic and r1r/r1c parts and clearly also extends into the adjacent basal plate; Figure 18A). Deep to the interpeduncular nucleus the decussation of the superior cerebellar peduncle appears in the caudal isthmus, tangent to the r0/r1 interneuromeric boundary (Figures 13A and 9). It has been shown experimentally in the chick that the ventromedian interpeduncular complex (which lies subpially across the whole prepontine floor and adjacent basal plate) has a small rostral isthmic portion (called prodromal interpeduncular nucleus, IPpro, in Figure 18A; unlabeled in Figure 9) and two larger, rostral and caudal main interpeduncular nuclei (in r1r and r1c, respectively; see IPr, IPc in Figure 9; compare IPR, IPC in Figure 18A), apart other accessory rhabdoid, apical and lateral subnuclei. This complex is the result of a complex migratory convergence of diverse hindbrain alar and basal cell populations into this superficial median and paramedian nuclear primordium (Lorente-Cánovas et al., 2012). It is thought that all mammals (and possibly all vertebrates) show this median nuclear complex, already present in anamniotes, though we do not know whether some of the molecularly characterized homologous cell populations remain unmigrated near their origins in the more primitive species [it represents the target of the equally constant bilateral, sometimes asymmetric, habenulo-interpeduncular (or retroflex) tracts coming from the habenular thalamic nuclei in p2; see Ferran and Puelles, 2024]. Note that some authors placed wrongly the interpeduncular nucleus in the midbrain or even in the diencephalon or the hypothalamus (e.g., Bayer and Altman, 2004, Vol. 2, e.g., plate 56B).
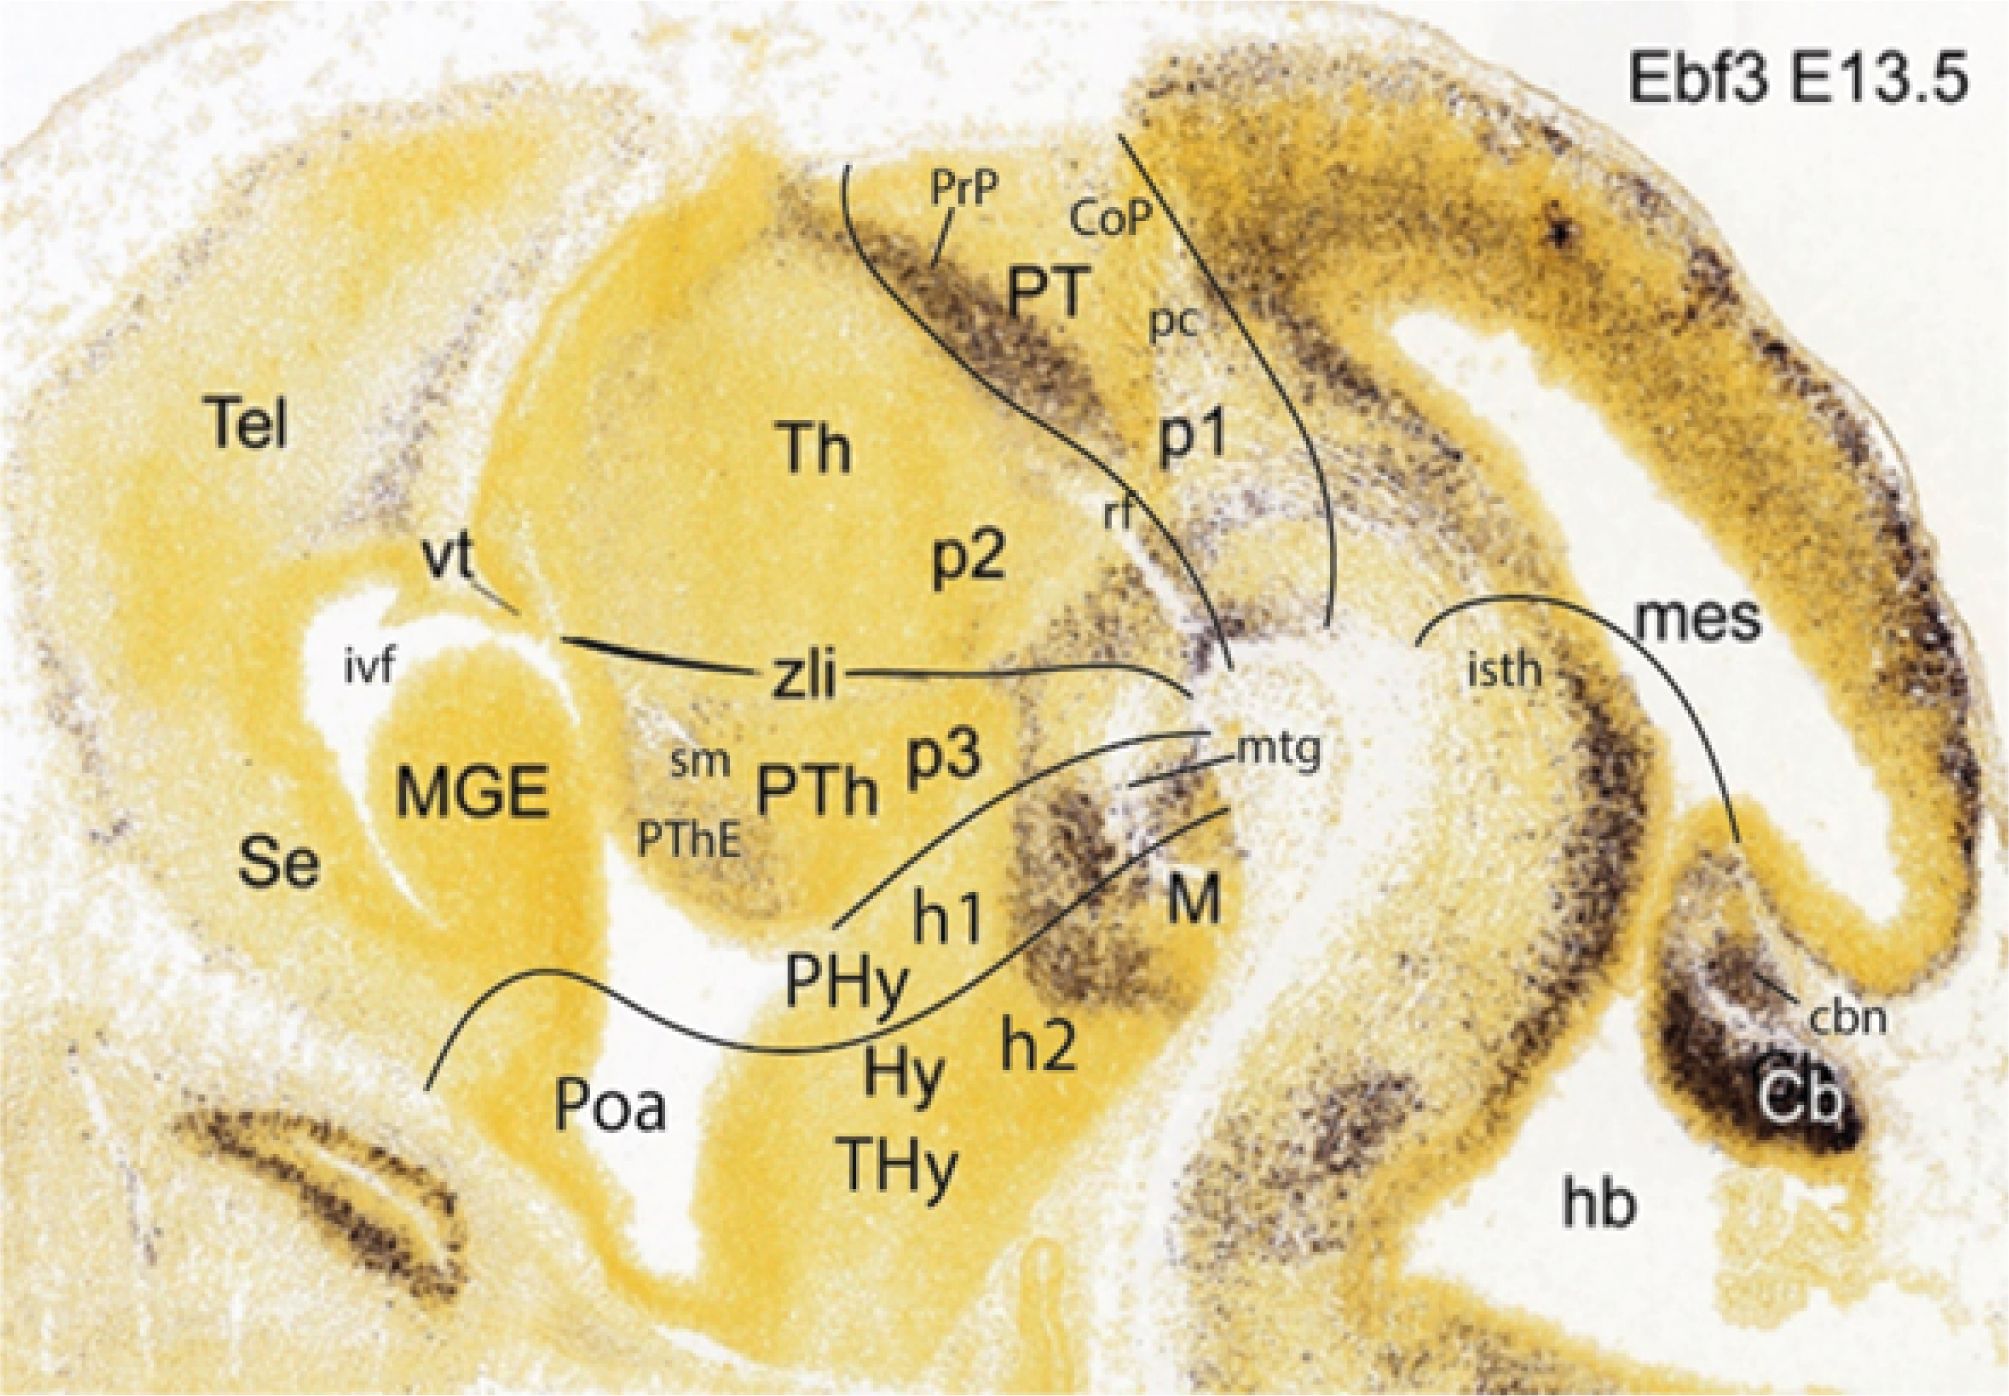
Figure 24. Parasagittal section through a mouse E13.5 embryo ISH-reacted for the Ebf3 marker. Downloaded from the Allen Developing Mouse Brain Atlas (not published before). This section clearly illustrates how the transverse forebrain chorioidal roof fold called velum transversum (vt), generally seen at this stage above the interventricular foramen, points straightly into the transverse alar boundary between Th (in p2) and PTh (in p3), identified as zona limitans interparencephalica or intrathalamica (zli) by Rendahl (1924; compare Figure 3A). The thalamic thin chorioidal roof plate joins caudally the habenular neural roof plate, in front of the pretectum (PT). Note that the distinct Ebf3 labeling of part of the underlying basal plate (ending rostrally at the mamillary AT) shows a small dorsal spike pointing into the zli. The vt thus marks dorsally the p2/p3 interprosomeric limit. The differential Ebf3 labeling of the p2 and p3 basal plate regions, as well as of the mamillary area (M) versus the retromamillary area (no tag; this area is traversed longitudinally by the mamillotegmental tract) supports molecular delineation of the corresponding prosomeres at their basal domains. The weakly Ebf3-labeled dorsal area within PTh displaying unlabeled longitudinal fibers represents the dorsal alar prethalamic eminence subarea (PThE) and the fibers of the characteristic stria medullaris tract (sm) which course longitudinally through it toward the habenula and the habenular commissure. The transverse dorsoventral fibers of the habenulo-interpeduncular or retroflex tract (rf) are seen entering the basal plate just rostral to the thalamo-pretectal border (p2/p1). The pretectum (PT; p1) shows selectively labeled its rostralmost alar AP microzone (precommissural pretectum; PcP), and transversely coursing fibers of the posterior commissure (pc) are seen reaching the basal plate (commissural pretectum; CoP). Ebf3 labels in the cerebellum both the primordium of the cerebellar nuclei (smaller rostral superficial mass; cbn) and the postmitotic cortical neurons lying periventricularly (future Purkinje cells; Cb), before migrating to the cerebellar surface (eventually to cover the nuclei). Cb, cerebellar cortex primordium (premigratory); cbn, cerebellar nuclei; CoP, commissural pretectum; pc, posterior commissure (AP microzone); h1,h2, hypothalamo-telencephalic prosomeres 1,2; hb, hindbrain; Hy, hypothalamus; isth, isthmus; ivf, interventricular foramen; M, mamillary body; mes, mesencephalon; MGE, medial ganglionic eminence; mtg, mamillotegmental tract; p1–p3, diencephalic prosomeres 1–3; PHy, peduncular hypothalamus; Poa, preoptic area; PrP, precommissural pretectum (AP microzone); PT, pretectum; PTh, prethalamus; PThE, prethalamic eminence; rf, retroflex tract; Se, septum; sm, stria medullaris tract; Tel, telencephalon; Th, thalamus; THy, terminal hypothalamus; vt, velum transversum.
The pontine floor (r2–r4) is largely occupied by the basilar pontine nuclei, which are restricted in all mammals to r3 and r4 (the majority belongs to r4; Figures 5E, F). The floor of r2 is strongly compressed between the prepontine interpeduncular complex and the pontine bulge (Figure 9). Subpially, it contains the decussation of the trigemino-thalamic lemniscus, originated from the main sensory trigeminal nucleus in r2–r3. Periventricularly it apparently contains a vestibulo-vestibular decussation. The efferent pontine fibers form the pontocerebellar peduncle, which crosses the pontine floor throughout its r3–r4 extent. Its fibers partly continue through superficial parts of r2, passing rostrally or caudally to the local trigeminal nerve root; the more caudal pontocerebellar fibers, probably out of r4, course initially through r4, r3, and r2 before they converge into r1 to enter the cerebellum (Figure 18A; the traditional term “pons” of human neuroanatomy thus refers to the overall mass of the cerebellopetal fibers, rather than to the less massive basilar nuclei). Deep to the subpial basilar pons, within the median floor tegmentum of r3–r4, an analogously migrated pontine population extends toward the ventricle in a tapering formation called reticulo-tegmental nucleus; it points into a quite reduced ventricular surface at the center of the rhombic flexure (blue-labeled rttg population in Figure 9).
The retropontine floor (r5, r6) lies more or less hidden under the overhanging r4 pons bulge, depending on the species, forming part of the foramen caecum (the overhang is minimal in the mouse; see Figure 9, compare with Figure 18A). The floor stretch of r5 is occupied superficially in all mammals by the trapezoid body, representing the decussation of the lateral lemniscus (the ascending auditory pathway; the subpially decussating trapezoid body is easily visualized in midsagittal sections; tz; Figure 9). At both sides of this floor domain emerge the roots of the abducens nerve. The floor of r6 is a simple glial raphe lacking distinctive features (apart the shared bilateral bulge of the descending pyramidal tract; barely distinguished in Figure 9).
The medullary floor (r7–r11) is dominated by the glial raphe that separates at the midline the two inferior olives, which extend over r8–r11 down to the pyramidal decussation (IO; pyx; Figures 21 and 9; note the pyx lies in myelomere 1; the rhombospinal boundary passes rostral to it; Tomás-Roca et al., 2016). The r7 floor lacks this olivary reference and is not distinctive; it shows bilaterally the descending pyramidal tract, as happens with that of r6 and the rest of medullary rhombomeres. It possibly is crossed by part of the decussating olivocerebellar tract fibers ascending toward the inferior cerebellar peduncle (corpus restiformis). The neuromeric serial rootlets of the hypoglossal nerve emerge from the preolivary sulcus across r8–r11, at both sides of the medullary floor.
3.1.4 Spinal cord
The spinal floor separates throughout the two ventral horns and carries the so-called anterior or white spinal decussation, which is actually a decussation of spinoreticular and spinothalamic fibers which are repeated serially in all myelomeres. In the first myelomere (my1) we see the decussation of the crossed pyramidal tract fibers, most of whose fibers pass in the human case from the ventral column into the lateral column (contrarily, in the mouse and some other mammals they pass instead into the dorsal column; Figures 21 and 9).
3.2 The roof plate
The roof plate of the brain forms throughout by median fusion of the borders of the neural plate, thus closing the neural tube (rostral and caudal open neuropores can be observed transiently; Figure 14). After differentiation, the roof plate shows either neural or chorioidal sectors (Figure 12A). The neural roof portions behave as normal components of the neuroepithelium and can produce neurons, apart of generating optionally glandular- or receptor-like circumventricular organs (Figure 25). Some neural roof portions allow axons to cross the dorsal brain midline in a number of commissures and decussations (commissures interconnect equal bilateral brain areas, whereas decussations connect unequal areas; the main roof commissures are mapped in blue in Figure 25). The chorioidal roof portions represent areas where the neuroepithelium flattens throughout, forming a thin tela (tissue) that may fold multiply, and protrude into the underlying ventricle, invaginated by vascular capillaries pressed within its folds. These ingrowths form the so-called chorioidal plexi, which filter blood plasma into the ventricles, converted into the variously enriched but acellular (normally transparent) cerebrospinal fluid. We can divide the roof plate conveniently in sectors corresponding to the different tagmata and proneuromeres (Figures 12A, 9, and 25).
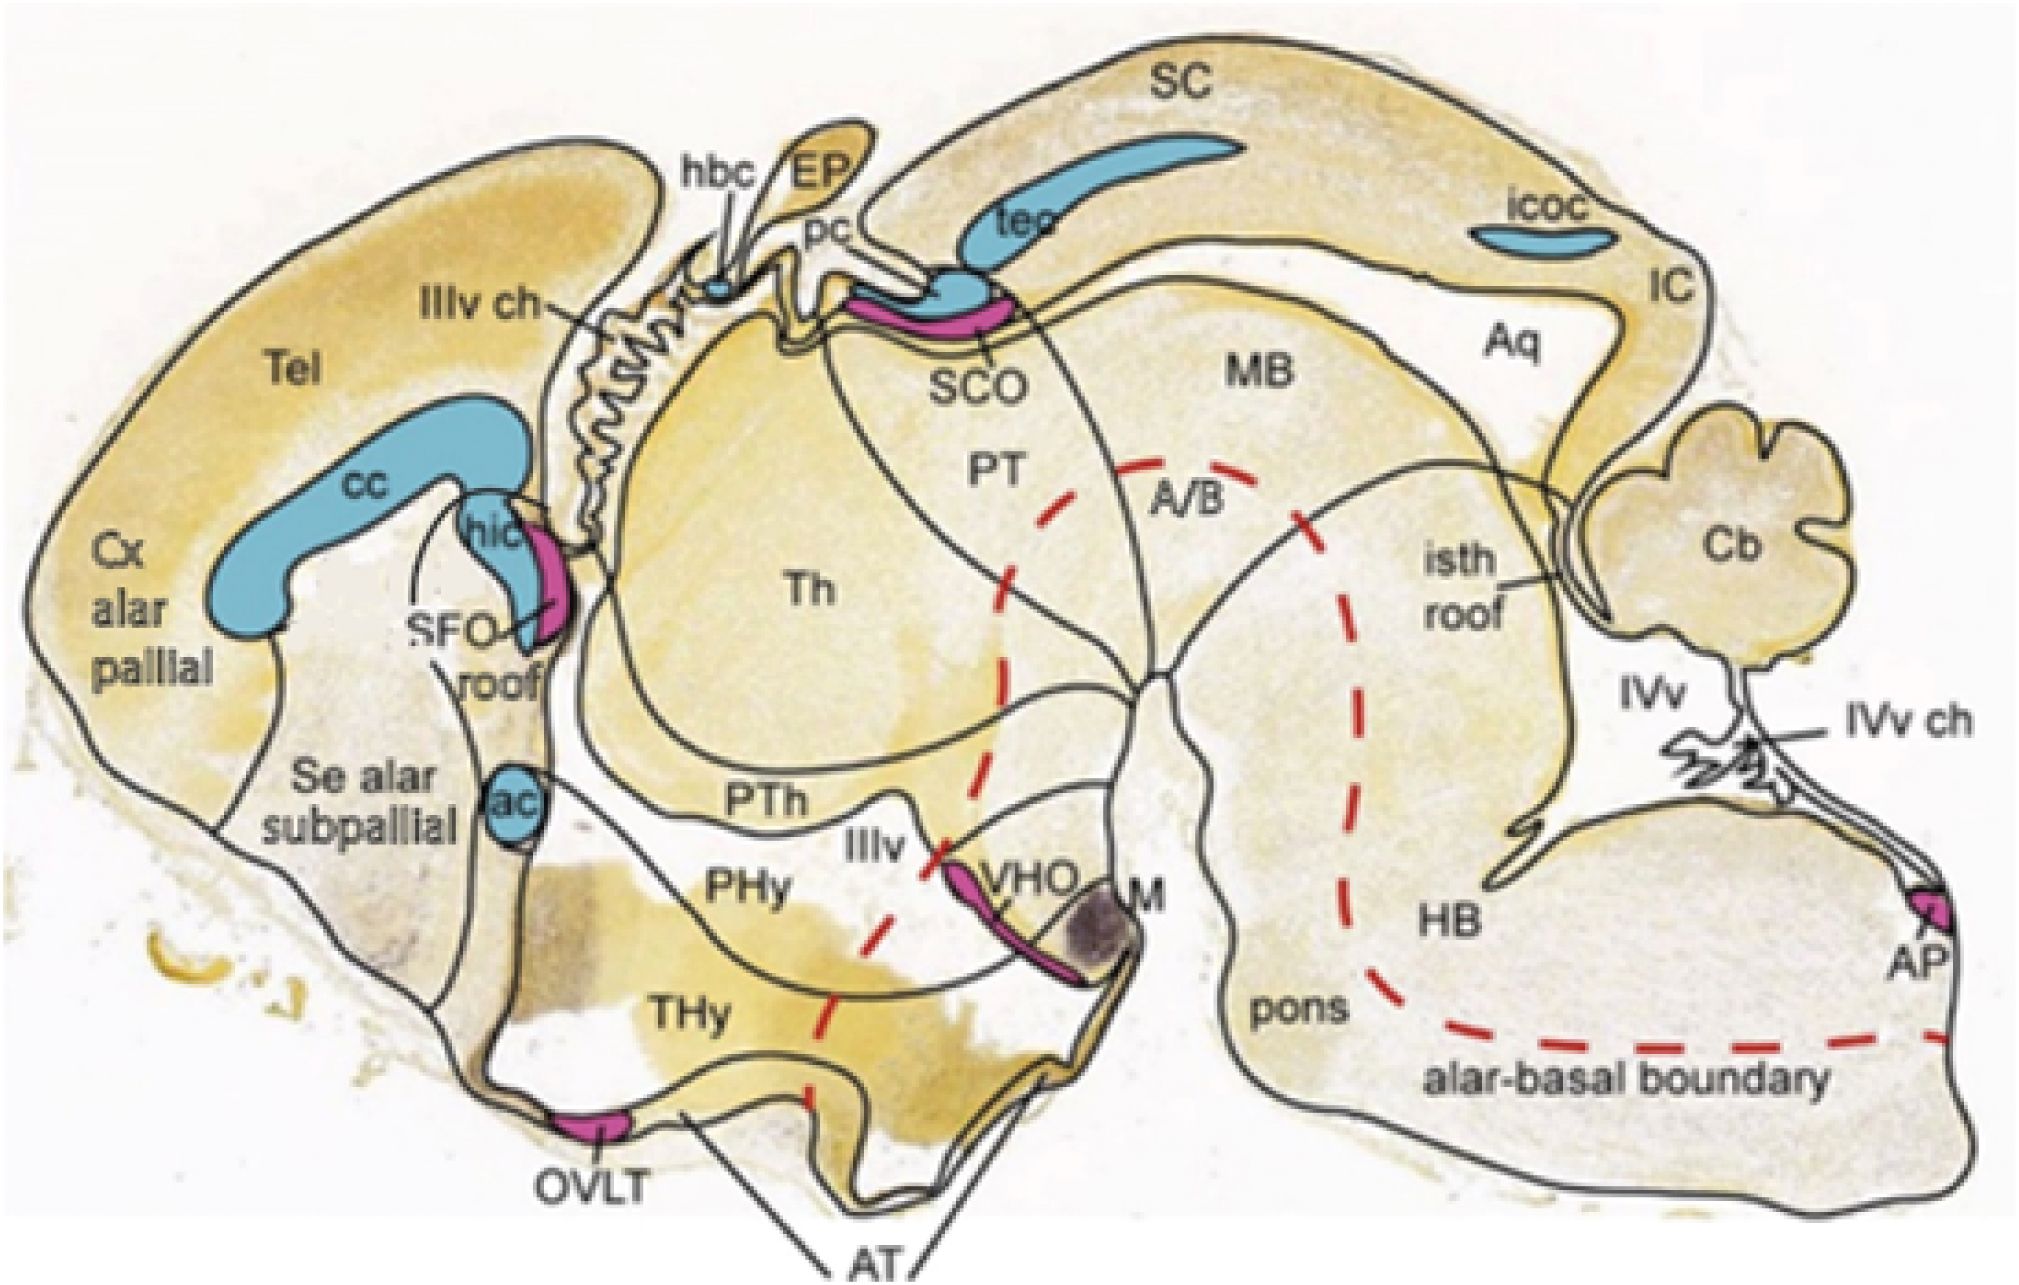
Figure 25. Semischematic tracing on top of a real E18.5 sagittal section (extracted from the Allen Developing Mouse Brain Atlas) of anatomic details of the brain roof plate including diverse identified roof commissures (blue; note “tec” refers to the sum of the tectal gray and the intertectal commissures, whereas “icoc” refers to the intercollicular commissure of the inferior colliculus), chorioidal tela roof patches (ch, in white) and the main circumventricular organs (violet). From Ortega et al. (2021). A/B, alar–basal boundary; ac, anterior commissure; AP, area postrema; Aq, aqueduct; AT, acroterminal domain; Cb, cerebellum; Cx ala pallial, pallial alar cortical domain; EP, epiphysis; HB, hindbrain; hbc, habenular commissure; hic, hippocampal commissure; IC, inferior colliculus; icoc, intercollicular commissure; IIIv ch, chorioidal plexus of third ventricle; IIIv, third ventricle; isth roof; isthmic roof; IVv, fourth ventricle; IVvc h, chorioidal plexus of the fourth ventricle; M, mamillary area; MB, midbrain; OVLT, vascular organ of the lamina terminalis; pc, posterior commissure; PHy, peduncular hypothalamus; PT, pretectum; PTh, prethalamus; SC, superior colliculus; SCO, subcommissural organ; Se alar subpallial, subpallial septal alar domain; SFO, subfornical organ; tec, tectal commissure (tectal gray + SC commissures); Tel, telencephalon; cc, corpus callosum commissure; Th, thalamus; THy, terminal hypothalamus; VHO, ventricular hypothalamic organ (also spelled HVO).
3.2.1 Hypothalamic roof (related to septum and hippocampus)
The hypothalamic roof plate is habitually described as if it was telencephalic, though, strictly, the telencephalon does not participate in the roof plate, being a purely alar evagination within the primordial hypothalamic alar plate (i.e., after closure of the anterior neuropore, the hypothalamus already has a fully fused roof plate before the alar telencephalic vesicle evaginates; green part of roof; Figure 14D). The rostralmost prosomeric sector of the hypothalamic roof is represented by the acroterminal h2 roof corresponding to the locus where the anterior commissure crosses the septal commissural plate (Figure 12A; the anterior commissure may be understood as an olfactory commissure with some additional cortical and amygdalar components). Note that monotreme and marsupial mammals that do not have a corpus callosum—prototheria and metatheria—pass all their crossed cortical fibers through either the anterior commissure or the hippocampal commissure; all non-mammalian vertebrates have some sort of anterior commissure. The ascription of this commissure to the rostralmost roof plate was demonstrated by experimental fate mapping in amphibians (Jacobson, 1959, Eagleson and Harris, 1990; Eagleson et al., 1995), chick (Puelles et al., 1987; Cobos et al., 2001) and mouse (Inoue et al., 2000). Associated to the median anterior commissure is the preoptic part of the septum (in particular the median preoptic nucleus; Figures 15A and 19).
The following hypothalamic roof sector relates to the h1-related septal commissural plate subregion that extends from the anterior commissure to the hippocampal commissure and associated subfornical organ (ac, hic, SFO; Figure 25); the SFO lies at the transition of the septal neural roof into the forebrain chorioidal roof which, extends into the roof of the paired interventricular foramina and the attached chorioidal fissure (Figures 12A and 25). Note that this neural septal roof, which is part of the telencephalic subpallium (with which it interconnects under the evaginated lateral ventricle (see Figure 19; see also Puelles et al., 2013, 2016, 2019a—the latter’s Figure 14), is covered by the corpus callosum and the septum pellucidum found under the interhemispheric fissure (Figure 25). The callosal fibers do not cross through the septal roof plate, as the hippocampal commissure does, but above it, perforating the supracommissural hippocampal cortical domain, using a singular cortico-cortical (i.e., inter-alar) bridge (a secondarily formed glial sling). In contrast, the hippocampal commissure (hic; Figure 25; a.k.a. trigonal or fornical commissure) carries hippocampal efferents vehiculated by the fimbria tract along the cortical hem. We can accordingly speak of a strictly septohippocampal h1 roof sector at the back, behind an olfactory anterior commissural h2 roof at the front, both being subpallial regions according to their molecular profiles (Borello et al. in preparation). There exist median or paramedian commissural septal nuclei associated to the hippocampal or anterior commissures (the major ones being the unpaired triangular nucleus of Cajal, partly interstitial to the hic, and the paired nucleus of the anterior commissure). Their neurons are glutamatergic and project to the habenula (however, these are neither subpallial nor pallial cells, since they represent tangentially immigrated elements originated in the diencephalic prethalamic eminence; see Alonso et al., 2020, 2021). In contrast, the remaining paramedian septal wall participating in the medial subpallial wall of the hemisphere, where most septal nuclei lie, belongs to the evaginated telencephalic alar plate, contiguous to the (hypothalamic) septal roof plate (Figures 25 and 19). This implies that the septum is a topologically dorsal subpallial part of the secondary prosencephalon, with an eminently GABAergic cell population, that participates of a rostrodorsal paramedian alar telencephalic area and a median hypothalamic roof domain and receives immigrated glutamatergic and cholinergic components from other brain regions. The septum is conventionally misidentified as a “ventral telencephalic” structure, due to its topography in coronal sections (but they are unreliable when the axis is bent; see Se in Figure 19, next to the roofplate anterior commissure).
The subpallial topologically rostral part of the hemisphere (Figures 14D, E) abuts directly the neural septal roof, see the transition of the striatal formation (lateral ganglionic eminence), plus the pallidal and diagonal domains (medial ganglionic eminence), plus the preoptic area into the septum in Figure 19 [illustrated also in Puelles et al., 2013, 2016 and Figure 14 in Puelles et al., 2019a; note that up to 2019, we interpreted the septum wrongly as having pallial and subpallial parts, misguided by the presence therein of supposedly pallial glutamatergic elements; this changed after Alonso et al., 2020, 2021 showed experimentally that the septal glutamatergic components are not pallial but of eminential (diencephalic) migratory origin]. In contrast, the large caudal pallial part of the hemisphere (also part of h1; Figures 14D, E) only reaches indirectly the septal commissural roof via the fibers of the olfactory anterior commissure and the hippocampal commissure (note these fibers originate exclusively from the two distinct parts of allocortex: olfactory cortex and hippocampal cortex). The isocortex of modern mammals (eutheria) interconnects commissurally via the corpus callosum, but this connection bypasses the roof plate altogether and uses an ad hoc bridge built after adhesion of the hippocampal cortical surfaces at the bottom of the interhemispheric fissure (apparently the only such pial adhesion case occurring in the brain). Caudal to the commissural septum, the rest of the hypothalamic roof plate adopts a chorioidal tela structure (flattened neuroepithelium; Figures 12A and 25). The chorioidal tela jumps from the caudal telencephalic septal roof (precisely, from the SFO) into the prethalamic and thalamic parts of the chorioidal diencephalic roof (p3 and p2 roof; Figures 12A and 25). This chorioidal sector ends with a median caudal insertion into the habenular commissure in front of the epiphyseal stalk (i.e., the forebrain chorioidal roof extends from h1 into p3 and p2; see IIIv ch, hbc; Figure 25). This diencephalic part of the median forebrain chorioidal tela builds the chorioidal plexus of the third ventricle (IIIv; Figure 25).
In addition to this median chorioidal roof, there are bilateral wings of the same tela that extend over the interventricular foramina into the caudomedial wall of the hemisphere, forming the so-called chorioidal fissure, along which the chorioidal plexi of the lateral ventricles invaginate (Figure 19). These wings form as a consequence of the hemispheric evagination, which sort of pinches the nearest part of the chorioidal roof plate into the evaginated alar telencephalic vesicle, where it subsequently elongates passively following the disproportionate growth of the hemispheric temporal pole (a part of the alar hypothalamus reaching the chorioidal fissure is also captured in the hemispheric evagination, jointly with a part of the prethalamic eminence; Figure 19). These bilateral chorioidal wings begin next to the median SFO-related tela and first constitute the chorioidal roof of the interventricular foramina (Figure 25). The telencephalic chorioidal insertion moves from the median SFO into the free border of the neighboring fimbria hippocampi (fimbrial taenia; note that the fimbria converges bilaterally into the septal hippocampal commissure, being thus contiguous to the SFO and hic). Once beyond the interventricular foramina, the fimbria tract forms the rim of the hippocampus and retains attached the telencephalic border of the chorioidal tela wing, thus called “fimbrial taenia,” which now participates in the so-called chorioidal fissure (the fimbrial taenia lies at its posterior border; Figure 19). The fissure extends with the fimbria all the way to the medial amygdala and then comes back toward the interventricular foramen, now inserting its anterior border along the topologically dorsal border of the evaginated prethalamic eminence (and similarly beyond the interventricular foramen, more caudally, along its non-evaginated dorsal border), thus reaching the prethalamus or p3 (Figure 19). The prethalamic eminence was mentioned above as a partly evaginated rostrodorsal part of the prethalamic alar plate which gets captured during evagination by the caudomedial wall of the hemisphere (like the chorioidal roof and the hypothalamo-amygdalar corridor; see Figures 7 and 19; this complex issue is treated by Villiger and Ludwig, 1946, as well as by Puelles, 2019; the readers can check the sequential human embryonic images of Bayer and Altman, 2004, 2006, 2008, keeping in mind the present prosomeric interpretation, in contrast to the authors’ own interpretations referring to the lamina affixa myth; see below).
In this way, each hemispheric chorioidal wing is present along the medial wall of the temporal horn of the lateral ventricle but connects dorsally via the foraminal roof with the median “roof body” component that extends along the dorsal midline from the septal SFO into the habenular commissure, with additional lateral insertions on the eminential and habenular taeniae (Figure 25; Puelles, 2019). The chorioidal fissure has a particularly long course in the human brain, where the amygdala is found at the temporal uncus (far from the interventricular foramen, where it begins).
The lateralized chorioidal fissure is an intrinsic part of the h1 roof, irrespective of its anomalous non-dorsomedian position (in fact, any chorioidal structure is by definition a part of the roof plate, irrespective of its morphogenetically deformed adult position; this implies that the bilateral chorioidal fissure wings must have been stretched morphogenetically during the unequal growth of the pallial telencephalon, a process that affects as well the neighboring attached roof and alar parts of the hypothalamus and prethalamus (Figure 19; discussed in Puelles, 2019; see also Puelles et al., 2019a regarding chorioidal vascularization). It may be surmised that at the start of telencephalic evagination the prospective amygdalar temporal pole area lay close to the future interventricular foramina and the caudal septum with related roof plate. Subsequent to hemispheric evagination the amygdalar primordium apparently was separated into the prospective temporal pole by differential pallial surface growth (drawing the attached chorioidal, eminential, and hypothalamic wings with it).
The two different histologic types of the hypothalamic roof (rostral neural septocommissural versus caudal chorioidal) do not correspond to the prosomeric h2 and h1 roof sectors, since the h2/h1 boundary lies just behind the anterior commissure, within the septum (Figures 20 and 25). The difference seems rather due to the distinction of subpallium (associated to the neural roof) versus pallium (associated via the hippocampus to chorioidal roof; see Figures 14D, E). We strictly do not know yet how this primary pallio-subpallial pattern is established (but see speculations in Puelles, 2017 and Puelles et al., 2019a, suggesting that the pallio-subpallial boundary is transversal -a deformed AP pattern- and thus orthogonal to the roof; that would be the reason why it reaches the roof between septum and cortical pallium; Figure 19). The mechanism that creates morphogenetically the curved chorioidal fissure of the lateral ventricle roof that ends at the amygdala (chf; Figure 19) is clearly a passive stretching consequence of the differential pallial growth process that creates the temporal lobe. Different mammalian species showing variable development of the temporal poles can be expected to show corresponding changes in this anatomic aspect, as we know happens in the extreme human case.
3.2.2 Diencephalic roof
As stated in the previous section, the telencephalic chorioidal roof continues caudally into the diencephalic chorioidal roof (Figure 12A), first covering the whole prethalamic prosomere (p3), and then extending into a rostral part (about three fourths in the human case, less in the mouse) of the thalamic roof (p2), down to the habenular commissure (see hbc in Figure 25). The thalamic (habenular) roof region caudal to this insertion is again neural, that is, non-chorioidal, and features rostrally the habenular commissure, followed by the stalked pineal gland or epiphysis, and ends with a small dorsomedian retrohabenular area next to the distinct pretectal roof (p1), marked by the posterior commissure and the underlying subcommissural organ (Figures 9 and 25).
The boundary between the telencephalic and diencephalic parts of the chorioidal tela is histologically unremarkable in mammals (some lizards have an accessory pallial commissure that marks it). This boundary should lie roughly just caudal to the laterally stretched chorioidal fissure that forms the roof of the interventricular foramen and extends until the amygdala. We may perhaps safely deduce that the posterior half of the chorioidal fissure (next to the fimbria) is telencephalic (or hypothalamic), while the anterior half of the chorioidal fissure with the alternative taenial insertion at the partly evaginated prethalamic eminence—eminential taenia (Figure 19)—may be judged to be diencephalic, unless the entire prethalamus is ascribed to the telencephalon/hypothalamus complex (a theoretical possibility consistent with some molecular evidence, but contradicted by some experimental data; see Lagutin et al., 2003; Albuixech-Crespo et al., 2017). This conceptual intrafissural limit can be projected tentatively into the chorioidal dorsal midline, probably not far from the subfornical organ and the interventricular foramen. It is unclear whether the median paraphysis gland, when it occurs (best developed in amphibia, and still present in sauropsids, but not evident in mammals), lies either in the telencephalic chorioidal tela or in the prethalamic one. I incline to ascribe it to the telencephalon. The prosomeric telodiencephalic limit obviously is an extension of the hypothalamo-diencephalic limit, that is h1/p3, since the telencephalon is actually a grossly deformed part of the alar hypothalamus (Figure 19).
This prosomeric thesis contrasts with the columnar viewpoint of Kuhlenbeck (1927, 1973) who places the dorsal telodiencephalic boundary at the chorioidal velum transversum (see below), understood as a dorsal transverse telodiencephalic chorioidal furrow postulated to extend laterocaudally around the hemisphere along the “sulcus hemisphericus” into a basal “torus hemisphericus” that contains the anterior commissure (remarkably, in the prosomeric model this actually means arching from roof into roof). As commented above (section 2.2.1), it is experimentally demonstrated in several vertebrate species that the anterior commissure lies across the anteriormost roof plate. The columnar “telodiencephalic limit” is accordingly wrong, particularly because it ascribes arbitrarily the hypothalamus to the diencephalon (due to disregard for the cephalic flexure of the brain axis) and implicitly admits that the telencephalon is a dorsal hypothalamic outgrowth and not an axial transverse part of the neural tube by tracing the telodiencephalic boundary from the roof velum transversum to the equally roof-belonging anterior commissure.
As regards neuromeric parts of the diencephalic roof, we have to consider the prethalamus (p3), the thalamus (p2) and the pretectum (p1). The prethalamic eminence (PThE; classically misconceived as “thalamic eminence”) is the dorsalmost part of the alar prethalamus (p3; see Puelles et al., 2021 and Figure 7), and it consequently is continuous dorsalward with the corresponding prethalamic chorioidal roof, which extends into the chorioidal fissure of the hemisphere (Figure 7). During the morphogenesis of the mammalian chorioidal fissure, rostral alar and roof portions of PThE result captured morphogenetically by the telencephalic evagination and the subsequent differential growth and rotation of the hemispheric temporal pole. A rostral flap of the PThE plus attached roof thus results evaginated through the caudal lip of the interventricular foramen into the medial wall of the hemisphere (Figures 7 and 19). The PThE accordingly bends lateralwards transforaminally to incorporate its primarily diencephalic alar and roof material to the caudomedial wall of the hemisphere, rostrally to the chorioidal fissure (Figures 7 and 19; this eminential evagination process can be followed in three section planes in the Bayer and Altman human brain developmental atlas—see Bayer and Altman’s, 2008, 2006 first trimester material stretching from gestation weeks GW3.8 to GW9). The caudal rest of the PThE remains in a standard unevaginated diencephalic position (though the literature does not interpret it consistently as prethalamic).
The descriptor “eminentia” refers to the ependyma-covered bulge formed at the place where the PThE bends at the back of the interventricular foramen into its evaginated part (PThE; Figures 7 and 19). Here, it protrudes markedly into the ventricular cavity and was wrongly thought to be the rostral end of the thalamic mass by the classics (thus was mistakenly called “thalamic eminence”). This cryptic dorsal alar diencephalic locus placed partly within the telencephalic medial wall, with rostrally evaginated and caudally non-evaginated parts, presents throughout along its anomalously placed dorsal border (depicted in Figure 19) the prethalamic taenial attachment of the forebrain chorioidal fissure. The stria medullaris tract courses longitudinally through the non-evaginated sector of the prethalamic eminence (this tract enters the PThE caudally to the interventricular foramen, collecting fibers coming from the hypothalamus, preoptic region, basal telencephalon, and septum, essentially from eminential neurons previously migrated tangentially into these regions; Alonso et al., 2020, 2021).
The old neuroanatomic literature was not aware of the distinct neuromeric nature of the prethalamus (p3) versus the more caudal thalamus prosomere (p2) (Figures 1B, 12B, 11A, and 7). Often, these territories were thought to be both “thalamic,” though at other times parts of the alar prethalamus—or the entire territory—were separated as “subthalamus” (we still see such wrong interpretations in the Swanson, 2004 and Dong, 2008 rodent brain atlases; see comments in Puelles et al., 2012a). It was thus widely believed (wrongly) that the thalamus contacts rostrally the telencephalic subpallium and pallium. This does not occur, since there is always some interposed part of the prethalamus, rostrally to the interthalamic zona limitans (see Figures 7 and 19 and next paragraph).
The evaginated flap of the prethalamic eminence found rostral to the chorioidal fissure (shown in Figure 19 and characterized molecularly in Figure 7) was historically nearly uniformly misinterpreted as the “lamina affixa,” a purported telencephalic chorioidal sheet adhered to the lateral thalamic surface (this myth was discussed in Puelles, 2019). Linked to this erroneous concept is the likewise wrong idea that the chorioidal tela of the chorioidal fissure attaches its non-fimbrial border to the stria terminalis area of the lateral ventricle bottom. The stria terminalis tract is actually a subpallial periventricular tract coursing next to the bottom of sulcus terminalis under the lateral ventricle ependyma (see legend of Figure 19). This sulcus actually represents a spike of Otx2-negative alar hypothalamic neuroepithelium captured as well during telencephalic evagination that extends as a hypothalamo-amygdalar corridor toward the amygdala (HyA; Figure 19). Via the sulcus terminalis, this hypothalamic spike or corridor separates distinctly the Otx2-positive basal ganglia (whose medial ganglionic eminence carries the stria terminalis tract largely within its diagonal subarea) from the likewise Otx2-positive evaginated eminential part of the caudomedial wall, running in parallel to the hypothalamo-prethalamic boundary. This myth of the lamina affixa fixed at the stria terminalis holds that the chorioidal attachment does not lie at the topological dorsal end of the evaginated PThE, but at an antecedent subpallial locus that putatively preceded adhesion of the medial telencephalic wall to the lateral diencephalic wall, thus creating the “lamina affixa.” But the chorioidal roof cannot be inserted at the subpallial stria terminalis, because we clearly see it is inserted from early embryonic stages onwards on the prethalamic eminence in all sorts of mammalian and non-mammalian embryos (Figure 7).
It seems that the classic authors up to Swanson, 2012 did not differentiate sufficiently the stria terminalis from the eminential (prethalamic) taenia, associated instead to the prethalamic stria medullaris tract (sm; Figure 24). This unrealistic “lamina affixa” theory (since neither the postulated thalamic adhesion nor the stria terminalis insertion was ever demonstrated) is now superseded by the more parsimonious theory of telencephalic evagination capturing caudomedially a flap of the prethalamic eminence, jointly with part the of dorsal alar hypothalamus that forms the hypothalamo-amygdalar corridor, and the associated fissural chorioidal roof plate (Figures 7 and 19). The correlative “diencephalic bulge” described in the bottom of the human lateral ventricle corresponds not to chorioidal tela affixed to thalamic pial surface, but to the ependymal ventricular surface of the evaginated PThE (“t” in Figure 19).
As regards the prethalamo-thalamic border at the chorioidal roof (p3/p2), the forebrain chorioidal roof shows transiently during development in most vertebrates a median transversal fold that historically was called “velum transversum” (von Kupffer, 1906; Ziehen, 1906). It was long supposed to mark the telo-diencephalic limit at the chorioidal roof (particularly by Kuhlenbeck, 1927, 1954, 1973). However, once we examine this fold in the thousands of sagittally sectioned mouse embryos of the Allen Developmental Mouse Brain Atlas (developingmouse.brain-map.org), keeping in mind the prethalamus lying in front of the thalamus, then we notice many favorable sections (particularly at E13.5) in which the velum transversum roof fold coincides precisely with the transverse p3/p2 interprosomeric boundary, marked along the alar plate by the cell-poor transverse interthalamic alar ridge known as zona limitans intrathalamica (zli; see Rendahl’s first graphic reconstruction of zli in Figure 3A; Rendahl, 1924; see zli in Figures 16 and 24).
The zli was alternatively identified classically as the “external medullary lamina” of the thalamus (or as the thalamic “reticular ridge” of Bayer and Altman; search for it in their rat brain atlas—Altman and Bayer, 1995—or in their atlas of the brain of late trimester human embryos—Bayer and Altman, 2006; plates 209A/C for GW7.5, 122C for GW8, and 57A/C for GW9. Note that, against the opinion of these authors, much molecular data attests that this interthalamic boundary has nothing to do with the origin of the reticular nucleus, which is actually a derivative of the rostralmost prethalamic alar AP microzone (see Puelles et al., 2021). The prethalamus is interpreted variously, either as “subthalamus,” or as “anterior thalamic region,” in these two beautifully illustrated but often incorrectly interpreted series of rat and human developing brain mappings. Both interpretations as “subthalamus” or as “anterior thalamus” are wrong; unfortunately, one has to approach these excellent plates with well-formed personal interpretive criteria, in order not to be confused. The zona limitans is usually not well interpreted, or even disregarded (i.e., shown without identification), by current columnar authors such as Altman and Bayer, 1995 or Swanson, 2004, 2012, 2018). This probably occurs because the evident transversality of this clear-cut interneuromeric landmark (see Figures 1A–4, 12B, 13B, 11, 16, 14, 7, 10, 17, and 24) disrupts objectively the columnar tenet of the longitudinal nature of the classic dorsal and ventral thalamic regions (realistically described in the prosomeric model as thalamus and prethalamus; since Puelles and Rubenstein, 2003). It may be assumed that columnar authors would prefer the zona limitans boundary to be longitudinal, though it manifestly is transversal, if the notochord and the basal plate are longitudinal (actually, the zona limitans intrathalamica distinctly points into the roof plate, specifically into the velum transversum; Figures 3A and 24). The prethalamus and thalamus separated by the zona limitans evidently are anteroposterior alar parts of two contacting neuromeres (Figure 7; see corroborating data from the GW4 and GW5 stages in Bayer and Altman, 2008).
In any case, the thalamic chorioidal roof proper (found behind the velum transversum; Figure 24) is attached bilaterally to the thalamic taenia, that is, the free dorsal border of the habenular alar thalamic area, aside of finishing at the median habenular commissure. The habenula is not an independent diencephalic column (epithalamus of columnar authors), irrespective of its true longitudinal nature (in which it rather resembles the hyperdorsal prethalamic eminence in p3), since it lies entirely within one prosomere—p2; columns are supposed to cross several pre-existent neuromeres (Kuhlenbeck, 1973). The habenular region is accordingly the dorsalmost subarea of the thalamic alar plate, which characteristically originates the retroflex or habenulo-interpeduncular tract (shown in Figure 24). The stria medullaris tract first courses through the PThE and a rostral part of the habenular region, before it crosses the thalamic roof at the habenular commissure, rostrally to the pineal stalk (the fibers crossing in this commissure interconnect phylogenetically old telencephalic areas). Curiously, this small commissure is not placed next to any interprosomeric boundary, but at the middle of one prosomere (Figure 25). The apex of the habenular area is formed by the median pineal gland or epiphysis protruding dorsally at the distal end of its stalk (Figure 25; note some vertebrates have lost this gland—though humans keep it—and others have a pineal eye associated to it—we lost that). The neurally structured median retrohabenular area mentioned above is a caudal microzonal part of this thalamic roof area that lies behind the pineal stalk, in front of the pretectum (p1).
The thalamic retrohabenular roof area limits caudally with the commissural pretectal roof (p1), represented by the so-called subcommissural organ (SCO; Figures 9 and 25), a circumventricular ependymal specialization found all along the length of the overlying posterior commissure; the thickened SCO neuroepithelium present in all vertebrates secretes into the ventricle a mucoproteic material with unknown function—the “fiber of Reissner.” Both the subcommissural organ and the posterior commissure start precisely at the thalamo-pretectal boundary (p2/p1) and end at the diencephalo-mesencephalic boundary (p1/m1), which are thus usually quite distinct. These landmarks thus represent important prosomeric boundary markers. If you detect the salient SCO/pc structure at the roof of your sections, you immediately know they pass through the pretectum. If such structure is not there in the roof you see, the section does not pass through the pretectum.
3.2.3 Midbrain roof
The midbrain roof is formed strictly by a median palisade of radial glial fibers belonging mainly to the large m1 prosomere, while the preisthmic m2 roof section is much smaller (Figures 10 and 17; it lies in front of the isthmic decussation of the trochlear nerve; see the “4n” tag just under the cerebellum in Figure 21). Alar m1 divides into four distinct AP alar midbrain domains, the rostral tectal gray, the intermediate and large superior colliculus, an intercalated small intercollicular area, and the caudally protruding inferior colliculus. Three commissures interconnecting these areas cross the corresponding m1 roof (the tectal-gray commissure and the intertectal commissure are practically continuous, as represented by “tect” in Figure 25, but they carry different packets of fibers; separately, more caudally, is the intercollicular commissure that interconnects the inferior colliculi; icoc; Figure 25). The tectal gray with its rostral commissure is treated inconsistently in the neuroanatomic literature, due to the columnar tradition to misinterpret it as a “posterior pretectal nucleus belonging to the midbrain” (I commented above this is actually impossible, due to developmental molecular antagonism, partly related to Pax6 regulation, whose expression is permanent in the pretectum, but not in the midbrain). As expected, the tectal gray is molecularly mesencephalic, Pax6-negative, representing a rostral AP alar microzone of m1 subtly different from the superior colliculus (see it differentially marked in Figure 2D in Puelles, 2022).
The neuromeric pretectum always posed a conceptual classificatory problem for columnar authors (this model does not admit neuromeres); surprisingly, the cited early embryonic human material of the Bayer and Altman (2008) atlas seems to admit (perhaps inadvertently) the neuromeric nature of the pretectum. The small m2 midbrain prosomere also has its own roof, of course, which is very small, thin, and undistinctive. It lies caudal to the inferior colliculus and rostral to the isthmic roof, the latter being marked by the decussation of the trochlear nerve (4n in Figure 21; not distinguished in Figure 25).
3.2.4 Hindbrain roof
The hindbrain roof is neurally structured within the rostral isthmic rhombomere (r0), as well as at its caudal end, next to the spinal cord (Figures 12A and 25); at both places, it shows a median radial glial palisade similar to the midbrain one (Ortega et al., 2021). The chorioidal roof portion jointly with its rhombic taenial lip covers most of the hindbrain (r0 down to r10 or r11). It is shaped as a rhombus (generating the “rhombencephalon” name for the hindbrain) and is limited taenially by the rhombic lip across the cited rhombomeres. The isthmic neural roof includes the cerebellar vermis—a caudal r0 derivative with the true roof glial palisade along its midline (see Figure 18B and Watson et al., 2017). The non-cerebellar isthmic rostral neural roof part (rostral to the vermal lingula) shows the decussation of the trochlear nerve, which emerges bilaterally at the dorsal alar surface of the isthmus (4n in Figure 21). The isthmic roof continues caudalwards with a similar median glial palisade structure observable with appropriate glial markers along the midline of the entire cerebellar vermis, ending at its nodulus part, where the transition into chorioidal roof occurs (see Ortega et al., 2021). The typical vermal cerebellar structure (with subpial cortex + inner nuclei) seems to participate in the cerebellar roof but actually belongs instead to the adjacent massive alar plate, like the rest of the cerebellum (there is also a massive cerebellar population of inner granule cells—about 70% of all neurons in the human brain—that derive from the transiently postnatally proliferating external granular layer; the latter is constituted by subpial precursors migrated tangentially over the cerebellar mass from the cerebellar rhombic lip (the border between alar and roof plates; see how the postmitotic granule cells migrate radially into the internal granular layer of the cerebellar cortex in Ramón y Cajal, 1909, 1929).
The true cerebellar roof is thus the cryptic median glial palisade. It is crossed inside the cerebellar white matter central mass by the so-called cerebellar commissure, which is actually a decussation of various afferent or efferent fiber bundles). Beyond the vermal nodule, the chorioidal roof extends from r0 into the caudal neural roof domain, possibly associated to the area postrema in r11, a circumventricular viscerosensory specialization (AP in Figure 25) and the solitary tract-related commissura infima (not shown). The large hindbrain chorioidal roof tela is expanded mediolaterally at middle length, shaped as a rhombus, and is limited by the rhombic lip taenia throughout. The rostral angle of the rhombic chorioidal tela is attached to the free border of the vermal nodulus (r0). The upper sides of the chorioidal rhombus are inserted upon the extensive r1 rhombic lip attached to the alar cerebellar hemisphere (deformed morphogenetically into a position lateral to the isthmic vermis, though it is topologically caudal to it; Figure 18B). The lateral angle of the rhombic chorioidal roof, or “cochlear angle,” is associated to the cochlear column along compressed r2–r6 portions (Figure 18B; compare Figure 9). The caudolateral sides of the rhombic chorioidal tela down to its caudal angle represent the insertions of the roof portions of the remaining medullary rhombomeres (r7–r11). The caudal r11 has a non-chorioidal neural roof part, where the dorsal midline is formed by the commissural portion of the solitary viscerosensory column (a right–left fusion of the caudal ends of these columns), as well as by commissural fibers of the solitary tracts in the so-called commissura infima (not shown in Figure 25; it lies caudal to AP). The exact rhombomeric ascription of these last elements has not been yet determined precisely.
3.2.5 Spinal cord roof
The roof plate of the entire spinal cord is represented by the median dorsal glial raphe that separates at the dorsal midline the left and right dorsal columns.
3.3 The acroterminal domain
This domain lies along the midline of the terminal hypothalamus and associated medial preoptic area that jointly form the rostral end of the brain. It stretches from the rostralmost roof (anterior commissure/septum) to the rostralmost floor (mamillary body; see Figures 4, 13B, 11, 14, 15A, 10, 17, 25, and 19). It is defined molecularly in the early embryonic mouse by Dlk1 expression (developingmouse.brain-map.org; Figures 13B, C). It divides into alar and basal subdomains, separated by the alar–basal boundary (Nkx2.2-positive longitudinal band and upper limit of basal Shh expression), which ends rostrally under the optic chiasma. The following description is based on Puelles et al. (2012a) and Puelles and Rubenstein (2015); see also Ferran et al. (2015) and Puelles (2017, 2018).
3.3.1 Alar acroterminal subdomain
The alar AT portion starts under the anterior commissure, described above as the rostralmost roof, and ends under the optic chiasma. We see first the lamina terminalis, which belongs to the rostromedian acroterminal preoptic area (a non-evaginated part of the telencephalic subpallium. The narrow, thin, and cell poor lamina terminalis displays a median acroterminal nucleus ending in front of the anterior commissure, called the median preoptic nucleus. This preoptic lamina ends at a slightly thicker locus just above the optic chiasma, where the circumventricular organum vasculosum of the lamina terminalis is found (OVLT; Figures 15A and 25). This organ senses the osmotic density of the blood plasma in its blood capillaries and collaborates in this role with the subfornical organ in the septocommissural roof plate (SFO; Figure 25). This OVLT locus correlates topographically with the dorsoventrally compressed rostral end of the alar paraventricular hypothalamic area, which underlies the preoptic area (Figures 15B–D and 17). The optic chiasma—the large-scale decussation of the optic nerves carrying retinal efferents that enter the optic tract—coincides with the rostral acroterminal end of the ventralmost alar hypothalamic area, renamed subparaventricular area by Puelles et al. (2012a); its acroterminal portion is characterized by the presence of the retinorecipient suprachiasmatic nucleus (SCH; Figures 15A and 17; using the prosomeric axis, its topography is not “suprachiasmatic” but rather retrochiasmatic). The chiasma relates ventralwards with the supra- or postoptic decussations (classic names redolent of the obsolete columnar axial conception, since all the different decussating strands are “suboptic” in prosomeric coordinates). The molecular alar–basal boundary, marked by basal Shh and Nkx2.1 signals, and the rostral end of the alar–basal limiting Nkx2.2 band (Figures 12B and 16), apparently reaches the acroterminal domain under the postoptic decussations, separating them from the classic tuber cinereum (Latin for “gray prominence”), which is the uppermost part of the basal tuberoinfundibular area, also known as retrochiasmatic or anterobasal area.
3.3.2 Basal acroterminal subdomain
The basal AT territory is composed of three superposed regions above the h2 floor: the tuberoinfundibular, perimamillary, and mamillary regions (the first one being subdivided, Figure 15C), which represent jointly the dorsoventrally enlarged rostralmost part of the brain basal plate (Figures 12B, 15C, 20, 10, and 17). The large tuberoinfundibular sector starts dorsally under the postoptic decussations with a dorsal tuberal subregion (TuD) characterized at the rostral midline by the anterobasal area (Puelles et al., 2012a), classically known as retrochiasmatic area or tuber cinereum. The anterobasal AT area is shaped as a median horseshoe-shaped anterobasal nucleus (Abas; with wings pointed caudalwards) representing the earliest born and rostralmost basal neuronal population in the hypothalamus (see Puelles et al., 1987; Amat et al., 2022; Figure 1B); its scarcely studied neurons generate an ipsilaterally descending tract of unknown destiny (unpublished observations in collaboration with S. Easter). Other anterobasal cells migrate ventralwards into the underlying intermediate tuberal subdivision and participate in diverse nuclear formations (particularly in the ventromedial nucleus; López-González and Puelles, 2023; possibly also in the arcuate nucleus). Ventral to the acroterminal TuD there appears a larger intermediate tuberal subregion (TuI) encompassing the median eminence (with its acroterminal arcuate nucleus) and the infundibulum with its distal neurohypophysis (Figure 15C). At the ventral end of the tuberal region, there is a third thin ventral tuberal subregion (TuV), corresponding to the classic tuberomamillary area. This displays at its rostral AT subregion a median ventricular recess or diverticule (termed saccular diverticule by Retzius, 1896), which may represent the rostral end of the longitudinal hypothalamic circumventricular organ lying along the TuV (HVO; Figure 25), a possible local secondary organiser (Puelles, 2017; see also Puelles et al., 2012a). The TuV is in addition the neuroepithelial locus where the brain population of tuberomamillary histaminergic neurons is produced (only source of such neurons; some of them migrate from there into the neighboring mamillary and retromamillary regions). The superficial acroterminal part of the TuV domain is the definitive locus of the migrated ventral premamillary nucleus (PMV), whose neurons originate at the retromamillary area in h1 (López-González et al., 2021).
Under the TuV we have next the perimamillary/periretromamillary basal hypothalamic longitudinal area, which also ends at the AT domain (PM/PRM; Figures 15B, D, and 17). The terminal PM derivative of h2 is the dorsal premamillary nucleus (PMD), which is less voluminous than its caudal PRM h1 companion (Figures 15B–D and 17). The conventional “ventral” and “dorsal” descriptors of the two classical premamillary nuclei (PMV, PMD) unfortunately refer to the irreal columnar axis and happen to be absolutely self-contradictory when examined within the prosomeric axial assumptions, given that the PMD within PM lies strictly ventral to the migrated PMV within TuV, and its origin lies rostral to the retromamillary origin of PMV. Moreover, their unification within the concept “premamillary nuclei” is also contradictory with their similar prosomeric “supramamillary” position. Obviously, a name change is needed (Puelles, 2019), which we have not proposed so far, but would like to consider tentatively here, namely, (1) the PMD might retain the name perimamillary nucleus (PM), since it is the only known derivative of the PM domain, and the description fits its close relationship with the mamillary nucleus, and (2) the PMV might be named ovoid tuberomamillary nucleus (OvTM), which agrees both with its aspect and adult location. Both new terms avoid referring to the axis to eschew the present confuse semantic situation. Note the PM is a radial derivative of the PM domain in h2, whereas the OvTM is a tangentially migrated derivative of the RM area in h1 (Puelles et al., 2012a; López-González et al., 2021; see also Puelles and Nieuwenhuys, 2024).
The basal mamillary area forms the third basal hypothalamic h2 complex with its caudal neighbor the retromamillary area (RM; Figures 15B–D and 17). It also forms the rostral acroterminal end of the basal hypothalamus, ventrally to the tuberoinfundibular region, and immediately dorsal to the hypothalamic mamillary floor sector (Figures 12D and 8A). The mamillary pouch shows an acroterminal rostral aspect formed by an indistinct thin median mamillary neuroepithelial membrane under the tuberomamillary area (MnM in Figures 13B, C, and 15A) and in ventral continuity with the mamillary median floor, which is somewhat thicker (Figures 4, 12D, 14, 15A–C, 20, 8A, 10, and 17). The mamillary area is itself subdivided into the conventional medial and lateral mamillary nuclei, the origin of the mamillotegmental and mammillothalamic tracts (the medial mamillary nucleus is subdivided into mediomedial and mediolateral parts).
4 Longitudinal and transversal tracts
Axonal navigation patterns have been studied so far only partially with modern molecular and experimental mapping methods. Despite many advances, there is as yet no general theory of axonal circulation (navigation) through the brain, which means that most axonal courses remain so far unexplained, particularly within the columnar model. The specific literature comments extensively on the origin and targets of the fibers tracts and collaterals, touching eventually their synaptic patterns, but rarely deals with their overall morphologic topology (how are they disposed in the brain), a feature which nevertheless is strongly conservative evolutionarily (implying it is genomically regulated). In any case, it is remarkable that, once axonal trajectories are mapped using the prosomeric model, it becomes apparent that most axonal courses can be classified into either longitudinal or transversal stretches. Often tracts change their spatial orientation in topological angles of 90° at specific neuromeric decision points (e.g., the cerebral peduncle, or the fornix tract; Figure 20), or give out collaterals orthogonally to the main axonal course (e.g., the corticopontine collaterals out of the pyramidal tract). Given that the prosomeric model postulates a non-Cartesian checker-board pattern of transverse and longitudinal limits of the various FMUs (Figures 22–17; FMU = fundamental morphogenetic units of Nieuwenhuys and Puelles, 2016 and Nieuwenhuys, 2017), and the latter are held to be differentially patterned molecularly due to the previous action of intercrossed anteroposterior and dorsoventral gradiental position-coding molecular mechanisms, it is well possible that the observed preferential navigation, encompassing permissive or non-permissive restrictions, attractions and repellences, and/or decision points affecting the axonal growth cones during navigation likewise relate to the signaling framework of early patterning processes, thus explaining the close relationships of the tracts with prosomeric borders (e.g., see Puelles, 2022 on the optic tract, and Ferran and Puelles, 2024 on the habenulo-interpeduncular tract).
When neuromeres were first studied with neurofibrillary stains (e.g., Orr, 1887; Tello, 1923, 1934), it was an early impression that early axons tended to fasciculate along the transverse interneuromeric boundaries (aggregating into dorsoventral courses along the superficial constrictions). However, in most cases this has turned out to be a false impression. The fibers actually aggregate in front or behind the interneuromeric limits, and it is only the bulging of adjacent neuromeres what tends to compress the separate axonal aggregates into the limiting constriction. In the adult brain, many transverse tracts indeed tend to aggregate parallel (tangent, adjacent, or near) to interneuromeric boundaries, without being properly at the boundaries. Some clear-cut examples are the posterior commissure next to the p1/m1 limit (Figure 19), the retroflex tract next to the p2/p1 limit (Figure 19), the cerebral peduncle next to the h1/p3 limit (Figure 20), and the fornix tract next to the h2/h1 limit (Figure 20). Similarly, longitudinal tracts may grow at specific dorsoventral positions along the alar or basal plates (e.g., the optic tract, Puelles, 2022, or the longitudinal stria medullaris and mamillotegmental tracts in Figure 19), possibly reading the fine DV molecular microzonal subdivisions, without coursing precisely at their longitudinal boundaries. Many longitudinal tracts thus lie close and parallel to the nearest primary dorsoventral boundaries (roof/alar, alar/basal, basal/floor). They practically never can be said to run along the limits themselves. Oblique axonal courses are extremely rare, but some examples do exist (e.g., the crossed fibers from the pontine basilar nuclei in r3–r4 as they approach the cerebellum in r1 obliquely via r2; Figure 18A; another example is represented by the mamillo-thalamic collaterals of the longitudinal basal mamillo-tegmental tract, which emerge at h1 level from the convexity of the princeps tract and proceed obliquely upwards across basal p3 into alar p2, to reach finally the anterior thalamic complex; this very oblique course [h1-p3-p2] may be exposed to singular signaling conditions generated by the intercalated zona limitans intrathalamica organiser, p3/p2, whose basis expands roughly parallel to the initial oblique course of this tract).
The tracts thus generally represent a very important set of orderly landmarks for neuroanatomic orientation within the prosomeric model, while they seem to be rather chaotically distributed within the alternative, non-causally underpinned columnar model (e.g., the stria medullaris, optic and mamillo-tegmental tracts are clearly longitudinal in prosomeric interpretation (and parallel to each other), whereas by columnar interpretation all three are initially transverse ventral diencephalic tracts that turn into oblique and then longitudinal courses as they advance “dorsalwards;” no columnar morphologist has commented on such odd behavior).
The mixed hindbrain cranial nerves carrying various sensory components plus branchiomotor and preganglionic efferents (trigeminus, facial, glossopharyngeal, vagus, and accessory nerves) as a rule have their alar plate roots at the paired rhombomeres (r2, r4, r6, etc.; their components generated at the odd rhombomeres navigate into the paired roots). This feature is important for guiding our identification of rhombomeric regions in sections. The spinal mixed nerves are characteristic of each single myelomere, excepting the my1 unit, which is devoid of a nerve. On the other hand, purely sensory or purely somatomotor cranial nerves do not seem to follow any particular rule as regards their neuromeric exit or entrance loci, though the purely sensory ones (cochlear and vestibular nerves) enter through the alar plate, while the somatomotor ones (oculomotor, abducens and hypoglossal nerves) exit through the basal plate, with exception of the trochlear nerve, which exits via the isthmic alar plate after its roof decussation.
5 Prosomeric patterns of vascularization
Puelles et al. (2019c) studied general patterns of early vascular invasion in the early developing mouse neural tube in correlation with molecularly labeled prosomeric AP or DV subdivisions (neuromeres and primary alar and basal plates). Note that we had previously obtained data on the temporal and spatial patterns of neurogenesis in the chick, a lizard, and the rat (Puelles et al., 1987, 2015; review in Amat et al., 2022). Since the earliest neurons are born in the basal plate (see Figure 1B), we initially expected that the earliest radial vascular penetration coming from the pre-existent perineural vascular network would occur at the basal plate (early vessels wait at the brain surface for a while without penetrating, apparently attending an attracting signal supposedly released by differentiating neurons). Surprisingly, the earliest penetrant blood vessels were found to enter selectively the alar plate, essentially in forebrain and hindbrain areas largely poor in differentiating neurons (Figure 1B). This suggests that at least the earliest vascular invasion may be demanded more by the degree of proliferative activity of the neuroepithelium (higher in the alar plate) than by the rhythm of neurogenesis (higher in the basal plate).
Such alar vascular invasion was heterochronic in neighboring neuromeres (for instance, the alar thalamus, p2, was distinctly retarded in this aspect relative to both the alar prethalamus, p3, and the alar pretectum, p1). We concluded that the neural vascular-attracting signal was possibly released as a particular proliferative or maturation state was reached, which occurred heterochronically in the different prosomeres according to their differential molecular profiles and consequent local proliferative profiles, largely irrespective of the ongoing neurogenetic mechanism. At a later stage, blood vessels also started to enter the basal plate, possibly demanded now by neuronal nutritional needs. A particular series of radially penetrating branches penetrate the floor plate in a segmentally redundant pattern (Figures 23A, B; see also Scremin and Holschneider, 2012; Scremin, 2015); Figure 9 shows some of these floor-related blood vessels -unlabeled- penetrating radially rhombomeres r5 and r6. Each neuromere thus seems to receive separate and heterochronic irrigating vessels targeting specifically its alar, basal, and floor FMUs. The existence of particular well-known adult chorioidal vessels serving discretely the diverse chorioidal plexi across different forebrain and hindbrain neuromeres suggests that the roof plate domains possibly also use their unique AP and DV molecular profiles to attract their own irrigation. An overall summary map of these preliminary forebrain results mapped topologically upon the prosomeric model is presented in Figure 23B (see other details in the Puelles et al., 2019c report).
6 Conclusion
The present summary of morphologic definitions, assumptions, explanations, and practical applications of the prosomeric model ends here. The notions provided apply to all vertebrates (not so chordates) but have been treated here with special attention to mammals. I have presented essentially what we now call “the updated prosomeric model” of Puelles et al. (2012a), as we use it now, providing insights on several of the modifications we introduced gradually compared with the early version of Puelles and Rubenstein (1993) and Rubenstein et al. (1994), or the subsequent partly modified version of Puelles and Rubenstein (2003). These decisions resolved problems arising from novel data or interpretations, increasing the consistency and explanatory power of the model. Some colleagues have expressed privately discontent that we periodically change the model, perhaps thinking we do it arbitrarily, rather than moved by cogent scientific reasons. In general, we noticed our errors before others did, perhaps because we expected they might exist, due to the complexity of the system and the difficulty in attending to all the details, even in being aware of them (which often was not the case; one sees what one expects). Anyhow, we think it was our duty to change stepwise the details of the model that turned out to be somehow perfectible, while keeping invariable the scientific program. These changes uniformly made the model stronger and more consistent, which is the purpose of a model, rather than to become a blinding invariant dogma that blocks progress (as has happened in the long run with the columnar model). We appeal to reason, not to faith. Further errors or better interpretations may be reported anytime by other researchers, and we will be happy to acknowledge opportune criticisms with convenient changes. We thus intend to continue updating the model as needed, as long as we can, and therefore I always recommend using the most recent version, as we all do with computer software.
Author contributions
LP: Conceptualization, Visualization, Writing – original draft, Writing – review & editing.
Funding
The author(s) declare financial support was received for the research, authorship, and/or publication of this article. This research was funded by the SENECA Foundation (Autonomous Community of Murcia) by research grant 21925/PI/22 to E.García-Calero.
Acknowledgments
The institutional support of the Univ. of Murcia to LP (emeritus professor) is appreciated.
Conflict of interest
The author declares that the research was conducted in the absence of any commercial or financial relationships that could be construed as a potential conflict of interest.
The author(s) declared that they were an editorial board member of Frontiers, at the time of submission. This had no impact on the peer review process and the final decision.
Publisher’s note
All claims expressed in this article are solely those of the authors and do not necessarily represent those of their affiliated organizations, or those of the publisher, the editors and the reviewers. Any product that may be evaluated in this article, or claim that may be made by its manufacturer, is not guaranteed or endorsed by the publisher.
References
Albuixech-Crespo B., López-Blanch L., Burguera D., Maeso I., Sánchez-Arrones L., Moreno-Bravo J. A., et al. (2017). Molecular regionalization of the developing amphioxus neural tube challenges major partitions of the vertebrate brain. PloS Biol. 15, e2001573. doi: 10.1371/journal.pbio.2001573
Alonso A., Merchán P., Sandoval J. E., Sánchez-Arrones L., García-Cazorla A., Artuch R., et al. (2012). Development of the serotonergic cells in murine raphe nuclei and their relations with rhombomeric domains. Brain Struct. Funct. 218, 1229–1277. doi: 10.1007/s00429-012-0456-8
Alonso A., Trujillo C. M., Puelles L. (2020). Longitudinal developmental analysis of prethalamic eminence derivatives in the chick by mapping of Tbr1 in situ expression. Brain Struct. Funct. 225, 481–510. doi: 10.1007/s00429-019-02015-3
Alonso A., Trujillo C. M., Puelles L. (2021). Quail-chick grafting experiments corroborate that Tbr1-positive eminential prethalamic neurons migrate along three streams into hypothalamus, subpallium and septocommissural areas. Brain Struct. Funct 226, 759–785. doi: 10.1007/s00429-020-02206-3
Altman J., Bayer S. A. (1995). Atlas of prenatal rat brain development (Boca Ratón, Florida: CRC Press).
Amat J. A. (1986). “Compartimentación y dinámica neurogenética del tubo neural del embrión de pollo,” in Manifestación heterocrónica del plan estructural del neuroeje. Doctorado en Medicina (Murcia: Univ. of Murcia).
Amat J. A., Martínez-de-la-Torre M., Trujillo C. M. A., Fernández B., Puelles L. (2022). Neurogenetic heterochrony in chick, lizard and rat mapped with wholemount AChE and the prosomeric model. Brain Behav. Evol. 97, 48–82. doi: 10.1159/000524216
Andreu-Cervera A., Anselme I., Karam A., Laclef C., Catala M., Schneider-Maunoury S. (2019). The ciliopathy gene Ftm/Rpgrip1l controls mouse forebrain patterning via region-specific modulation of Hedgehog/Gli signaling. J. Neurosci. 39, 2398–22415. doi: 10.1523/JNEUROSCI.2199-18.2019
Aroca P., Lorente-Cánovas B., Mateos F. R., Puelles L. (2006). Locus coeruleus neurons originate in alar rhombomere 1 and migrate into the basal plate: studies in chick and mouse embryos. J. Comp. Neurol.; 496, 802–818. doi: 10.1002/(ISSN)1096-9861
Aroca P., Puelles L. (2005). Postulated boundaries and differential fate in the developing rostral hindbrain. Brain Res. Rev. 49, 179–190. doi: 10.1016/j.brainresrev.2004.12.031
Bayer S. A., Altman J. (2004). The human brain during the third trimester (Boca Raton, Florida: CRC Press).
Bayer S. A., Altman J. (2006). The human brain during the second trimester (Boca Raton, Florida: CRC Press).
Bayer S. A., Altman J. (2008). The human brain during the late first trimester (Boca Raton, Florida: CRC Press).
Bergquist H. (1932). Zur Morphologie des Zwischenhirns bei Niederen Wirbeltieren. Acta Zool 13, 52–304 + 23. doi: 10.1111/j.1463-6395.1932.tb00485.x
Bergquist H., Källén B. (1954). Notes on the early histogenesis and morphogenesis of the central nervous system in vertebrates. J. Comp. Neurol. 100, 627–659. doi: 10.1002/cne.901000308
Bulfone A., Puelles L., Porteus M. H., Frohman M. A., Martin G. R., Rubenstein J. L. R. (1993). Spatially restricted expression of Dlx-1, Dlx-2 (Tes-1), Gbx-2 and Wnt-3 in the embryonic day 12.5 mouse forebrain defines potential transverse and longitudinal segmental boundaries. J. Neurosci. 13, 3155–3172. doi: 10.1523/JNEUROSCI.13-07-03155.1993
Bulfone A., Smiga S. M., Shimamura K., Peterson A., Puelles L., Rubenstein J. L. R. (1995). T-Brain-1 (Tbr-1): A homologue of Brachyury whose expression defines molecularly distinct domains within the cerebral cortex. Neuron 15, 63–78. doi: 10.1016/0896-6273(95)90065-9
Cambronero F., Puelles L. (2000). Rostrocaudal nuclear relationships in the avian medulla oblongata: Fate-map with quail-chick chimeras. J. Comp. Neurol. 427, 522–545. doi: 10.1002/(ISSN)1096-9861
Carsten M. H. (2024). “The embryologic basis of craniofacial structure,” in Developmental anatomy, evolutionary design, and clinical applications, vol. I, II. (Springer, Berlin).
Cobos I., Shimamura K., Rubenstein J. L. R., Martínez S., Puelles L. (2001). Fate map of the avian anterior forebrain at the 4-somite stage, based on the analysis of quail-chick chimeras. Devel Biol. 239, 46–67. doi: 10.1006/dbio.2001.0423
Coggeshall R. E. (1964). A study of diencephalic development in the albino rat. J. Comp. Neurol. 122, 241–270. doi: 10.1002/cne.901220208
Dalcq A. (1947). Recent experimental contributions to brain morphogenesis in amphibians. Growth Symp. 6, 85.
Díaz C., Puelles L. (2020). Developmental genes and malformations in the hypothalamus. Front. Neuroanat 14, 1–28. doi: 10.3389/fnana.2020.607111
Díaz C., Rubenstein J., Puelles L. (2023). Dorsoventral arrangement of lateral hypothalamus populations in the mouse hypothalamus: a prosomeric genoarchitectonic analysis. Mol. Neurobiol. 60, 687–731. doi: 10.1007/s12035-022-03043-7
Di Bonito M. A., Studer M., Puelles L. (2017). Nuclear derivatives and axonal projections originating from rhombomere 4 in the mouse hindbrain. Brain Structure Funct. 222, 3509–3542. doi: 10.1007/s00429-017-1416-0
Dong H. W. (2008). “Allen reference atlas,” in A digital color brain atlas of the C57BL/6J male mouse (John Wiley and Sons, New York), ISBN: 978-0-470-05408-6.
Eagleson G. W., Ferreiro B., Harris W. A. (1995). Fate of the anterior neural ridge and the morphogenesis of the Xenopus forebrain. J. Neurobiol. 28, 146–158. doi: 10.1002/neu.480280203
Eagleson G. W., Harris W. A. (1990). Mapping of the presumptive brain regions in the neural plate of Xenopus laevis. J. Neurobiol. 21, 427–440. doi: 10.1002/neu.480210305
Ferran J. L., Dutra de Oliveira E., Sánchez-Arrones L., Sandoval J. E., Martínez-de-la-Torre M., Puelles L. (2009). Genoarchitectonic profile of developing nuclear groups in the chicken pretectum. J. Comp. Neurol. 517, 405–451. doi: 10.1002/cne.22115
Ferran J. L., Irimia M., Puelles L. (2022). Is there a prechordal region in amphioxus? Brain Behav. Evo. 96, 334–352. doi: 10.1159/000521966
Ferran J. L., Puelles L. (2024). Atypical course of the habenulo-interpeduncular tract in the chick. J. Comp. Neurol. 532, e25646. doi: 10.1002/cne.25646
Ferran J. L., Puelles L., Rubenstein J. L. R. (2015). Molecular codes defining rostrocaudal domains in the embryonic mouse hypothalamus. Front. Neuroanat. doi: 10.3389/fnana.2015.00046. In: Alvarez-Bolado G., Grinevich V., Puelles L., (eds) Development of the Hypothalamus. (Lausanne: Frontiers Media). 9, 46. doi: 10.3389/978-2-88919-634-0
Ferran J. L., Sánchez-Arrones L., Bardet S. M., Sandoval J., Martínez-de-la-Torre M., Puelles L. (2008). Early pretectal gene expression pattern shows a conserved anteroposterior tripartition in mouse and chicken. Brain Res. Bull. 75, 295–298. doi: 10.1016/j.brainresbull.2007.10.039
Ferran J. L., Sánchez-Arrones L., Sandoval J. E., Puelles L. (2007). A model of early molecular regionalization in the chicken embryonic pretectum. J. Comp. Neurol. 505, 379–403. doi: 10.1002/cne.21493
Flames N., Pla R., Gelman D. M., Rubenstein J. L. R., Puelles L., Marín O. (2007). Delineation of multiple subpallial progenitor domains by the combinatorial expression of transcriptional codes. J. Neurosci. 27, 9682–9695. doi: 10.1523/JNEUROSCI.2750-07.2007
García-Calero E., Fernández-Garre P., Martínez S., Puelles L. (2008). Early mamillary pouch specification in the course of prechordal ventralization of the forebrain tegmentum. Devel Biol. 320, 366–377. doi: 10.1016/j.ydbio.2008.05.545
García-Calero E., López-González L., Martínez-de-la-Torre M., Fan C.-M., Puelles L. (2021). Sim1-expressing cells illuminate the origin and course of migration of the nucleus of the lateral olfactory tract in the mouse amygdala. Brain Struct. Funct. 226, 519–562. doi: 10.1007/s00429-020-02197-1
García-Calero E., Martínez-de-la-Torre M., Puelles L. (2020). A radial histogenetic model of the mouse pallial amygdala. Brain Struct. Funct. 225, 1921–1956. doi: 10.1007/s00429-020-02097-4
García-Calero E., Puelles L. (2020). Histogenetic radial models as aids to understanding complex brain structures: the amygdalar radial model as a recent example. Front. Neuroanat 14. doi: 10.3389/fnana.2020.590011
García-Calero E., Puelles L. (2021). Lhx9 gene expression during development of the mouse anterior amygdalar radial unit. Brain Struct. Funct. 226, 576–600. doi: 10.1007/s00429-020-02201-8
García-Guillén I. M., Martínez-de-la-Torre M., Puelles L., Aroca P., Marín F. (2021). Molecular segmentation of the sensory trigeminal nucleus in the adult mouse brain. Front. Neuroanat 15. doi: 10.3389/fnana.2021.785840
Gribnau A. A. M., Geijsberts L. G. M. (1985). Morphogenesis of the brain in staged Rhesus monkey embryos. Adv. Anat Embryol Cell Biol. 91, 1–69.
Herrick C. J. (1910). The morphology of the forebrain in amphibia and reptilia. J. Comp. Neurol. 20, 413–547. doi: 10.1002/cne.920200502
Hidalgo-Sánchez M., Andreu-Cervera A., Villa-Carballar S., Echevarria D. (2022). An update on the molecular mechanism of the vertebrate isthmic organizer development in the context of the neuromeric model. Front. Neuroanat 16. doi: 10.3389/fnana.2022.826976
Hidalgo-Sánchez M., Martínez-de-la-Torre M., Alvarado-Mallart R. M., Puelles L. (2005). Distinct pre-isthmic domain, defined by overlap of Otx2 and Pax2 expression domains in the chicken caudal midbrain. J. Comp. Neurol. 483, 17–29. doi: 10.1002/cne.20402
His W. (1895). Die anatomische nomenclatur. Nomina Anatomica. Neurologie. Suppl. Arch. EntwGesch 1893, 384–424.
His W. (1904). Die Entwicklung des Menschliches Gehirns Während der Ersten Monaten (Leipzig: Hirzel).
Hutchings C., Nuriel Y., Lazar D., Kohl A., Muir E., Genin O., et al. (2024). Hindbrain boundaries as niches of neural progenitor and stem cells regulated by the extracellular matrix proteoglycan chondroitin sulphate. Development 151, dev201934. doi: 10.1242/dev.201934
Inoue T., Nakamura S., Osumi N. (2000). Fate mapping of the mouse prosencephalic neural plate. Dev. Biol. 219, 373–383. doi: 10.1006/dbio.2000.9616
Jacobson C. O. (1959). The localization of the presumptive cerebral regions in the neural plate of the axolotl larva. J. Embryol Exp. Morphol 7, 1–21. doi: 10.1242/dev.7.1.1
Ju M. J., Aroca P., Puelles L., Redies C. (2004). Molecular profiling indicates avian branchiomotor nuclei invade the hindbrain alar plate. Neuroscience 128, 785–796. doi: 10.1016/j.neuroscience.2004.06.063
Keyser A. (1972). The development of the diencephalon of the Chinese hamster. An investigation of the validity of the criteria of subdivision of the brain. Acta Anat Suppl 59, 1–178.
Kuhlenbeck H. (1927). Vorlesungen über das Zentralnervensystem der Wirbeltiere (Jena: Gustav Fischer).
Kuhlenbeck H. (1954). The human diencephalon. A summary of development, structure, function, and pathology (Basel: S.Karger).
Kuhlenbeck H. (1973). “The central nervous system of vertebrates,” in Part II: overall morphologic pattern, vol. 3. (S.Karger, Basel).
Lagutin O. V., Zhu C. C., Kobayashi D., Topczewski J., Shimamura K., Puelles L., et al. (2003). Six3 repression of Wnt signaling in the anterior neuroectoderm is essential for vertebrate forebrain development. Genes Devel; 17, 368–379. doi: 10.1101/gad.1059403
Lim T. M., Jaques K. F., Stern C. D., Keynes R. J. (1991). An evaluation of myelomeres and segmentation of the chick embryo spinal cord. Development 113, 227–238. doi: 10.1242/dev.113.1.227
Locy W. A. (1895). Contribution to the structure and development of the vertebrate head. J. Morphol 4, 497–594. doi: 10.1002/jmor.1050110302
López-González L., Alonso A., García-Calero E., de Puelles E., Puelles L. (2021). Tangential intrahypothalamic migration of the mouse ventral premamillary nucleus depends on Fgf8 signaling. Front. Cell Dev. Biol. 9, 676121. doi: 10.3389/fcell.2021.676121
López-González L., Puelles L. (2023). Populational heterogeneity and partial migratory origin of the ventromedial hypothalamic nucleus: genoarchitectonic analysis in the mouse. Brain Struct. Funct. 228, 537–576. doi: 10.1007/s00429-022-02601-y
Lorente-Cánovas B., Marín F., Corral-San-Miguel R., Hidalgo-Sánchez M., Ferran J. L., Puelles L., et al. (2012). Multiple origins, migratory paths and molecular profiles of cells populating the avian interpeduncular nucleus. Devel Biol. 361, 12–26. doi: 10.1016/j.ydbio.2011.09.032
Marín F., Aroca P., Puelles L. (2008). Hox gene colinear expression in the avian medulla oblongata is correlated with pseudorhombomeric domains. Devel Biol. 323, 230–247. doi: 10.1016/j.ydbio.2008.08.017
Marín F., Puelles L. (1995). Morphological fate of rhombomeres in quail/chick chimeras: a segmental analysis of hindbrain nuclei. Eur. J. Neurosci. 7, 1714–1748.
Martínez-de-la-Torre M., Lambertos A., Peñafiel R., Puelles L. (2018). An exercise in brain genoarchitectonics: Analysis of AZIN2-LacZ expressing neuronal populations in the mouse hindbrain. J. Neurosci. Res. 96, 1490–1517. doi: 10.1002/jnr.24053
Martínez-de-la-Torre M., Pombal M. A., Puelles L. (2011). Distal-less-like protein distribution in the larval lamprey forebrain. Neuroscience 178, 270–284. doi: 10.1016/j.neuroscience.2010.12.030
Mathis L., Nicolas J. F. (2000a). Different clonal dispersion in the rostral and caudal mouse central nervous system. Development 127, 1277–1290. doi: 10.1242/dev.127.6.1277
Mathis L., Nicolas J. F. (2000b). Clonal organization in the postnatal mouse central nervous system is prefigured in the embryonic neuroepithelium. Devel Biol. 219, 277–281. doi: 10.1002/1097-0177(2000)9999:9999<::AID-DVDY1042>3.3.CO;2-C
McClure C. F. W. (1890). The segmentation of the primitive vertebrate brain. J. Morphol 4, 35–56. doi: 10.1002/jmor.1050040104
Neal H. V. (1898). The segmentation of the nervous system in Squalus acanthias. Bull. Mus Comp. Zool Harvard Coll. 31, 148–294.
Nieuwenhuys R. (2017). Principles of current vertebrate neuromorphology. Brain Behav. Evol. 90, 117–130. doi: 10.1159/000460237
Orr H. (1887). Contribution to the embryology of the lizard, with special reference to the central nervous system and some organs of the head, together with observations on the origin of vertebrates. J. Morphol 1, 311–372. doi: 10.1002/jmor.1050010204
Ortega F., Gomez-Villafuertes R., Benito-León M., Martínez de la Torre M., Olivos-Oré L. A., Arribas-Blazquez M., et al. (2021). Salient brain entities labelled in P2rx7-EGFP reporter mouse embryos include the septum, roof plate glial specializations and circumventricular ependymal organs. Brain Struct. Funct. 226, 715–741. doi: 10.1007/s00429-020-02204-5
Palmgren A. (1921). Embryological and morphologic studies on the midbrain and cerebellum of vertebrates. Acta Zool 2, 1–94. doi: 10.1111/j.1463-6395.1921.tb00464.x
Peretz Y. P., Eren N., Kohl A., Hen K., Yaniv K., Weisinger K., et al. (2016). A new role of hindbrain boundaries as pools of neural stem/progenitor cells regulated by Sox2. BMC Biol. 14, 1–20. doi: 10.1186/s12915-016-0277-y
Pombal M. A., Megías M., Bardet S. M., Puelles L. (2009). New and old thoughts on the segmental organization of the forebrain in lampreys. Brain Behav. Evol. 74, 7–19. doi: 10.1159/000229009
Pombal M. A., Puelles L. (1999). A prosomeric map of the lamprey forebrain based on calretinin immunocytochemistry, Nissl stain and ancillary markers. J. Comp. Neurol. 414, 391–422. doi: 10.1002/(ISSN)1096-9861
Portmann A. (1959). Einführung in die vergleichende Morphologie der Wirbeltiere (Basel/Stuttgart: Benno Schwabe & Co).
Puelles L. (1995). A segmental morphological paradigm for understanding vertebrate forebrains. Brain Behav. Evol. 46, 319–337. doi: 10.1159/000113282
Puelles L. (2001). Brain segmentation and forebrain development in amniotes. Brain Res. Bull. 55, 695–710. doi: 10.1016/S0361-9230(01)00588-3
Puelles L. (2013). “Plan of the developing vertebrate nervous system relating embryology to the adult nervous system (prosomere model, overview of brain organization),” in Comprehensive developmental neuroscience: patterning and cell type specification in the developing CNS and PNS. Eds. Rakic P., Rubenstein J. L. R. (Academic Press, Amsterdam), 187–209.
Puelles L. (2014). “Development and evolution of the claustrum,” in Functional neuroanatomy of the claustrum. Eds. Smythies J., Ramachandran V. S., Edelstein L. (Academic Press, New York), 119–176.
Puelles L. (2016). Comments on the limits and internal structure of the mammalian midbrain. Intl J. Exp. Clin. Anat 10, 60–70. doi: 10.2399/ana.15.045
Puelles L. (2017). “Role of secondary organizers in the evolution of forebrain development in vertebrates,” in Handbook of evolutionary neuroscience. Ed. Shepherd S. V. (Blackwell-Wiley, Chichester, UK), 350–387.
Puelles L. (2018). Developmental studies of avian brain organization. Int. J. Dev. Biol. 62, 207–224. doi: 10.1387/ijdb.170279LP
Puelles L. (2019). Survey of midbrain, diencephalon, and hypothalamus neuroanatomic terms whose prosomeric definition conflicts with columnar tradition. Front. Neuroanat 13. doi: 10.3389/fnana.2019.00020
Puelles L. (2021). Recollections on the origin and development of the prosomeric model. Front. Neuroanat 15. doi: 10.3389/fnana.2021.787913
Puelles L. (2022). Prosomeric classification of retinorecipient centers: a new causal scenario. Brain Struct. Funct. 227, 1171–1193. doi: 10.1007/s00429-022-02461-6
Puelles L., Díaz C., Stühmer T., Ferran J. L., Martínez-de la Torre M., Rubenstein J. L. R. (2021). LacZ-reporter mapping of Dlx5/6 expression and genoarchitectural analysis of the postnatal mouse prethalamus. J. Comp. Neurol. 529, 367–420. doi: 10.1002/cne.24952
Puelles L., Doménech-Ratto G., Martínez-de-la-Torre M. (1987). Location of the rostral end of the longitudinal brain axis: Review of an old topic in the light of marking experiments on the closing rostral neuropore. J. Morphol 194, 163–171. doi: 10.1002/jmor.1051940205
Puelles L., Fernández B., Martínez-de-la-Torre M. (2015). “Neuromeric landmarks in the rat midbrain, diencephalon and hypothalamus, compared with acetylcholinesterase histochemistry,” in The rat nervous system, 4th ed. Paxinos G. (Academic Press/Elsevier, San Diego/New York), 25–43.
Puelles L., Gil M. (1978). Diferenciación transitoria de melanocitos en el techo del istmo tronco-encefálico en embriones de pollo. Anal. Desarrollo 22, 3–7.
Puelles L., Harrison M., Paxinos G., Watson C. (2013). A developmental ontology for the mammalian brain based on the prosomeric model. Trends Neurosci. 36, 570–578. doi: 10.1016/j.tins.2013.06.004
Puelles L., Hidalgo-Sánchez M. (2023). The midbrain preisthmus: a poorly known effect of the isthmic organizer. Int. J. Mol. Sci. 24, 9769. doi: 10.3390/ijms24119769
Puelles L., Kuwana E., Puelles E., Keleher J., Bulfone A., Rubenstein J. L. R. (2000). Pallial and subpallial derivatives in the chick and mouse telencephalon, traced by the embryonic expression profiles of the genes Dlx-2, Emx-1, Nkx-2.1, Pax-6 and Tbr-1. J. Comp. Neurol. 424, 409–438. doi: 10.1002/(ISSN)1096-9861
Puelles L., Martínez S., Martínez-de-la-Torre M. (2008). Texto de neuroanatomía (Buenos Aires: Ed.Médica Panamericana).
Puelles L., Martínez-de-la-Torre M., Bardet S., Rubenstein J. L. R. (2012a). “Hypothalamus,” in The mouse nervous system. Eds. Watson C., Paxinos G., Puelles L. (Academic Press/Elsevier, San Diego/New York), 221–312.
Puelles L., Martinez-de-la-Torre M., Martinez S., Watson C., Paxinos G. (2019a). The chick brain in stereotaxic coordinates and alternate stains. 2nd.edit (New York: Academic Press).
Puelles L., Martínez-de-la-Torre M., Paxinos G., Watson C., Martínez S. (2007). The chick brain in stereotaxic coordinates: an atlas featuring neuromeric subdivisions and mammalian homologies (San Diego: Elsevier/Academic Press).
Puelles E., Martínez-de-la-Torre M., Watson C., Puelles L. (2012b). “Midbrain,” in The mouse nervous system. Eds. Watson C., Paxinos G., Puelles L. (Academic Press/Elsevier, San Diego/New York), 337–359.
Puelles L., Martínez-Marín R., Melgarejo-Otalora P., Ayad A., Valavanis A., Ferran J. L. (2019c). Patterned vascularization of embryonic mouse forebrain and neuromeric topology of major human subarachnoidal arterial branches: Prosomeric mapping. Front. Neuroanat. 13, 59. doi: 10.3389/fnana.2019.00059
Puelles L., Merchán P., Morales-Delgado N., Castro B., Díaz C., Ferran J. L. (2016). Radial and tangential migration of telencephalic somatostatin neurons originated from the mouse diagonal area. Brain Struct. Funct. 221, 3027–3065. doi: 10.1007/s00429-015-1086-8
Puelles L., Milán F. J., Martínez-de-la-Torre M. (1996). A segmental map of subdivisions in the diencephalon of the frog Rana perezi: acetylcholinesterase-histochemical observations. Brain Behav. Evol. 47, 279–310. doi: 10.1159/000113247
Puelles L., Nieuwenhuys R. (2024). Can we explain thousands of molecularly identified mouse neuronal types? From knowing to understanding. Biomolecules 14, 708. doi: 10.3390/biom14060708
Puelles L., Rubenstein J. L. R. (1993). Expression patterns of homeobox and other putative regulatory genes in the embryonic mouse forebrain suggest a neuromeric organization. Trends in Neurosci. 16, 472–479.
Puelles L., Rubenstein J. L. R. (2003). Forebrain gene expression domains and the evolving prosomeric model. Trends Neurosci 26, 469–476.
Puelles L., Rubenstein J. L. (2015). A new scenario of hypothalamic organization: rationale of new hypotheses introduced in the updated prosomeric model. Front Neuroanat. Mar. 9, 27. doi: 10.3389/fnana.2015.00027
Puelles L., Stühmer T., Rubenstein J. L. R., Díaz C. (2023). Critical test of the assumption that the hypothalamic entopeduncular nucleus of rodents is homologous with the primate internal pallidum. J. Comp. Neurol. 531, 1715–1750. doi: 10.1002/cne.25536
Puelles L., Tvrdik P., Martínez-de-la-Torre M. (2019b). The postmigratory alar topography of visceral cranial nerve efferents challenges the classical model of hindbrain columns. Anat Rec 302, 485–504. doi: 10.1002/ar.23830
Ramón y Cajal S. (1909). “Histologie du Système Nerveux de L’Homme et des Vertébrés,” in Tome II. Edit.française revue et mise a jour par l’auteur, traduite de l’espagnol par le Dr.L.Azoulay, Re-edition de 1955 (CSIC, Inst.Ramón y Cajal, Madrid).
Ramón y Cajal S. (1929). Etudes sur la Neurogenése de quelques Vertébrés (Madrid: Tipografía Artística).
Redies C., Ast M., Nakagawa S., Takeichi M., Martínez-de-la-Torre M., Puelles L. (2000). Morphologic fate of diencephalic prosomeres and their subdivisions revealed by mapping cadherin expression. J. Comp. Neurol. 421, 481–514. doi: 10.1002/(ISSN)1096-9861
Rendahl H. (1924). Embryologische und morphologische Studien über das Zwischenhirn beim Huhn. Acta Zool 5, 241–344. doi: 10.1111/j.1463-6395.1924.tb00169.x
Retzius G. (1896). “Das menschenhirn,” in Studien in der makroskopischen Morphologie, vol. Vol.I, II. (Königliche Buchdruckerei P.A. Norstedt & Söhne, Stockholm).
Rubenstein J. L. R., Martínez S., Shimamura K., Puelles L. (1994). The embryonic vertebrate forebrain: the prosomeric model. Science 266, 578–580. doi: 10.1126/science.7939711
Sánchez-Arrones L., Ferran J. L., Rodríguez-Gallardo L., Puelles L. (2009). Incipient forebrain boundaries traced by differential gene expression and fate mapping in the chick neural plate. Devel Biol. 335, 43–65. doi: 10.1016/j.ydbio.2009.08.012
Schröder H., Moser N., Huggenberger S. (2020). “Neuroanatomy of the mouse,” in An introduction (Springer, Berlin).
Scremin O. U. (2015). “Cerebral vascular system,” in The rat nervous system, 4th. Ed. Paxinos G. (Academic Press, New York), 985–1011.
Scremin O. U., Holschneider D. P. (2012). “Vascular supply,” in The mouse nervous system. Eds. Watson C., Paxinos G., Puelles L. (Academic Press/Elsevier, San Diego/New York), 459–472.
Sela-Donenfeld D. P. I., Kayam G., Wilkinson D. (2009). Boundary cells regulate a switch in the expression of FGF3 in hindbrain rhombomeres. BMC Dev. Biol. 9, 16. doi: 10.1186/1471-213X-9-16
Sengul G., Watson C. (2012). “Spinal cord,” in The mouse nervous system. Eds. Watson C., Paxinos G., Puelles L. (Academic Press/Elsevier, San Diego/New York), 424–458.
Shimogori T., Lee D. A., Miranda-Angulo A., Yang Y., Wang H., Jiang L., et al. (2010). A genomic atlas of mouse hypothalamic development. Nat. Neurosci. 13, 767–775. doi: 10.1038/nn.2545
Striedter G. F. (2005). Principles of brain evolution (Sunderland, Massachusetts: Sinauer Assoc., Inc).
Striedter G. F., Northcutt R. G. (2020). “Brains through time,” in A natural history of vertebrates (Oxford Univ. Press, Oxford).
Swanson L. W. (2018). Brain maps 4.0 – Structure of the rat brain: An open access atlas with global nervous system nomenclature ontology and flatmaps. J. Comp. Neurol. 526, 935–943. doi: 10.1002/cne.24381
Tello J. F. (1923). Les différenciations neuronales dans l’ embryon de poulet pendant les quattre premiers jours de l’incubation. Trab Lab. Invest. Biol. 21, 1–94.
Tello J. F. (1934). Les différenciations neurofibrillaires dans le prosencéphale de la souris de 4 a 15 mm. Trab Lab. Invest. Biol. 29, 339–396.
Ten Donkelaar H. J. (2020). “Clinical neuroanatomy,” in Brain circuitry and its disorders, 2nd ed. (Springer, Berlin).
Ten Donkelaar H. J., Kachlik D., Tubbs R. S. (2018). “An illustrated terminologia neuroanatomica,” in A concise encyclopedia of human neuroanatomy (Springer, Berlin).
Ten Donkelaar H. J., Lammens M., Hori A. (2023). “Clinical neuroembryology,” in Development and developmental disorders of the human central nervous system, 3rd ed. (Springer, Berlin).
Tomás-Roca L., Corral-San-Miguel R., Aroca P., Puelles L., Marín F. (2016). Crypto-rhombomeres of the mouse medulla oblongata, defined by molecular and morphological features. Brain Struct. Funct. 221, 815–838. doi: 10.1007/s00429-014-0938-y
Vaage S. (1969). The segmentation of the primitive neural tube in chick embryos (Gallus domesticus), A morphological, histochemical and autoradiographical investigation. Ergebn Anat EntwGesch 41, 1–88.
Vaage S. (1973). The histogenesis of the isthmic nuclei in chick embryos (Gallus domesticus). I. A morphological study. Z Anat EntwGesch 142, 283–314. doi: 10.1007/BF00519134
Villiger E., Ludwig E. (1946). “Gehirn und rückenmark,” in Leitfaden für das Studium der Morphologie und des Faserverlaufs, 14th (Benno Schwabe & Co, Basel).
von Kupffer K. (1906). “Die morphogenie des zentralnervensystems,” in Hertwigs Handbuch der Vergleichenden und Experimentellen Entwicklungslehre der Wirbeltiere, vol. 2 . Ed. Hertwig O. (Gustav Fischer, Jena), 1–394.
Watson C. (2012). “Hindbrain,” in The mouse nervous system. Eds. Watson C., Paxinos G., Puelles L. (Academic Press/Elsevier, San Diego/New York), 398–423.
Watson C., Bartholomaeus C., Puelles L. (2019). Time for radical changes in brain stem nomenclature – applying the lessons from developmental gene patterns. Front. Neuroanat 13. doi: 10.3389/fnana.2019.00010
Watson C., Kirkaldie M., Paxinos G. (2010). “The brain,” in An introduction to functional neuroanatomy (Elsevier, Amsterdam).
Watson C., Shimogori T., Puelles L. (2017). Mouse FGF8-Cre lineage analysis defines the territory of the postnatal mammalian isthmus. J. Comp. Neurol. 525, 2782–2799. doi: 10.1002/cne.24242
Watson C., Sidhu A. (2009). “Toward a spinal cord ontology,” in The spinal cord. A christopher and dana reed foundation text and atlas. Eds. Watson C., Paxinos G., Kayalioglu G. (Elsevier, San Diego), 380–383.
Weisinger K., Kohl A., Kayam G., Monsonego-Ornan E., Sela-Donenfeld D. P. I. (2012). Expression of hindbrain boundary markers is regulated by FGF3. Biol. Open 1, 67–74. doi: 10.1242/bio.2011032
Wullimann M. F., Puelles L. (1999). Postembryonic neural proliferation in the zebrafish forebrain and its relationship to prosomeric domains. Anat Embryol 329, 329–348. doi: 10.1007/s004290050232
Wullimann M. F., Puelles L., Wicht H. (1999). Early postembryonic neural development in the zebrafish: a 3-D reconstruction of forebrain proliferation zones shows their relation to prosomeres. Eur. J. Morphol 37, 117–121. doi: 10.1076/ejom.37.2.117.4739
Keywords: brain models, anteroposterior units, dorsoventral subdivisions, gene markers, midline parts, midline landmarks, axonal tracts
Citation: Puelles L (2024) An illustrated summary of the prosomeric model. Front. Mamm. Sci. 3:1456996. doi: 10.3389/fmamm.2024.1456996
Received: 29 June 2024; Accepted: 27 August 2024;
Published: 27 September 2024.
Edited by:
Ruth Benavides-Piccione, Spanish National Research Council (CSIC), SpainReviewed by:
Miguel Ángel García-Cabezas, Autonomous University of Madrid, SpainManuel A. Pombal, University of Vigo, Spain
Kenji Shimamura, Kumamoto University, Japan
Copyright © 2024 Puelles. This is an open-access article distributed under the terms of the Creative Commons Attribution License (CC BY). The use, distribution or reproduction in other forums is permitted, provided the original author(s) and the copyright owner(s) are credited and that the original publication in this journal is cited, in accordance with accepted academic practice. No use, distribution or reproduction is permitted which does not comply with these terms.
*Correspondence: Luis Puelles, cHVlbGxlc0B1bS5lcw==
†ORCID: Luis Puelles, orcid.org/0000-0002-9541-7073