 Shannon M. Barber-Meyer
 Grace L. Olson
 Jens J. Currie
- Research Department, Pacific Whale Foundation, Wailuku, HI, United States
Introduction: Recent minimum population estimates are critical for effective marine mammal conservation, yet such estimates are often lacking at the stock or management level. Throughout the Main Hawaiian Islands, pantropical spotted dolphins (PSD; Stenella attenuata attenuata) are comprised of a pelagic and three island-associated stocks (O‘ahu, 4-Islands, and Hawai‘i Island). The insular stocks, in particular, face multiple anthropogenic and natural threats such as vessel impacts, fisheries interactions, marine debris, climate change, and disease. Prior to this study, no abundance estimates of the 4-Islands (i.e., the Maui Nui region) PSD stock existed that were suitable for management use and inclusion in stock assessment report calculations.
Methods: We generated annual mark-recapture abundance estimates of naturally marked adults in a POPAN-framework using photo-identification data collected from small-boat surveys during 2014–2022 in the Maui Nui region. We extrapolated these estimates to the wider population using dorsal fin mark rates.
Results and discussion: We collected data on 62 groups of PSD, throughout all months of the year, and with an average group size of 55.70 (SD = 17.31). We analyzed encounter histories of 174 distinct individuals. Annual recapture rate averaged 1.84 (SD = 1.32) with a maximum of 7. Individuals detected per year averaged 35.67 (SD = 21.16) with a maximum of 77 in 2017. Overall mark rate was 0.495 (SE = 0.010), resulting in total annual abundance estimates that averaged 154.87 (SE = 14.25) and ranged from 105 (SE = 13) in 2014 to 232 (SE = 31) in 2017. Although abundance estimates fluctuated, generally 250 animals or less used the study area each year and we found no overall evidence of a trend. Our benchmark results revealed a small population in need of monitoring given the numerous threats facing this stock, the uncertainty of their impacts, and the decreased resiliency and recovery potential of small populations to negative demographic and environmental stochastic events. Our findings, including documenting long-term site fidelity and year-round presence of PSD in Maui Nui, further signify this area as one of future research and conservation importance.
Introduction
Successful marine mammal conservation requires reliable population-level information to support data-driven management decisions (Tyne et al., 2014). For example, recent minimum population estimates (e.g., abundance) are required for marine mammal management as mandated by the US Marine Mammal Protection Act (Bradford et al., 2018; Carretta et al., 2021). Abundance estimates are also important for examining potential impacts of threats to their population via direct mortality, reduced fecundity and recruitment, habitat degradation, range displacement, and other changes in behavior (e.g., Lettrich et al., 2023). Despite their importance, abundance estimates are often lacking at the stock or management level (Bradford et al., 2018). Such is the case for some insular pantropical spotted dolphins (PSD; Stenella attenuata attenuata) found in Hawaiʻi (Carretta et al., 2021).
PSD in the Hawaiian Islands belong to an offshore subspecies (Perrin, 1975; Dizon et al., 1994; Perrin et al., 1994), and are known as “kiko”, the ʻŌlelo Hawaiʻi (Hawaiian language) word for “spot” (Baird, 2016). Based on genetic distinctions and corresponding migration rates (Courbis et al., 2014), the National Oceanic and Atmospheric Administration (NOAA) delineated PSD in Hawaiian waters into four management stocks under the US Marine Mammal Protection Act, including a pelagic stock and three island-associated stocks; O‘ahu, 4-Islands, and Hawai‘i Island (Oleson et al., 2013; Carretta et al., 2021). Prior to our study, recent and reliable abundance estimates of the 4-Islands (i.e., Maui Nui region) insular stock, were lacking (Becker et al., 2022), as well as any information on trends or current and maximum net productivity rates (Carretta et al., 2021).
There is heightened urgency to fill such knowledge gaps, as small, island-associated cetacean populations face elevated risk due to their geographic and genetic isolation and increased exposure to anthropogenic threats (Courbis et al., 2014; Tyne et al., 2014; Methion and Diáz López, 2018; Silva et al., 2020; Cobarrubia-Russo et al., 2021). Like other dolphins in the Main Hawaiian Islands (MHI), insular PSD in Hawaiʻi face numerous human-caused threats, such as fisheries interactions, vessel traffic including tourism-related activities, marine debris entanglement and ingestion risk, habitat degradation and shoreline development, acoustic interference, climate change, and pathogens (Tyne et al., 2014; Bradford and Lyman, 2015; Jacob et al., 2016; Currie et al., 2017; Bradford and Lyman, 2019; Baird and Webster, 2020; Machernis et al., 2021; Van Cise et al., 2021; Olson et al., 2022). Cumulative stressors may also interact to create synergistic, negative impacts (Lettrich et al., 2023), resulting in reduced resiliency and recovery from injurious demographic and environmental stochastic events (Gilpin and Soulé, 1986; Traill et al., 2007). Threat impacts and abundance are important components of NOAA’s stock status assessments used in management (e.g., Carretta et al., 2021). Recent stock abundance estimates are required to calculate the maximum level of human-caused mortality that can be removed annually from a stock (i.e., potential biological removal; Wade and Angliss, 1997).
Within the Hawaiian archipelago, numerous cetacean abundance estimates have been determined by ship-based line-transect surveys, typically utilizing group size data, rather than individual identification (e.g., Bradford et al., 2017; Becker et al., 2022; Bradford et al., 2022). Ship-based, line transect survey data across 2017–2020 were used to calculate an average habitat-based model-predicted abundance estimate for the PSD 4-Islands stock of 1,650 (95% CI = 748–3,639) (Becker et al., 2022). Due to an inability to adequately sample nearshore areas, insular stock sightings were sparse and were skewed toward Hawaiʻi Island, including only four detections in the 4-Islands region (Becker et al., 2022). The authors cautioned “the potential for bias may make them [insular PSD abundance estimates] unsuitable for use in an assessment context” (Becker et al., 2022:20). Additionally, a design-based winter abundance estimate for the 4-Islands stock could not be calculated due to lack of data (Bradford et al., 2022). In general, prior efforts at generating insular stock abundance estimates have been hampered by small samples and uneven survey effort, resulting in unreliable estimates (Becker et al., 2022; Bradford et al., 2022).
Mark-recapture surveys using photo-identification based on natural markings (Rosel et al., 2011) are an alternate method to line-transect surveys to estimate abundance. These surveys can be conducted from small vessels in nearshore habitats and have been successfully used in the MHI for various cetaceans (e.g., Hill et al., 2011; Tyne et al., 2014; Bradford et al., 2018; Van Cise et al., 2021). Prior to our study, no study had utilized photo-identification in a mark-recapture framework to estimate PSD abundance in Hawaiʻi, despite the need (Bradford et al., 2022). We aimed to generate abundance estimates for the PSD 4-Islands stock, as well as associated information such as seasonality of sightings, mark and recapture rates, group sizes, etc. Such benchmark information is important for comparisons with this and other populations, for guiding current management and future research, and for informing and assessing potential conservation interventions.
Methods
Study area
Our study occurred in the nearshore and primarily leeward waters of Maui Nui, Hawaiʻi (also known as the 4-Islands region of Maui, Kahoʻolawe, Lānaʻi, and Molokaʻi) (Figure 1). These waters are generally shallower (primarily<200 m, but approximately 600 m south of Lānaʻi) than those surrounding other MHI because the four islands of Maui Nui, now separated by five channels, were previously connected as a super-island (Grigg et al., 2002). The seafloor consists of sandy basins, drowned reef features, seamounts, and ridgelines (Grigg et al., 2002).
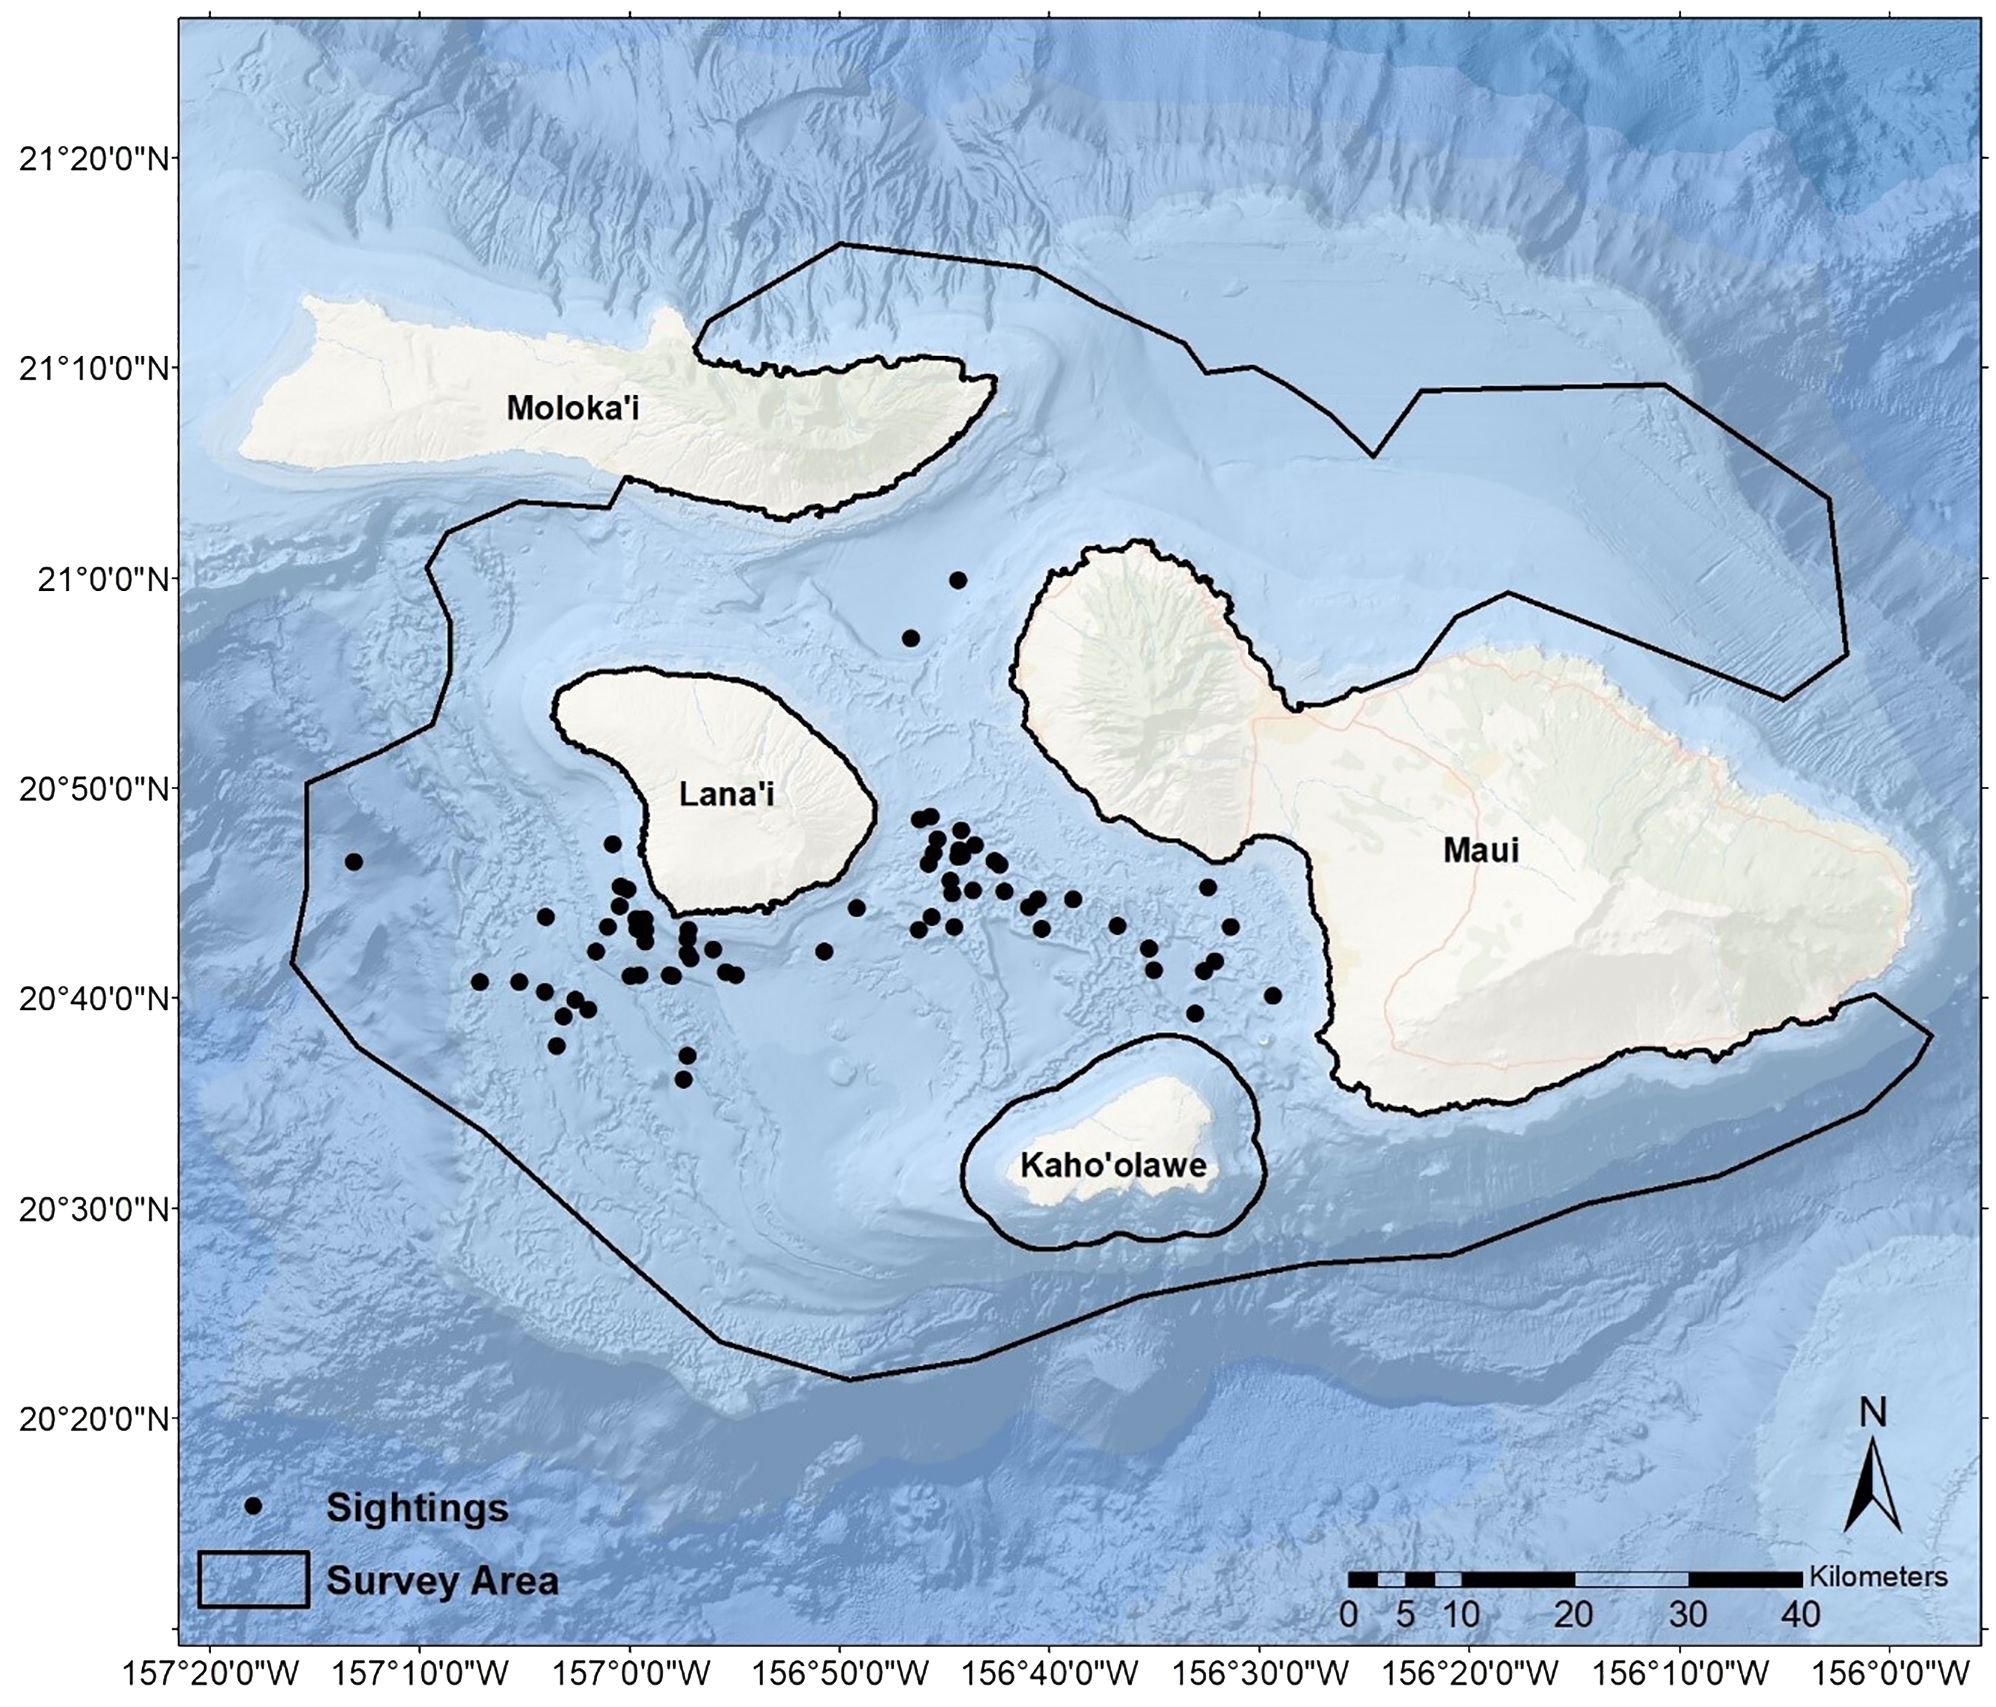
Figure 1 Sightings of pantropical spotted dolphins (Stenella attenuata attenuata) observed during surveys conducted in the Maui Nui region of Hawaiʻi from 2014–2022. The extent of our research vessel track during the study period delineated the available survey area.
Data collection
We collected data via two primary methods, line-transect and opportunistic surveys. We designed both as multi-species cetacean surveys that maximized coverage and potential sightings. We conducted line-transect surveys for photo identification from 2014–2018 aboard a 7.9-m dedicated research vessel (see Olson et al., 2022 for additional details). We carried out opportunistic surveys during 2018–2022 from the same vessel and designed them to provide broad coverage, while accounting for strong and persistent trade winds common to this region (see Stack et al., 2020 for additional details). We surveyed only when both the Beaufort Wind Scale and the Douglas Sea State were ≤3 (calm or light winds) to maximize detection of dolphins. We traveled at speeds of ≤15 kts during surveys with observers scanning 180° arcs with one on port, one on starboard, and the captain surveying towards the bow (for opportunistic surveys we also had an observer surveying towards the stern). We included detections of PSD when not on formal survey effort (i.e., transiting) to maximize our sample.
When we detected dolphins, we approached the group for species identification and initiated a focal follow (hereafter, an ‘encounter’). We defined “group” as one or more dolphins of the same species within approximately 100 m of a focal individual (see Syme et al., 2022). We noted the time of the sighting and recorded the location (latitude and longitude) at the start of the encounter using a Garmin GPSMAP78 handheld Global Positioning System. We photographed dolphin dorsal fins with digital SLR Canon cameras (EOS 90, EOS 6D, and EOS 7D) and a Canon EF 100–400 mm zoom lens. We attempted to photograph all dolphins present and all dorsal fins on both their left and right sides (Rosel et al., 2011), but permit restrictions on encounter duration and large group sizes often prevented documentation of all dolphins (Hupman et al., 2018; Elliser et al., 2022). We also collected associated data such as group size (minimum, best, and maximum estimates) and composition (estimated number of adults, subadults, and calves). We considered subadults and calves as those approximately ¾ and ½ the body length of an adult, respectively.
During our study, we received photo donations from members of the public and received platform-of-opportunity data collected opportunistically by trained staff on ocean tourism vessels. We combined data from all sources to increase our sample (Bradford et al., 2018; Van Cise et al., 2021).
Photograph processing
We cropped photographs of multiple dorsal fins to images containing only a single dorsal fin (except in the case of putative moms with calves to preserve the associated pair in the image). We first assessed all images of dolphin dorsal fins for quality and then for distinctiveness. Photographic quality ranged from 0–4 (4 = excellent, 0 = bad) based on the proportion of dorsal fin visible, focus, contrast, and angle (Appendix A; see Baird et al., 2009 and Bradford et al., 2018). Next, we assessed images for dorsal distinctiveness from 1–3 (1 = very distinct, 2 = moderately distinct, 3 = subtly distinct) and clean (no distinctiveness) based on probability of noticing marks in the field and how likely the marks were to be identified when processing photographs in the lab (Appendix B; Tyne et al., 2014).
We evaluated images for matches to individual dolphin dorsal fins in our photograph identification catalog by examination of primary identification features including natural, permanent marks such as scars, notches, deformations, etc (Würsig and Würsig, 1977; Rosel et al., 2011; Elliser et al., 2022). We used secondary identification characteristics such as spots and other marks (e.g., scars) on the rest of the body to confirm potential matches (Hammond et al., 1990). We first assessed dorsal fin images for potential matches to our catalog via finFindR (Thompson et al., 2022). We cataloged verified finFindR matches as a repeat sighting of the individual. When a match was not found through finFindR, we visually compared the image to all images in our catalog. We added dorsal fins with no matches to our catalog as new individuals. Prior to 2018, we did all matching manually without finFindR. In all cases, we confirmed matches and new individuals by a minimum of two independent observers.
We limited our mark-recapture analysis to high-quality images (score of 3 or 4) of very or moderately distinct individuals (score of 1 or 2) (Urian et al., 2015; Courtin et al., 2023). Further, we excluded identified calves and sub-adults because 1) survival often differs between adults and non-adults, and 2) dorsal fins of juveniles are more often clean and, therefore, disproportionately fewer individuals are identifiable compared to adults (Hupman et al., 2018). We generated encounter histories of 1’s (detected) and 0’s (not detected) for each individual per sighting and pooled at the yearly level to mitigate data sparseness (Van Cise et al., 2021). A shorter, seasonal sampling period was precluded because our data were spread throughout all months of the year without a distinct temporal preponderance.
Mark-recapture analysis
Our generally sparse and temporally spread data did not lend themselves to analysis of brief sampling periods, and demographic and geographic closure of the dolphin population throughout the duration of our study was unlikely (White et al., 1982). Thus, we did not employ closed population models to estimate abundance. Similarly, varying survey effort and timing across years, in combination with sparse recaptures, restricted our use of Polluck’s Closed Capture Robust Design (Kendall et al., 1997). Therefore, we selected open population models allowing for population gains and losses (births, deaths, and migration) between sampling periods (Schwarz and Seber, 1999). Specifically, we estimated the abundance of very and moderately distinctly marked adults (hereafter, ‘marked adults’) via the open mark-recapture model POPAN (Schwarz and Arnason, 1996) in Program MARK version 9.0 (White and Burnham, 1999). The POPAN model is a formulation of the Jolly-Seber model (Jolly, 1965; Seber, 1965) that includes a “super-population” parameter. The super-population reflects the total number of animals available for capture throughout the study and does not account for deaths (Williams et al., 2002). Therefore, rather than the superpopulation estimate, annual estimates of abundance are more biologically meaningful and are what we report.
Assumptions for the open population models included: (1) marks are unique, not lost, and correctly identified; (2) all individuals have the same probability of capture, whether previously captured or not; (3) all individuals have the same probability of survival, whether previously captured or not; (4) capture and survival of individuals are independent between individuals; (5) the study area is consistent; and (6) sampling is instantaneous (Williams et al., 2002). Our photo-identification protocols ensured that violations to assumption 1 would be very minimal. Because we attempted to photograph all individuals on both sides of their dorsal fins regardless of distinctiveness, differences in individual capture probabilities attributable to our sampling methods would be minimal (assumption 2). However, some research in Hawaiʻi has indicated that females and subadults are more likely to approach a vessel to ride the bow wave, than are adult males (Baird, 2016). The models we evaluated included those that allowed for time-varying probabilities of capture. To ensure that equal survivability was sufficiently met (assumption 3), we excluded identified calves and subadults. Because the capture method (photography) is relatively non-invasive, our sampling method should have no effect on survival (assumption 3). Assumption 4 is likely to be violated because dolphins tend to exhibit non-random associations (Pryor and Shallenberger, 1991). Subgroups of PSD based on age and sex have been frequently observed in Hawaiʻi (Baird, 2016). However, this violation of the independence of fates is not likely to cause bias in point estimates, though the corresponding standard errors may be biased low (Williams et al., 2002). Further, we mitigated overdispersion in the data during model evaluation and selection through variance inflation (see below). While we generally aimed for consistent coverage of our study area across years (assumption 5), this was not always possible (e.g., pauses in effort related to the COVID-19 pandemic and weather). Thus, the annual estimates are best interpreted as the abundance of marked adults that used the sampled area each year. Our sampling interval (pooled at the annual level) was not instantaneous (assumption 6), but represented the best compromise between mitigating sparse data and a reasonable sampling interval (Van Cise et al., 2021).
The estimated parameters in the POPAN model were apparent survival (ф), capture probability (p), probability of entry into the population (b), and the super-population size (N). Because mortality and emigration are indistinguishable in open population models, survival estimates represent apparent survival (hereafter, ‘survival’), and may underestimate true survival if the probability of study area fidelity is not one (Schaub and Royle, 2014). The suite of models we tested included constant and time-varying survival (ф), time-varying probability of entry (b), and capture probability (p) that was constant, time-varying, effort-constrained, and time-varying with an additive effort covariate. We represented effort by total nautical miles traveled, rather than nautical miles surveyed, because many PSD sightings, i.e., >20, occurred when our crew was not on formal survey effort and those detections were included in our data (Olson et al., 2022). The model allowing for both time-varying survival and capture probabilities required fixing otherwise-confounded (Williams et al., 2002) capture probability (p) values (i.e., the first and second p were set equal as were the final two p). We used the following parameter-specific link functions; the logit link function for survival and capture probabilities, the multinomial logit link function for the probability of entry, and the log link for the super-population.
We generated goodness-of-fit statistics for the POPAN model in Program RELEASE version 3.0 (Burnham et al., 1987) via Program MARK (White and Burnham, 1999). We determined if overdispersion existed in the data by dividing the chi-square (χ2) statistic from the global test by its degrees of freedom (values >1 indicated overdispersion) (Lebreton et al., 1992). For values >1, we replaced the default value of 1 with that number as a variance inflation factor (ĉ) in Akiake Information Criteria corrected for small samples (AICc) model selection and generated quasi-AICc (QAICc) results (Anderson et al., 1994). We considered the model with the lowest QAICc the top model. To mitigate model uncertainty, we generated parameter estimates via model averaging in the case of potentially competing models (ΔQAIC<4) that also differed from the top model by more than the inclusion of an uninformative parameter (Burnham and Anderson, 2004; Arnold, 2010).
Proportion distinctive and total annual abundance
To determine the mark rate of dorsal fins, we followed mark rate calculations for ‘not-all-captured’ groups in Tyne et al. (2014) and Hupman et al. (2018) because the time available to photograph dolphins in combination with group size generally precluded all individuals being captured. Thus, we calculated the proportion of marked or distinctive individuals (i.e., mark rate, ) and standard error (SE) as:
where n is the total number of high-quality images.
To minimize the impacts on the mark rate from years with fewer encounters, we calculated the overall mark rate across the study, rather than within-year mark rates. We applied this mark rate to each annual abundance estimate of marked adults (Nm) to derive corresponding annual estimates (and standard errors, SE) for the population (Ntotal) encompassing non-adults and both marked and unmarked adults as follows (Wilson et al., 1999; Williams et al., 2002):
where n is the total number of high-quality images.
We calculated log-normal 95% confidence intervals (CIs) for Ntotal as follows (Burnham et al., 1987):
where the upper limit (UL) was and the lower limit (LL) was .
Results
Surveys
Over the nine-year study, we traveled 27,304.6 nautical miles (nmi) during formal surveys and transit, with an average of 3,033.84 nmi/y (SD = 1,215.92), ranging from a minimum of 1,503.1 nmi in 2020 (when surveys were impacted by the COVID-19 pandemic) to a maximum of 6,038.9 nmi in 2014 (the first year of the study). The extent of our survey tracks comprised 7,186 km2 available survey area (Figure 1). Based on encounters with sufficient data (i.e., excluding encounters without group size estimates, etc.), the number of encounters of PSD totaled 62 and averaged 6.89/y (SD = 4.09, min = 2, max = 15). When pooled across years, encounters were generally distributed throughout the year without a strong seasonal peak (Figure 2). The mean of the average of best group size estimates (Bolaños-Jiménez et al., 2022) encountered each year was 55.70 (SD = 17.31, min = 24.43, max = 86.67), and the average maximum group size encountered each year was 91.11 (SD = 30.44, min = 45, max = 150). We received donated photographs from one date each year during 2014, 2019, and 2021. We received platform-of-opportunity photographs from five dates during 2021 and two during 2022.
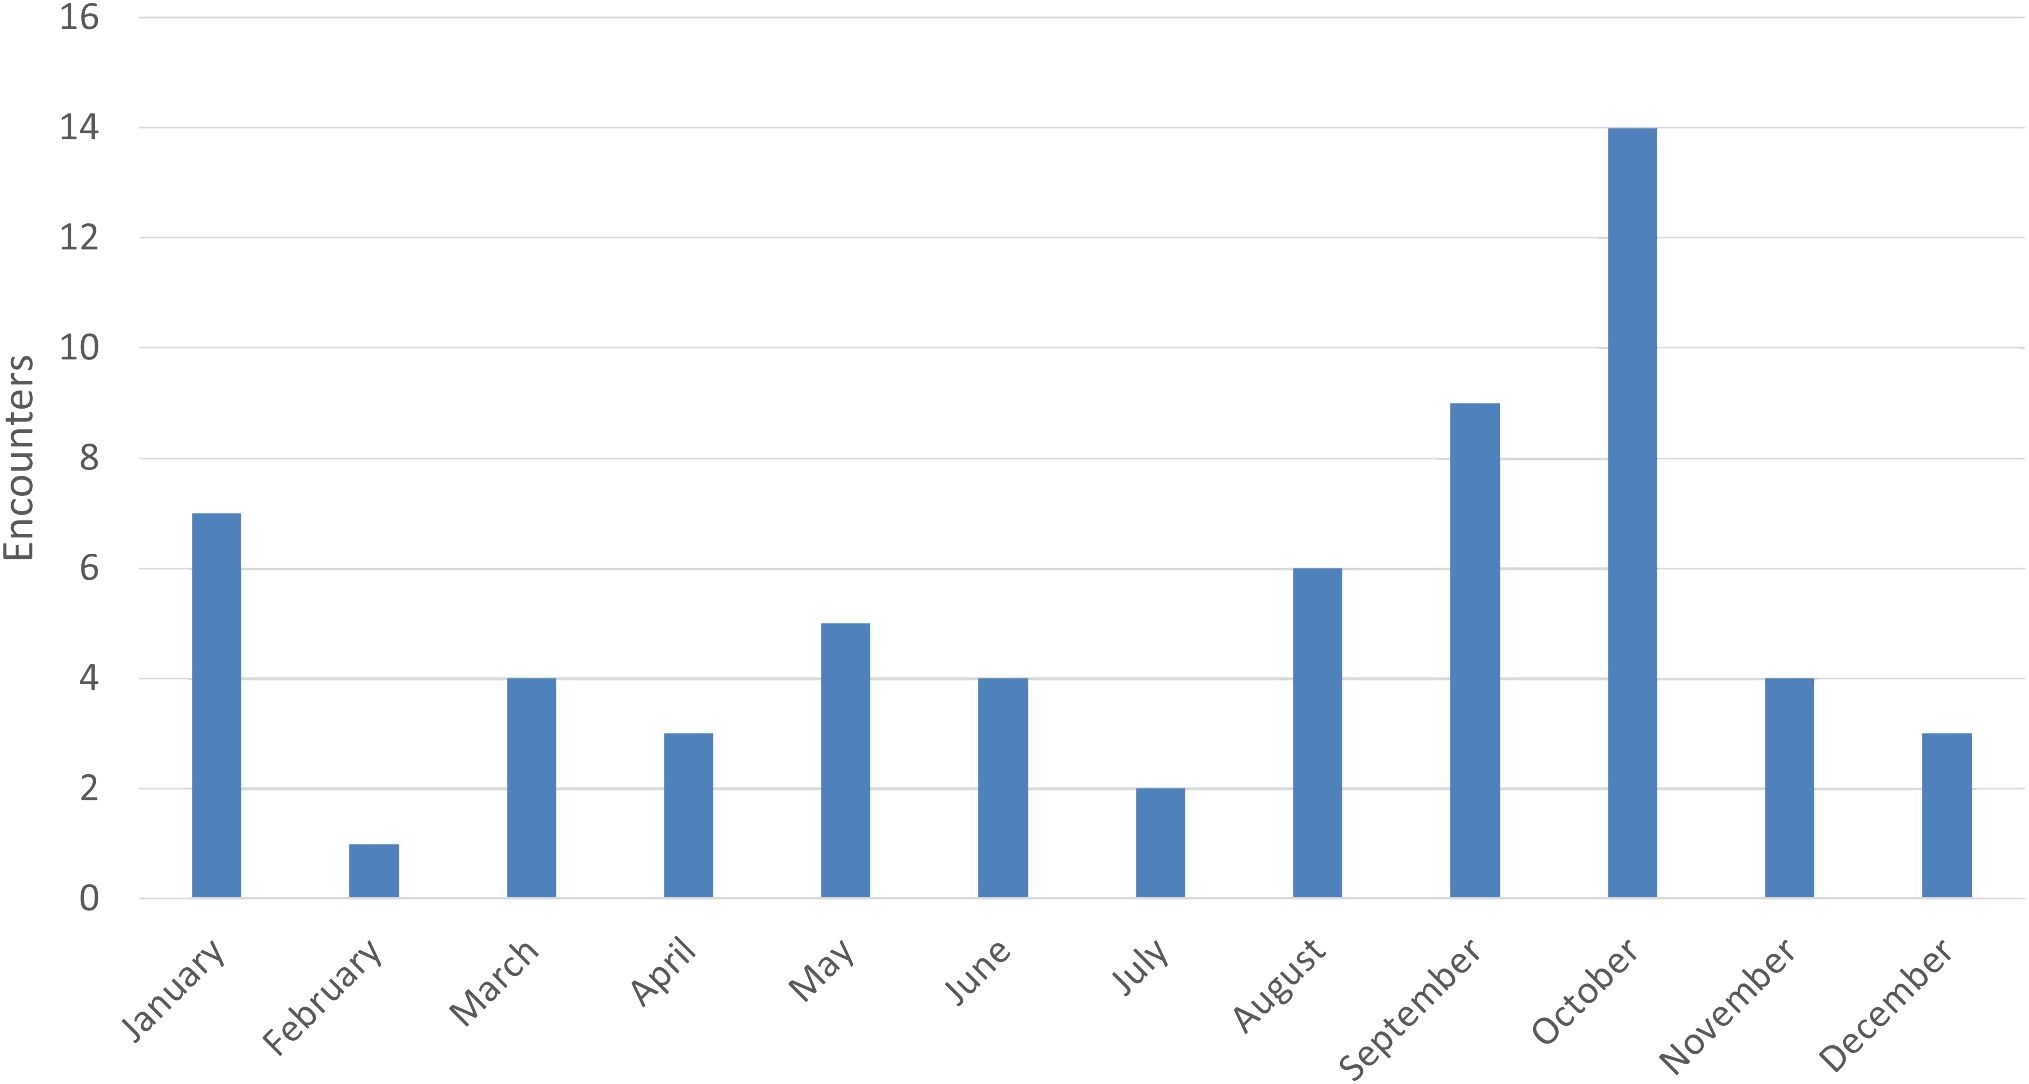
Figure 2 Monthly tallies of pantropical spotted dolphin (Stenella attenuata attenuata) encounters, pooled across years, during 2014–2022 in the Maui Nui region of Hawaiʻi.
Photo-identification
We analyzed encounter histories of 174 distinct individuals. Of those, the annual recapture rate averaged 1.84 (SD = 1.32, min = 1, max = 7), with 89% detected during three or fewer years and 59% detected in only one year (Figure 3). The number of individuals detected per year averaged 35.67 (SD = 21.16, min = 11 in 2015 and 2020, max = 77 in 2017; Figure 4). The discovery curve (Figure 5) of cumulative individuals detected from 2014–2022, indicated we detected new individuals during the final year of the study (i.e., 26 new individuals), but at a lower rate than the 1:1 linear relationship that would have resulted if all individuals detected were previously unidentified.
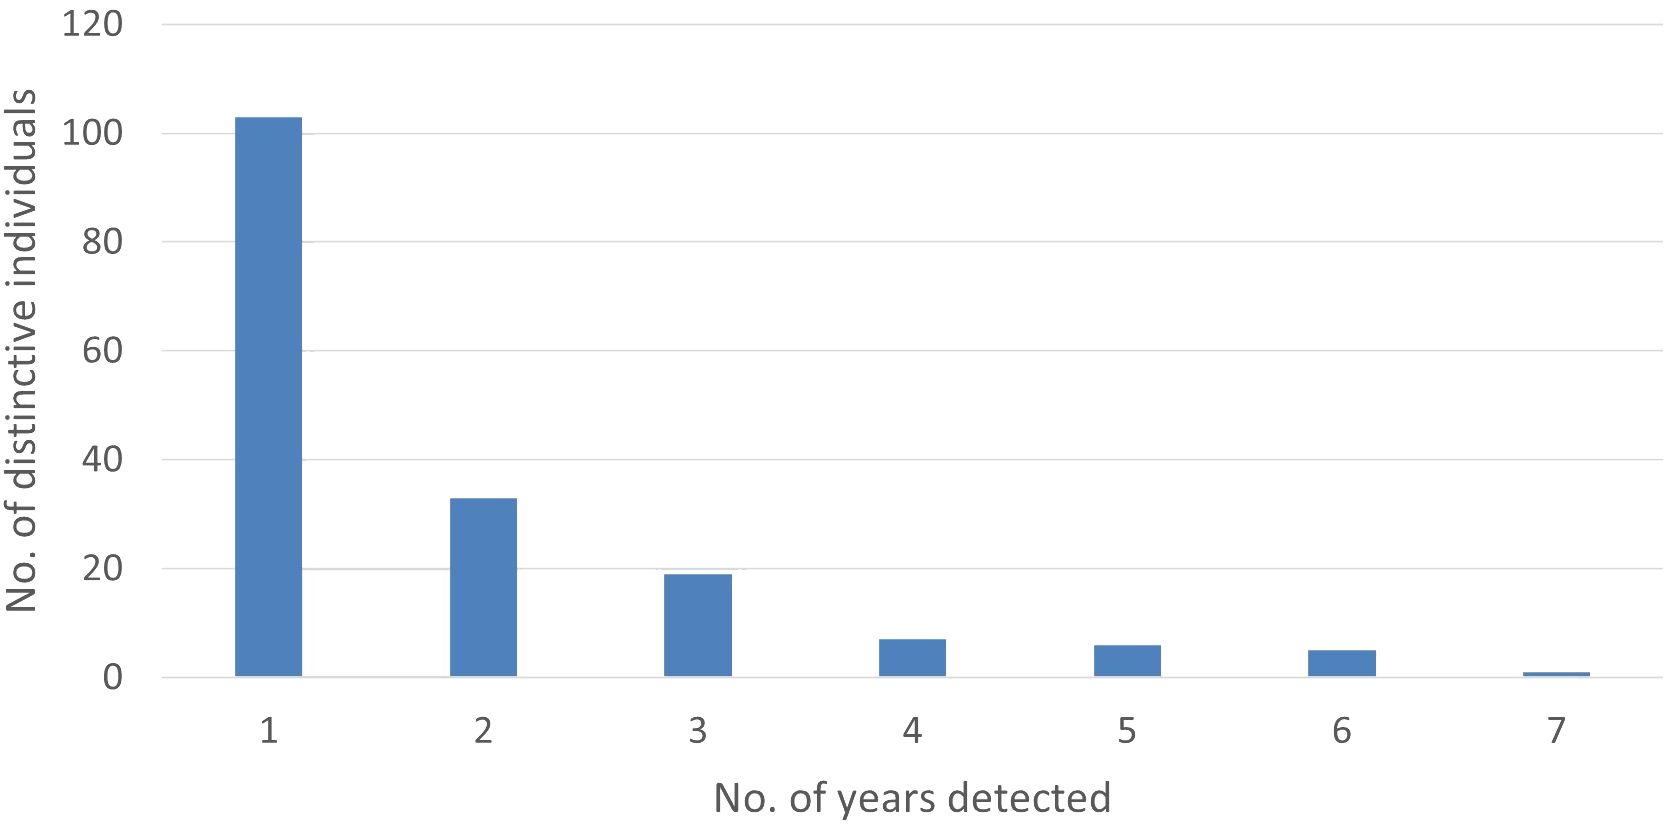
Figure 3 The number of years individual distinctive pantropical spotted dolphins (Stenella attenuata attenuata) were photo-identified during 2014–2022 in the Maui Nui region of Hawaiʻi.
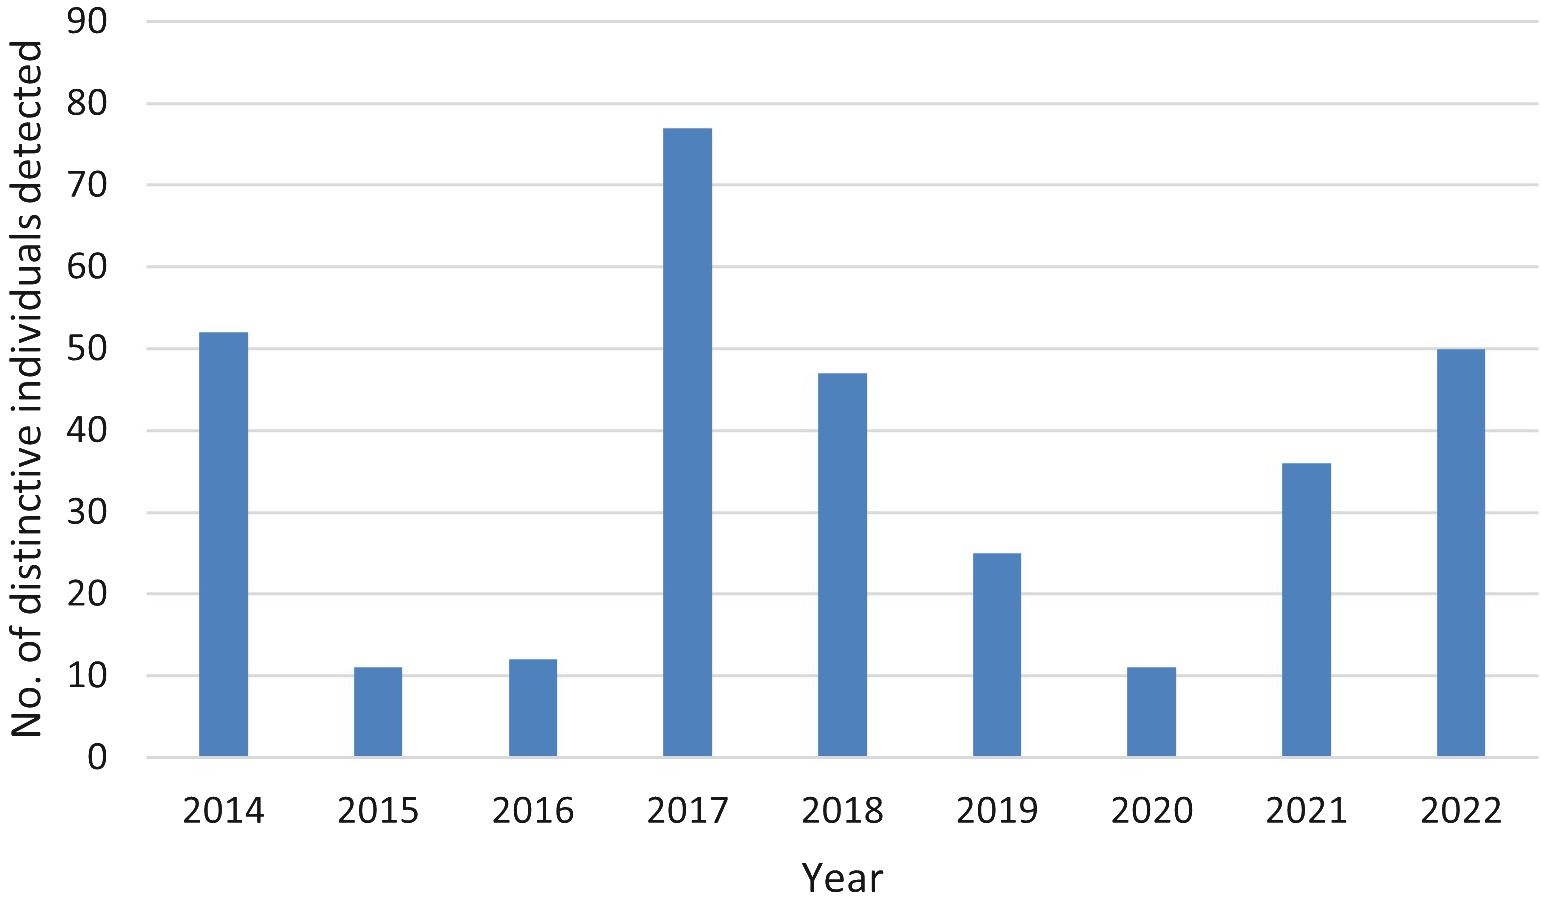
Figure 4 The number of individual distinctive pantropical spotted dolphins (Stenella attenuata attenuata) photo-identified by year during 2014–2022 in the Maui Nui region of Hawaiʻi.
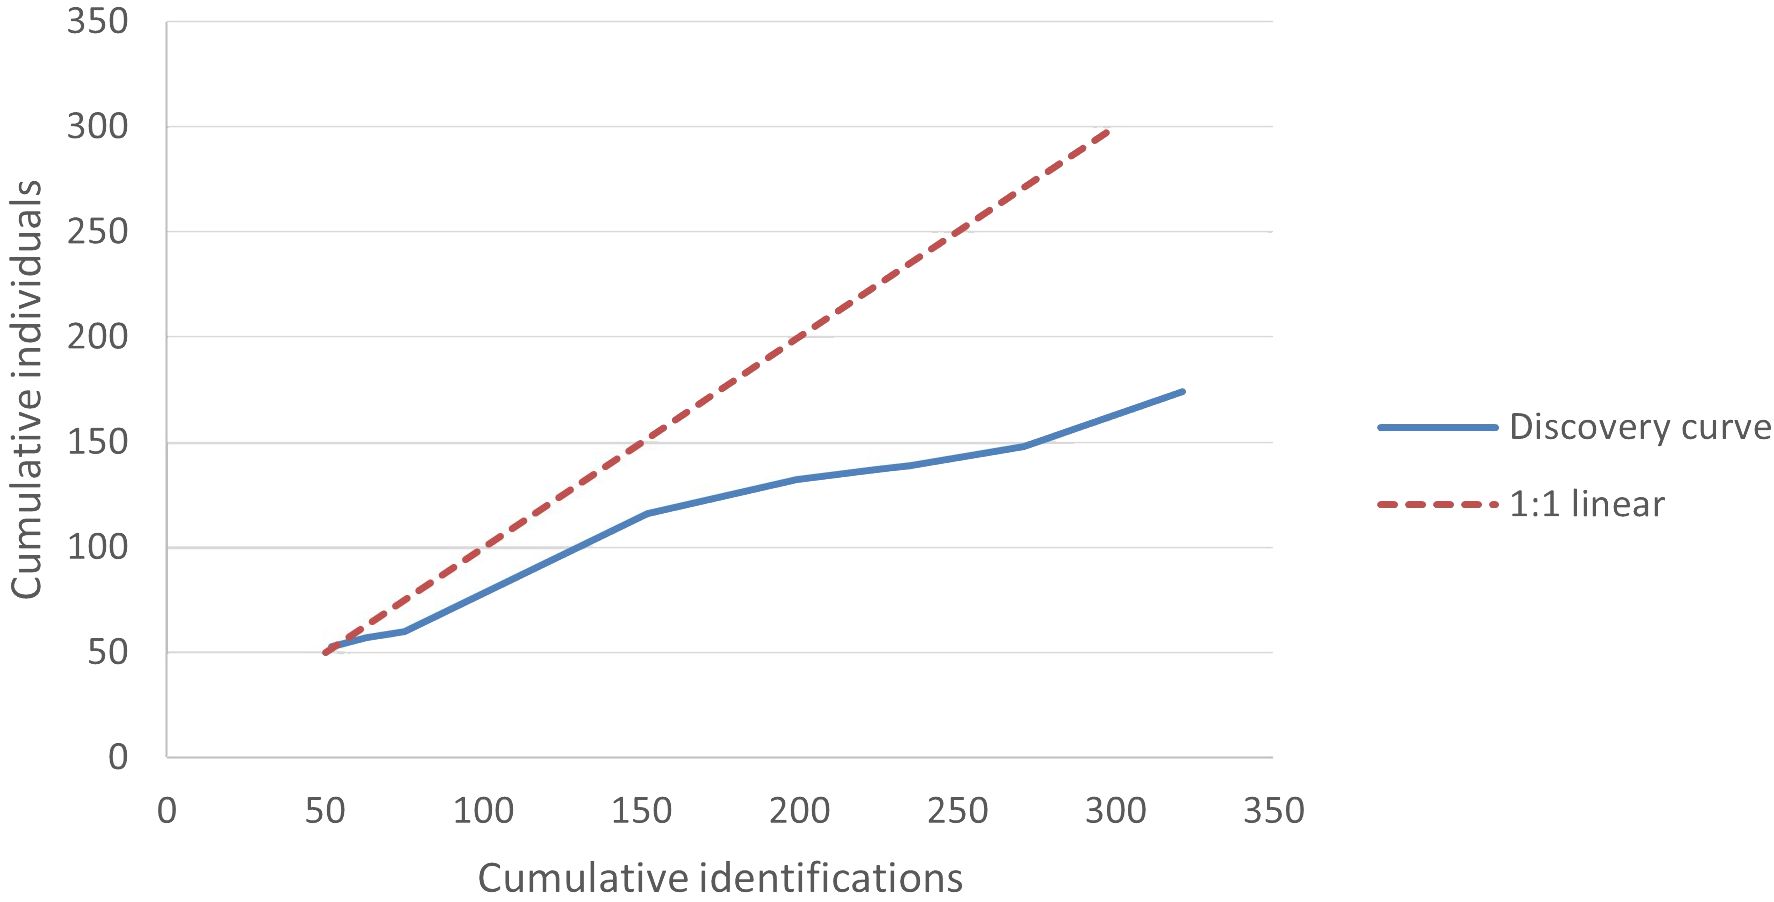
Figure 5 Discovery curve comparing cumulative total pantropical spotted dolphin (Stenella attenuate) individuals photo-identified to the cumulative annual identifications during 2014–2022 in the Maui Nui region of Hawaiʻi. The 1:1 linear trend represents the plot that would result if a new individual was added with each identification.
POPAN models
The global goodness-of-fit test was significant (χ2 = 38.85, df = 19, p = 0.005) and indicated some overdispersion in the data. Model selection results were adjusted by the variance inflation factor (ĉ = 2.04), with the resulting top model (lowest QAICc) including constant survival, and time-varying capture probability and probability of entry (Table 1). There were no competing models and the model with the next lowest QAICc value differed only by the inclusion of an uninformative parameter (i.e., nautical miles traveled per year). Survival of marked adults was 0.788 (SE = 0.025; 95% CI = 0.735–0.834). Annual capture probabilities averaged 0.459 (SD = 0.259) and ranged from 0.158 (SE = 0.050) in 2020 to 1.00 (SE = 0.012) in 2014. Excluding the first year of the study (2014), capture probability averaged 0.391 (SD = 0.185), with the highest annual probability of capture during 2017 at 0.667 (SE = 0.094). Estimated probabilities of entry averaged 0.111 (SD = 0.112) and ranged from 0.009 in 2019 (SE = 0.044) to a maximum of 0.339 in 2017 (SE = 0.076). Annual abundance estimates of marked adults (Nm) averaged 77 (SE = 7) and ranged from a low of 52 (SE = 6) in 2014 to a high of 115 (SE = 15) in 2017 (Table 2).
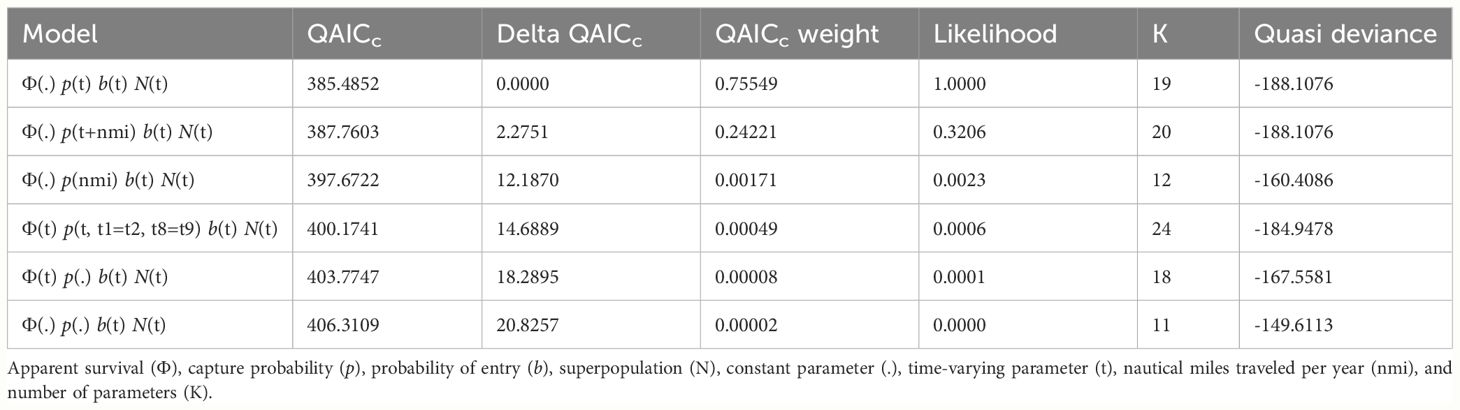
Table 1 Model results from QAICc (Quasi-Akaike Information Criterion corrected for small sample size) selection of POPAN annual sightings data of adult pantropical spotted dolphins (Stenella attenuata attenuata) photo-identified during 2014–2022 in the Maui Nui region of Hawaiʻi.
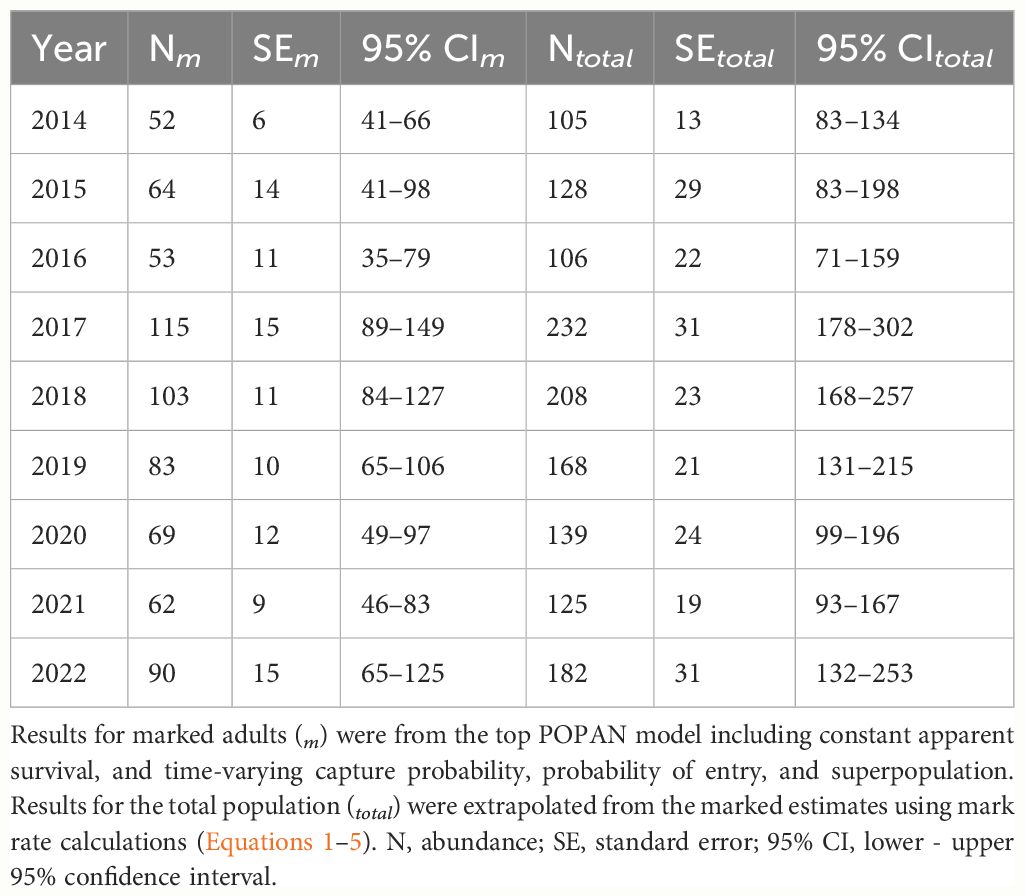
Table 2 Pantropical spotted dolphin (Stenella attenuata attenuata) annual abundance estimates during 2014–2022 in the Maui Nui region of Hawaiʻi.
Mark rate and extrapolated abundances
Following Equations 1–4, we calculated the overall mark rate as 0.495 (SE = 0.010), which resulted in total annual abundance estimates (Ntotal) that averaged 154.87 (SE = 14.25) and ranged from 105 (SE = 13) in 2014 to 232 (SE = 31) in 2017 (Table 2). Overall, the results indicated that generally 250 animals or less used the study area each year. Although abundance estimates fluctuated over time, we found no evidence of an overall trend via visual inspection of the data (Table 2).
Discussion
For such a widely distributed cetacean, there are few estimates of PSD abundance based on photo-identification mark-recapture studies (e.g., Courtin et al., 2023). Our study represents the first abundance estimates based on mark-recapture methods of PSD for the Maui Nui (4-Islands stock), and the first application of these methods to PSD in in the MHI. Although the use of photo-ID on larger groups of cetaceans, and especially those that generally have lower mark rates, can be challenging (Hupman et al., 2018; Hammond et al., 2021; Elliser et al., 2022), we have successfully utilized our large photo-identification catalog (>350 individuals) to conduct an open population abundance analysis spanning nine years.
Photo-identification surveys
Despite challenges such as the COVID-19 pandemic, we achieved substantial survey effort throughout our study averaging over 3,000 nmi/y traveled, with encounters generally spread throughout the calendar year. Our observations of average and maximum group sizes (55.70 and 150, respectively) compare well with that recorded (mean = 60; max = 150) during 36 encounters in the Maui Nui basin during 1999 (Baird et al., 2001).
Our annual recapture rate of individual PSD averaged 1.84, with 41% captured at least twice during different years. This overall recapture rate is similar to that observed in PSD in Guadeloupe (42%), but lower than in Martinque (62%), with frequent users and occasional visitors pooled (Courtin et al., 2023). Guadeloupe’s occasional visitors had a much lower recapture rate (6%) than those in Martinque (48%), which reduced the overall recapture rate (Courtin et al., 2023). We have also likely detected occasional visitors to our study area. Lower resight rates are expected when studying cetacean species in open populations that are also found in group sizes often large enough to preclude entire photographic capture (Elliser et al., 2022). Our resight rate may also be an underestimate because not all photographs were suitable for cataloging (Elliser et al., 2022).
While newly discovered animals generally decreased over time, our discovery curve indicated that new individuals were detected during the final year of the study, suggesting that this open population was not captured entirely (Hupman et al., 2018). Although we were not able to consistently sample all areas that this stock uses, we do not expect detectability to be an issue in the areas we sampled because we surveyed during favorable sea states and because PSD have increased detectability in that they are frequently observed leaping out of the water (Baird et al., 2013). In addition to the first detections of marked adults that were previously present in the study area, some of the newly identified individuals each year could also represent individuals that were recently recruited into the marked adult portion of the population (Bradford et al., 2018).
Our overall mark rate of dorsal fins was 0.495. This is much higher than the PSD mark rate observed in Guadeloupe (0.12) and Martinique (0.09) (Courtin et al., 2023). A direct comparison is difficult because that analysis only used the highest category of photo quality (Q1) from a three-tiered quality scale for their mark rate calculations, whereas we used the top two quality categories (Q1+Q2) from a five-tiered scale (Appendix A) (Courtin et al., 2023). Our approach would have likely resulted in a higher mark rate, depending on the extent of overlap among quality categories. Our mark rate is also higher than that observed in a nearby population of spinner dolphins (S. longirostra) (0.35) (Tyne et al., 2014) – but that study only calculated the mark rate of highly distinct individuals (D1) from a three-tiered scale, whereas we calculated mark rate using very and moderately distinct (D1+D2) from a four-tiered scale (Appendix B). That study also calculated quality differently than our approach (i.e., total scores of 6 to >11 based on the sum of weighted criteria were binned into three quality categories; Tyne et al., 2014). Overall, our approach would likely have resulted in a higher mark rate, depending on the extent of overlap among distinctiveness and quality categories. While attempts were made to photograph all dorsal fins equally (regardless of dorsal distinctiveness categories detailed in Appendix B), if distinctive individuals were more frequently photographed than clean individuals, they would be over-represented and our mark rate would be inflated (Wickman et al., 2021). If our mark rate was artificially high, our extrapolated abundance estimates of the wider population would be correspondingly deflated (Wickman et al., 2021).
Model selection and potential sampling biases
Despite overdispersion in our data as indicated by the global goodness-of-fit test result, the level of excess variation was within acceptable limits and did not indicate inadequate model structure (Anderson et al., 1994). Further, the QAICc model selection method we used performs well with overdispersed capture-recapture data (Anderson et al., 1994). Our top model included time-varying probabilities of capture and entry and constant survival.
Models that consider time-varying probabilities of capture commonly result in incorrect, and sometimes extreme, values for the first period (Courtin et al., 2023), as evidenced in our first-year results (yr = 2014, p = 1.00, SE = 0.01). Exclusive of the first year, our capture probabilities were relatively low and averaged 0.39. Low recapture rates tend to result in decreased precision in survival and abundance estimates (Otis et al., 1978; Williams et al., 2002). Further, the variability of our sampling from year to year introduced uncertainty into our survival and abundance estimates and potential corresponding bias in trend analysis. Although we attempted to account for some of this variability through the evaluation of nautical miles traveled as a predictor of annual capture probability, the top model did not include this covariate. Our annual surveys were not restricted to PSD habitat, as other species were studied concurrently. Thus, our attempt to account for variation in effort via total nautical miles may not have precisely represented effort strictly relevant to PSD detection. We conducted a subsequent exploratory analysis with an effort covariate that only included distance traveled during survey effort in likely PSD habitat. Our model selection results did not change, revealing remaining variation in capture-probabilities unexplained by this alternate version of effort. Some of the observed fluctuations in capture probabilities from year to year may also represent slight variations in field methodologies such as the number of cameras, the average time spent with a group, and the area surveyed (Hupman et al., 2018), as well as ecological and environmental variation (Bradford et al., 2018).
Estimated probabilities of entry varied widely across years and indicated that approximately 70% of the recruitment from the super-population occurred before 2017, with a maximum single year entry probability of 0.339 at the start of 2017. Although some lower probabilities of entry occurred in later years, likely owing in part to reduced surveys related to the COVID-19 pandemic, low probabilities of entry also occurred prior to 2017 (e.g., 0.012 during 2016). Thus, there remains unexplained variation in the entry probabilities unrelated to the pandemic.
Logistical and capacity challenges precluded systematic and consistent surveys of the windward and other remote areas of Maui Nui. Therefore, most of our sampling was focused on the leeward coasts and shallower waters of Maui Nui. Consequently, the area we surveyed likely represents a portion of the range used by the 4-Islands PSD stock. These and other survey restrictions prevented our use of models that assume demographic and geographic closure, and resulted in the possible detection of animals that were not surveyed in other years and/or also were not part of this island-associated stock (Hupman et al., 2018). Including animals from other stocks would artificially inflate the abundance estimate and, if they permanently emigrated during our study, would artificially decrease the apparent survival estimate (Pradel et al., 1997). Movements and affiliations of the insular stocks have not been well studied, and potential social connectivity, population structure, site fidelity, and heterogeneity in habitat use may be unaccounted for in our estimates (e.g., Van Cise et al., 2021). Differential individual habitat use could also negatively bias our apparent survival estimate (Hupman et al., 2018; Van Cise et al., 2021). Similar to transiency, sampling some regions within the study area only a few times can negatively bias apparent survival estimates (Van Cise et al., 2021). The extent to which our spatial sampling may have affected our abundance results is unclear, as a prior study indicated that PSD occurred more often in leeward waters (Pittman et al., 2016). But it was unknown if this apparent distribution was the result of increased sampling effort in leeward areas, greater sightability in less windy waters, habitat preference for calmer areas, or a combination of those factors (Pittman et al., 2016). In another study, the greatest densities of PSD occurred in waters much deeper (approximately 1,500–3,500 m) (Becker et al., 2022) than the mean sighting depth of PSD in leeward Maui Nui (224.32 m; min = 65.20 m; max = 641.50 m; n = 50 sightings during 2013–2018) (Olson et al., 2022). Unfortunately, sampling issues such as these are not uncommon in cetacean population estimation (Bradford et al., 2018). Nevertheless, our results remain useful for current management and as benchmark estimates for future comparisons.
Survival
Pantropical spotted dolphins are considered long-lived mammals (Perrin, 2009) and as such typically exhibit high and near constant survival of adults (Eberhardt, 2002), exclusive of any significant mortality event (e.g., major oil spill, disease outbreak, harmful algal blooms, etc.). Given this and the longevity of PSD relative to the duration of our study (Baird, 2016; Courtin et al., 2023), it is not surprising that the top model included constant survival.
Estimated survival (apparent survival) is the product of true survival and emigration (Schaub and Royle, 2014). If the probability of site fidelity to the study area is not equal to one, apparent survival will underestimate true survival (Schaub and Royle, 2014). Although the effort covariate was not selected in the top model, our generally low estimates of capture probability and apparent survival (0.79) are likely partially due to the variation in survey effort (e.g., Hupman et al., 2018) and non-random sampling (e.g., Van Cise et al., 2021). When comparing our apparent survivability to that from other studies, our estimate approximates that of PSD that were considered frequent users of an area near Guadeloupe (0.80, 95% CI = 0.72–0.85), is lower than frequent users of a different area in the same study near Martinique (1, 95% CI = 1–1), and is markedly higher than that for occasional visitors for both the Guadeloupe and Martinique areas (0.01, 95% CI = 0.003–0.04 and 0.50, 95% CI = 0.39–0.60, respectively) (Courtin et al., 2023). Lower apparent survival in Guadeloupe was suspected to be due to more movement in and out of the study area (Courtin et al., 2023). Similarly, our results may indicate dispersion of individuals from our sampling area (Courtin et al., 2023) and heterogeneity in habitat use (Van Cise et al., 2021). A neighboring Hawaiʻi Island Stenella population (i.e., spinner dolphins), reported a higher survival rate (0.97 ± 0.05, Tyne et al., 2014), but that population was considered to have little movement in or out of the study area.
Migration rates between the island-associated stocks were determined via genetic analysis to be low and on the order of a few individuals per generation (Courbis et al., 2014). However, the stock boundaries set by NOAA (within 20 km of Maui, Kahoʻolawe, Lānaʻi, and Molokaʻi for the 4-Islands stock and within 65 km of Hawaiʻi Island for the Hawaiʻi Island stock; Carretta et al., 2021) overlap, as the ʻAlenuihāhā Channel between Maui and Hawaiʻi Island is only 48 km wide. Similarly, the boundaries of the Oʻahu stock (including waters within 20 km; Carretta et al., 2021) and the 4-Islands stock are within 2 km, as the Kaʻiwi Channel that separates the northwestern-most island of the 4-Islands (i.e., Molokaʻi) and Oʻahu to the northwest is only 42 km wide. Movement data from five PSD that were satellite-tagged inside the three insular stock boundaries, revealed a median of only 65.9% (min = 22.2%, max = 100%) of their locations were within their respective stock boundaries (Baird and Webster, 2019). One dolphin tagged in 2016 near Oʻahu traveled through O‘ahu’s waters for 13 days, then moved to the windward waters of Molokaʻi and Maui for about three days, and then was located north of Hawaiʻi Island for the final three and a half days of tag transmission data (Baird and Webster, 2019). Thus, while genetic migration data demonstrated the various island-associated stocks generally did not interbreed (Courbis et al., 2014), the limited movement data available indicated there was some overlap in habitat use (Baird and Webster, 2019).
Robust design models that utilize primary open and secondary closed periods (demographic and geographic closure) allow for the estimation of emigration (Kendall et al., 1997). Unfortunately, our sampling methods precluded the use of such models. While our lower survival is potentially due to some migration during the study period and to our varied sampling, the possibility that some level of mortality may be occurring cannot be excluded. Apart from lethal interactions with humans, predators of PSD in Hawaiʻi include sharks such as the tiger shark, Galeocerdo cuvier (Maldini, 2003; Baird, 2016), and the cookie-cutter shark, Isistius brasiliensis (Jones, 1971; Baird, 2016), the killer whale, Orcinus orca (Perrin and Hohn, 1994; Baird, 2016), the false killer whale, Pseudorca crassidens (Perryman and Foster, 1980), likely the pygmy killer whale, Feresa attenuta (Perrin and Hohn, 1994), and possibly the short-finned pilot whale, Globicephala macrorhyncus (Perrin, 2009). Additional threats to the population are discussed below.
Abundance
In addition to potential sources of bias discussed above, misidentification of individuals can also cause bias in abundance estimates. Our use of only distinctive individuals (D1+D2) in our mark-recapture analysis and our cataloging protocols minimized this source of bias. Like others (e.g., Bradford et al., 2018; Hupman et al., 2018; Van Cise et al., 2021), we combined our research survey data with data collected from platforms of opportunity and information from donated photographs to maximize our sample.
Although our data were collected year-round and lacked a strong seasonal peak when pooled across years, our sampling was insufficient to explore seasonal abundance. A previous habitat-based abundance estimate for the 4-Islands stock included only depth as a predictor variable (Becker et al., 2022), and therefore, was also not useful for assessing seasonal variations. Research using data collected from tour boats in the relatively shallow and leeward waters of Maui documented increased sightings of PSD during summer (Self et al., 2021). Another study predicted dispersed summer and restricted winter PSD distributions (Pittman et al., 2016), but given potential sampling bias, further research was recommended (Bradford et al., 2022).
Our annual abundance estimates suggested a small population, generally less than 250 individuals, used our sampled area each year. We may have underestimated the 4-Islands stock abundance because our survey area did not consistently include the full range of the stock, especially the windward and more remote areas, and we cannot confidently conclude that all distinctive individuals passed through the areas we surveyed (Bradford et al., 2018). Any potential underestimate would not necessarily be directly proportional to unsurveyed areas because of the high mobility of PSD. Given the unquantified effects of potential sampling bias in our study, we did not attempt a statistical trend analysis of the annual abundance estimates (Bradford et al., 2018). Visual inspection of the estimates did not support evidence for either an overall declining or increasing trend (Table 2).
Our annual abundance estimates approximate the PSD effective population size (220) determined by genetics for the neighboring Hawaiʻi Island stock (Courbis et al., 2014), but are much smaller than the predicted habitat-based estimate of 1,650 (95% CI = 748–3,639) for the 4-Islands stock (Becker et al., 2022). The extent to which this habitat-based estimate represents the 4-Islands stock is uncertain because it used pooled data from the MHI insular stock complex that contained only four sightings from the 4-Islands stock area and because depth was the only predictor variable in the model (Becker et al., 2022). Perhaps there is limited preferred habitat for this species in our study area due to the typically shallower waters (Grigg et al., 2002; Courbis et al., 2014). Alternatively, this may be an example of niche separation with the 4-Islands stock preferring the shallower waters of Maui Nui (Courbis et al., 2014; Courtin et al., 2023).
In addition to limited preferred habitat, dolphin abundance may also be reduced by inadequate prey resources (Cobarrubia-Russo et al., 2021). If prey resources were limited, that could result in dolphins traveling farther to obtain food (i.e., emigrating out of the study area; Courtin et al., 2023), resulting in a decline in apparent local abundance.
Conservation implications
Effective management decisions are best made in concert with recent population abundance estimates (Tyne et al., 2014). Prior to our research, no reliable estimates existed for the 4-Islands PSD stock (Becker et al., 2022; Bradford et al., 2022). With appropriate caveats as discussed above, our last annual estimate can be utilized to determine the minimum population estimate required in potential biological removal calculations (Wade and Angliss, 1997) for NOAA’s PSD 4-Islands stock assessment report (e.g., Bradford et al., 2018). Because small populations, in general, are at greater conservation risk (Gilpin and Soulé, 1986), it is critical to understand how threats to their populations may affect abundance. Our abundance estimates of the 4-Islands PSD stock will be useful in conservation management decisions related to both current and emerging threats in Hawaiʻi.
Threats such as fisheries interactions and vessel traffic exposure (Baird and Webster, 2020; Machernis et al., 2021), pathogens such as cetacean morbillivirus (Jacob et al., 2016), and marine debris (Bradford and Lyman, 2019) have been identified in the MHI, but additional research on precise impacts, extent, and prevalence is warranted. The extent of fishery interaction impacts at the PSD stock or population levels in Hawai‘i remains unknown. Fishers in Hawaiʻi are known to exploit the association between PSD and yellowfin tuna (Thunnus albacares) in tuna hook and line fisheries (Baird and Webster, 2020). Such commercial and recreational troll fisheries in Hawaiʻi move their vessels within or to the front of dolphin groups while pulling lines behind them (Courbis et al., 2014; Baird and Webster, 2020). While the specific impacts of this targeted fishing approach remain unknown, PSD groups with fishing vessels present near Hawaiʻi Island were observed in a narrower depth range and in a reduced geographic area than dolphin groups without fishing vessels present (Baird and Webster, 2020). Furthermore, a recent analysis from Maui Nui of the 4-Islands PSD stock found that 12.0% exhibited fishery-related dorsal fin scars (Machernis et al., 2021). While the precise extent of these fishery interactions is undetermined, research demonstrates it is widespread, occurs frequently, and involves many dolphins (Baird and Webster, 2020).
In addition to direct interactions with fishery gear, PSD may also be affected by competition with fisheries for prey. During our surveys, we did not observe PSD in poor body condition (Currie et al., 2021) that might have indicated the Maui Nui population was prey-limited either from overfishing or from potential competition with other dolphin species. Whether overfishing may be a concern to PSD prey in the Maui Nui area is unclear due partly to the number of recreational fishers being unknown, although a previous study noted that over 2,000 small-scale fishers held state licenses in Hawaiian waters (Baird and Webster, 2020). Additional research on the 4-Islands stock foraging habits and their prey base would be helpful in elucidating whether prey limitation may be affecting this stock.
The 4-Islands stock of PSD also faces the widespread threat of vessel traffic (Olson et al., 2022). Pantropical spotted dolphins in Maui Nui were determined to be exposed to vessel traffic risk throughout their distribution, with the highest risk in deeper, offshore waters (Olson et al., 2022). Further, acoustic (and other) disturbance from vessels could affect their natural behaviors (Baird, 2016). Although PSD are not known for resting in nearshore bays like some spinner dolphin groups (Tyne et al., 2014), they may still be affected by unregulated tourism during their day-time resting periods. Our PSD photo-identification catalog also includes evidence of direct vessel impacts (e.g., propeller scars, blunt injuries) to several PSD.
During 2007–2012, 55 entanglements or hooked-with-marine-debris events were reported for cetaceans in Hawaiian waters (Bradford and Lyman, 2015). In 2010, a PSD was observed in the 4-Islands area with multiple wraps of unidentified gear (Bradford and Lyman, 2015). In 2017, a PSD was documented by our research team in the 4-Islands region, with a band of non-fishery-related debris around its rostrum that prevented its mouth from opening (Bradford and Lyman, 2019). Because these two entanglement instances were not part of a systematic effort to document marine debris, actual marine debris entanglement impacts to PSD in Hawaiian waters are likely more extensive (Bradford and Lyman, 2015). Marine debris also poses health risks to cetaceans due to ingestion, and, like entanglement, is also probably underreported (Currie et al., 2017).
Population level impacts of pathogens to PSD are also understudied. For example, the virus cetacean morbillivirus (CeMV) can cause lesions in the lungs, lymph nodes, and brains of cetaceans and has resulted in many epizootics in the Atlantic Ocean with high rates of mortality (Jacob et al., 2016). A novel strain of CeMV has been detected in the tissues from strandings of 12 cetacean species in Hawaiʻi, including PSD (Jacob et al., 2016). Although it has not yet been documented within the 4-Islands stock of PSD, it is thought to be common in the region with one-fourth of cetaceans in Hawaiʻi being affected (Jacob et al., 2016). The prevalence of this novel strain is concerning, especially given how disease impacts can be intensified when interacting with other stressors (Carretta et al., 2021), such as climate change (Lettrich et al., 2023).
We found no publications assessing the MHI insular stocks of PSD for vulnerability to climate change impacts, but as island-associated delphinids, the vulnerability of these stocks to climate change is unlikely to be low (Tyne et al., 2014; Lettrich et al., 2023). Changes in ocean chemistry, circulation, and temperature may adversely affect PSD both directly and indirectly (e.g., through their prey) (Lettrich et al., 2023). Further, any associated potential habitat shifts by PSD in response to climate change would be difficult given the geographic isolation of the insular stocks from other segments of the species’ range and from other suitable habitats (Lettrich et al., 2023). Climate change may exacerbate other existing threats as well, such as fisheries interactions, vessel impacts, and disease, creating synergistic effects (Carretta et al., 2021; Lettrich et al., 2023).
Small, island-associated populations tend to be at heightened conservation risk in general (Tyne et al., 2014; Methion and Diáz López, 2018; Silva et al., 2020; Cobarrubia-Russo et al., 2021). Our benchmark findings are important for assessing these and other future threats to PSD in Hawaiʻi, and are particularly useful for future comparisons and in guiding research because they were documented prior to major environmental catastrophes.
Future survey and research recommendations
Our study utilized data that were not collected specifically for use in mark-recapture models. A systematic approach designed specifically to determine PSD abundance and survival using mark-recapture models would likely result in increased capture rates, which can reduce the impacts of heterogeneity in capture probabilities and can improve precision of survival and abundance estimates (Otis et al., 1978; Williams et al., 2002; Van Cise et al., 2021). Furthermore, our study focused primarily on the leeward and shallower waters of Maui Nui. To better assess the 4-Islands stock’s abundance and survival, and to confirm overall and seasonal distributions, increased sampling of windward Maui Nui and channels are warranted. These areas are particularly difficult to survey given the strength and direction of the consistent winds in the region (Stack et al., 2020; Van Cise et al., 2021).
Additional temporal and spatial effort in such systematic surveys should result in less biased estimates more suitable for trend analysis (Bradford et al., 2018). Future studies that incorporate the full range of the 4-Islands stock would also provide greater resolution on residency and habitat use. A more complete understanding of the movements within and between the PSD insular stocks in the MHI is needed to determine if some of the animals we detected belonged to different stocks (Courbis et al., 2014; Baird and Webster, 2019; Carretta et al., 2021). As more areas are sampled (including windward waters), what is conventionally considered preferred PSD habitat may need to be revised. Habitat use may also vary on an individual dolphin basis (and may be related to age and sex), with some dolphins frequently using an area compared to occasional visitors also detected in the same area (e.g., Courtin et al., 2023). Notably, three of out five PSD that were satellite tagged in insular stock boundaries tended to use shallower habitat with median depths recorded at tagged animal locations of less than 1,000 m (Baird and Webster, 2019).
In addition to recommendations to improve surveys, further research into the magnitude of and trends in threat impacts is warranted. Threats facing PSD (such as climate change) can result in emigration from the study area (either temporary or permanent) (Lettrich et al., 2023). To best track this potential displacement, coordinated research with neighboring studies including visual, acoustic, genetic, and other biological data could help to determine connectivity, movements, population dynamics, social structure, and other life history parameters. Given logistic (e.g., weather) and funding constraints, researchers should also explore combining different data platforms, such as tag data, to better inform the modeling process.
The year-round presence of PSD and site fidelity, as indicated by individual resightings during the nine years of our study, illustrate that the Maui Nui region is important habitat for this small, resident population. Ongoing monitoring of this population at finer resolution, and in relationship to environmental variables and potential stressors, is necessary as threats increase, such as demonstrated by the recent climate-change related Maui coastal wildfire disaster (some potential wildfire impacts to cetaceans include inhalation of smoke, influx of ash, debris, and chemicals into coastal waters, algal blooms, and disruption of food chains; e.g., Santori et al., 2023). Our study area also overlapped with portions of the Hawaiian Islands Humpback Whale National Marine Sanctuary, an area comprising vital breeding and calving wintering grounds for humpback whales (Aki et al., 1994). Thus, Maui Nui is not only a critical area for both conservation and future research of PSD, but for other species, as well, that depend on this unique ecosystem for their long-term persistence.
Data availability statement
The original contributions presented in the study are included in the article/Supplementary Material, further inquiries can be directed to the corresponding author/s.
Ethics statement
The animal study was approved by the National Oceanic and Atmospheric Administration as part of the permitting process. This research was conducted under NMFS LOC 18101 and NMFS MMPA/ESA Permit # 21321. The study was conducted in accordance with the local legislation and institutional requirements.
Author contributions
SB-M: Conceptualization, Formal analysis, Investigation, Methodology, Project administration, Supervision, Visualization, Writing – original draft, Writing – review & editing. GO: Data curation, Investigation, Visualization, Writing – review & editing. JC: Conceptualization, Funding acquisition, Investigation, Project administration, Supervision, Writing – review & editing.
Funding
The author(s) declare financial support was received for the research, authorship, and/or publication of this article. We thank the members and supporters of Pacific Whale Foundation (PWF) for providing funding for this study.
Acknowledgments
We appreciate the many research volunteers and staff who contributed to the data collection and processing, and particularly Elizabeth Beato, former PWF Research Assistant. We thank the University of Hawaiʻi Marine Mammal Research Program for their cooperation during 2021 and 2022 surveys near Lānaʻi. We also thank the PacWhale Eco-Adventures captains and naturalists and members of the public who contributed data. This research was conducted under NMFS LOC 18101 and NMFS/MMPA Permit # 21321. We are grateful to the two reviewers of an earlier draft for improving our work.
Conflict of interest
The authors declare that the research was conducted in the absence of any commercial or financial relationships that could be construed as a potential conflict of interest.
The author(s) declared that they were an editorial board member of Frontiers, at the time of submission. This had no impact on the peer review process and the final decision.
Publisher’s note
All claims expressed in this article are solely those of the authors and do not necessarily represent those of their affiliated organizations, or those of the publisher, the editors and the reviewers. Any product that may be evaluated in this article, or claim that may be made by its manufacturer, is not guaranteed or endorsed by the publisher.
Supplementary material
The Supplementary Material for this article can be found online at: https://www.frontiersin.org/articles/10.3389/fmamm.2024.1412415/full#supplementary-material
References
Aki K., Brock R., Miller J., Mobley J. R., Rappa P. J., Tarnas D., et al. (1994). A site characterization study for the Hawaiian Islands Humpback Whale National Marine Sanctuary. Available at: https://repository.library.noaa.gov/view/noaa/46822 (Accessed Dec. 11, 2023).
Anderson D. R., Burnham K. P., White G. C. (1994). AIC model selection in overdispersed capture-recapture data. Ecology 75, 1780–1793. doi: 10.2307/1939637
Arnold T. W. (2010). Uninformative parameters and model selection using Akaike's Information Criterion. J. Wildlife Manage. 74, 1175–1178. doi: 10.1111/j.1937-2817.2010.tb01236.x
Baird R. W. (2016). The lives of Hawai‘i’s dolphins and whales: natural history and conservation. (Honolulu, HI: University of Hawai‘i Press), 341. doi: 10.1515/9780824865931
Baird R. W., Gorgone A. M., McSweeney D. J., Ligon A. D., Deakos M. H., Webster D. L., et al. (2009). Population structure of island-associated dolphins: Evidence from photo-identification of common bottlenose dolphins (Tursiops truncatus) in the main Hawaiian Islands. Mar. Mammal Sci. 25, 251–274. doi: 10.1111/mms.2009.25.issue-2
Baird R. W., Ligon A. D., Hooker S. K., Gorgone A. M. (2001). Subsurface and nighttime behaviour of pantropical spotted dolphins in Hawai‘i. Can. J. Zool. 79, 988–996. doi: 10.1139/z01-070
Baird R. W., Webster D. L. (2019). Movements of satellite-tagged pantropical spotted dolphins in relation to stock boundaries in Hawaiian waters. (Olympia, WA: Cascadia Research Collective), 13.
Baird R. W., Webster D. L. (2020). Using dolphins to catch tuna: Assessment of associations between pantropical spotted dolphins and yellowfin tuna hook and line fisheries in Hawai‘i. Fish. Res. 230, 105652. doi: 10.1016/j.fishres.2020.105652
Baird R. W., Webster D. L., Aschettino J. M., Schorr G. S., McSweeney D. J. (2013). Odontocete cetaceans around the main Hawaiian Islands: Habitat use and relative abundance from small-boat sighting surveys. Aquat. Mamm 39, 253–269. doi: 10.1578/AM.39.3.2013.253
Becker E. A., Forney K. A., Oleson E. M., Bradford A. L., Hoopes R., Moore J. E., et al. (2022). Abundance, distribution, and seasonality of cetaceans within the US exclusive economic zone around the Hawaiian archipelago based on species distribution models (U.S. Dept. of Commerce, NOAA Technical Memorandum NOAA-TM-NMFS-PIFSC-131). 45 p. doi: 10.25923/9e50-d280
Bolaños-Jiménez J., Morteo E., Fruet P. F., Delfín-Alfonso C. A., Secchi E. R., Bello-Pineda J. (2022). Seasonal population parameters reveal sex-related dynamics of common bottlenose dolphins in open waters of the southwestern Gulf of Mexico. Mar. Mammal Sci. 38, 705–724. doi: 10.1111/mms.12897
Bradford A. L., Baird R. W., Mahaffy S. D., Gorgone A. M., McSweeney D. J., Cullins T., et al. (2018). Abundance estimates for management of endangered false killer whales in the main Hawaiian Islands. Endanger. Species Res. 36, 297–313. doi: 10.3354/esr00903
Bradford A. L., Forney K. A., Oleson E. M., Barlow J. (2017). Abundance estimates of cetaceans from a line-transect survey within the U.S Hawaiian Islands Exclusive Economic Zone. Fish. B-NOAA 115, 129–142. doi: 10.7755/FB.115.2.1
Bradford A. L., Lyman E. (2015). Injury determinations for humpback whales and other cetaceans reported to NOAA response networks in the Hawaiian Islands during 2007–2012 (U.S. Dep. Commer., NOAA Tech. Memo., NOAA-TM-NMFS-PIFSC-45). 29p. doi: 10.7289/V5TX3CB1
Bradford A. L., Lyman E. G. (2019). Injury determinations for humpback whales and other cetaceans reported to NOAA response networks in the Hawaiian Islands during 2017 (U.S. Dept. of Commerce, NOAA Technical Memorandum NMFS-PIFSC-81). 18 p. doi: 10.25923/7csm-h961
Bradford A. L., Yano K. M., Oleson E. M. (2022). Estimating the Winter Abundance of Cetaceans around the Main Hawaiian Islands (U.S. Dept. of Commerce, NOAA Technical Memorandum NMFS-PIFSC-135). 42 p. doi: 10.25923/801q-ke40
Burnham K. P., Anderson D. R., White G. C., Brownie C., Pollock K. H. (1987). Design and analysis methods for fish survival experiments based on release-recapture. Am. Fish. Soc Monogr. 5, 1–437.
Burnham K. P., Anderson D. R. (2004). Multimodel inference: Understanding AIC and BIC in model selection. Sociol. Method. Res. 33(2), 261–304. doi: 10.1177/0049124104268644
Carretta J. V., Oleson E. M., Forney K. A., Muto M. M., Weller D. W., Lang A. R., et al. (2021). “Pantropical Spotted Dolphin (Stenella attenuata attenuata): Hawaii Islands Stock Complex – Oʻahu, 4-Islands, Hawaiʻi Island, and Hawaiʻi Pelagic Stocks (revised 5/2021),” in U.S. Pacific marine mammal stock assessments: 2020 (U.S. Department of Commerce, NOAA Technical Memorandum NOAA-TM-NMFS-SWFSC-646), Pp. 238–244.
Cobarrubia-Russo S., Barber-Meyer S., Barreto G. R., Molero-Lizarraga A. (2021). Historic population estimates for bottlenose dolphins (Tursiops truncatus) in Aragua, Venezuela, indicate monitoring need. Aquat. Mamm 47, 10–20. doi: 10.1578/AM.47.1.2021.10
Courbis S., Baird R. W., Cipriano F., Duffield D. (2014). Multiple populations of pantropical spotted dolphins in Hawaiian waters. J. Hered. 105, 627641. doi: 10.1093/jhered/esu046
Courtin B., Millon C., Feunteun A., Safi M., Duporge N., Bolaños-Jiménez J., et al. (2023). Site fidelity and population parameters of pantropical spotted dolphins in the Eastern Caribbean through photographic identification. Front. Mar. Sci. 10. doi: 10.3389/fmars.2023.939263
Currie J. J., Stack S. H., McCordic J. A., Kaufman G. D. (2017). Quantifying the risk that marine debris poses to cetaceans in coastal waters of the 4-Islands region of Maui. Mar. pollut. Bull. 121, 69–77. doi: 10.1016/j.marpolbul.2017.05.031
Currie J. J., van Aswegen M., Stack S. H., West K. L., Vivier F., Bejder L. (2021). Rapid weight loss in free ranging pygmy killer whales (Feresa attenuata) and the implications for anthropogenic disturbance of odontocetes. Sci. Rep. 11, 8181. doi: 10.1038/s41598-021-87514-2
Dizon A. E., Perrin W. F., Akin P. A. (1994). Stocks of dolphins (Stenella spp. and Delphinus delphis) in the eastern tropical Pacific: a phylogeographic classification. Vol. 119 (NOAA Technical Report NMFS). 20 pp.
Eberhardt L. L. (2002). A paradigm for population analysis of long-lived vertebrates. Ecology 83, 2841–2854. doi: 10.1890/0012-9658(2002)083[2841:APFPAO]2.0.CO;2B
Elliser C. R., van der Linde K., MacIver K. (2022). Adapting photo-identification methods to study poorly marked cetaceans: a case study for common dolphins and harbor porpoises. Mamm. Biol. 102, 811–827. doi: 10.1007/s42991-021-00194-3
Gilpin M. E., Soulé M. E. (1986). “Minimum viable populations: Processes of extinction,” in Conservation biology: The science of scarcity and diversity. Ed. Soulé M. E. (Sinauer Associates, Sunderland, MA), 19–34.
Grigg R., Grossman E., Earle S., Gittings S., Lott D., McDonough J. (2002). Drowned reefs and antecedent karst topography, Auʻau Channel, SE Hawaiian Islands. Coral Reefs 21, 73–82. doi: 10.1007/s00338-001-0203-8
Hammond P. S., Francis T. B., Heinemann D., Long K. J., Moore J. E., Punt A. E., et al. (2021). Estimating the abundance of marine mammal populations. Front. Mar. Sci. 8. doi: 10.3389/fmars.2021.735770
Hammond P. S., Mizroch S. A., Donovan G. P. (1990). Report of the workshop on individual recognition and the estimation of cetacean population parameters. Individual recognition of cetaceans: Use of photo-identification and other techniques to estimate population parameters. Rep. Int. Whal. Commun. Special Issue 12, 1–17.
Hill M. C., Bradford A. L., Andrews K. R., Baird R. W., Deakos M. H., Johnston D. W., et al. (2011). Abundance and movements of spinner dolphins off the main Hawaiian Islands. (Pacific Islands Fisheries Science Center Working Paper WP-11-013), 34.
Hupman K., Stockin K. A., Pollock K., Pawley M. D., Dwyer S. L., Lea C., et al. (2018). Challenges of implementing Mark-recapture studies on poorly marked gregarious delphinids. PLoS One 13, e0198167. doi: 10.1371/journal.pone.0203356
Jacob J. M., West K. L., Levine G., Sanchez S., Jensen B. A. (2016). Initial characterization of novel beaked whale morbillivirus in Hawaiian cetaceans. Dis. Aquat. Organ. 117, 215227. doi: 10.3354/dao02941
Jolly G. M. (1965). Explicit estimates from capture-recapture data with both death and immigration-stochastic model. Biometrika 52, 225. doi: 10.2307/2333826
Jones E. C. (1971). Isistius brasiliensis, a squaloid shark, the probable cause of crater wounds on fishes and cetaceans. Fish. Bull. 69, 791–798.
Kendall W. L., Nichols J. D., Hines J. E. (1997). Estimating temporary emigration using capture–recapture data with Pollock’s robust design. Ecology 78, 563–578. doi: 10.1890/0012-9658(1997)078[0563:ETEUCR]2.0.CO;2
Lebreton J. D., Burnham K. P., Clobert J., Anderson D. R. (1992). Modeling survival and testing biological hypotheses using marked animals: a unified approach with case studies. Ecol. Monogr. 62, 67–118. doi: 10.2307/2937171
Lettrich M. D., Asaro M. J., Borggaard D. L., Dick D. M., Griffis R. B., Litz J. A., et al. (2023). Vulnerability to climate change of United States marine mammal stocks in the western North Atlantic, Gulf of Mexico, and Caribbean. PLoS One 18, e0290643. doi: 10.1371/journal.pone.0290643
Machernis A. F., Stack S. H., Olson G. L., Sullivan F. A., Currie J. J. (2021). External Scarring as an Indicator of Fisheries Interactions with Bottlenose (Tursiops truncatus) and Pantropical Spotted (Stenella attenuata) Dolphins in Maui Nui, Hawai‘i. Aquat. Mamm. 47, 482–498. doi: 10.1578/AM.47.5.2021.482
Maldini D. (2003). Evidence of predation by a tiger shark (Galeocerdo cuvier) on a spotted dolphin (Stenella attenuata) off Oʻahu, Hawai‘i. Aquat. Mamm. 29, 84–87. doi: 10.1578/016754203101023915
Methion S., Diáz López B. (2018). Abundance and demographic parameters of bottlenose dolphins in a highly affected coastal ecosystem. Mar. Freshw. Res. 69, 1355–1364. doi: 10.1071/MF17346
Oleson E. M., Baird R. W., Martien K. K., Taylor B. L. (2013). Island-associated stocks of odontocetes in the main Hawaiian Islands: A synthesis of available information to facilitate evaluation of stock structure (PIFSC Working Paper WP13003), 40.
Olson G. L., Stack S. H., Machernis A. F., Sullivan F. A., Currie J. J. (2022). Mapping the exposure of pantropical spotted dolphins and common bottlenose dolphins to different categories of vessel traffic in Maui Nui, Hawai‘i. Aquat. Mamm. 48, 167–181. doi: 10.1578/AM.48.2.2022.167
Otis D. L., Burnham K. P., White G. C., Anderson D. R. (1978). Statistical inference from capture data on closed animal populations. Wildlife Monogr. 62, 3–135. Available at: https://www.jstor.org/stable/3830650.
Perrin W. F. (1975). Variation of spotted and spinner porpoise (genus Stenella) in the eastern tropical Pacific and Hawaii Vol. 21 (University of California, San Diego, La Jolla, California, USA. University of California Press: Bull. Scripps Inst. Oceanogr). Available at: https://escholarship.org/uc/item/2dq444zq. 206 pp.
Perrin W. F. (2009). “Pantropical spotted dolphin,” in Encyclopedia of marine mammals, 2nd edn. Eds. Würsig B., Perrin W. F., M.“Hans” Thewissen J. G. (Academic Press Inc, London, UK), 819–821. doi: 10.1016/B978-0-12-373553-9.00192-9
Perrin W. F., Hohn A. A. (1994). “Pantropical spotted dolphin Stenella attenuata,” in Handbook of Marine Mammals, London: London Academic Press, vol. 5. , 71–98.
Perrin W. F., Schnell G. D., Hough D. J., Gilpatrick J. W. Jr., Kashiwada J. V. (1994). Reexamination of geographical variation in cranial morphology of the pantropical spotted dolphin, Stenella attenuata, in the eastern Pacific. Fish. Bull. 92, 324346. London Academic Press, London.
Perryman W. L., Foster T. C. (1980). “Preliminary report on predation by small whales, mainly the false killer whale, Pseudorca crassidens, on dolphins (Stenella spp. and Delphinus delphis) in the eastern tropical Pacific,” in Southeast Fisheries Center Admin. Rep. (Southwest Fisheries Center, La Jolla, CA). LJ—80-05.
Pittman S. J., Winship A. J., Poti M., Kinlan B. P., Leirness J. B., Baird R. W., et al. (2016). “Chapter 6: Marine mammals - cetaceans,” in Marine biogeographic assessment of the main Hawaiian Islands. Bureau of Ocean Energy Management and National Oceanic and Atmospheric Administration. Eds. Costa B. M., Kendall M. S. (OCS Study BOEM 2016-035 and NOAA Technical Memorandum NOS NCCOS), 227–265. 214, 359
Pradel R., Hines J. E., Lebreton J. D., Nichols J. D. (1997). Capture–recapture survival models taking account of transients. Biometrics 53, 60–72. doi: 10.2307/2533097
Pryor K., Shallenberger I. K. (1991). “Chapter five: Social structure in spotted dolphins (Stenella attenuata) in the tuna purse seine fishery in the Eastern Tropical Pacific,” in Dolphin societies: Discoveries and puzzles. Eds. Pryor K., Norris K. S. (Berkeley, Los Angeles, London: University of California Press), 161–198.
Rosel P. E., Hohn A. A., Mullin K., Garrison L. P., Schwacke L. H., Adams J., et al. (2011). “Photo-identification capture-mark-recapture techniques for estimating abundance of bay, sound and estuary populations of Bottlenose dolphins along the US East Coast and Gulf of Mexico, a workshop report,” in NOAA Technical Memorandum NMFS-SEFSC-621 (Southeast Fisheries Science Center, Lafayette, LA), 38. Available at: https://repository.library.noaa.gov/view/noaa/4014.
Santori C., Rowe S., Smyth C. (2023). “The impacts of the 2019–20 wildfires on marine species and ecosystems,” in Australia's Megafires: Biodiversity Impacts and Lessons from 2019–2020 (CISRO Publishing, Melbourne, Australia), 78.
Schaub M., Royle J. A. (2014). Estimating true instead of apparent survival using spatial Cormack–Jolly–Seber models. Methods Ecol. Evol. 5, 1316–1326. doi: 10.1111/2041-210X.12134
Schwarz C. J., Arnason A. N. (1996). A general methodology for the analysis of capture-recapture experiments in open populations. Biometrics 52, 860–873. doi: 10.2307/2533048
Schwarz C. J., Seber G. A. F. (1999). Estimating animal abundance: review III. Stat. Sci. 14, 427–456. doi: 10.1214/ss/1009212521
Seber G. A. F. (1965). A note on the multiple-recapture census. Biometrika 52, 1–2, 249–259. doi: 10.1093/biomet/52.1-2.249
Self H., Stack S. H., Currie J. J., Lusseau D. (2021). Tourism informing conservation: The distribution of four dolphin species varies with calf presence and increases their vulnerability to vessel traffic in the four-island region of Maui, Hawaiʻi. Ecol. Solut. Evid. 2, e12065. doi: 10.1002/2688-8319.12065
Silva D., Young R. F., Lavin A., O’Shea C., Murray E. (2020). Abundance and seasonal distribution of the southern North Carolina Estuarine System stock of common bottlenose dolphins (Tursiops truncatus). J. Cetacean Res. Manage. 21, 33–43. doi: 10.47536/jcrm.v2lil.175
Stack S. H., Olson G. L., Neamtu V., Machernis A. F., Baird R. W., Currie J. J. (2020). Identifying spinner dolphin Stenella longirostris longirostris movement and behavioral patterns to inform conservation strategies in Maui, Nui, Hawaiʻi. Mar. Ecol. Prog. Ser. 644, 187–197. doi: 10.3354/meps13347
Syme J., Kiszka J. J., Parra G. J. (2022). How to define a dolphin “group”? Need for consistency and justification based on objective criteria. Ecol. Evol. 12, e9513. doi: 10.1002/ece3.9513
Thompson J. W., Zero V. H., Schwacke L. H., Speakman T. R., Quigley B. M., Morey J. S., et al. (2022). finFindR: Automated recognition and identification of marine mammal dorsal fins using residual convolutional neural networks. Mar. Mammal Sci. 38, 139–150. doi: 10.1111/mms.12849
Traill L. W., Bradshaw C. J., Brook B. W. (2007). Minimum viable population size: A meta-analysis of 30 years of published estimates. Biol. Conserv. 139, 159–166. doi: 10.1016/j.biocon.2007.06.011
Tyne J. A., Pollock K. H., Johnston D. W., Bejder L. (2014). Abundance and survival rates of the Hawai‘i Island associated spinner dolphin (Stenella longirostris) stock. PLoS One 9, e86132. doi: 10.1371/journal.pone.0086132
Urian K., Gorgone A., Read A., Balmer B., Wells R. S., Berggren P., et al. (2015). Recommendations for photo-identification methods used in capture-recapture models with cetaceans. Mar. Mammal Sci. 31, 298–321. doi: 10.1111/mms.12141
Van Cise A. M., Baird R. W., Harnish A. E., Currie J. J., Stack S. H., Cullins T., et al. (2021). Mark-recapture estimates suggest declines in abundance of common bottlenose dolphin stocks in the main Hawaiian Islands. Endanger. Species Res. 45, 37–53. doi: 10.3354/esr01117
Wade P. R., Angliss R. P. (1997). Guidelines for Assessing Marine Mammal Stocks: Report of the GAMMS Workshop April 35, 1996, Seattle, Washington (U.S. Dept. of Commerce, NOAA Technical Memorandum NMFSOPR12), 93.
White G. C., Anderson D. R., Burnham K. P., Otis D. L. (1982). Capture-recapture and removal methods for sampling closed populations. LA-8787-NERP (Los Alamos, NM: Los Alamos National Laboratory), 14.
White G., Burnham K. (1999). Program MARK: survival estimation from populations of marked animals. Bird Study 46, s120–s139. doi: 10.1080/00063659909477239
Wickman L., Rayment W., Slooten E., Dawson S. M. (2021). Recommendations for estimating mark rate of cetaceans in photo-ID research: A critique of field sampling protocols and variance estimation. Mar. Mammal Sci. 37, 328–343. doi: 10.1111/mms.12723
Williams B. K., Nichols J. D., Conroy M. J. (2002). Analysis and management of animal populations: Modeling, estimation, and decision making. (San Diego, CA: Academic Press), 817.
Wilson B., Hammond P. S., Thompson P. M. (1999). Estimating size and assessing trends in a coastal bottlenose dolphin population. Ecol. Appl. 9, 288–300. doi: 10.1890/1051-0761(1999)009[0288:ESAATI]2.0.CO;2
Keywords: abundance, 4-Islands stock, Hawaiʻi, insular, marine mammal management, mark-recapture, pantropical spotted dolphin (Stenella attenuata attenuata), photo-identification
Citation: Barber-Meyer SM, Olson GL and Currie JJ (2024) Pantropical spotted dolphin (Stenella attenuata attenuata) abundance estimates in Maui Nui, Hawaiʻi reveal small population in need of monitoring. Front. Mamm. Sci. 3:1412415. doi: 10.3389/fmamm.2024.1412415
Received: 04 April 2024; Accepted: 17 June 2024;
Published: 12 July 2024.
Edited by:
Christian Timothy Chimimba, University of Pretoria, South AfricaReviewed by:
Joseph Shostell, University of Minnesota Crookston, United StatesFranciele Rezende De Castro, Instituto Aqualie, Brazil
Copyright © 2024 Barber-Meyer, Olson and Currie. This is an open-access article distributed under the terms of the Creative Commons Attribution License (CC BY). The use, distribution or reproduction in other forums is permitted, provided the original author(s) and the copyright owner(s) are credited and that the original publication in this journal is cited, in accordance with accepted academic practice. No use, distribution or reproduction is permitted which does not comply with these terms.
*Correspondence: Shannon M. Barber-Meyer, c2hhbm5vbmJhcmJlcm1leWVyQHBhY2lmaWN3aGFsZS5vcmc=