 Cortney A. Watt
 Cody G. Carlyle
 Claire A. Hornby
 Bryanna A. H. Sherbo
95% of researchers rate our articles as excellent or good
Learn more about the work of our research integrity team to safeguard the quality of each article we publish.
Find out more
ORIGINAL RESEARCH article
Front. Mamm. Sci. , 07 July 2023
Sec. Life History and Conservation
Volume 2 - 2023 | https://doi.org/10.3389/fmamm.2023.1208276
Introduction: The Eastern High Arctic–Baffin Bay (EHA-BB) beluga whale (Delphinapterus leucas) population spends summer in estuaries around Somerset Island, Nunavut, Canada. A single abundance estimate from 1996 suggests an abundance >21,000 beluga whales; however, more information on abundance and distribution is needed to ensure effective management of this population, especially in estuaries where previous surveys provided minimal coverage. To assess the feasibility of using Very High Resolution (VHR) satellite imagery to obtain estuary abundance estimates for this beluga population, we evaluated a citizen science crowd counting initiative that was designed to monitor remote beluga whale populations and their estuary use.
Methods: In July and August 2020 the WorldView 2 and 3, and GeoEye 1 satellites were tasked to collect VHR imagery (30–41 cm) of estuaries previously known to be used by Eastern High Arctic–Baffin Bay beluga whales. The objectives were to obtain an estuary abundance estimate for this population from satellite imagery, and to evaluate the effectiveness of having imagery annotated using a crowd-source platform. Almost 3,800 km2 of ocean imagery was analyzed using Maxar’s Geospatial Human Imagery Verification Effort (GeoHIVE) Crowdsourcing platform. Expert readers then manually compared counts to those performed by crowd-counters to determine variance in observer counts.
Results and Discussion: The estuary abundance estimate from 11 core estuaries was 12,128 (CV 36.76%, 95% confidence interval 6,036–24,368) beluga whales. This represents an estuary abundance estimate only, as the greater Peel Sound and Prince Regent Inlet areas were not photographed. The estuaries with the largest abundance of beluga whales were Creswell Bay, Maxwell Bay, and Prince Whales Island, with over 2,000 crowd-counted whales in each estuary. Although VHR imagery has potential to assist with surveying and monitoring marine mammals, for larger estuaries it was not always possible to photograph the entire area in a single day, and cloud cover was an issue for sections of most images. This work will assist with planning large-scale aerial surveys for monitoring beluga whale populations, identifying high-use areas and important beluga habitat, and highlights the utility of using VHR imagery to enhance our understanding of estuary abundance and distribution of Arctic whales.
Advances in resolution of commercially available satellite imagery, such as Maxar Technologies Inc. (Maxar; Westminster, Colorado, USA) WorldView series, have allowed for direct detection and counting of animals. Very High Resolution (VHR) satellites now have resolutions under 40 cm and can be used for monitoring marine mammals in remote locations (Platonov et al., 2013; Cubaynes et al., 2019; Charry et al., 2021; Clarke et al., 2021; Matthews et al., 2022). Charry et al. (2021) were the first to show that satellite imagery could also be used for detection and monitoring of medium sized cetaceans, such as beluga whales (Delphinapterus leucas). No study, however, has tried to estimate cetacean population abundance using satellite imagery, although the potential of the method has been explored (Bamford et al., 2020; Höschle et al., 2021). Traditionally, abundance estimates for cetaceans are obtained using large scale aerial or boat-based surveys (Williams et al., 2017; Doniol-Valcroze et al., 2020). Both methods have the potential to disturb marine mammals, are costly, logistically challenging, and require a large team of people. Monitoring using satellites is unique from these traditional methods as surveys can occur remotely without disturbing animals, and can cover large geographic areas in a single image providing information on the instantaneous detection of whales across a large spatial scale (Höschle et al., 2021). This is particularly useful for species and populations that are highly mobile, and distributed across large geographic regions that are logistically difficult to travel to and survey such as the Eastern High Arctic–Baffin Bay (EHA-BB) beluga whale population.
The EHA-BB beluga whale population spends summer (approximately July through September) in the fiords and inlets around Somerset Island, Nunavut, Canada (Richard et al., 1998; Richard et al., 2001) (Figure 1). The animals in this population migrate to the North Water polynya (Finley and Renauld, 1980; Richard et al., 1998) and west Greenland (Heide-Jørgensen et al., 1993; Heide-Jørgensen and Reeves, 1996) in the winter (~November–April), and then return to the summering grounds (Sergeant and Brodie, 1975; Smith et al., 1985; Doidge and Finley, 1993; Smith and Martin, 1994). Beluga whales from this population are hunted for subsistence by Canadian hunters on the summering grounds (Watt, 2021), and by hunters in west Greenland on their wintering grounds. A single abundance estimate, using systematic line transect visual and photographic aerial surveys, suggests the population consists of over 21,000 beluga whales (Innes et al., 2002). The visual survey was adjusted for perception bias (whales missed by observers) and both visual and photographic surveys were adjusted for availability bias (whales missed at depth). However, this estimate is outdated (from 1996), provided minimal coverage of estuaries, and more information on estuary abundance and distribution is needed to ensure effective management of this harvested population, which is listed as “special concern” by the Committee on the Status of Endangered Wildlife in Canada (COSEWIC, 2004).
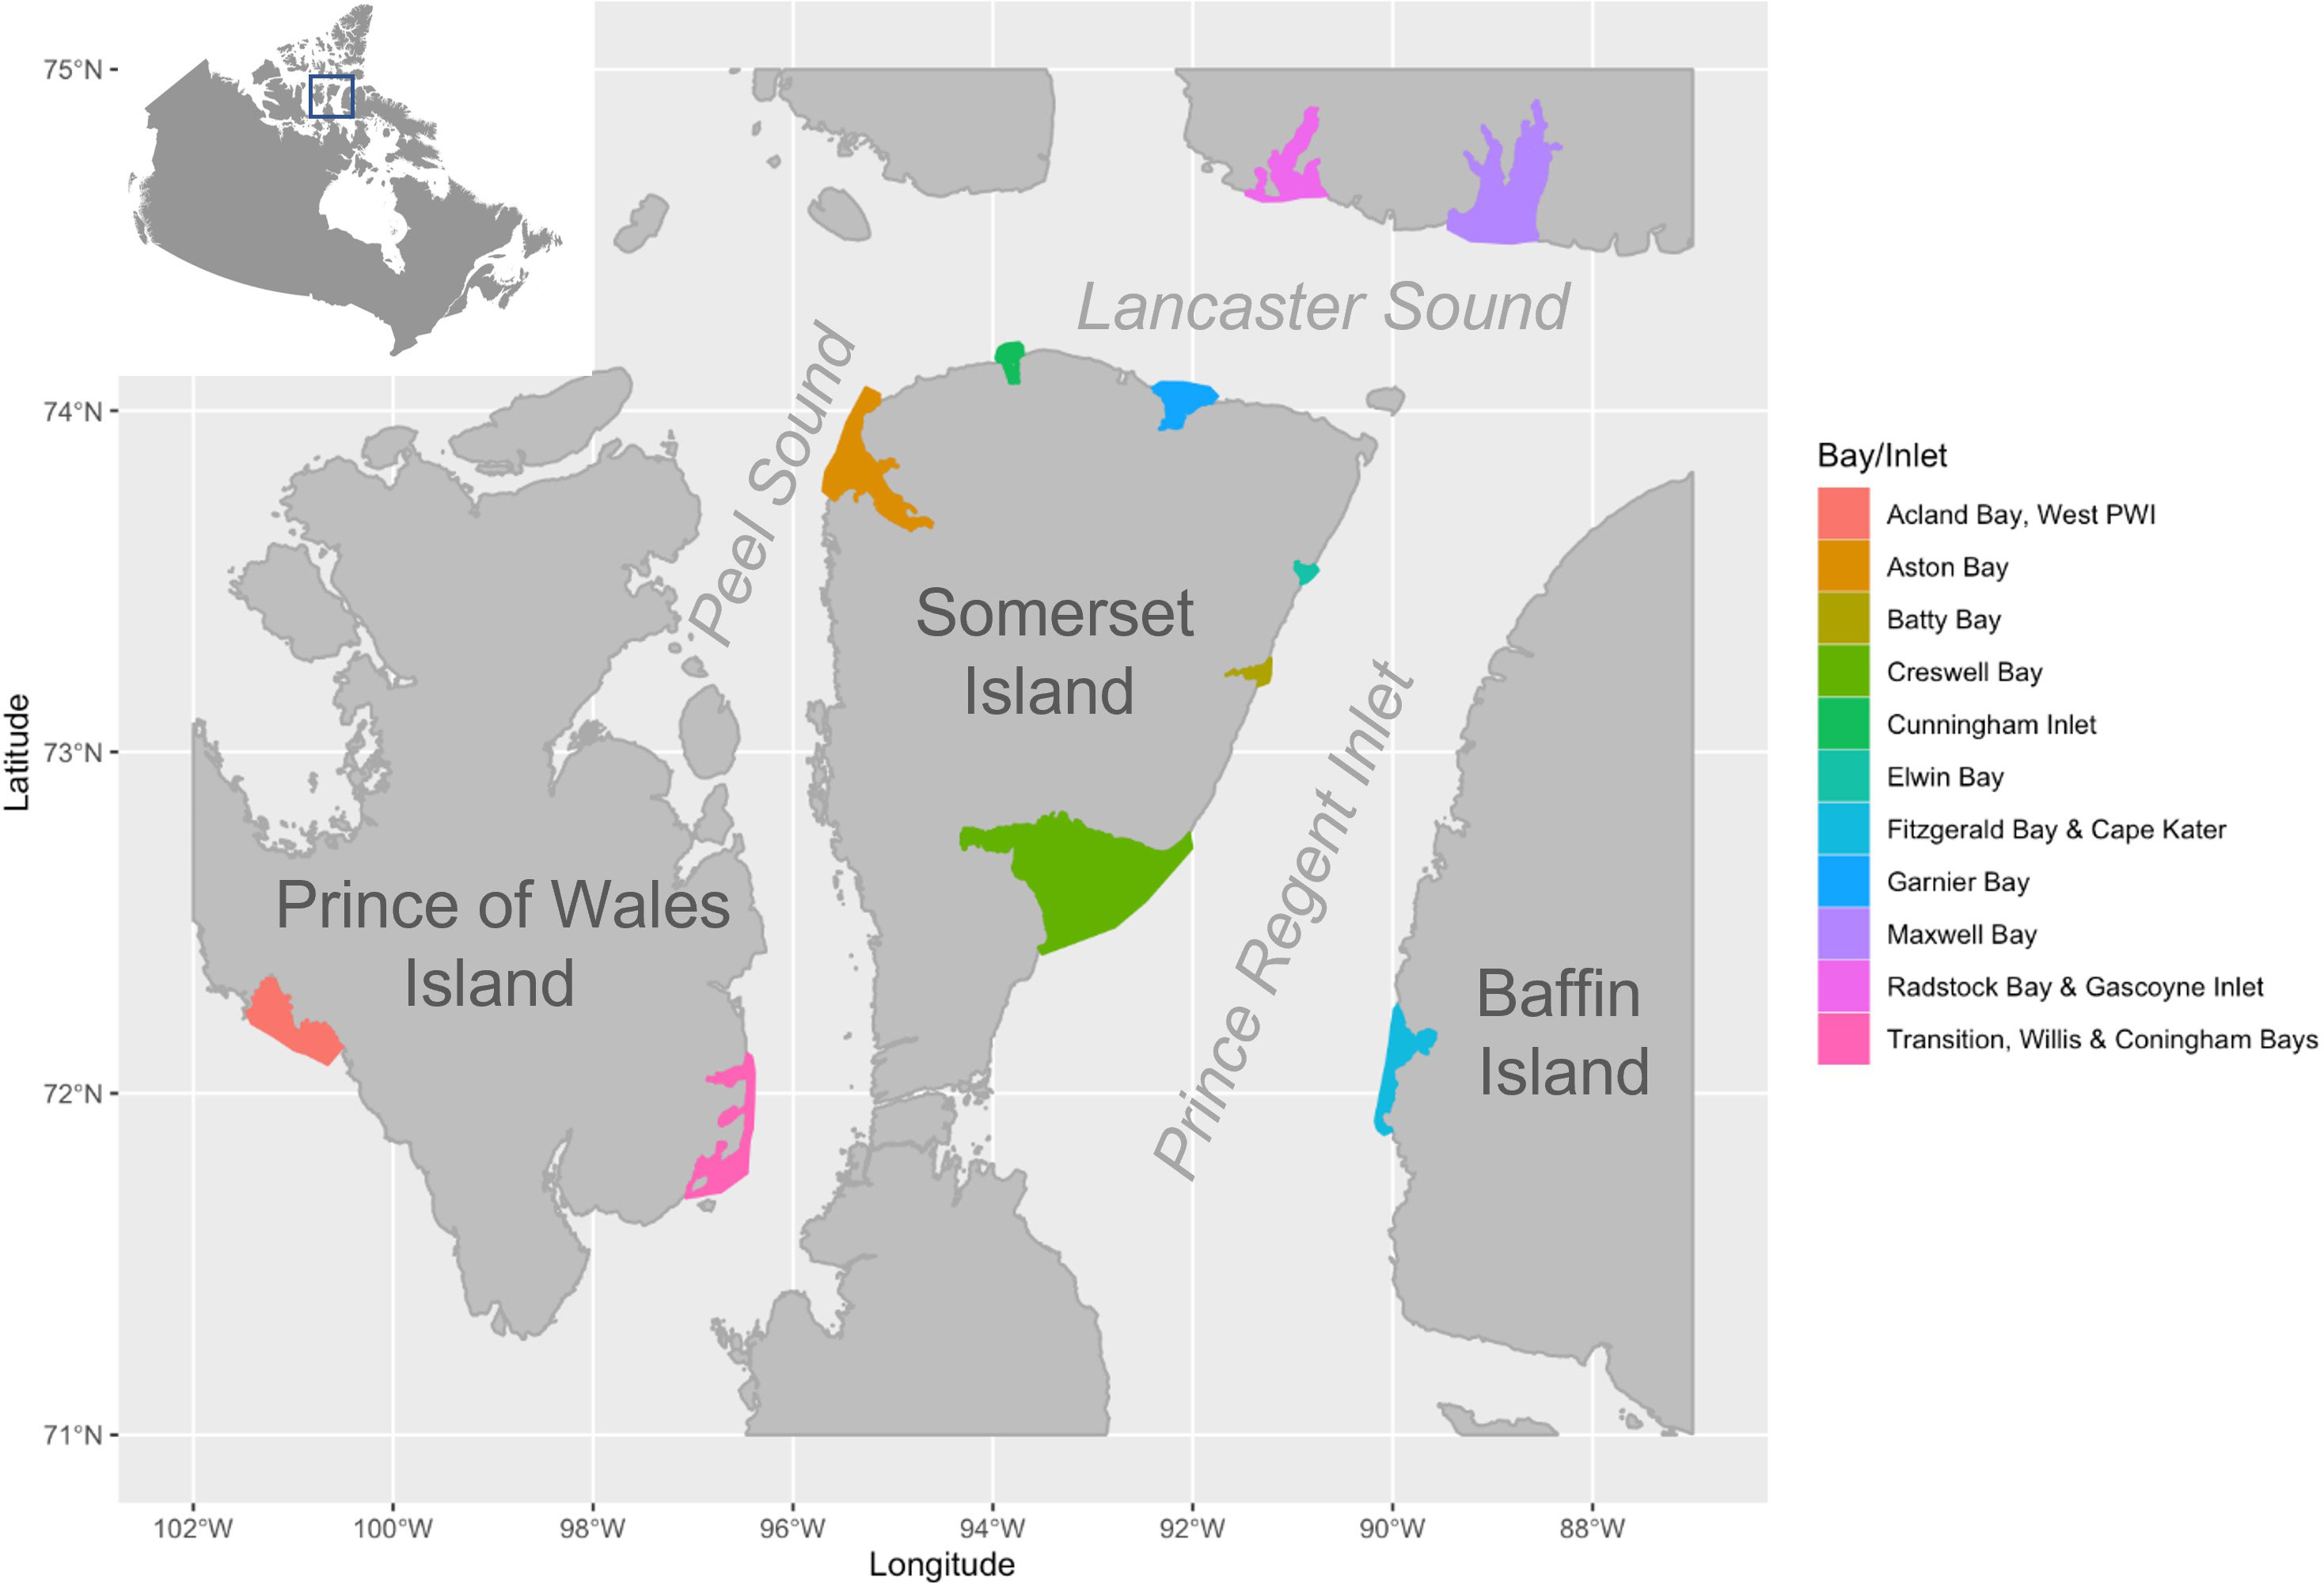
Figure 1 Map of the Somerset Island estuaries where satellite imagery was collected to estimate estuary abundance of the Eastern High Arctic–Baffin Bay beluga whale population.
The WorldView 2 and 3 (WV2 and WV3) and GeoEye (GE1) satellites included in the WorldView constellation satellite series were tasked to take images of EHA-BB beluga estuaries, which have been identified in previous surveys and through traditional knowledge (Figure 1), in August–early September when beluga are known to congregate in the region (Sergeant and Brodie, 1975; Smith et al., 1985; Doidge and Finley, 1993; Smith and Martin, 1994). Following satellite collection, images were annotated by a crowd of experienced online participants, referred to as crowd-counters, which were validated by experienced readers to identify and mark beluga whales. The objectives of this research were to evaluate 1) the effectiveness of crowd-counting satellite imagery for whale detection, and 2) develop an estuary abundance estimate, which could also be considered a minimum abundance estimate since the greater Peel Sound and Prince Regent Inlet were not imaged, for the EHA-BB beluga whale population using VHF satellite imagery.
The WorldView constellation satellite series are a VHR commercial Earth observing system owned by Maxar. Launched in 2008, 2009, and 2014 WorldView satellites take images of the Earth at an altitude of 617–770 km in a sun-synchronous orbit passing over the central Canadian Arctic at approximately 10:30 am (UTC-6). Multispectral (eight color bands) and panchromatic (black and white) satellite imagery covering a total ocean area of 3,842 km² was collected at 30–41 cm resolution from areas where beluga whales were previously observed including Aston Bay, Batty Bay, Creswell Bay, Cunningham Inlet, Elwin Bay, Fitzgerald Bay and Cape Kater, Garnier Bay, Maxwell Bay, Prince Wales Island, Prince Wales Island West, and Radstock Bay and Gascoyne Inlet (Figure 1). Prior knowledge of summer distribution was used to determine areas of interest and dominant species for each location. Images were collected during the summer (August to September) with open water or low ice concentration and a single image on one day was collected for each estuary, except Radstock Bay and Gascoyne Inlet (Table 1) where imagery was collected on three different dates (August 5th, 10th, and September 4th).
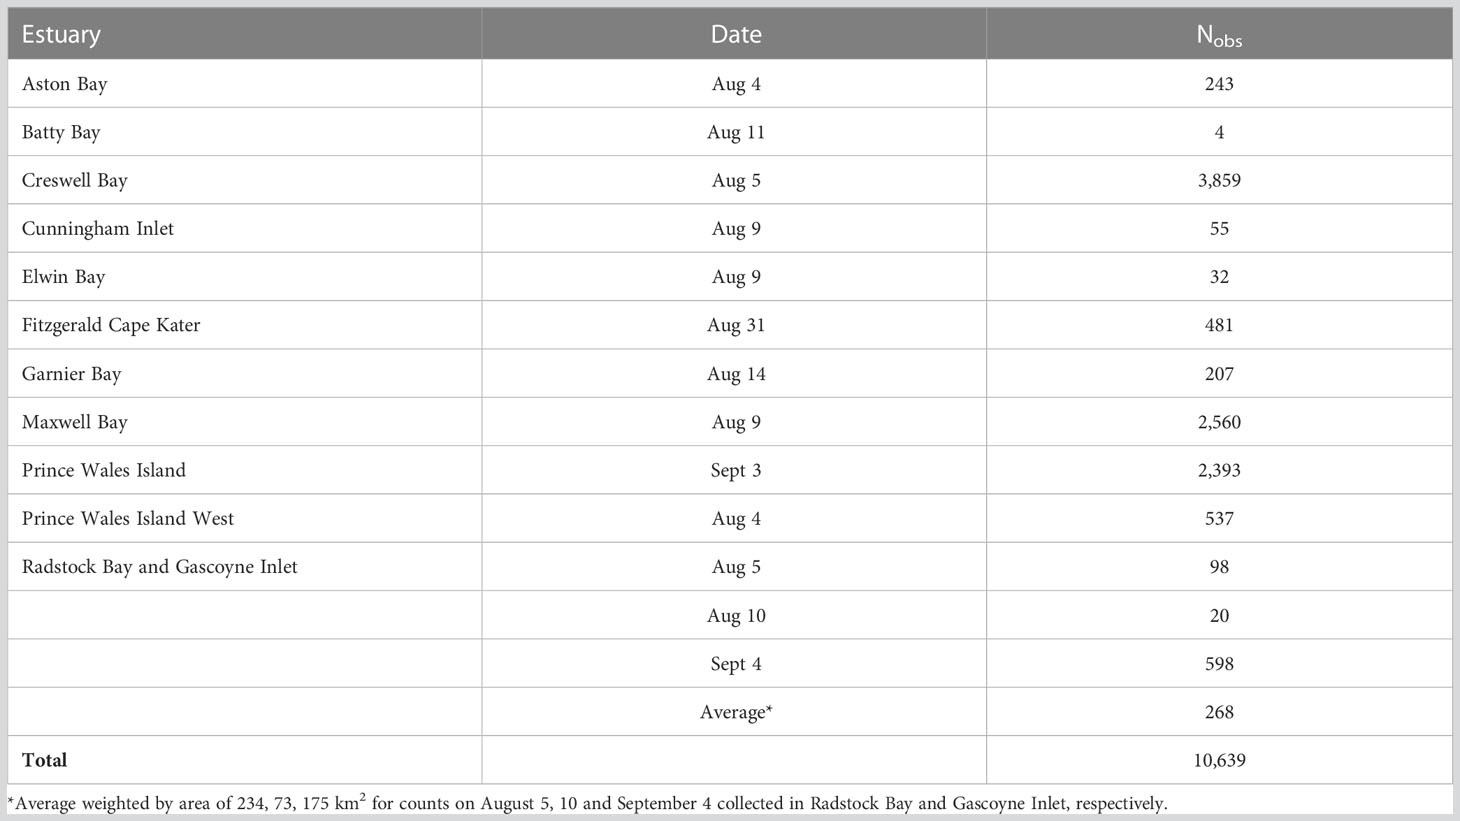
Table 1 Beluga whale targets identified by the crowd counting initiative per estuary in the Canadian high Arctic, where Nobs is the number of crowd-counted whales in each estuary.
To efficiently scan imagery for beluga whales, a crowd-counting initiative was conducted by MDA consulting using their Geospatial Human Imagery Verification Effort (“GeoHIVE”) technology. GeoHIVE includes a team of geospatial analysts, geospatial developers and imagery analysts, that worked with a crowd of experienced online participants vetted through training campaigns for their ability to read satellite imagery (the previously mentioned “crowd-counters”). The crowd-counters annotated features of interest (i.e., beluga whales) in satellite imagery while the GeoHIVE team processed imagery and provided limited validation of crowd annotations (Brunke et al., 2021).
Satellite images were divided into a 250 m grid for a total of 230,967 tiles. The image tiles were pansharpened, stripped of all geographic identifiers, and adjusted by colour contrast as needed to improve ability to detect whales (Brunke et al., 2021). Then an online imagery reading campaign was conducted where paid crowd-counters who did not have any knowledge of prior views or features, read imagery and identified features (Brunke et al., 2021). Each tile was scanned, features of interest (i.e., beluga whales) were tagged with points, and bounding boxes were drawn around these features. Following this, crowd-counters voted on the likelihood of features marked by other crowd members being whales to obtain a confidence score for each feature. To assess error rate, MDA staff experienced in reading satellite imagery, albeit not for whales, assessed 5% of the imagery.
In addition to feature detection, sun glare, cloud cover, and Beaufort Sea State was documented for each tile. Cloud cover and sun glare obscured feature detection, while the presence of shadowing or dense formations from sun and cloud made feature detection difficult. A shapefile masking cloud cover and sun glare was made to determine the unreadable area, and this area was not included in the estuary abundance estimate (i.e., density estimates were not extrapolated).
Features identified by different crowd-counters within 0.5m of each other were spatially clustered so that the same whale within the same image tile observed by different crowd-counters would not be counted as multiple whales if points were not precise across crowd-counters (Brunke et al., 2021). Clusters were only applied across counters, not within a single counter (i.e., if three whales were tagged side by side by one counter, it would result in three detections, but if a single whale was tagged by three independent counters, these were clustered to a single detection).
Image tiles were randomly selected for quality control and quality assessment, and visually checked by two trained technicians (C. Carlyle, and B. Sherbo) using ArcMap 10.8.1 (Esri, Redlands, California, USA). Tiles were separated by the those with whales detected or not. From this, 6% of tiles with whales present (545 tiles) and an equal number of tiles without whales (n = 545), for a total of 1,090 tiles were re-read. Tiles were stratified by estuary before random selection using the sample design tool in ArcMap (Buja and Menza, 2013), to ensure whales from each estuary were adequately sampled for assessment. Images were read independently at a scale of 1:800, each feature of interest was identified by adding a georeferenced point. Features were identified by their whale-like size, shape, and colour between 1.5 to 3.0 m in length and roughly torpedo shaped, sometimes with a tail fluke evident. Most whales were swimming in groups and some whales were identified due to their close proximity to other whales, such as whales under the surface or smaller, potentially younger whales. Each feature point was given a confidence rating: 2 for a confident whale (right shape and size) and 1 for a not-confident whale (approximate shape and size and/or close proximity to group including confident whales). Observations of cloud, fog, land, Beaufort Sea State, and sun glare were documented for each tile. Trained observers double checked all confident whale points (2) and 10% of not confident (1) whale points. Trained observers confident whale points (2) were used as true positives. Precision (Eq. 1), recall (Eq. 2), and F1 score (measure of model accuracy) (Eq. 3) were calculated to compare the crowd-counters to technicians (Gonçalves et al., 2020).
Summer estuary abundance estimates were calculated by summing the crowd counts from each individual estuary. This estimate, however, needs to be corrected for whales too deep beneath the surface of the water to be seen, known as availability bias, which requires information on the time whales spend below the surface of the water. In 1994 an experiment using inanimate beluga models was performed and it was determined that the depth to which beluga whales could be identified and seen beneath the waters surface from aerial surveys was 5.0 m (Richard et al., 1994). A similar experiment where a satellite image of inanimate beluga models was taken in a clear lake found the whales could only be identified to 2.0 m (Stewart et al., unpublished data). In 1996, whales from the EHA-BB beluga population were tagged with satellite transmitters which provided information on the time they spend at depth (Heide-Jørgensen et al., 2001). Satellite telemetry data was available from 11 beluga whales instrumented with satellite transmitters in Cunningham Inlet, Elwin Bay, and Creswell Bay (Heide-Jørgensen et al., 2001; Innes et al., 2002). Within estuaries, these beluga whales spent 87% of their time within 0–2 m of the water surface (Innes et al., 2002), and would be available in the satellite imagery. Therefore, an availability bias correction factor (Ca) of 1.14 (CV 3.2%) (Innes et al., 2002) was applied to the surface satellite imagery counts (Nsurface) to develop a corrected estuary abundance estimate (Ncor):
Within a single satellite image there is no variance associated with the encounter rate as we assume that all available whales are counted. The only variance is that associated with the availability bias correction factor (3.2%), the variability in observer counts, and the weighted variance when multiple days were counted for a single estuary (which only applied to Radstock Bay and Gascoyne Inlet). Variability in observer counts was determined by taking the average absolute percent difference between the technicians and the crowd-counters over the technicians counts for each tile per estuary. For example, for a single tile, if the technicians detected 6 whales and the crowd detected 7, the percent difference would be 17% (absolute(6–7)/6 × 100). In instances where no whales were detected by technicians, one was added to the denominator. These percent differences were then averaged across all tiles that were read by both crowd-counters and technicians, for each estuary, to get an average variation. For estuaries where crowd-counters and technicians detected no beluga whales in the randomly selected tiles (Aston Bay, Batty Bay, Cunningham Inlet, Elwin Bay, and Prince Wales Island West), an average of the variance between the technicians and the crowd-counters for all other estuaries was used. The total variance of the estimate was calculated using the delta method (Buckland et al., 2001):
Beluga were detected from satellite imagery taken from the WorldView 2 and 3 (WV2 and WV3) and GeoEye-1 (GE1) satellites with a resolution of 30, 40, and 41 cm, respectively (Figure 2). From satellite imagery acquired in 2020 during the low or no ice season the crowd counting initiative identified 10,639 beluga whales in all estuaries (Table 1).
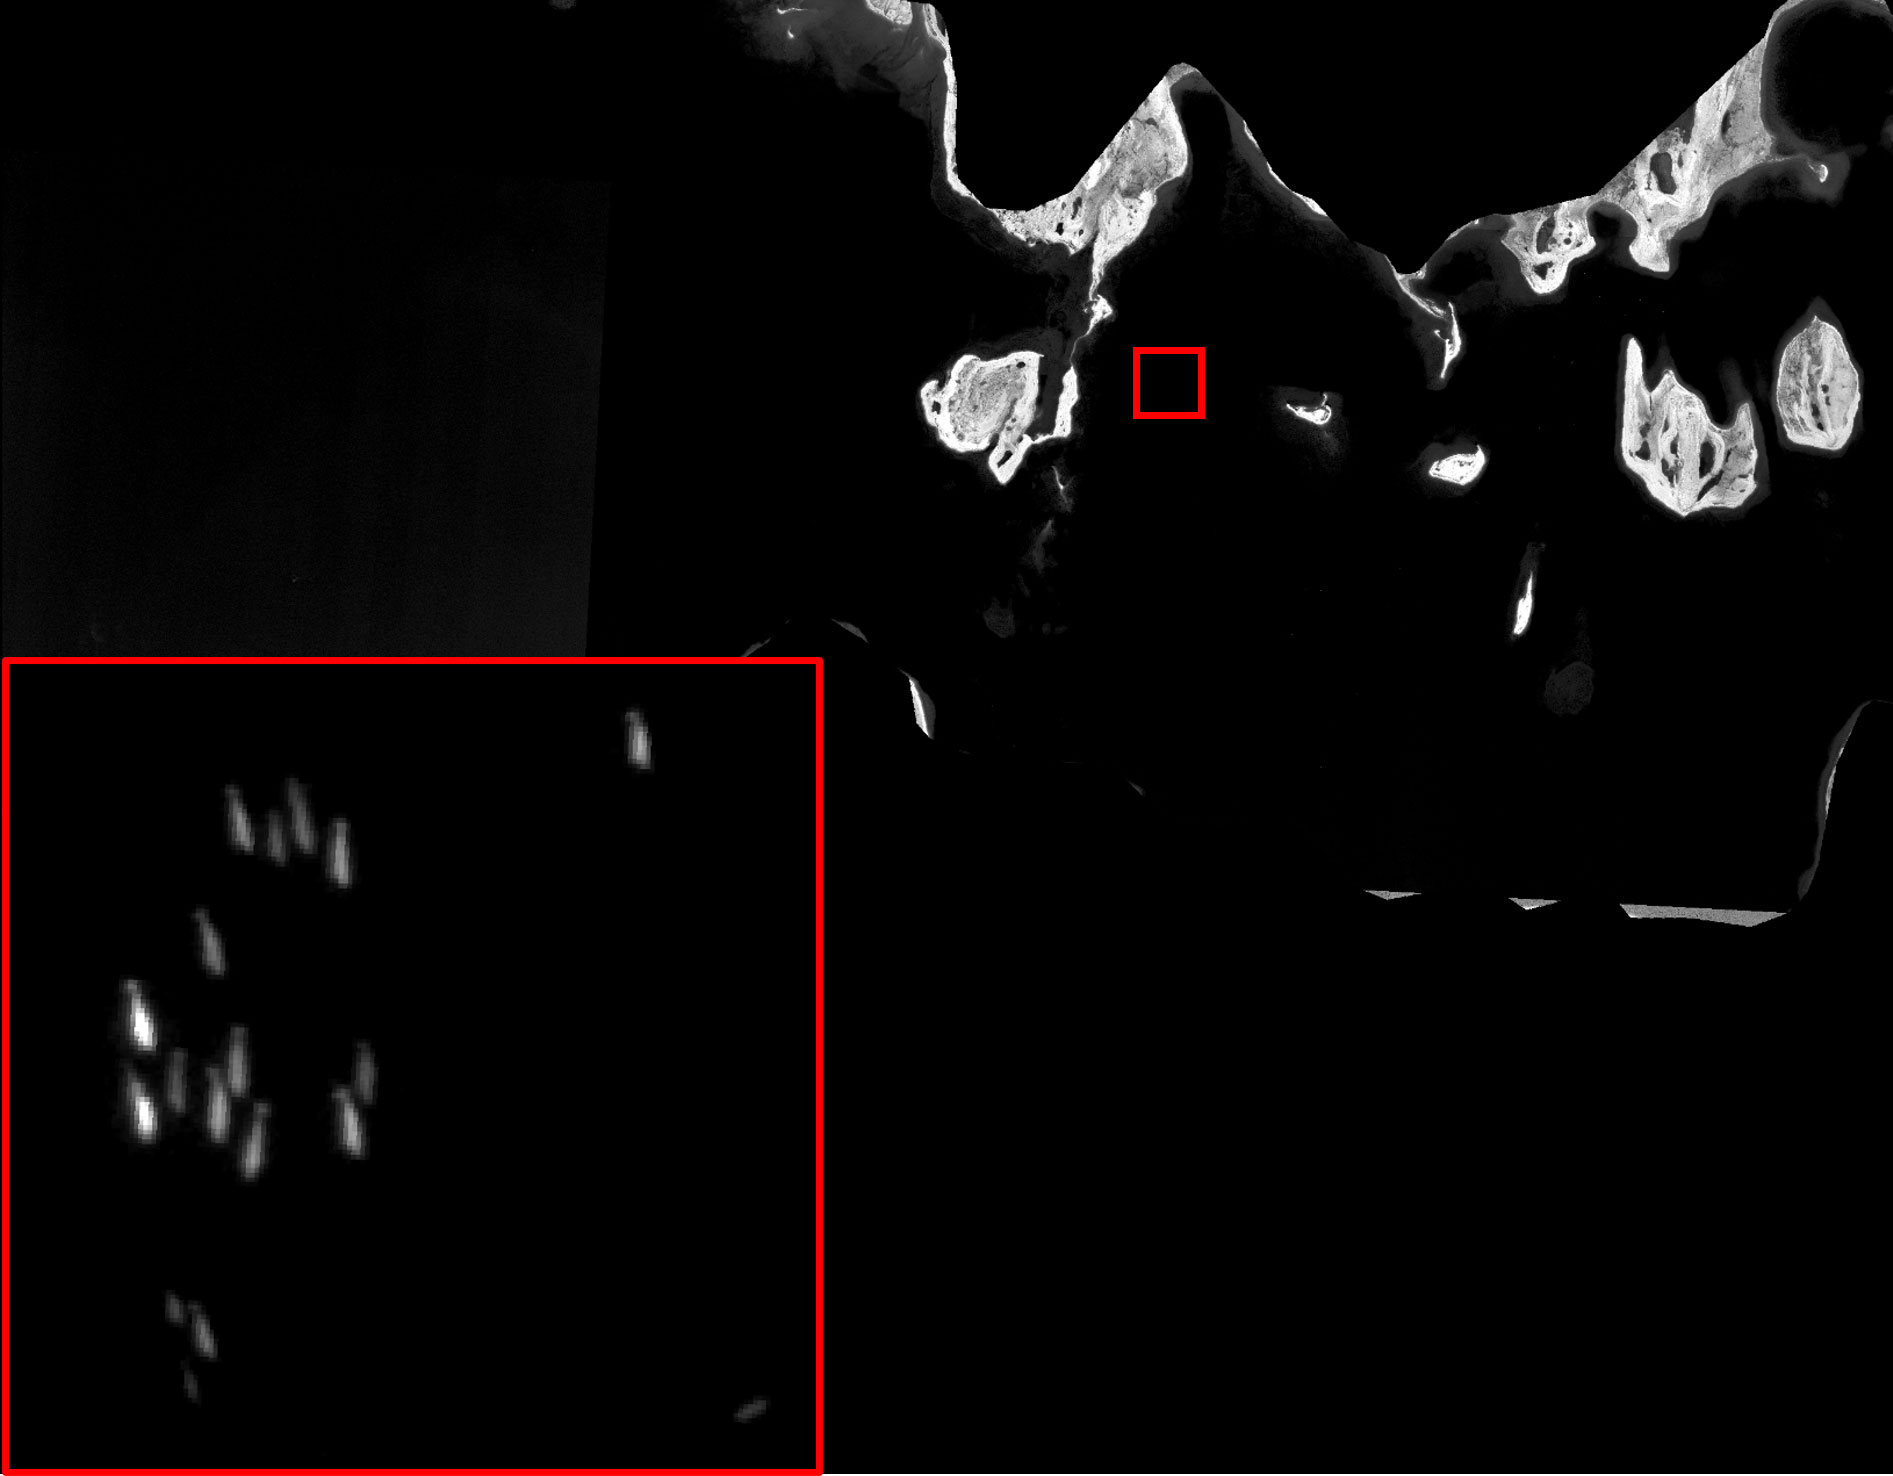
Figure 2 Panchromatic WorldView 3 satellite image of beluga whales on August 5, 2020 in Creswell Bay, Nunavut (republished under an end user license agreement with Maxar Technologies, original copyright 2020).
Technicians identified 235 features as confident whales in randomly selected tiles (n = 1,090) and within these tiles the crowd-counters identified 171 features of interest (i.e., whales). Between the technicians and crowd-counters 51.48% (n = 121) of georeferenced features aligned (Table 2). When compared to technicians, the crowd had an overall precision of 71% and recall of 65%. Certain areas of interest were more precise than others, for example; Creswell Bay had the most features identified as beluga whales and had a precision of 90% and recall of 55%. Other areas were less precise but had a higher recall; for example, Maxwell Bay had a precision of 6% and recall of 100%. In Maxwell Bay discrepancies were related to the crowd identifying features of interest as confident whales that were reviewed by technicians and determined not to be beluga whales. In Aston Bay, Batty Bay, Cunningham Inlet, Elwin Bay, and Prince Wales Island West, crowd-counters and technicians detected no beluga whales in the randomly selected tiles and are omitted from Table 2.
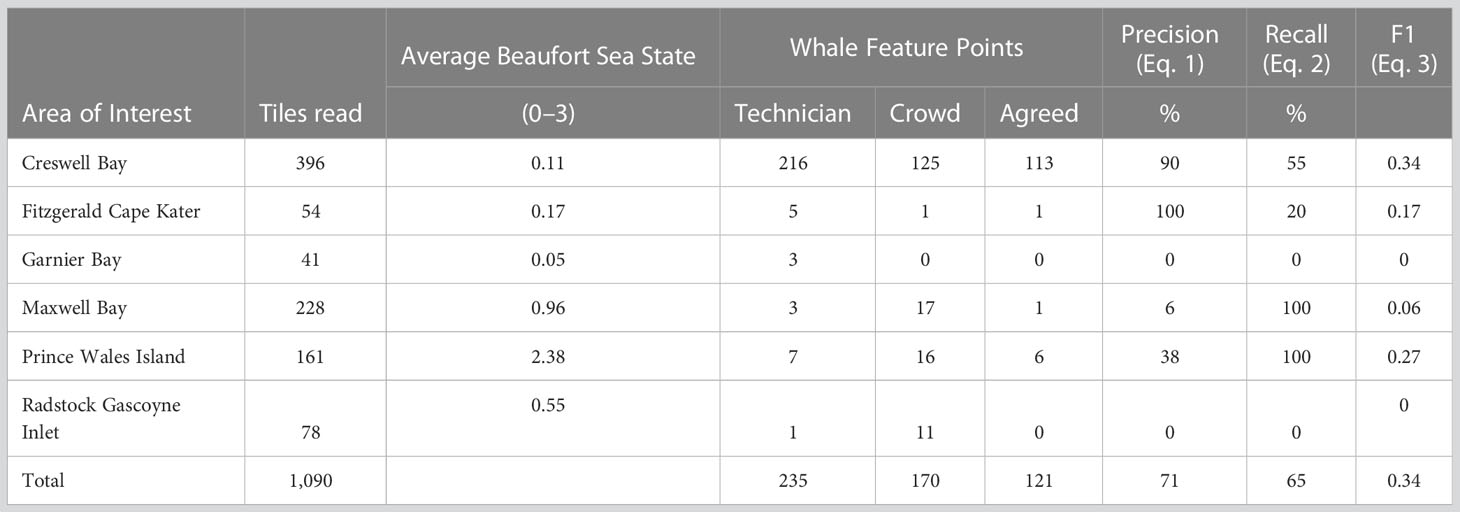
Table 2 Quality control and quality assurance of crowd-counted whales.
Total precision, recall, and F1 were calculated following Eq. 1, 2, and 3.
Of the total features agreed on as confident whales (scored as 2) recorded by technicians (n = 235), technicians identified 16 features of interest that were later agreed upon not to be a beluga, 1.80% (n = 5) were identified by B. Sherbo, and 3.95% (n = 11) were identified by C. Carlyle. All tiles with features (n = 84) were assessed. The mean percentage classification disagreement between technicians was 11.1% (n = 26). This occurred when a technician classified a feature as a whale and the other technician did not identify the feature (10 features were agreed upon as a beluga and 16 features were agreed upon as not a beluga).
To calculate estuary abundance for each estuary the estimated counts from each estuary were adjusted for availability bias by multiplying by 1.14 (CV 3.2%) and then summed to provide a minimum estuary abundance estimate of 12,128 beluga whales (Table 3). The variation in observer counts for individual estuaries (varNobs) ranged from 36.87% to 113.46%. Estuaries where this estimate was not possible because randomly selected tiles contained no whales, were assigned an average of the percent difference based on all other estuaries (75.14%) (Table 3). The total variation, which incorporated the variance from observer counts and from the availability bias estimate (and from the weighted average for Radstock Bay and Gascoyne Inlet) was 36.76%, resulting in a 95% confidence interval of 6,036–24,368 beluga whales.
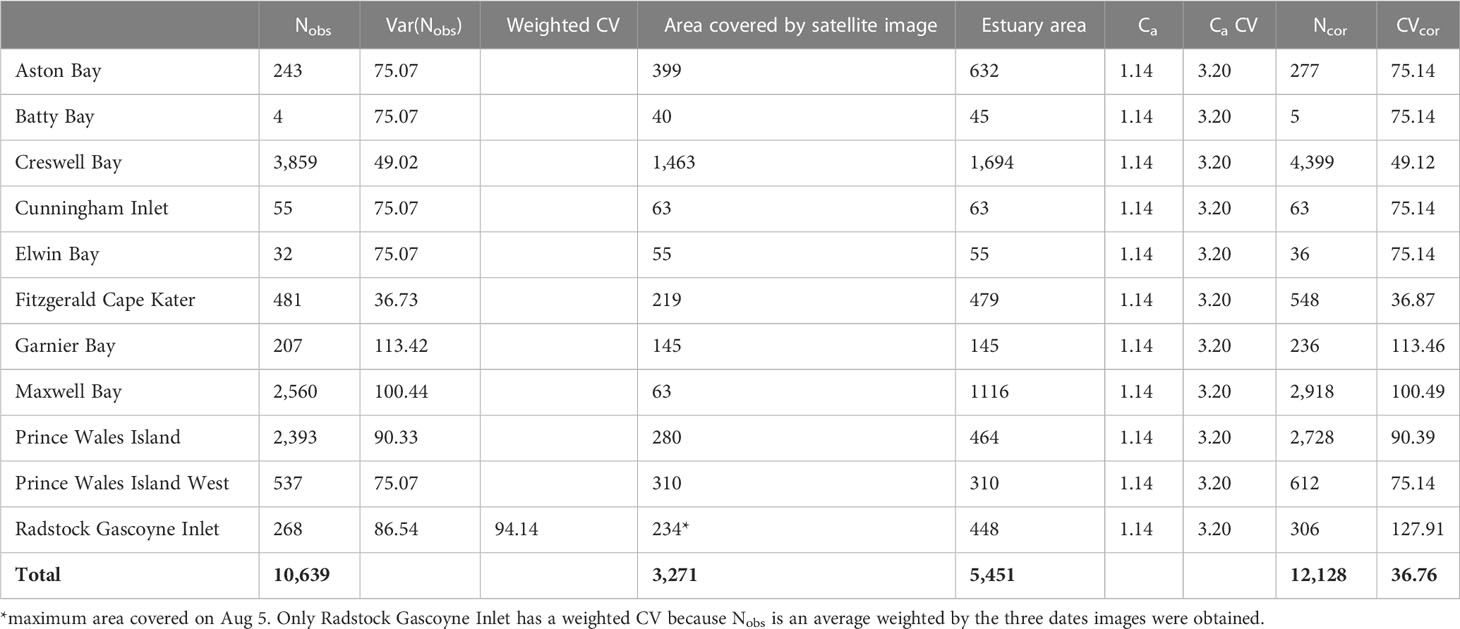
Table 3 Abundance estimates for estuaries inhabited by beluga whales from the Eastern High Arctic–Baffin Bay beluga population and the total minimum estuary abundance estimate for the population.
This is the first study to use large scale collection of satellite imagery to estimate abundance for a medium sized cetacean, and provides the first estuary abundance estimate for the EHA-BB beluga population in over 20 years. VHR satellite imagery offers several advantages over traditional aerial survey estimates, specifically capturing large geographical areas near instantaneously, which is not possible in aerial or boat based surveys. However, the satellite imagery is not without limitation. Although the resolution is high enough to accurately identify beluga whales, clouds, high Beaufort Sea State, and sun glare posed challenges for identification (Abileah, 2002) and there were unreadable sections in all images. In addition, it was difficult to capture all the estuaries in a short time span and the survey dates spanned 4.5 weeks; therefore, whales may have moved into or out of different estuaries. This is also a limitation of aerial survey estimates, but often observers can document movement of whales while travelling to and from the survey regions. Weather also limited collection of multiple satellite images of a single site for all estuaries except Radstock Gascoyne Inlet.; this is similarly an issue in aerial surveys where repeat surveys of strata are ideal but often prevented due to poor weather (Doniol-Valcroze et al., 2020, Watt et al., 2021). Processing of the images to identify whales is also time intensive and the use of crowd-counters presented significant advantages for processing large amounts of imagery in a short time, but also posed challenges because of reader experience and subjectivity with identifying whales in 30–41 cm resolution imagery.
Crowd-counters successfully identified areas where there were no targets of interest. This significantly reduced the total kilometers of imagery that would need to be read (by more than 50%). Furthermore, the time savings with crowd-counters was significant. Manual reading of 10% of the satellite imagery by only a few technicians took weeks; however, the crowd count happened over only a few days. When compared to technicians, crowd-counters tended to overestimate the number of beluga whales in images that had a lot of waves and white caps, such as in Maxwell Bay, where the crowd identified 17 whales and technicians only identified 3 in the reviewed tiles (Table 2). In addition, in estuaries that had large numbers of whales the crowd tended to underestimate the total whales (see Creswell Bay, Table 2). The accuracy and precision of the crowd varied by estuary and image; however, there was also variability in counts between the two technicians that read the imagery prior to conferring and making final decisions on target identification together. Inter-observer variability in animal counts in remote sensing imagery by trained specialists can generally range from 5 to 15% (Linchant et al., 2015; Fossette et al., 2021; Schlossberg et al., 2016). Depending on the goals of the research and how accurate count estimates need to be, crowd-counters could provide an option in the future, and could become more accurate and precise through training. In our study, the goals were to estimate estuary use and abundance and not to set or evaluate conservation targets or limit reference points. If these were the goals of the research reduced error would be needed and manual detection should be used.
The clustering algorithm used to amalgamate whale targets across multiple crowd sources may have underestimated whales in the imagery by grouping whales in very close proximity; however, multiple detections from a single crowd-counter were never clustered together so as long as at least one counter identified the overlapping whales they would have been accounted for. We chose to use the smallest clustering algorithm of 0.5 m to reduce the chances of clustering multiple whales as one.
The estuaries where imagery was acquired are known to be dominated by beluga whales; however, narwhals (Monodon monoceros) can sometimes also be found in some of these areas, particularly in Creswell Bay where narwhals have been satellite tagged previously (Laidre et al., 2003). Generally, it is difficult to identify whales to species using satellite imagery, and although narwhal are significantly darker and more difficult to read in satellite imagery (Charry et al., 2021) they are a similar size as beluga whales and it is possible that some of the features identified as whales are narwhal and not beluga. It is impossible to rule out this possibility; however, if some of the whales are narwhal we suspect it is a low proportion (<5%) given that narwhal tend to distribute in the offshore areas in deep water, while beluga whales tend to rely more on shallower estuaries Innes et al. (2002) sighted no narwhal within estuaries). In the future, commercially available satellite imagery with 10–15 cm resolution would likely allow identification to species level and could eliminate this source of uncertainty, while also improving detectability of whales among crowd-counters and experienced readers (Hodul et al., 2023).
The satellite telemetry data used to adjust the estuary abundance estimates are from 1996, and although they are the best information we have available on whale behaviour in this area, it is possible that behaviour has changed over time. Although these are the best estimates we have for time at the surface for whales from the EHA-BB beluga whale population, this correction is quite low compared to corrections used for other Canadian populations of beluga whales. For example, for the Cumberland Sound beluga population a multiplication factor of 2.06 (CV 5.6%) has been used for 0–2 m depth (Watt et al., 2021). For the western Hudson Bay population a multiplication factor of 1.71 (CV 11%) has been used for 0–2 m depth (Matthews et al., 2017). Use of these higher correction factors would result in estimated estuary abundance for the EHA-BB population of 21,916 (95% CI 7,464–64,349) and 18,193 (95% CI 6,177–53,581), respectively, which is slightly higher than our estimated estuary abundance, and closer to the 1996 population abundance estimate of 21,213 beluga whales. Uncertainty in the availability bias multiplication factor highlights the need for updated information on diving behaviour of beluga whales from the EHA-BB population.
Satellite imagery offers a safe, effective method for estimating cetacean estuary abundance; however, ground-truthing with traditional aerial surveys would improve confidence in the estimate (Bamford et al., 2020). Crowd-counters offer one possible solution to handling the immense imagery reading task, but the future of abundance estimation with satellite imagery likely relies on automated detection algorithms that can be used to eliminate large areas with no features of interest and identify whales (Borowicz, 2019; Rodofili et al., 2022; Khan et al., 2023), while also eliminating the subjectivity of readers. Object or pixel based machine learning algorithms could greatly reduce the time required for analysis after imagery acquisition. In a study by Fretwell et al. (2019), 64% more whales were identified through satellite imagery analysis than from aerial surveys. Aerial surveys can disturb marine mammals and potentially alter behaviour if flown at low altitudes (Patenaude et al., 2002); satellite imagery offers a passive method for gathering this information.
The acquisition of multiple images from the same estuary, Radstock Bay and Gascoyne Inlet on August 5th, August 10th, and September 4th, highlights the importance of considering beluga whale migration and residency time in estuaries. A low estuary abundance in August followed by a peak abundance in early September may suggest this Inlet acts as a stop-over site on the migration to and from the wintering grounds for these beluga whales (Richard et al., 2001). It is thus critical to ensure the timing of surveys correspond with the summer aggregation period for this population, and suggests multiple survey passes may be needed to capture variability in estuary use. For inclusion in our estuary abundance we chose to use a weighted average of the repeat images from Radstock Gascoyne Inlet, as is often done in beluga whale aerial surveys (Watt et al., 2021; Matthews et al., 2017). When weather is favorable and repeat surveys of estuaries is possible, it is common to have variability in counts. For example, in repeat surveys conducted approximately a week apart, counts of beluga whales from Cumberland Sound, Canada, varied from 301 to 1,286 whales (Watt et al., 2021), and in Western Hudson Bay, Canada, counts varied from 928 to 2,783 whales (Matthews et al., 2017). If we were to assume that variability in the other estuaries is as high as was seen in Radstock Gascoyne Inlet (CV 94%), the CV around the estuary abundance estimate would increase to 59% with a subsequent 95% CI of 4,129–35,620 beluga whales. However, it is likely variability in the other estuaries across subsequent dates would be less than in Radstock Gascoyne Inlet, since this is an area that migratory whales pass (Richard et al., 1998; Richard et al., 2001); therefore, this high variability likely represents migration in and out of the estuary on the way to and from the summering grounds, rather than variation present in estuaries used for summer aggregation.
Despite some of the limitations of satellite imagery, this field is emerging and advances in image resolution will only improve scientific research. Marine mammal abundance estimation, estuary use, residency time, and distribution are just some of the areas of research that will benefit from satellite imagery. The non-invasive nature of surveying with satellite imagery, as well as the ability to obtain information from locations that are logistically challenging or prohibitive for aerial surveying, will expand our knowledge of cryptic Arctic marine mammals. However, a better understanding of the factors impacting the detectability of marine mammals in satellite imagery such as morphology (colour, size), environment (colour, sea state), and behaviour is needed (Abileah, 2002; Cubaynes et al., 2019). The white colour, large aggregations, and large proportion of time spent near the surface, may have made the EHA-BB population an ideal candidate for detection by satellite imagery. How appropriate satellite imagery is for census of other marine mammal populations could vary with these factors across space, time, and species. A sky-view of the EHA-BB population has revealed important information on estuary use and provided an estuary abundance estimate for this population that has not been researched for over 20 years.
The raw data supporting the conclusions of this article will be made available by the authors, without undue reservation.
Ethical review was not required as images were acquired from satellites that were flying over beluga estuaries regardless of this project.
CW designed and funded the research and wrote the preliminary paper draft. CH coordinated imagery acquisition and developed reading protocols. BS and CC read the satellite imagery. All authors contributed to manuscript formulation. All authors contributed to the article and approved the submitted version.
We thank Species at Risk and Crown-Indigenous Relations and Northern Affairs Canada (CIRNAC) for funding which supported this research. Also thanks to MDA, Maxar and the crowd-counters, with special thanks to J. Iacozza, S. Brunke, V. Wu, M. She, and J. Roos for ongoing technical support. Thank you to the two reviewers whose comments improved the final version of this paper.
The authors declare that the research was conducted in the absence of any commercial or financial relationships that could be construed as a potential conflict of interest.
The author CW declared that they were an editorial board member of Frontiers, at the time of submission. This had no impact on the peer review process and the final decision.
All claims expressed in this article are solely those of the authors and do not necessarily represent those of their affiliated organizations, or those of the publisher, the editors and the reviewers. Any product that may be evaluated in this article, or claim that may be made by its manufacturer, is not guaranteed or endorsed by the publisher.
Abileah R. (2002). Marine mammal census using space satellite imagery. US Navy J. Underwater Acous. 52, 709–724.
Bamford C. C. G., Kelly N., Dalla Rosa L., Cade D. E., Fretwell P. T., Trathan P. N., et al. (2020). A comparison of baleen whale density estimates derived from overlapping satellite imagery and a shipborne survey. Sci. Rep. 10, 12985. doi: 10.1038/s41598-020-69887-y
Borowicz A. (2019). Aerial-trained deep learning networks for surveying cetaceans from satellite imagery. PloS One 14, 1–15. doi: 10.1371/journal.pone.0212532
Brunke S., Wu V., Branson W. (2021). Satellite imagery reader – annual whale count (Canada: Department of Fisheries and Oceans MDA Project), 10182.
Buckland S. T., Anderson D. R., Burnham K. P., Laake J. L., Borchers D. L., Thomas L. (2001). Introduction to distance sampling: estimating abundance of biological populations (New York, NY: Oxford University Press), 432.
Charry B., Tissier E., Iacozza J., Marcoux M., Watt C. A. (2021). Mapping Arctic cetaceans from space: a case study for beluga and narwhal. PloS One 16, e0254380. doi: 10.1371/journal.pone.0254380
Clarke P. J., Cubaynes H. C., Stockin K. A., Olavarría C., de Vos A., Fretwell P. T., et al. (2021). Cetacean strandings from space: challenges and opportunities of very high resolution satellites for the remote monitoring of cetacean mass strandings. Front. Mar. Sci. 8. doi: 10.3389/fmars.2021.650735
COSEWIC (2004). COSEWIC assessment and status report on the beluga whale Delphinapterus leucas. Commun. Status Endanger. Wildl. Canada. Ottawa, ix + 70.
Cubaynes H. C., Fretwell P. T., Bamford C., Gerrish L., Jackson J. A. (2019). Whales from space: four mysticete species described using new VHR satellite imagery. Mar. Mammal Sci. 35, 466–491. doi: 10.1111/mms.12544
Doniol-Valcroze T., Gosselin J.-F., Pike D. G., Lawson J. W., Asselin N. C., Hedges K., et al. (2020). Narwhal abundance in the eastern Canadian high Arctic. NAMMCO Sci. Publ. J. 11. doi: 10.7557/3.5100
Doidge D. W., Finley K. J. (1993). Status of the baffin bay population of beluga, Delphinapterus leucas. Can. Field-Naturalist 107, 533–546.
Finley K. J., Renaud W. E. (1980). Marine mammals inhabiting the baffin bay north water in winter. Arctic 33, 724–738. doi: 10.14430/arctic2592
Fossette S., Loewenthal G., Peel L. R., Vitenbergs A., Hamel M. A., Douglas C., et al. (2021). Using aerial photogrammetry to assess stock-wide marine turtle nesting distribution, abundance and cumulative exposure to industrial activity. Remote Sens. 13, 1116. doi: 10.3390/rs13061116
Fretwell P. T., Jackson J. A., Ulloa Envina M. J., Haussermann V., Perez Alvarez M. J., Ollavarria C., et al. (2019). Using remote sensing to detect whale strandings in remote areas: the case of sei whales mass mortality in Chilean Patagonia. PloS One 14 (10), e0222498. doi: 10.1371/journal.pone.0222498
Gonçalves B. C., Spitzbart B., Lynch H. J. (2020). SealNet: a fully-automated pack-ice seal detection pipeline for sub-meter satellite imagery. Remote Sens. Environ. 239, 111617. doi: 10.1016/j.rse.2019.111617
Heide-Jørgensen M. P., Hammeken N., Dietz R., Orr J., Richard P. R. (2001). Surfacing times and dive rates for narwhals (Monodon monoceros) and belugas (Delphinapterus leucas). Arctic 54, 284–298. doi: 10.14430/arctic788
Heide-Jørgensen M. P., Lassen H., Teilmann J., Davis R. A. (1993). An index of the relative abundance of wintering belugas, Delphinapterus leucas, and narwhals, Monodon monoceros, off west greenland. Can. J. Fish. Aquat. Sci. 50, 2323–2335. doi: 10.1139/f93-257
Heide-Jørgensen M. P., Reeves. R. R. (1996). Evidence of a decline in beluga, Delphinapterus leucas, abundance off west greenland. ICES J. Mar. Sci. 53, 61–72. doi: 10.1006/jmsc.1996.0006
Hodul M., Knudby A., McKenna B., Jame A., Mayo C., Brown M., et al. (2023). Individual north Atlantic right whales identified from space. Mar. Mammal Sci. 39, 220–231. doi: 10.1111/mms.12971
Höschle C., Cubaynes H. C., Clarke P. J., Humphries G., Borowicz A. (2021). The potential of satellite imagery for surveying whales. Sensors 21, 963. doi: 10.3390/s21030963
Innes S., Heide-Jørgensen M. P., Laake J. L., Laidre K., Cleator H. J., Richard P., et al. (2002). Surveys of belugas and narwhal in the Canadian high Arctic in 1996. NAMMCO Sci. Publ. 4, 169–190. doi: 10.7557/3.2843
Khan C. B., Goetz K. T., Cubaynes H. C., Robinson C., Murnane E., Aldrich T., et al. (2023). A biologist’s guide to the galaxy: leveraging artificial intelligence and very high-resolution satellite imagery to monitor marine mammals from space. J. Mar. Sci. Eng. 11, 595. doi: 10.3390/jmse11030595
Laidre K. L., Heide-Jørgensen M. P., Dietz R., Hobbs R. C., Jørgensen O. A. (2003). Deep-diving by narwhals Monodon monoceros: differences in foraging behaviour between wtinering areas? Mar. Ecol. Prog. Ser. 261, 269–281. doi: 10.3354/meps261269
Linchant J., Lhoest S., Quevauvillers S., Semeki J., Lejeune P., Vermeulen C. (2015). WIMUAS: developing a tool to review wildlife data from various UAS flight plans. Int. Arch. Photogramm. Remote Sens. Spatial Inf. Sci. XL3, 379–384. doi: 10.5194/isprsarchives-XL-3-W3-379-2015
Matthews C. J. D., Dispas A., Mosnier A. (2022). Evaluating satellite imagery for Atlantic walrus (Odobenus rosmarus rosmarus) stock assessment – a pilot study. Can. Tech. Rep. Fish. Aquat. Sci. 3492, v + 25.
Matthews C. J. D., Watt C. A., Asselin N. C., Dunn J. B., Young B. G., Montsion L. M., et al. (2017). Estimated abundance of the Western Hudson bay beluga stock from the 2015 visual and photographic aerial survey. DFO Can. Sci. Advis. Sec. Res. Doc. 2017/061, v + 20.
Patenaude N. J., Richardson W. J., Smultea M. A., Koski W. R., Miller G. W. (2002). Aircraft sound and disturbance to bowhead and beluga whales during spring migration in the alaskan Beaufort Sea. Mar. Mammal Sci. 18, 309–335. doi: 10.1111/j.1748-7692.2002.tb01040.x
Platonov N. G., Modvintsev I. N., Rozhnov V. V. (2013). The possibility of using high resolution satellite images for detection of marine mammals. Ecology 40, 197–205. doi: 10.1134/S1062359013020106
Richard P. R., Heide-Jørgensen M. P., Orr J. R., Dietz R., Smith T. G. (2001). Summer and autumn movements and habitat use by belugas in the Canadian high Arctic and adjacent areas. Arctic 54, 207–222. doi: 10.14430/arctic782
Richard P. R., Heide-Jørgensen M. P., St. Aubin D. (1998). Fall movements of belugas (Delphinapterus leucas) with satellite-linked transmitters in Lancaster sound, Jones sound, and northern Baffin bay. Arctic 51, 5–16. doi: 10.14430/arctic1040
Richard P., Weaver P., Dueck L., Barber D. (1994). Distribution and numbers of Canadian High Arctic narwhals (Monodon monoceros) in August 1984. Meddelelser om Gronland Bioscience 39, 41–50.
Rodofili E. N., Lecours V., LaRue M. (2022). Remote sensing techniques for automated marine mammals detection: a review of methods and current challenges. PeerJ 10, e13540. doi: 10.7717/peerj.13540
Schlossberg S., Chase M. J., Griffin C. R. (2016). Testing the accuracy of aerial surveys for large mammals: an experiment with African savanna elephants (Loxodonta africana). PloS One 11, e0164904. doi: 10.1371/journal.pone.0164904
Sergeant D. E., Brodie P. F. (1975). Identity, abundance, and present status of populations of white whales, Delphinapterus leucas, in north america. J. Fish. Res. Board Can. 32, 1047–1054. doi: 10.1139/f75-123
Smith T. G., Martin A. R. (1994). Distribution and movements of belugas, Delphinapterus leucas, in the Canadian high Arctic. Can. J. Fish. Aquat. Sci. 51, 1653–1663. doi: 10.1139/f94-166
Smith T. G., Hammill M. O., Burrage D. J., Sleno G. A. (1985). Distribution and abundance of belugas, Delphinapterus leucas, and narwhals, Monodon monoceros, in the canadian high arctic. Can. J. Fish. Aquat. Sci. 42, 676–684. doi: 10.1139/f85-087
Watt C. A. (2021). Catch statistics for beluga (Delphinapterus leucas) harvested from the Eastern high Arctic – Baffin bay and Cumberland sound populations from 1977-2020. Can. Tech. Rep. Fish. Aquat. Sci. 3444, vii + 18.
Watt C. A., Marcoux M. M., Ferguson S. H., Hammill M. O., Matthews C. J. D. (2021). Population dynamics of the threatened Cumberland sound beluga (Delphinapterus leucas) population. Arctic Sci. 7, 545–566. doi: 10.1139/as-2019-0030
Keywords: Arctic, beluga (Delphinapterus leucas), VHR imagery, crowd counting, satellite imagery, estuary abundance
Citation: Watt CA, Carlyle CG, Hornby CA and Sherbo BAH (2023) Eastern High Arctic–Baffin Bay beluga whale (Delphinapterus leucas) estuary abundance and use from space. Front. Mamm. Sci. 2:1208276. doi: 10.3389/fmamm.2023.1208276
Received: 18 April 2023; Accepted: 19 June 2023;
Published: 07 July 2023.
Edited by:
Nigel Bennett, University of Pretoria, South AfricaReviewed by:
Shannon Barber-Meyer, Pacific Whale Foundation, United StatesCopyright © 2023 Watt, Carlyle, Hornby and Sherbo. This is an open-access article distributed under the terms of the Creative Commons Attribution License (CC BY). The use, distribution or reproduction in other forums is permitted, provided the original author(s) and the copyright owner(s) are credited and that the original publication in this journal is cited, in accordance with accepted academic practice. No use, distribution or reproduction is permitted which does not comply with these terms.
*Correspondence: Cortney A. Watt, Q29ydG5leS5XYXR0QGRmby1tcG8uZ2MuY2E=
Disclaimer: All claims expressed in this article are solely those of the authors and do not necessarily represent those of their affiliated organizations, or those of the publisher, the editors and the reviewers. Any product that may be evaluated in this article or claim that may be made by its manufacturer is not guaranteed or endorsed by the publisher.
Research integrity at Frontiers
Learn more about the work of our research integrity team to safeguard the quality of each article we publish.