 Amber Gigi Hoi
 Megan A. Greischar
 Nicole Mideo
- 1Department of Ecology and Evolutionary Biology, University of Toronto, Toronto, ON, Canada
- 2Department of Ecology and Evolutionary Biology, Cornell University, Ithaca, NY, United States
Malaria parasites spend part of their life in a vertebrate host and the rest in an arthropod vector and must successfully navigate both environments to gain fitness. In vertebrate hosts, malaria parasites infect red blood cells and can either replicate asexually or develop into the sexual form required for transmission to the vector. Despite the clear fitness benefits of onward transmission, only a small proportion of malaria parasites convert to sexual development. Mathematical models seeking to test the plausibility of various hypotheses to explain these low “conversion rates” have focused almost exclusively on the vertebrate/host half of the parasite life cycle. Here, we examined how processes occurring in the vector, including density-dependent parasite development and parasite-induced vector mortality, influence the evolution of parasite conversion rate in the host by developing a multi-scale model of within-host infection dynamics and parasite within-vector developmental processes for rodent malaria. We found that, regardless of model specifications (e.g., definitions of fitness, magnitude of parasite-induced vector mortality), considering processes within the vector had only a weak influence on the optimal conversion rate, but substantially diminished the fitness returns for all strategies and resulted in a sharper declines off the optima. Our approach allowed us to derive new metrics of parasite fitness (which we call “infectivity functions”) that link within-host gametocyte density to the probability of transmission to new hosts after passing through the vector, and that prevent overestimation of parasite transmission potential.
Introduction
Parasites, by definition, exploit their hosts for survival and gain fitness by transmitting to new hosts (Poulin, 2007). To maximize their success, parasites possess many traits that have been selected specifically for infecting hosts, including sophisticated life history strategies to help them navigate the within-host environment (Thomas et al., 2002; Reece et al., 2009; Mideo and Reece, 2012). For example, parasites are capable of adjusting their growth and developmental schedules to mitigate the effect of drug treatment (Buckling et al., 1997; Paterson and Barber, 2007), better compete for limited host resources (Mideo, 2009; Leggett et al., 2013), and to take advantage of sparse transmission opportunities (Poulin, 2003; Crossan et al., 2007; Isaïa et al., 2020). Parasites with complex development that requires sequentially infecting more than one species, such as a vertebrate host and an arthropod vector, face the extra challenge of having to move through multiple environments that are likely to pose different selective pressures at various points of their life cycle. If parasite traits and strategies are genetically or physiologically correlated across life stages, then the selective environment in one host may constrain the expression of phenotypes in another (Gandon, 2004; Gilchrist and Coombs, 2006). This means that inferences about parasite life history evolution, and the forces that shape it, will be incomplete if only parts of their life cycle are considered at a time. As parasite traits influence disease transmission and severity, successful disease control relies on understanding how parasite life history evolution is shaped by processes operating across scales and environments (Reece et al., 2009; Williams, 2010; Mideo et al., 2013; Restif and Graham, 2015).
The malaria parasite (Plasmodium spp.) has a complex life cycle, spending part of its development in a vertebrate host and the other part in an arthropod vector. In the host, Plasmodium utilizes red blood cells (RBCs) as the main resource for growth and development. Upon invading an RBC, a Plasmodium parasite may enter the proliferation cycle where it replicates asexually, eventually bursting out of the RBC to release multiple progeny parasites (merozoites). Alternatively, Plasmodium merozoites may be committed to develop into gametocytes in the next infected RBC, which can be picked up by a mosquito vector during a bloodmeal. Inside the vector, gametocytes differentiate into microgametocytes and macrogametocytes (males and females, respectively), which fuse to form a diploid zygote that undergoes further developmental steps before the parasite is again infectious to its vertebrate host. The proportion of infected RBCs in a given cohort that produce gametocytes is termed the “conversion rate” (Bruce et al., 1990). From the perspective of the parasite, this is one of the most important life history “decisions” to make, representing a growth (i.e., asexual replication) versus reproduction (i.e., transmission) trade-off akin to those faced by free-living organisms (Stearns, 1992; Reece et al., 2009). On the one hand, there are clear benefits to producing many gametocytes: transmission to new hosts is a standard proxy for parasite fitness (Anderson and May, 1982; Ewald, 1983) and high gametocyte density within a host increases transmission success to mosquitoes (albeit in a saturating manner; Paul et al., 2003; Huijben et al., 2010; Bell et al., 2012). On the other hand, replication is also important to parasite success because building up to high within-host densities can help parasites overcome innate host immune defenses (Metcalf et al., 2011) and may extend the duration of infections (Klein et al., 2014). One might therefore intuitively expect some intermediate level of investment in transmission. However, Plasmodium parasites tend to make few gametocytes (relative to merozoites) and have low conversion rates – in natural transmission settings, conversion rates have been estimated at only a few percent (Stewart et al., 2022) – a phenomenon known as reproductive restraint (Taylor and Read, 1997).
A number of hypotheses have been put forth to explain the evolutionary puzzle of reproductive restraint in Plasmodium (e.g., Taylor and Read, 1997). Given that conversion rate is a parasite trait expressed in a vertebrate host, theory has largely interrogated the evolutionary influence of processes acting within the host (e.g., McKenzie and Bossert, 1998; Mideo and Day, 2008; Greischar et al., 2016; Birget et al., 2018). For example, multi-genotype infections can generate selection for low investment in transmission relative to replication due to within-host resource competition (Mideo and Day, 2008) or immune-mediated apparent competition (McKenzie and Bossert, 1998), results that have been supported by experimental data (Pollitt et al., 2011). The evolutionary influence of within-vector processes on transmission investment has received comparatively less attention. It has long been hypothesized that parasites exhibit reproductive restraint because high parasite density in the vector results in increased mortality (virulence), which decreases the probability of the parasite infecting a new host (Taylor and Read, 1997; Koella, 1999). While this is supported by some empirical evidence (Ferguson et al., 2003; Dawes et al., 2009; Pollitt et al., 2013), conditions under which these effects would become apparent and relevant (e.g., parasite load, parasite-vector species pair) remain open questions (Ferguson and Read, 2002). Furthermore, theory suggests that this effect on its own cannot plausibly generate selection for low transmission investment; instead, it generates selection for low gametocyte numbers, which can be achieved via a multitude of investment and growth strategies (Mideo and Day, 2008). Focusing solely on vector mortality also neglects the complicated series of developmental steps that parasites must undergo within the vector.
The developmental success of Plasmodium within a vector, following ingestion of gametocytes from an infected vertebrate, is highly density-dependent and non-linear (Baton and Ranford-Cartwright, 2005; Sinden et al., 2007). When the density of gametocytes circulating in the host is low, the starting inoculum in a vector will likely also be low (Sinden et al., 2007; Bell et al., 2012). Importantly, this reduces the odds of a vector picking up both microgametocytes and macrogametocytes during its bloodmeal, hampering the parasite’s fertilization success and subsequent ookinete production (Sinden et al., 2007; Bell et al., 2012). Low ookinete density in turn reduces the success of invading the vector’s midgut epithelium (Sinden et al., 2007). Ookinetes that manage to establish in the midgut will incubate as oocysts which subsequently burst to release sporozoites, which migrate to the salivary glands of the vector from which they may have an opportunity to infect a host when the vector takes another bloodmeal (Baton and Ranford-Cartwright, 2005). Initially, the production of sporozoites increases linearly with oocyst density, however, at higher densities, “crowding” results in fewer sporozoites ultimately making it to the salivary glands (Pollitt et al., 2013). These conflicting effects of load on parasite developmental success in the vector, coupled with potentially increased vector mortality resulting from high parasite load (Ferguson et al., 2003; Dawes et al., 2009; Pollitt et al., 2011), point to additional trade-offs faced by the parasite in allocating resources towards transmission stages, and make it non-intuitive to predict how processes within the vector will influence parasite life history decisions made within the host. Moreover, Plasmodium transmission potential (a proxy for parasite fitness) is typically calculated using infectivity functions that link within-host gametocyte density to the probability of infecting a vector, usually assessed from the proportion of exposed mosquitoes that survive and subsequently develop oocysts (Paul et al., 2003; Huijben et al., 2010; Bell et al., 2012). These infectivity functions increase with gametocyte abundance, implying that more gametocytes entering a mosquito means more fitness for parasites and, in particular, more parasites successfully exiting the vector – a strong assumption given the density-dependent and non-linear trajectory of parasite development within the vector. Failure to account for these processes may therefore impede accurate estimation of parasite transmission potential and resulting selection on parasite life history.
In this study we sought to understand whether explicit consideration of parasite within-vector life stages alters the resolution to the growth-reproduction trade-off experienced by malaria parasites within the host, thus altering the optimal conversion rate. We developed a multiscale model of rodent malaria to achieve this. At the within-host level, we capitalized on a previously-published model of within-host parasite development and infection dynamics (Greischar et al., 2016; Figure 1). To capture processes within the vector, we propagated the gametocytes produced from the within-host model through a series of empirically-derived functions that quantitatively capture parasite growth in the vector (Sinden et al., 2007; Dawes et al., 2009; Churcher et al., 2010; Pollitt et al., 2013; Figure 2). This integration of within-host and within-vector models allowed us to investigate the joint effect of multiple density-dependencies and trade-offs in malaria parasite development and determine whether constraints of life inside a vector can influence the evolution of parasite traits that are expressed within a host. It also allowed us to refine estimates of parasite transmission potential by incorporating processes that occur in the vector and more holistically define parasite fitness as transmission to new hosts after passage through mosquito.
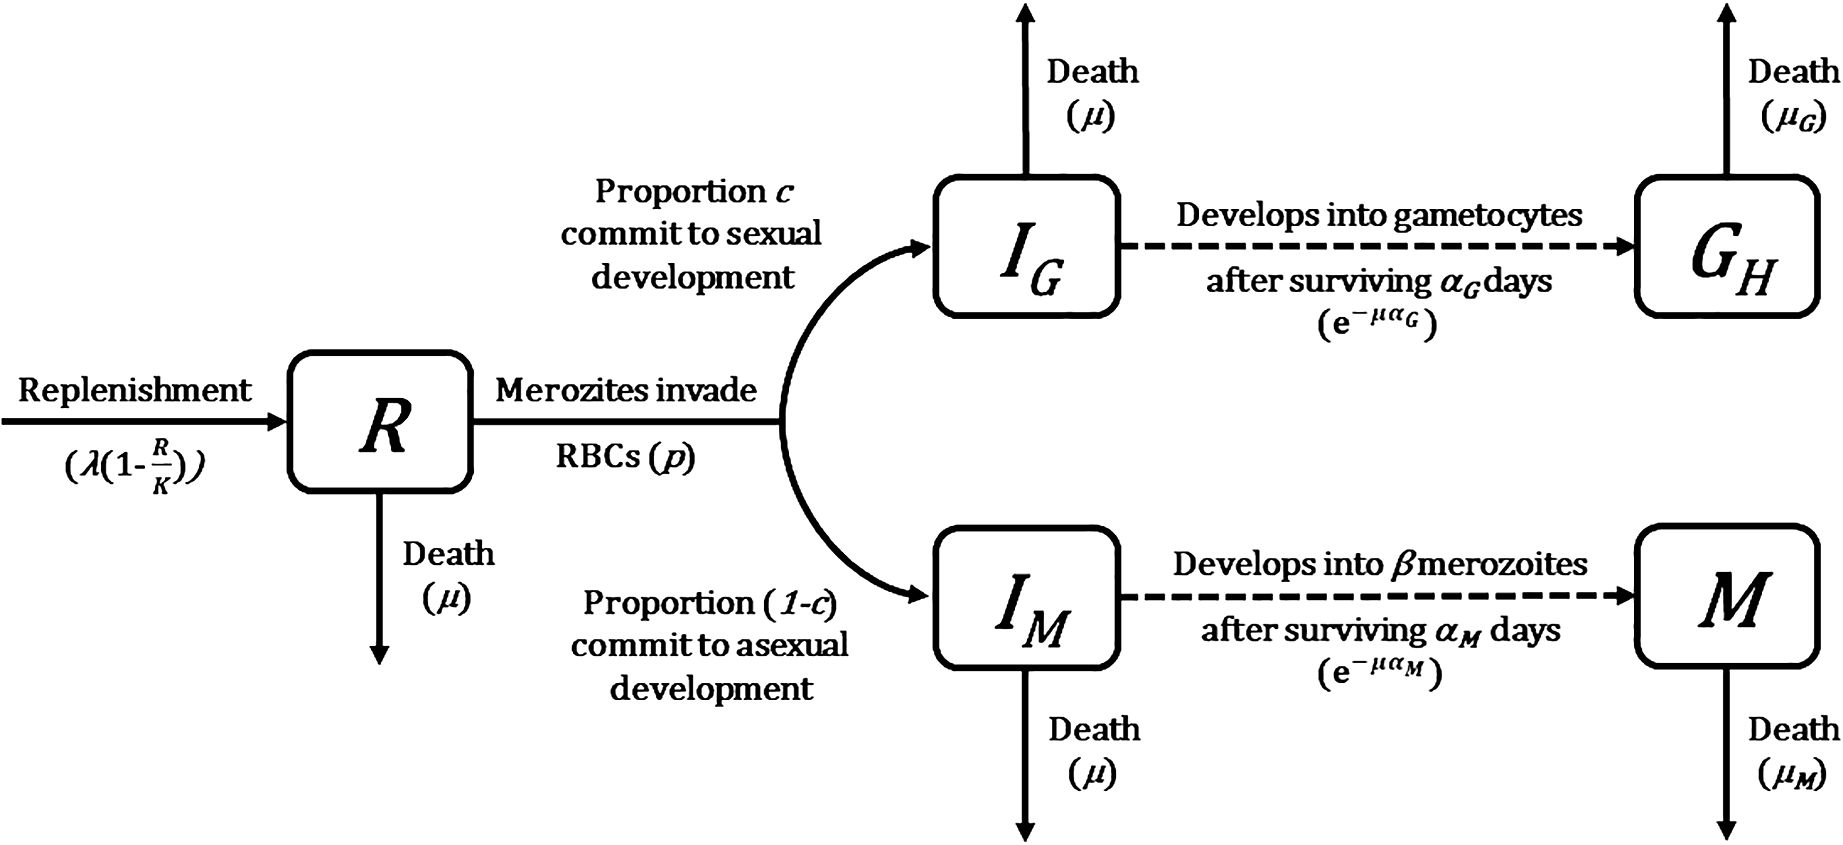
Figure 1 Flow diagram of mathematical model describing Plasmodium population dynamics within a host (Greischar et al., 2016). Compartments represent different host cell and parasite life stage categories (state variables). Solid arrows describe instantaneous transitions between compartments whereas dotted arrows show transitions with a time delay, with transition rates and probabilities given in brackets. See Table 1 for a complete list of symbols used and their definitions.
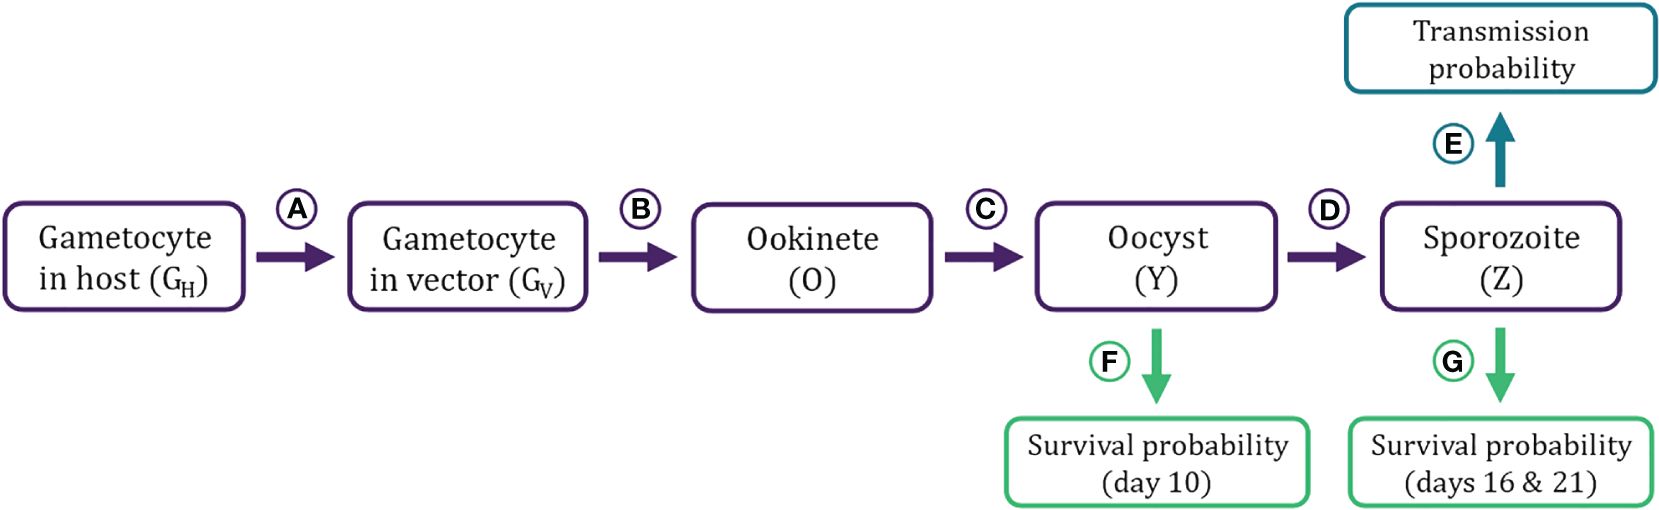
Figure 2 Flow diagram of stochastic simulation model describing Plasmodium population dynamics within a vector. The model takes within-host gametocyte density (GH) tracked by the DDE model (Figure 1) as the input. (A–D) Transitions from one developmental stage within the vector to the next. A) Gametocytes in host (GH) are taken up in a bloodmeal and enter the vector’s midgut (GV), where they (B) mate and produce ookinetes (O). (C) Ookinetes burrow through the midgut wall and develop into oocysts (Y). (D) Oocysts mature into sporozoites (Z). (E–G) Transmission and survival probabilities estimated from the parasite density at different life stages. (E) The probability of infecting a new host is estimated from the sporozoite density (Z) in the salivary gland of a mosquito. (F) Oocyst load (Y) influences the probability of surviving until day 10. G) Sporozoite loads (Z) influence the probability of surviving until first and second post-exposure bloodmeals (Day 16 and 21 post-exposure, respectively). Equations, parameters, and sources for transition functions and survival/infection probabilities are detailed in Table 2 and graphed in Figure 3.
Methods
Within-host model
The starting point of our multiscale model was an existing mathematical model of rodent malaria, Plasmodium chabaudi, within-host infection dynamics (Greischar et al., 2016). This model tracks the density (in numbers per microliter) of a parasite population as merozoites (M) that invade red blood cells (RBC; R) and either commit to asexual replication (IM) or sexual development (IG) to become gametocytes (G). The dynamics of these host cells and parasite life stages (state variables) are described by a series of delayed differential equations. When compared with ordinary differential equations where rates of change are determined entirely by the current state of the system, delayed differential equations link rates to both current (indicated by t in brackets) and past states (indicated by t minus some time delay in brackets), thereby allowing for the incorporation of realistic developmental delays between RBC invasion and maturation without having to track parasite age explicitly. Below, we present the model equations and describe how they track the dynamics of each state variable. A schematic representation of the model is depicted in Figure 1, and details of symbols used and their definitions are in Table 1.
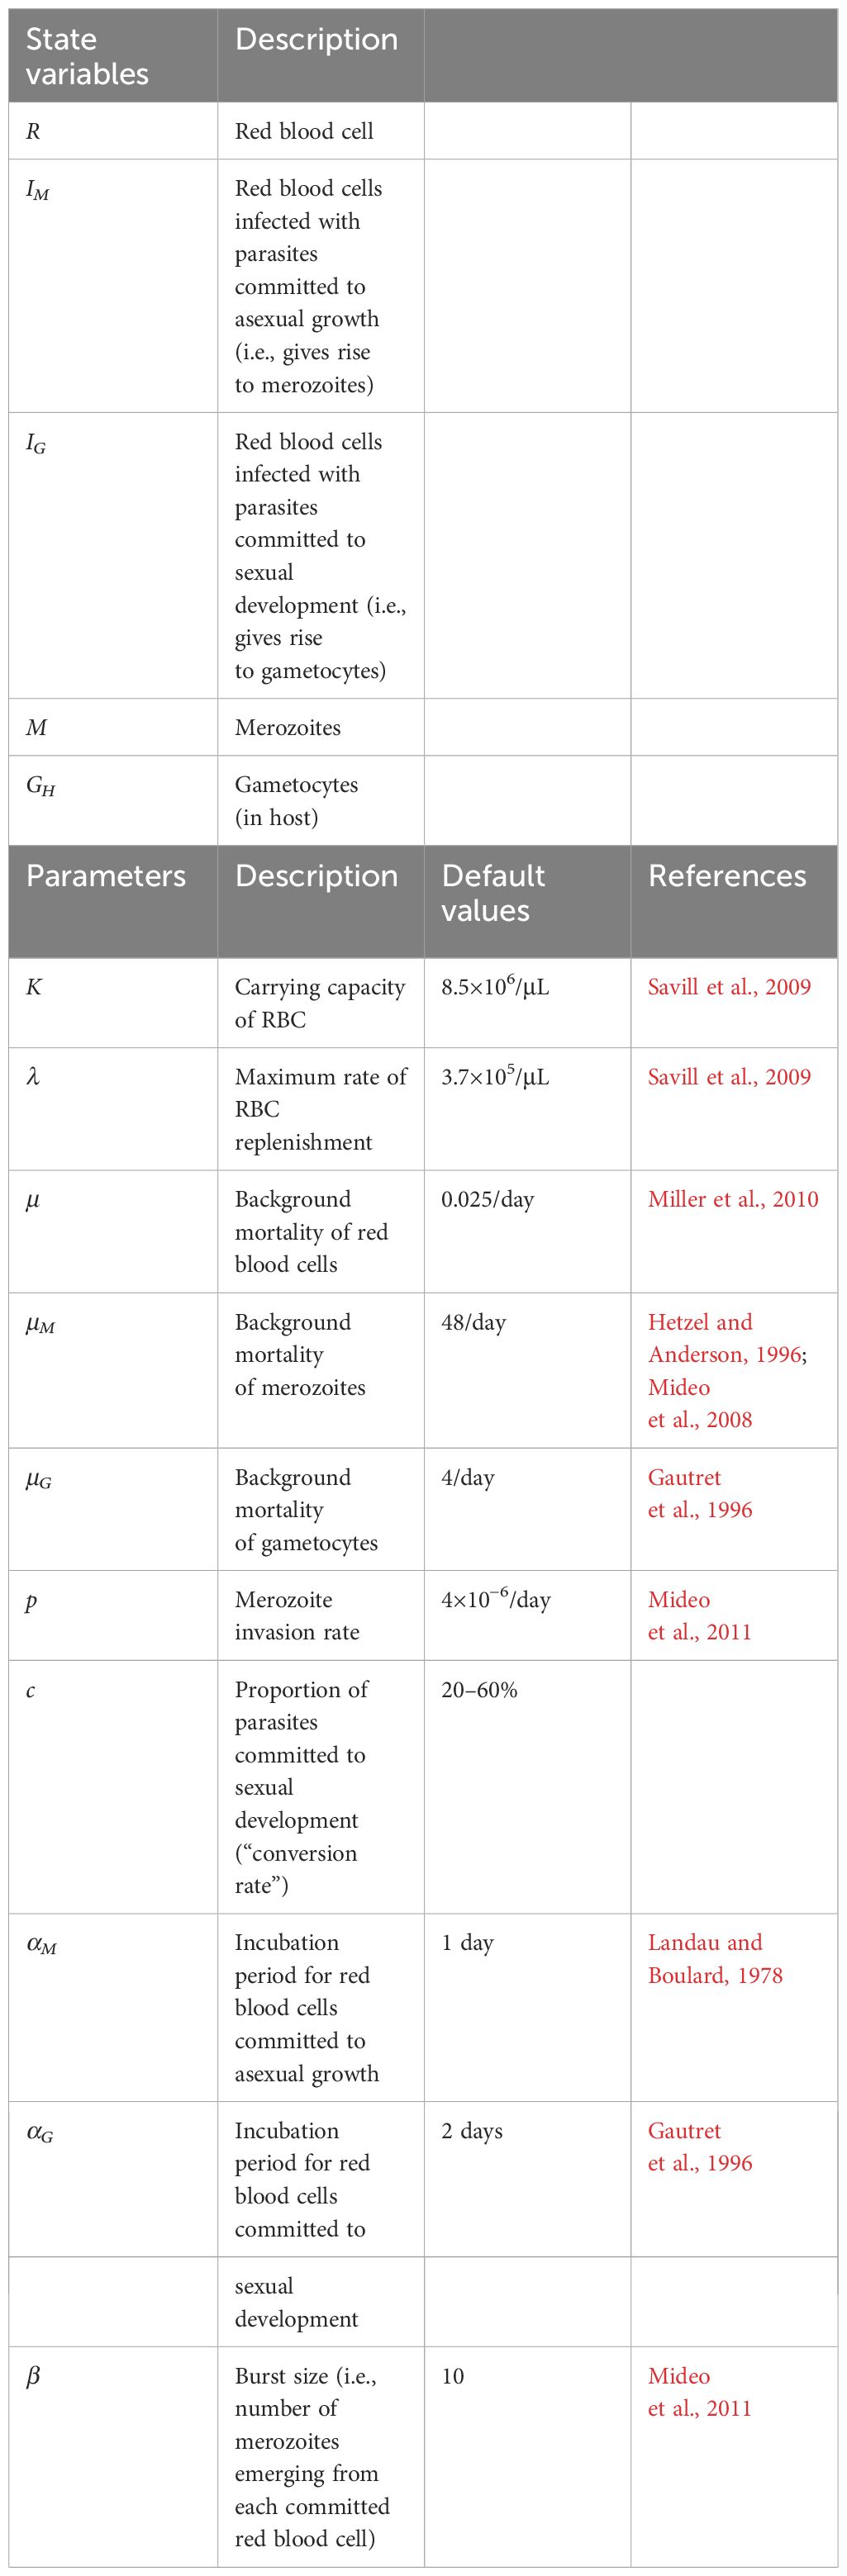
Table 1 Symbols and definitions of variables and parameters (including default values) in the within-host DDE model.
Host red blood cells are lost to natural mortality at per capita rate μ and to invasion by merozoites (M) at the per merozoite rate p (Equation 1). There is logistic replenishment of RBCs, up to a carrying capacity, K, at a maximum rate, λ, that maintains RBCs at a homeostatic equilibrium in the absence of infection:
A proportion of infected RBCs, c, commit to sexual development (IG) and the rest (1 − c) to asexual development (IM). RBCs in the IM-class are subject to natural mortality (at per capita rate μ), but will release merozoites if they survive through the parasite’s developmental period αM (i.e., one day for the rodent malaria, P. chabaudi; this occurs with probability ) (Equation 2). The number of infected RBCs that burst at time t depends on the number of susceptible RBCs available, and the number of merozoites around to infect them, at time t − αM:
Each infected RBC that survives through the developmental period will burst to release β merozoites, which suffer natural mortality at per capita rate μM, and rapidly reinvade uninfected RBC at per capita rate p (Equation 3):
RBCs in the IG class are also subject to natural mortality (μ) but will give rise to gametocytes (GH) if they survive the gametocyte maturation period αG (two days for P. chabaudi; this occurs with probability ) (Equation 4). We use the subscript to denote densities within the host, and to differentiate this quantity from the densities of gametocytes that are ingested by a vector, denoted by subscript V. The number of IG-class RBCs that will mature into GH at time t depends on the number of RBCs and merozoites αG time steps ago:
Mature gametocytes (GH) emerge from infected and committed RBCs after surviving through developmental period αG and are lost to natural mortality at per capita rate μG (Equation 5):
This model assumes no immune clearance from the host and that the transmission investment strategy is fixed over the course of infection (i.e., conversion rate, c, is constant). Theory already exists showing that early immune clearance should reduce transmission investment and that the qualitative impact of different environmental conditions is unchanged when transmission investment is constant or time-varying (e.g., competition decreases investment; Greischar et al., 2016), so we forgo recapitulating those theoretical results and focus instead on a simpler simulated within-host environment, characterized solely by RBC availability and constant investment. This within-host model provides a baseline from which to explore the influence of within-vector processes on parasite life history.
We used this model to simulate the dynamics of a single-strain, acute infection for a range of conversion rates (20–60%) within which previous studies suggest the optimum is likely to occur (Greischar et al., 2016). Simulated infections were initiated with a cohort of infected RBCs (IM), mimicking experimental studies where infections typically involve inoculating a rodent host with infected RBCs. For computational efficiency, we assumed that the initial cohort contained parasites with ages uniformly distributed throughout intraerythrocytic development, capturing an asynchronous parasite population. (We note that previous work suggests a synchronous inoculum is unlikely to qualitatively alter results; Greischar et al., 2016). Our model was simulated with a step size of 0.01 days to balance model precision with efficiency of running simulations.
Within-vector model
We extended this within-host model by integrating it with an individual-based stochastic simulation (Churcher et al., 2010) that tracks parasite cohorts as they pass through the vector. Recent advances in measuring parasite within-vector growth dynamics provided detailed quantification of transition efficiencies (mean number of parasites developing into the next stage, given a certain population size in a current stage) for all parasite developmental stages considered in our simulation (see Table 2). Such data were available for several vector-parasite pairs (e.g., Vaughan, 2007; Poudel et al., 2008), and we focused on Anopheles stephensi and Plasmodium berghei as it was the only pair where data were available for all within-vector life stages. We note that there are important differences between P. berghei and P. chabaudi (for which the within-host model is parameterized). For example, the former is a reticulocyte (i.e., young RBC) specialist, unlike the latter (Garnham, 1966; McNally et al., 1992), and attains much lower densities in the vector (Poudel et al., 2008). However, our aim is not to provide a quantitative prediction for conversion rates of a particular species, rather we seek to titrate the evolutionary influence of within-vector processes relative to expectations from considering only the within-host environment.
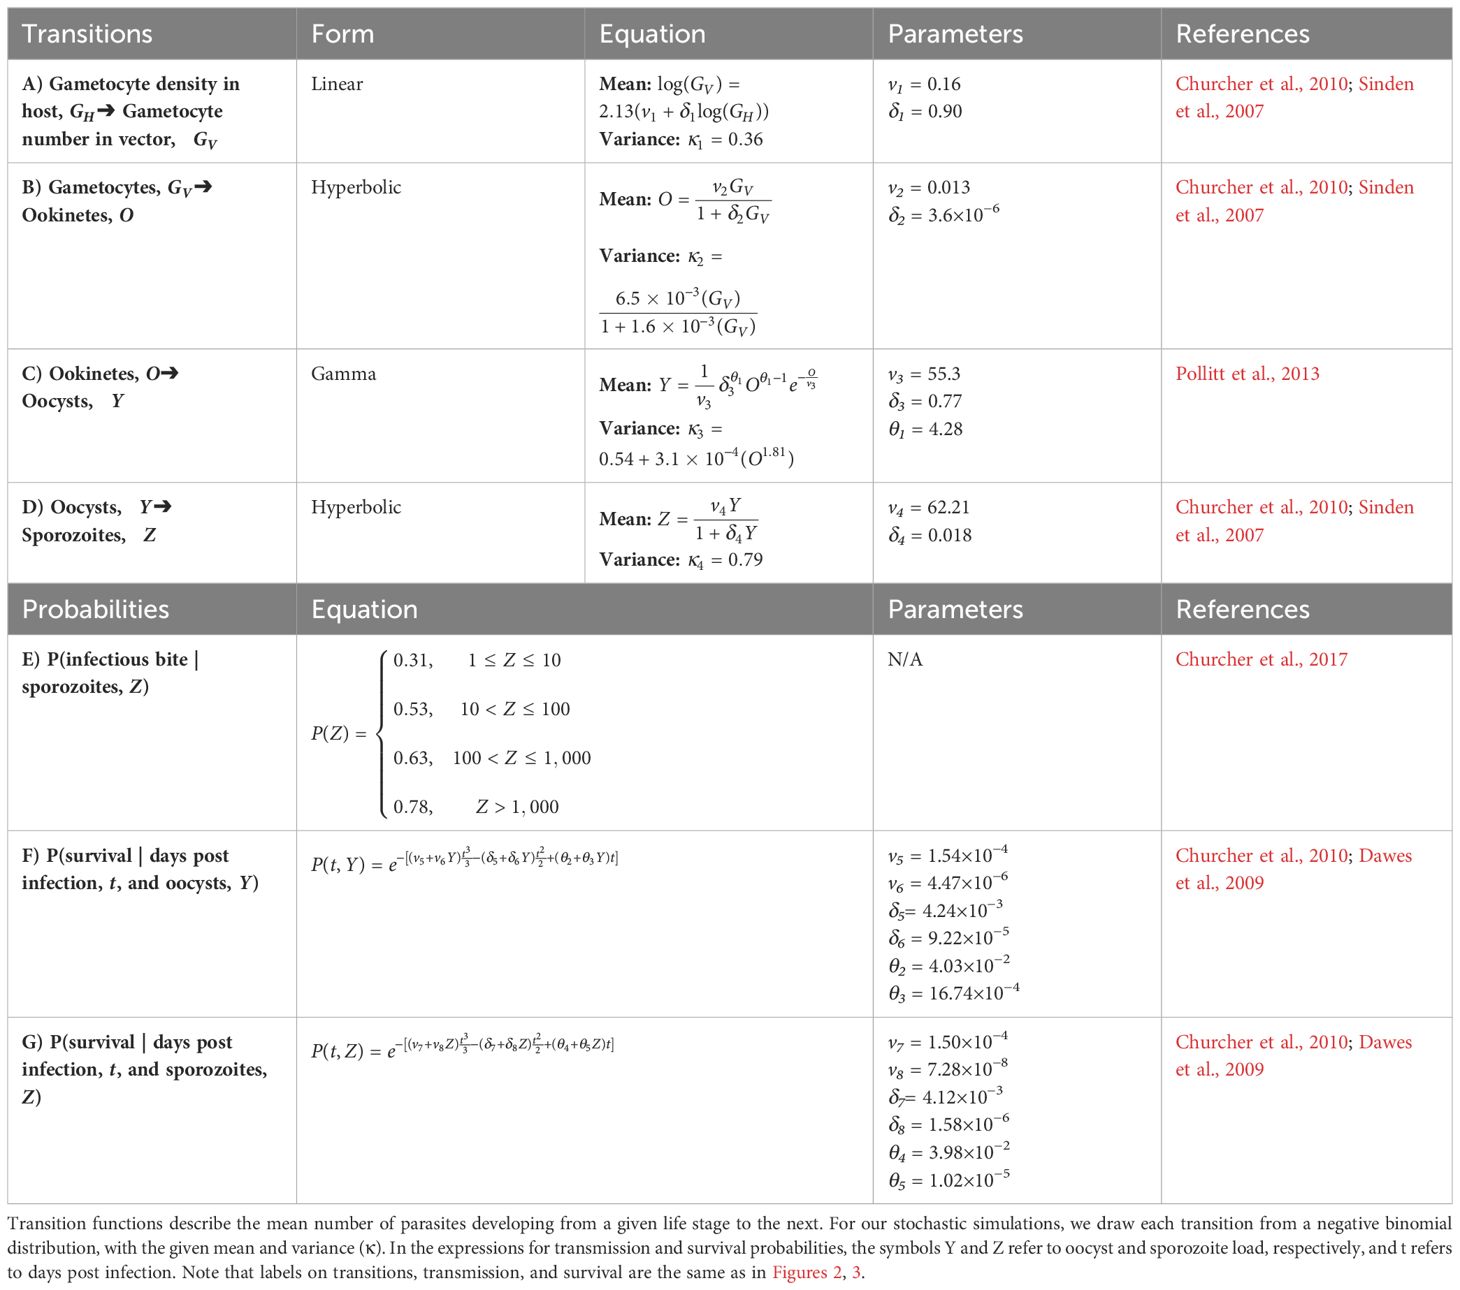
Table 2 Transition (A–D), transmission (E), and survival (F–G) functions and parameter values used in the within-vector simulations.
Gametocyte densities (GH) per microliter predicted by the within-host model were first translated to gametocyte abundance in the starting inoculum in the vector (GV), assuming a constant bloodmeal size of 2.13 μL (transition A in Table 2; Figures 2, 3; Vaughan, 2007; Bell et al., 2012). Once inside the vector, gametocytes first have to complete two development stages – ookinete and oocyst (transitions B and C in Table 2; Figures 2, 3; Sinden et al., 2007; Churcher et al., 2010) – in order to establish an infection in the vector. Oocysts then mature into sporozoites and migrate to the mosquito’s salivary glands from which they may have the opportunity to infect a new host (transition D in Table 2; Figures 2, 3; Pollitt et al., 2013). Since parasite development in the vector is known to be a highly variable process (Sinden et al., 2007; Vaughan, 2007), we implemented this simulation stochastically by sampling randomly around the mean transition-efficiency functions, where the random variables follow negative binomial distributions to account for overdispersion observed in the empirical data (Table 2; Churcher et al., 2010).
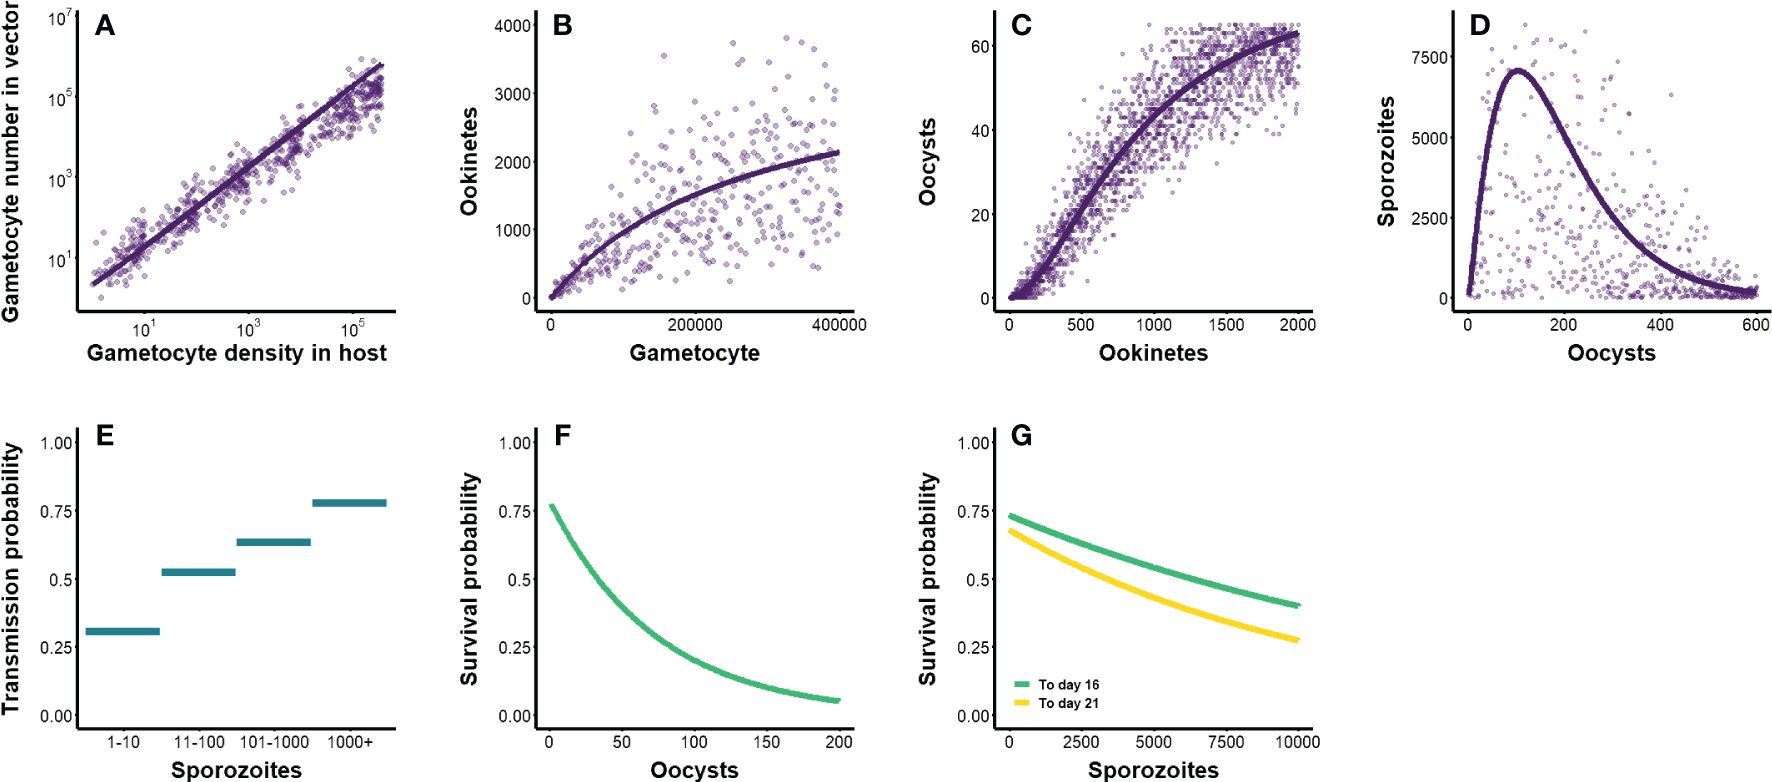
Figure 3 (A–D) Parasite density-dependent transitions through within-vector life stages. Lines represent mean predictions from previously-derived functions, while points depict outcomes of stochastic sampling around the mean (see Table 2). Initial gametocyte densities within a host were generated from the within-host model outlined in Methods and depicted in Figure 1. (A) The transition from gametocyte density within a host to gametocyte number in vector (Bell et al., 2012). (B) The transition from gametocytes in vector to ookinetes (Sinden et al., 2007; Churcher et al., 2010). (C) The transition from ookinetes to oocysts (Sinden et al., 2007; Churcher et al., 2010). (D) The transition from oocysts to sporozoites (Pollitt et al., 2013). (E–G) Parasite density-dependent transmission and survival probabilities. (E) Probability of infecting a new host, based on sporozoite load (Churcher et al., 2017). (F) Probability of the vector surviving 10 days post-exposure, based on oocyst load (Dawes et al., 2009; Churcher et al., 2010). (G) Probability of the vector surviving 16 and 21 days post-exposure, based on sporozoite load (Dawes et al., 2009; Churcher et al., 2010).
We simulated two opportunities for vectors to blood feed, on days 16 and 21 post-exposure to an infectious host, which correspond to, respectively, the end of the parasite’s extrinsic incubation period (i.e., earliest occurrence of sporozoites in salivary glands) and when the vector would likely take a second bloodmeal after completing its first gonotrophic cycle (Paaijmans et al., 2013). Whether these bloodmeals lead to new infections in a host depend on the bloodmeal being infectious and the vector remaining alive to take those bloodmeals. The probability that a bloodmeal generates a new infection in a host was assumed to be a function of sporozoite load (probability E in Table 2; Figures 2, 3; Churcher et al., 2017, 2010; Dawes et al., 2009). The probabilities of the mosquito surviving until establishment of the parasite (day 10 post-exposure) and until blood feeding (days 16 and 21) were estimated as functions of oocyst (probability F in Table 2; Figures 2, 3) and sporozoite abundance (probability G in Table 2; Figures 2, 3), respectively. We further assumed that, in all scenarios, vectors feed to repletion uninterrupted and that the mortality, depletion, and deterioration of gland sporozoites is negligible over the time period considered (Beier, 1993). We then simulated Bernoulli trials based on these probabilities to determine whether each independent event (survival or infectious bite) was successful, and tallied the total number of infectious bites each vector was alive to deliver. As such, each initial cohort of gametocytes ingested by the vector has the potential to generate up to two new infections in hosts.
Defining fitness and optimizing conversion rate
To determine the “best” parasite strategy (i.e., the optimal conversion rate, c), we needed to quantitatively define parasite fitness. Previous studies (Greischar et al., 2016; Birget et al., 2018) have used an empirically-derived relationship linking within-host parasite density to the probability of infecting a mosquito (Bell et al., 2012) to calculate the cumulative probability of infecting mosquitoes (“cumulative transmission potential”) over the course of an infection as a proxy for parasite fitness and numerically determined the conversion rate that maximized this quantity. For a single-strain, acute infection (lasting 20 days), the optimal conversion rate was 42.1% (i.e., c = 0.42; Greischar et al., 2016). We used this as our baseline comparator for our simulation results.
We translated our within-host model-simulated densities of gametocytes into three different measures of parasite fitness. First, we used the total number of infected vectors (defined as the establishment of at least one oocyst in a vector that survives to day 16 post-exposure; transitions A–C and probability F in Table 2; Figures 2, 3; definition B in Table 3). This serves as a point of comparison between model simulations and empirical observations (Bell et al., 2012), and between our simulations and a previous theoretical study that did not include vector mortality (Greischar et al., 2016). Second, to isolate the influence of within-vector developmental transitions, we used the total number of newly infected hosts, incorporating the impact of natural vector mortality only on survival to days 16 and 21 post-exposure (transitions A–D, probability E, and y-intercept of probability F in Table 2; Figures 2, 3; definition C in Table 3). Third, to isolate the effect of costs of gametocytes for vector survival (parasite virulence), we used the total number of infected hosts, incorporating the impact of both natural and infection-induced vector mortality (transitions A–D and probabilities E–G in Table 2; Figures 2, 3; definition D in Table 3). For the third case, we also conducted a sensitivity analysis with hypothetical levels of virulence that corresponded to 10–50% increases in vector mortality relative to empirical estimates (details of the survival functions used can be found in Appendix A).
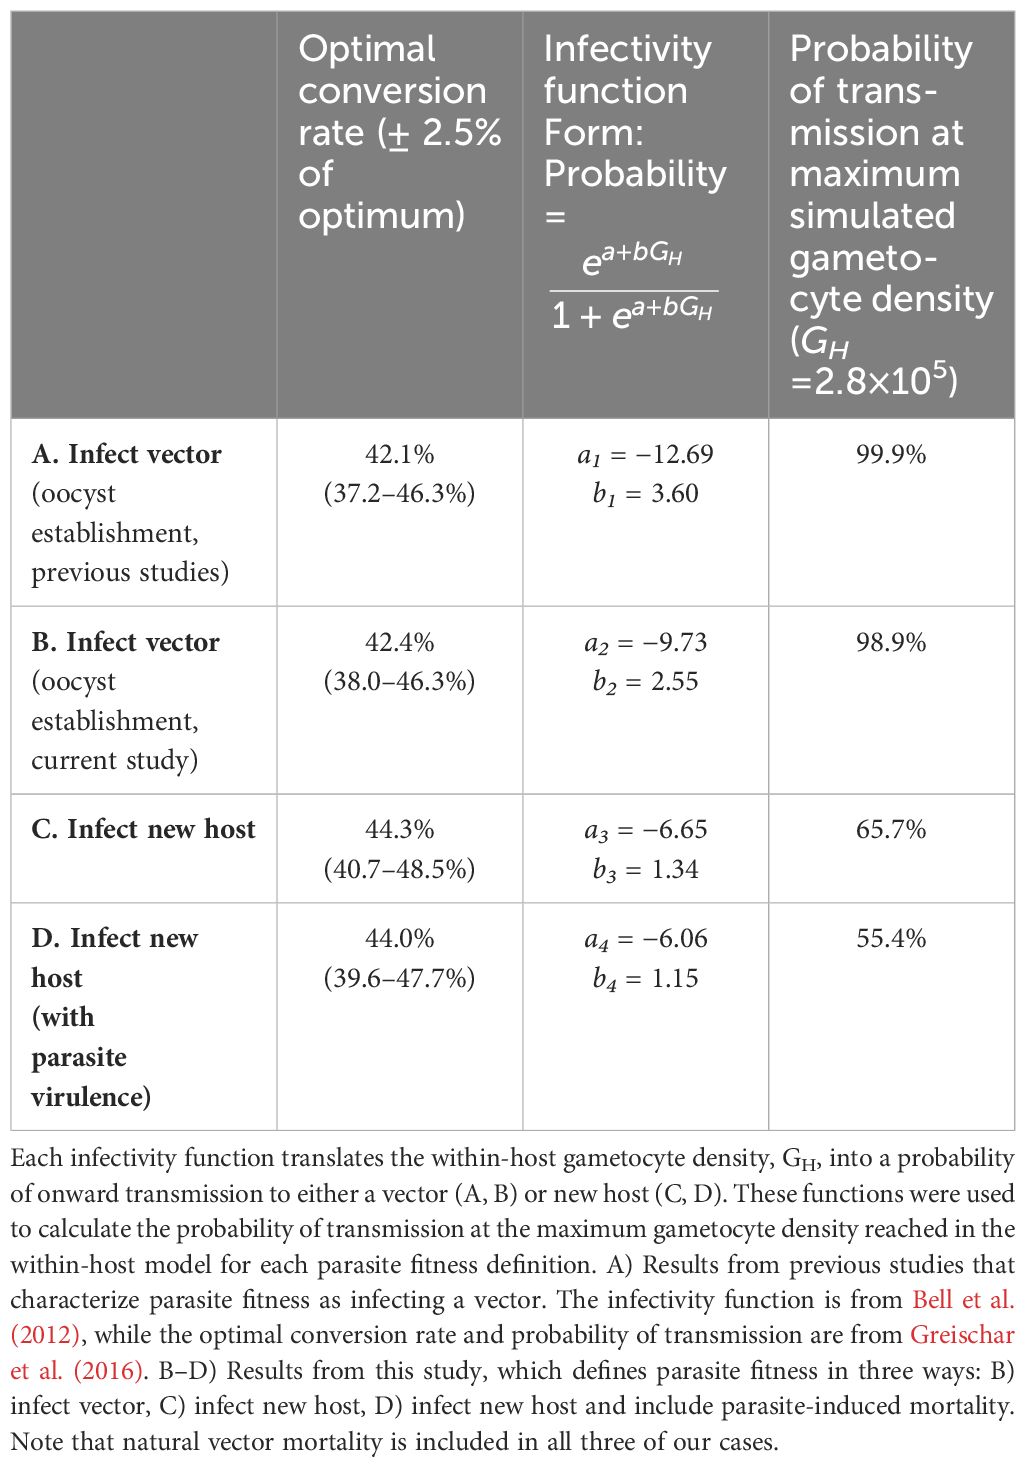
Table 3 Comparison of parasite optimal conversion rate (peaks in Figure 4), infectivity function (curves in Figure 5), and probability of transmission under different definitions of parasite fitness.
For each conversion rate, we calculated fitness using each of the three metrics (definitions B–D) by summing the number of new infections accrued over the 20-day simulated infection. In all cases, we assumed that one mosquito will feed on a host at every time point in the simulation. With a step size of 0.01 days, this equates to 100 mosquitoes being exposed to parasites per day. Since each exposed mosquito subsequently has two chances to feed on separate hosts (on days 16 and 21), parasites in the infect-new-host scenarios (C–D in Table 3) can generate twice as many new infections than those in the infect-vector scenario (B in Table 3). We therefore present parasite fitness as the proportion of maximum attainable new infections to facilitate comparison across scenarios. The maximums are 100 × 20 = 2,000 new infections in vectors and 100 × 20 × 2 = 4,000 in hosts. These values are not meant for direct interpretation due to the (unrealistic) assumption that new mosquitoes are constantly available to feed on the host at every time point in the simulation. Nonetheless, this approach allowed us to hold external ecologies, such as vector population dynamics (Greischar et al., 2019), constant and focus our study on fitness differences arising from within-vector processes. Given the stochastic nature of our simulation approach, we decided to forgo conventional optimization methods. Rather, fitness calculations for each conversion rate and scenario were repeated 1,000 times and the optimal strategy was identified as the one that gave, on average, the highest parasite fitness in each case.
Refining parasite infectivity functions
In order to directly translate within-host gametocyte density to transmission potential, we derived three new “infectivity functions” describing the probabilities of infecting a vector (to oocyst stage) or a new host, the latter with and without parasite virulence to the vector. We pooled our simulated data from across the full range of conversion rates for each scenario considered and fit logistic regression models (following Huijben et al., 2010) with parasite infection outcome (binary yes/no) as the response variable and gametocyte density in host (GH) as the predictor variable. We first formulated a function for the probability of infecting a vector (definition B in Table 3) to serve as a comparator between the empirically-estimated function describing the probability that oocysts establish in an exposed vector (definition A in Table 3; Bell et al., 2012) and results from our stochastic simulation model. In this formulation, we purged dead vectors from our dataset to better mimic the experimental set up in Bell et al. (2012). We note that removing dead vectors from total exposed will result in an overestimation of parasite fitness, but we chose to do so as the purpose for this set of simulations was to determine whether our simulation model can reasonably recapitulate empirical observations. We then formulated functions for the probability of infecting a new host where we retained dead vectors in the two infect-host scenarios (definitions C–D in Table 3) as the purpose of these two cases was to compare the effects of varying sources (and therefore degrees) of vector mortality on parasite life history. Using these functions, we calculated the transmission potential – to vectors, to new hosts, and to new hosts when vectors can suffer parasite-induced mortality – of the parasite over a 20-day acute infection of a host. All functions incorporate natural vector mortality (up to day 10 for infecting a vector, and up to day 16 for infecting a new host).
Finally, we examined the trade-off between transmission success and parasite virulence in the vector. We obtained the transmission probability and virulence level (given by 1 minus survival probability) for each gametocyte density outputted by the within-host model. Transmission probability was calculated using the newly formulated infectivity function for infecting a new host (definition C, Table 3) while survival probability was calculated using “survivorship functions” (details on their formulation can be found in Appendix B). Both the within-host and within-vector models, along with subsequent data analyses and graphics production, were implemented in R statistical software version 4.0.4 (R Core Team, 2021).
Results
Optimal conversion rates
We visualized our simulation results as fitness surfaces depicting parasite success over the range of the conversion rates considered (Figure 4). For each definition of parasite fitness (B–D in Table 3), we plotted the fitness achieved as a proportion of total attainable new infections for all 1,000 replicates of each conversion rate strategy (light-colored bands in Figure 4A). The mean of each light-colored band is shown by a dark colored line, the peak of which indicates the optimal conversion rate for that fitness definition (black circles in Figure 4A). Focusing solely on transmission to vectors, our model produces a very similar optimal conversion rate (peak of blue line in Figure 4A) as previous studies: the best strategy from our stochastic model propagating within-host gametocytes into within-vector gametocytes and developing oocysts is 42.4% (definition B in Table 3), compared with the previous estimate of 42.1% from a deterministic application of an infectivity function that captures these same transitions (Greischar et al., 2016; definition A in Table 3). When we extend our model to include onward infection to new hosts (green line in Figure 4A), explicitly incorporating parasite within-vector life stages and development, the inferred optimal conversion rate did not change by much: 44.3% (fitness outcomes ±2.5% of the optimum are achieved for conversion rates 40.7–48.5%; definition C in Table 3). Intriguingly, the inclusion of parasite-induced vector mortality (yellow line in Figure 4A) also had only a modest impact on optimal conversion rate (44.0%, ± 2.5% range 39.6–47.7%; definition D in Table 3). Even as parasite-induced vector mortality is hypothetically increased 50% above empirical estimates, the optimal conversion rate is still largely unaffected (Figure 4B; Table A1 in Appendix A). Overall, these results suggest that a slightly higher conversion rate strategy is required to complete the transmission chain – from host to vector to host – than in the absence of considering selection pressures in the vector.
Infectivity functions
Our newly derived infectivity functions (Figure 5) reveal an overestimation of parasite transmission potential when within-vector processes are overlooked. When considering infecting a vector only, our model-derived infectivity function – which translates within-host gametocyte densities into the probability of observing parasites at the oocyst stage within a vector (blue line in Figure 5) – closely resembled the empirically-derived relationship (purple line in Figure 4; Bell et al., 2012). Both showed transmission potential to be near zero at low within-host parasite densities (GH< 103), but increasing rapidly after that to plateau around 105 gametocytes. To infect a new host after passage through a vector, however, is a much more laborious process: barriers to transmission at low densities remain, and gains to transmission potential with increasing gametocyte production are achieved a lot more gradually (green line in Figure 5). This infectivity function – which translates within-host gametocyte densities into the probability of infecting a new vertebrate host – reveals that at GH ≈ 2.8×10⁵ (i.e., the maximum within-host gametocyte density reached in our model; Figure 5, dashed vertical line), parasites have an approximately 65% chance of generating a new infection, assuming no virulence to the vector. Incorporating parasite-induced mortality to the vector in the simulation further dropped this probability to around 55%. These lowered probabilities more accurately reflect the barriers that exist within a mosquito and show that it takes more gametocytes to secure a new infection in a host than are required to infect a vector.
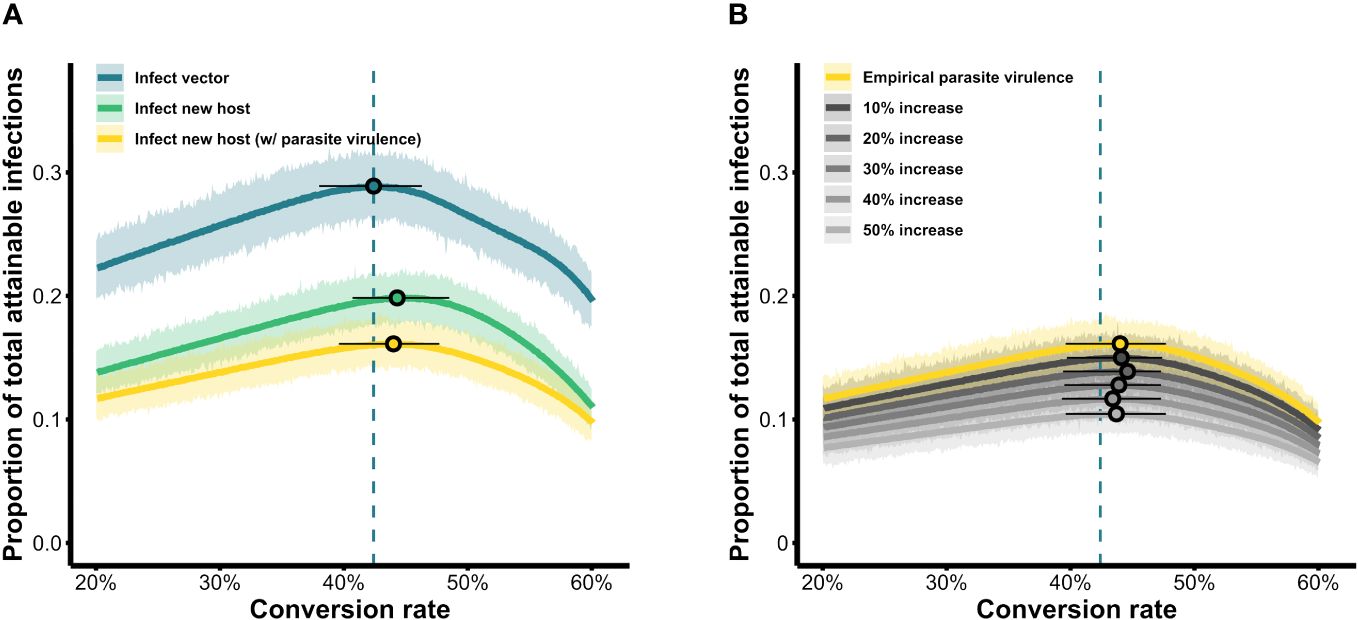
Figure 4 Parasite fitness over the range of conversion rate strategies simulated. (A) Fitness is quantified as the total number of new infections in vectors (blue) or new hosts (with and without parasite-induced vector mortality; yellow and green, respectively) as a proportion of the maximum attainable, from a single infected individual over the course of a 20-day infection. (B) The influence of increasing parasite-induced vector mortality on parasite fitness. For each scenario, the light-colored band shows results from 1,000 replicate simulations per conversion rate while the solid-colored line shows the mean fitness achieved for each conversion rate. Circles indicate the peak of the respective curves, i.e., the optimal conversion rate in a given scenario, while whiskers indicate strategies that obtain fitness within a 5% range (± 2.5%) of the maximum. Blue dashed lines mark the optimal conversion rate for the infect-vector scenario which serves as a baseline comparator across scenarios.
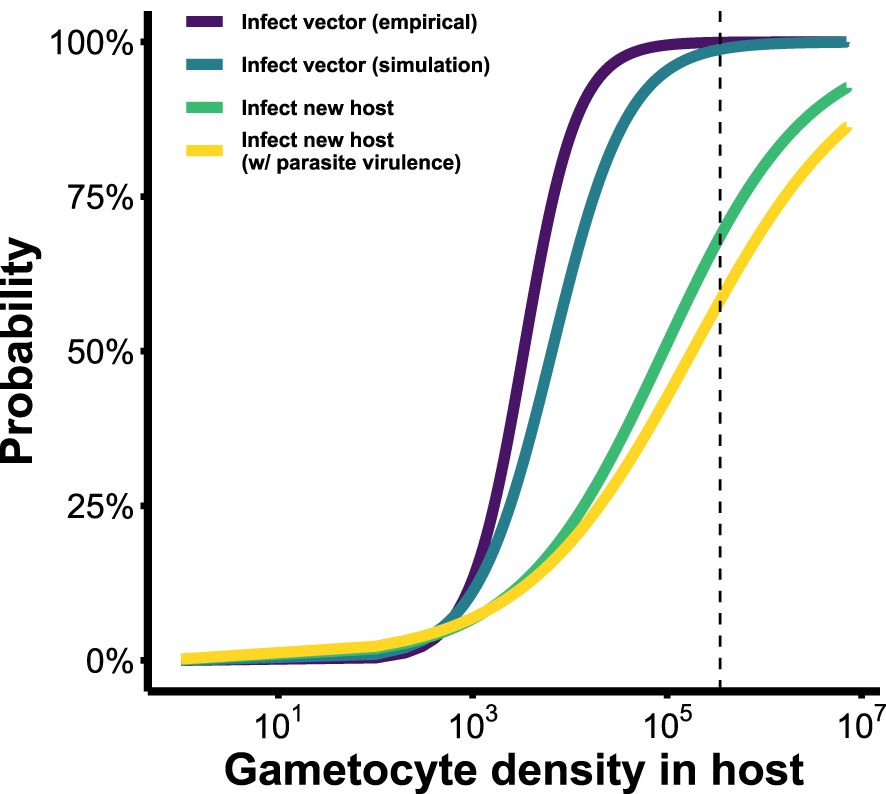
Figure 5 Infectivity functions describing the probability of Plasmodium onward transmission (to either vectors or new hosts), based on gametocyte density within the host. Purple: probability of transmission to mosquito vectors, derived from empirical data (Bell et al., 2012). The next three fitness functions were derived from our simulation model. Blue: probability of transmission to vector. Green and yellow: probability of transmission to a new host after passage through the vector, excluding and including parasite-induced vector mortality, respectively. Vertical dashed line indicates maximum observed gametocyte density across all conversion rates considered (GH= 2.8×10⁵). See Table 3 for fitted equations of each of these functions.
The new infectivity functions and outcomes of the within-vector simulation paint a different picture of parasite performance than previously thought. Over the course of the simulated infection and range of conversion rates considered, the parameter space in which the parasite can generate a new infection shrinks when within-vector development and parasite virulence are incorporated (bands are smaller in Figures 6B, C compared to Figure 6A). The probabilities of transmission are also reduced across the board for the two infect-new-host scenarios (bands are lighter in Figures 6B, C compared to Figure 6A). A closer examination of the parasite’s transmission potential over the course of infection, given the optimal conversion rates (Figures 6D–F), reveals that the probability of infecting a mosquito increases rapidly from day five onwards and plateaus near 98.5% for a few days before declining (Figure 6D), whereas the probability of infecting new hosts, even in the absence of parasite-induced mortality, is a lot lower than that: the gain in transmission potential is more gradual, peaks around 60% probability of infection then rapidly declines, rarely exceeding 50% over the course of the infection (Figure 6E). Incorporating parasite virulence further dampens the peak, but not by much (Figure 6F). Cumulatively, the transmission potential of the parasite over the 20-day acute infection period (i.e., areas under the curves in Figures 6D–F) decreased by 49.8% and 56.5% after incorporating within-vector development and parasite virulence, respectively. Together, these results suggests that parasites are unable to obtain fitness until later in the infection, and the overall capacity is low. Even though the predicted optimal strategy remained similar after considering within-vector processes (Figure 4; Table 3), the fitness returns of those strategies are quite different, and parasite transmission potential may be severely overestimated if all the processes contributing to transmission after a vector becomes infected are ignored.
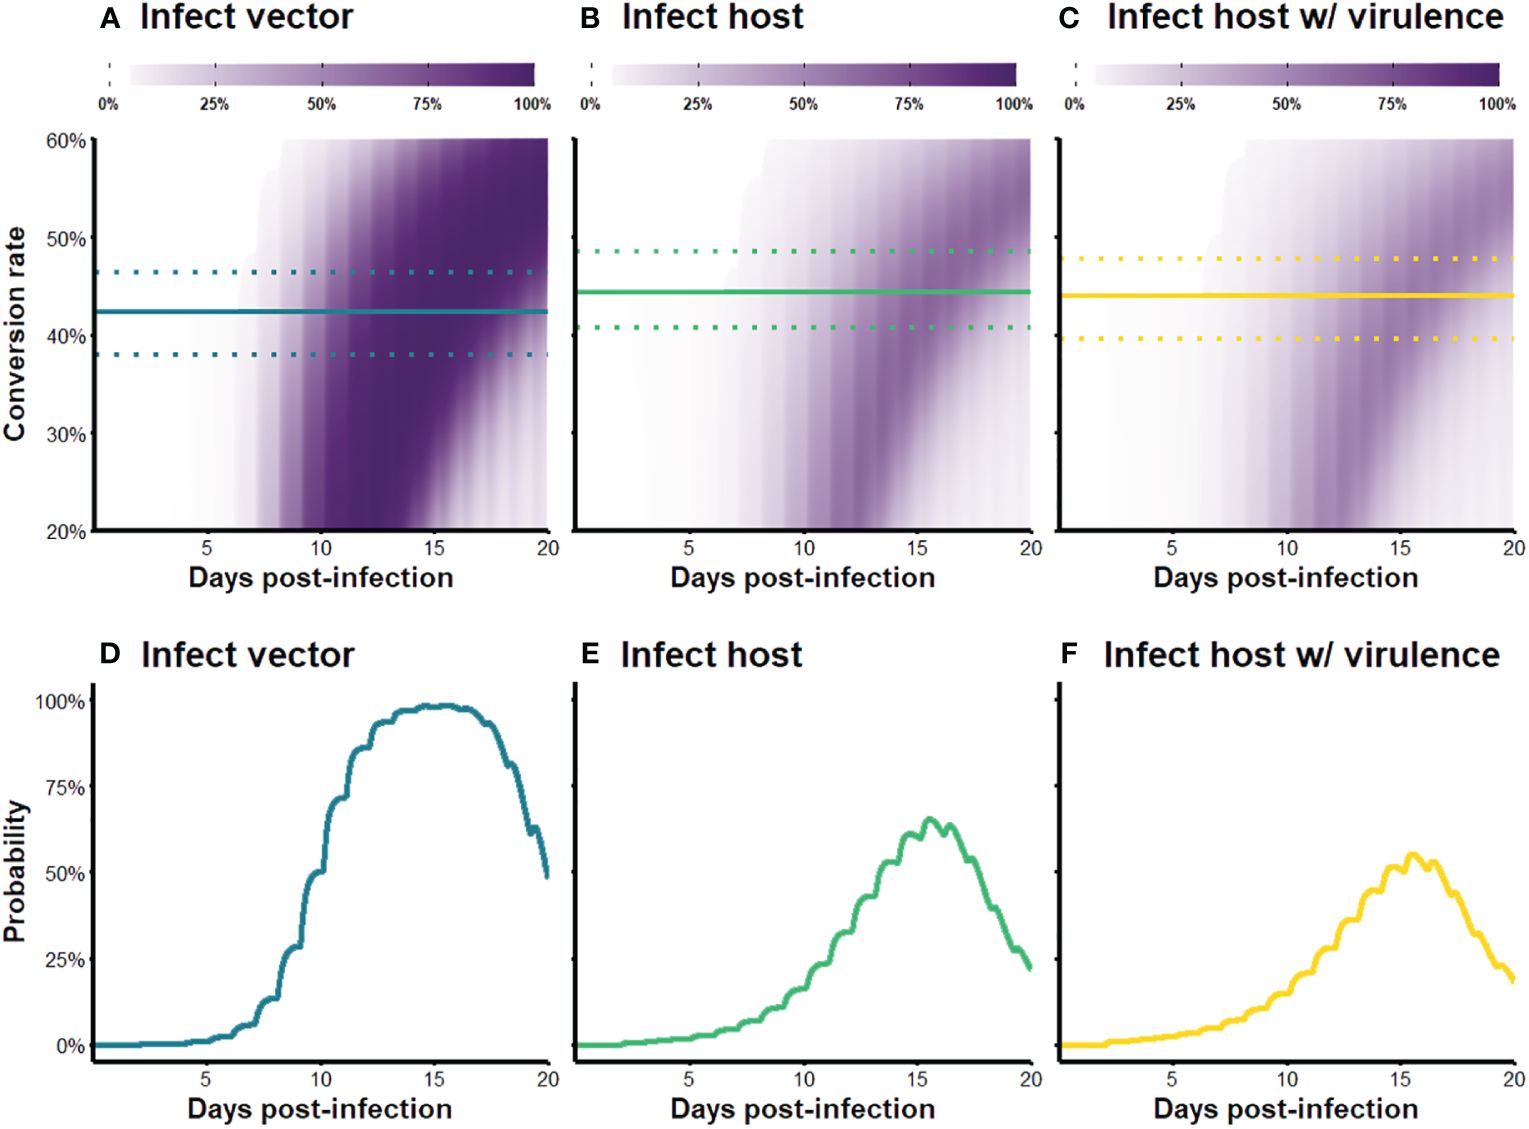
Figure 6 (A–C) Transmission probability over the course of infection, for varying conversion rate strategies. Color intensity indicates the probability of transmission to (A) a vector, (B) a new host, and (C) a new host when parasite-induced vector mortality is included. The solid lines indicate optimal strategies for each fitness metric and the dotted lines show strategies that produce outcomes within ±2.5% range of the optimum. (D–F) Transmission probability over the course of infection given the optimal conversion rate strategy. To obtain these curves, we first use our within-host model to generate a time series of gametocyte dynamics given the optimal conversion rate strategy, and then multiply the values by the appropriate infectivity functions (Figure 5; Table 3) to get transmission potential at each time point.
Virulence-transmission trade-offs
Lastly, we investigated whether the parasite experiences a trade-off between virulence and transmission in the vector (i.e., do higher gametocyte densities lead to greater probability of onward transmission but also greater risk of vector mortality)? We found that the slope of this relationship was shallow (Figure 7). At very low parasite densities (GH< 100), virulence increased rapidly but transmission probability remained low (yellow and green regions in Figure 7), representing an inevitable cost of infection incurred before the parasite can reap any fitness benefits. As parasite densities increased, the marginal mortality cost of increasing parasite load was low compared to gains from increased transmission (blue and purple regions in Figure 7), suggesting that there is little incentive for suppressing gametocyte production. Therefore, virulence to the vector is unlikely to be a strong selective pressure for reproductive restraint, which is consistent with our finding that parasite-induced mortality did not alter the optimal conversion rate.
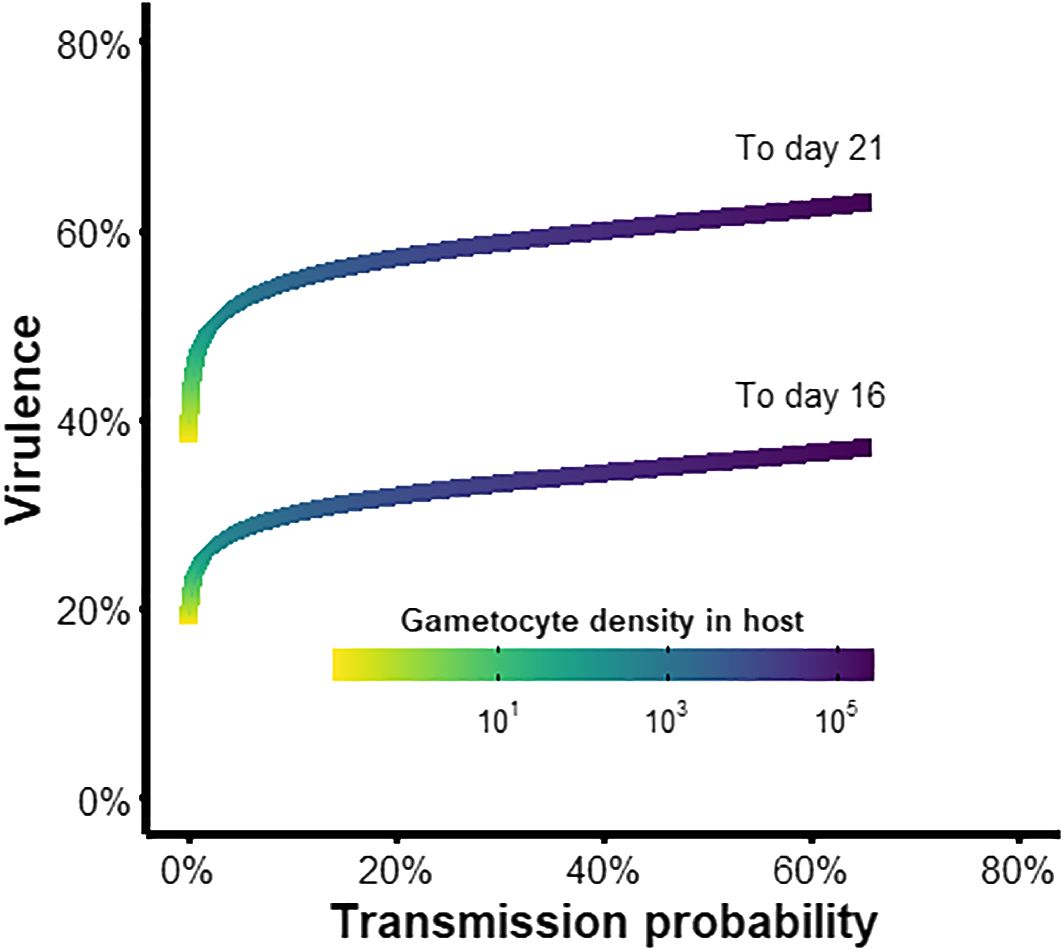
Figure 7 Trade-off between transmission and virulence of the parasite within the vector. Plotted are the virulence levels (1-survival probability) to day 16 or 21 post-exposure (Appendix B) and the probability of transmission to new hosts (infectivity function D from Table 3), given a particular within-host gametocyte density and therefore starting inoculum in the vector.
Discussion
In this study, we investigated whether parasite development in the vector influences the evolution of transmission investment (conversion rate), a key life history trait malaria parasites express in the host (Taylor and Read, 1997; Reece et al., 2009). We considered two aspects of parasite-vector interactions that may influence this trait: non-linear and non-monotonic density-dependent developmental transitions (Sinden et al., 2007), and parasite-induced vector mortality (Dawes et al., 2009; Churcher et al., 2010). These represent conflicting selective pressures as both high and low gametocyte densities are likely detrimental to parasite fitness. While infection of the vector fails at low inoculum (Bell et al., 2012), high parasite density hampers sporozoite production (Pollitt et al., 2013) and increases vector mortality (Dawes et al., 2009; Churcher et al., 2010), limiting the number of new infections generated. To assess the combined effects of these processes on parasite life history evolution, we constructed a multiscale model including a stochastic simulation model of parasite within-vector developmental transitions. Parasite fitness was defined as the number of new infections achieved in hosts (with or without parasite-induced mortality to the vector), an advance over previous proxies of parasite fitness which assume infecting the vector is directly proportional to parasite fitness (Greischar et al., 2016; Birget et al., 2018). This approach also allowed us to derive new infectivity functions describing the probability of infecting a new host given a particular within-host gametocyte density. By deriving these new infectivity functions (specifically, C and D in Table 3), we have provided a ready tool for translating within-host dynamics into the probability of infecting new hosts, whether those within-host dynamics are model-simulated or experimentally observed, and without having to explicitly model within-vector processes. Unlike previous infectivity functions (Bell et al., 2012), ours completes the transmission chain, from host to vector back to host, and therefore provides a more holistic fitness metric for studying the evolution of other parasite traits and the evolutionary influence of particular environmental factors.
Our results revealed that within-vector development had little effect on the optimal parasite conversion rate. Regardless of how parasite fitness was defined and even with parasite-induced mortality increased up to 50% over empirical estimates, the optimal conversion rate was estimated to be around 42–44% (Table 3; Table A1 in Appendix A). These estimates are high compared with empirical observations (Taylor and Read, 1997) likely due to the lack of within-host competition and immunity in this model, known determinants of reproductive restraint in Plasmodium parasites (McKenzie and Bossert, 1998; Mideo and Day, 2008; Pollitt et al., 2011; Greischar et al., 2016). We note that while adding these complexities would likely decrease our baseline optimal conversion rate, they are unlikely to qualitatively alter the effects of within-vector processes that we have investigated here (except in some specific cases, e.g., transmission-blocking immunity). Despite the optimal strategy being largely unchanged when within-vector processes are considered, the transmission potential of the parasite decreased substantially following passage through the vector. While this drop was expected – it cannot be more likely to leave the vector than it is to enter – it was surprising within-vector processes did not impact optimal conversion rates. One explanation could be that our simulated parasite populations never generated high enough oocyst numbers to hinder sporozoite production (maximum oocyst density in our simulation model was 115; Appendix C). Thus, the density-dependent developmental transitions, and conflicting selective pressures, that precluded easy a priori predictions about trait evolution did not end up influencing conversion rate in our simulations. High oocyst loads close to the level that generated the crowding phenomenon in lab settings (i.e., 150–200) have been observed in natural populations, but are very rare (Bompard et al., 2020). Most wild-caught mosquitoes carry 1–10 oocysts, with the median being greater than 5 (Pringle, 1966; Paul et al., 2003; Bompard et al., 2020). Understanding the factors that drive this right-skewed oocyst load distribution, especially the conditions that give rise to the long tail, would be important for studying parasite-vector interactions and parasite evolution in natural settings.
We found that the effect of increasing parasite load on vector mortality was small relative to gains in transmission potential. The near-flat slope of the trade-off curve (except at very low densities; Figure 7) further suggests that natural, not parasite-induced, mortality is the more significant source of mortality for vectors. This was also apparent from our sensitivity analysis of increasing parasite-induced mortality beyond empirical observations, which still did not alter the optimal parasite conversion strategy. Our findings therefore provide further evidence against the long-held hypothesis that Plasmodium parasites suppress transmission investment to reduce harm to their vector (reviewed in Taylor and Read, 1997; see also Mideo and Day, 2008), since the effect of parasite load on vector survival appears to be weak beyond an inevitable cost. In contrast, the huge gains in transmission potential may incentivize production of gametocytes to achieve high transmission probability after paying the price of vector mortality. This corroborates the modeling study of Churcher et al. (2010), which finds that high gametocyte density should be favored: even though increasing gametocyte density results in fewer vectors being alive to take bloodmeals, each bloodmeal is more infectious due to the high sporozoite load at the salivary gland, therefore resulting in high number of total new infections generated.
Other details of parasite-vector interactions may impact parasite life history evolution and could provide fruitful avenues for future work. For instance, the extrinsic incubation period (EIP, the time it takes the parasite to develop in the vector, from inoculation to becoming infectious), is a non-monotonic function of ookinete load with intermediate numbers (200–2,000) resulting in the shortest EIP (Childs and Prosper, 2020). Short EIPs are favored due to the reduced cumulative risk of vector mortality, however, how high ookinete numbers could translate to high sporozoite load (and therefore per-bite transmissibility). How this non-monotonic and density-dependent relationship between vector survival and parasite transmission may influence optimal conversion rate, in the context of other biological complexities we considered here, is unclear. Furthermore, EIP is known to be influenced by various biotic and abiotic factors such as temperature and vector condition (Paaijmans et al., 2012; Hien et al., 2016; Ohm et al., 2018). It could therefore be useful to investigate how these factors and parasite within-vector growth and development interact to influence parasite life-history evolution.
Our model assumed that the “reproductive value” of gametocytes is constant over time, meaning that a given within-host density of gametocytes always gives rise to the probability of transmission predicted by our infectivity function, regardless of which particular day those gametocytes are produced. This assumption will not hold if gametocyte infectivity declines over the course of an infection (e.g., due to a rise in transmission-blocking immune responses; Rosenberg, 2008) or if transmission opportunities are not uniformly distributed over the course of an infection. In natural settings, mosquitoes tend to bite at specific times of the day (Gatton et al., 2013) and their population sizes vary seasonally (e.g., Mordecai et al., 2019). Relaxing our model assumption of constant blood feeding at regular intervals to incorporate patterns in daily blood feeding rhythms should have little effect on our results, as the within-day variation in parasite density in our model is small compared to differences between days. Mosquito population dynamics, on the other hand, may have a stronger influence – previous work has shown that higher transmission investment is favored when the mosquito population is expanding (e.g., at the beginning of the rainy season), and vice versa (Greischar et al., 2019). Though we found no influence of parasite-induced vector mortality in our study, this could change if mortality affects the recruitment of adult mosquitoes (Beck-Johnson et al., 2013). Similarly, predictions could be altered if within-vector parasite load is associated with changes to the timing and frequency of vector bloodmeals (Schwartz and Koella, 2001; Handel and Rohani, 2015).
Our within-vector model was parameterized for the An. stephensi and P. berghei vector-parasite species pair. Given that parasite and vector species identities are known determinants of their interaction dynamics and outcome (e.g., Vaughan, 2007; Poudel et al., 2008), our prediction of no effect of within-vector dynamics may not hold for other species pairs, especially when extrapolating to those that cause human malaria in natural settings. In general, human malaria parasites tend to have higher transition efficiencies, particularly for the ookinete to oocyst and oocyst to sporozoite transitions, resulting in higher gland sporozoite loads compared with rodent malaria species (Vaughan, 2007). This suggests that the per-bite transmission probability could saturate at lower starting inoculum, alleviating the selection pressure for transmissibility and in turn, increasing the relative impact of parasite-induced vector mortality on parasite transmission potential. In this case, we speculate that the optimal conversion rate could be lower than what is predicted here. Moreover, malaria parasites in natural settings are likely to encounter many different vectors species in which they experience different developmental dynamics (Vaughan et al., 1994) and EIP (Ohm et al., 2018), resulting in different probabilities of the mosquito surviving long enough to transmit even if all else is equal. This raises the interesting possibility that parasites in diverse communities may have to be plastic or tune their strategies to the particularities of each community (Sibly, 1996). In different parts of the world where the diversity and seasonality of vector communities are drastically different from one another (Carter and Mendis, 2002; Baird, 2017; Hoi et al., 2022), vector diversity, especially that of seasonally varying community composition, may be an important driver of parasite local adaption.
Understanding parasite life history evolution is important because these traits, like conversion rate for Plasmodium, underlie key clinical and epidemiological outcomes (i.e., infection severity and infectiousness). Given that these same traits may help parasites evade our efforts to control them (Reece et al., 2010; Birget et al., 2018; Schneider et al., 2018) elucidating the constraints on parasite trait evolution may have applied relevance. For parasites that move between a vertebrate host and an invertebrate vector, the evolution of traits expressed during part of that life cycle may be constrained by processes and trade-offs that are hidden in another part. Though we find that life in a vector exerted little influence on the evolution of malaria parasite conversion rates expressed within a host, this is unlikely to be true for all traits and all parasite-vector combinations. Indeed, Spence et al. (2013) find that life in a vector can influence parasite antigenic expression and subsequent virulence in a host. Thus, further studies into parasite-vector interactions and vector ecology as potential evolutionary drivers of key parasite traits should remain a research priority.
Data availability statement
The original contributions presented in the study are included in the article/Supplementary Material. Further inquiries can be directed to the corresponding author.
Author contributions
AH: Conceptualization, Data curation, Formal analysis, Investigation, Methodology, Software, Visualization, Writing – original draft, Writing – review & editing. MG: Conceptualization, Data curation, Investigation, Methodology, Software, Supervision, Writing – review & editing. NM: Conceptualization, Funding acquisition, Investigation, Methodology, Resources, Supervision, Writing – review & editing.
Funding
The author(s) declare financial support was received for the research, authorship, and/or publication of this article. This work was funded by the Natural Sciences and Engineering Research Council of Canada Postgraduate Scholarship to AH (PGSD3-504362-2017) and Discovery Grant to NM (RGPIN-2018-06017). The funders had no role in study design, data collection and analysis, decision to publish, or preparation of the manuscript.
Acknowledgments
We thank Cylita Guy, Madeline Peters, Tsukushi Kamiya, and Alexander Whitlock for valuable discussion throughout this project, and Benjamin Gilbert, Marla Sokolowski, and two reviewers for feedback on earlier versions of this manuscript.
Conflict of interest
The authors declare that the research was conducted in the absence of any commercial or financial relationships that could be construed as a potential conflict of interest.
Publisher’s note
All claims expressed in this article are solely those of the authors and do not necessarily represent those of their affiliated organizations, or those of the publisher, the editors and the reviewers. Any product that may be evaluated in this article, or claim that may be made by its manufacturer, is not guaranteed or endorsed by the publisher.
Supplementary material
The Supplementary Material for this article can be found online at: https://www.frontiersin.org/articles/10.3389/fmala.2024.1392060/full#supplementary-material
References
Anderson R. M., May R. M. (1982). Coevolution of hosts and parasites. Parasitology 85, 411–426. doi: 10.1017/S0031182000055360
Baird J. K. (2017). Asia-Pacific malaria is singular, pervasive, diverse and invisible. Int. J. Parasitol. 47, 371–377. doi: 10.1016/j.ijpara.2016.06.006
Baton L. A., Ranford-Cartwright L. C. (2005). Spreading the seeds of million-murdering death: metamorphoses of malaria in the mosquito. Trends Parasitol. 21, 573–580. doi: 10.1016/j.pt.2005.09.012
Beck-Johnson L. M., Nelson W. A., Paaijmans K. P., Read A. F., Thomas M. B., Bjørnstad O. N. (2013). The effect of temperature on Anopheles mosquito population dynamics and the potential for malaria transmission. PloS One 8, e79276. doi: 10.1371/journal.pone.0079276
Beier J. C. (1993). Malaria sporozoites: survival, transmission and disease control. Parasitol. Today 9, 210–215. doi: 10.1016/0169-4758(93)90010-D
Bell A. S., Huijben S., Paaijmans K. P., Sim D. G., Chan B. H. K., Nelson W. A., et al. (2012). Enhanced transmission of drug-resistant parasites to mosquitoes following drug treatment in rodent malaria. PloS One 7, e37172. doi: 10.1371/journal.pone.0037172
Birget P. L. G., Greischar M. A., Reece S. E., Mideo N. (2018). Altered life history strategies protect malaria parasites against drugs. Evol. Appl. 11, 442–455. doi: 10.1111/eva.12516
Bompard A., Da D. F., Yerbanga S. R., Morlais I., Awono-Ambéné P. H., Dabiré R. K., et al. (2020). High Plasmodium infection intensity in naturally infected malaria vectors in Africa. Int. J. Parasitol. 50, 985–996. doi: 10.1016/j.ijpara.2020.05.012
Bruce M. C., Alano P., Duthie S., Carter R. (1990). Commitment of the malaria parasite Plasmodium falciparum to sexual and asexual development. Parasitology 100, 191–200. doi: 10.1017/S0031182000061199
Buckling A. G. J., Taylor L. H., Carlton J. M.-R., Read A. F. (1997). Adaptive changes in Plasmodium transmission strategies following chloroquine chemotherapy. Proc. R. Soc B Biol. Sci. 264, 553–559. doi: 10.1098/rspb.1997.0079
Carter R., Mendis K. N. (2002). Evolutionary and historical aspects of the burden of malaria. Clin. Microbiol. Rev. 15, 564–594. doi: 10.1128/CMR.15.4.564-594.2002
Childs L. M., Prosper O. F. (2020). The impact of within-vector parasite development on the extrinsic incubation period. R. Soc Open Sci. 7, 192173. doi: 10.1098/rsos.192173
Churcher T. S., Dawes E. J., Sinden R. E., Christophides G. K., Koella J. C., Basáñez M.-G. (2010). Population biology of malaria within the mosquito: density-dependent processes and potential implications for transmission-blocking interventions. Malar. J. 9, 311. doi: 10.1186/1475-2875-9-311
Churcher T. S., Sinden R. E., Edwards N. J., Poulton I. D., Rampling T. W., Brock P. M., et al. (2017). Probability of transmission of malaria from mosquito to human is regulated by mosquito parasite density in naïve and vaccinated Hosts. PloS Pathog. 13, e1006108. doi: 10.1371/journal.ppat.1006108
Crossan J., Paterson S., Fenton A. (2007). Host availability and the evolution of parasite life-history strategies. Evolution 61, 675–684. doi: 10.1111/j.1558-5646.2007.00057.x
Dawes E. J., Churcher T. S., Zhuang S., Sinden R. E., Basáñez M.-G. (2009). Anopheles mortality is both age- and Plasmodium-density dependent: implications for malaria transmission. Malar. J. 8, 228. doi: 10.1186/1475-2875-8-228
Ewald P. W. (1983). Host-parasite relations, vectors, and the evolution of disease severity. Annu. Rev. Ecol. Syst. 14, 465–485. doi: 10.1146/annurev.es.14.110183.002341
Ferguson H. M., Mackinnon M. J., Chan B. H., Read A. F. (2003). Mosquito mortality and the evolution of malaria virulence. Evolution 57, 2792–2804. doi: 10.1554/03-211
Ferguson H. M., Read A. F. (2002). Why is the effect of malaria parasites on mosquito survival still unresolved? Trends Parasitol. 18, 256–261. doi: 10.1016/s1471-4922(02)02281-x
Gandon S. (2004). Evolution of multihost parasites. Evolution 58, 455–469. doi: 10.1111/j.0014-3820.2004.tb01669.x
Garnham P. C. C. (1966). Malaria parasites and other haemosporidia (Oxford, UK: Blackwell Publishing Ltd)
Gatton M. L., Chitnis N., Churcher T., Donnelly M. J., Ghani A. C., Godfray H. C. J., et al. (2013). The importance of mosquito behavioral adaptations to malaria control in Africa. Evolution 67, 1218–1230. doi: 10.1111/evo.12063
Gautret P., Miltgen F., Gantier J. C., Chabaud A. G., Landau I. (1996). Enhanced gametocyte formation by Plasmodium chabaudi in immature erythrocytes: pattern of production, sequestration, and infectivity to mosquitoes. J. Parasitol. 82, 900–906. doi: 10.2307/3284196
Gilchrist M. A., Coombs D. (2006). Evolution of virulence: interdependence, constraints, and selection using nested models. Theor. Popul. Biol. 69, 145–153. doi: 10.1016/j.tpb.2005.07.002
Greischar M. A., Beck-Johnson L. M., Mideo N. (2019). Partitioning the influence of ecology across scales on parasite evolution. Evolution 73, 2175–2188. doi: 10.1111/evo.13840
Greischar M. A., Mideo N., Read A. F., Bjørnstad O. N. (2016). Predicting optimal transmission investment in malaria parasites. Evolution 70, 1542–1558. doi: 10.1111/evo.12969
Handel A., Rohani P. (2015). Crossing the scale from within-host infection dynamics to between-host transmission fitness: a discussion of current assumptions and knowledge. Philos. Trans. R. Soc B Biol. Sci. 370, 20140302. doi: 10.1098/rstb.2014.0302
Hetzel C., Anderson R. M. (1996). The within-host cellular dynamics of bloodstage malaria: theoretical and experimental studies. Parasitology 113, 25–38. doi: 10.1017/S0031182000066245
Hien D. F. D. S., Dabiré K. R., Roche B., Diabaté A., Yerbanga R. S., Cohuet A., et al. (2016). Plant-mediated effects on mosquito capacity to transmit human malaria. PloS Pathog. 12, e1005773. doi: 10.1371/journal.ppat.1005773
Hoi A. G., Gilbert B., Mideo N. (2022). Vector diversity and malaria prevalence: global trends and local determinants. Ecology. doi: 10.1101/2022.10.13.512182
Huijben S., Nelson W. A., Wargo A. R., Sim D. G., Drew D. R., Read A. F. (2010). Chemotherapy, within-host ecology and the fitness of drug-resistant malaria parasites. Evolution 64, 2952–2968. doi: 10.1111/j.1558-5646.2010.01068.x
Isaïa J., Rivero A., Glaizot O., Christe P., Pigeault R. (2020). Last-come, best served? Mosquito biting order and Plasmodium transmission. Proc. R. Soc B Biol. Sci. 287, 20202615. doi: 10.1098/rspb.2020.2615
Klein E. Y., Graham A. L., Llinás M., Levin S. (2014). Cross-reactive immune responses as primary drivers of malaria chronicity. Infect. Immun. 82, 140–151. doi: 10.1128/IAI.00958-13
Koella J. C. (1999). An evolutionary view of the interactions between anopheline mosquitoes and malaria parasites. Microbes Infect. 1, 303–308. doi: 10.1016/S1286-4579(99)80026-4
Landau I., Boulard (1978). “Life cycles and morphology,” in Rodent Malaria. Eds. Killick-Kendrick R., Peters W. (Academic Press, London ; New York), 53–84.
Leggett H. C., Benmayor R., Hodgson D. J., Buckling A. (2013). Experimental evolution of adaptive phenotypic plasticity in a parasite. Curr. Biol. 23, 139–142. doi: 10.1016/j.cub.2012.11.045
McKenzie F. E., Bossert W. H. (1998). The optimal production of gametocytes by Plasmodium falciparum. J. Theor. Biol. 193, 419–428. doi: 10.1006/jtbi.1998.0710
McNally J., O’Donovan S. M., Dalton J. P. (1992). Plasmodium berghei and Plasmodium chabaudi chabaudi: development of simple in vitro erythrocyte invasion assays. Parasitology 105, 355–362. doi: 10.1017/S0031182000074527
Metcalf C. J. E., Graham A. L., Huijben S., Barclay V. C., Long G. H., Grenfell B. T., et al. (2011). Partitioning regulatory mechanisms of within-host malaria dynamics using the effective propagation number. Science 333, 984–988. doi: 10.1126/science.1204588
Mideo N. (2009). Parasite adaptations to within-host competition. Trends Parasitol. 25, 261–268. doi: 10.1016/j.pt.2009.03.001
Mideo N., Acosta-Serrano A., Aebischer T., Brown M. J. F., Fenton A., Friman V.-P., et al. (2013). Life in cells, hosts, and vectors: Parasite evolution across scales. Infect. Genet. Evol. 13, 344–347. doi: 10.1016/j.meegid.2012.03.016
Mideo N., Barclay V. C., Chan B. H. K., Savill N. J., Read A. F., Day T. (2008). Understanding and predicting strain-specific patterns of pathogenesis in the rodent malaria Plasmodium chabaudi. Am. Nat. 172, E214–E238. doi: 10.1086/591684
Mideo N., Day T. (2008). On the evolution of reproductive restraint in malaria. Proc. R. Soc B Biol. Sci. 275, 1217–1224. doi: 10.1098/rspb.2007.1545
Mideo N., Reece S. E. (2012). Plasticity in parasite phenotypes: evolutionary and ecological implications for disease. Future Microbiol. 7, 17–24. doi: 10.2217/fmb.11.134
Mideo N., Savill N. J., Chadwick W., Schneider P., Read A. F., Day T., et al. (2011). Causes of variation in malaria infection dynamics: insights from theory and data. Am. Nat. 178, E174–E188. doi: 10.1086/662670
Miller M. R., Råberg L., Read A. F., Savill N. J. (2010). Quantitative analysis of immune response and erythropoiesis during rodent malarial infection. PloS Comput. Biol. 6, e1000946. doi: 10.1371/journal.pcbi.1000946
Mordecai E. A., Caldwell J. M., Grossman M. K., Lippi C. A., Johnson L. R., Neira M., et al. (2019). Thermal biology of mosquito-borne disease. Ecol. Lett. 22, 1690–1708. doi: 10.1111/ele.13335
Ohm J. R., Baldini F., Barreaux P., Lefevre T., Lynch P. A., Suh E., et al. (2018). Rethinking the extrinsic incubation period of malaria parasites. Parasitol. Vectors 11, 178. doi: 10.1186/s13071-018-2761-4
Paaijmans K. P., Blanford S., Chan B. H. K., Thomas M. B. (2012). Warmer temperatures reduce the vectorial capacity of malaria mosquitoes. Biol. Lett. 8, 465–468. doi: 10.1098/rsbl.2011.1075
Paaijmans K. P., Cator L. J., Thomas M. B. (2013). Temperature-dependent pre-bloodmeal period and temperature-driven asynchrony between parasite development and mosquito biting rate reduce malaria transmission intensity. PloS One 8, e55777. doi: 10.1371/journal.pone.0055777
Paterson S., Barber R. (2007). Experimental evolution of parasite life-history traits in Strongyloides ratti (Nematoda). Proc. R. Soc B Biol. Sci. 274, 1467–1474. doi: 10.1098/rspb.2006.0433
Paul R. E. L., Ariey F., Robert V. (2003). The evolutionary ecology of Plasmodium. Ecol. Lett. 6, 866–880. doi: 10.1046/j.1461-0248.2003.00509.x
Pollitt L. C., Churcher T. S., Dawes E. J., Khan S. M., Sajid M., Basáñez M.-G., et al. (2013). Costs of crowding for the transmission of malaria parasites. Evol. Appl. 6, 617–629. doi: 10.1111/eva.12048
Pollitt L. C., Mideo N., Drew D. R., Schneider P., Colegrave N., Reece S. E. (2011). Competition and the evolution of reproductive restraint in malaria parasites. Am. Nat. 177, 358–367. doi: 10.1086/658175
Poudel S. S., Newman R. A., Vaughan J. A. (2008). Rodent Plasmodium: population dynamics of early sporogony within Anopheles stephensi mosquitoes. J. Parasitol. 94, 999–1008. doi: 10.1645/GE-1407.1
Poulin R. (2003). Information about transmission opportunities triggers a life-history switch in a parasite. Evolution 57, 2899–2903. doi: 10.1111/j.0014-3820.2003.tb01530.x
Poulin R. (2007). Evolutionary Ecology of Parasites (Princeton, New Jersey: Princeton University Press)
Pringle G. (1966). A quantitative study of naturally-acquired malaria infections in Anopheles Gambiae and Anopheles funestus in a highly malarious area of East Africa. Trans. R. Soc Trop. Med. Hyg. 60, 626–632. doi: 10.1016/0035-9203(66)90009-5
R Core Team (2021). R: A language and environment for statistical computing. (Vienna, Austria: Foundation for Statistical Computing).
Reece S. E., Ali E., Schneider P., Babiker H. A. (2010). Stress, drugs and the evolution of reproductive restraint in malaria parasites. Proc. R. Soc B Biol. Sci. 277, 3123–3129. doi: 10.1098/rspb.2010.0564
Reece S. E., Ramiro R. S., Nussey D. H. (2009). Plastic parasites: sophisticated strategies for survival and reproduction? Evol. Appl. 2, 11–23. doi: 10.1111/j.1752-4571.2008.00060.x
Restif O., Graham A. L. (2015). Within-host dynamics of infection: from ecological insights to evolutionary predictions. Philos. Trans. R. Soc B Biol. Sci. 370, 20140304. doi: 10.1098/rstb.2014.0304
Rosenberg R. (2008). Malaria: some considerations regarding parasite productivity. Trends Parasitol. 24, 487–491. doi: 10.1016/j.pt.2008.07.009
Savill N. J., Chadwick W., Reece S. E. (2009). Quantitative analysis of mechanisms that govern red blood cell age structure and dynamics during anaemia. PloS Comput. Biol. 5, e1000416. doi: 10.1371/journal.pcbi.1000416
Schneider P., Greischar M. A., Birget P. L. G., Repton C., Mideo N., Reece S. E. R. (2018). Adaptive plasticity in the gametocyte conversion rate of malaria parasites. PloS Pathog. 14, e1007371. doi: 10.1371/journal.ppat.1007371
Schwartz A., Koella J. C. (2001). Trade-offs, conflicts of interest and manipulation in Plasmodium-mosquito interactions. Trends Parasitol. 17, 189–194. doi: 10.1016/S1471-4922(00)01945-0
Sibly R. M. (1996). Life history evolution in heterogeneous environments: a review of theory. Philos. Trans. R. Soc B Biol. Sci. 351, 1349–1359. doi: 10.1098/rstb.1996.0118
Sinden R. E., Dawes E. J., Alavi Y., Waldock J., Finney O., Mendoza J., et al. (2007). Progression of Plasmodium berghei through Anopheles stephensi is density-dependent. PloS Pathog. 3, e195. doi: 10.1371/journal.ppat.0030195
Spence P. J., Jarra W., Lévy P., Reid A. J., Chappell L., Brugat T., et al. (2013). Vector transmission regulates immune control of Plasmodium virulence. Nature 498, 228–231. doi: 10.1038/nature12231
Stewart L. B., Freville A., Voss T. S., Awandare G. A., Conway D. J. (2022). Plasmodium falciparum sexual commitment rate variation among clinical isolates and diverse laboratory-adapted lines. Microbiol. Spectr. 10, e02234–e02222. doi: 10.1128/spectrum.02234-22
Taylor L. H., Read A. F. (1997). Why so few transmission stages? Reproductive restraint by malaria parasites. Parasitol. Today 13, 135–140. doi: 10.1016/S0169-4758(97)89810-9
Thomas F., Brown S. P., Sukhdeo M., Renaud F. (2002). Understanding parasite strategies: a state-dependent approach? Trends Parasitol. 18, 387–390. doi: 10.1016/S1471-4922(02)02339-5
Vaughan J. A. (2007). Population dynamics of Plasmodium sporogony. Trends Parasitol. 23, 63–70. doi: 10.1016/j.pt.2006.12.009
Vaughan J. A., Hensley L., Beier J. C. (1994). Sporogonic development of Plasmodium yoelii in five Anopheline species. J. Parasitol. 80, 674–681. doi: 10.2307/3283245
Keywords: malaria, reproductive restraint, conversion rate, vectors, virulence
Citation: Hoi AG, Greischar MA and Mideo N (2024) Limited impact of within-vector ecology on the evolution of malaria parasite transmission investment. Front. Malar. 2:1392060. doi: 10.3389/fmala.2024.1392060
Received: 26 February 2024; Accepted: 29 May 2024;
Published: 21 June 2024.
Edited by:
Alena Pance, University of Hertfordshire, United KingdomReviewed by:
Sonal Kale, National Institute of Allergy and Infectious Diseases (NIH), United StatesSompob Saralamba, Mahidol Oxford Tropical Medicine Research Unit (MORU), Thailand
Copyright © 2024 Hoi, Greischar and Mideo. This is an open-access article distributed under the terms of the Creative Commons Attribution License (CC BY). The use, distribution or reproduction in other forums is permitted, provided the original author(s) and the copyright owner(s) are credited and that the original publication in this journal is cited, in accordance with accepted academic practice. No use, distribution or reproduction is permitted which does not comply with these terms.
*Correspondence: Amber Gigi Hoi, YW1iLmcuaG9pQGdtYWlsLmNvbQ==