 Megan A. Greischar
 Nicholas J. Savill
 Sarah E. Reece
 Nicole Mideo
94% of researchers rate our articles as excellent or good
Learn more about the work of our research integrity team to safeguard the quality of each article we publish.
Find out more
ORIGINAL RESEARCH article
Front. Malar., 15 May 2024
Sec. Pathogenesis
Volume 2 - 2024 | https://doi.org/10.3389/fmala.2024.1386266
This article is part of the Research TopicWomen in Malaria ResearchView all 14 articles
Malaria infections represent an iconic example of developmental synchrony, where periodic fevers can result when the population of parasites develops synchronously within host red blood cells. The level of synchrony appears to vary across individual hosts and across parasite species and strains, variation that—once quantified—can illuminate the ecological and evolutionary drivers of synchrony. Yet current approaches for quantifying synchrony in parasites are either biased by population dynamics or unsuitable when population growth rates vary through time, features ubiquitous to parasite populations in vitro and in vivo. Here we develop an approach to estimate synchrony that accounts for population dynamics, including changing population growth rates, and validate it with simulated time series data encompassing a range of synchrony levels in two different host-parasite systems: malaria infections of mice and human malaria parasites in vitro. This new method accurately quantifies developmental synchrony from per capita growth rates using obtainable abundance data even with realistic sampling noise, without the need to sort parasites into developmental stages. Our approach enables variability in developmental schedules to be disentangled from even extreme variation in population dynamics, providing a comparative metric of developmental synchrony.
Malaria parasites replicate in the blood of their hosts, and when this replicative cycle is synchronized, it can result in the periodic fevers classically associated with malaria infection (Kitchen, 1949; Nerlich et al., 2008). Synchrony indicates the degree to which parasites within infected red blood cells (iRBCs) show similar developmental timing across the population of iRBCs that make up an infection, and it can have consequences far beyond triggering symptoms. Since antimalarial drugs are most effective against certain parasite developmental ages (ter Kuile et al., 1993), parasite populations may be vulnerable—or resilient—to clearance by fast-acting drugs depending on the timing and synchronization of development (White et al., 1992). Theory suggests that pathogenic organisms could evolve different developmental schedules as a form of non-classical drug resistance (Neagu et al., 2018). Such evolutionary changes in synchrony could have knock-on consequences for malaria epidemiology, since synchrony is thought to influence infection severity (Touré-Ndouo et al., 2009) and the odds of onward transmission (Greischar et al., 2014; Schneider et al., 2018). Synchrony also influences capacity to accurately measure population expansion, generating spuriously large parasite multiplication rates and making it challenging to quantify how novel therapeutics (e.g., drugs, vaccines) impact parasites in vivo (Greischar and Childs, 2023). Anticipating synchrony and its potential to evolve requires understanding the degree to which parasites show heritable variation in their developmental schedules, but quantifying that variation has so far been stymied by methodological challenges. Existing methods are incapable of quantifying synchrony in ways that enable comparisons across genetic backgrounds and environments (Greischar et al., 2019).
The difficulty of quantifying synchrony arises in diverse systems (including insect pests, Bjørnstad et al., 2016), but addressing the challenges for malaria parasites—where data are available from artificial culture, experimental animal models, and natural infections—offers scope for making the comparisons needed to resolve the proximate and evolutionary drivers of developmental rhythms. In the context of malaria parasites, synchrony refers to the period of development and multiplication within a red blood cell (RBC)—the “intraerythrocytic development cycle” or IDC—that is completed when the RBC bursts to release merozoites, stages capable of invading RBCs. While periodic fevers are indicative of synchrony, the iRBC abundance required to trigger fevering (the “pyrogenic threshold”) varies across hosts (reviewed in McKenzie et al., 2008), and infections can be synchronized even when hosts show no outward symptoms (Färnert et al., 1997). Fevers are therefore an inconsistent marker of synchrony. In practice, synchrony is nearly always quantified as the percentage of parasites in a particular age range (i.e., a morphologically distinct stage of the IDC; Lambros and Vanderberg, 1979; Deharo et al., 1994, Deharo et al., 1996; Reilly et al., 2007; Touré-Ndouo et al., 2009; Allen and Kirk, 2010; O’Donnell et al., 2011), a metric that suffers from multiple sources of bias. Attempting to distinguish developmental age from morphology is inherently subjective (Ciuffreda et al., 2020) and the duration of a particular morphological stage can vary across genotypes (e.g., the early “ring” stage in Plasmodium falciparum, Reilly et al., 2007).
Distinct from these practical challenges, stage percentages represent a biased estimate of synchrony because parasite age distributions vary with population growth rates (White et al., 1992; Khoury et al., 2014; Greischar et al., 2019). This bias will be far more widespread—impacting infections in vivo and in vitro—since malaria infections exhibit extreme variability in population dynamics, such that parasite numbers within an infection can vary over several orders of magnitude on the timescale of days or weeks (e.g., Miller et al., 1994; Huijben et al., 2010; Wacker et al., 2012). Robust comparisons can be made by focusing on time windows where population dynamics are similar across treatments (e.g., comparing synchrony in typical versus perturbed host feeding rhythms, Prior et al., 2018), but that approach cannot be generalized, e.g., to the case where treatments alter parasite population dynamics. In vitro experiments reflect this quandary: Allen and Kirk (2010) hypothesized that shaking P. falciparum cultures would help maintain synchrony by reducing spatial variation in nutrient availability and concomitant variability in developmental duration, and they tested that hypothesis by checking for a greater percentage of iRBCs in the early part of development in shaken versus static cultures following initial synchronization. However, shaking cultures also accelerates population expansion by reducing merozoites that are wasted invading RBCs that have already been infected, as would be frequent in static cultures (Allen and Kirk, 2010). Thus, a greater percentage of young iRBCs would be expected even if shaking did not reduce variability in developmental duration. Recent efforts to quantify synchrony have focused on using gene expression data to obtain parasite age distributions (Ciuffreda et al., 2020), but the fundamental problem remains: age distributions, no matter how well-resolved, are still influenced by population dynamics in ways that preclude broader comparison of developmental synchrony (Greischar et al., 2019).
The population dynamics that undermine the stage percentage approach also preclude the most commonly used method for quantifying synchrony that does not rely on age distribution data. In some malaria species, iRBCs in the latter half of parasite development sequester in the microvasculature of their hosts where they cannot be easily sampled (e.g., P. falciparum; White et al., 1992), causing periodic fluctuations in iRBC abundance where the period corresponds to the duration of the IDC. The fluctuations can be fit with a model to quantify synchrony. Those models assume log-linear expansion (i.e., a constant rate of parasite multiplication) and fit a sine wave, the amplitude of which serves as a metric for the degree of synchrony (e.g., Simpson et al., 2002; reviewed in Gnangnon et al., 2021). That approach sidesteps the bias inherent to stage percentages but cannot be applied broadly, for example, when sequestration is absent or when parasite multiplication rates change through time. Sequestration is not ubiquitous and cannot take place in vitro or in certain hosts (e.g., rag1−/− mice, Khoury et al., 2014). While parasites often multiply exponentially initially, that log-linear expansion cannot continue indefinitely as resources become exhausted and immune pressure mounts, so the latter portions of time series must be discarded prior to fitting the model. It is also not obvious how the amplitude of fitted sine waves can be translated into a biologically meaningful and readily comparable measure of developmental synchrony, especially for malaria species that do not sequester and hence do not exhibit oscillations in observable iRBC abundance.
Here we present a new method for quantifying synchrony that treats the age distribution as unobserved data and instead quantifies developmental synchrony by fitting a simple model, a Leslie matrix (Leslie, 1945), to infection time series (specifically, repeated measures of infected RBC densities). This approach estimates the time window over which a cohort of parasites within an infection complete their IDC and burst out of RBCs: a short window, relative to the cycle length, indicates a highly synchronized infection, while a long window indicates asynchrony. Since no existing approach can provide accurate estimates of synchrony from empirical data against which to compare (Greischar et al., 2019), we instead validate this approach by applying it to simulated data (i.e., where the true answer is known). We do this for two malaria species, Plasmodium falciparum and P. chabaudi, that show considerable differences in the duration of the IDC and population dynamics. Our approach can recover differences in synchrony using tractable sampling schedules, and, equally important, can detect similar levels of synchrony despite differences in IDC duration and population dynamics across species. This method relies on iRBC counts sampled multiple times per IDC rather than labor-intensive morphological staging. The focus on stage percentages has left a dearth of relevant data sets for applying this method, but these data are readily obtainable whenever sequestration does not obscure iRBC abundance (e.g., in vitro). Unlike existing metrics, this definition of synchrony enables comparisons across species and environments even when population dynamics also vary, providing a framework for understanding the evolutionary drivers and practical consequences—including the capacity for harm and vulnerability to control—of synchrony.
We develop an approach for measuring synchrony by fitting a model to per capita replication rates calculated from iRBC time series. We estimate synchrony from the age distribution of parasites within iRBCs, similar to past efforts (Ciuffreda et al., 2020) but with an important difference: instead of directly measuring age distributions—a composite measure of synchrony and population dynamics—we fit the initial age distribution with a model that accounts for subsequent changes in age structure caused by population dynamics. We focus on initial ages because changes in the age distribution through time reflect both synchrony, the variation in developmental timing across the population of iRBCs, and population growth (Greischar et al., 2019). The simple model we fit to data to estimate synchrony represents a null hypothesis for how age distributions would change through time in response to population dynamics if synchrony were constant. Other hypotheses can then be tested against the null model, e.g., that synchrony increases or decreases with time, or that there are multiple cohorts with distinct levels of synchrony. Ideally, we would apply this method to real data, comparing its performance against the current gold standard approach. However, in this case the gold standard metric—the percentage of parasites in a particular developmental window—is known to be unacceptably biased (Greischar et al., 2019), so we instead simulate data where the true level of synchrony is known (that is, specified in the mechanistic model) and constant. We use those simulated data both to illustrate the bias inherent to the gold standard approach and to validate our novel approach.
We use a previously described mechanistic model (Greischar et al., 2014) to simulate experimental infections of mice with the rodent malaria parasite, P. chabaudi, and in vitro cultures of human malaria parasites, P. falciparum. These two scenarios exhibit divergent population dynamics: P. chabaudi requires 24 hours for the IDC and RBCs are replenished by the host causing iRBC abundance to rebound from infection-induced decline; P. falciparum requires 48 hours for the IDC and replicates in an artificial culture of RBCs without RBC replenishment (in our simulations). The model tracks the abundance of infected and uninfected RBCs, as well as the number of RBC-invasive merozoites, per microliter (details in Supplementary Methods). We simulate four different levels of synchrony, identical for each of the two scenarios (Figure 1), and sample our simulated infections on empirically feasible schedules. To test low resolution time series, we simulate “even” sampling where infections are censused twice per IDC with equal time between each sample (12 hours apart for P. chabaudi and 24 hours apart for P. falciparum). We also examine “uneven” sampling where more samples are taken per IDC and sampling is concentrated around peak bursting. For uneven sampling, we assume only three samples per IDC are possible for P. chabaudi infections in vivo (gathered in an eight hour window around peak bursting), whereas we simulate sampling P. falciparum in vitro every two hours for the 12-hour period spanning peak bursting (seven samples per IDC, as described by Reilly Ayala et al., 2010). By using distinct sampling schedules for the two species, we also test whether the new approach can cope with practical differences in the timing and frequency with which malaria species can be assessed.
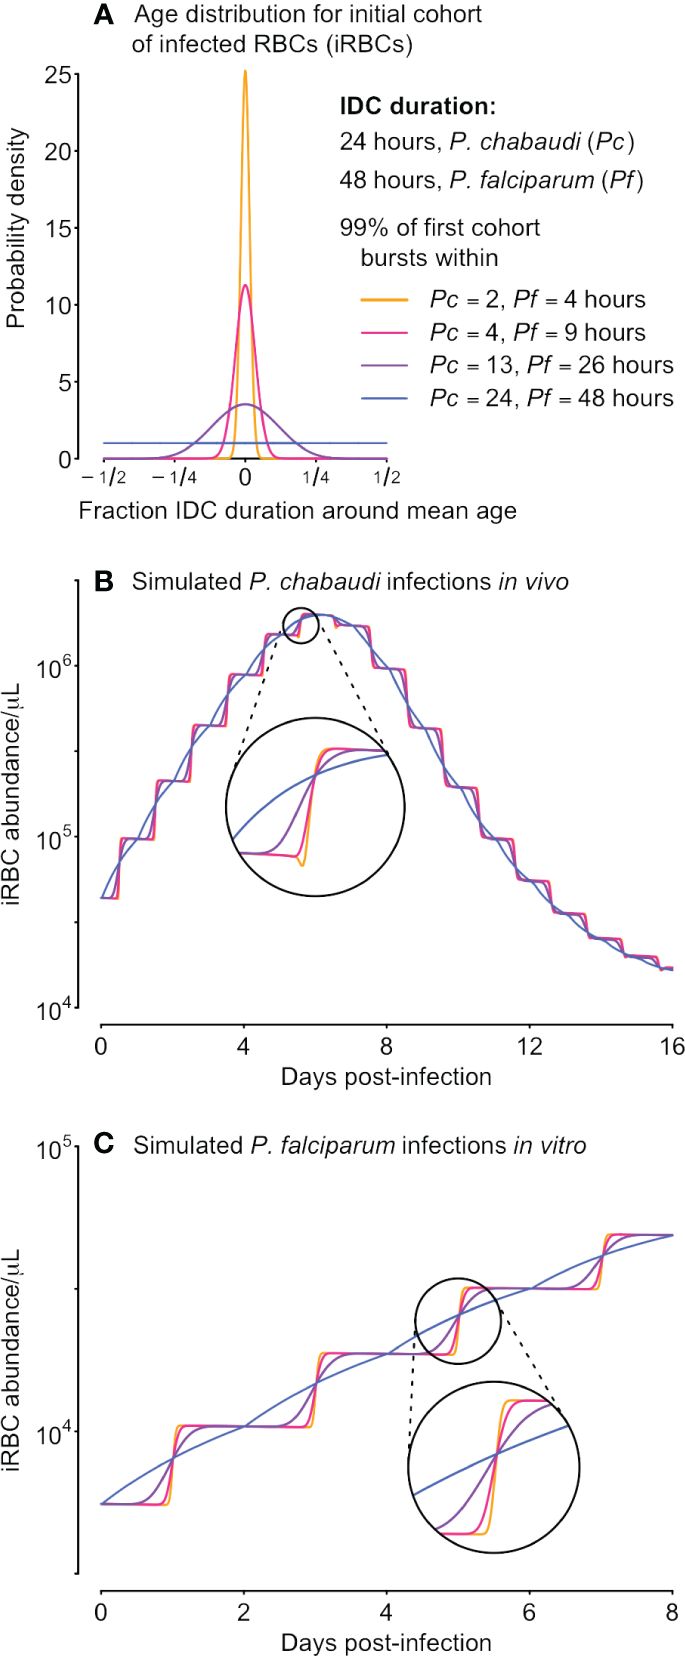
Figure 1 Differences in synchrony are dwarfed by population dynamics, even for unrealistically well-sampled time series. We used a range of starting age distributions for the initial cohort of iRBCs (A) and simulated iRBC abundance for P. chabaudi infections of mice (B) and P. falciparum infections in vitro (C), both “sampled” every 15 minutes. The initial age distribution for each cohort is described by a symmetric beta distribution and is assumed to be extremely synchronous (a narrow distribution of parasite ages, sP= 500, orange), highly synchronous (sP= 100, pink), synchronous (sP= 10, purple), or asynchronous (a uniform distribution of parasites ages, sP= 1, blue). Those beta distributions translate into 99% of the initial inoculum bursting within 2, 4, 13 or 24 hours (respectively) for P. chabaudi, or within 4, 9, 26 or 48 hours (respectively) for P. falciparum.
We use simulated iRBC abundance as is and also with realistic sampling noise. We assume that iRBC abundance will be assessed via microscopy, since qPCR estimates parasite genome copies that can only be related to iRBC abundance if the level of synchrony is known (e.g., Cheesman et al., 2003). Microscopy protocols for estimating iRBC abundance via microscopy vary, so we test the consequences of either counting iRBCs until a target total number of RBCs have been observed (binomial error) or counting to a target iRBC number (negative binomial error). Details of the model, parameter values, and simulated sampling schedules and sampling noise can be found in Supplementary Methods. We confirm that simulated data generate biased estimates of synchrony using existing methods (percentage of iRBCs in the early half of development) and then test our new approach for quantifying synchrony.
Our metric for synchrony requires estimating the initial iRBC age distribution, while accounting for changes due to population dynamics. We do this by fitting a symmetric Beta distribution as detailed below. A Beta distribution is flexible enough to yield iRBC age distributions ranging from uniform to narrow bell curves (Figure 1). The fitted initial iRBC age distribution can then be used to demarcate the time required for 99% of iRBCs to burst (as in Figure 1A), and dividing that quantity by the duration of the IDC can serve as a measure of developmental synchrony that can be readily compared across species:
We subtract the fraction from one to arrive at a measure of synchrony that scales from zero (completely asynchronous) to one for perfectly synchronized infections, consistent with past efforts to establish a “synchronicity index” (Deharo et al., 1996). The time required for 99% bursting corresponds to the 0.005 and 0.995 quantiles of the symmetric Beta distribution given by the shape parameter sP, multiplied by the duration of the IDC. Thus, for the same shape parameter, the time required for 99% of bursting would take twice as long for P. falciparum compared with P. chabaudi (Figure 1), since P. falciparum requires twice as long to complete its cycle (reviewed in Paul et al., 2003; Mideo et al., 2013).
By default, the initial age distribution (the symmetric Beta distribution) is centered halfway through development, but that need not be the case in real populations. We therefore fit an additional offset parameter that reflects the initial median age of the cohort, around which the Beta distribution is centered. In this way, we can independently specify the median age and the variability around that median age. In contrast, if the initial age distribution were specified with an asymmetric Beta distribution, the shape parameters would alter the mean and the variance simultaneously. The choice of 99% of the time required for bursting can yield values comparable to the full duration of the IDC for asynchronous infections, and hence a synchrony of zero according to Equation 1. Note that synchrony can be calculated given an age distribution (here specified by one parameter, sP) and the duration of the IDC. We test our approach on simulated data by comparing known sP values (i.e., the values used to simulate the time series) with estimated values () obtained by fitting a simple model (next section). We examine the simpler case of synchrony being maintained through time and later discuss how this approach could encompass changing synchrony.
We next derive a simple model to fit to time series data and thereby estimate the level of synchrony. In formulating that model, we focus on one of the simplest ways of modeling the continual feedbacks between population dynamics and age distributions, a Leslie matrix (Leslie, 1945; reviewed in Hastings, 1997). Given information on the number of new iRBCs generated by each bursting schizont, a Leslie matrix can be used to project the population expansion (or decline) of an age-structured population, illustrated with a hypothetical example of a population with four age classes in Figure 2. In the context of malaria infections, a Leslie matrix can be used to specify how iRBCs containing parasites in different developmental age classes transition to subsequent developmental age classes or burst to generate new iRBCs (Figure 2B).
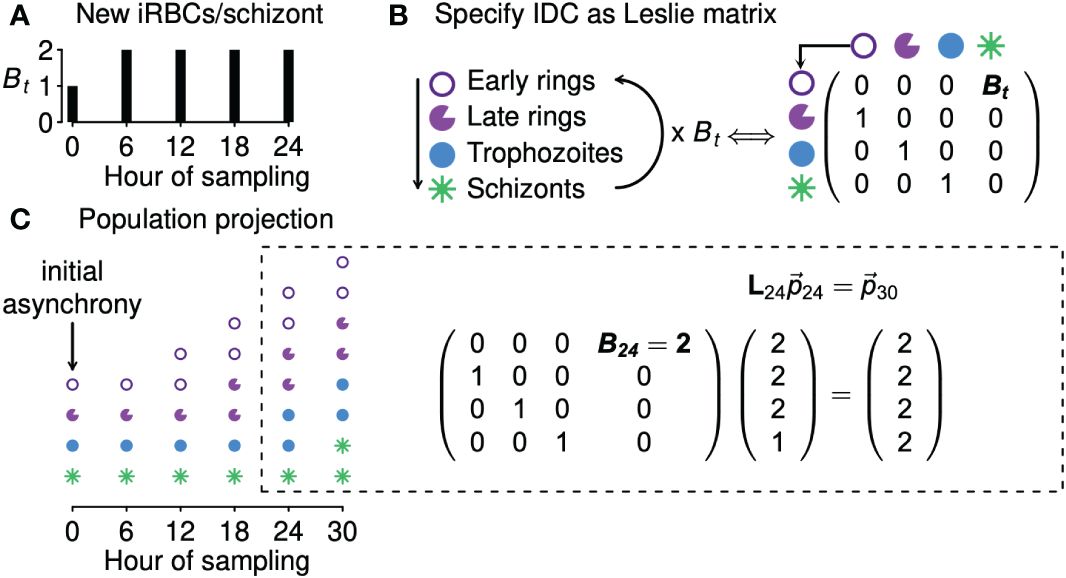
Figure 2 Leslie matrices project how age distributions change in response to changing population growth. Panel (A) shows a hypothetical example of changing numbers of new iRBCs produced per schizont (Bt) through time. In panel (B), progression through development is shown as a life cycle diagram (left) and, equivalently, as a Leslie matrix (right). Leslie matrices—one for each Bt value—are used to project how age distributions change through time (C), as in the example calculation shown at right. The Leslie matrix is denoted L while indicates the abundance of iRBCs in each developmental class.
We assume that the iRBC population is initially distributed across n developmental age classes, that is, a discretization of the continuous age distribution used in the data-generating model. The fraction of the IDC spent within each class is given by 1/n (e.g., if samples were taken, at minimum, 4 hours apart for a species with an IDC lasting 24 hours, then n = 24/4 = 6, and each age class lasts 4 hours). When iRBCs are sampled at evenly spaced intervals throughout the developmental cycle, n is equal to k, the number of samples per cycle (e.g., in Figure 2, n = k = 4). If sampling is uneven, n is equal to the duration of the IDC divided by the minimum time between samples. For example, if sampling occurred three times per cycle (k = 3) so that iRBCs were censused four hours prior to peak bursting, at peak bursting, and four hours after peak bursting, we treat that situation as though iRBCs were counted every four hours (with missing counts for three of the six samples), so that again n = 24/4 = 6.
For a population with n age classes, the Leslie matrix (L) is
where m values indicate the fecundity of each age class and θ values give the probability of individuals in a particular age class surviving to mature into the subsequent age class in the next time point. We assumed that each age class is certain to survive and mature into the subsequent age class at the next time step (θ1 = θ2 = θ3 =… = θn−1 = 1). In the simulated data, approximately 2% of iRBCs will not survive development due to background mortality of RBCs (µ, see Supplementary Tables S1, S2). If we are nonetheless able to recover the true duration of bursting, it would suggest the approach is robust to at least small deviations from the assumption of 100% survival of iRBCs during the IDC. Further, background RBC mortality is likely to be the dominant force removing iRBCs in the acute portion of infection, where RBC limitation can largely explain dynamics (Mideo et al., 2008) and immune clearance is thought to be minimal (White et al., 1992). Immunity will certainly be minimal in vitro. Note that immune clearance of merozoites would be accounted for through the calculation of parasite multiplication rates (PMRs), the fold-increase in iRBC abundance over each IDC represented in the time series (defined in Table 1). However, when immune clearance of developing iRBCs is substantial, the assumption of 100% iRBC survival through each IDC may need to be revisited.
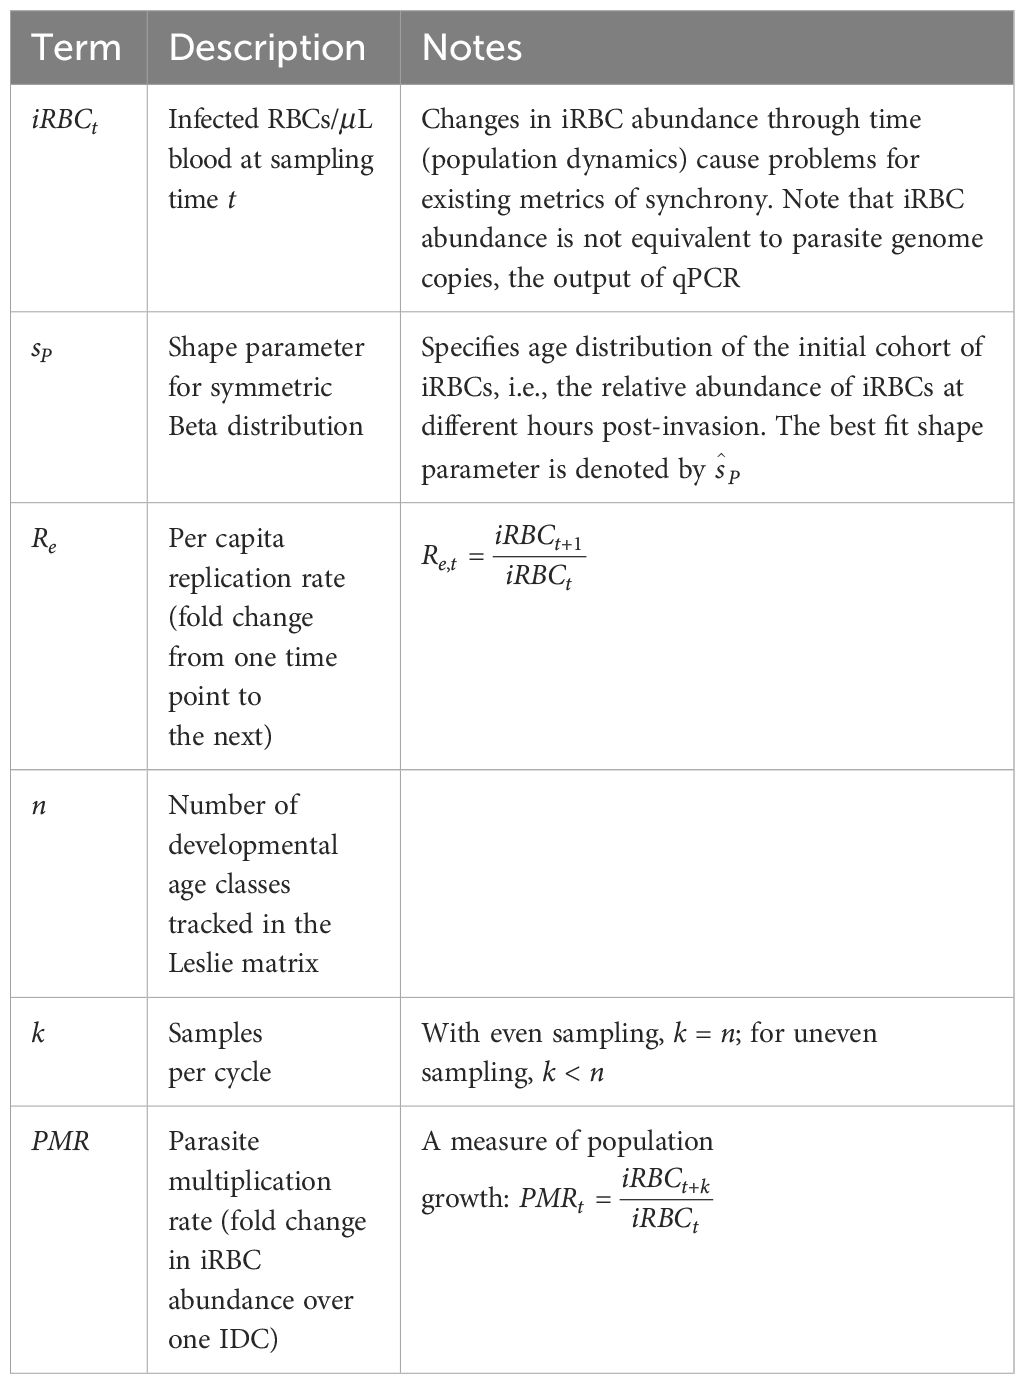
Table 1 Key terms and definitions used in our metric of synchrony, as applied to malaria parasites.
Since only the final age class of malaria parasites are capable of bursting out to generate new iRBCs, m1 = m2 = m3 = … = mn−1 = 0 and mn= Bt, where Bt is the number of new rings generated by each iRBC completing development (Figure 2A). Note that Bt is not equivalent to the burst size, the average number of merozoites emerging from each bursting schizont, because some emerging merozoites will fail to successfully invade. Once Bt values are obtained by interpolating between PMR values (see below), the Leslie matrix (Equation 2) can be parameterized for each time point at which population projections are needed. Given a vector to indicate the numbers of iRBCs in each age class at time t,
The number of iRBCs in each age class is then summed to obtain the projected total number of iRBCs at each time point. Projecting the total iRBC abundance (Equation 3) enables calculation of the predicted per capita growth rate, for each time point, where
and the i subscript indicates the developmental age class.
The initial number of iRBCs in each developmental age class, denoted by the vector , can be specified with a symmetric beta distribution, which has the useful property of ranging from uniform (i.e., completely asynchronous, when the shape parameter, sP, is equal to one) to increasingly narrow bell-shaped curves with increasing sP values (Figure 1A). For a symmetric beta distribution, the mean falls at 0.5 by default—equivalent to the median parasite age falling exactly halfway through the IDC—but that need not be the case for real data. We therefore fit an “offset” parameter, constrained to vary between zero and one, to allow the mean of the beta distribution (that is, the median parasite age) to deviate from 0.5. We use the cumulative density function of the beta distribution to obtain the initial stage distribution, , for a given number of stage compartments (n). The initial I0 iRBCs are sorted into n stages according to the beta distribution specified by a given shape parameter, (the quantity to be fitted). The initial number of iRBCs is arbitrary, since we are fitting per capita replication rates (rather than iRBC abundance), so we set I0 = 100 to avoid errors of precision that might occur with lower iRBC counts.
We describe the algorithm for estimating synchrony using Equation 1 (illustrated in Figure 3):
Step 1. Obtain time series of iRBC abundance, sampled multiple times per IDC. Age distribution data are not required.
Step 2. (a) We first calculate the parasite multiplication rates (PMRs) and then (b) calculate the per capita replication rates (Re, Table 1).
Step 3. By interpolating between the observed PMRs, we obtain estimated Bt values needed to project population dynamics for an age-structured population (see Figure 2).
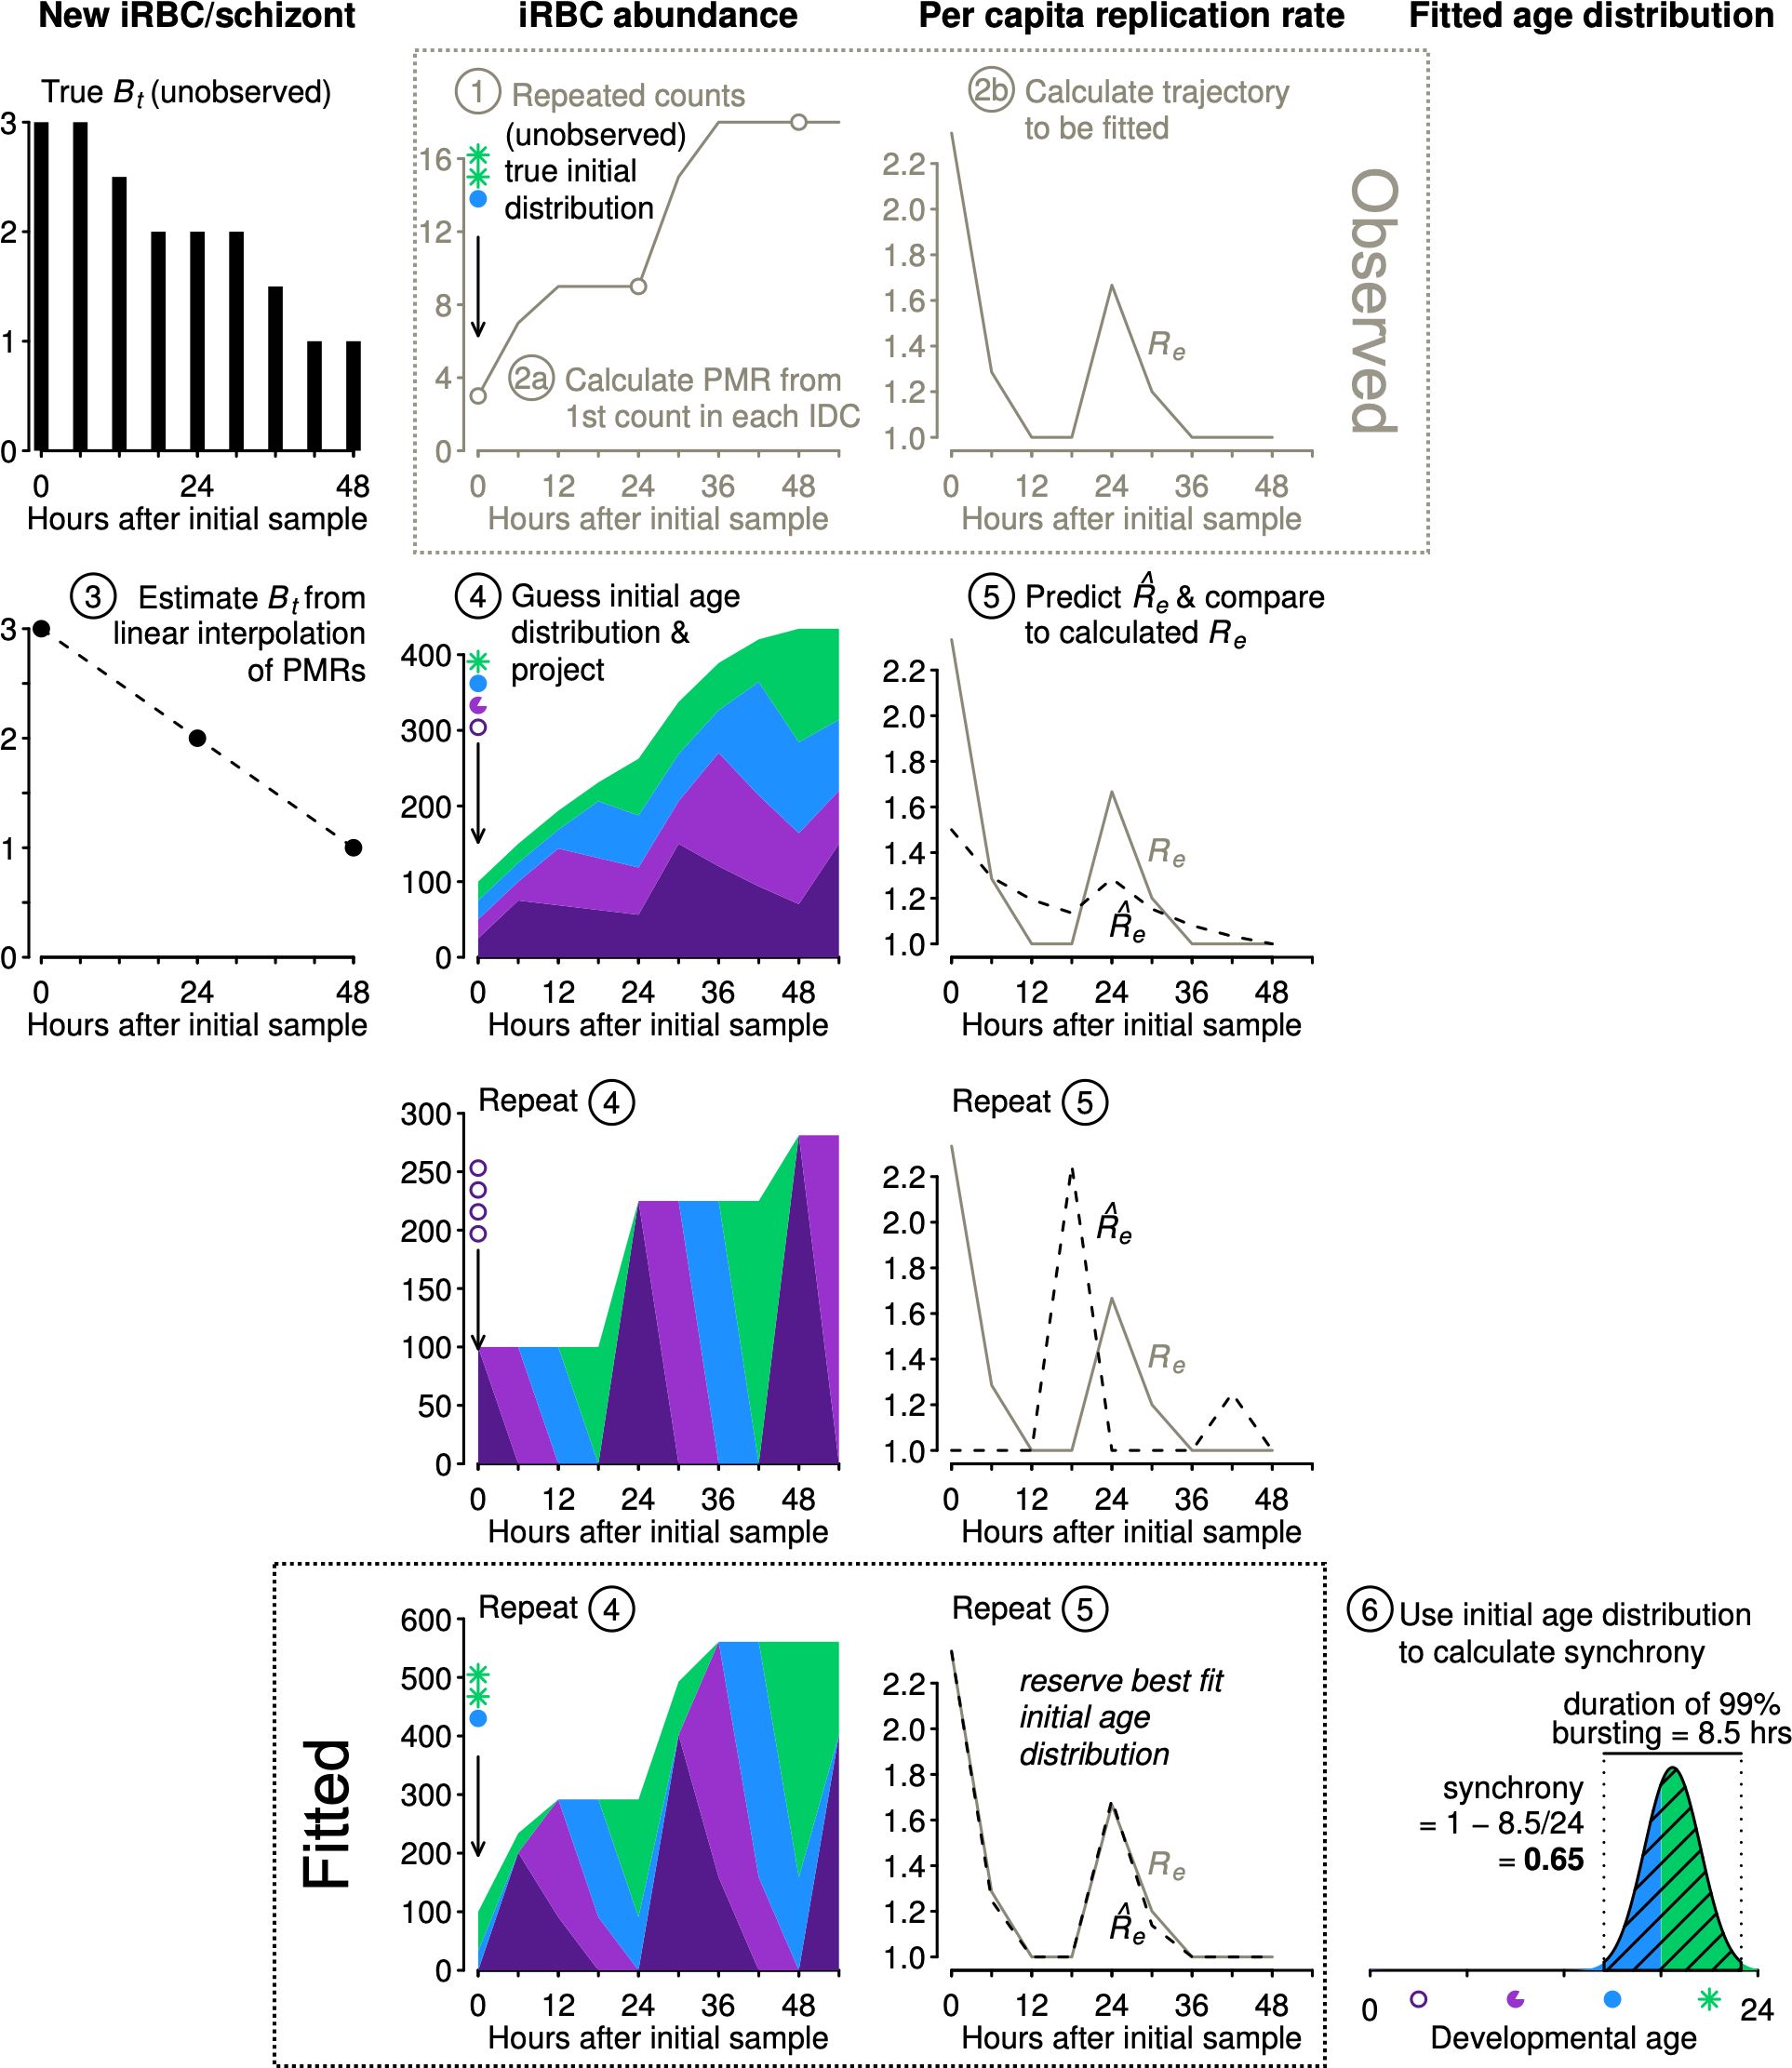
Figure 3 The new approach estimates synchrony while accounting for population dynamics. Example iRBC count data were obtained (Step 1) using the initial age distribution shown (sP) and projecting forward using the Bt values shown at left (black, see Figure 2). We calculate PMR values (Step 2a) and per capita replication rates (Re, Step 2b), the trajectory to be fitted. We estimate Bt values by linear interpolation of PMRs (Step 3). Using estimated Bt values, we guess an initial age distribution and project population dynamics (Step 4) and calculate predicted values to compare with observed Re values (Step 5). We repeat steps 4 and 5 and retain the best fit initial distribution () to calculate synchrony using Equation 1 (Step 6). To conserve space, y-axis labels are given at the top of each column of panels.
The subsequent steps 4 and 5 are carried out numerous times, using an optimization algorithm (details follow) to determine the starting age distribution that yields predicted values that best match the observed Re values:
Step 4. We project iRBC abundance for a large number of starting age distributions using a Leslie matrix (see example in Figure 2). The starting age distribution is specified as a symmetric Beta distribution with a shape parameter that will be fitted () and used to calculate the time required for 99% bursting and the level of synchrony according to Equation 1. Though not used to calculate synchrony, we also fit an offset parameter to allow the median parasite age to deviate from the default of half the IDC duration.
Step 5. Each projected iRBC abundance is subsampled to obtain values at the same times reported in the actual data. That is, any time points that are missing in the observations are dropped prior to calculating predicted per capita replication rates () for comparison with observed per capita replication rates (Re).
Step 6. Identify the initial age distribution associated with the best fitting (Equation 4). Determine the time required for 99% bursting in that initial age distribution by subtracting the 0.5% quantile from the 99.5% quantile of the Beta distribution defined by the best fit . Calculate synchrony according to Equation 1.
We use the Nelder-Mead algorithm to locate the value of (and the offset parameter) that minimizes the sum of the absolute error between the observed and predicted per capita replication rates (Re and , respectively). The machinery to perform the optimization is readily available from R (R Core Team, 2020; see Supplementary Methods for details and annotated code). For each simulated time series, we run the optimization 1000 times with randomly chosen starting parameters to increase the chances of arriving at a globally optimal best fit. We then retain the best fit shape parameter () and offset parameter from those 1000 optimizations (i.e., the values corresponding to the fit yielding the lowest sum absolute error) and use it to calculate the time for 99% bursting and then synchrony according to Equation 1.
Our simulated data reveal problems associated with the common approach of quantifying synchrony as the percentage of iRBCs in a particular life stage (reviewed in Greischar et al., 2019). Since the morphologically distinguishable “ring” stage occupies roughly the first half of intraerythrocytic development (Cheesman et al., 2003; Reilly et al., 2007), 50% rings would correspond to asynchrony in a population that is neither expanding nor contracting, while 100% rings is typically thought to indicate perfect synchrony (Greischar et al., 2019). The full simulated dynamics of percentage rings (Supplementary Figure S1) already indicate challenges with this metric: only if infections are sampled at the perfect point in time, and with perfect accuracy, can we recover the correct rank order of synchrony. Even then it is difficult to correctly identify the asynchnronous infection because the percentage rings consistently deviates from the null expectation of 50%. Of course, with real data, this resolution is not typically possible, nor is the perfect accuracy of our simulated data. Instead, we plot the data only from sample time points when maximal ring percentages would be expected in a synchronous infection (i.e., the first half of the IDC, for each of the IDCs simulated) and add realistic measurement error (Figure 4). Depending on the sampling schedule, highly synchronized infections can be indistinguishable from the asynchronous expectation or may appear “semi-synchronized” (a bare majority of parasites in the ring stage, e.g., ∼64%; Khoury et al., 2017). Note that simulations of P. falciparum in vitro yield higher percent rings on average (Figure 4B, D), since that population is only expanding, in contrast to the simulations of P. chabaudi, which expand and then decline (Figure 1B, C). The age distribution assessed at a single time point—the equivalent of choosing one of the point estimates on these plots—will frequently fail to detect even substantial rank order differences in synchrony, but synchrony is frequently assessed in this way (e.g., Touré-Ndouo et al., 2009; Ciuffreda et al., 2020).
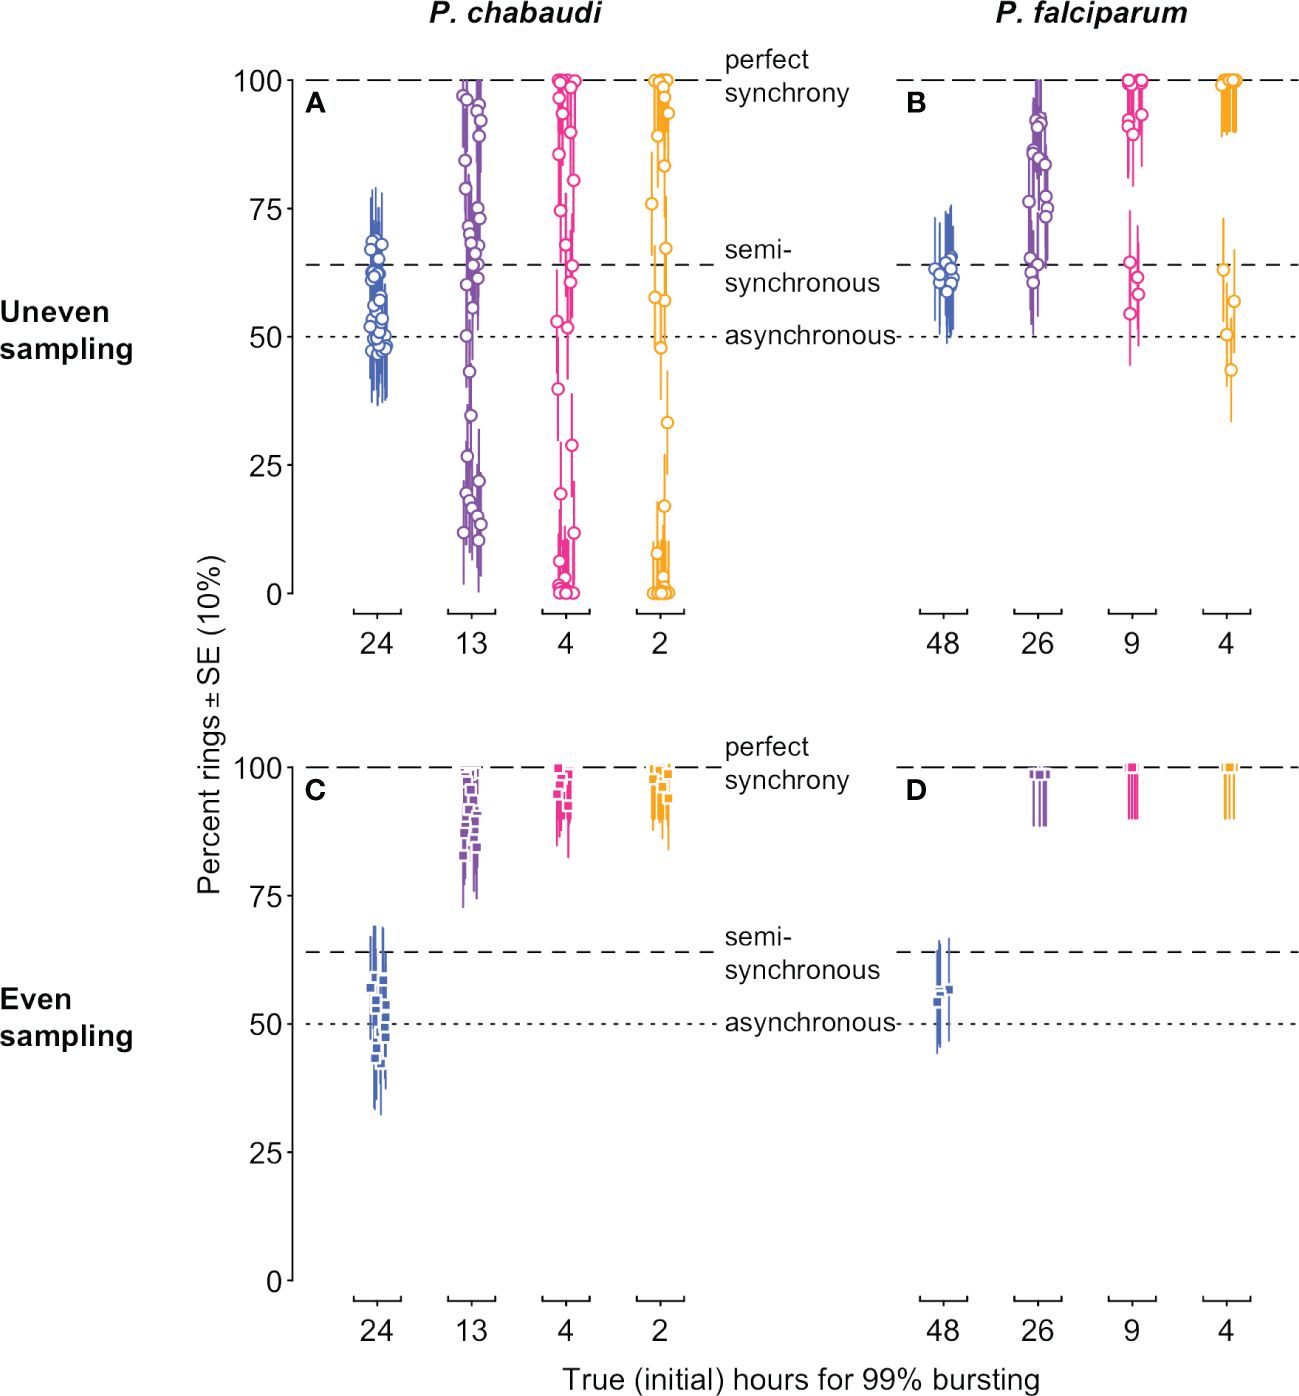
Figure 4 Stage percentages vary with population dynamics, making it difficult to accurately assess and compare synchrony when estimated in this way. The percentage of rings in simulated infections is shown for time points when rings would be expected (i.e., in the first half of each IDC). Ring percentages from unevenly “sampled” infections (open circles in (A, B)) show percentages that deviate substantially from values expected for perfectly synchronous, semi-synchronous, and asynchronous infections, while even sampling (closed squares in (C, D)) can only distinguish between asynchrony and some degree of synchrony. Colors and x-axis indicate the true duration of bursting and hence initial level of synchrony as in Figure 1A. P. chabaudi infections (A, C) were simulated over 16 IDCs, while P. falciparum simulations represent 4 IDCs. Vertical line segments indicate ±10%, roughly the standard error reported for stage percentage data where sequestration is not occuring (as in rag1−/− mice; Khoury et al., 2014). Horizontal lines indicate expected values for perfect synchrony (100%, long dash), asynchrony (50% rings in a static population, dotted line), or a semi-synchronous population (64% rings, following Khoury et al., 2017). The corresponding initial age distribution and iRBC abundance are shown in Figure 1 (details on data generating model in Supplementary Methods, parameter values in Supplementary Tables S1, S2).
Differences in synchrony can be difficult to discern from iRBC trajectories due to large changes in abundance that can occur in a matter of days, even with extremely high resolution time series in the absence of sampling noise (Figure 1B, C). Per capita replication rates make distinct levels of synchrony much clearer (Re, Supplementary Figure S2A, C). However, per capita replication rates vary with the sampling schedule, and sparse sampling reduces the ability to visually detect differences in synchrony (e.g., twice per IDC; Supplementary Figure S2B, D). We first examined the fitted per capita replication rates compared to simulated P. chabaudi and P. falciparum values assuming no sampling noise. The simple fitted model (colors as in Figure 1) yields predicted values that are very close to the Re values from simulated data (Supplementary Figures S3, S4).
Model fitted estimates represent the best fit from 1000 randomly chosen starting values, so we re-ran fits 20 times on simulated time series, without sampling noise, to estimate variability in the fitting process itself. When sampling was uneven, the fitted values did not vary, but even sampling twice per IDC yielded a range of estimates for the duration of bursting and hence synchrony (closed squares in Figure 5). For even sampling only, multiple combinations of median parasite age (fitted with the offset parameter) and duration of bursting yielded equally good fits (Supplementary Figure S5). This issue—nonidentifiability—was foreshadowed by the extremely similar per capita replication rates (Revalues) for all but the asynchronous simulations (Supplementary Figure S4). In contrast, Re trajectories are distinct for each level of synchronization with uneven sampling (Supplementary Figure S3) and identifiability is not an issue. We chose the timing of uneven sampling so that more samples were taken around the median time of bursting for each cohort, since that will yield the largest changes in iRBC abundance and hence the largest Re values. If the time of median bursting is known, clustering samples around that time is likely to make it easier to detect differences in synchrony. However, if the timing of bursting is not known, uneven sampling would still be useful to avoid nonidentifiability between bursting duration and median parasite age.
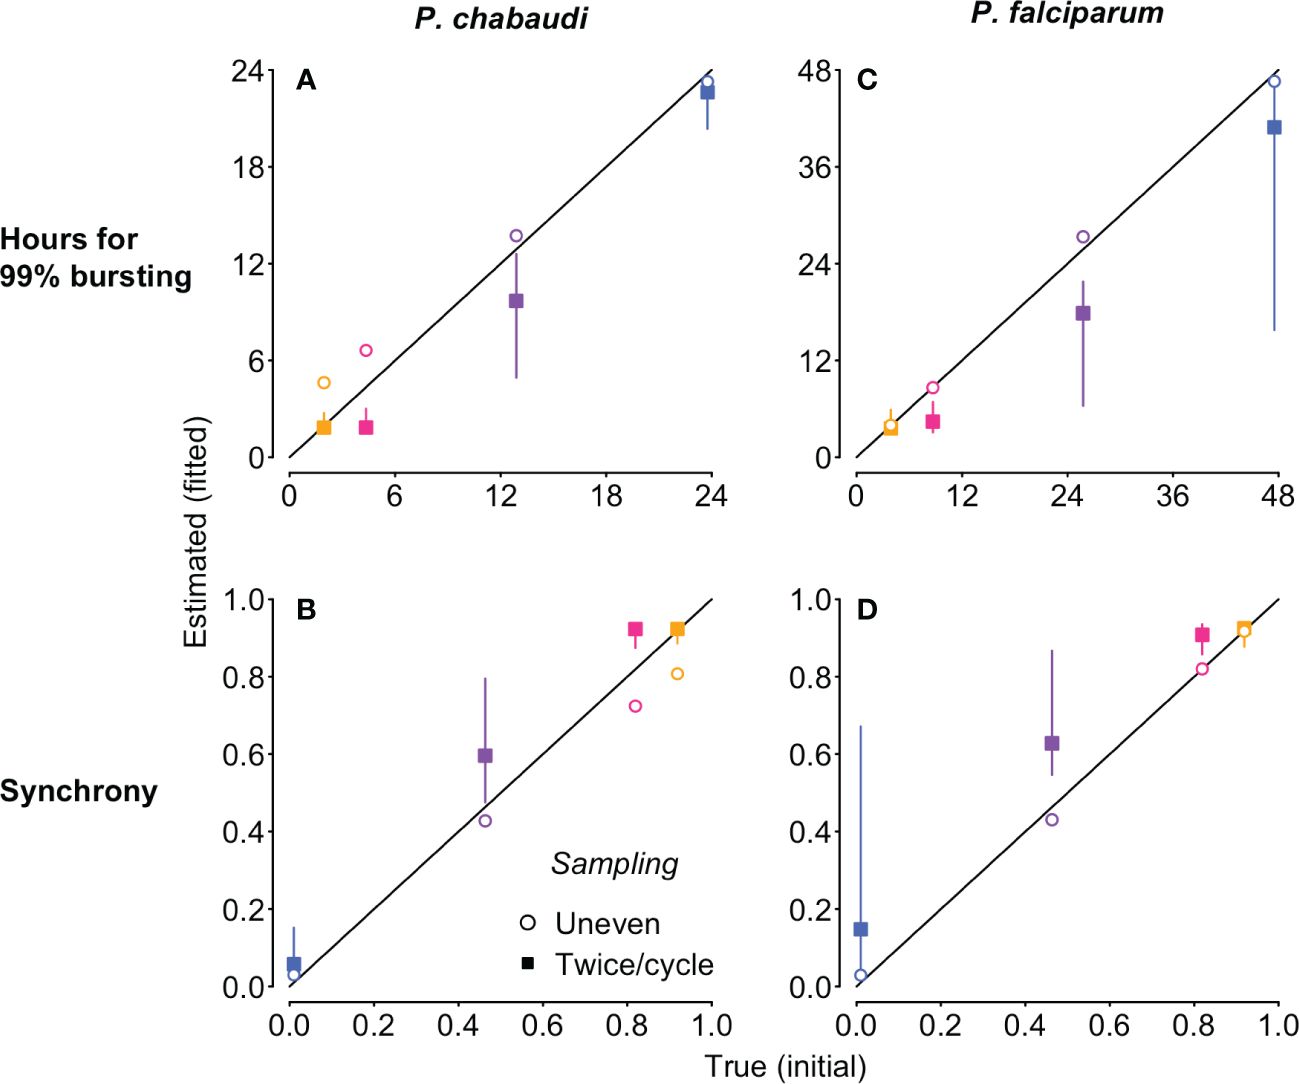
Figure 5 The new approach estimates the duration of 99% bursting (A, C) and synchrony (B, D) very close to the true values (i.e., the values derived from the Beta distribution used to simulate the “observed” time series), despite differences in IDC length and population dynamics. The time series to which the Leslie matrix model is fitted were also used to generate Figure 4, but we used total iRBC abundance as shown in Figure 1 rather than stage percentages. Fits to simulated P. chabaudi (P. falciparum in vitro) infections are shown in panels (A–D). Open circles denote uneven sampling intervals while closed squares refer to sampling performed at even intervals twice per IDC. Vertical segments indicate the 95% high density region of predicted values; only evenly sampled time series showed any variation in the predicted values. True initial synchrony and duration of bursting is indicated with colors (as in Figure 1) and by position on the x-axis. Note that in addition to better identifiability, fitting to unevenly sampled data provides more accurate estimates of true synchrony, accounting for modest loss of synchrony over simulated infections (Supplementary Figure S7).
Focusing on the fits to noiseless data, unevenly sampled, we obtain estimates of bursting duration and synchrony extremely close to their true initial values (open circles, Figure 5). The fits to simulated P. chabaudi infections appear to modestly overestimate the duration of bursting, and hence underestimate the true level of synchrony (Figure 5A, C), but that does not represent a problem with the method itself. Rather, these estimates are detecting a modest decline in initial synchrony over the 16 IDCs simulated, due to very slight differences in IDCs within each cohort arising from the exponentially-distributed waiting times in the merozoite stage assumed in the underlying model. High levels of initial synchrony result in discrete pulses of merozoite abundance that become wider through time as synchrony declines (Figure S6). The P. falciparum fits are to shorter time series—4 IDCs—and the synchrony estimates are therefore nearly identical to their initial true values (Figures 5B, D). When we recalculate synchrony using the mean hours for 99% bursting calculated from simulated merozoite abundance (details in Supplementary Code), we find that the new method returns estimates nearly identical to the true value (Figure S7). Despite large differences in iRBC dynamics (Figure 1B, C), the estimates of the duration of bursting (relative to IDC length) and synchrony are extremely similar for P. chabaudi and P. falciparum (Figures 5, S7). Thus, this approach yields synchrony estimates that account for—and can therefore be uncoupled from—the population dynamics that render existing methods ineffective.
We then tested the new approach on the same underlying time series with simulated sampling noise assuming percent parasitemia was subject to a binomial or negative binomial distribution. For simulated P. chabaudi infections, fitted estimates of synchrony matched well with their true initial values on average, but binomial error in percent parasitemia yielded a wide range of fitted values that could sometimes suggest the incorrect rank order of synchrony (Figure 6A). For negative binomial error, estimated synchrony is clustered tightly around the true value, though the highest levels of synchronization may be difficult to distinguish from one another (Figure 6B). Initial fits to noisy P. falciparum time series using the same target counts as for P. chabaudi (500 for binomial noise and 100 for negative binomial) gave an unacceptably wide range of estimates and poor match to true values (Supplementary Figure S8). Fits to noisy P. falciparum time series show a wider spread of estimated values, since parameter values were chosen to keep percent parasitemia below approx. 10% (Supplementary Table S2). Using larger, but still plausible, target counts (2000 and 400, respectively), we find that average fitted values can deviate from the true rank order when error is binomially distributed (Figure 6C), but the true rank order can usually be recovered when error is negative binomially distributed (Figure 6D). Noisy asynchronous time series present the biggest challenge to accurate estimation of synchrony, since the ratio of signal to noise is lowest. That is, oscillations in per capita replication rates (Re values) are minimal (panels D and H in Supplementary Figures S3, S4) so that sampling noise can easily masquerade as a higher level of synchrony. Taken together, these fits suggest that sampling to a target iRBC count should make it easier to distinguish the true level of synchrony, and that greater effort (e.g., higher target counts) will be needed for P. falciparum infections or other species where percent parasitemia tends towards lower values.
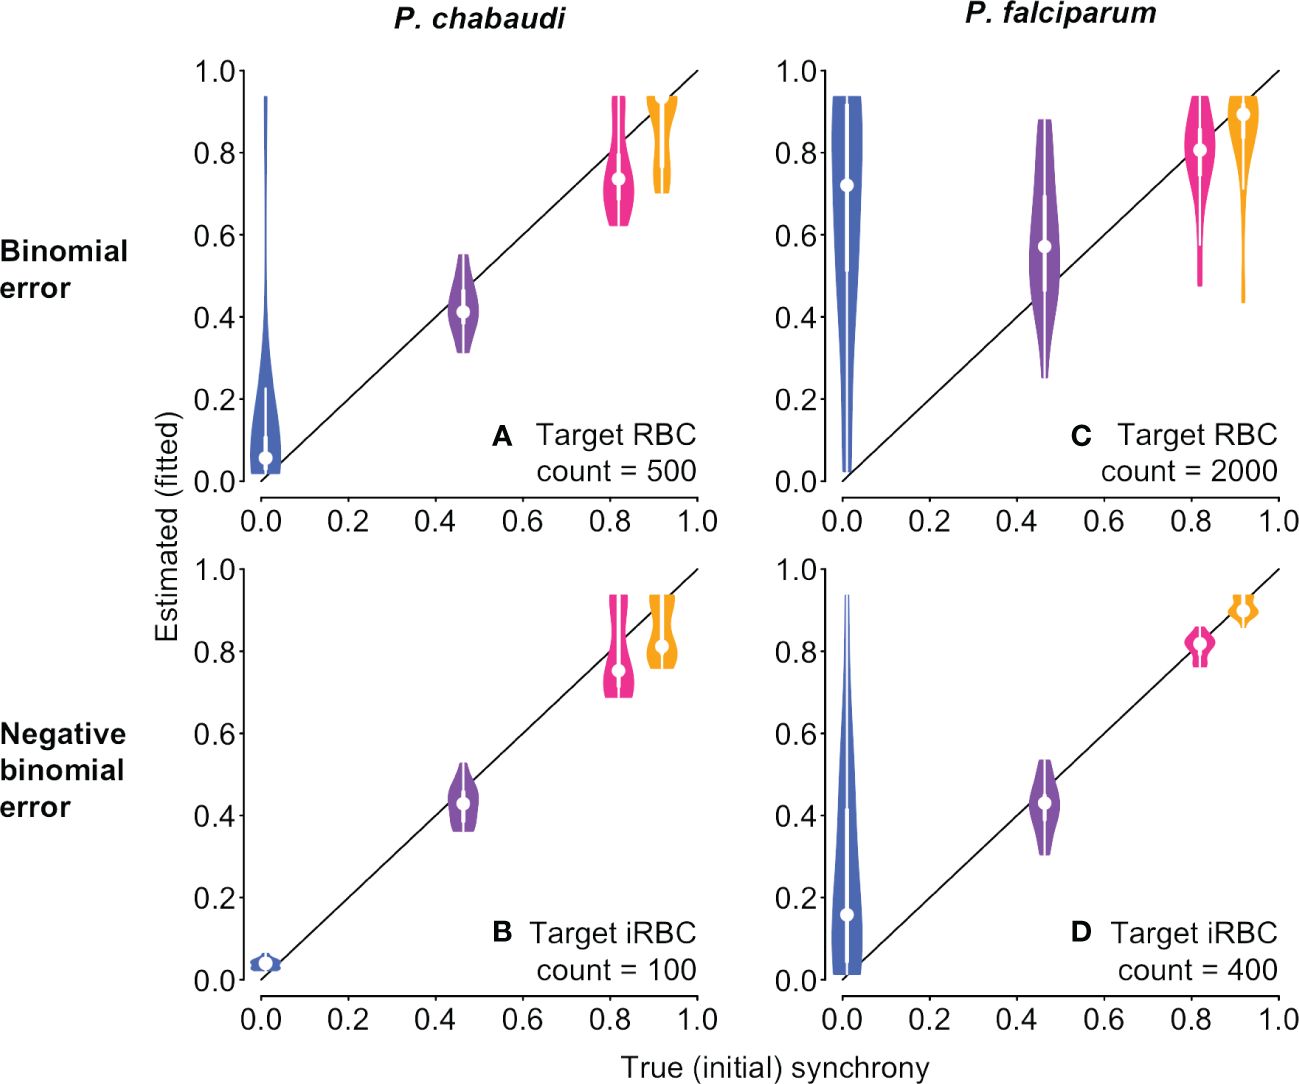
Figure 6 With sampling error, it is still possible to discern differences in synchrony, depending on the error distribution. The time series to be fitted are identical to those shown in Figure 1 and used in Figure 5, but with simulated sampling noise added (see Supplementary Methods for details). Violin plots showing the distribution of 20 fits to time series with simulated sampling noise, with a binomial (A, C) or negative binomial (B, D) distribution. When error is binomially distributed (A, B), synchrony differences can be obscured, with asynchronous infections often appearing spuriously synchronous. Synchrony estimates are better behaved when sampling noise follows a negative binomial distribution (B, D). P. falciparum tends toward much lower percent parasitemia, especially in vitro (Reilly et al., 2007), so larger target RBC (iRBC) counts were used for (C, D), following reported experimental protocols (see details in Supplementary Methods). For corresponding plots showing the estimated duration of bursting, see Supplementary Figure S9.
Developmental synchrony has the potential to alter malaria parasite fitness by influencing replication rates, drug efficacy, and transmission success (Hawking et al., 1968; Hawking, 1970; White et al., 1992; Greischar et al., 2014; Schneider et al., 2018; Owolabi et al., 2021; O’Donnell et al., 2022; reviewed in Mideo et al., 2013; Greischar et al., 2019; Prior et al., 2020). Further, parasites at different developmental ages vary in their susceptibility to host defenses (e.g., γδ T cells; Costa et al., 2011) and antimalarial drugs (Yayon et al., 1983), including the current front-line drug, artemisinin (ter Kuile et al., 1993; Owolabi et al., 2021). The ability to account for underlying differences in population dynamics is central to comparing synchrony across environments, populations and species. Intuitive metrics (e.g., the percentage of iRBCs in a particular developmental stage) fail to account for population dynamics and yield biased estimates of synchrony (Greischar et al., 2019), except where population dynamics do not vary across treatments (Prior et al., 2018). So far the only method that sidesteps the bias generated by population dynamics is fitting a dynamical model to data (White et al., 1992; Simpson et al., 2002; reviewed in Greischar et al., 2019), but these models assume constant population growth rates, preventing comparisons within and across infections. We developed a new approach, validated against simulated data, that can distinguish the level of synchrony while accounting for considerable variation in population growth rates.
The Leslie matrix model presented here describes the dynamics for a population that begins at a particular level of synchrony and whose age distributions are subsequently unperturbed except by replication. That model is nonetheless able to return the correct average level of synchrony when the underlying dynamics deviate from the assumption of fixed IDC duration and synchrony changes through time (Supplementary Figure S7). As is, these methods could be applied whenever the goal is to detect average differences in synchrony, e.g., the problem of determining which treatments maintain higher levels of synchrony (such as shaking in vitro P. falciparum cultures to maintain uniform distribution of nutrients, Allen and Kirk, 2010). When synchrony is hypothesized to be changing through time, whether due to processes internal or external to the organisms in question, the fitted Leslie matrix model represents the null expectation, serving as a starting point to compare against more complicated scenarios. For example, this approach could also be extended to quantifying how synchrony changes over the course of infection by fitting the model to portions of the time series. Each time window would then have a different fitted shape parameter , and by extension, a different estimated duration of bursting and level of synchrony according to Equation 1. If splitting the time series into multiple windows results in a better fit compared to fitting a single shape parameter for the entire infection—reducing the sum absolute error enough to justify the added complexity of the fitted model—that would suggest that the level of synchrony is changing through time. A similar approach could be used to test for deviations from our null assumption of 100% survival across all developmental classes. For example, drugs may alter synchrony (i.e., the age distribution) directly since anti-malarial drugs disproportionately impact parasites in the middle of development when they are most metabolically active (ter Kuile et al., 1993). As a consequence, population growth rates will also be reduced, with indirect impacts on age distributions. A model that incorporates enhanced removal of middle-aged parasites would allow for direct impact of drugs on parasite age distributions, while in our null model, drugs could only impact age distributions via changes to population growth rates. Comparing these models would reveal how drugs influence synchrony.
Our results have implications for the type of data and the frequency and duration of sampling needed to quantify synchrony in other systems, pathogenic and free-living. Crucially, age distribution data are not required, only estimates of total population size sampled multiple times per generation. Sampling at even intervals through a generation is neither necessary nor desirable, since that makes it difficult to estimate synchrony separately from median age. We show that it is possible to quantify synchrony from as little as four generations of data, i.e., four IDCs for malaria parasites. Estimating synchrony from even shorter time series may be feasible depending on the error distribution of the count data. Ideal methods for estimating population size would produce consistent coefficients of variation whether individuals are abundant or rare (e.g., negative binomial error distribution). For the case of malaria infections, our new approach allows for sampling schedules that are entirely feasible in experimental animal models (Deharo et al., 1994, Deharo et al., 1996; O’Donnell et al., 2011; Prior et al., 2018; O’Donnell et al., 2022) and even controlled human infection trials (reviewed in Duncan and Draper, 2012). For plants and animals, a wealth of data exist that can be used to parameterize matrix models (i.e., age-specific survival and fecundity; Salguero-Gomez et al., 2015, Salguero-Gomez et al., 2016), though the goal is typically to estimate population expansion rates from age distribution data (Hernández et al., 2023) rather than the reverse.
The methods in the present study rely on time series of abundance, and there are important challenges to obtaining accurate abundance data. In particular, the question of whether synchrony can be resolved from the data depends on the level of sampling noise, which for malaria parasites requires replicate samples from the same infection at the same point in time. Quantifying sampling noise would not require time series, though it would be helpful to obtain replicate samples from infections with different iRBC abundances, so that the relationship between the mean and variance of iRBC counts can be established. These data exist for PCR-derived counts in P. chabaudi (Mideo et al., 2008; Huijben et al., 2010; Miller et al., 2010), but comparable data from microscopy-derived iRBC counts appear to be lacking in both P. chabaudi and P. falciparum. Estimates of that sampling error are needed to make specific recommendations about experimental design, including sampling frequency and duration. All else equal, per capita replication rates will approach one (the population replacement level) as sampling resolution increases, because increases in iRBC abundance will be subdivided into smaller and smaller intervals. That could make it more difficult to distinguish synchrony-driven differences in per capita replication rates and may represent another reason to aim for clustering sampling around median bursting times, when changes in iRBC abundance—and therefore in Re values—will be the greatest. Further, if error distributions were known, it would be possible to implement a maximum likelihood approach rather than minimizing the sum absolute error as we have done here.
The other major challenge is that some developmental ages are more difficult to sample. For example, the mature stages of some Plasmodium spp. sequester where they cannot be sampled, at least in certain hosts. When sequestration occurs, it would lead to underestimates of total parasite abundance (e.g., P. falciparum, White et al., 1992; P. vivax, Carvalho et al., 2010; P. berghei in wild type but not rag1−/− mice, Khoury et al., 2014). If the level of synchrony is changing through time, the bias introduced by sequestration may likewise fluctuate, making it difficult to compare synchrony estimates from different phases of infection or across different infections. Sequestration is not universal, so some host-parasite combinations would not suffer from this bias (including P. berghei in rag1−/− mice (Khoury et al., 2014), any P. falciparum infections in vitro). Sequestration is also a problem for studies attempting to quantify synchrony in vivo from age distribution data (Deharo et al., 1994, Deharo et al., 1996; Touré-Ndouo et al., 2009; O’Donnell et al., 2011; Ciuffreda et al., 2020), along with the added challenge of the bias introduced by population dynamics (reviewed in Greischar et al., 2019). Accounting for the bias introduced by sequestration will be crucial for making comparisons across parasite species that also vary in their propensity to sequester as well as across environments where the potential for sequestration varies (e.g., in vivo and in vitro conditions).
Empirical advances offer some promise for sidestepping the problem of sequestration to estimate total iRBC abundance from proxy measures. Methods exist to quantify the total number of parasite genomes from volatiles in breath samples (Berna et al., 2015), plasma biomarkers (Dondorp et al., 2005), and—for experimental animal models—from transgenic parasite strains expressing luciferase or other markers (Franke-Fayard et al., 2005). Caution is warranted in using these methods, since they quantify parasite genomes, rather than iRBC abundance. Unfortunately, those two quantities are only equivalent for parasite populations that are synchronized and have not yet begun DNA replication (e.g., Cheesman et al., 2003), so studies attempting to quantify total parasite biomass must make assumptions regarding the synchrony of the parasite population being examined. The present study suggests that if biomarker abundance were quantified at multiple time points per IDC, it may be possible to fit rather than assume the underlying level of synchrony by modifying the approach introduced here. As with microscopy-estimated counts, quantifying the sampling error distribution associated with these newer methods will be crucial to determining feasibility.
Perhaps even more challenging is the fact that time series of iRBC abundance are not typically gathered when the goal is estimating synchrony; rather, stage percentages are overwhelmingly used to compare synchrony through time and across different infections (reviewed in Greischar et al., 2019). The focus on stage percentages is understandable, given that researchers often require parasite populations enriched for a particular developmental age class (for example, when testing stage-specificity of antimalarial drugs, e.g., ter Kuile et al., 1993). However, knowing the stage percentages at a particular point in time does not enable the projection of future stage percentages, especially when parasite numbers are changing (Greischar et al., 2019). Since it utilizes replication rates, our new approach can project how age distributions will change through time for a given initial level of synchrony. Projected age distributions could prove useful, for example, in predicting when parasite populations will be most vulnerable to drug treatment or immune clearance.
Existing methods for quantifying synchrony are useful when abundance is steady through time and the duration of morphologically-distinguishable developmental stages is known in advance (reviewed in Greischar et al., 2019). Those conditions are likely to hold for only a small minority of cases, but the method validated here can estimate synchrony when numbers are changing—and in fact works best when populations are undergoing dramatic changes in abundance—and requires no prior knowledge of stage durations. The key requirements of this approach are time series of iRBC abundance, sampled multiple times per developmental cycle, and knowledge about the duration of development. While the focus with stage percentage data has left a dearth of requisite data, they are obtainable (O’Donnell et al., 2022). Further, given the kind and resolution of data required, the approach is likely to have utility in other organisms, both pathogenic and free-living. Past studies quantifying changes in synchrony in free living organisms have relied on time series of abundance (e.g., insect pests, Yamanaka et al., 2012; Nelson et al., 2013; Bjørnstad et al., 2016), but we have shown that a useful signal of synchrony also emerges from per capita replication rates. Whether models fit abundance or per capita growth rates, accounting for population dynamics is necessary to identify ecological processes that maintain versus erode synchrony and to determine whether synchrony is heritable and capable of evolving. These unresolved questions carry enormous practical significance—the answers can inform the schedule of drug treatment (or for free-living pests, chemical controls) and enable predictions about evolutionary responses to intervention efforts. For malaria parasites, better understanding of variation in synchrony—which requires robust methods to estimate it—could improve understanding of pathogenesis and epidemiology and inform efforts to intervene at the individual and population level.
The original contributions presented in the study are included in the article/Supplementary Material. Further inquiries can be directed to the corresponding author.
MG: Conceptualization, Formal analysis, Funding acquisition, Investigation, Methodology, Validation, Visualization, Writing – original draft. NS: Conceptualization, Funding acquisition, Visualization, Writing – review & editing. SR: Conceptualization, Funding acquisition, Visualization, Writing – review & editing. NM: Conceptualization, Funding acquisition, Project administration, Validation, Visualization, Writing – review & editing.
The author(s) declare financial support was received for the research, authorship, and/or publication of this article. This work was supported by funding from the Human Frontiers Science Program (grant number RGP0046/2013), Natural Sciences and Engineering Research Council (N.M. Discovery Grant 436171), the University of Toronto Ecology and Evolutionary Biology Department Postdoctoral Fellowship (MG), the Cornell University College of Agricultural Sciences (MG), the Royal Society (SR, 202769/Z/16/Z; 204511/Z/16/Z), and the Wellcome Trust (SR, 202769/Z/16/A).
We have benefited greatly from discussions with Stephen Ellner, Christina Hernández, Timothy Lambert, Aidan O’Donnell, Alíz Owolabi, Damie Pak, Petra Schneider, Jordi Ripoll, and the reviewers.
The authors declare that the research was conducted in the absence of any commercial or financial relationships that could be construed as a potential conflict of interest.
All claims expressed in this article are solely those of the authors and do not necessarily represent those of their affiliated organizations, or those of the publisher, the editors and the reviewers. Any product that may be evaluated in this article, or claim that may be made by its manufacturer, is not guaranteed or endorsed by the publisher.
The Supplementary Material for this article can be found online at: https://www.frontiersin.org/articles/10.3389/fmala.2024.1386266/full#supplementary-material
Supplementary Figure 1 | Percentage rings for the simulations shown in Figure 1. The bursting for the initial cohort is shown in panel (A) (identical to Figure 1A), with the percentage rings in P. chabaudi and P. falciparum shown in (B, C), respectively. Closed squares (open circles) indicate time points corresponding to even (uneven) sampling. See main text for details.
Supplementary Figure 2 | Simulated per capita replication rates (Re) can show differences in synchrony more clearly than iRBC abundance (compare to Figure 1B, C). The shape parameter (sP) of the Beta distribution is shown in the key in order of declining synchrony, where sP=1 yields a uniform age distribution (asynchrony). Left panels show Revalues for simulated P. chabaudi (A) and P. falciparum in vitro (B) infections sampled unevenly, while right panels show Re values when infections are sampled twice per IDC (C, D). Note that Revalues vary with sampling schedule, and sparse sampling (panels (C, D) can make it difficult to discern smaller differences in synchrony.
Supplementary Figure 3 | The fitted model can closely track simulated time series sampled at uneven intervals. True (that is, derived from simulated “observations”, black) and fitted per capita replication rates (Re and , respectively) are shown for simulated P. chabaudi (left panels) and P. falciparum (right panels) time series. Colors as in Figure 1, and sampling occurred 3–4 times daily for each species (see Simulating experimental infection data section in Methods for details). The Re values shown in black are identical to the trajectories overlaid in Supplementary Figure S2A, C.
Supplementary Figure 4 | The fitted model can closely track simulated time series sampled at even intervals. True (derived from simulated “observations”, black) and fitted per capita replication rates (Re and , respectively) are shown for simulated P. chabaudi (left panels) and P. falciparum (right panels) time series. Colors as in Figure 1, with sampling occurring at even intervals, twice per IDC. The Re values shown in black are identical to the trajectories overlaid in Supplementary Figure S2B, D.
Supplementary Figure 5 | With even sampling, multiple combinations of median parasite age and duration of bursting yield identical fits (nonidentifiability). For both species and each level of synchrony simulated, the combinations of best fitting median parasite age and bursting duration are shown, with the range of sum absolute error (SAE) values for even sampling given in the plot title. Open circles indicate corresponding fits for uneven sampling, for reference (points lie on top of each other). Colors as in Figure 5.
Supplementary Figure 6 | The duration of bursting is apparent from merozoite abundance in the simulated infections shown in Figure 1. Simulated P. chabaudi infections encompass 16 IDCs (A–D), and synchrony decays to a small but noticeable degree in extremely and highly synchronous infections (note the widening of peaks over the course of infection). In contrast, simulated P. falciparum infections (E–H) encompass only 4 IDCs and synchrony has minimal opportunity to decay.
Supplementary Figure 7 | Changes in synchrony through time (or a lack thereof) are apparent when bursting duration is estimated from simulated merozoite abundance, and the new approach can estimate the correct average level of synchrony with uneven sampling. The most apparent changes in synchrony are in the extremely and highly synchronized simulated infections for P. chabaudi, which encompasses 16 IDCs (A), while P. falciparum infections show minimal changes in synchrony over the 4 IDCs simulated (B). Calculating synchrony using Equation 1 from the average duration of bursting shown in panels (A, B) yields the x-axis values in panels (C, D) (respectively). When changes in bursting duration through time are incorporated, the new method returns estimates nearly identical to the true values (C, D) for uneven sampling (open circles). As in Figure 5, even sampling (closed squares) results in non-identifiability such that a range of estimated synchrony values give similar fits to data (see Supplementary Figure S5).
Supplementary Figure 8 | Synchrony differences are harder to discern for P. falciparum, which was simulated to maintain a low percent parasitemia (approx. 10% or less, Supplementary Table S2). Target counts as in Figure 6A, C.
Supplementary Figure 9 | The ability to distinguish differences in the duration of bursting depends on distribution of sampling noise. Violin plots showing the distribution of 20 fits to time series with simulated sampling noise, with a binomial (A, B) or negative binomial (C, D) distribution. When error is binomially distributed (A, B), differences are difficult or impossible to detect, with asynchronous infections often appearing with a spuriously short duration of bursting (that is, highly synchronized). Duration of bursting estimates are closer to true values when sampling noise follows a negative binomial distribution (C, D).
Supplementary Table 1 | Parameters for within-host models of P. chabaudi infections of mice. Initial inoculum size was chosen to give a reasonable approximation of the dynamics of many experimental P. chabaudi infections, which attain peak parasite density at day seven post-infection, with RBCs subsequently dropping to their minimum value, on the order of a million RBCs per µL (Huijben et al., 2010). Note that we used a larger merozoite mortality rate (µz) than that used previously (Greischar et al., 2014, Greischar et al., 2016) with the aim of slowing the loss of synchrony.
Supplementary Table 2 | Parameters for within-host models of P. falciparum infections in vitro.
Allen R. J. W., Kirk K. (2010). Plasmodium falciparum culture: the benefits of shaking. Mol. Biochem. Parasitol. 169, 63–65. doi: 10.1016/j.molbiopara.2009.09.005
Berna A. Z., McCarthy J. S., Wang R. X., Saliba K. J., Bravo F. G., Cassells J., et al. (2015). Analysis of breath specimens for biomarkers of plasmodium falciparum infection. J. Infect. Dis. 212, 1120–1128. doi: 10.1093/infdis/jiv176
Bjørnstad O. N., Nelson W. A., Tobin P. C. (2016). Developmental synchrony in multivoltine insects: generation separation versus smearing. Popul. Ecol. 58, 479–491. doi: 10.1007/s10144-016-0564-z
Carvalho B. O., Lopes S. C., Nogueira P. A., Orlandi P. P., Bargieri D. Y., Blanco Y. C., et al. (2010). On the cytoadhesion of Plasmodium vivax-infected erythrocytes. J. Infect. Dis. 202, 638–647. doi: 10.1086/654815
Cheesman S. J., de Roode J. C., Read A. F., Carter R. (2003). Real-time quantitative PCR for analysis of genetically mixed infections of malaria parasites: technique validation and applications. Mol. Biochem. Parasitol. 131, 83–91. doi: 10.1016/S0166-6851(03)00195-6
Ciuffreda L., Zoiku F. K., Quashie N. B., Ranford-Cartwright L. C. (2020). Estimation of parasite age and synchrony status in Plasmodium falciparum infections. Sci. Rep. 10, 1–10. doi: 10.1038/s41598-020-67817-6
Costa G., Loizon S., Guenot M., Mocan I., Halary F., de Saint-Basile G., et al. (2011). Control of Plasmodium falciparum erythrocytic cycle: γδ T cells target the red blood cell-invasive merozoites. Blood 118, 6952–6962. doi: 10.1182/blood-2011-08-376111
Dean L. (2005). “Blood groups and red cell antigens,” in Blood and the cells it contains (Bethesda (MD): National Center for Biotechnology Information (US)), 1–8http://www.ncbi.nlm.nih.gov/books/NBK2263/
Deharo E., Coquelin F., Chabaud A. G., Landau I. (1996). The erythrocytic schizogony of two synchronized strains of Plasmodium berghei, NK65 and ANKA, in normocytes and reticulocytes. Parasitol. Res. 82, 178–182. doi: 10.1007/s004360050091
Deharo E., Gautret P., Ginsburg H., Chabaud A. G., Landau I. (1994). Synchronization of Plasmodium yoelii Nigeriensis and P. y. killicki infection in the mouse by means of Percoll-glucose gradient stage fractionation: determination of the duration of the schizogonic cycle. Parasitol. Res. 80, 159–164. doi: 10.1007/BF00933785
Dondorp A. M., Desakorn V., Pongtavornpinyo W., Sahassananda D., Silamut K., Chotivanich K., et al. (2005). Estimation of the total parasite biomass in acute falciparum malaria from plasma PfHRP2. PloS Med. 2, 0788–0797. doi: 10.1371/journal.pmed.0020204
Duncan C. J. A., Draper S. J. (2012). Controlled human blood stage malaria infection: current status and potential applications. Am. J. Trop. Med. Hygiene 86, 561–565. doi: 10.4269/ajtmh.2012.11-0504
Färnert A., Snounou G., Rooth I., Björkman A. (1997). Daily dynamics of Plasmodium falciparum subpopulations in asymptomatic children in a holoendemic area. Am. J. Trop. Med. Hygiene 56, 538–547. doi: 10.4269/ajtmh.1997.56.538
Franke-Fayard B., Janse C. J., Cunha-Rodrigues M., Ramesar J., Büscher P., Que I., et al. (2005). Murine malaria parasite sequestration: CD36 is the major receptor, but cerebral pathology is unlinked to sequestration. PNAS 102, 11468–11473. doi: 10.1073/pnas.0503386102
Gnangnon B., Duraisingh M. T., Buckee C. O. (2021). Deconstructing the parasite multiplication rate of Plasmodium falciparum. Trends Parasitol. 37, 922–932. doi: 10.1016/j.pt.2021.05.001
Greischar M. A., Childs L. M. (2023). Extraordinary parasite multiplication rates in human malaria infections. Trends Parasitol. 39, 626–637. doi: 10.1016/j.pt.2023.05.006
Greischar M. A., Mideo N., Read A. F., Bjørnstad O. N. (2016). Predicting optimal transmission investment in malaria parasites. Evolution 70, 1542–1558. doi: 10.1111/evo.12969
Greischar M. A., Read A. F., Bjørnstad O. N. (2014). Synchrony in malaria infections: how intensifying within-host competition can be adaptive. Am. Nat. 183, E36–E48. doi: 10.1086/674357
Greischar M. A., Reece S. E., Savill N. J., Mideo N. (2019). The challenge of quantifying synchrony in malaria parasites. Trends Parasitol. 35, 1–15. doi: 10.1016/j.pt.2019.03.002
Hawking F. (1970). The clock of the malaria parasite. Sci. Am. 222, 123–131. doi: 10.1038/scientificamerican0670-123
Hawking F., Worms M. J., Gammage K. (1968). 24- and 48-hour cycles of malaria parasites in the blood; their purpose, production and control. Trans. R. Soc. Trop. Med. Hygiene 62, 731–760. doi: 10.1016/0035-9203(68)90001-1
Hernández C. M., Ellner S. P., Adler P. B., Hooker G., Snyder R. E. (2023). An exact version of Life Tabl Response Experiment analysis, and the R package exactLTRE. Methods Ecol. Evol. 2023, 1–13. doi: 10.1111/2041-210X.14065
Huijben S., Nelson W. A., Wargo A. R., Sim D. G., Drew D. R., Read (2010). Chemotherapy, within-host ecology and the fitness of drug-resistant malaria parasites. Evolution 64, 2952–2968. doi: 10.1111/j.1558-5646.2010.01068.x
Khoury D. S., Cromer D., Akter J., Sebina I., Elliott T., Thomas B. S., et al. (2017). Host-mediated impairment of parasite maturation during blood-stage Plasmodium infection. PNAS 114, 2–7. doi: 10.1073/pnas.1618939114
Khoury D. S., Cromer D., Best S. E., James K. R., Kim P. S., Engwerda C. R., et al. (2014). Effect of mature blood-stage Plasmodium parasite sequestration on pathogen biomass in mathematical and in vivo models of malaria. Infect. Imm. 82, 212–220. doi: 10.1128/IAI.00705-13
Kitchen S. F. (1949). “Symptomatology: general considerations,” in Malariology–A comprehensive survey of all aspects of this group of diseases from a global standpoint, vol. Vol. 240 . Ed. Boyd M. F. (W.B. Saunders Company, Philadelphia), 966–994.
Lambros C., Vanderberg J. P. (1979). Synchronization of Plasmodium falciparum erythrocytic stages in culture. J. Parasitol. 65, 418–420. doi: 10.2307/3280287
Leslie P. (1945). On the use of matrices in certain population mathematics. Biometrika 33, 183–212. doi: 10.1093/biomet/33.3.183
McKenzie F. E., Smith D. L., O’Meara W. P., Riley E. M. (2008). Strain theory of malaria: the first 50 years. Adv. Parasitol. 66, 1–46. doi: 10.1016/S0065-308X(08)00201-7
Mideo N., Barclay V. C., Chan B. H. K., Savill N. J., Read A. F., Day T. (2008). Understanding and predicting strain-specific patterns of pathogenesis in the rodent malaria Plasmodium chabaudi. Am. Nat. 172, 214–238. doi: 10.1086/591684
Mideo N., Reece S. E., Smith A. L., Metcalf C. J. E. (2013). The Cinderella Syndrome: Why do malaria-infected cells burst at midnight? Trends Parasitol. 29, 10–16. doi: 10.1016/j.pt.2012.10.006
Miller L. H., Good M. F., Milon G. (1994). Malaria pathogenesis. Science 264, 1878–1883. doi: 10.1126/science.8009217
Miller M. R., Råberg L., Read A. F., Savill N. J. (2010). Quantitative analysis of immune response and erythropoiesis during rodent malarial infection. PloS Comput. Biol. 6, e1000946. doi: 10.1371/journal.pcbi.1000946
Neagu I. A., Olejarz J., Freeman M., Rosenbloom D. I., Nowak M. A., Hill A. L. (2018). Life cycle synchronization is a viral drug resistance mechanism. PloS Comput. Biol. 14, 1–26. doi: 10.1371/journal.pcbi.1005947
Nelson W. A., Bjørnstad O. N., Yamanaka T. (2013). Recurrent insect outbreaks caused by temperature-driven changes in system stability. Science 341, 796–799. doi: 10.1126/science.1238477
Nerlich A. G., Schraut B., Dittrich S., Jelinek T., Zink A. R. (2008). Plasmodium falciparum in ancient Egypt. Emerging Infect. Dis. 14, 1317–1318. doi: 10.3201/eid1408.080235
O’Donnell A. J., Greischar M. A., Reece S. E. (2022). Mistimed malaria parasites re-synchronize with host feeding-fasting rhythms by shortening the duration of intra-erythrocytic development. Parasite Immunol. 44, e12898. doi: 10.1111/pim.12898
O’Donnell A. J., Schneider P., McWatters H. G., Reece S. E. (2011). Fitness costs of disrupting circadian rhythms in malaria parasites. Proc. R. Soc. B: Biol. Sci. 278, 2429–2436. doi: 10.1098/rspb.2010.2457
Owolabi A. T. Y., Reece S. E., Schneider P. (2021). Daily rhythms of both host and parasite affect antimalarial drug efficacy. Evolution Medicine Public Health 9, 208–219doi: 10.1093/emph/eoab013
Paul R. E. L., Ariey F., Robert V. (2003). The evolutionary ecology of Plasmodium. Ecol. Lett. 6, 866–880. doi: 10.1046/j.1461-0248.2003.00509.x
Prior K. F., Rijo-Ferreira F., Assis P. A., Hirako I. C., Weaver D. R., Gazzinelli R. T., et al. (2020). Periodic parasites and daily host rhythms. Cell Host Microbe 27, 176–187. doi: 10.1016/j.chom.2020.01.005
Prior K. F., van der Veen D. R., O’Donnell A. J., Cumnock K., Schneider D., Pain A., et al. (2018). Timing of host feeding drives rhythms in parasite replication. PloS Pathog. 14, 1–21. doi: 10.1371/journal.ppat.1006900
R Core Team (2020). R: A language and environment for statistical computing (Vienna, Austria: R Foundation for Statistical Computing).
Reilly H. B., Wang H., Steuter J. A., Marx A. M., Ferdig M. T. (2007). Quantitative dissection of clone-specific growth rates in cultured malaria parasites. Int. J. Parasitol. 37, 1599–1607. doi: 10.1016/j.ijpara.2007.05.003
Reilly Ayala H. B., Wacker M. A., Siwo G., Ferdig M. T. (2010). Quantitative trait loci mapping reveals candidate pathways regulating cell cycle duration in Plasmodium falciparum. BMC Genomics 11, 577–590. doi: 10.1186/1471-2164-11-577
Salguero-Gomez R., Jones O. R., Archer C. R., Bein C., de Buhr H., Farack C., et al. (2016). COMADRE: A global data base of animal demography. J. Anim. Ecol. 85, 371–384. doi: 10.1111/1365-2656.12482
Salguero-Gomez R., Jones O. R., Archer C. R., Buckley Y. M., Che-Castaldo J., Caswell H., et al. (2015). The compadre Plant Matrix Database: An open online repository for plant demography. J. Ecol. 103, 202–218. doi: 10.1111/1365-2745.12334
Schneider P., Rund S. S., Smith N. L., Prior K. F., O’Donnell A. J., Reece S. E. (2018). Adaptive periodicity in the infectivity of malaria gametocytes to mosquitoes. Proc. R Soc. B 285, 20181876. doi: 10.1098/rspb.2018.1876
Simpson J. A., Aarons L., Collins W. E., Jeffery G. M., White N. J. (2002). Population dynamics of untreated Plasmodium falciparum malaria within the adult human host during the expansion phase of the infection. Parasitology 124, 247–263. doi: 10.1017/S0031182001001202
ter Kuile F., White N. J., Holloway P., Pasvol G., Krishna S. (1993). Plasmodium falciparum: in vitro studies of the pharmacodynamic properties of drugs used for the treatment of severe malaria. Exp. Parasitol. 76, 85–95. doi: 10.1006/expr.1993.1010
Touré-Ndouo F. S., Zang-Edou E. S., Bisvigou U., Mezui-Me-Ndong J. (2009). Relationship between in vivo synchronicity of Plasmodium falciparum and allelic diversity. Parasitol. Int. 58, 390–393. doi: 10.1016/j.parint.2009.07.011
Wacker M. A., Turnbull L. B., Walker L. A., Mount M. C., Ferdig M. T. (2012). Quantification of multiple infections of Plasmodium falciparum in vitro. Malar J. 11, 180. doi: 10.1186/1475-2875-11-180
White N. J., Chapman D., Watt G. (1992). The effects of multiplication and synchronicity on the vascular distribution of parasites in falciparum malaria. Trans. R. Soc. Trop. Med. Hygiene 86, 590–597. doi: 10.1016/0035-9203(92)90141-X
Yamanaka T., Nelson W. A., Uchimura K., Bjørnstad O. N. (2012). Generation separation in simple structured life cycles: models and 48 years of field data on a tea tortrix moth. Am. Nat. 179, 95–109. doi: 10.1086/663201
Keywords: model-validated methods, Plasmodium chabaudi, Plasmodium falciparum, population dynamics, developmental timing, intraerythrocytic development, Leslie matrix
Citation: Greischar MA, Savill NJ, Reece SE and Mideo N (2024) How to quantify developmental synchrony in malaria parasites. Front. Malar. 2:1386266. doi: 10.3389/fmala.2024.1386266
Received: 14 February 2024; Accepted: 19 April 2024;
Published: 15 May 2024.
Edited by:
Eizo Takashima, Ehime University, JapanReviewed by:
Viola Introini, European Molecular Biology Laboratory, SpainCopyright © 2024 Greischar, Savill, Reece and Mideo. This is an open-access article distributed under the terms of the Creative Commons Attribution License (CC BY). The use, distribution or reproduction in other forums is permitted, provided the original author(s) and the copyright owner(s) are credited and that the original publication in this journal is cited, in accordance with accepted academic practice. No use, distribution or reproduction is permitted which does not comply with these terms.
*Correspondence: Megan A. Greischar, bWVnYW4uZ3JlaXNjaGFyQGNvcm5lbGwuZWR1
Disclaimer: All claims expressed in this article are solely those of the authors and do not necessarily represent those of their affiliated organizations, or those of the publisher, the editors and the reviewers. Any product that may be evaluated in this article or claim that may be made by its manufacturer is not guaranteed or endorsed by the publisher.
Research integrity at Frontiers
Learn more about the work of our research integrity team to safeguard the quality of each article we publish.