
94% of researchers rate our articles as excellent or good
Learn more about the work of our research integrity team to safeguard the quality of each article we publish.
Find out more
ORIGINAL RESEARCH article
Front. Malar., 10 August 2023
Sec. Case Management
Volume 1 - 2023 | https://doi.org/10.3389/fmala.2023.1148115
 Roxanne R. Rees-Channer1*
 Christine M. Bachman2
 Lynn Grignard3
 Michelle L. Gatton4
 Stephen Burkot2
 Matthew P. Horning2
 Charles B. Delahunt2Liming Hu2
 Courosh Mehanian2,5
 Clay M. Thompson6Katherine Woods7Paul Lansdell3Sonal Shah3
 Peter L. Chiodini1,3
Introduction: Light microscopy remains a standard method for detection of malaria parasites in clinical cases but training to expert level requires considerable time. Moreover, excessive workflow causes fatigue and can impact performance. An automated microscopy tool could aid in clinics with limited access to highly skilled microscopists, where case numbers are excessive, or in multi-site studies where consistency is essential. The EasyScan GO is an automated scanning microscope combined with machine learning software designed to detect malaria parasites in field-prepared Giemsa-stained blood films. This study evaluates the ability of the EasyScan GO to detect, quantify and identify the species of parasite present in blood films compared with expert light microscopy.
Methods: Travelers returning to the UK and testing positive for malaria were screened for eligibility and enrolled. Blood samples from enrolled participants were used to make Giemsa-stained smears assessed by expert light microscopy and the EasyScan GO to determine parasite density and species. Blood samples were also assessed by PCR to confirm parasite density and species present and resolve discrepancy between manual microscopy and the EasyScan GO.
Results: When compared to light microscopy, the EasyScan GO exhibited a sensitivity of 88% (95% CI: 80-93%) and a specificity of 89% (95% CI: 87-91%). Of the 99 samples labelled positive by both, manual microscopy identified 87 as Plasmodium falciparum (Pf) and 12 as non-Pf. The EasyScan GO correctly reported Pf for 86 of the 87 Pf samples and non-Pf for 11 of 12 non-Pf samples. However, it failed to distinguish between non-Pf species, reporting all as P. vivax. The EasyScan GO calculated parasite densities were within +/-25% of light microscopy densities for 33% of samples between 200 and 2000 p/µL, falling short of WHO level 1 (expert) manual microscopy competency (50% of samples should be within +/-25% of the true parasitemia).
Discussion: This study shows that the EasyScan GO can be proficient in detecting malaria parasites in Giemsa-stained blood films relative to expert light microscopy and accurately distinguish between Pf and non-Pf species. Performance at low parasite densities, distinguishing between non-Pf species and accurate quantitation of parasitemia require further development and evaluation.
Current WHO estimations suggest that malaria is responsible for over 200 million infections annually, of which approximately half a million cases lead to death (WHO, 2018a). The disease is a significant global burden, particularly in regions of sub-Saharan Africa. While there has more recently been an increase in implementation of alternative diagnostic methods for detection of malaria, including rapid diagnostic kits (RDTs) (Jimenez et al., 2017; Cunningham et al., 2019) and polymerase chain reaction (PCR) (Padley et al., 2003; Roth et al., 2016), manual light microscopy, where available, remains the standard of care in a clinical laboratory, backed up by RDTs and/or PCR if required, since light microscopy is able to detect, quantify and identify all species of malaria parasites (Plasmodium spp.) infecting humans (Rogers et al., 2022). The method involves a reader examining multiple fields of view (FOV) in both thick and thin Giemsa-stained blood films (Makhija et al., 2015; WHO, 2016). Accuracy of manual microscopy is critically dependent on the skill of the microscopist and is difficult to standardize, since performance can be hampered by excessive workload requiring high levels of concentration over many hours (Wongsrichanalai et al., 2007; Bowers et al., 2009). In these circumstances, diagnostic quality can be compromised, leading to incorrect clinical management of cases. An increase in false positive results means patients are being given unnecessary treatment with anti-malarial drugs, whereas false negatives can lead to an increase in the provision of unnecessary anti-infective agents, ongoing clinical symptoms, increased morbidity and possible death (GMP, 2009).
Automated malaria diagnosis systems have several potential benefits: they do not fatigue; they give reproducible results; they can examine greater quantities of blood to give more stable results; they can increase the productivity of overworked technicians and pathologists; and they can be widely deployed, addressing the expert-training bottleneck. For example, automated systems (if sufficiently accurate) would be well-suited to drug resistance monitoring (Tilley et al., 2016; Balikagala et al., 2021), which requires extensive parasite quantitation to derive clearance curves (White, 2011). Because of widespread infrastructure centered on Giemsa-stained blood films for manual microscopy, automated methods that use Giemsa-stained films are best positioned for rapid, practical deployment. Most work on software for automated analysis of digital images has (at least) two key problems: Firstly, it is focused on thin blood films (Das et al., 2015; Rosado et al., 2016; Pattanaik and Swarnkar, 2018; Poostchi et al., 2018), despite thin films being poorly suited to malaria use-cases such as detection of low parasitemias and end-point assessment in drug efficacy studies. Thick films are preferable in such situations (WHO, 2016; Mehanian et al., 2017; Delahunt et al., 2019). Secondly, most machine learning studies report performance metrics inappropriate for clinical malaria case scenarios (Poostchi et al., 2018; Delahunt et al., 2019). Nevertheless, substantial progress has been made in automated systems targeting thick blood films (Mehanian et al., 2017; Torres et al., 2018; Manescu et al., 2019; Vongpromek et al., 2019; Yang et al., 2020; Horning et al., 2021), including the use of clinically relevant performance metrics. This work has leveraged revolutionary advances in machine learning (ML) based on convolutional neural networks (CNNs), in which algorithms automatically extract useful visual features to analyze digital images (LeCun et al., 2015; Goodfellow et al., 2016).
These benefits of automated systems are offset by drawbacks (Torres et al., 2018), including: high training data demands of CNNs; difficulty handling the wide variation in field-prepared blood films; ML algorithms’ notorious brittleness in the face of novel presentations (e.g. data from new field sites); dependence on complex hardware deployed in potentially challenging environments; and ML algorithms’ current inability to match the adaptability of skilled human technicians.
In addition to software algorithms, an automated system requires reliable hardware to scan blood slides and capture images for analysis. Because of the blood volume required (e.g. to contain 500 white blood cells at a minimum (WHO, 2016)), the hardware must be high-throughput, and to process thick films it must capture stacks of images at multiple depths (Mehanian et al., 2017; Manescu et al., 2019). To meet malaria use case scenarios, hardware must be robust and low-cost. Thus, the hardware component of an automated system also represents a significant challenge. Given the known risks (from both software and hardware) of automated systems, field studies involving realistic clinical tasks are essential to assessing their readiness for deployment for individual malaria diagnosis.
In this study, we tested a fully automated malaria diagnosis system that combines ML software developed by Global Health Laboratories (GHL) with the EasyScan GO, an automated scanning microscope developed by Motic (2021). We present a diagnostic performance evaluation of the EasyScan GO by direct comparison with expert manual microscopy, using PCR as a reference. Specifically, we assess the accuracy of the device in the detection, quantitation and species identification of malaria parasites in Giemsa-stained thick and thin blood films. This study is the fifth in a series of field trials of this family of software and hardware; others were in Peru (Torres et al., 2018), Thailand/Indonesia (Vongpromek et al., 2019), on a WHO evaluation slide set (Horning et al., 2021) and very recently in an 11-site, 11-country study (Das et al., 2022). The system has also had two internal assessments (Mehanian et al., 2017; Delahunt et al., 2019). Together, these studies offer a uniquely broad evaluation of performance, in realistic settings, of an automated system for malaria diagnosis.
Returned travelers who have recently visited malaria-endemic countries and are unwell are routinely assessed for possible malaria infection in clinics at The Hospital for Tropical Diseases and Homerton University Hospital, London, UK. Diagnostic evaluation primarily involves examination of patient blood samples by manual light microscopy (using stained peripheral blood smears) to confirm the presence of malaria parasites, determine the species and provide an estimation of parasitemia where P. falciparum or P. knowlesi are present. Supplementary testing using Rapid Diagnostic Tests (RDTs) and PCR may also take place (Tangpukdee et al., 2009; Bailey et al., 2013). Patients who are confirmed positive for malaria are given appropriate antimalarial medication and supportive care. For this study, residual patient blood samples were obtained subsequent to routine laboratory testing from a total of 1202 returned travelers over the age of 18 years. These samples were anonymized and used to prepare study-specific Giemsa-stained thick and thin blood films to facilitate a direct comparison between manual light microscopy and the EasyScan GO and for PCR assessment at The London School of Hygiene and Tropical Medicine, London, UK.
Thick and thin smears were prepared on clean glass slides using surplus patient EDTA blood samples which had been obtained by venepuncture (Warhurst and Williams, 1996; WHO, 2016). Thin smears were fixed in methanol for 1 minute prior to staining. Fully air-dried smears were immersed for 30 minutes in 3% (v/v) Giemsa staining solution diluted in Phosphate-buffered water (pH 7.2), rinsed in tap water to remove stain deposit and allowed to air-dry vertically. Blood films were viewed using a x100 oil-immersion objective and a minimum of 200 and 50 fields of view (FOV) were assessed for thick and thin films respectively. Thick films were initially used for positive confirmation of malaria parasites being present within a blood sample whereas thin films were used for Plasmodium species determination. For subsequent quantitation of parasites, thick films were further examined and parasites counted until a total of 500 white blood cells (WBCs) had been seen and an accurate parasite density (parasites/µL of blood) determined using patient WBC counts obtained from laboratory records.
For each blood sample, there were two independent reads performed. The first result was obtained from the routine diagnostic laboratory after examination by two microscopists within that laboratory and was used to determine if samples were malaria parasite positive or negative for recruitment purposes. The second reading was study-specific, also provided by an expert microscopist, who examined slides produced from the same blood samples after they had been anonymized to confirm positivity and perform accurate quantitation. If there was a discrepancy between the results provided by the study microscopist and the initial diagnostic laboratory microscopy result, a second expert study microscopist was then engaged to perform a third read.
The EasyScan GO is a fully automated end-to-end malaria diagnostic system which includes both hardware and software. An automated bright-field microscopy platform scans Giemsa-stained thick and thin blood films, and malaria detection algorithms process the image sets to give parasite detection, species ID, and parasite quantitation for the patient. Given a blood film, the device automatically scans and processes the slide, and outputs a report that includes estimated diagnosis, species ID, quantitation, WBC count, and a mosaic of thumbnail images of top suspected malaria parasites (Figure 1). The images allow a technician or pathologist to quickly check the device’s findings. Using the current software and for the purposes of this study, a complete slide evaluation including an output report with image thumbnails took ~10 minutes (Horning et al., 2021). Thin films generally took longer at ~18 minutes per slide, as more FOV needed to be scanned.
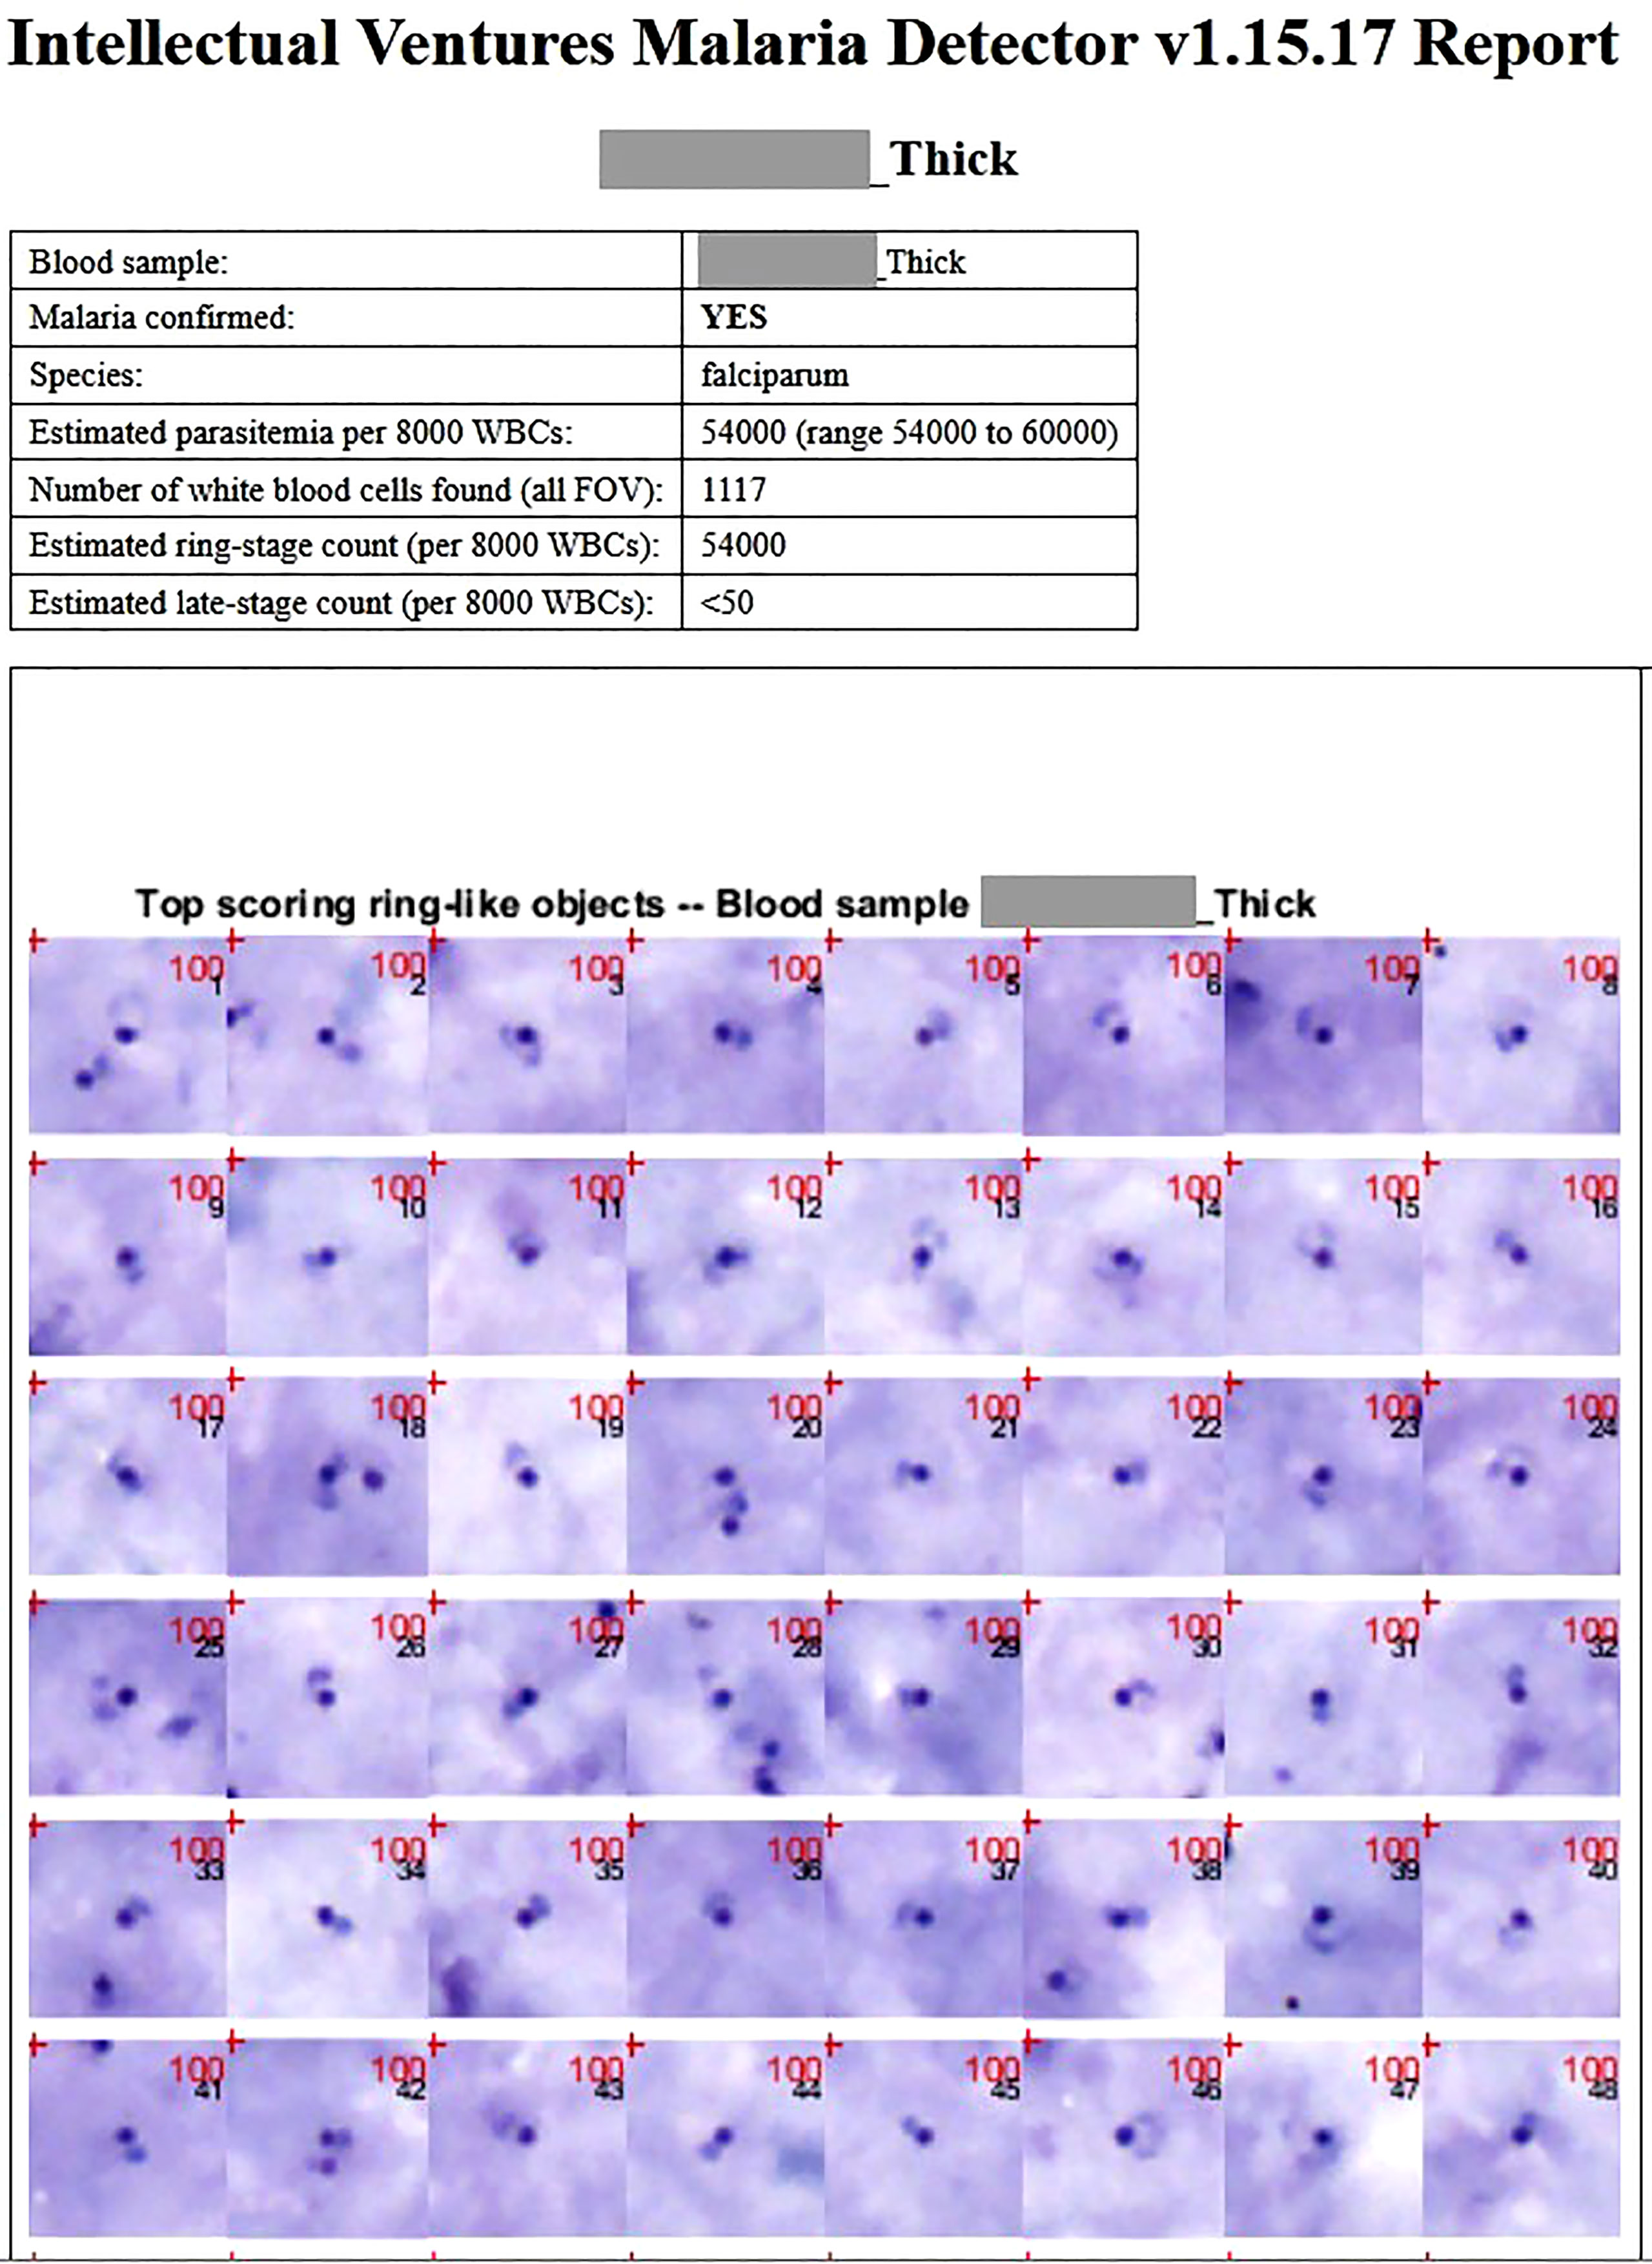
Figure 1 A typical patient thick film report for a P. falciparum sample, as outputted by the EasyScan GO. The report includes statistics, predicted diagnosis, and mosaics of thumbnails of the highest scoring detected objects. The mosaics allow an expert microscopist to quickly double-check whether the detected objects justifying the EasyScan GO diagnosis are truly parasites. Thick and thin film reports from a non-P. falciparum sample are shown in Supplementary Figures 1 and 2.
Thick films are used to (i) confirm whether malaria parasites are present, (ii) obtain an accurate parasite count, and (iii) obtain a species identification of P. falciparum vs non-P. falciparum (with the default for non-P. falciparum cases being P. vivax). Thin films are used for refined Plasmodium species determination (e.g. between non-P. falciparum species). The overall algorithm architecture, as well as the EasyScan GO device, are described in (Horning et al., 2021). Thick film algorithms are fully detailed in (Mehanian et al., 2017) and thin film algorithms, in (Delahunt et al., 2019).
Briefly, a new sample is assessed as follows: In a thick film the algorithm analyses 100 image stacks (each 113 µm x 85 µm x 5 depths), containing an average of 1527 WBCs (std dev 862; 90% of samples have over 720 WBCs). Candidate parasite objects are detected, then culled, by rapid morphological methods, which are tuned for high sensitivity yet still eliminate most of the easier distractor objects. The remaining candidate objects pass through two convolutional neural net (CNN) classifiers to receive labels as ring, late-stage, or distractor. WBCs are detected and counted by a separate module. Diagnosis is based on whether the suspected parasite count per WBC exceeds a noise threshold that has been pre-tuned to aim for 90% patient specificity. While the high blood volume examined theoretically allows for a lower limit of detection, in practice the object false positive rate is a limiting factor (Delahunt et al., 2022). Quantitation is reported based on thick films only, leveraging the large blood volume examined to reduce Poisson variability (Delahunt et al., 2019). Species ID is binary, P. falciparum vs non-P. falciparum, based on comparing ring and late-stage counts and leveraging two facts: sequestration in P. falciparum and relatively low parasitemias in non-P. falciparum infections. For those samples labeled non-P. falciparum, the thin film is processed in a similar fashion to the thick film, but with a single CNN assigning a species (or distractor) label to each object. Final species ID from thin film is determined by weighted majority vote.
Training slides included over 500 imaged blood slides from 12 countries, encompassing a wide range of different staining presentations and containing a variety of artefacts. The collection included large numbers of P. falciparum-positive, P. vivax-positive, and Plasmodium spp.-negative slides, and much smaller numbers of P. ovale and P. malariae-positive slides, as these species are much less commonly encountered. Slides used for training were annotated by expert microscopists specializing in the diagnosis of malaria. Details about slide collections are found in (Mehanian et al., 2017; Delahunt et al., 2019; Horning et al., 2021). Annotation methods are fully described in (Mehanian et al., 2017).
The WHO international standard for P. falciparum DNA for nucleic acid amplification techniques (Padley et al., 2008) was used as a positive control for P. falciparum. Lyophilized blood samples derived from patients infected with P. vivax, P. ovale and P. malariae, used as part of the WHO external quality assessment scheme for malaria nucleic acid amplification testing (WHO, 2018b) were used as non-P. falciparum positive controls. Negative controls consisted of negative extraction controls (whole uninfected blood) and negative assay controls (nuclease-free water). Parasite DNA was extracted from samples using the PureLink™ Pro 96 Genomic DNA Purification Kit (Invitrogen, US).
For real-time PCR, in the first instance, each sample was amplified in a multiplex reaction targeting the conserved region of the Plasmodium 18S rRNA gene and the human beta-2 microglobulin (β2 M) gene (a DNA extraction control). After genus-specific amplification, positive samples were subsequently tested for P. falciparum, P. vivax, P. ovale and P. malariae in a multiplex real-time PCR reaction. Primers used for these amplifications are shown in supplemental table 1 and are modified slightly from those described previously (Shokoples et al., 2009). The ABI 7500 FAST System (Applied Biosystems, US) was used for all amplification reactions. The conditions consisted of an initial activation of DNA Polymerase at 95°C for 30 secs followed by 40 cycles of amplification comprising denaturation at 95°C for 3 secs, annealing and extension at 60°C for 30 secs.
Nested PCR (nPCR) is widely regarded as the gold standard nucleic acid amplification (NAA) method for detection of malaria parasites in very low density samples (Cordray and Richards-Kortum, 2012; Vasoo and Pritt, 2013) and was performed as a confirmatory test where there was discordance between results reported for manual light microscopy, EasyScan GO and real-time PCR. The species-specific nucleotide sequences of the 18S rRNA gene of P. falciparum, P. vivax, P. malariae and P. ovale were amplified as described previously (Snounou et al., 1993; Snounou and Singh, 2002; Padley et al., 2003; Singh et al., 2004; Calderaro et al., 2007) with slight modifications, and primers used are shown in supplemental table 1. Assays were performed using a PxE thermal cycler (ThermoFisher Scientific, US) and a DNA Engine Tetrad® 2 cycler (Bio-Rad, US). Thermal cycling parameters used are described previously (Snounou and Singh, 2002) with the only adaptation being that Nest 1 and Nest 2 reactions were given 30 and 25 cycles of annealing, extension and denaturation respectively.
The required sample size of 104 malaria positive slides and 1125 malaria negative slides was calculated as a non-inferiority study to be able to jointly test that the sensitivity of EasyScan GO was not decreased by more than 80% compared to expert microscopy, and that the false positive fraction (1-specificity) was not increased by more than 50% compared to expert microscopy, with 5% significance and 80% power. The malaria positive slides were expected to be derived from symptomatic clinical cases, plus follow-up slides from these same patients following treatment (i.e. with lower parasitemia). The sensitivity and specificity for expert microscopy with this slide composition was assumed to be 80% and 90%, respectively.
A total of 1202 patient samples were collected and the same sets of Giemsa-stained thick and thin slides evaluated concurrently by manual light microscopy and the EasyScan GO. By light microscopy, 113 of the samples were confirmed as malaria parasite positive and 1089 were negative. When compared to light microscopy, the EasyScan GO exhibited a sensitivity of 88% (95% CI: 80-93%) and a specificity of 89% (95% CI: 87-91%). The EasyScan GO correctly identified 99 of the 113 light microscopy positives but also incorrectly reported a positive result for 122 samples that were identified as parasite negative (1089) by light microscopy (Table 1).
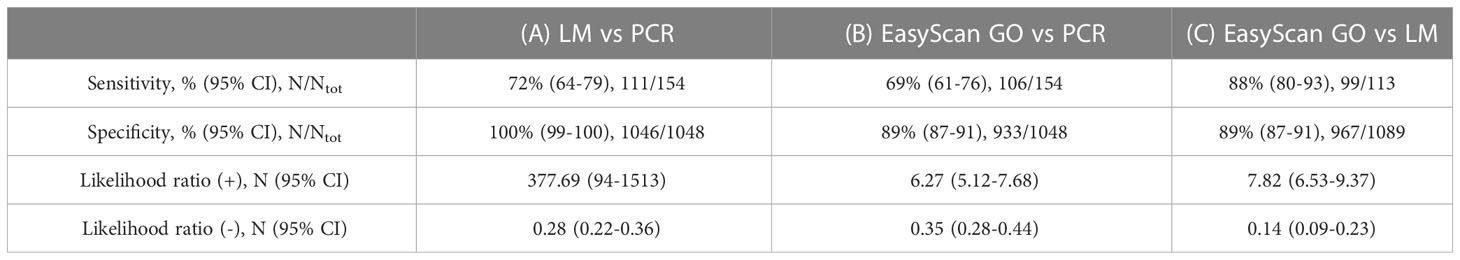
Table 1 Diagnostic accuracies of (A) light microscopy (LM) vs real-time PCR (as reference); (B) EasyScan GO vs real-time PCR (as reference); and (C) EasyScan GO vs light microscopy (as reference).
Of the 99 samples labelled positive by both light microscopy and the EasyScan GO, manual microscopy identified 87 as P. falciparum and 12 as non-P. falciparum comprising 6 P. vivax, 5 P. ovale and 1 P. malariae. The EasyScan GO correctly reported P. falciparum for 86 of the 87 P. falciparum samples and reported non- P. falciparum for 11 out of 12 non-P. falciparum samples (Kappa = 0.905). However, it failed to distinguish between the non-falciparum species, reporting all non-P. falciparum samples as P. vivax.
To achieve level 1 (expert) competency in malaria microscopy, the WHO requires that 50% of samples containing malaria parasites with densities between 200 and 2000 p/uL be quantified within +/-25% of the “true count” (WHO, 2016). Quantitation of low parasitemia (e.g. under 200 p/µL) samples is intrinsically noisy due to Poisson variability in the number of parasites present in the examined blood (Delahunt et al., 2019). In this study, EasyScan GO quantitation was within +/-25% of true count for 33% (6/18) of samples with parasitemias between 200 and 2000 p/µL; and within +/-25% of true count for 30% (24/79) of samples with parasitemias above 200 p/µL (Figure 2). It should be noted that the WHO standard assumes that the ground-truth quantitation is an average of several counts provided by multiple expert-level microscopists, while here we compare to a ground-truth given by a single expert-level microscopist.
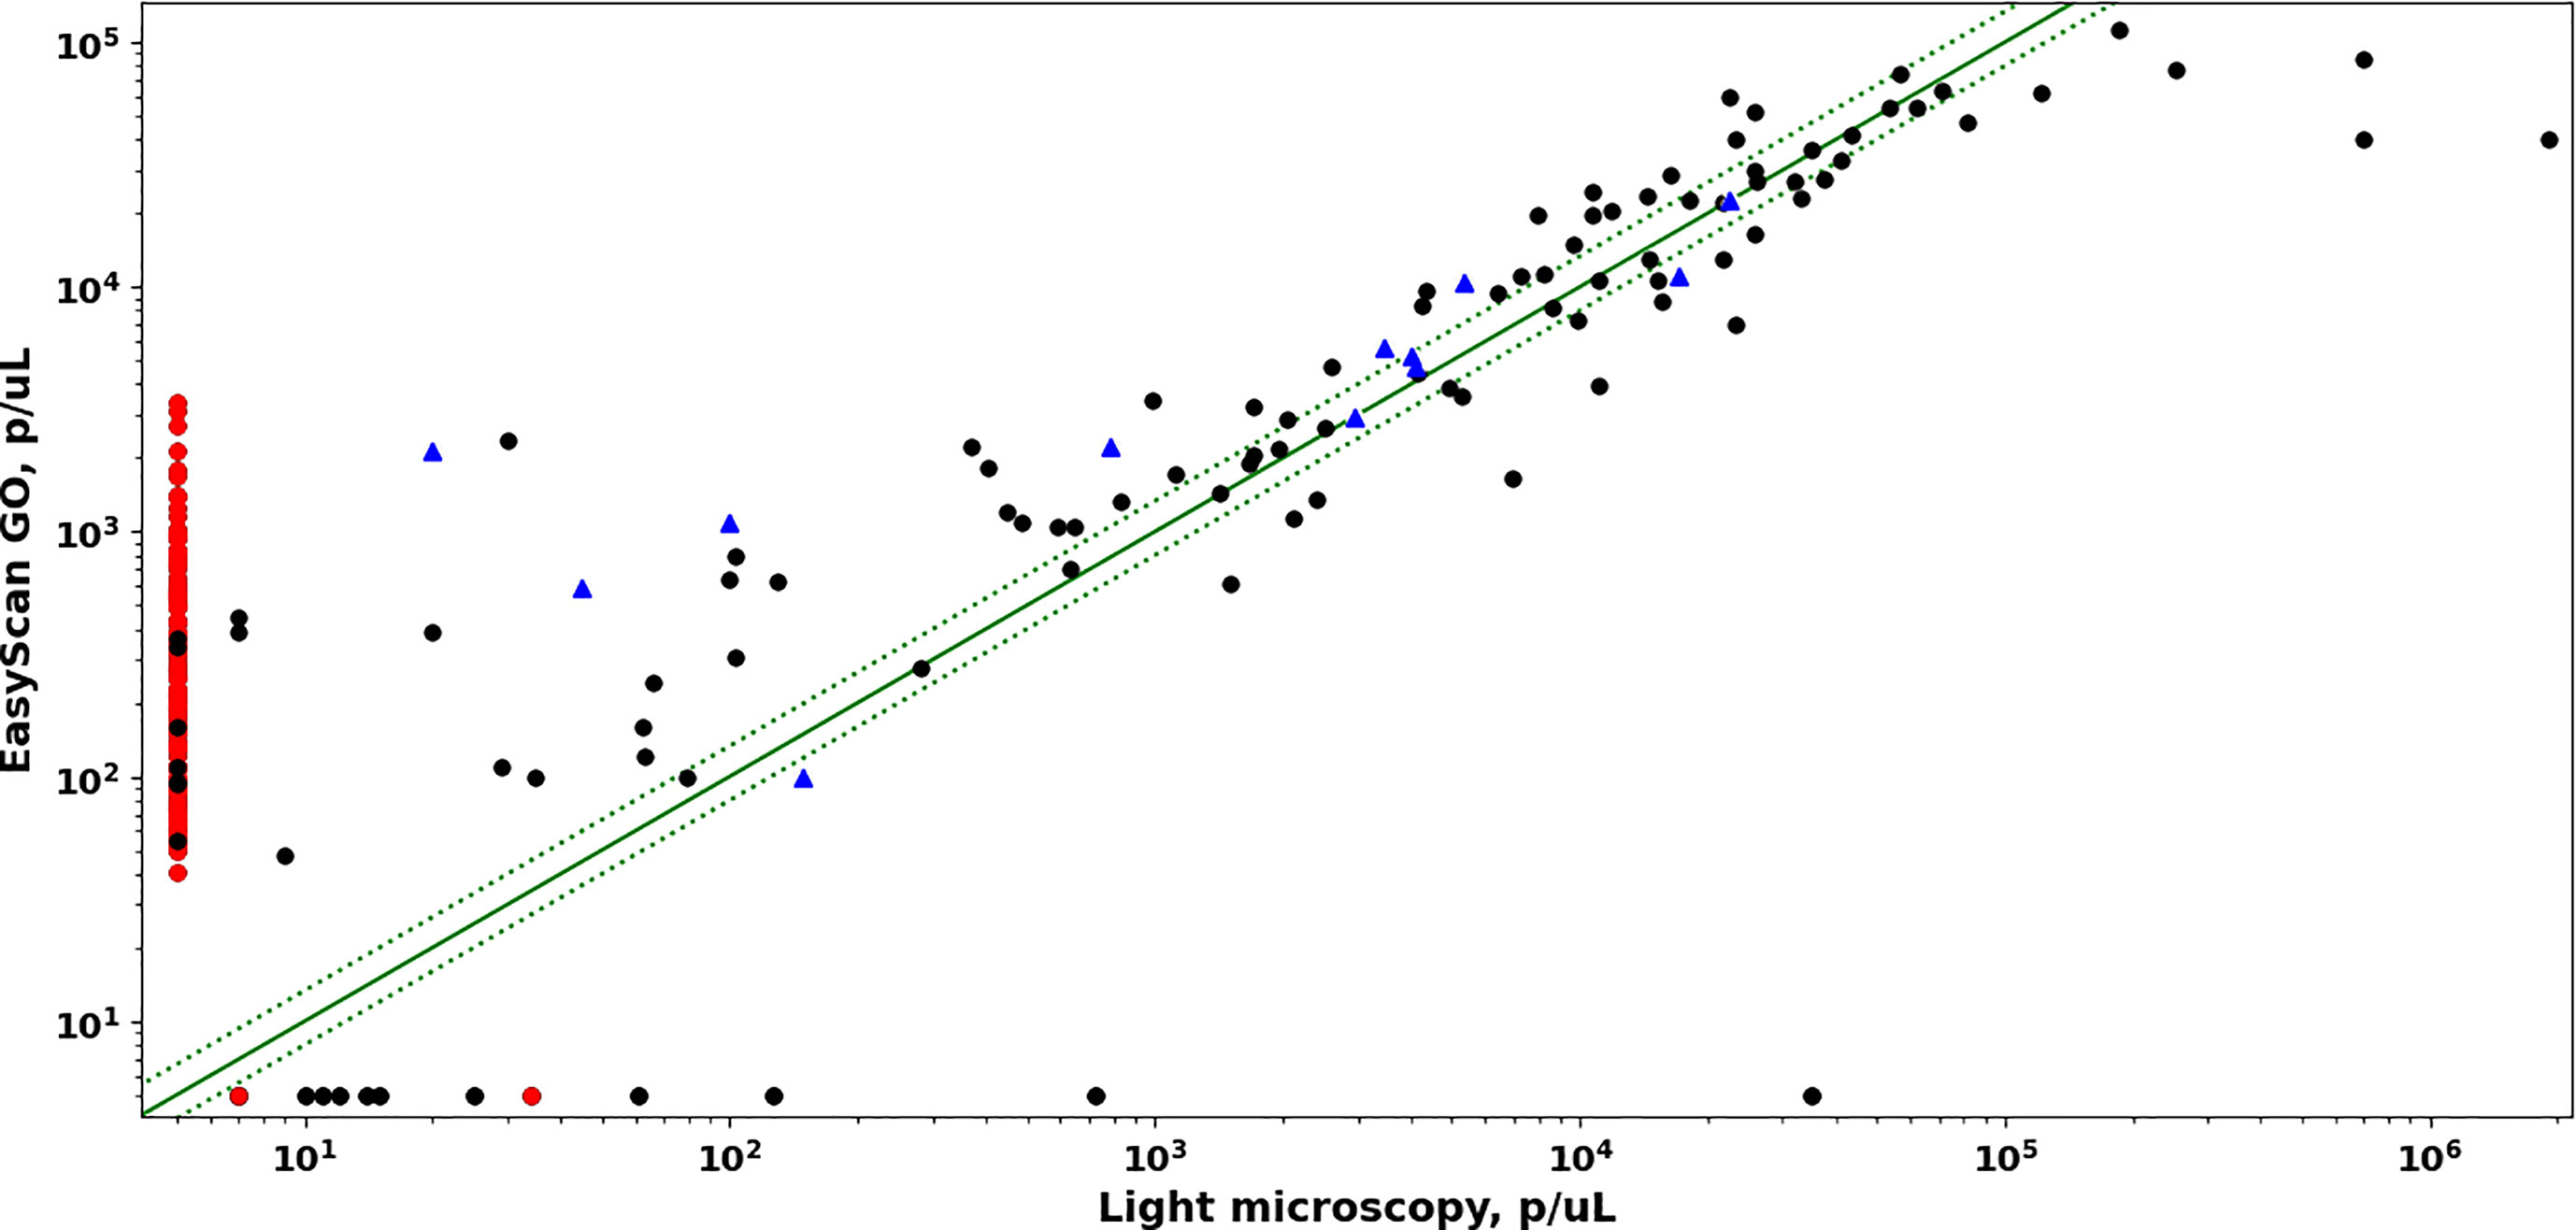
Figure 2 Comparison of parasite densities estimated by EasyScan GO vs manual light microscopy. Dotted green lines correspond to +/- 25% error. PCR-positive samples are black circles (Pf) or blue triangles (non-Pf). PCR-negative samples are red circles.
Blood film examination for malaria parasites is far from extinct, despite the wide uptake of malaria rapid diagnostic tests (RDTs). Indeed, the 2022 edition of the British Society for Haematology guidelines for the laboratory diagnosis of malaria states “Rapid diagnostic tests (RDTs) for malarial antigen cannot replace microscopy but can be useful as a supplementary test when malaria diagnosis is performed by relatively inexperienced staff. They should not be used instead of a film at any time including out of hours” (Rogers et al., 2022). Furthermore, HRP-2 and HRP-3 deletions represent a threat to the utility of HRP2-based RDTs in some geographic areas (Feleke et al., 2021) so it is imperative to retain blood film microscopy for the diagnosis of malaria both in malaria-endemic areas and in travelers returning from those areas presenting for diagnosis of a febrile illness. Nonetheless, quality assured malaria microscopy requires significant expertise, reinforcement by regular exposure to positive samples and regular external quality assessment. Therefore, an automated process for malaria microscopy which compares favorably with expert manual microscopy would be a valuable addition to a laboratory’s diagnostic repertoire. There are both advantages and drawbacks to automated malaria diagnosis as outlined in the introduction of this paper. Possible scenarios for use of an automated device like the EasyScan GO include hospital clinics in malaria-endemic countries, to support laboratory staff and thus allow them to increase patient throughput; settings in non-malaria-endemic countries (like the United Kingdom), where many biomedical scientists in general hospitals outside the National Centres for Tropical Diseases do not routinely see malaria cases and may therefore lack both experience and high-level expertise; and in sentinel sites monitoring drug resistance, to aid in the highly labor-intensive quantitation work required. Suitability for these scenarios depends, in various ways, on parasite detection, species identification, and quantitation, as detailed below.
In this study, diagnostic accuracy of the EasyScan GO was similar to that of expert Light Microscopy. The principal difference was the EasyScan GO’s lower specificity (89% vs 100%, PCR as reference). From a clinical perspective, false positives could mean patients receiving drug treatment that is not required, therefore the device would not be used as a standalone diagnostic tool without additional input from other laboratory staff needing to screen further for potential false positives. However, the mosaic of thumbnails of suspected parasites (e.g. as shown in Figure 1 and supplementary figures 1 and 2), included in every report outputted by the device, makes this check relatively easy and screening could be done remotely if so required. Sensitivity of the EasyScan GO was very similar to light microscopy, meaning both techniques are able to positively identify parasites at comparable densities and become limited below similar parasite densities. In terms of clinical care, this is reassuring since similar numbers of positive malaria infections could be identified and subsequently treated. The low sensitivity of light microscopy vs PCR was likely due to the inclusion of a number of low-parasitemia samples (under 50 parasites/µL), which would often be undetected by most non-reference microscopists and could therefore be missed in a routine laboratory. In addition, some of the patients sampled may in fact be 1-2 weeks post treatment for malaria and the positive PCR is residual circulating Plasmodial DNA, rather than an active infection with live parasites. The low sensitivity of the EasyScan GO vs PCR was mostly observed in the same low-parasitemia samples, but the device did appear to miss two samples with higher parasitemia (see Figure 2). The sample with a very high parasitemia (~35,000 p/µL) was possibly post-treatment, since the parasites appeared to contain no cytoplasm, which could potentially lead to the software algorithm having much more difficulty identifying them as true parasites. The EasyScan GO did detect a few low-parasitemia samples that were missed by light microscopy but picked up by PCR. However, given the high estimated parasitemia of these samples compared with the PCR result, it suggests they may have been “right for the wrong reason”, with the positive diagnoses triggered by incorrectly classified artefacts rather than correctly classified parasites. If so, they are perhaps most similar to false positive negative samples. One of the most common limitations with light microscopy that will also impact any digital imaging device such as the EasyScan GO is variation in quality of blood films (Das et al., 2022). The software was trained with a large number of training slides encompassing a wide range of slide backgrounds containing a variety of different artefacts, but undoubtedly the device will improve further as it learns from a larger range of sample sets in future.
The Easy Scan GO accurately distinguished P. falciparum from non-P. falciparum, using the thick film. However, it failed to distinguish between the various non-P. falciparum species, defaulting to P. vivax. This was likely a reflection of insufficient P. ovale and P. malariae training samples: CNNs require vast amounts of training data, and due to natural distributions of the malaria species the algorithms’ training sets were highly imbalanced, containing ample P. vivax (and P. falciparum) but very few P. ovale and P. malariae blood films. In addition, to determine species, the algorithm applies a logical decision tree to findings from thick and thin films, where thick film decides between P. falciparum and non-P. falciparum, and thin film can modify a non-falciparum finding. Due to prevalence rates and training data imbalances, this logical tree favors P. vivax over P. ovale and P, malariae. That is, P. vivax is the default non-P. falciparum choice. This weakness might be mitigated in two ways: By substantially increasing the number of P. ovale and P. malariae samples in the training set (in practice, a difficult task); or by applying local geographical priors, e.g. the rareness of P. vivax relative to P. ovale in West Africa (Howes et al., 2011) (as in (WHO, 2000; Bailey et al., 2013; WHO, 2016)). Since the EasyScan GO has an implicit bias towards P. vivax (vs. ovale, malariae, and knowlesi), it is more suitable for geographic regions with this same predominance, for example India or Peru. This concern does not apply to diagnosis of P. falciparum.
Evolving drug resistance (Tilley et al., 2016; Balikagala et al., 2021) makes drug efficacy trials and drug resistance sentinel sites a potential use-scenario for automated microscopy, because of the need for high-throughput parasite quantitation in laboratory settings: The labor-intensive process requires quantitating blood films drawn every few hours from treated patients, in order to plot parasite clearance curves (White, 2011). Since several film quantitations are combined to calculate a clearance curve, the exact performance specification for individual blood film quantitations is not well defined and partly depends on the calculation method. An informal guideline recommends that most quantitations be accurate to within +/- 25% (excepting very low parasitemia samples) (Dhorda M, WWARN. Personal communication). WHO’s microscopist evaluation protocol looks at whether P. falciparum samples with parasitemia between 200 and 2000 p/µL have a quantitation error within 25% (WHO, 2016). In this study, EasyScan GO’s accuracy was within this margin for 33% of such samples. This may be too low to usefully calculate accurate clearance curves, though it might be close to sufficient. An experiment on a set of time-series blood films as used in clearance studies, comparing clearance curve log slopes as calculated from quantitations done by light microscopy and by the EasyScan GO, would help clarify this point.
An important detail to note is that light microscopy parasite quantitations in this study were based on accurate total WBC counts which varied widely by individual (mean 5430, std dev 2070), while EasyScan GO assumed a fixed value of 8000 WBCs/µL. When correcting parasitemia estimates provided by EasyScan GO using accurate individual WBC counts, the percentage of samples having quantitation error within the 25% margin increases to 50%. This indicates that quantitation error was affected by how WBC counts per µL were defined for the samples examined.
The EasyScan GO system, and very similar algorithms deployed on different hardware, have been evaluated in four other field trials (Torres et al., 2018; Vongpromek et al., 2019; Horning et al., 2021; Das et al., 2022) and two internal tests (Mehanian et al., 2017; Delahunt et al., 2019) allowing a broad perspective on system reliability in the face of diverse slide presentations.
1. The same EasyScan GO system was applied to a WHO 55 reference set and had somewhat stronger performance vs PCR (87% sensitivity, 100% specificity) (Horning et al., 2021). The higher sensitivity was likely because the WHO set had only parasitemias above 80 p/uL, i.e. it lacked the low parasitemias typically challenging for microscopists. The difference in specificities was perhaps due to differences in slide preparation and distractor types in the two sets of slides.
2. The same EasyScan GO system, minus the thin film algorithm and applied to thick films only, was also applied to field slides (170 Light Microscopy (LM)-positive, 623 LM-negative) from a variety of sites in Thailand and Indonesia (Vongpromek et al., 2019). In this setting, diagnostic accuracy was somewhat higher (89% sensitivity, 97% specificity), whilst samples whose parasitemia was under 50 p/µL, were missed. Quantitation accuracy was very similar to that of the current study: 30% of quantitations had error under 25% relative to LM reference.
3. A system with a very similar thick film algorithm (no thin film algorithm) and a different scanning microscope (the Autoscope, not the EasyScan GO) was tested on field samples (thick films only) in Peru (Torres et al., 2018). Performance in Peru was very similar to that reported here. In particular, sensitivities compared with PCR were nearly identical (LM: 68%, Autoscope: 72%), and specificities were very similar (LM: 98%, Autoscope 85%). The Peru study presented only P. falciparum and P. vivax and algorithm species identification accuracy was 90%.
4. The same system as used in the present study, minus the thin film module and applied to thick films only, was tested on field samples at 11 sites in 11 countries (Das et al., 2022). Sensitivity and specificity were similar (91% and 85%). Species identification accuracy (P. falciparum vs P. vivax only, no P. ovale or P. malariae present) was 92%. Quantitation accuracy was worse (23% of quantitations had error under 25% relative to LM reference).
5. Two internal algorithm assessments reported similar though somewhat more optimistic results (Mehanian et al., 2017; Delahunt et al., 2019).
The perspective afforded by five separate field trials is, to our knowledge, unique for an automated malaria diagnosis system. This perspective is highly valuable because a system’s performance can vary in different settings. Since machine learning-based systems can be brittle in the face of new data sources, the high variability of slide preparation at different clinics is a serious challenge for automated malaria diagnosis systems. In this context, therefore, multiple data points on system performance are especially important to understanding a system’s suitability for deployment. Collectively, these trials demonstrate strong performance of a fully automated system for assessing a diversity of Giemsa-stained blood films.
Manual malaria microscopy requires significant expertise and even expert microscopists become fatigued in the face of a heavy workload, with the potential for error. An automated system such as the EasyScan GO would have the capacity to reduce workload for individual microscopists whilst retaining the option for a technician or pathologist to quickly check the device’s findings using the mosaic of thumbnails of suspected parasites it produces. This reflects the general fact that, currently, automated Machine Learning systems do not match the capabilities of expert microscopists at malaria diagnosis.
In this study, the EasyScan GO fell short in performance compared to that of expert manual light microscopy in terms of sensitivity and specificity (88% and 89% respectively). The EasyScan GO wrongly identified 122 samples as positive that were read as parasite negative by light microscopy. However, as mentioned above, this limitation could be partially mitigated by the output of thumbnail images of these wrongly identified parasites that can be rechecked by a microscopist on site or from a remote location. From all malaria positives identified by both light microscopy and the EasyScan GO, the latter accurately identified all but one P. falciparum sample. From a clinical perspective, this is an important variable since the device can detect almost as many cases caused by this potentially deadly species as an expert microscopist and a comparable number of patients would therefore be correctly treated. However, by contrast, it failed to distinguish between non-P. falciparum species, reporting all non-P. falciparum samples as P. vivax. The EasyScan GO also fell short in its accuracy of parasite density determination, only being able to quantify within +/-25% of the “true count” in 33% of samples with densities between 200 and 2000 p/µL.
The dependence of quantitation accuracy on the ground truth method for counting WBCs/µL suggests possible future paths for automated microscopy: for example, scanning a known volume of blood might improve quantitation accuracy e.g. the Earle and Perez method, that does not require a microscopist to manually count WBCs in order to estimate parasitemia accurately (Bowers et al., 2009).
As machine learning advances further and has the opportunity to learn from exposure to more positive malaria sample images as well as a wide range of background and staining artefacts, fully automated systems such as EasyScan GO will have a future in malaria diagnosis in a variety of settings in both endemic and non-endemic areas.
The raw data supporting the conclusions of this article will be made available by the authors, without undue reservation.
The studies involving human participants were reviewed and approved by London-Central Research Ethics Committee. Written informed consent for participation was not required for this study in accordance with the national legislation and the institutional requirements.
CB and PC assisted with study design. KW and PC were responsible for identifying and recruiting study participants. RR-C, LG, PL, KB and SS were responsible for SP development and laboratory work. MH, CD, LH, CM, and CT developed the software algorithm. Study data was analysed by MG, MH, SB, CD and RR-C. CB, CD, RR-C and PC were responsible for drafting the manuscript. All authors contributed to the manuscript and approved the final version.
All funding for the study was provided by The Global Good Fund I, LLC.
The authors would like to thank all collaborating staff within Research Offices at the London School of Hygiene and Tropical Medicine, Homerton University Hospital NHS Foundation Trust, and University College London/University College London Hospitals NHS Foundation Trust (the Joint Research Office). Specifically, we acknowledge the invaluable assistance provided by senior research nurses Monica James (Homerton) and Michelle Berkeley (UCL/UCLH). In addition, we would like to thank laboratory staff within the department of Haematology at Homerton University Hospital NHS Foundation Trust for the preparation and provision of blood smears for their patients enrolled in the study.
Author CT was employed by the company Creative Creek, LLC.
The remaining authors declare that the research was conducted in the absence of any commercial or financial relationships that could be construed as a potential conflict of interest.
All claims expressed in this article are solely those of the authors and do not necessarily represent those of their affiliated organizations, or those of the publisher, the editors and the reviewers. Any product that may be evaluated in this article, or claim that may be made by its manufacturer, is not guaranteed or endorsed by the publisher.
The Supplementary Material for this article can be found online at: https://www.frontiersin.org/articles/10.3389/fmala.2023.1148115/full#supplementary-material
Bailey J. W., Williams J., Bain B. J., Parker-Williams J., Chiodini P. L. (2013). Guideline: the laboratory diagnosis of malaria. general haematology task force of the British committee for standards in haematology. Br. J. Haematol. 163 (5), 573–580. doi: 10.1111/bjh.12572
Balikagala B., Fukuda N., Ikeda M., Katuro O. T., Tachibana S. I., Yamauchi M., et al. (2021). Evidence of artemisinin-resistant malaria in Africa. Med N Engl. J. 385 (13), 1163–1171. doi: 10.1056/NEJMoa2101746
Bowers K. M., Bell D., Chiodini P. L., Barnwell J., Incardona S., Yen S., et al. (2009). Inter-rater reliability of malaria parasite counts and comparison of methods. Malar J. 8, 267. doi: 10.1186/1475-2875-8-267
Calderaro A., Piccolo G., Perandin F., Gorrini C., Peruzzi S., Zuelli C., et al. (2007). Genetic polymorphisms influence plasmodium ovale PCR detection accuracy. J. Clin. Microbiol. 45 (5), 1624–1627. doi: 10.1128/JCM.02316-06
Cordray M. S., Richards-Kortum R. R. (2012). Emerging nucleic acid-based tests for point-of-care detection of malaria. Am. J. Trop. Med. Hyg. 87 (2), 223–230. doi: 10.4269/ajtmh.2012.11-0685
Cunningham J., Jones S., Gatton M. L., Barnwell J. W., Cheng Q., Chiodini P. L., et al. (2019). A review of the WHO malaria rapid diagnostic test product testing programme (2008–2018): performance, procurement and policy. Malar J. 18, 387. doi: 10.1186/s12936-019-3028-z
Das D. K., Mukherjee R., Chakraborty C. (2015). Computational microscopic imaging for malaria parasite detection: a systematic review. J. Microsc 260 (1), 1–19. doi: 10.1111/jmi.12270
Das D., Vongpromek R., Assawariyathipat T., Srinamon K., Kennon K., Stepniewska K., et al. (2022). Field evaluation of the diagnostic performance of EasyScan GO. a digital malaria microscopy device based on machine-learning. Malaria J. 21, 122. doi: 10.1186/s12936-022-04146-1
Delahunt C. B., Gachuhi N., Horning M. P. (2022) Use case-focused metrics to evaluate machine learning for diseases involving parasite loads. Available at: https://arxiv.org/abs/2209.06947.
Delahunt C. B., Jaiswal M. S., Horning M. P., Janko S., Thompson C. M., Kulhare S., et al. (2019). “Fully-automated patient-level malaria assessment on field-prepared thin blood film microscopy images,” in 2019 IEEE Global Humanitarian Technology Conference (GHTC), (Seattle, WA, United States: IEEE). 1–8. doi: 10.1109/GHTC46095.2019.9033083
Feleke S. M., Reichert E. N., Mohammed H., Brhane B. G., Mekete K., Mamo H., et al. (2021). Plasmodium falciparum is evolving to escape malaria rapid diagnostic tests in Ethiopia. Nat. Microbiol. 6 (10), 1289–1299. doi: 10.1038/s41564-021-00962-4
Horning M. P., Delahunt C. B., Bachman C. M., Luchavez J., Luna C., Hu L., et al. (2021). Performance of a fully-automated system on a WHO malaria microscopy evaluation slide set. Malaria J. 20 (1), 110. doi: 10.1186/s12936-021-03631-3
Howes R. E., Patil A. P., Piel F. B., Nyangiri O. A., Kabaria C. W., Gething P. W., et al. (2011). The global distribution of the Duffy blood group. Nat. Commun. 2 (1), 266. doi: 10.1038/ncomms1265
Jimenez A., Rees-Channer R. R., Perera P., Gamboa D., Chiodini P. L., González I. J., et al. (2017). Analytical sensitivity of current best-in-class malaria rapid diagnostic tests. Malar J. 16, 128. doi: 10.1186/s12936-017-1780-5
LeCun Y., Bengio Y., Hinton G. (2015). Deep learning. Nature 521 (7553), 436–444. doi: 10.1038/nature14539
Makhija K. S., Maloney S., Norton R. (2015). The utility of serial blood film testing for the diagnosis of malaria. Pathology. 47 (1), 68–70. doi: 10.1097/PAT.0000000000000190
Manescu P., Neary-Zajiczek L., Shaw M., Elmi M., Claveau R., Pawar V., et al. (2019). Deep learning enhanced extended depth-of-field for thick blood-film malaria high-throughput microscopy (arXiv:1906.07496: Image and Video Processing). doi: 10.48550/arXiv.1906.07496
Mehanian C., Jaiswal M., Delahunt C., Thompson C., Horning M., Hu L., et al. (2017). “Computer-automated malaria diagnosis and quantitation using convolutional neural networks,” in 2017 IEEE International Conference on Computer Vision Workshops (ICCVW). (Venice, Italy: IEEE), 116–125. doi: 10.1109/ICCVW.2017.22
Motic (2021) EasyScan GO AI-powered malaria detection. Available at: https://moticdigitalpathology.com/EasyScanGo/.
Padley D. J., Heath A. B., Sutherland C., Chiodini P. L., Baylis S. A. (2008). Establishment of the 1st world health organization international standard for plasmodium falciparum DNA for nucleic acid amplification technique (NAT)-based assays. Malar J. 7, 139. doi: 10.1186/1475-2875-7-139
Padley D., Moody A. H., Chiodini P. L., Saldanha J. (2003). Use of a rapid, single-round, multiplex PCR to detect malarial parasites and identify the species present. Ann. Trop. Med. parasitology 97, 131–137. doi: 10.1179/000349803125002977
Pattanaik P., Swarnkar T. (2018). Comparative analysis of morphological techniques for malaria detection. Int. J. Healthcare Inf. Syst. Informatics 13 (4), 49–65. doi: 10.4018/IJHISI.2018100104
Poostchi M., Silamut K., Maude R. J., Jaeger S., Thoma G. (2018). Image analysis and machine learning for detecting malaria. Transl. Res. 194, 36–55. doi: 10.1016/j.trsl.2017.12.004
Rogers C. L., Bain B. J., Garg M., Fernandes S., Mooney C., Chiodini P. L. (2022). British Society for haematology guidelines for the laboratory diagnosis of malaria. Br. J. Haematol. 197 (3), 271–282. doi: 10.1111/bjh.18092
Rosado L., Correia da Costa J. M., Elias D., Cardoso J. S. (2016). A review of automatic malaria parasites detection and segmentation in microscopic images. Anti-infect Agents 14 (1), 11–22. doi: 10.2174/221135251401160302121107
Roth J. M., Korevaar D. A., Leeflang M. M., Mens P. F. (2016). Molecular malaria diagnostics: a systematic review and meta-analysis. Crit. Rev. Clin. Lab. Sci. 53 (2), 87–105. doi: 10.3109/10408363.2015.1084991
Shokoples S. E., Ndao M., Kowalewska-Grochowska K., Yanow S. (2009). Multiplexed real-time PCR assay for discrimination of plasmodium species with improved sensitivity for mixed infections. Jounal Clin. Microbiol. 47, 975–980. doi: 10.1128/JCM.01858-08
Singh B., Kim Sung L., Matusop A., Radhakrishnan A., Shamsul S. G., Cox-Singh J., et al. (2004). A large focus of naturally acquired plasmodium knowlesi infections in human beings. Lancet. 363 (9414), 1017–1024. doi: 10.1016/S0140-6736(04)15836-4
Snounou G., Singh B. (2002). Nested PCR analysis of plasmodium parasites. Methods Mol. Med. 72, 189–203. doi: 10.1385/1-59259-271-6:189
Snounou G., Viriyakosol S., Zhu X. P., Jarra W., Pinheiro L., do Rosario V. E., et al. (1993). High sensitivity of detection of human malaria parasites by the use of nested polymerase chain reaction. Mol. Biochem. Parasitology 61 (2), 315–320. doi: 10.1016/0166-6851(93)90077-B
Tangpukdee N., Duangdee C., Wilairatana P., Krudsood S. (2009). Malaria diagnosis: a brief review. Korean J. Parasitol. 47 (2), 93–102. doi: 10.3347/kjp.2009.47.2.93
Tilley L., Straimer J., Gnädig N. F., Ralph S. A., Fidock D. A. (2016). Artemisinin action and resistance in plasmodium falciparum. Trends Parasitology 32 (9), 682–696. doi: 10.1016/j.pt.2016.05.010
Torres K., Bachman C. M., Delahunt C. B., Alarcon Baldeon J., Alava F., Gamboa Vilela D., et al. (2018). Automated microscopy for routine malaria diagnosis: a field comparison on giemsa-stained blood films in Peru. Malaria J. 17 (1), 339. doi: 10.1186/s12936-018-2493-0
Vasoo S., Pritt B. S. (2013). Molecular diagnostics and parasitic disease. Clin. Lab. Med. 33 (3), 461–503. doi: 10.1016/j.cll.2013.03.008
Vongpromek R., Proux S., Ekawati L., Archasuksan L., Bachman C., Bell D., et al. (2019). Field evaluation of automated digital malaria microscopy: EasyScan GO. Trans. R Soc. Trop. Med. Hyg. 113, 14–15. doi: 10.1186/s12936-021-03631-3
Warhurst D. C., Williams J. E. (1996). Laboratory diagnosis of malaria. J. Clin. Pathol. 49 (7), 533–538. doi: 10.1136/jcp.49.7.533
WHO (2000). Bench aids for the diagnosis of malaria infections. 2nd ed (Geneva: World Health Organization).
WHO (2016). Malaria microscopy quality assurance manual. version 2 ed (Geneva: World Health Organization).
WHO (2018b). External quality assurance scheme for malaria nucleic acid amplification testing - operational manual (Geneva: World Health Organization).
Wongsrichanalai C., Barcus M. J., Muth S., Sutamihardja A., Wernsdorfer W. H. (2007). A review of malaria diagnostic tools: microscopy and rapid diagnostic test (RDT). Am J. Trop. Med. Hyg. 77, 119–127. doi: 10.4269/ajtmh.2007.77.119
Keywords: malaria, diagnostics, microscopy, machine learning, EasyScanGO
Citation: Rees-Channer RR, Bachman CM, Grignard L, Gatton ML, Burkot S, Horning MP, Delahunt CB, Hu L, Mehanian C, Thompson CM, Woods K, Lansdell P, Shah S and Chiodini PL (2023) Evaluation of an automated microscope using machine learning for the detection of malaria in travelers returned to the UK. Front. Malar. 1:1148115. doi: 10.3389/fmala.2023.1148115
Received: 19 January 2023; Accepted: 04 July 2023;
Published: 10 August 2023.
Edited by:
Andre Lin Ouedraogo, Bill and Melinda Gates Foundation, United StatesReviewed by:
Kingsley Badu, Kwame Nkrumah University of Science and Technology, GhanaCopyright © 2023 Rees-Channer, Bachman, Grignard, Gatton, Burkot, Horning, Delahunt, Hu, Mehanian, Thompson, Woods, Lansdell, Shah and Chiodini. This is an open-access article distributed under the terms of the Creative Commons Attribution License (CC BY). The use, distribution or reproduction in other forums is permitted, provided the original author(s) and the copyright owner(s) are credited and that the original publication in this journal is cited, in accordance with accepted academic practice. No use, distribution or reproduction is permitted which does not comply with these terms.
*Correspondence: Roxanne R. Rees-Channer, Um94YW5uZS5yZWVzLWNoYW5uZXJAbmhzLm5ldA==
Disclaimer: All claims expressed in this article are solely those of the authors and do not necessarily represent those of their affiliated organizations, or those of the publisher, the editors and the reviewers. Any product that may be evaluated in this article or claim that may be made by its manufacturer is not guaranteed or endorsed by the publisher.
Research integrity at Frontiers
Learn more about the work of our research integrity team to safeguard the quality of each article we publish.