
95% of researchers rate our articles as excellent or good
Learn more about the work of our research integrity team to safeguard the quality of each article we publish.
Find out more
ORIGINAL RESEARCH article
Front. Lab Chip Technol. , 29 February 2024
Sec. Imaging and Detection
Volume 3 - 2024 | https://doi.org/10.3389/frlct.2024.1289437
This article is part of the Research Topic Celebrating Excellence in North America: Lab-on-a-Chip Technologies View all 4 articles
 Mónica Gabriela Sánchez-Salazar1,2
 Regina Garza-Garza1,2
 Regina Crespo-López Oliver1,2Valeri Sofía Jerezano-Flores1,2Salvador Gallegos-Martínez1,2Sofía Ramos-Meizoso1,2Manuel Verduzco-Valenzuela1,2
 Grissel Trujillo-de Santiago1,2*
 Mario Moisés Alvarez1,2*
Introduction: Organ-on-chips have become an effective platform for studying the physiology of tissues and organs and for evaluating the safety and efficacy of drugs. In these systems, the inline monitoring of key parameters of biological performance (i.e., glucose, oxygen, or lactic acid concentrations) provides valuable information regarding the cell/tissue physiological state. However, significant limitations still exist when attempting to obtain inline information in these systems, and the microsensing technology of on-chip measurement of key parameters is still limited by size, cost, and availability.
Methods: Here, we demonstrate the use of a commercially available glucometer (FreestleTM Libre; Abbott), normally used for continuous determination of blood glucose levels, to provide continuous inline measurements of the glucose concentration in tumor-on-chips. Here, we employed a colorectal tumor-on-chip as a first demonstration model and measured the on-chip concentration of glucose continuously for extended culture times (2 weeks).
Results and Discussion: We show that inline glucose readings are reproducible and enable the accurate determination of glucose consumption rates (GCRs) by a tumor cell culture. In turn, the GCR measurements provide valuable information regarding the changes in the metabolic activity of the on-chip cultures following inlet perturbations (i.e., delivery of pulses of glucose, culture media additives, and drugs). Inline continuous glucose sensors will be useful tools in organ-on-chip research and will greatly enable cancer research in tumor-on-chip systems.
Organ-on-chips (Lim et al., 2021; Liu et al., 2021; Subia et al., 2021), or microphysiological systems (MPS), are micro/milli-fluidic devices used to culture microtissues and are proving valuable as platforms that emulate relevant features of tissues and organs to facilitate biomedical research (Liu et al., 2022; Ngo et al., 2023; Zhou et al., 2023). Organ-on-chips can be used to conduct fundamental studies (Zhang et al., 2017; Sabaté del Río et al., 2023; Wang et al., 2023), to model diseases (Weltin et al., 2014; Azizgolshani et al., 2021; Fuchs et al., 2021; Gallegos-Martínez et al., 2022), to assess the effects of physical or chemical stimuli on tissues (Dornhof et al., 2022), or to screen novel pharmaceutical compounds (Criscione et al., 2023; Sabaté del Río et al., 2023).
One of the main advantages of organ-on-chips is that their small volumes provide the ability to precisely control the conditions in the cellular/tissue microenvironment (i.e., temperature, pH, concentrations, and concentration gradients, mixing, and flow conditions). Nevertheless, while operating in small volumes facilitates the control of the microenvironment, it also imposes relevant limitations and challenges (Zhang et al., 2017; Fuchs et al., 2021; Sabaté del Río et al., 2023). For instance, measuring variables in chips is challenging. Repeated/frequent intrusions into the chip culture chambers is undesirable because it increases the risk of contamination or disturbance of culture conditions and because measuring relevant parameters inside chips is difficult precisely due to their small size. Therefore, an ideal aim for the organ-on-chip community is to develop on-chip microsensors capable of reporting the value of the key parameters (inline, if possible) within the chip itself (Pu et al., 2016; Zhang et al., 2017; Fuchs et al., 2021; Sabaté del Río et al., 2023).
The development of microsensors to measure glucose, pH, dissolved oxygen, relevant signaling molecules, and biomarkers, among other key parameters, has received much attention in the recent literature (Weltin et al., 2014; Azizgolshani et al., 2021; Dornhof et al., 2022; Ngo et al., 2023). However, as most of these technologies have not yet reached the market, researchers interested in sensing variables in chips must frequently fabricate their own sensing systems. In the rare cases where specific microsensors are available, they are frequently costly and not necessarily user-friendly. A remarkable exception is the range of commercially available sensors that continuously measure glucose levels in human blood. Fortunately, the medical need for inexpensive glucose sensors has boosted the technology for continuous glucose sensing to a well-developed commercial status (Chmayssem et al., 2023) and clinical use (Battelino et al., 2023). Today, many patients can continuously follow their blood glucose levels using commercial glucometers. These glucometers, based on micro-needle sensors (Chmayssem et al., 2023), can be comfortably worn for days or weeks and can report glucose concentrations in real time. Here, we demonstrate the use of a relatively low-cost and commercially available glucose sensor (Freestyle® Libre 3 from Abbott) (Feldman et al., 2004) to determine, in real time, the glucose concentration inside an organ-on-chip system.
The Freestyle® Libre 3 is a wearable sensing device widely used to measure the concentration of glucose in human blood in real time and has been extensively validated for use in diabetic (Avari et al., 2023) and non-diabetic human subjects (Tolfrey et al., 2023). However, to our knowledge, the use of the Freestyle glucose sensor has not been documented in cell culture applications. Arguably, the accurate determination of the concentration of the carbon source is closely linked to the overall metabolic performance of on-chip cultures and is highly relevant for taking full advantage of organ-on-chip platforms. Glucose is the universal source of carbon for mammalian cells and most human and animal tissues; therefore, the ability to measure glucose concentrations on-chip in real time would be highly valuable for assessing the overall metabolic status of an on-chip culture.
In this contribution, we introduce a non-intuitive and straightforward strategy to use readily accessible commercial (and relatively low-cost sensors) to obtain relevant and real-time information from microfluidic systems. We implemented our continuous glucose monitoring in a colorectal tumor-on-chip as a first demonstration model and measured the on-chip concentration of glucose continuously for extended culture times (2 weeks). As we demonstrate in this study, the continuous monitoring of glucose concentrations on chips with a simple inline sensor may be a simple and powerful method for the rapid assessment of the effect of additives, drugs, and other chemical stimuli applied to on-chip cultures.
Here, we demonstrate the use of a commercial glucose sensor (Freestyle®) to conduct continuous inline determinations of the glucose concentration in organs-on-chip in a continuous manner.
As proof of concept, we selected a simple cancer-on-chip or tumor-on-chip (Figure 1A). We fabricated Caco2 cell–laden alginate/GelMA microspheres and used them to fill the culture chamber of a 3D-printed chip to develop a simplified colorectal cancer-on-chip. The microspheres were fabricated using cell suspensions containing 1.5 × 10⁶ cells/mL.
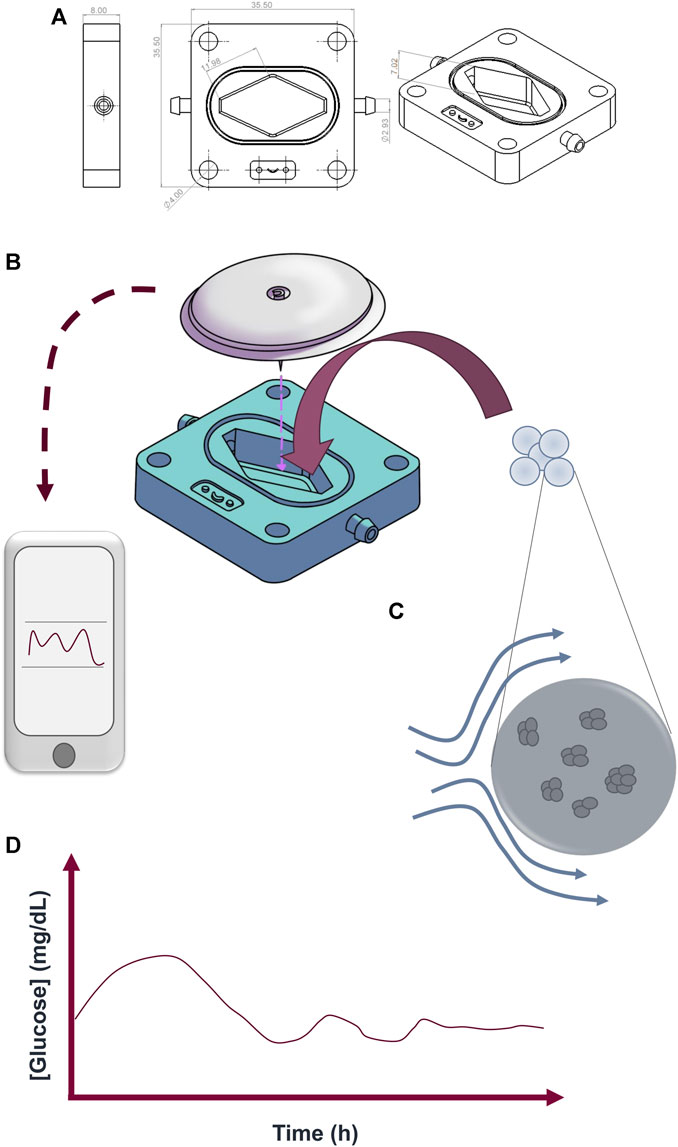
FIGURE 1. Chip design and configuration. (A) Shape and dimensions of the 3D-printed chip. The device was designed in SolidWorks. (B) Integration of the FreeStyle® glucose sensor with the tumor-on-chip (ToC). After seeding the microspheres inside the ToC, the sensor was placed on top of the culture chamber, and the device was connected to a syringe and a waste tube to complete the setup. The sensor performed glucose readings every 15 min, and data were collected every 8 h using a cellphone with the FreeStyle® LibreLink app. (C) Schematic representation of Caco2 microtumors embedded in alginate/GelMA microspheres. The microspheres deflect the flow, thereby enhancing transport. Nutrients, additives, and/or drugs diffuse from the bulk of the liquid and into the microspheres that emulate cancerous tissue. The microspheres consisted of 1.75% alginate and 2.5% GelMA. (D) Schematic representation of glucose concentration graphs obtained from the readings from the FreeStyle® glucose sensor. A steady state, in terms of glucose concentrations, is expected to be reached. Any change applied to the system in the intlet stream will perturb the glucose readings, if biologically relevant, and a new steady state will eventually be achieved.
The aims of the shape of the chip and the presence of gel microspheres within the culture chamber were to promote mixing (Sánchez-Salazar et al., 2023). The rhomboidal shape of the culture chamber follows the rationale of avoiding dead corners (Figure 1B), while the microspheres deflect the flow to enhance mixing (Figure 1C). However, a certain level of heterogeneity in this system is anticipated, and concentration gradients are expected to exist within the culture chamber. Therefore, we strongly recommend mixing characterizations for the rational selection of sensing locations. Evaluating the extent of heterogeneity is crucial for comprehending the representativeness and significance of sensor readings measured at specific chip locations within the broader context of the entire system.
For example, in the experiments reported here, we placed only one sensor in the geometric center of the chip, as indicated in Figure 1B, and we conducted a series of mixing experiments to understand the implications of this selection of location.
Figure 2A shows the results from on-chip experiments in which we fed doxorubicin (a fluorescent anti-cancer agent) and recorded its concentration over time (12 h) using optical fluorescence microscopy. To simplify the analysis, the chip was divided into nine regions (Figure 2B), and the time evolution of the mean fluorescence value was calculated in these regions (Figures 2C, D). The results also confirmed that the hydrogel microspheres (in this case, without Caco2 cells) effectively deflected the convective flow and enhanced the dispersion of the doxorubicin within the chip. Image analysis showed that a steady concentration of doxorubicin is reached in approximately 10–12 h in the central location of the chip (i.e., where the sensor was placed) at the flow rate tested (Figures 2B, C). As expected, the results also show that the chip environment is not completely homogeneous, and that the concentration of doxorubicin reaches its highest value in the central location (Figures 2C, D).
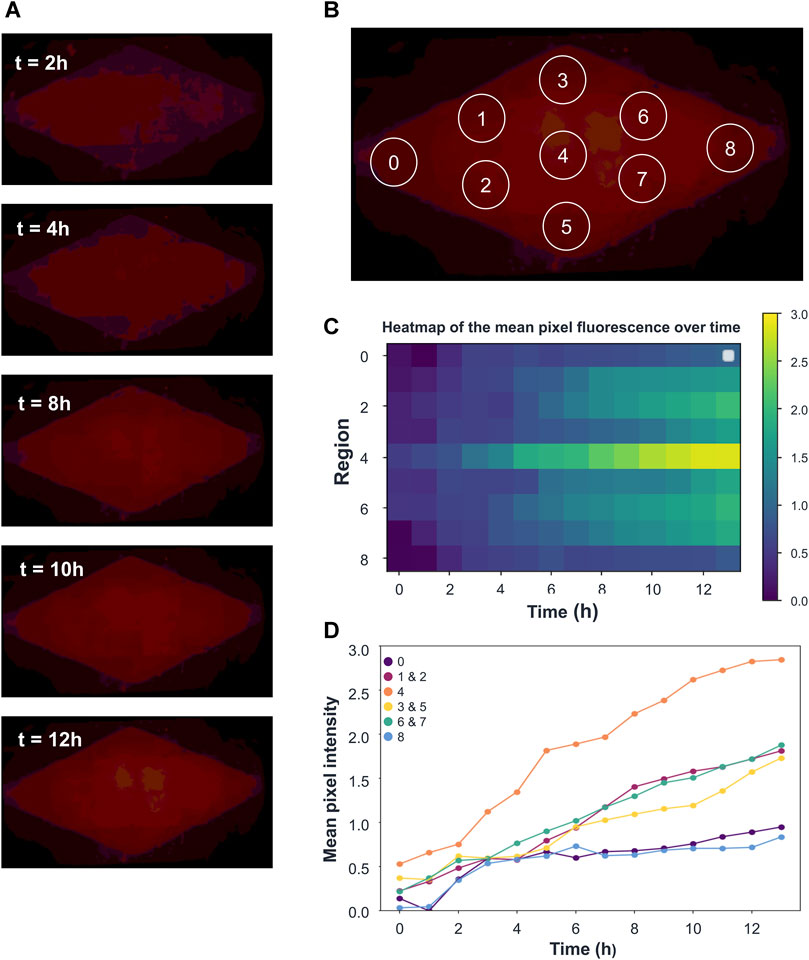
FIGURE 2. On-chip transport of a fluorescent tracer. (A) Evolution of the on-chip fluorescence caused by the perfusion of doxorubicin, as recorded using a fluorescence microscope. (B) The chip was divided into 9 different zones to evaluate the mean fluorescence intensity at different time points. (C) Heatmap describing the evolution of fluorescence at each zone in every time point. (D) Image analysis quantification of the increase in mean fluorescence intensity in the 9 regions of the chip during 12 h of perfusion with doxorubicin.
Here, we used doxorubicin as a model molecule to show the distribution profiles developed in the chip, as well as the existence of heterogeneity, at a particular flow. The results from our doxorubicin experiments cannot be generalized to other molecules, as every molecule will exhibit its own different on-chip transport properties (i.e., diffusivity coefficient), which will depend mainly on size and polarity. In addition, the absolute value of the local concentrations during transients and at the steady state will depend on the operating conditions (mainly the flow rate and microbead packing densities) (Figure 1D). However, the heterogeneity assessed by using doxorubicin as a tracer is expected to be representative for any molecule, and these experiments reveal that higher concentrations of an added molecule will be found along the central section of the chip. Therefore, measuring the concentration of glucose in the central zone of the chip should provide reliable information regarding the highest concentration present in the system.
After mixing characterization, we performed a set of experiments to validate the time-dependent calibration and accuracy of the Freestyle® sensor on chip. For that, we filled the chip with GelMA/alginate beads without cells. We then prepared glucose solutions at different concentrations within the experimental range foreseen to be used in the cell culture experiments (60–110 mg dL−1). We successively fed these glucose solutions to the chip at a flow rate of 8 μL min−1, from high to low concentrations, until different steady states were reached (i.e., until a constant sensor glucose reading was achieved).
In Figure 3A, we show representative inline glucose readings during experiments. In this illustrative case, a glucose solution with a concentration of 80 mg dL−1 was fed to the chip, leading to the attainment of a first steady state at t = 136 h. The sensor reports a consistent average concentration of 80.93 ± 0.93 mg dL−1 during the subsequent 8 h (Figure 3Bi) . Then, the glucose concentration is changed to 70 mg dL−1, resulting in the establishment of a new steady state at t = 163 h. During the subsequent 10 h, the sensor maintains a stable average concentration of 72.81 ± 0.48 mg dL−1 (Figure 3Bii) .
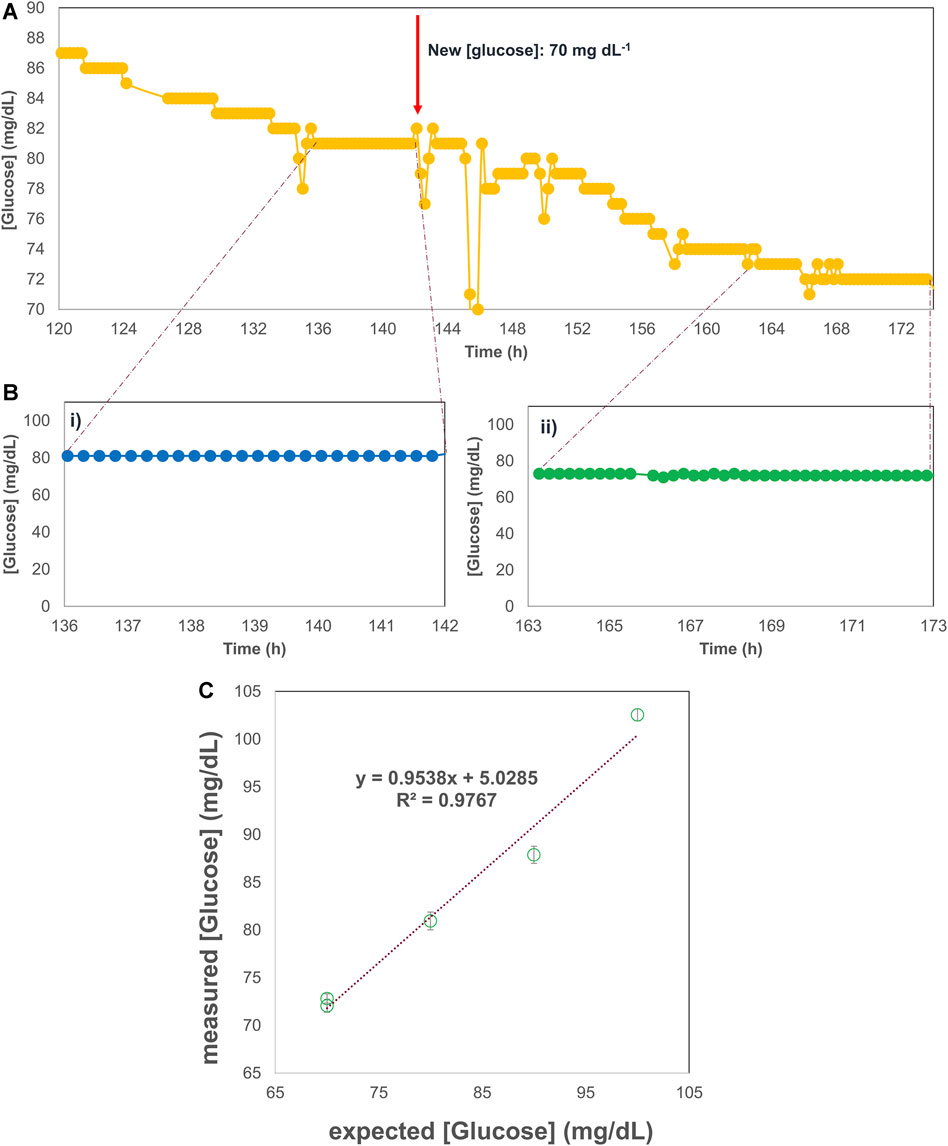
FIGURE 3. Validation of the time-dependent calibration and accuracy of the Freestyle® sensor. (A) Evolution of the glucose concentration in a representative period (52 h) of long-term on-chip experiment (10 days) using hydrogel microbeads without cells. A glucose solution with a concentration of 80 mg dL−1 was fed to the chip, leading to the attainment of a first steady state at t = 136 h. Then, the glucose concentration is changed to 70 mg dL−1, resulting in the establishment of a new steady state at t = 163 h. (B) In-line glucose readings during two different steady states. (i) The sensor reports a consistent average concentration of 80.93 ± 0.93 mg dL−1 during 8 h (ii) The sensor maintains a stable average concentration of 72.81 ± 0.48 mg dL−1 during 10 h. (C) Correlation between the expected values of glucose concentrations and the readings obtained from the sensor at successive steady states obtained by feeding glucose solutions at different concentrations (i.e., 100, 90, 80, and 70 mg dL−1). Error bars based on standard deviations.
In addition, we produced a correlation between the expected values of glucose concentrations and the readings obtained from the sensor at successive steady states. We observed a high linear correlation value (i.e., r2 = 0.97) in the range of 100 to 60 mg dL−1 (Figure 3C).
This entire set of experiments lasted for at least 10 days with each sensor. During this time, the accuracy of the sensor remained within 1% of the average glucose reading at the steady state (i.e., the coefficient of variation was lower than 1%). In addition, we observed an average deviation of less than 1% with respect to the true glucose concentration (i.e., we observed an average deviation of 1.01 mg dL−1 and a standard deviation of 0.02 mg dL−1) throughout different steady states.
Then, we conducted a first set of extended culture experiments. As stated before, we installed the Freestyle® sensor in the chip to continuously measure the glucose concentration in the bulk culture media perfused to continuously supply nutrients to the cells to promote their proliferation. Figure 4A shows the evolution of the on-chip glucose concentration during a culture period of 14 days. We established different on-chip residence times by varying the inlet flow rate. For instance, during the first period of 9 days, we perfused culture media at a flow rate of 3.82 μL min−1. Assuming a packing factor of 0.634, which corresponds to a situation of loosely packed spheres in a volumetric space, the effective volume in our chip after filling was ∼5.0 mL (i.e., 0.4965 mL). Therefore, the hydraulic residence time on the chip for this flow rate of 3.82 μL min−1 was approximately 2.16 h. Note that for these flow rate conditions, a steady-state concentration was reached after nearly 180 h of perfusion (Figure 4Ai). During the next 12 h, the glucose concentration varied within 1% of the average value (Figure 4Aii). This suggests that the entire living system had reached a metabolic steady state. Figure 4Aii shows the evolution of the deviation with respect to the local average for the glucose readings. Monitoring this value allowed us to quantitatively establish whether a steady state had been reached. At t = 192 h, we established a new flow rate of 7.64 μL min−1 (Figure 4Ai). From that time point, the glucose concentration readings slowly migrated to an asymptotic value of 74 mg dL−1. From t = 250 h to t = 300 h, the glucose concentration remained steady (1% variation with respect to the mean value), indicating that a new steady state had been achieved (Figure 4Aii).
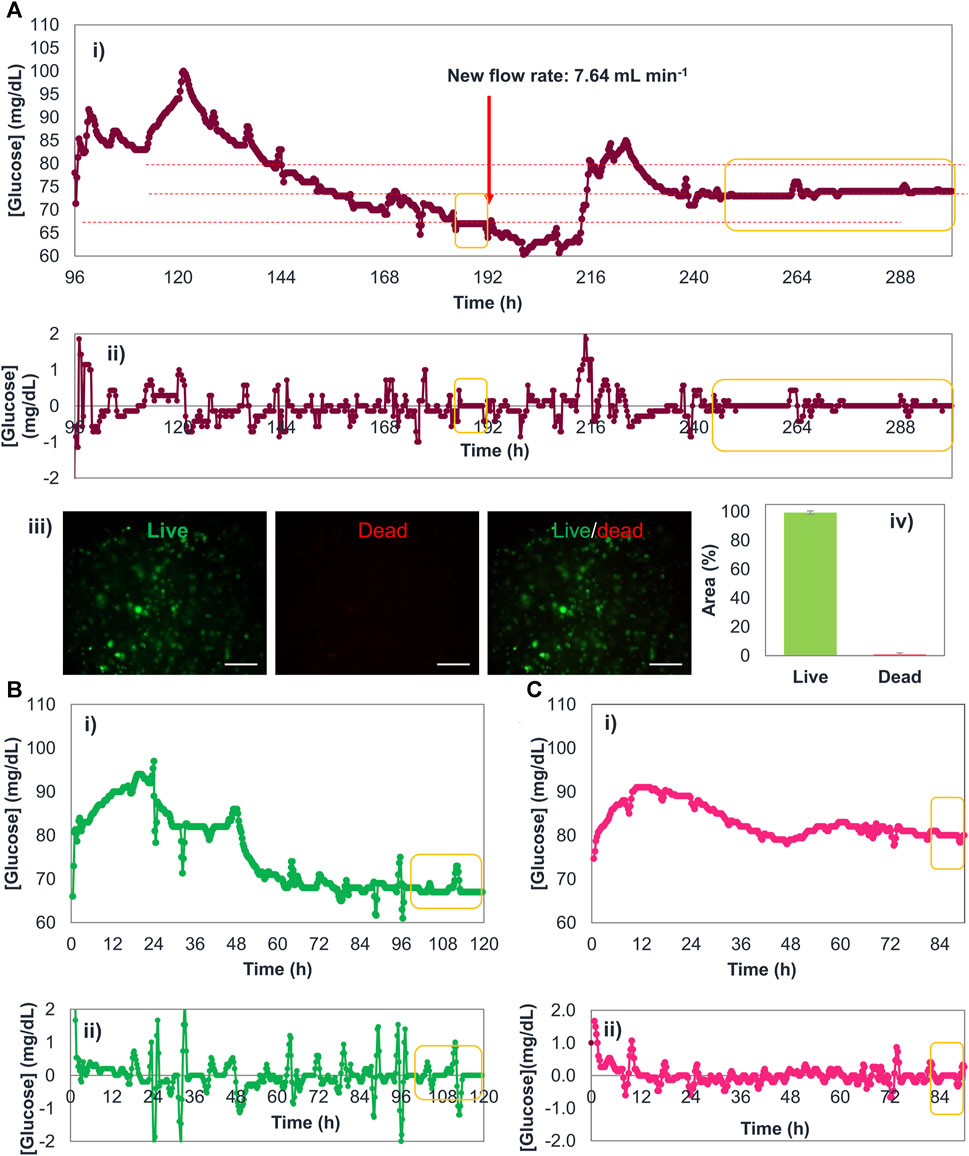
FIGURE 4. Continuous glucose measurements in tumor-on-chip (ToC) devices. (A) Evolution of the glucose concentration in a long-term on-chip culture experiment. A flow rate of 3.82 μL min−1 was established at the beginning of the experiment. Later, at t = 200 h, the flow rate was adjusted to 7.64 μL min−1. (i) Changes in glucose concentration were continuously recorded in real time using a Freestyle sensor throughout the 14 days of on-chip culture, and (ii) the analysis of the variations in glucose concentration measurements, as continuously reported by the sensor, enabled the identification of steady states. (iii) Caco2 cells displayed high cell viability after 14 days of culture (iii). (B) Continuous glucose concentration readings in a second ToC device, perfused at 3.82 μL min−1, and analysis of the variations in glucose concentration measurements to identify steady states. Two additional experiments of continuous perfusion (B,C) were conducted in distinct ToCs operated at 3.82 μL min−1: Plots represent the (i) continuous glucose concentration readings in the second and third devices and (ii) the analysis of the variations in glucose concentration measurements to identify steady states.
We also assessed the on-chip viability using Live/dead staining and image analysis techniques. After 14 days of continuous culture, we found high values of viability (between 96% and 99% in samples taken from different zones of the chip) (Figure 4Aiii). This high viability suggests that the prevailing on-chip conditions at the two flow rates tested supported the long-term survival of Caco2 cells encapsulated in alginate/GelMA.
The continuous glucose readings provide valuable inline information regarding the overall metabolic state of the chip and can be later correlated with off-chip assessments. For example, in this case, the high glucose consumption 0.66 mg dL−1 min−1 can be associated with high viabilities (i.e., ∼100%).
We also conducted replicate experiments using two additional chips (Figures 4B, C). With these chips, our aim was to reproduce the conditions of the first chip in terms of seeding density, microsphere packing, and flow rate. Reproducing these three variables is challenging due to the intrinsic variability of the biofabrication of the microspheres and the packing process. Therefore, variations in the glucose concentrations were anticipated during the transient periods and the steady states. Indeed, slightly different glucose concentrations were achieved at each of the steady states. In the first chip, we observed a glucose concentration of 74 mg dL−1 at a steady state induced by perfusing culture media at 3.82 μL min−1 (Figure 4B). At the same flow rate, we observed steady state concentrations of 67 and 80 mg dL−1 for the second and third chips, respectively (i.e., a variation of ± 7 mg dL−1). These results suggest that, for experiments conducted at the same flow rate, slight variations in the fabrication of the microspheres (i.e., variations in the cell seeding density or the metabolic state of the cells at seeding), or their loading into the chip (i.e., the number of microspheres placed in the chip and the packing of microspheres) may lead to different glucose concentrations at the steady state. In addition, we observed variations of less than 2% (with respect to the mean value of glucose concentration) during steady states (Figures 4A–Cii). This suggests that the glucose readings were remarkably stable.
Overall, the glucose concentration reached at the steady state may be a good indicator of the overall metabolic status and the number of live cells within the chip. The strategy of inline glucose measurements was complemented by other relevant on-chip assessments.
The continuous measurement of glucose concentrations in organ-on-chips enables a real-time assessment of chemical or physical changes in the cell microenvironment within the chip.
As an example, we studied the effect of a pulse of pyruvate and two periods of continuous addition of insulin in our colorectal cancer-on-chip system. After establishing a steady state glucose concentration of ∼80 mg dL−1 using a flow rate of 3.82 μL min−1, we first added pyruvate dissolved at 1.1 mg mL−1 into the feeding stream of culture medium. Figure 5 shows that the glucose concentration in the central zone of the chip started to decrease, in essentially a linear fashion, after the pyruvate pulse. A new steady state was reached after ∼50 h at a lower glucose concentration (i.e., 74 mg dL−1). After a period of 20 h at steady state, a continuous perfusion of culture medium containing 100 mg mL−1 insulin was initiated. Soon after the start of insulin infusion (i.e., less than one residence time), and over a period of 8 h, the glucose concentration readings decreased with a faster slope (i.e., 1.625 mg dL−1 h−1) than had been observed after the pyruvate pulse (i.e., 0.146 mg dL−1 h−1). A new steady state was reached after about 48 h of continuous insulin perfusion. Remarkably, the glucose concentration at this new steady state (i.e., ∼60 mg dL−1) was much lower than had been observed before insulin perfusion (i.e., ∼70 mg dL−1). This suggests that insulin supplementation has the important effect of increasing the glucose uptake by on-chip–cultured Caco2 cells.
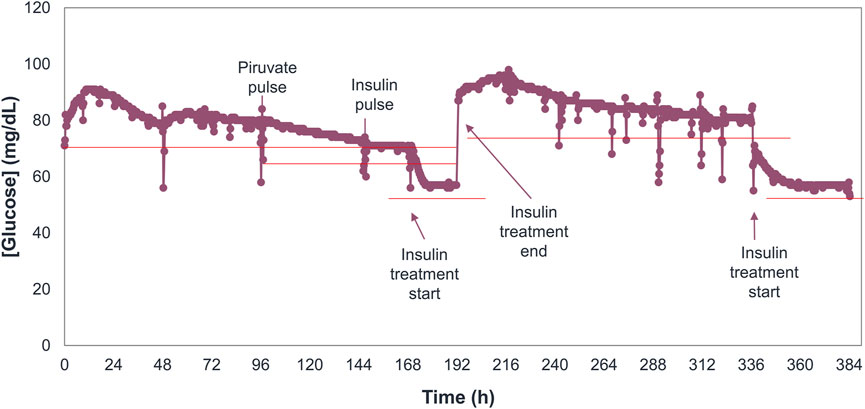
FIGURE 5. On-chip effects of pyruvate and insulin treatment on Caco2 microspheres. Continuous and inline determinations of glucose concentrations in a long-term culture experiment (14 days) in which Caco2 microspheres were exposed to pyruvate and insulin treatments and distinct steady states were achieved after each treatment.
Figure 5 also shows that, after insulin perfusion ceased, a new steady state was achieved after approximately 100 h of continuous feeding with culture medium without insulin. Note that this recovery time is consistent with the times needed to achieve a steady state in our first set of experiments at the same medium flow rate (i.e., in the range of 90–120 h). The glucose concentration observed at this new steady state, achieved after the cessation of insulin treatment, was ∼80 mg dL−1. This value is consistent with the original steady state originated by a flow rate of 7.64 μL min−1 of naïve culture medium. Using the same chip, we repeated the treatment of continuous insulin perfusion and observed similar trends of decay in glucose concentrations. Remarkably, approximately the same glucose concentration was achieved at both steady states associated with continuous insulin perfusion.
Overall, the results derived from the experiments using additions of pyruvate and insulin demonstrate that the inline monitoring of on-chip glucose concentrations enables the rapid and simple determination of the effect of chemical insults (pulses or continuous perfusion). Moreover, the effect of any chemical stimulus can be quantified by determining the slope of the decay (or increase) of the glucose concentration and/or the differences in glucose concentration between the steady state that preceded the stimulus and the steady state achieved after the stimulus.
We conducted an additional set of on-chip experiments to demonstrate the inline and continuous monitoring of glucose concentration during on-chip anti-cancer drug testing. We first established a steady state in our colorectal tumor-on-chip using a flow rate of 3.82 μL min−1. We then applied a regimen of continuous on-chip perfusion of 10 mM 5-fluorouracil (5-FU), an anti-cancer compound frequently used to treat colorectal cancer (Vodenkova et al., 2020). The 5-FU treatment was expected to induce cell death (or at least cell damage) in the Caco2 culture. Therefore, the overall glucose consumption on-chip was expected to decrease due to the decrease in metabolic activity in the chip in response to the anti-cancer treatment.
Indeed, the glucose concentration started to increase soon after the initiation of 5-FU perfusion, suggesting that the anti-cancer compound was killing or compromising the metabolic activity of the Caco2 cells (Figure 6A). We then simulated an intravenous infusion for 2 days (a commonly used administration strategy for this pharmaceutical compound) by discontinuing the on-chip perfusion of 5-FU after 48 h. Soon thereafter, the on-chip glucose concentration, as reported by the Freestyle® sensor, started to decrease. This indicated a recovery of the metabolic activity of the cells in the chip and/or a proliferation of the cells that had survived the 5-FU treatment. One day after cessation of the first round of treatment, we initiated a second period of treatment with 5-FU. In this second round (again 48 h of continuous perfusion), we increased the 5-FU concentration 5-fold (i.e., from 10 to 50 nm). Interestingly, we did not observe any significant alteration in the glucose concentration readings in the following 24 h or after the interruption of the second round of treatment (Figure 6A). This suggests that the cells that survived the first round of treatment may have developed resistance to 5-FU treatment (Shao et al., 2023).

FIGURE 6. Effect of 5-FU on Caco2 microspheres. (A) Continuous and inline evaluation of glucose in a long-term on-chip experiment (14 days) in which Caco2 microspheres were sequentially treated with 5-FU at two different doses. (B) Cell survival of Caco2 microspheres cultured in the chip after treatment with 5-FU, as determined using Live/dead staining. (C) Immunostaining of relevant markers (Ki-67, HIF-1a, E-cad, N-cad) on Caco2 microspheres cultured for 14 days in chips treated with 5-FU or untreated controls. (D) Gene expression of relevant markers (Ki-67, HIF-1a, E-cad, N-cad) as determined by qPCR assays conducted on samples taken from chips perfused with 5-FU (dark purple bars) or untreated controls (medium purple bars). The basal expression of each gene at day 0 of culture is also shown (light purple bars).
According to live/dead assays, 95% of the on-chip cells were alive after this experiment of double infusion of 5-FU and a brief recovery of 1 day (Figure 6B). This is consistent with the hypothesis of the development of on-chip drug resistance. Indeed, several reports indicate that cancer cells may develop resistance to 5-FU (Blondy et al., 2020; Azwar et al., 2021; Sethy and Kundu, 2021); which is usually administered in combination with other drugs to enhance anti-cancer effects and avoid or minimize the development of drug resistance.
We also used immunostaining to explore the effect of this double round of on-chip 5-FU treatment in the presence of relevant cancer markers related to proliferation (i.e., Ki67) and hypoxia (i.e., HIF-1α). We collected microspheres from the chip exposed to two periods of 5-FU infusion. Samples were collected and analyzed 24 h after the suspension of the second round of treatment. Ki67 expression was lower in the samples collected from chips exposed to the 5-FU treatment than from chips not exposed to the anti-cancer treatment. However, we found similar levels of HIF-1α expression in samples from both chip groups (Figure 6C). Notably, increased Ki67 expression has been related to poor outcomes in colorectal cancer patients (Luo et al., 2019), and its expression has been observed in cancer cells inside ToC devices, indicating that perfusion culture enhances cellular proliferation activity (Nashimoto et al., 2020). In addition, HIF-1a has been related to the epithelial-to-mesenchymal transition (EMT) and a poor prognosis in colorectal cancer patients since it promotes the proliferation and migration of cancer cells (Peng et al., 2018).
We also analyzed the expression of E-cadherin and N-cadherin (markers associated with migration and invasiveness) in samples derived from the 5-FU–treated chip and untreated controls. N-cadherin is widely expressed in colorectal cancer cell lines, and it has been correlated with lower survival rates in patients with colorectal cancer (Yan et al., 2015). Interestingly, we found that the E-cadherin expression levels were similar in microspheres collected from treated and untreated chips. However, N-cadherin levels were much lower in microspheres collected from chips recovered form FU-treatment than in samples from untreated chips (Figure 6C). Overall, these results suggest that the cells that survived the first round of 5-FU infusion on-chip were able to develop a certain level of resistance to this anti-cancer compound and were able to survive a second round of 5-FU infusion, even at a much higher concentration. The surviving cells were able to repopulate the chip rapidly. Therefore, the observed levels of viability, hypoxia, and E-cadherin expression were similar in samples collected from the treated and untreated chips. However, 5-FU treatment compromised the level of proliferation and the production of N-cadherin (a marker of migration and the epithelial–mesenchymal transition).
We also used pPCR to quantify the expression of Ki67, HIF-1α, E-cadherin, and N-cadherin in microspheres from chips recovered from 5-FU treatment and from untreated controls (Figure 6D). In agreement with the immunostaining results, the expression levels of Ki67 and N-cadherin were significantly lower in cells recovered from 5-FU treatment than in untreated controls, and the expression of HIF-1α was similar in the treated and untreated chips.
The continuous inline monitoring of glucose, the main carbon source in mammalian cell cultures, is highly relevant in cell and tissue culture applications. In addition, it could provide valuable information regarding the dynamics of a tissue bioreactor, which is challenging to obtain offline. We integrated a commercial glucose sensor into a 3D-printed colorectal-on-chip and demonstrated its use in monitoring the evolution of glucose concentration changes in real time in cell culture bioreactors. Using this simple strategy, we were able to identify the timeframe in which the cells/tissues cultured inside the chip achieve a steady state of glucose consumption. In turn, this strategy enables the assessment of the effects of different treatments and pulses applied to the cultured cells (i.e., responses to insulin or chemotherapeutic drugs). This provides the possibility of modulating the conditions inside the device and observing the effects in a practical fashion in real time. In a series of experiments using our simplified colorectal cancer millifluidic system, we demonstrated that different flow rates (and, consequently, different residence times) induce the culture system to achieve different steady states. By continuously monitoring the on-chip glucose concentrations, we also investigated the effects of pulses of pyruvate and insulin and sustained perfusion of insulin in colorectal cancer cells. The advantages of real-time glucose concentration quantification were also illustrated in experiments in which colorectal cancer cells were exposed to a treatment regimen with 5-FU consisting of two rounds of on-chip perfusion at two different concentrations. In these experiments, the inline monitoring of glucose concentrations became a valuable tool that identified trends in glucose uptake that were consistent with the generation of drug resistance in the population of cells that survived the first therapeutic regimen. The observation of this type of pattern would have been challenging in the absence of a strategy for the real-time evaluation of glucose concentrations.
We anticipate that the simple strategy presented here, based on a commercially available glucose sensor, will facilitate a wide range of cell and tissue culture experiments by providing a cost-effective means of sensing the overall metabolic state of cell culture systems in real time.
In the experiments reported here, we used a 3D-printed tumor-on-chip (ToC) device to house cell-laden microspheres and enable the continuous perfusion of culture medium (or culture medium containing anti-cancer drugs) through them. The device consists of a rhomboid culture chamber with inlet and outlet ports connected to silicon tubing. The chip was based on our previous design (Sánchez-Salazar et al., 2023), with minor modifications. The new design has a chamber depth of 7 mm and is larger in total volume (∼1.36 mL) (Figure 1). The chip was 3D-printed with clear resin (FormLabs, Somerville, MA, United States) in a stereolithographic 3D printer (Form 3, FormLabs, Somerville, MA, United States).
The rhomboid chamber was filled with hydrogel microspheres (their fabrication is described in the following “Microsphere fabrication” section). The chip is built to hold a transparent lid that is secured by screws and nuts and has a rubber O-ring to prevent liquid leaks. The use of an acrylic lid and transparent resin allows the passage of light and visualization of the interior of the culture chamber. The configuration and dimensions of the chip are detailed in Figure 1A. To perfuse culture media, we connected soft transparent tubing (MasterFlex, Zapopan, JAL, Mexico) to the inlet and outlet ports.
The inlet tubing was connected to a syringe containing culture medium, while the outlet tubing was connected to a 15 mL tube for collection of the waste medium. The syringe was placed in a syringe pump to provide a continuous flow of 3.82 μL min−1.
Hydrogel microspheres were fabricated using a mix of gelatin-methacryloyl (GelMA) (Yue et al., 2015; Tavares-Negrete et al., 2022) and alginate (Sigma-Aldrich, St. Louis, MO, United States). Briefly, GelMA with a high degree of methacrylation was prepared (Tavares-Negrete et al., 2022) by dissolving GelMA in Dulbecco’s Phosphate Buffered Saline (DPBS) at 5% (w/v), together with lithium phenyl-2,4,6-trimethylbenzoylphosphinate (LAP) at 0.2% (w/v) as a photoinitiator, for 20 min at 70°C. The GelMA was filtered throughout a 0.22 µm filter and kept at 4°C until use. Alginate was prepared in DPBS at a 3.5% (w/v) concentration by agitation at 40°C for 1 h. To fabricate hydrogel microspheres without cells, we mixed 5% GelMA pregel and 3.5% alginate at a 1:1 ratio to obtain final concentrations of 2.5% GelMA and 1.75% alginate.
To prepare cell-laden microspheres, Caco2 cells were resuspended in the GelMA/alginate pregel at a final cell density of 1.5 × 10⁶ cells/mL. This suspension was dripped through a 27G tip at a flow rate of 3 mL/min using a syringe pump. To crosslink the alginate, the drops were received in a 4% calcium chloride solution supplemented with 12 g/L Tween 20 at 4°C. For this, the distance between the tip and the bath was set at 15 cm to allow the formation of hydrogel microspheres. The spheres were kept at 4°C for 5 min and then exposed to UV light (OmniCure S1500, Mississauga, Ontario, Canada) at 365 nm for 35 s and a distance of 15 cm to photocrosslink the GelMA. The Caco2-loaded spheres were washed three times with PBS, placed in 6-well culture plates, and cultured in Eagle’s Minimum Essential Medium (EMEM) for 24 h to allow them to stabilize.
We characterized the efficiency of the convective/diffusive transport efficiency within the rhomboidal chips using 12.8 μM doxorubicin dissolved in EMEM (used to provide conditions similar to those used during on-chip culture). We continuously pumped the doxorubicin in EMEM through the chips at a flow rate of 1 μL min−1 (Figure 2A). In preliminary experiments, we also compared the diffusive transport between chips with rectangular or rhomboidal culture chambers and those filled with hydrogel microspheres.
Diffusion experiments were conducted under an inverted microscope configured to capture frames of the culture chamber under fluorescence LED illumination (the 2-dodecylresorufin channel) every half hour for 12 h in overnight experiments. As a protocol, all pictures were taken with a 90% LED intensity and 500 ms exposure time. The resulting time series, consisting of images taken each hour since hour 0 (12 pictures in total), were analyzed using ImageJ software (NIH, Bethesda, MD, United States) without color correction of the doxorubicin fluorescence. We obtained the average fluorescence intensity in nine different regions of the rhomboid chamber (Figure 2B) by considering five squares 45,000 pixels in area. The data acquired at each measuring square were the mean local pixel fluorescence every hour. The mean of the 5 different squares in each area was obtained at each time point using the Python programming language (Wilmington, DE, United States).
Due to symmetry considerations, the intensities calculated in the analogous regions of the chip above and below the central axis were averaged to calculate and plot only six fluorescence profiles. The regions that were averaged were the top inlet and bottom inlet [to calculate the center-inlet (CI) value], the top corner and bottom corner [to calculate the center corner (CC) value], and the top outlet and bottom outlet [to calculate the center-outlet (CO) value]. We therefore reported the average fluorescence value for the following six regions in each chip configuration: inlet (I), center-inlet (CI), center corners (CC), center (C), center-outlet (CO), and outlet (O). The average pixel intensity for the fluorescence at each hour was used to plot the evolution of the fluorescence at each region. Heatmaps were further developed using Python programming and picture editing software (Clip Studio Paint, Tokyo, Japan; Procreate, Tasmania, Australia).
Caco2 cells were cultured in EMEM (Sigma-Aldrich, St. Louis, MO, United States) supplemented with 10% fetal bovine serum (FBS) and 1% penicillin-streptomycin. The cells were incubated at 37°C in a 5% CO2 atmosphere and 100% humidity for maintenance culture and for experiments. For passaging, the cells were detached with 0.25% trypsin/0.53 mM EDTA and a 0.4% trypan blue solution was used (in 1:1 ratio) for counting and estimation of cell viability (Strober, 2015).
To assemble the chip system, we sterilized the mini-reactors by immersion in 70% ethanol and exposure to UV light for 15 min. The acrylic lids were cleaned with benzalkonium chloride (Lysol) and further sterilized under UV light for 15 min. The hoses, waste tubes, screws, and nuts were sterilized in an autoclave for 15 min at 121°C. The Caco2 microspheres were retrieved from culture plates using a sterile spatula and placed in the culture chamber of the chip. We then placed and secured the lids with screws and nuts, connected syringes with culture media to the inlet, and attached waste tubes to the outlet using sterile tubing (MasterFlex 96400-14). We then filled the reservoirs with culture medium, loaded the syringes in a syringe pump (IPS-14RS, Inovenso, Boston, MA, United States), placed the chip and the pump inside the incubator, and set the perfusion flow rate at 1 μL min−1 for drug diffusion experiments and 3.82 μL min−1 for culture experiments.
We integrated the FreeStyle glucose sensor with the in-chip system by first sterilizing the chip by immersion in 70% ethanol and then exposing it to UV light for 15 min in a laminar hood. The chip was then washed with sterile PBS to remove residual ethanol. We placed the microspheres in the chip using a sterile spatula and filled the reservoir without overflowing. We then placed the FreeStyle® Libre Sensor on top of the chip and used silicone and Teflon to secure it and avoid leakage. The final chip setup was completed as stated in the section “Chip design and fabrication.” The chips were placed in a CO2 incubator and culture medium was pumped at a flow of 3.82 μL min−1 or 7.64 μL min−1.
We continuously measured the glucose concentration in the bulk of the liquid within the chip using the integrated FreeStyle® commercial glucometer (Freestyle® Libre 3). Glucose concentrations were continuously measured inline on a cellphone using the FreeStyle® LibreLink app for Android, with measurements recorded every 8 h.
The cell viability of the on-chip cultures was assessed using Live/dead staining techniques and the LIVE/DEAD™ Cell Imaging Kit (ThermoFisher, United States) according to the manufacturer’s instructions. We obtained fluorescence images using an Axio Observer. Z1 microscope (Zeiss, Oberkochen, Germany). Reconstructed micrographs were acquired with the microscope software (Zen Blue Edition, Zeiss, Oberkochen, Germany). Live/dead images were analyzed using ImageJ software (NIH, Bethesda, MD, United States) by measuring the fraction of the area occupied by live cells (i.e., cells stained in green) or dead cells (i.e., cells stained in red) in randomly selected microspheres in each experiment. For each experimental image, the mean area was obtained, and then the percentage of live and dead cells was calculated.
We assessed the response of on-chip Caco2-loaded microspheres to 1.1 mg/mL pyruvate and 100 or 140 mg/mL insulin with a single device. To do this, we first filled the chip culture chambers with Caco2-loaded microspheres and perfused them with EMEM for 3 days. After this on-chip stabilization period, we perfused the chips with EMEM + 1.1 mg/mL pyruvate for 48 h. We then changed the perfusion back to EMEM for 2 days. We later applied an insulin pulse of 140 mg/mL for 1 h to simulate postprandial conditions and changed the perfusion back to pristine EMEM for 24 h. Subsequently, we applied a first treatment with 100 mg/mL insulin in EMEM for 24 h to observe the metabolic changes in the Caco2 cells. After removing the insulin treatment, we perfused EMEM for 8 days to let the cells restabilize, applied a new insulin treatment for 48 h, and then ended the experiment.
We assessed the response of Caco2-loaded microspheres to 10 mM 5-fluorouracil (5-FU) on-chip. For that, we first filled Caco2-loaded microspheres in the chip culture chambers and perfused them with EMEM for 5 days. After this on-chip stabilization period, we perfused the chips with EMEM + 10 mM 5-fluorouracil (5-FU) for 46 h to emulate an intravenous dosage of 5-FU chemotherapy. Then, we changed the perfusion back to EMEM for 3 days. We later perfused EMEM + 50 mM 5-FU again for 46 h to emulate a second dose of drug and finally perfused EMEM for the rest of the experiment. We performed live/dead staining and qPCR on the Caco2 microspheres to evaluate survival and relevant marker expression at the end of the experiment.
We took samples of the microspheres of each chip, placed them into 1.5 mL Eppendorf tubes, and washed them first with 4% (w/v) calcium chloride to preserve the structure and then with PBS to remove remaining culture media. We then fixed the samples with 4% (w/v) paraformaldehyde for 30 min at room temperature. We removed the fixation solution and washed the samples once with 4% calcium chloride and twice with PBS. We then permeabilized the samples with 0.5% (v/v) Triton X-114 in PBS for 45 min at room temperature. We later removed the permeabilization solution and washed the microspheres once with 4% calcium chloride and once with PBS. We removed the PBS, added the blocking solution [5% (w/v) BSA, 0.3 M glycine, and 0.5% (v/v) Triton x-114 in PBS] and incubated the samples overnight at 4°C. We prepared four different primary antibodies (anti-Ki-67, anti-HIF-1α, anti-E-cadherin, and anti-N-cadherin) in the blocking solution with a 1:75 concentration and added them to the samples. The samples were incubated overnight at 4°C. We prepared the secondary antibody (donkey anti-mouse, Abcam, Boston, MA, United States) in the blocking solution with a 1:200 concentration. We washed the samples three times with the washing solution [0.2% (v/v) Triton x-114% and 0.04% (v/v) Tween 80 in PBS], added the secondary antibody solution, and incubated them overnight at 4°C. We removed the secondary antibody and washed the samples two times with the washing solution for 10 min. DAPI was added at a concentration of 3:1000 in the washing solution and incubated for 1 h at 37°C to counterstain the nuclei. Finally, we washed the samples twice for 10 min with the washing solution and left them in the same solution overnight at 4°C before microscopy.
All microscopy was done with an Axio Observer. Z1 microscope (Zeiss, Oberkochen, Germany) equipped with Colibri.2 LED illumination and an Apotome.2 system (Zeiss, Oberkochen, Germany). Normal imaging of the microspheres was obtained with the Brightfield channel. Fluorescence images for immunostaining were obtained with the DAPI and FITC channels. Fluorescence images for the Live/Dead were obtained with the red EtHD1 and AF594 channels and the green FITC channel.
The original contributions presented in the study are included in the article/Supplementary material, further inquiries can be directed to the corresponding authors.
MS-S: Investigation, Data curation, Formal Analysis, Methodology, Writing–original draft. RG-G: Investigation, Writing–original draft, Software. RC-L: Data curation, Investigation, Software, Writing–original draft. VJ-F: Investigation, Writing–original draft. SG-M: Investigation, Methodology, Writing–original draft. SR-M: Investigation, Writing–review and editing. MV-V: Investigation, Writing–review and editing. GT-dS: Conceptualization, Formal Analysis, Funding acquisition, Methodology, Project administration, Resources, Supervision, Writing–original draft, Writing–review and editing. MMA: Methodology, Conceptualization, Data curation, Formal Analysis, Funding acquisition, Project administration, Resources, Supervision, Writing–original draft, Writing–review and editing.
The author(s) declare financial support was received for the research, authorship, and/or publication of this article. MS-S and SG-M gratefully acknowledge financial support granted by CONACyT (Consejo Nacional de Ciencia y Tecnología, México) in the form of the Graduate Program Scholarships (Grant CVU 605240 and CVU 814051, respectively). GT-dS and MMA gratefully acknowledge funding from Fundación Biocodex México (Grant MX 2019) and the Worldwide Universities Network (WUN) (Grant WUN Research Project 2023). MMA and GT-dS acknowledge funding provided by CONACyT in the form of Scholarships as members of the National System of Researchers (grant SNI 26048 and SNI 256730). This research was partially funded by Tecnológico de Monterrey and Fundación FEMSA (Grant No. 2022-2023).
We gratefully acknowledge the experimental contributions of María Elena Domínguez-Villaseñor, Claudia Maribel Luna-Aguirre, and Sara Cristina Pedroza-González, Óscar Emmanuel Solís-Pérez. We gratefully acknowledge the support kindly provided by Santa Cruz Biotechnology Inc. in the form of free antibody samples.
The authors declare that the research was conducted in the absence of any commercial or financial relationships that could be construed as a potential conflict of interest.
All claims expressed in this article are solely those of the authors and do not necessarily represent those of their affiliated organizations, or those of the publisher, the editors and the reviewers. Any product that may be evaluated in this article, or claim that may be made by its manufacturer, is not guaranteed or endorsed by the publisher.
Afeef, S., Tolfrey, K., Zakrzewski-Fruer, J. K., Barrett, L. A., Afeef, S., Tolfrey, K., et al. (2023). Performance of the FreeStyle Libre flash glucose monitoring system during an oral glucose tolerance test and exercise in healthy adolescents. Sensors 23, 4249. doi:10.3390/S23094249
Avari, P., Tang, W., Jugnee, N., Hersi, I., Al-Balah, A., Tan, T., et al. (2023). The accuracy of continuous glucose sensors in people with diabetes undergoing hemodialysis (ALPHA study). Avaliable at: https://home.liebertpub.com/dia.
Azizgolshani, H., Coppeta, J. R., Vedula, E. M., Marr, E. E., Cain, B. P., Luu, R. J., et al. (2021). High-throughput organ-on-chip platform with integrated programmable fluid flow and real-time sensing for complex tissue models in drug development workflows. Lab. Chip 21, 1454–1474. doi:10.1039/d1lc00067e
Azwar, S., Seow, H. F., Abdullah, M., Faisal Jabar, M., and Mohtarrudin, N. (2021). Recent updates on mechanisms of resistance to 5-fluorouracil and reversal strategies in colon cancer treatment. Biol. (Basel) 10, 854–934. doi:10.3390/biology10090854
Battelino, T., Alexander, C. M., Amiel, S. A., Arreaza-Rubin, G., Beck, R. W., Bergenstal, R. M., et al. (2023). Continuous glucose monitoring and metrics for clinical trials: an international consensus statement. Lancet Diabetes and Endocrinol. 11, 42–57. doi:10.1016/S2213-8587(22)00319-9
Blondy, S., David, V., Verdier, M., Mathonnet, M., Perraud, A., and Christou, N. (2020). 5-Fluorouracil resistance mechanisms in colorectal cancer: from classical pathways to promising processes. Cancer Sci. 111, 3142–3154. doi:10.1111/cas.14532
Chmayssem, A., Nadolska, M., Tubbs, E., Sadowska, K., Vadgma, P., Shitanda, I., et al. (2023). Insight into continuous glucose monitoring: from medical basics to commercialized devices. Microchim. Acta 190, 177–224. doi:10.1007/S00604-023-05743-W
Criscione, J., Rezaei, Z., Hernandez Cantu, C. M., Murphy, S., Shin, S. R., and Kim, D. H. (2023). Heart-on-a-chip platforms and biosensor integration for disease modeling and phenotypic drug screening. Biosens. Bioelectron. 220, 114840. doi:10.1016/J.BIOS.2022.114840
Dornhof, J., Kieninger, J., Muralidharan, H., Maurer, J., Urban, G. A., and Weltin, A. (2022). Microfluidic organ-on-chip system for multi-analyte monitoring of metabolites in 3D cell cultures. Lab. Chip 22, 225–239. doi:10.1039/d1lc00689d
Feldman, B., McGarraugh, G., Heller, A., Bohannon, N., Skyler, J., DeLeeuw, E., et al. (2004). FreeStyleTM: a small-volume electrochemical glucose sensor for home blood glucose testing. Avaliable at: https://home.liebertpub.com/dia.
Fuchs, S., Johansson, S., Tjell, A., Werr, G., Mayr, T., and Tenje, M. (2021). In-line analysis of organ-on-chip systems with sensors: integration, fabrication, challenges, and potential. ACS Biomater. Sci. Eng. 7, 2926–2948. doi:10.1021/ACSBIOMATERIALS.0C01110
Gallegos-Martínez, S., Lara-Mayorga, I. M., Samandari, M., Mendoza-Buenrostro, C., Flores-Garza, B. G., Reyes-Cortés, L. M., et al. (2022). Culture of cancer spheroids and evaluation of anti-cancer drugs in 3D-printed miniaturized continuous stirred tank reactors (mCSTRs). Biofabrication 14, 035007. doi:10.1088/1758-5090/AC61A4
Lim, J., Ching, H., Yoon, J. K., Jeon, N. L., and Kim, Y. T. (2021). Microvascularized tumor organoids-on-chips: advancing preclinical drug screening with pathophysiological relevance. Nano Converg. 8, 12. doi:10.1186/s40580-021-00261-y
Liu, X., Fang, J., Huang, S., Wu, X., Xie, X., Wang, J., et al. (2021). Tumor-on-a-chip: from bioinspired design to biomedical application. Microsystems Nanoeng. 7, 50. doi:10.1038/s41378-021-00277-8
Liu, X., Su, Q., Zhang, X., Yang, W., Ning, J., Jia, K., et al. (2022). Recent advances of organ-on-a-chip in cancer modeling research. Biosensors 12, 1045–1131. doi:10.3390/bios12111045
Luo, Z. W., Zhu, M. G., Zhang, Z. Q., Ye, F. J., Huang, W. H., and Luo, X. Z. (2019). Increased expression of Ki-67 is a poor prognostic marker for colorectal cancer patients: a meta analysis. BMC Cancer 19, 123–213. doi:10.1186/s12885-019-5324-y
Nashimoto, Y., Okada, R., Hanada, S., Arima, Y., Nishiyama, K., Miura, T., et al. (2020). Vascularized cancer on a chip: the effect of perfusion on growth and drug delivery of tumor spheroid. Biomaterials 229, 119547. doi:10.1016/j.biomaterials.2019.119547
Ngo, H., Amartumur, S., Tran, V. T. A., Tran, M., Diep, Y. N., Cho, H., et al. (2023). In vitro tumor models on chip and integrated microphysiological analysis platform (MAP) for life sciences and high-throughput drug screening. Biosensors 13, 231. doi:10.3390/bios13020231
Peng, J. K., Shen, S. Q., Wang, J., Jiang, H. W., and Wang, Y. Q. (2018). Ηypoxia-inducible factor 1-α promotes colon cell proliferation and migration by upregulating AMPK-related protein kinase 5 under hypoxic conditions. Oncol. Lett. 15, 3639–3645. doi:10.3892/ol.2018.7748
Pu, Z., Zou, C., Wang, R., Lai, X., Yu, H., Xu, K., et al. (2016). A continuous glucose monitoring device by graphene modified electrochemical sensor in microfluidic system. Biomicrofluidics 10, 011910. doi:10.1063/1.4942437
Sabaté del Río, J., Ro, J., Yoon, H., Park, T. E., and Cho, Y. K. (2023). Integrated technologies for continuous monitoring of organs-on-chips: current challenges and potential solutions. Biosens. Bioelectron. 224, 115057. doi:10.1016/J.BIOS.2022.115057
Sánchez-Salazar, M. G., Crespo-López Oliver, R., Ramos-Meizoso, S., Jerezano-Flores, V. S., Gallegos-Martínez, S., Bolívar-Monsalve, E. J., et al. (2023). 3D-Printed tumor-on-chip for the culture of colorectal cancer microspheres: mass transport characterization and anti-cancer drug assays. Bioengineering 10, 554. doi:10.3390/bioengineering10050554
Sethy, C., and Kundu, C. N. (2021). 5-Fluorouracil (5-FU) resistance and the new strategy to enhance the sensitivity against cancer: implication of DNA repair inhibition. Biomed. Pharmacother. 137, 111285. doi:10.1016/j.biopha.2021.111285
Shao, C., Yu, Y., Lei, X., Cao, J., Zhao, Y., and Ye, F. (2023). Organ-on-a-chip for dynamic tumor drug resistance investigation. Chem. Eng. J. 460, 141739. doi:10.1016/J.CEJ.2023.141739
Strober, W. (2015). Trypan blue exclusion test of cell viability. Curr. Protoc. Immunol. 111 (A3)–A3.B.3. doi:10.1002/0471142735.IMA03BS111
Subia, B., Dahiya, U. R., Mishra, S., Ayache, J., Casquillas, G. V., Caballero, D., et al. (2021). Breast tumor-on-chip models: from disease modeling to personalized drug screening. J. Control. Release 331, 103–120. doi:10.1016/J.JCONREL.2020.12.057
Tavares-Negrete, J. A., Pedroza-González, S. C., Frías-Sánchez, A. I., Salas-Ramírez, M. L., de Santiago-Miramontes, M. D. L. A., Luna-Aguirre, C. M., et al. (2023). Supplementation of GelMA with minimally processed tissue promotes the formation of densely packed skeletal-muscle-like tissues. ACS Biomater. Sci. Eng. 9, 3462–3475. doi:10.1021/acsbiomaterials.2c01521
Vodenkova, S., Buchler, T., Cervena, K., Veskrnova, V., Vodicka, P., and Vymetalkova, V. (2020). 5-fluorouracil and other fluoropyrimidines in colorectal cancer: past, present and future. Pharmacol. Ther. 206, 107447. doi:10.1016/J.PHARMTHERA.2019.107447
Wang, P., Wang, Y., and Qin, J. (2023). Multi-organ microphysiological system: a new paradigm for COVID-19 research. Organs-on-a-Chip 5, 100029. doi:10.1016/J.OOC.2023.100029
Weltin, A., Slotwinski, K., Kieninger, J., Moser, I., Jobst, G., Wego, M., et al. (2014). Cell culture monitoring for drug screening and cancer research: a transparent, microfluidic, multi-sensor microsystem. Lab. Chip 14, 138–146. doi:10.1039/c3lc50759a
Yan, X., Yan, L., Liu, S., Shan, Z., Tian, Y., and Jin, Z. (2015). N-cadherin, a novel prognostic biomarker, drives malignant progression of colorectal cancer. Mol. Med. Rep. 12, 2999–3006. doi:10.3892/mmr.2015.3687
Yue, K., Trujillo-de Santiago, G., Alvarez, M. M., Tamayol, A., Annabi, N., and Khademhosseini, A. (2015). Synthesis, properties, and biomedical applications of gelatin methacryloyl (GelMA) hydrogels. Biomaterials 73, 254–271. doi:10.1016/j.biomaterials.2015.08.045
Zhang, Y. S., Aleman, J., Shin, S. R., Kilic, T., Kim, D., Mousavi Shaegh, S. A., et al. (2017). Multisensor-integrated organs-on-chips platform for automated and continual in situ monitoring of organoid behaviors. Proc. Natl. Acad. Sci. U. S. A. 114, E2293–E2302. doi:10.1073/pnas.1612906114
Keywords: organ-on-chip, tumor-on-chip, continuous, glucose, glucose sensor, inline
Citation: Sánchez-Salazar MG, Garza-Garza R, Crespo-López Oliver R, Jerezano-Flores VS, Gallegos-Martínez S, Ramos-Meizoso S, Verduzco-Valenzuela M, Trujillo-de Santiago G and Alvarez MM (2024) Continuous inline monitoring of glucose in an organ-on-chip using FreeStyle™ libre glucometers. Front. Lab. Chip. Technol. 3:1289437. doi: 10.3389/frlct.2024.1289437
Received: 05 September 2023; Accepted: 05 February 2024;
Published: 29 February 2024.
Edited by:
Yuxiang Liu, Worcester Polytechnic Institute, United StatesReviewed by:
Ahmet Can Sabuncu, Worcester Polytechnic Institute, United StatesCopyright © 2024 Sánchez-Salazar, Garza-Garza, Crespo-López Oliver, Jerezano-Flores, Gallegos-Martínez, Ramos-Meizoso, Verduzco-Valenzuela, Trujillo-de Santiago and Alvarez. This is an open-access article distributed under the terms of the Creative Commons Attribution License (CC BY). The use, distribution or reproduction in other forums is permitted, provided the original author(s) and the copyright owner(s) are credited and that the original publication in this journal is cited, in accordance with accepted academic practice. No use, distribution or reproduction is permitted which does not comply with these terms.
*Correspondence: Grissel Trujillo-de Santiago, Z3Jpc3NlbEB0ZWMubXg=; Mario Moisés Alvarez, bWFyaW8uYWx2YXJlekB0ZWMubXg=
Disclaimer: All claims expressed in this article are solely those of the authors and do not necessarily represent those of their affiliated organizations, or those of the publisher, the editors and the reviewers. Any product that may be evaluated in this article or claim that may be made by its manufacturer is not guaranteed or endorsed by the publisher.
Research integrity at Frontiers
Learn more about the work of our research integrity team to safeguard the quality of each article we publish.