 Grace Maxted
 Pedro Estrela
 Despina Moschou
- 1Department of Electronic and Electrical Engineering, University of Bath, Bath, United Kingdom
- 2Centre for Biosensors, Bioelectronics and Biodevices (C3Bio), University of Bath, Bath, United Kingdom
During the recent pandemic outbreak, Lab-on-Chip devices did not manage to fully reach their potential in rapid diagnosis of pathogens, mainly due to the lack of cost-effective LoC solutions integrated with all required sample preparation modules. This paper presents such a critical step, aiming to translate electrochemical pH control into practical protein preconcentration modules, easy to integrate with subsequent quantification modules seamlessly via Lab-on-PCB technology. In this work we present a device capable of electrochemically controlling the pH of a solution local to an individually addressed electrode in a PCB array. The electrodes were functionalised with an electropolymerised self-assembled monolayer of 4-Aminothiophenol and were subjected to voltages of 0.2–0.4 V, evaluating for the first time the bias effect both over time and over space. This study enables for the first time the implementation of this technique for electrochemical pH control into practical Lab-on-PCB devices such as isoelectric focusing, via the informed design of such electrode arrays of appropriate size and spacing.
Introduction
The need for portable diagnostic platforms has become increasingly evident over the course of the COVID-19 pandemic (Wang et al., 2020). Polymerase chain reaction (PCR) tests and lateral flow tests (LFT) have showcased the benefits and shown how impactful biosensors can be to an audience wider than healthcare and research scientists (Waggoner et al., 2020; Hsiao et al., 2021). Such types of devices are, however, not limited to the detection of this virus and can be used for a wide variety of diagnosis and monitoring purposes worldwide due to their ease of use and portable nature. These devices are a sub-class of Lab-on-a-Chip (LoC) technology which shrinks laboratory scale processes into small, portable, mass manufacturable devices with a variety of applications (Moschou and Tserepi, 2017). Nonetheless, during the pandemic only the latter sub-class devices were deployed at the community level, despite their comparably lower sensitivity and practicality than other more advanced Lab-on-Chip technologies. One of the main reasons for this has been the lack of practical implementations of these devices, including the very critical step of sample preparation in seamlessly fabricated diagnostics. Sample preparation modules can improve the sensitivity of sensing devices to unprecedented levels, a parameter which would have proven critical in the fight against COVID-19, where early detection of asymptomatic patients is of vital importance.
There are many different types of LoC devices and different materials that are used which lend themselves to different applications; an example is printed circuit boards (PCBs) which are a subset of polymer LoCs and are mass manufacturable, cheap and allow for the seamless integration of multiple microfluidic modules within the layers of the PCB (Moschou and Tserepi, 2017). These properties lend PCBs naturally to biosensing LoCs. Lab-on-PCB devices are hence affordable, mass manufacturable, easy to use, readily available and consume minimal reagent volumes, enabling the incorporation of several different types of sample preparation modules, including protein preconcentration ones.
Many on-chip preconcentration methods are currently being studied, which may be divided into two main categories, static and dynamic techniques, and range from porous membranes to isoelectric focusing (IEF) (Lin et al., 2011). IEF exploits a molecule’s charged nature to concentrate it at its isoelectric point (pI) which is the pH at which the net charge of the molecule is zero. In environments more acidic than the pI of a molecule, the molecule will have a net positive charge, whilst in a more basic environment the molecule will have a net negative charge (Sommer and Hatch, 2009). With applied electric fields and a pH gradient, the movement of the charged molecules will be accelerated and steered, eventually coming to rest at the pI of the molecule; where it has no net charge and ceases to be affected by the electric fields. pH gradients in IEF have so far been created using methods such as static gels or carrier ampholytes (Sommer and Hatch, 2009). A comparison of different IEF subtypes used with microchips may be seen in Table 1. As can be seen in Table 1, the concentration achieved through these methods vary from 10 to 108, with this being achieved in time frames that vary from 430 ms (Xu et al., 2003) to “several hours” (Peng et al., 2008).
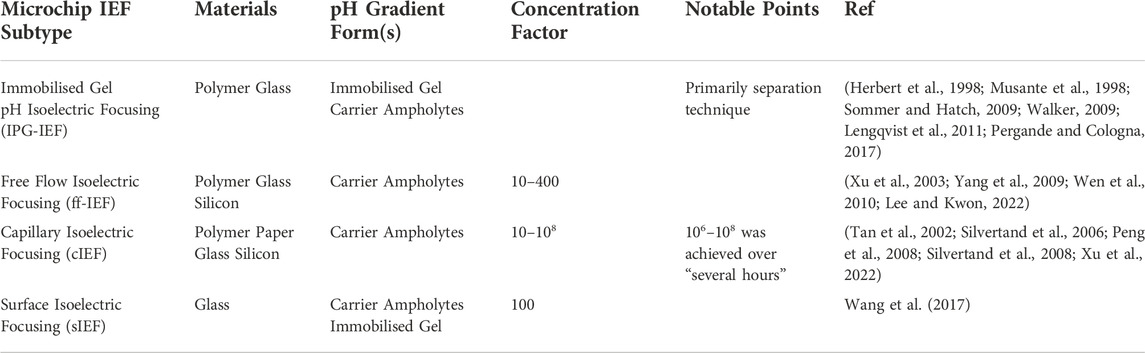
TABLE 1. Table comparing different forms of microchip isoelectric focusing. Materials for these microchips are typically glass, quartz, silicon, polymers (such as PDMS and PMMA), graphene and paper; carrier ampholytes or immobilised gels are used to form the pH gradients needed for these techniques (Colyer et al., 1997; Cui et al., 2005; Mohamadi et al., 2007; Peng et al., 2008; Dutta, 2019; Yu et al., 2019; Niu et al., 2021; Naghdi et al., 2022).
In this work we explore for the first time the practical capability of electrochemically generated acid (EGA) (Balakrishnan et al., 2018) in serving the role of pH gradient formation. More specifically, this work presents a PCB-implemented electrode array designed to locally control the sample pH electrochemically. The individually addressed PCB array was designed to explore in practice the capability and limitations of this technique in creating a pH gradient for use in IEF protein preconcentration Lab-on-PCB modules. The spatial resolution of the electrochemical setup and its response over time is herein described along with the quantitative control of electrochemically generated acid.
Materials and methods
Double sided PCB arrays of 20 electrodes (Figure 1) were designed in Altium Designer and manufactured by Newbury Electronics Ltd. (United Kingdom) using a black solder resist and gold electrode pads. Tracks were covered with solder resist and pads were encroached to protect the PCB. Black solder resist was selected to minimise scattering of light used to optically monitor the device as previous experiments had shown a distortion due to the traditional green resist. The PCB was designed to slot into a 64 pin PCIE connector which was mounted into a breakout board for easy control over multiple pads in the array. A holder was designed to create a uniform well of fluid above the electrode array capable of holding 1 mL of fluid for over an hour without leakage or significant evaporation. This was designed to instigate a uniform optical path length above the electrodes of approximately 1.4 mm, although surface tension at the edges of the holder meant this was observed to be imperfect. The PCB arrays had pads of 3 mm diameter with distances between the pads from a minimum of 0.3 mm to a maximum of 6 mm. The lower limit, 0.3 mm, was dictated by the tooling of the PCBs; the diameter of the pads was selected for ease of use with the spectrometer used as any smaller and the detector would be submersed in the buffer solution.
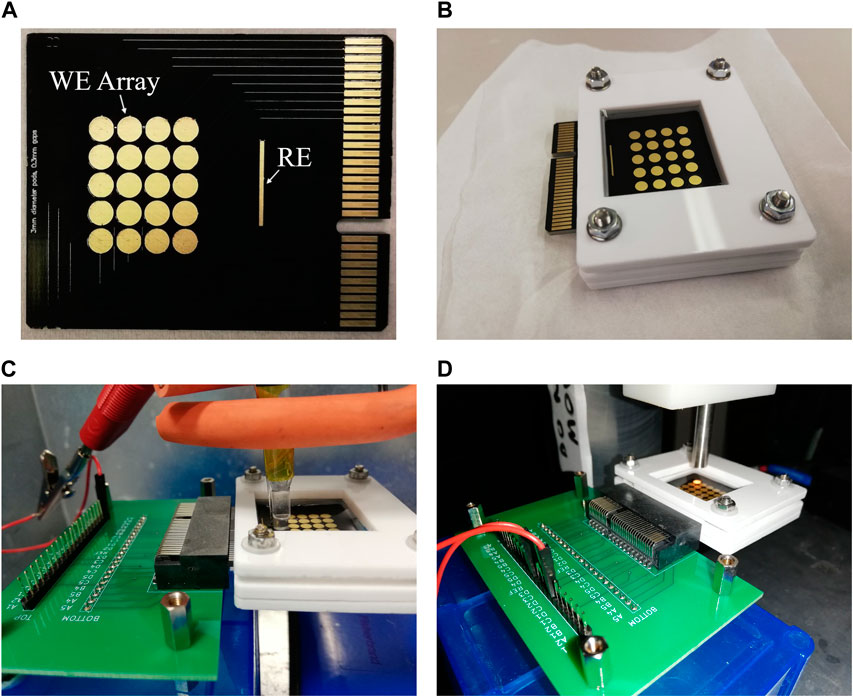
FIGURE 1. Photograph showing (A) PCB array, (B) holder, (C) 3-electrode setup for polymerisation with breakout board, (D) 2-electrode setup shown in situ under the spectrometer beam.
Potentiostats CompactStat, PocketStat, PocketStat 2 (Ivium Technologies, Netherlands) and PalmSens4 (PalmSens, Netherlands) were used to control the electrochemical measurements in a two or three electrode setup. In a 2-electrode setup, the on-chip gold pseudo-reference electrode (RE) was used (elongated electrode on the right-hand side of array, Figure 1A) and in all 3-electrode setups, external Pt counter (Alvatek Ltd., United Kingdom) and Ag/AgCl (Alvatek Ltd., United Kingdom) reference (with a salt bridge) electrodes were used. Each circular pad in the PCB array was usable as a working electrode.
The PCBs were cleaned by first wiping with acetone then rinsing with isopropanol and water. Any thiols were then desorbed from the surface by cycling with cyclic voltammetry (CV) in 100 mM NaOH for a minimum of 25 cycles. Standard PCB cleaning procedure was then carried out, defined as “SC-1” (Zupančič et al., 2021a), which involved 15 min immersion in a 5:1:1 ratio of ultrapure water, hydrogen peroxide (Sigma-Aldrich, United Kingdom) and ammonium hydroxide (Sigma-Aldrich, United Kingdom) and subsequent immersion in acetone, isopropanol and ultrapure water. Drying was always done with inert nitrogen gas.
The cleaned PCB was then immersed in 0.5 mM 4-Aminothiophenol (4-ATP, Sigma-Aldrich, United Kingdom) in absolute ethanol for 19 h to form a self-assembled monolayer (SAM) on the gold surface of the electrodes. 19 h was experimentally determined to provide a stable SAM, similar to what can be found in existing literature for other thiol terminated SAMs (Xu et al., 2019). This SAM is redox active and through electropolymerisation (3 cycles of CV in 10 mM phosphate buffered saline, PBS, −0.25–0.7 V, 50 mV/s, Sigma-Aldrich, United Kingdom) a quasi-reversible redox state may be induced (Balakrishnan et al., 2017). Figure 2 shows the unpolymerised and polymerised forms of 4-ATP SAM. The polymerised SAM is then used to produce electrochemically generated acid (EGA) through the application of different voltages. The effectiveness of cleaning and presence of SAM was studied using ferri/ferrocyanide ([Fe(CN)6]3-/4-, Sigma-Aldrich, United Kingdom).
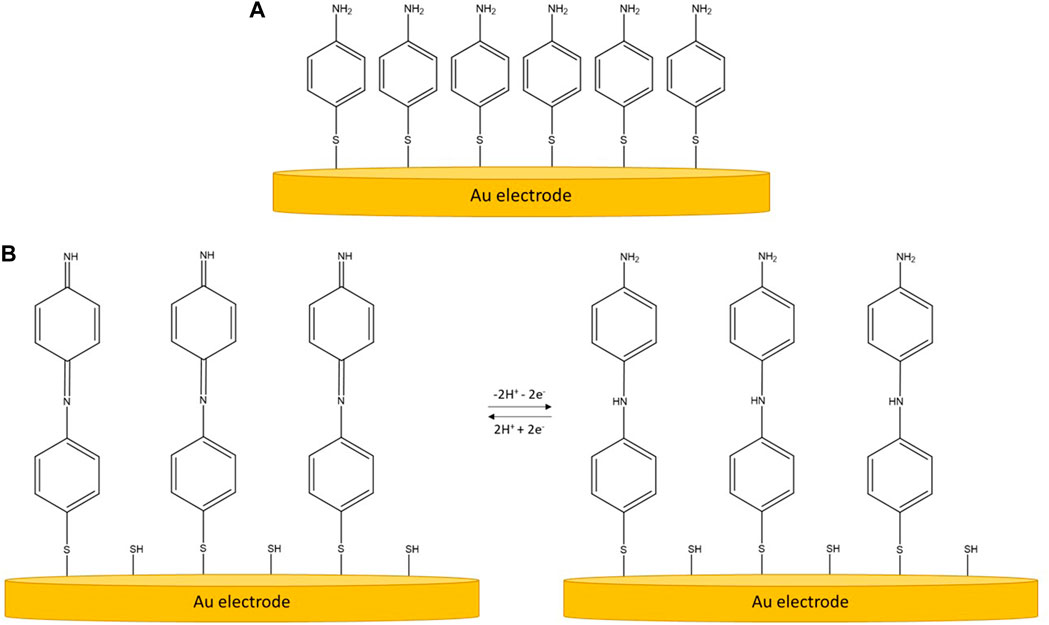
FIGURE 2. Schematic for 4-ATP SAM on gold electrode. (A) Unpolymerised form. (B) Electropolymerised form of 4-ATP SAM on gold electrodes and the redox states with an applied potential. Diagram adapted from the open access work of D. Balakrishnan (Balakrishnan et al., 2017), http://creativecommons.org/licenses/by/4.0/.
The production and behaviour of the EGA was monitored with a fluorescent dye, 5(6)-Carboxynaphthofluorescein (CNF, Sigma-Aldrich, United Kingdom). This dye is effective within the range of pH six to nine and has different optical properties in acidic/neutral and basic conditions (Bidmanova et al., 2012) due to the transition between the “open” and “closed” form of the fluorescein (Feng et al., 2020). This dye was dissolved in DMSO (Sigma-Aldrich, United Kingdom) and subsequent dilutions done using PBS or buffers of known pH between pH 4 and pH 10 (VWR, United States). The ratio between the emission wavelengths for basic and acidic pH, Eq. (1), was used to calibrate the optical properties of the dye on the PCB with the polymerised SAM. The optical data was collected using a USB spectrometer (USB4000-UV-VIS-ES from OceanInsight, United States) which was configured for the range of 200 nm <
OceanView (OceanInsight, United States) was used to record the spectroscopic data and employed pre-processing of the data comprising of averaging 10 scans and applying a Boxcar filter. This is a smoothing filter which improves the signal-to-noise ratio (SNR) by a factor of √N by replacing N data points with the average of those N data points (Chemistry Libre Texts, 2019); here n=4 which halves the signal-to-noise ratio (SNR). Post collection, the data was also smoothed using a 200 point Savitzky-Golay in OriginLab, which is a noise reducing low-pass filter (Savitzky and Golay, 1964). OriginLab was used for fitting and post processing.
In our study we define the device spatial resolution (Lee and Kwon, 2022) as the distance at which the effects of EGA are no longer observed via our optical characterization method, using our control value as the benchmark threshold. This is an important characterisation to define for future developments of these arrays: knowing where the EGA measured on one pad would be impacted by EGA on neighbouring pads on the array allows for confident data collection and analysis and is crucial for any future multiplexing of the array. These PCB arrays were designed to be used for IEF and protein preconcentration. By determining the spatial resolution of the EGA, it is established how best to design future arrays to maximise the potential for multiple proteins with different pIs to be separated and concentrated.
Results and discussion
Electropolymerisation of 4-Aminothiophenol self-assembled monolayer
Once the stable 4-ATP SAM was established on the cleaned gold electrodes, electropolymerisation was performed to improve the redox capability of the monolayer. The curve in Figure 3A shows the electropolymerisation: the first scan shows a large, irreversible, oxidation reaction which according to literature corresponds to the molecules’ polymerisation where an oxidised molecule forms a head-to-toe dimer with an adjacent molecule (Hayes and Shannon, 1996; Balakrishnan et al., 2017). The effect of this irreversible transition may be seen in Figure 3B which shows the CV results in 4 mM ferri/ferrocyanide ([Fe(CN)6]3-/4-) for the clean gold, unpolymerised SAM and after the polymerisation between −0.5 and 0.5 V for three cycles at 200 mV/s. The clean gold shows a standard redox curve with oxidation peak at 0.340 V and a reduction peak at 0.175 V, both of which are absent when the SAM is functionalised onto the surface. The suppression of redox behaviour for the unpolymerised SAM is shown in stark contrast to the behaviour when the SAM has undergone the polymerisation. The scale of the redox reactions at 0.5 V is almost 20 times larger for the polymerised SAM showing a clear change and improvement in Figure 3B.
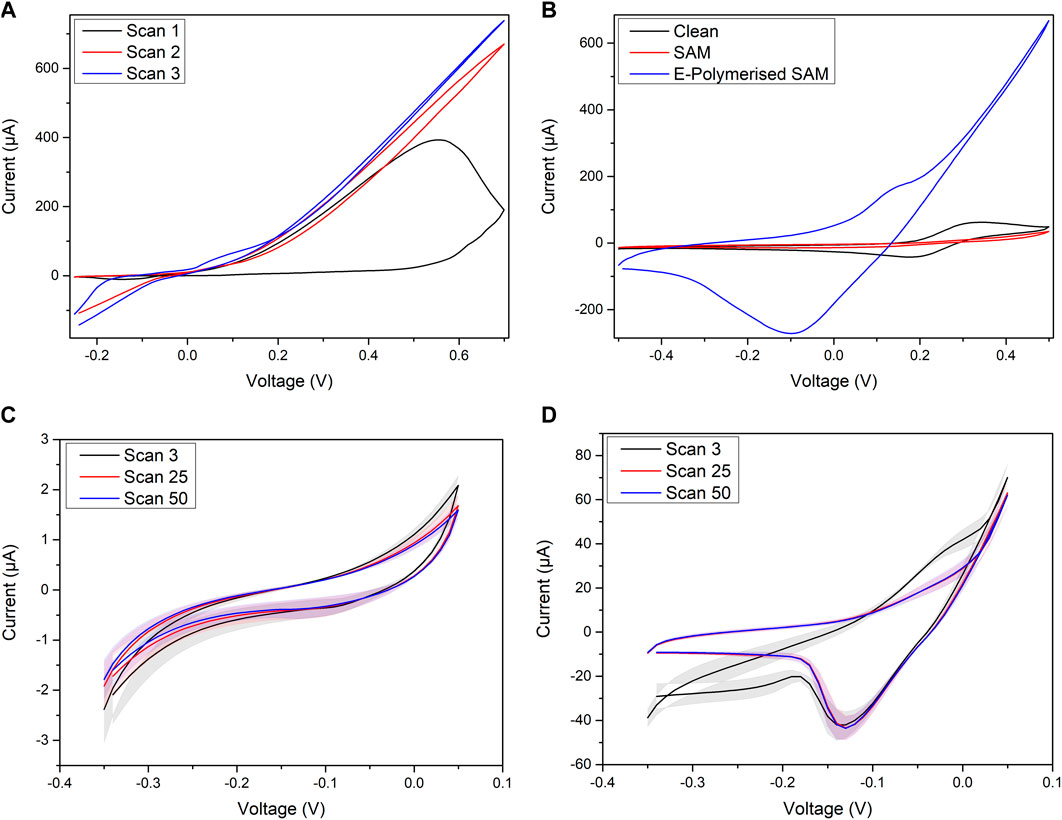
FIGURE 3. (A) Polymerisation of 4-ATP SAM on PCB array, (B) CV in [Fe(CN)6]3-/4- for PCB array when freshly cleaned compared to with the 4-ATP SAM, (C) third, 25th and 50th CV scans for unpolymerised SAM, (D) third, 25th and 50th CV scans for electropolymerised SAM.
This is supported by Figures 3C,D which shows the difference in the redox peaks when cycled at −0.35–0.05 V for 50 cycles at 100 mV/s in 10 mM PBS for the unpolymerised and polymerised SAMs, respectively. This range of potentials was utilised to prevent polymerisation/further polymerisation whilst showcasing the redox behaviour of the SAM. The unpolymerised SAM shows no distinct oxidation peak but does show a decrease in current response at 0.05 V from scan 3 to scan 50. The same may be said for the electropolymerised SAM, however the clear oxidation peak shown in scan 3 also decreases towards a more linear behaviour as the 50 cycles progress. This shows a decrease in the redox behaviour, however does illustrate that by performing the electropolymerisation, the redox reactions become more reversible, as shown in literature (Balakrishnan et al., 2017).
Characterisation of 5(6)-Carboxynaphthofluorescein
To optically monitor the acid generation produced by a potential being applied to the electropolymerised SAM, a fluorescent dye, CNF, was selected. This dye fluoresces at different wavelengths depending on the pH of its environment, see Eq. 1), and may be characterised by taking the ratio between its emission wavelengths in basic and acidic/neutral pH respectively, a technique shown previously in literature for the calibration of this dye (Fuladpanjeh-Hojaghan et al., 2019). The results for the characterisation of 100 µM of CNF in 10 mM PBS may be seen in Figure 4. Preliminary data was collected and compared to that shown in literature over a wider pH range using pH buffers of known pH (pH 4–10) and was then further calibrated in the pH range of interest, pH 6–9.
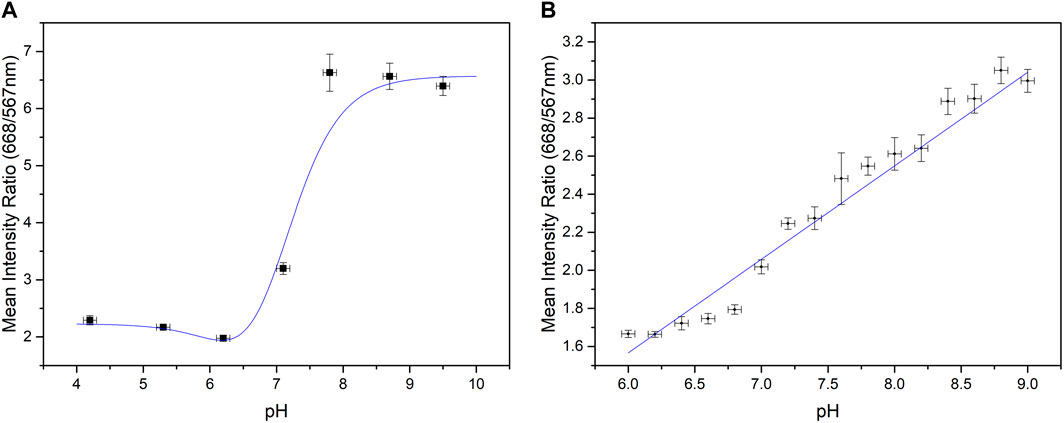
FIGURE 4. Calibration curves for 5 (6)-Carboxynapthofluorescein (A) between pH 4 and pH 10, (B) between pH 6 and pH 9 with a linear fit, R2 value of 0.939.
CNF was prepared by first dissolving the dye in dimethyl sulfoxide (DMSO) and then diluting it further in buffer solutions to achieve a concentration of 100 µM CNF in a range of pHs. The PCB array with the polymerised 4-ATP SAM was secured in its holder and the well was filled with 1 mL of the 100 µM CNF. The setup was then positioned under the spectrometer and the ratio of wavelengths was recorded along with the raw data. Three repeats were taken for each pH. The holder ensured a more consistent path length for the optical measurements and a range of positions in the array were used to confidently calibrate the setup. Scattering from the holder, fluid and neighbouring pads meant that no two pads on the array gave identical measurements, therefore taking a range of pads within the calibration was essential. This data confirmed the sigmoidal behaviour shown between pH 4–10 that was shown in literature, and verified the linear response between pH six to nine, confirming this as the functional pH range of the optical setup using this dye.
Control of electrochemically generated acid
To produce the EGA, the electropolymerised SAM was subjected to 4 cycles of CV between −0.75–0.75 V at 50 mV/s and continually optically monitored. Using the aforementioned spectrometer and dye, the pH over time was determined through the ratio of intensities at 668 and 567 nm, and the current was measured using a potentiostat; the experiment was set up in a dark unperturbed environment. As the different potentials were cycled through, the polymerised SAM underwent redox reactions, exchanging electrons and changing the concentration of protons through the reaction shown in Figure 2B. The agreement between the current, voltage and pH may be seen in Figure 5. The oxidation potential of electropolymerised 4-ATP is reported in literature to occur at 0.17 V (Balakrishnan, 2019). Here, the turning point for the change in pH was experimentally determined to be 0.3
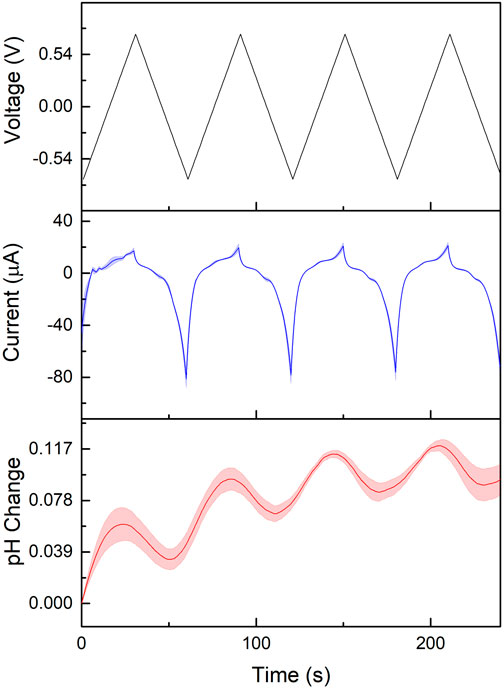
FIGURE 5. Voltage, current and pH change over time when cycling the voltage between -0.75 and 0.75 V at 50 mV/s for 4 cycles.
Three voltages (0.2, 0.3, and 0.4 V) were then trialled to determine the optimum reliability and stability of acid generation. A potentiostat was used to apply a constant potential, chronoamperometry (CA), for 60 min whilst it was continuously optically monitored. The data for this experiment may be seen in Figure 6 and shows the pH change after 60 min as well as the change over time. As can be seen in Figure 6A, this data indicates that 0.4 V provides the best option for changing the pH over time, with the linear fit shown in Figure 6B producing an R2 value of 0.997 compared to 0.963 and 0.674 for 0.2 and 0.3 V respectively. This demonstrates clear suitability of this potential to reliably and quantitatively change the pH over time with highly repeatable changes after 60 min as well as throughout. After 25 min, the behaviour is also shown to be distinct from the control and allows for the spatial resolution experiments to be conducted within one lab session, helping to eliminate any stochastic changes from experiments being conducted on different days. It is worth noting that visible degradation of the electrodes was occasionally observed after repeated use of the same pad when held at 0.4 V. All data here presented, however, is from electrodes that have not been used in any full experiments prior to those detailed here and will only have been subject to cleaning, functionalisation and polymerisation.
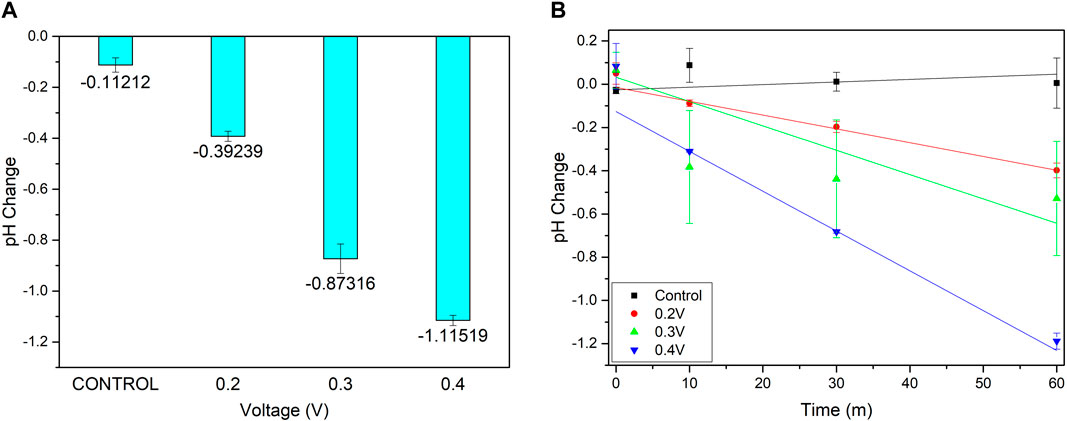
FIGURE 6. (A) pH change after 60 min of chronoamperometry of 0.2, 0.3 and 0.4 V (B) pH change over time.
Spatial resolution
The PCB array was then used to investigate the spatial resolution of this electrochemical/optical setup. As before, the electrodes were cleaned, functionalised and electropolymerised and the PCB secured in its holder to create a uniform path length when the 1 mL of 100 µM CNF in 10 mM PBS was pipetted into the well. The pad used for EGA, working electrode, was subjected to 0.4 V for a period of 25 min using CA to change the pH from its starting value of 7.2
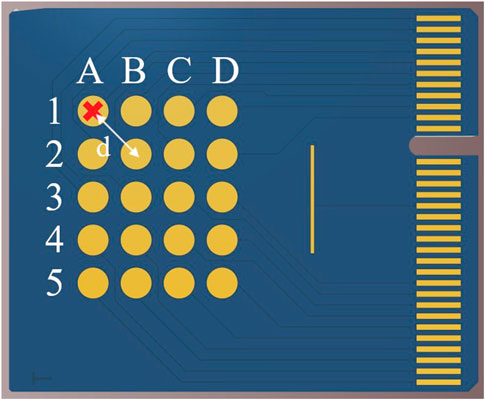
FIGURE 7. PCB array schematic showing labelling system and example spectrometer position.
All optical data was collected from unused, electropolymerised electrodes on the PCB array with the CA applied to pads at different distances away. Initially, differently spaced arrays were trialled to estimate the spatial resolution. This is defined as the distance at which the effects of the acid generation are no longer observed and is evaluated by the point of intersection of the line of best fit with the mean control threshold. It was found that the spatial resolution lies between 0.6 and 0.9 mm. Distances between this range were further investigated on an array with pads of 3 mm diameter and 0.3 mm spacing, with a testable range of 0.3–1.5 mm. At least three repeats were taken for each distance, with the holder ensuring the best repeatability of path length possible.
The data collected may be seen in Figure 8, which illustrates the pH change recorded at distances from 0.3 to 1.5 mm and shows a logistic dose response fit with an R2 value of 0.960. The fit for this data intersects with the data for the control at a distance of 0.664 mm which is the value for the spatial resolution of this setup and is the distance beyond which there is no recorded impact of electrochemical acid generation. Identifying the spatial resolution of the system allows for future PCB arrays to be designed to have electrodes spaced further than this to maximise the quantitative control of pH at every point in the array without interference from neighbouring electrodes. These PCBs, with e.g. pad diameters of 3 mm and separation distances of 0.9 mm, would then be used to quantitatively electrochemically change the pH of solution local to the electrodes, functionalised with a polymerised 4-ATP SAM, to the pI of a protein to change the concentration.
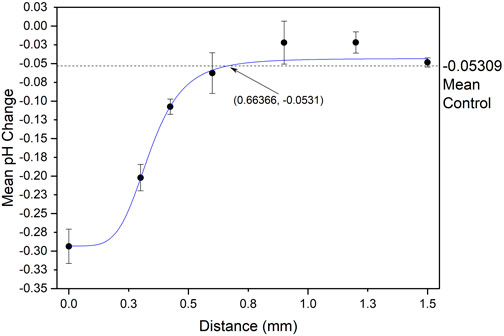
FIGURE 8. Spatial resolution data, mean pH change against distance from site of electrochemical acid generation.
Conclusion
In this work we present the first effort to practically implement local pH control electrochemically in PCB electrode arrays, a fundamental research step towards the implementation of the technique for practical IEF protein preconcentration arrays. We demonstrate that such an implementation is feasible in commercially manufactured PCB electrode arrays, with a pH change of 1.2 after 60 min, when biasing the electrodes at 0.4 V. The pH change response over time is linear, with smaller pH changes achievable in much lower timeframes in a highly controllable fashion. We have also identified the maximum distance from the biased electrode where a pH change is observable for our designed system at 0.664 mm. A linear relationship between the distance from biased electrode and pH change was observed below this threshold distance value.
Future development would aim to determine the feasibility of using this device as it currently exists, in “open air”, to concentrate samples of different proteins. Initial experiments will aim to preconcentrate a single type of protein and assess the minimum voltage change needed to achieve preconcentration and find the limit of detection for the methods used. Samples would be extracted during the application of voltage and the absorbance of the sample optically measured at 280 nm. This wavelength is known to correspond to the maximum absorbance in proteins (Sai et al., 2010). The Beer-Lambert Law correlates the absorbance intensity to the concentration of a species (Wypych, 2015) and could be used here with the aid of calibration methods. This extracted sample would be used to measure the change in concentration over time. With the optical methods described in this paper, the pH change could then be calculated and compared against the concentration. The device’s selectivity for multiple proteins within the sample could also be assessed by again extracting samples and taking a full fluorescence spectrum to determine the concentration. This would require the absorption spectra of the proteins used to be distinct as the absorption at 280 nm would not necessarily distinguish between different proteins within the sample.
Pulsing of the applied voltage, opposed to chronoamperometry, could be investigated to determine if a constant pH could be maintained. A staggered application of voltage over time to different pads in the array could also be used to create a pH gradient to be used for isoelectric focusing and protein preconcentration. These would be developed to correspond with future incorporation into a biosensing device. Whilst different buffers and starting pH conditions could also be investigated to determine if a different pH change could be attained and reached in a shorter period, PBS is a standard buffer in biosensing and changing the volume of sample and dimensions of the sample well itself to achieve this would be preferable.
Subsequent translation into an optically clear microfluidic device is planned once preliminary preconcentration experiments have been carried out. For external microfluidics, channels could be etched into PDMS, plasma bonded onto the surface of the PCB, micropumps used to create a flow and sample collection could occur using syringes (Kara et al., 2016; Zupančič et al., 2021b). Alternatively, new PCBs could be designed which incorporate microfluidic layers into the structure of the boards themselves (Moschou and Tserepi, 2017; Rainbow et al., 2020) as would be the case in the final design for the device. The microfluidics are to be designed to flow the sample over an array of electrodes, where the array is to be spaced at a distance greater than the spatial resolution calculated in this paper. This is to ensure there is no interference in the electrochemical acid generation caused by the acid generation produced by a neighbouring pad in the array. Allowing for the concentration of multiple proteins with different isoelectric points within the smallest possible microfluidic channel. This will allow a pH gradient to be formed within the channel and allow isoelectric focusing to take place and preconcentrate the sample ready for use in an accompanying biosensor. The use of microfluidics would allow for large volumes to be flowed through the channels, continuously concentrating specific proteins from the solution and allowing for the extraction of a greatly concentrated sample. This work enables the design of an IEF protein preconcentration module employing electrochemically produced pH gradient for the first time, opening new avenues in diagnostic Lab-on-PCB devices for low-abundance protein quantification.
Data availability statement
The original contributions presented in the study are included in the article/Supplementary Material, further inquiries can be directed to the corresponding authors.
Author contributions
GM designed the PCB arrays, conducted all experiments, and led the writing of the manuscript; PE supported the electrochemistry and optical laboratory aspects and the 4-ATP polymerization; DM conceptualized the preconcentration module, designed the spatial resolution experiments and wrote parts of the manuscript. All authors reviewed the manuscript.
Funding
GM was funded by an Engineering and Physical Sciences Research Council (EPSRC) Doctoral Training Award.
Acknowledgments
We thank Michael Linham for his aid in designing and manufacturing the holder and Gavin Dingley for his help with the electronic connections.
Conflict of interest
The authors declare that the research was conducted in the absence of any commercial or financial relationships that could be construed as a potential conflict of interest.
Publisher’s note
All claims expressed in this article are solely those of the authors and do not necessarily represent those of their affiliated organizations, or those of the publisher, the editors and the reviewers. Any product that may be evaluated in this article, or claim that may be made by its manufacturer, is not guaranteed or endorsed by the publisher.
References
Balakrishnan, D. (2019). “Acidity control in miniaturised volumes: Engineered microreactors for high hroughput chemical reactions,”. PhD Thesis (Enschede, Netherlands: University of Twente).LIST
Balakrishnan, D., Lamblin, G., Thomann, J. S., Guillot, J., Duday, D., Van Den Berg, A., et al. (2017). Influence of polymerisation on the reversibility of low-energy proton exchange reactions by Para-Aminothiolphenol. Sci. Rep. 7 (1), 15401. doi:10.1038/s41598-017-13589-5
Balakrishnan, D., Lamblin, G., Thomann, J. S., Van Den Berg, A., Olthuis, W., and Pascual-García, C. (2018). Electrochemical control of pH in nanoliter volumes. Nano Lett. 18 (5), 2807–2815. doi:10.1021/acs.nanolett.7b05054
Bidmanova, S., Hlavacek, A., Damborsky, J., and Prokop, Z. (2012). Conjugation of 5(6)-carboxyfluorescein and 5(6)-carboxynaphthofluorescein with bovine serum albumin and their immobilization for optical pH sensing. Sensors Actuators B Chem. 161 (1), 93–99. doi:10.1016/j.snb.2011.09.046
Chemistry Libre Texts, (2019). Boxcar averaging chemistry Libre Texts. Mind Touch; [updated 05/06/2019. Available from: https://chem.libretexts.org/Bookshelves/Analytical_Chemistry/Supplemental_Modules_(Analytical_Chemistry)/Analytical_Sciences_Digital_Library/JASDL/Courseware/Introduction_to_Signals_and_Noise/04_Signal-to-Noise_Enhancement/03_Digital_Filtering/03_Boxcar_Averaging.
Colyer, C. L., Mangru, S. D., and Harrison, D. J. (1997). Microchip-based capillary electrophoresis of human serum proteins. J. Chromatogr. A 781 (1), 271–276. doi:10.1016/s0021-9673(97)00502-5
Cui, H., Horiuchi, K., Dutta, P., and Ivory, C. F. (2005). Multistage isoelectric focusing in a polymeric microfluidic chip. Anal. Chem. 77 (5), 7878–7886. doi:10.1021/ac050781s
Dutta, D. (2019). Microfluidic electrophoresis : Methods and protocols. 1st ed. New York, NY, USA: Springer, 113–124.New York : Imprint: Humana
Feng, S., Gong, S., and Feng, G. (2020). Aggregation-induced emission and solid fluorescence of fluorescein derivatives. Chem. Commun. 56 (16), 2511–2513. doi:10.1039/c9cc09784h
Fuladpanjeh-Hojaghan, B., Elsutohy, M. M., Kabanov, V., Heyne, B., Trifkovic, M., and Roberts, E. P. L. (2019). In-operando mapping of pH distribution in electrochemical processes. Angew. Chem. Int. Ed. 58 (47), 16815–16819. doi:10.1002/anie.201909238
Hayes, W. A., and Shannon, C. (1996). Electrochemistry of surface-confined mixed monolayers of 4-aminothiophenol and thiophenol on Au. Langmuir 12 (15), 3688–3694. doi:10.1021/la9507390
Herbert, B. R., Molloy, M. P., Gooley, A. A., Walsh, B. J., Bryson, W. G., and Williams, K. L. (1998). Improved protein solubility in two-dimensional electrophoresis using tributyl phosphine as reducing agent. Electrophoresis 19 (5), 845–851. doi:10.1002/elps.1150190540
Hsiao, W. W-W., Le, T-N., Pham, D. M., Ko, H-H., Chang, H-C., Lee, C-C., et al. (2021). Recent advances in novel lateral flow Technologies for detection of COVID-19. Biosensors 11 (9), 295. doi:10.3390/bios11090295
Kara, A., Reitz, A., Mathault, J., Mehou-Loko, S., Amirdehi, M. A., Miled, A., et al. (2016). Electrochemical imaging for microfluidics: A full-system approach. Lab a Chip 16 (6), 1081–1087. doi:10.1039/c6lc00077k
Lee, Y., and Kwon, J-S. (2022). Microfluidic free-flow electrophoresis: A promising tool for protein purification and analysis in proteomics. J. industrial Eng. Chem. 109, 79–99. doi:10.1016/j.jiec.2022.02.028
Lengqvist, J., Eriksson, H., Gry, M., Uhlén, K., Björklund, C., Bjellqvist, B., et al. (2011). Observed peptide pI and retention time shifts as a result of post-translational modifications in multidimensional separations using narrow-range IPG-IEF. Amino Acids 40 (2), 697–711. doi:10.1007/s00726-010-0704-2
Lin, C-C., Hsu, J-L., and Lee, G-B. (2011). Sample preconcentration in microfluidic devices. Microfluid. Nanofluidics 10 (3), 481–511. doi:10.1007/s10404-010-0661-9
Mohamadi, M. R., Kaji, N., Tokeshi, M., and Baba, Y. (2007). Online preconcentration by transient isotachophoresis in linear polymer on a poly(methyl methacrylate) microchip for separation of human serum albumin immunoassay mixtures. Anal. Chem. 79 (10), 3667–3672. doi:10.1021/ac0623890
Moschou, D., and Tserepi, A. (2017). The lab-on-PCB approach: Tackling the μTAS commercial upscaling bottleneck. Lab a Chip 17 (8), 1388–1405. doi:10.1039/c7lc00121e
Musante, L., Candiano, G., and Ghiggeri, G. M. (1998). Resolution of fibronectin and other uncharacterized proteins by two-dimensional polyacrylamide electrophoresis with thiourea. J. Chromatogr. B Biomed. Sci. Appl. 705 (2), 351–356. doi:10.1016/s0378-4347(97)00545-8
Naghdi, E., Moran, G. E., Reinau, M. E., De Malsche, W., and Neusüß, C. (2022). Concepts and recent advances in microchip electrophoresis coupled to mass spectrometry: Technologies and applications. ELECTROPHORESIS. doi:10.1002/elps.202200179
Niu, J., Bao, Z., Wei, Z., Li, J. X., Gao, B., Jiang, X., et al. (2021). A three-dimensional paper-based isoelectric focusing device for direct analysis of proteins in physiological samples. Anal. Chem. 93 (8), 3959–3967. doi:10.1021/acs.analchem.0c04883
Peng, Y., Pallandre, A., Tran, N. T., Taverna, M., and El Rassi, Z. (2008). Recent innovations in protein separation on microchips by electrophoretic methods. Electrophoresis 29, 157–178. doi:10.1002/elps.200700347
Pergande, M., and Cologna, S. (2017). Isoelectric point separations of peptides and proteins. Proteomes 5 (4), 4. doi:10.3390/proteomes5010004
Rainbow, J., Sedlackova, E., Jiang, S., Maxted, G., Moschou, D., Richtera, L., et al. (2020). Integrated electrochemical biosensors for detection of waterborne pathogens in low-resource settings. Biosensors 10 (4), 36. doi:10.3390/bios10040036
Sai, V. V. R., Kundu, T., Deshmukh, C., Titus, S., Kumar, P., and Mukherji, S. (2010). Label-free fiber optic biosensor based on evanescent wave absorbance at 280 nm. Sensors actuators B, Chem. 143 (2), 724–730. doi:10.1016/j.snb.2009.10.021
Savitzky, A., and Golay, M. J. E. (1964). Smoothing and differentiation of data by simplified least squares procedures. Anal. Chem. 36 (8), 1627–1639. doi:10.1021/ac60214a047
Silvertand, L. H. H., Machtejevas, E., Hendriks, R., Unger, K. K., van Bennekom, W. P., and de Jong, G. J. (2006). Selective protein removal and desalting using microchip CE. J. Chromatogr. B 839 (1-2), 68–73. doi:10.1016/j.jchromb.2006.03.036
Silvertand, L. H. H., Torano, J. S., Van Bennekom, W. P., and Dejong, G. J. (2008). Recent developments in capillary isoelectric focusing: Recent developments in capillary electrophoresis. J. Chromatogr. A 1204 (2), 157–170. doi:10.1016/j.chroma.2008.05.057
Sommer, G. J., and Hatch, A. V. (2009). IEF in microfluidic devices. Electrophoresis 30 (5), 742–757. doi:10.1002/elps.200800598
Tan, W., Fan, Z. H., Qiu, C. X., Ricco, A. J., and Gibbons, I. (2002). Miniaturized capillary isoelectric focusing in plastic microfluidic devices. Electrophoresis 23 (20), 3638–3645. doi:10.1002/1522-2683(200210)23:20<3638::aid-elps3638>3.0.co;2-y
Waggoner, J. J., Stittleburg, V., Pond, R., Saklawi, Y., Sahoo, M. K., Babiker, A., et al. (2020). Triplex real-time RT-PCR for severe acute respiratory syndrome coronavirus 2. Emerg. Infect. Dis. 26 (7), 1633–1635. doi:10.3201/eid2607.201285
Walker, J. M. (2009). The protein protocols handbook. 3rd ed. Totowa, NJ: Humana Press.ed. Totowa, NJImprint: Humana
Wang, L., Wang, Y., Ye, D., and Liu, Q. (2020). Review of the 2019 novel coronavirus (SARS-CoV-2) based on current evidence. Int. J. Antimicrob. Agents 55 (6), 105948. doi:10.1016/j.ijantimicag.2020.105948
Wang, Z., Ivory, C., and Minerick, A. R. (2017). Surface isoelectric focusing (sIEF) with carrier ampholyte pH gradient. Electrophoresis 38 (20), 2565–2575. doi:10.1002/elps.201600565
Wen, J., Wilker, E. W., Yaffe, M. B., and Jensen, K. F. (2010). Microfluidic preparative free-flow isoelectric focusing: System optimization for protein complex separation. Anal. Chem. 82 (4), 1253–1260. doi:10.1021/ac902157e
Wypych, G. (2015). Handbook of UV degradation and stabilization. 2nd edition. Toronto, Ontario, Canada: ChemTec Publishing.ed. Toronto, Ontario
Xu, T., Han, L., George Thompson, A. M., and Sun, L. (2022). An improved capillary isoelectric focusing-mass spectrometry method for high-resolution characterization of monoclonal antibody charge variants. Anal. Methods 14 (4), 383–393. doi:10.1039/d1ay01556g
Xu, X., Makaraviciute, A., Kumar, S., Wen, C., Sjödin, M., Abdurakhmanov, E., et al. (2019). Structural changes of mercaptohexanol self-assembled monolayers on gold and their influence on impedimetric aptamer sensors. Anal. Chem. 91 (22), 14697–14704. doi:10.1021/acs.analchem.9b03946
Xu, Y., Zhang, C-X., Janasek, D., and Manz, A. (2003). Sub-second isoelectric focusing in free flow using a microfluidic device. Lab a Chip 3 (4), 224. doi:10.1039/b308476k
Yang, K. S., Clementz, P., Park, T. J., Lee, S. J., Park, J. P., Kim, D. H., et al. (2009). Free-flow isoelectric focusing microfluidic device with glass coating by sol–gel methods. Curr. Appl. Phys. 9 (2), e66–e70. doi:10.1016/j.cap.2008.12.032
Yu, S., Yan, C., Hu, X., He, B., Jiang, Y., and He, Q. (2019). Isoelectric focusing on microfluidic paper-based chips. Anal. Bioanal. Chem. 411 (21), 5415–5422. doi:10.1007/s00216-019-02008-5
Zupančič, U., Rainbow, J., Estrela, P., and Moschou, D. (2021). Utilising commercially fabricated printed circuit boards as an electrochemical biosensing platform. Micromachines 12 (7), 793. doi:10.3390/mi12070793
Keywords: electrochemical, acid generation, pH control, lab-on-PCB, spatial resolution
Citation: Maxted G, Estrela P and Moschou D (2022) An electrochemical device to control sample pH locally in Lab-on-PCB devices: An investigation into spatial resolution. Front. Lab. Chip. Technol. 1:1035423. doi: 10.3389/frlct.2022.1035423
Received: 02 September 2022; Accepted: 23 November 2022;
Published: 08 December 2022.
Edited by:
Jesse Greener, Laval University, CanadaReviewed by:
Angeliki Tserepi, National Centre of Scientific Research Demokritos, GreeceTugba Ozer, Yıldız Technical University, Turkey
Copyright © 2022 Maxted, Estrela and Moschou. This is an open-access article distributed under the terms of the Creative Commons Attribution License (CC BY). The use, distribution or reproduction in other forums is permitted, provided the original author(s) and the copyright owner(s) are credited and that the original publication in this journal is cited, in accordance with accepted academic practice. No use, distribution or reproduction is permitted which does not comply with these terms.
*Correspondence: Despina Moschou, ZG04NTVAYmF0aC5hYy51aw==; Grace Maxted, Z21tNDZAYmF0aC5hYy51aw==