- 1 Department of Psychology, University of Essex, Essex, UK
- 2 Department of Neurology, Vanderbilt University, Nashville, TN, USA
- 3 Department of Psychology, University of Virginia, Charlottesville, VA, USA
- 4 Royal Devon & Exeter Hospital, Devon, UK
- 5 Sobell Department of Motor Neuroscience and Movement Disorders, University College London Institute of Neurology, London, UK
Parkinson’s disease (PD) is characterized by difficulty with the timing of movements. Data collected using the synchronization–continuation paradigm, an established motor timing paradigm, have produced varying results but with most studies finding impairment. Some of this inconsistency comes from variation in the medication state tested, in the inter-stimulus intervals (ISI) selected, and in changeable focus on either the synchronization (tapping in time with a tone) or continuation (maintaining the rhythm in the absence of the tone) phase. We sought to re-visit the paradigm by testing across four groups of participants: healthy controls, medication naïve de novo PD patients, and treated PD patients both “on” and “off” dopaminergic medication. Four finger tapping intervals (ISI) were used: 250, 500, 1000, and 2000 ms. Categorical predictors (group, ISI, and phase) were used to predict accuracy and variability using a linear mixed model. Accuracy was defined as the relative error of a tap, and variability as the deviation of the participant’s tap from group predicted relative error. Our primary finding is that the treated PD group (PD patients “on” and “off” dopaminergic therapy) showed a significantly different pattern of accuracy compared to the de novo group and the healthy controls at the 250-ms interval. At this interval, the treated PD patients performed “ahead” of the beat whilst the other groups performed “behind” the beat. We speculate that this “hastening” relates to the clinical phenomenon of motor festination. Across all groups, variability was smallest for both phases at the 500-ms interval, suggesting an innate preference for finger tapping within this range. Tapping variability for the two phases became increasingly divergent at the longer intervals, with worse performance in the continuation phase. The data suggest that patients with PD can be best discriminated from healthy controls on measures of motor timing accuracy, rather than variability.
Introduction
The ability to accurately time movements is a critical component of motor function and the study of motor timing has provided insight into the functions of a hypothetical “internal clock” (see Jones and Jahanshahi, 2009 for a review). Motor timing has been most commonly measured using an elegant and influential paradigm known as the synchronization–continuation task (e.g., Wing and Kristofferson, 1973a,b). The task has proved a useful paradigm for studying both normal and pathological patterns of motor timing. The participant first synchronizes their tapping rate (usually the index finger of their dominant hand) with an externally provided cue (typically an auditory tone). The pacing stimulus is presented at a regular interval that generally falls within the period of several hundred milliseconds (ms) to a couple of seconds. After a criterion number of taps the pacing stimulus is stopped and the participant has to maintain the rhythm unaided; this is the continuation phase. Thus, the task measures the ability to entrain a motor response to a timed cue and to then maintain the learnt rhythm unaided.
Analysis of the task has focused on the quantification of the accuracy and variability of tapping. Both measure important characteristics of performance, with accuracy reflecting the closeness of a response to its target and variability reflecting how spread repeated responses are from the target. Investigation of accuracy has been typically explored using mean effects, either using the mean inter-response interval or mean absolute error (e.g., O’Boyle et al., 1996; Pope et al., 2006; Merchant et al., 2008a). Variability has been assessed using common statistical constructs such as the SD (e.g., Merchant et al., 2008a) or coefficient of variation (e.g., Pope et al., 2006). However, the exploration of variability has been dominated by an influential model (Wing and Kristofferson, 1973a,b) that seeks to decompose the variability on the continuation phase of the task into that attributable to “clock” processes or alternatively to motor execution. However, the Wing and Kristofferson model is not without caveats. First, the model assumes that the hypothetical clock and motor processes are independent of one another. Second, it does not allow for the drift in the length of the produced taps, a phenomenon that is commonly observed in human tapping data (e.g., Collier and Ogden, 2001; Madison, 2001). Additionally, the Wing and Kristofferson model is focused on variability during the continuation phase. This ignores the useful information that can be gained from exploring performance on the paced section of the paradigm. For example, impaired performance on the continuation phase could be due to an inability to reproduce a learnt rhythm, or it could be a reflection of the inability to master the rhythm during the synchronization phase.
The task has been readily adopted to assess motor timing in Parkinson’s disease (PD). PD is a complex neurodegenerative disorder characterized by impairments of motor function resulting in the clinical symptoms of bradykinesia, rigidity, tremor, and postural instability. The cardinal motor symptoms emerge following dopaminergic cell loss in the substantia nigra pars compacta. As such, research establishing that people with PD are impaired at the synchronization–continuation task has been pivotal to the hypothesis that the basal ganglia are essential to temporal processing (e.g., Pastor et al., 1992; Freeman et al., 1993; Harrington et al., 1998; although see Ivry and Keele, 1989; Yahalom et al., 2004; Spencer and Ivry, 2005). Our recent work has shown that the neural correlates of motor tapping show a distinct pattern for individuals with PD (Jahanshahi et al., 2010). Specifically, patients with PD do not show the typical pattern of activation of striato-frontal sites seen in healthy controls and instead show greater activation of the cerebellum.
Although the majority of studies report atypical performance on this task in PD, the pattern of dysfunction varies across studies. Analysis of accuracy has suggested faster (O’Boyle et al., 1996), slower (Pastor et al., 1992), and unimpaired (Yahalom et al., 2004; Spencer and Ivry, 2005) tapping in PD. Variability data are more consistent, with studies tending to find it elevated (e.g., Pastor et al., 1992; O’Boyle et al., 1996; Harrington et al., 1998; Merchant et al., 2008b), although some null results also exist (e.g., Ivry and Keele, 1989; Spencer and Ivry, 2005). The variation in the results could be attributable to many factors. As mentioned previously, most studies have not looked at variability performance on the synchronization section of the task. Further, not all studies assessed participants both “on” and “off” dopaminergic replacement therapy. Finally, many studies tested only one or two tapping rates. There is substantial evidence to suggest that performance might differ at different interval ranges, particularly in the “short” milliseconds vs. “long” seconds range (e.g., Nakamura et al., 1978; Peters, 1989).
The aim of this paper was to take a fresh and comprehensive look at motor timing in PD using the synchronization–continuation paradigm. We were interested in modeling both accuracy and variability performance on the task, across both the synchronization and continuation sections of the paradigm. The aims for the study were: (1) to develop a novel way for describing and modeling finger tapping data, (2) to look for group differences between participants with and without PD (3) to examine if acute manipulation (“on” vs. “off”) or chronic (treated PD vs. de novo PD) medication state influenced performance. To predict the pattern of the data, we fitted a linear mixed model according to three different predictors of performance: (1) groups of participants (treated PD patients both “on” and “off” medication, PD patients yet to start medication treatment, and healthy controls), (2) tapping rate (250, 500, 1000, 2000 ms), and (3) the two types of tapping (synchronization and continuation).
Materials and Methods
Participants
The study included three groups: (a) 14 patients with PD-treated with dopaminergic medication (PD-treated group), (b) eight PD patients yet to start dopaminergic therapy (PD-de novo group), and (c) 20 healthy participants (control group). Criteria for a diagnosis of PD was based on the UK Parkinson Disease Society Brain Bank criteria (Hughes et al., 1992), established by a physician experienced in PD diagnosis and management.
Participants in the PD-treated group were tested both “on” and “off” medication (PD-treated-on and PD-treated-off) where the “off” state was conducted after overnight withdrawal of medication (mean time since last medication = 14.43 h, SD = 3.48). Two patients were tested in the “off” condition only, while the remaining 12 were tested in both conditions, in a counterbalanced order. Details of the patients, including medication, can be seen in Table 1.
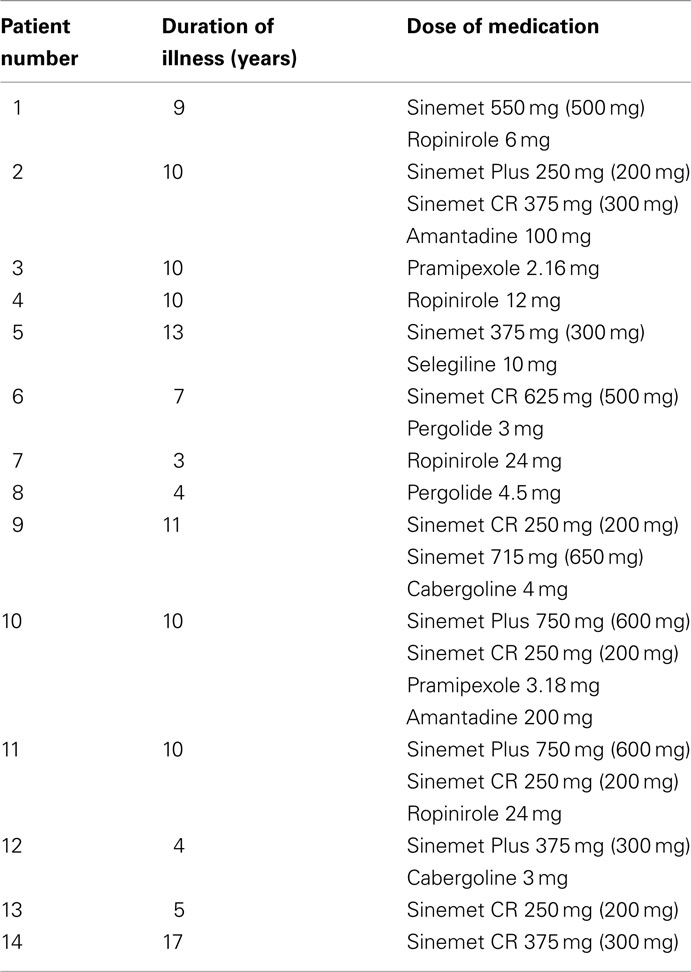
Table 1. Dopaminergic medication for the PD-treated group (for Sinemet, amount of levodopa in brackets).
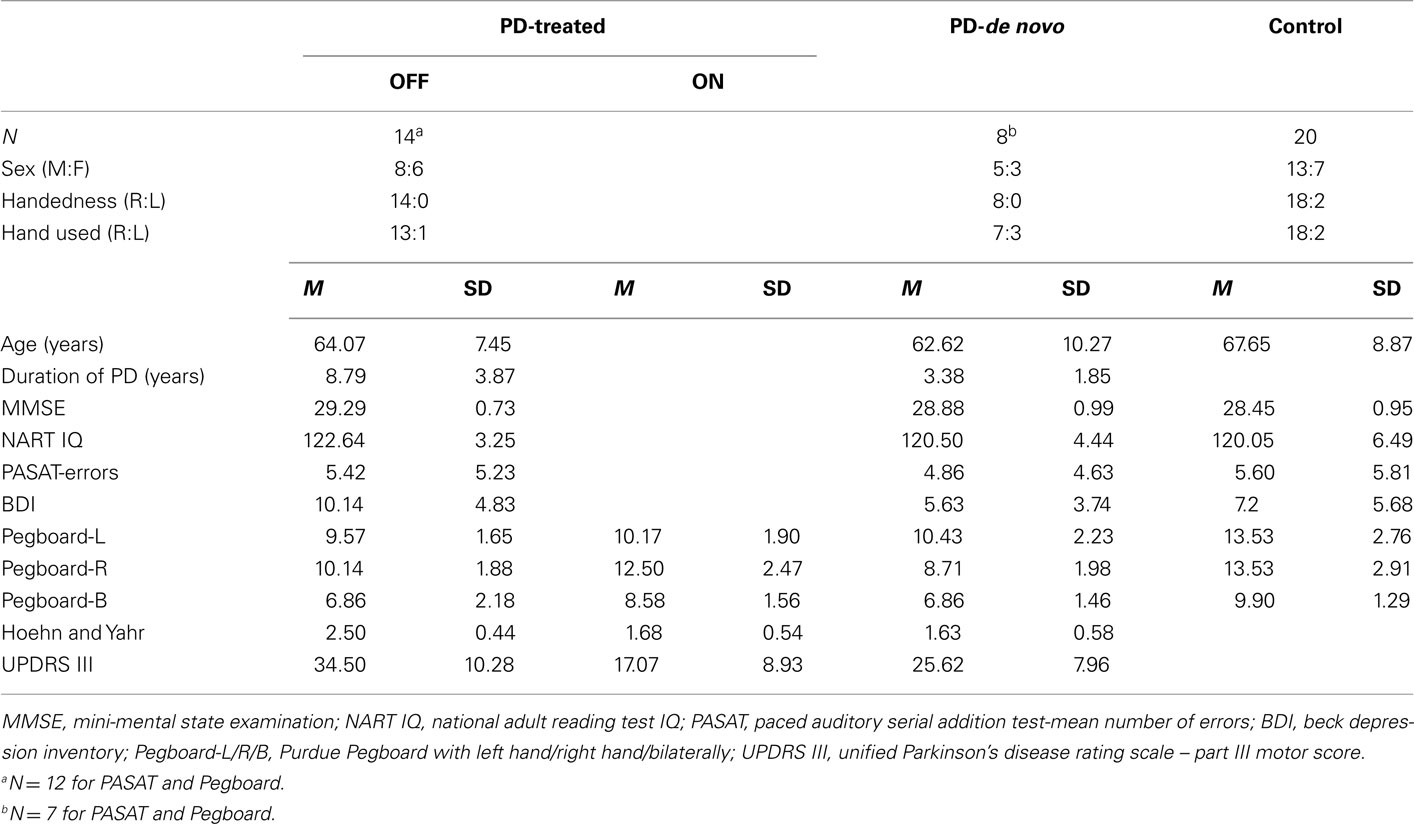
Participant groups were matched for age [PD-treated group: mean age = 64.07 years, SD = 7.45 years; PD-de novo group: 62.62 (10.27); Control group: 67.65 (8.87)]. None of the participants had a history of psychiatric or other neurological disease, head injury or alcohol/drug abuse. Participants were screened for cognitive impairment using the mini-mental state examination (MMSE: Folstein et al., 1975), with all scoring above the required cut-off of 27. Scores on the beck depression inventory (BDI: Beck et al., 1961) indicated that one participant in the control group had a score of 22 and one participant in the PD-treated group had a score of 20, both above the cut-off for moderate self-reported depression (range 19–29). All other participants were in the minimal or mild range. The three groups did not differ in terms of age, estimated premorbid verbal IQ (using the national adult reading test, NART: Nelson, 1982), or ability to maintain focused attention (paced auditory serial addition task, PASAT: Gronwall and Wrightson, 1981; Mann Whitney U, all p-values > 0.1). A summary of these measures can be found in Table 2.
The study had the approval of the Joint Medical Ethics Committee of the National Hospital for Neurology and Neurosurgery and the UCL Institute of Neurology and the North and East Devon Local Research Ethics Committee. Written, informed consent was obtained from all participants prior to the experiment.
Tasks
Clinical and Behavioral Measures of Motor Performance
Stage and severity of PD was assessed with the Hoehn and Yahr rating scale (Hoehn and Yahr, 1967) and Part III (Motor) score of the Unified PD Rating Scale (UPDRS: Fahn et al., 1987). In addition, motor speed and finger dexterity was measured with the Purdue Pegboard (Tiffin and Asher, 1948). The test comprises of a set of metal pegs and a pegboard. Participants pick up the pegs one at a time and place them one by one in one in the pegboard as quickly as possible. This was done three times: with the right hand, with the left hand and bimanually. The number of pegs placed in the holes in 30 s was recorded on each occasion.
Repetitive tapping task
The participant sat at a table in a quiet room. The task was programmed in Quick Basic and run on a Dell laptop. A response box (15 cm × 8 cm × 5 cm) with two identical circular response buttons (diameter 2.5 cm) was used to record responses. All the participants were instructed to use the same button and to ignore the second button. The travel of the button, which had a flat plastic surface and made a “click” sound when pressed, was 2.5 mm and the operating force was 0.8 N. All responses were made with the dominant or choice index finger of the participant (Table 2). Response times were recorded to the nearest millisecond. Participants were instructed to tap in synchrony with a tone (1000 Hz, duration 50 ms) presented with a constant inter-stimulus interval (ISI) of either 250, 500, 1000, or 2000 ms (synchronization phase). After 31 taps (30 intervals) the tone stopped and participants continued to tap and maintain the rhythm for a further 30 intervals (continuation phase). A loud tone indicated the end of the trial.
Participants performed the task over two blocks. Each block consisted of the presentation of four runs of trials (one of each interval type, i.e., 250, 500, 1000, and 2000 ms), with a counterbalanced order used. Erroneous responses were considered to be those where the inter-tap interval (ITI) was 50% longer or shorter than the target ISI. These responses were considered outliers and were excluded from the analysis, although the remainder of the run was kept. Relating to a concern over collecting enough valid data, for some participants a particular ISI was administered more than twice. This resulted in seven controls and three PD-de novo with additional runs of trials. For the PD-treated group, only four runs of trials were collected for three of the participants when “off” medication, and only four runs of trials from one participant and only seven runs of trials from two participants when “on” medication. An illustration of the task is provided in Figure 1.

Figure 1. The repetitive tapping task. The red dotted lines indicate a participant’s response, which can either lag or lead the target ISI. The tones cease in the continuation phase, as indicated by the black dotted line. ISI, inter-stimulus interval; ITI, inter-tap interval.
Analysis
Descriptive data
Analysis of descriptive data used independent or paired t-tests, and Mann Whitney U and Wilcoxon signed ranks tests, depending on whether the data were normally distributed.
Repetitive tapping analysis
We used linear mixed models (LMM; also known as multilevel analyses or hierarchical linear models) with categorical predictors to explore the accuracy and variability of the responses of the participants. The focus of the analysis was to find the best-fitting model for the data and to explore the effects of these predictors and their interactions. Our conclusions are based on LMMs computed using the function lmer (Bates et al., 2011) running on R 2.13.0. (R Development Core Team, 2011). Mixed-effects analyses (see Kreft and De Leeuw, 1998; Snijders and Bosker, 1999; Raudenbush and Bryk, 2002; Baayen, 2008) have considerable advantages over traditional repeated measures analyses, which are based on quasi-F tests, by-subjects analyses, combined by-subjects and by-items analyses, and random regression (Maxwell and Delaney, 2004; Baayen et al., 2008). In predicting the outcome variable – be it accuracy or variability – LMM allows us to assess how a participant’s clinical and experimental classification predicts performance.
We measured accuracy by calculating a relative error value for each tap: (ITI−ISI)/ISI. This value is comparable across ISIs and provides a quantitative assessment of the directionality of each tap: if the relative error is negative then the participant is ahead of the beat, or “leading,” and if the relative error is positive then the participant is behind the beat, or “lagging.” For the LMM of accuracy (the relative error), three categorical variables served as fixed effects in the model: group (Group: PD-treated-on, PD-treated-off, PD-de novo and control), ISI (ISI: 250, 500, 1000, and 2000 ms), and task phase (Task phase: synchronization or continuation). The participant served as the random effect.
We measured variability of performance by calculating the participants’ deviation from the predicted group relative error in the LMM of accuracy for each tap (i.e., participant observed relative error minus group predicted relative error). This approach allows for an assessment of individual performance based on group-specific estimates of accuracy, thus accounting for group patterns of performance. This method also has the benefit of modeling variability as it occurs on each trial, rather than calculating it as mean performance across an entire run of trials (i.e., instead of one variability score for a run of trials, we have 30 variability scores per phase). In essence, our variability measurement quantifies the deviation of each observed tap from the accuracy model for a given group. Since random noise in the data results in outliers that skew its distribution, this “residual” error does not conform to a normal distribution. Therefore, we transformed it by calculating the square root of the absolute value to create an adjusted measure of variability. A highly variable participant would produce a wide range of √abs(residuals), while constant performance would produce a narrow range. The LMM of variability was identical in structure to the model for accuracy, with three categorical variables as fixed effects and participant as random effect.
The significance of the fixed effects (predictors) was determined through interpretation of the 95% confidence intervals; if the lower and upper confidence intervals did not cross zero then the effect and corresponding estimated coefficient was considered significant at p < 0.05.
Results
Clinical and Behavioral Measures of Motor Performance
As expected, for the Hoehn and Yahr scale and the UPDRS Part III Motor score, the PD-treated group were significantly worse in the “off” than “on” medication state [Hoehn and Yahr: Wilcoxon signed ranks, Z = −3.11, p = 0.002; UPDRS: t(13) = −7.50, p < 0.001]. The PD-treated group tested “off” medication were significantly worse compared to the PD-de novo group [Hoehn and Yahr: t(20) = −4.00, p = 0.001; UPDRS: t(20) = −2.10, p = 0.05], reflecting more advanced stage of illness in the former group. However, the severity of motor symptoms of the PD-treated group were not significantly worse when they were compared in the “on” medication state to the de novo group, although there was a trend toward poorer performance for the UPDRS (UPDRS: p = 0.07; Hoehn and Yahr: p > 0.9).
For the Purdue pegboard, statistical analysis was confined to the right hand data to reduce the number of statistical tests; the right hand data were selected as they produced the most divergent results. Performance indicated that the PD-treated group when “off” medication and the PD-de novo group performed significantly more poorly than the control group. (Mann Whitney U for control vs. PD-treated-off: U = 38.50, p < 0.001. For control vs. PD-de novo: U = 8.50, p < 0.001; Bilateral U = 6.5, p < 0.001). However, when the treated PD group was “on” medication they did not differ from controls (p > 0.4). Not surprisingly, therefore, pegboard performance was better “on” than “off” medication for the PD-treated group [t(11) = 4.60, p = 0.001]. The PD-de novo group were equivalent to the PD-treated group when the treated patients were “off” medication (p < 0.1), but were worse than the treated group when they were “on” medication [t(16) = −2.95, p = 0.005]. See Table 2 for a summary of these results.
Accuracy
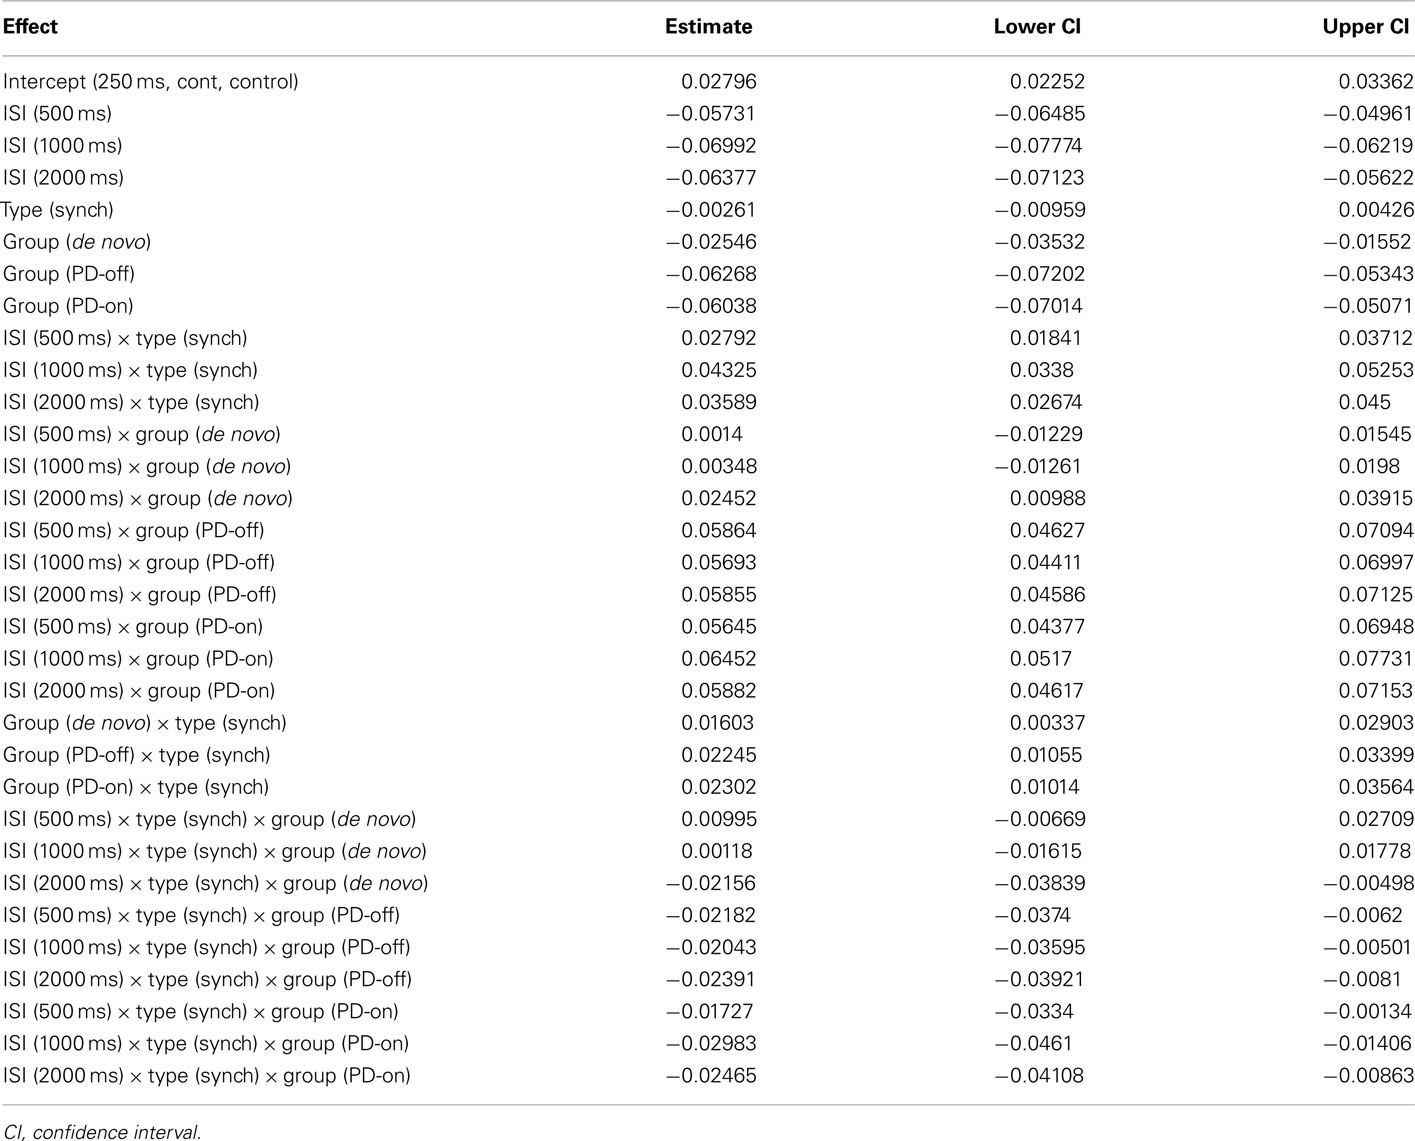
We used three predictors (Group, ISI, and Task Phase) as fixed effects to model relative error. The model also included three random-effects: a subject-by-subject variation in intercept, in the effect of ISI, and in the effect of Task Phase. The best-fitting LMM (Akaike information criterion, AIC was used for model comparison) included the triple interaction, all three two-way interactions and all main effects as fixed effects (see Table A1 in Appendix for the model coefficients and confidence intervals). Figure 2 shows the relative error predicted by this model for of all the conditions; the error bars represent 1 SE from the predicted value. To aid understanding of the complex data, we have presented it in two ways: Figure 2A: with the groups on the x axis to enable direct comparison of the groups at each ISI; Figure 2B: with the ISI on the x axis to enable the individual pattern for each group to be more easily ascertained. The model was complex in that it included the significant three-way interaction and all significant two-way interactions. Thus, we cannot explain the effect of one predictor without considering the variation of the other predictors. Reflecting this, we focused on patterns of interest with a second, refined model fitted to aid interpretation of these patterns.
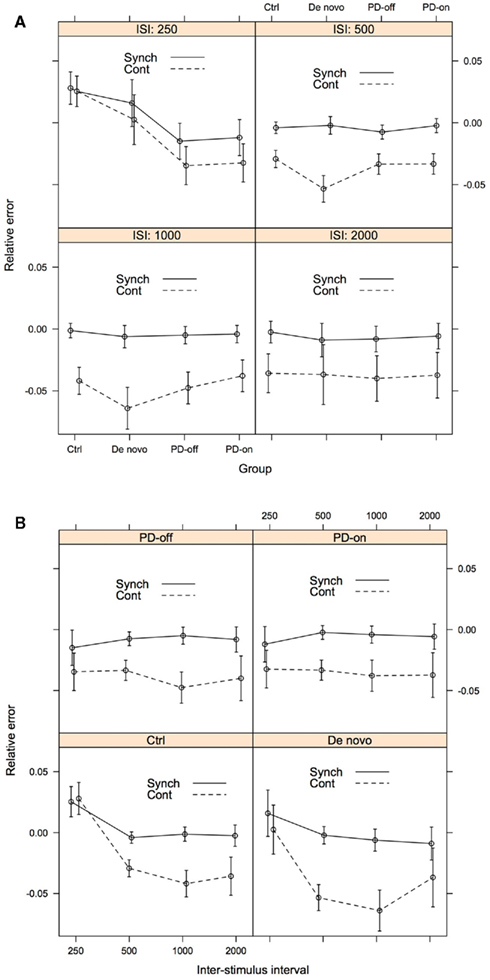
Figure 2. Accuracy as assessed by predicted relative error, for illustrative purposes presented both by ISI (A) and Group (B). The error bars represent 1 SE from the predicted relative error. For (A), lines connecting the data points do not imply that intermediate levels exist between the treatments. Rather they serve to facilitate the understanding of the data. Group: Ctrl, control; De novo, PD-de novo; PD-off, PD-treated-off; PD-on, PD-treated-on; Task Phase: Synch, synchronization; Cont, continuation; ISI, inter-stimulus interval.
Results are best interpreted by first focusing on the longer intervals (500, 1000, and 2000 ms) and then the shortest interval (250 ms). For the longer intervals, all groups of participants tapped with a negative relative error, i.e., responses were ahead of the beat. Further, all groups had smaller (i.e., closer to 0) predicted relative error during the synchronization phase (see Figure 2A). At 500 ms, the PD-de novo group had a greater negative error than the control group, and this pattern persisted at 1000 ms. Aside from this exception, performance across the groups was not distinguishable.
At the 250-ms ISI the pattern was more complex and was where meaningful group differences were observed. During the synchronization phase at 250 ms the control participants tapped with a positive relative error, i.e., they tapped “behind the beat.” This is in contrast to the PD-treated group (both “on” and “off” medication), who showed a negative or “ahead of the beat” performance at 250 ms. The PD-de novo group was more similar to the control group than the PD-treated group at 250 ms and showed a positive mean relative error score (but note that the SE bar included 0).
During the continuation phase at 250 ms, the pattern of effects was similar but the differences between control and PD-treated patients were more striking. Again, the control participants tapped with a positive relative error (behind the bead) and the PD-treated group (both “on” and “off” medication) showed a negative relative error (ahead of the beat). As with the synchronization phase, the PD-de novo group was more similar to the control group than the PD-treated group.
We developed a second model to assess our interpretation of the pattern of data in a manner analogous to post hoc testing. We used three newly coded predictors as fixed effects to model relative error: Treatment [treated (PD-on and PD-off) vs. untreated (PD-de Novo and Control)], ISI [short (250 ms) vs. long (500, 1000, and 2000 ms)], and Task Phase (synchronization vs. continuation). The model included the same random-effects as in the previous model: a subject-by-subject variation in intercept, in the effect of ISI, and in the effect of Task Phase. The three predictors appeared as a significant triple interaction in the new model. The estimated values of the model coefficients and associated confidence intervals can be seen in Table 3, whilst Figure 3 shows the relative error predicted by this model for of all the conditions. This analysis more clearly illustrated the pattern evident in the first model. First, the treated and untreated groups were indistinguishable at the long ISI (500, 1000, 2000 ms), with both groups showing greater relative error in the continuation phase. Second, the groups diverged at the short ISI (250 ms), with the treated group showing hastening (negative relative error) compared to the untreated group. Further, the hastening was more pronounced for the continuation phase, whereas the untreated group showed no differentiation between phases at the short ISI (see Figure A1 in Appendix for supporting evidence in two post hoc models for the short and long intervals). In sum, participants with a diagnosis of PD who have been treated with dopaminergic medication (whether “off” or “on” at the time of testing) are differentiated from control and de novo PD patients at the short ISI of 250 ms, but not at longer intervals.
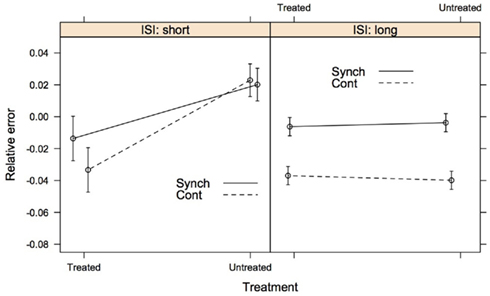
Figure 3. The second model of accuracy comparing the PD patients receiving dopaminergic medication (treated group) to PD patients who were dopamine naïve and healthy controls (untreated group). ISI tapping rates are collapsed into short (250 ms) and long (500, 1000, and 2000 ms). The error bars represent 1 SE from the predicted relative error. Lines connecting the data are placed to illustrate group differences. Synch, synchronization phase; Cont, continuation phase.
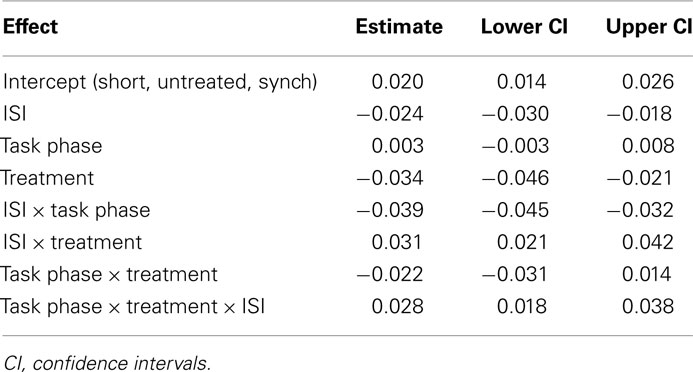
Table 3. Estimated values of the model coefficients for the second model of accuracy (relative error).
Variability
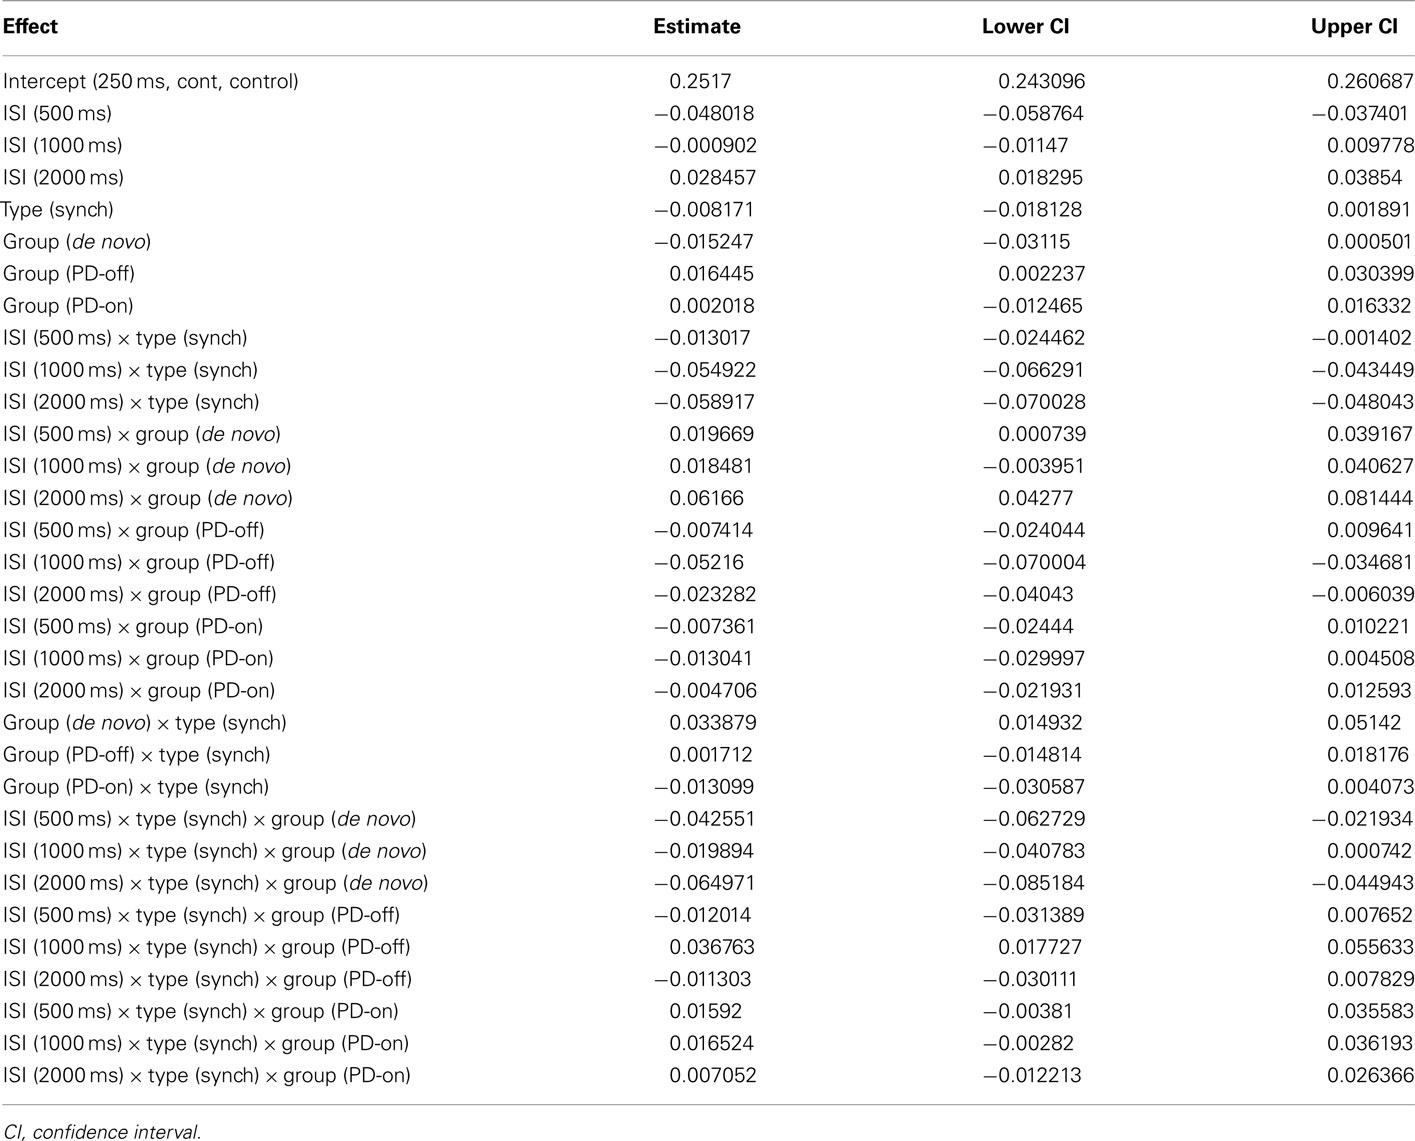
Our approach to modelling variability was identical to our LMM model for accuracy. We used the same three predictors as fixed effects: Group, ISI, and Task Phase. The model also included the same three random-effects: a subject-by-subject variation in intercept, in the effect of ISI, and in the effect of Task Phase. The best-fitting LMM included the triple interaction, all three two-way interactions and all main effects as fixed effects, see Table A2 in Appendix for the model coefficients and confidence intervals. Figure 4 shows the variability predicted by this model for of all the conditions; the error bars represent 1 SE from the predicted value. As with the accuracy model, to aid understanding of the data we have presented it in two formats: Figure 4A: with the groups on the x axis to enable direct comparison of the groups at each ISI; Figure 4B: with the ISI on the x axis to enable the individual pattern for each group to be more easily ascertained. Again, as the three-way interaction was significant we focused on complex patterns of interest.
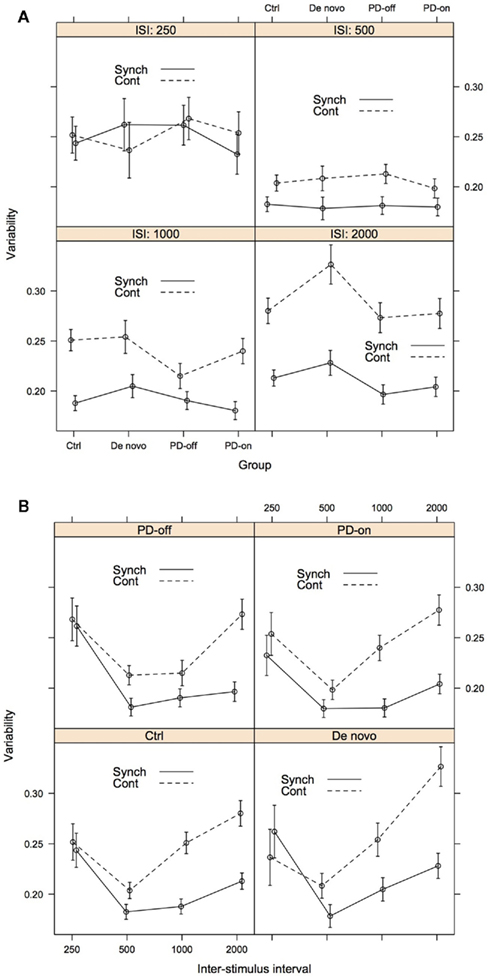
Figure 4. Variability as assessed by participant deviation from predicted relative error, for illustrative purposes presented both by ISI (A) and Group (B). The error bars represent 1 SE from the predicted relative error. For (A), lines connecting the data are placed to illustrate group differences. Group: Ctrl, control; De novo, PD-de novo; PD-off, PD-treated-off; PD-on, PD-treated-on; Task Phase: Synch, synchronization; Cont, continuation; ISI, inter-stimulus interval.
When comparing the two task phases, we found that the predicted variability of the synchronization phase was lower than that of the continuation phase. Across all groups, variability was lowest at the 500-ms condition and increased across the 1000- and 2000-ms ISIs, particularly during the continuation phase. Figure 4B clearly illustrates that the difference between the synchronization and continuation phases increased with the ISI for the intervals 500-2000 ms. It is noteworthy that the variability between groups and task phases at the 250-ms ISI was overlapping and highly similar. Compared to the accuracy models, group differences were less striking. However, there was some suggestion of differentiation of the patient groups from the control group at the higher ISIs (see Figure 4A). First, the PD-treated group showed reduced variability at the 1000 ISI compared to the other groups during the continuation phase, this was more evident when they were “off” medication. This pattern was less distinct at 2000 ms and with evidence more compelling for the synchronization phase. Second, the PD-de novo group showed increased variability compared to the other groups at the 2000 ISI, with the effect being more distinct for the continuation phase.
Discussion
This study applied a linear mixed model approach to explore the relative patterns of accuracy and variability on the synchronization–continuation task for treated and de novo patients with PD and healthy controls. In one of the most comprehensive assessments to date, our primary finding is that the treated PD group are distinguishable from the PD-de novo and control groups when tapping at the 250-ms rate. The treated PD patients tap “ahead” of the beat, whilst the other groups tap “behind” the beat. We liken this anticipatory motor response to the clinical phenomenon of motor “hastening” or festination. Regarding variability, motor timing at an ISI of 500 ms reduced the variability for all participants, which we speculate is indicative of a preferred finger tapping rate. For the longer (>250 ms) intervals, accuracy, and variability were compromised during the self-paced continuation phase compared to the synchronization phase. Related to this, the continuation phase was a better discriminator of performance, with the participants with PD showing more atypical motor timing behavior during continuation tapping.
Dopaminergic medication, although improving the UPDRS Part III motor score, did not have a substantive effect on motor timing performance in the PD-treated group. There are several possible explanations for this finding. The overnight medication withdrawal may be too short, or the individual pharmacokinetic or pharmacodynamic properties of different dopaminergic therapies may need to be taken into account. An alternative interpretation is that dopaminergic intervention does not produce robust changes in repetitive finger tapping or that the use of compensatory motor circuits when “off” medication can enable performance (see Jahanshahi et al., 2010). Previous research on repetitive tapping in PD has tested participants either exclusively “on” or “off” medication (e.g., Pastor et al., 1992; Freeman et al., 1993; Harrington et al., 1998; Yahalom et al., 2004), thus surprisingly little data on the effect of dopaminergic therapy on motor timing exists. The data that do exist are distinctly mixed in their findings. Pastor et al. (1992) assessed nine of their 42 PD patients “off” medication and after administration of 250 mg of levodopa. Dopaminergic therapy improved accuracy, as measured by the mean ITI, for the shorter intervals (400, 500, and 666 ms) but did not affect longer intervals (1000 and 2000 ms). O’Boyle et al. (1996) found that variability was worse “off” than “on” medication, although accuracy was not significantly different. Contradicting this, another study suggests no differences in variability between PD whether “on” or “off” medication (Merchant et al., 2008a).
To assess if treated PD patients performed differently to the other two groups, we compared the accuracy data collected both “off” and “on” medication (treated group) to healthy controls and de novo PD patients (untreated group). We found significant differences in the direction of the predicted relative error between the two groups for “short” (250 ms) compared to “long” (500, 1000, and 2000 ms) ISIs. This suggests that either long-term medication use influences performance, or that progression of PD results in more notable alterations to timing accuracy, especially during short intervals. A longitudinal study with a focus on modeling therapeutic dose and disease severity could help disambiguate these alternative hypotheses.
For all participants, performance on the synchronization phase was better than on the continuation phase for both accuracy and variability during the longer (500, 1000, 2000 ms) intervals. Previously, papers investigating motor timing in PD have tended not to explore the synchronization phase. One previous study found that performance for the PD group deteriorated in the continuation phase but that control group performance was maintained (Freeman et al., 1993). Our data are clear in showing that all groups found maintaining the rhythm more difficult in the continuation phase for intervals ≥ 500 ms. For these longer intervals, the difference in variability becomes greater as the target ISI increases, whereas accuracy is more stable. We have previously demonstrated that synchronization phase and continuation phase tapping activate distinct regions, which demonstrate the differential behavioral demands (Jahanshahi et al., 2010). Particularly, the continuation phase is unique in activating the dorsolateral prefrontal cortex (Jahanshahi et al., 2010), which is known to play a role in “willed” or “internally generated” actions (Jahanshahi et al., 1995). It has been shown that people with PD show greater differences from healthy controls in neural activation for internally generated than externally triggered movements (Jahanshahi et al., 1995). This would predict a polarized performance between the continuation and synchronization phases for the PD patients. Indeed, the data indicate that the PD group show greater relative impairment on the continuation phase than the synchronization phase.
Accuracy of Motor Timing
For the accuracy model, the key finding is that participants in the PD-treated group showed a hastening of their tapping (i.e., were “ahead of the beat”) at 250 ms, whereas the PD-de novo and control groups were behind the beat. This effect was more striking in the continuation phase. Indeed, for the continuation phase the estimated means and SEs of the two groups were distinctly either side of zero relative error, suggesting potential in the future for this task to be used in discriminating treated PD from other populations. A second model that dichotomized the intervals into “short” (250 ms) and “long” (500, 1000, 2000 ms) confirmed that the 250-ms interval can successfully discriminate the PD-treated group from the other participants in the study, whereas the groups were equivalent at the longer durations. The PD-de novo and control groups were able to maintain their level of accuracy at 250 ms during the more challenging continuation phase, whereas the performance of the PD-treated group became more extreme. For the longer durations, all groups showed deterioration in accuracy from the synchronization phase to the continuation phases. Indeed, the groups were close to zero relative error during the synchronization phase but behind the beat in the continuation phase.
If the control group is taken as the model for “typical” performance, the pattern of data suggest that the PD-treated group show an atypical hastening in their tapping at very short (250 ms) intervals. This finding is similar to the clinical phenomenon of festinating movements. Festination is the tendency to speed up when performing a repetitive movement and, for experimental studies, is typically identified when movement rate exceeds that of the healthy control group by a specified margin (e.g., Logigian et al., 1991; Moreau et al., 2007). Previously, oral festination has been measured by asking participants to repeat a syllable at different frequencies, synchronized to an auditory pacing tone (Logigian et al., 1991; Moreau et al., 2007). Consistent with our findings, festination (measured as either 2 or 3 SDs from control performance) was apparent for ISIs between 200 and 333 ms in the study by Moreau et al. (2007) and for ISIs below 400 ms in the study by Logigian et al. (1991) and was not observed for longer intervals. Speeded movements during finger and wrist versions of the synchronization (Nakamura et al., 1978; Logigian et al., 1991; Freeman et al., 1993; Stegemöller et al., 2009) and continuation tasks (Freeman et al., 1993) have also been observed. Nakamura et al. (1978) and Stegemöller et al. (2009) reported the phenomenon around an ISI of 400 ms, whereas Freeman et al. (1993) showed hastening compared to the control group in some participants at intervals between 250 and 500 ms. Logigian et al. (1991) required participants to perform isometric contractions of the index finger at different frequencies. In line with our findings, performance was comparable to controls at ISIs of 833 and 476 ms, but speeded between 185 and 385 ms, with the effects most obvious at 286 ms. There is a paucity of studies exploring the neurobiological correlates of motor festination in PD. Previous studies have speculated that aberrant oscillatory brain activity (Nakamura et al., 1978; Stegemöller et al., 2009) or motor activity influenced by tremor rate (Logigian et al., 1991) may explain the phenomenon. Stegemöller et al. (2009) found that increases in movement frequency were accompanied by a decrease in movement amplitude in participants with PD. Future research could benefit from integrated physiological exploration.
In interpreting the patient group data it is important to comment of the performance of our control group in comparison to previously reported healthy populations. It has been established that synchronization with a pacing stimulus produces a negative relative error in healthy individuals, i.e., tapping ahead of the beat (e.g., see Aschersleben, 2002). As with previous research (e.g., Flach, 2005), we find that the negative relative error is maintained in the continuation phase and is exaggerated. Flach’s (2005) explanation for this phenomenon is that the internal timing mechanism is systematically underestimating the ISI and this is being maintained in the self-paced condition. All our groups showed a negative relative error at ISIs of 500, 1000, and 2000 ms, but the control group showed a clear positive relative error, or tapping behind the beat, at 250 ms. A similar pattern of findings was found in a much earlier study by Peters (1989). Here, participants tapped in synchrony at ISIs ranging from 180 to 1000 ms. Healthy participants tapped behind the beat at 180 and 210 ms and ahead of the beat at intervals of 240 ms and greater. These findings speak to hypotheses that seek to establish a qualitative difference between different timing intervals and it has been speculated that different mechanisms might be in operation for the timing of very short intervals. One proposal is that when tapping speed is sufficiently fast the participant no longer experiences the taps as individual events and performance is in “automatic” rather than “controlled” mode (Peters, 1989). Within our own dataset, further evidence for a dissociation comes from the observation that the accuracy of performance was maintained in the switch to continuation tapping in the control group at 250 ms, whereas performance deteriorated for the longer intervals.
The difference between the PD-treated group and the other two groups at 250 ms was the most compelling evidence of differential accuracy performance in PD for motor timing. However, aside from the PD-de novo group showing greater negative error at 500 ms, and to a lesser extent at 1000 ms, there was no other evidence that the PD groups (PD-treated or PD-de novo) performed differently compared to the control group. Reflecting the current study, previous research has reported unimpaired repetitive timed movements in PD at durations of and above 476 ms (Logigian et al., 1991), 666 ms (Pastor et al., 1992) and 1000 ms (Jahanshahi et al., 2010). O’Boyle et al. (1996), Harrington et al. (1998), and Ivry and Keele (1989) have all found that a group with PD tapped at a significantly faster rate than a control group when “on” medication at intervals between 300 and 600 ms. In contrast, Pastor et al. (1992) reported that a group with PD were significantly slower at tapping with an ISI of 400 and 500 ms. In summary, despite the commonly asserted proposition that motor timing accuracy is impaired in PD, patients often perform well at longer intervals. The interval between 400 and 600 ms is subject to the most contrary findings, indicating that this is the key transition period for discriminating between groups. In light of this, future studies should place emphasis on the tapping intervals ≤ 600 ms when exploring accuracy in PD.
Variability of motor timing
Our variability measure was specifically calculated to take account of how much the error for each tap deviated from the predicted error for the group. Thus, we were quantifying how typical a participant’s performance was of their particular group.
Despite the significant three-way interaction, group differences were less striking for variability than for accuracy. The most distinct patterns were that the de novo PD group showed greater variability at the 2000-ms interval compared to all groups and particularly the treated PD group. One possibility is that this greater motor timing variability in the PD-de novo reflects the greater heterogeneity of this group. Alternatively, it is possible that the long-term use of dopamine has enduring effects on motor performance that persevere to an extent even in the “off” state. These effects could operate to reduce variability in motor timing in the treated PD group. Similar to previous work on cognition (e.g., Kulisevsky et al., 2000), future investigation of the chronic effect of dopaminergic therapy on motor timing in patients with or without motor fluctuations would be informative. There was some, albeit not consistent, suggestion of the PD-treated group showing reduced variability compared to the other groups at the higher intervals, most compellingly for the continuation phase at 1000 ms. This is difficult to interpret although this is not the first study to report reduced variance in PD (e.g., Jones et al., 2008).
Previous research has almost exclusively focused on variability during the continuation task. Two studies using a target interval of 550 ms have found no evidence of impaired variability in patients with PD, at least at the group level (Ivry and Keele, 1989; Spencer and Ivry, 2005), although O’Boyle et al. (1996) reported impairment using an identical duration. However, Merchant et al. (2008a) reported a deficit in PD for intervals between 350 and 1000 ms, albeit using a much shorter number of taps, and Harrington et al. (1998) reported impairment in PD for intervals of 300 and 600 ms. Pastor et al. (1992) also found increased variability for repetitive wrist movements at ISIs ranging from 400 to 2000 ms ISI. Variability in the synchronization task does not appear to be impaired in PD in previous studies, at least at the whole group level (e.g., Yahalom et al., 2004). However, the approach taken in our study is somewhat different to previous work. In including each tap in the model we improve the fidelity of our analysis. Further, we compare taps to the predicted group relative error, rather than a person’s own mean. What is clear in the current data set is that all groups showed the same pattern of increasing variability between 500 and 2000 ms, with the variability produced by the continuation phase becoming increasingly divergent from the better synchronization phase performance.
It is notable that variability was lowest in all groups for the 500-ms interval. Yahalom et al. (2004) asked participants with and without PD to tap at their most comfortable pace. For the control group this was around 580 ms and for the PD group around 685 ms. Thus, 500 ms is an interval that approximately aligns with the rhythm that participants are likely to find most “natural” and as a result show less variability in their performance. Given that our accuracy data, combined with a review of previous literature, suggests that the point at which the accuracy of repetitive tapping is compromised in PD is somewhere between 250 and 500 ms, this further supports the idea that this very short interval range is of particular significance in understanding motor timing behavior. It can be hypothesized that participants will not show atypical accuracy and variability at their preferred tapping rate, so perhaps the mixed results across studies reflect that some groups with PD have a higher natural rhythm preference. Reflecting on both the work of Yahalom et al. (2004) and Logigian et al. (1991), further work could seek to combine data on motor timing using the synchronization–continuation task, natural or preferred tapping rate preference, and inherent tremor oscillation rate. The interplay between these three factors may prove illuminating.
Conclusion
Our data find a striking phenomenon of tapping ahead of the beat for treated patients with PD at intervals of 250 ms. The data add to a sparse but generally consistent literature that festination occurs in PD for fast (ISI < 500 ms) repetitive movements. Whereas patients with PD diverge from control performance at short intervals for measures of accuracy, they are more distinct at longer intervals (ISI of 1000 and 2000 ms) for variability. Whilst dopaminergic medication state at the time of testing (“on” vs. “off” medication) did not affect performance across any of the conditions, there is suggestion of differences between the treated and de novo patients for both accuracy and variability. This highlights the need to look at chronic medication effects in PD. The performance of the PD patients and the control group were more similar for the synchronization phase than the continuation phase. This likely reflects the difficulties that individuals with PD have with internally generated movements (e.g., Jahanshahi et al., 1995). Future research would benefit from exploring heterogeneity within the population with PD as well as correlating clinical phenotypes, such as festinating gait, to motor timing.
Conflict of Interest Statement
The authors declare that the research was conducted in the absence of any commercial or financial relationships that could be construed as a potential conflict of interest.
Acknowledgments
The collection of these data was supported by a grant from the Brain Research Trust, UCL Institute of Neurology and a Medical Research Council Ph.D. studentship. Analysis was supported by a Collaborative Development Award from the British Council.
References
Aschersleben, G. (2002). Temporal control of movements in sensorimotor synchronization. Brain Cogn. 48, 66–79.
Baayen, R. H. (2008). Analyzing Linguistic Data. A Practical Introduction to Statistics Using R. Cambridge: Cambridge University Press.
Baayen, R. H., Davidson, D. J., and Bates, D. M. (2008). Mixed-effects modeling with crossed random effects for subjects and items. J. Mem. Lang. 59, 390–412.
Bates, D., Maechler, M., and Bolker, B. (2011). lme4: Linear mixed-effects models using S4 classes. R package version 0.999375-42. Available at: http://CRAN.R-project.org/package=lme4
Beck, A. T., Ward, C. H., Mendelson, M., Mock, J., and Erbaugh, J. (1961). An inventory for measuring depression. Arch. Gen. Psychiatry 4, 561–571.
Collier, G. L., and Ogden, R. T. (2001). Variance decomposition of tempo drift in isochronous rhythmic tapping. Ann. N. Y. Acad. Sci. 930, 405–408.
Fahn, S., Elton, R. L., and Committee, M. O. T. U. D. (1987). “Unified Parkinson’s disease rating scale,” in Recent Developments in Parkinson’s Disease, eds S. Fahn, C. D. Marsden, D. B. Calne, and M. Goldstein (Florham Park, NJ: Macmillan Healthcare Information), 153–164.
Flach, R. (2005). The transition from synchronization to continuation tapping. Hum. Mov. Sci. 24, 465–483.
Folstein, M. F., Folstein, S. E., and Mchugh, P. R. (1975). “Mini-mental state”: a practical method for grading the cognitive state of patients for the clinician. J. Psychiatr. Res. 12, 189–198.
Freeman, J. S., Cody, F. W., and Schady, W. (1993). The influence of external timing cues upon the rhythm of voluntary movements in Parkinson’s disease. J. Neurol. Neurosurg. Psychiatr. 56, 1078–1084.
Gronwall, D., and Wrightson, P. (1981). Memory and information processing capacity after closed head injury. J. Neurol. Neurosurg. Psychiatr. 44, 889–895.
Harrington, D. L., Haaland, K. Y., and Hermanowicz, N. (1998). Temporal processing in the basal ganglia. Neuropsychology 12, 3–12.
Hoehn, M. M., and Yahr, M. D. (1967). Parkinsonism: onset, progression and mortality. Neurology 17, 427–442.
Hughes, A. J., Daniel, S. E., Kilford, L., and Lees, A. J. (1992). Accuracy of clinical diagnosis of idiopathic Parkinson’s disease: a clinicopathological study of 100 cases. J. Neurol. Neurosurg. Psychiatr. 55, 181–184.
Ivry, R. B., and Keele, S. W. (1989). Timing functions of the cerebellum. J. Cogn. Neurosci. 1, 136–152.
Jahanshahi, M., Jenkins, I. H., Brown, R. G., Marsden, C. D., Passingham, R. E., and Brooks, D. J. (1995). Self-initiated versus externally triggered movements. I. An investigation using measurement of regional cerebral blood flow with PET and movement-related potentials in normal and Parkinson’s disease subjects. Brain 118(Pt 4), 913–933.
Jahanshahi, M., Jones, C. R. G, Zijlmans, J., Katzenschlager, R., Lee, L., Quinn, N., Frith, C. D., and Lees, A. J. (2010). Dopaminergic modulation of striato-frontal connectivity during motor timing in Parkinson’s disease. Brain 133, 727–745.
Jones, C. R. G., Malone, T. J., Dirnberger, G., Edwards, M., and Jahanshahi, M. (2008). Basal ganglia, dopamine and temporal processing: performance on three timing tasks on and off medication in Parkinson’s disease. Brain Cogn. 68, 30–41.
Jones, C. R. G., and Jahanshahi, M. (2009). The substantia nigra, the basal ganglia, dopamine and temporal processing. J. Neural Transm. Suppl. 73, 161–171.
Kulisevsky, J., García-Sánchez, C., Berthier, M. L., Barbanoj, M., Pascual-Sedano, B., Gironell, A., and Estévez-González, A. (2000). Chronic effects of dopaminergic replacement on cognitive function in Parkinson’s disease: a two-year follow-up study of previously untreated patients. Mov. Disord. 15, 613–626.
Logigian, E., Hefter, H., Reiners, K., and Freund, H. J. (1991). Does tremor pace repetitive voluntary motor behavior in Parkinson’s disease? Ann. Neurol. 30, 172–179.
Madison, G. (2001). Variability in isochronous tapping: higher order dependencies as a function of intertap interval. J. Exp. Psychol. Hum. Percept. Perform. 27, 411–422.
Maxwell, S. E., and Delaney, H. D. (2004). Designing Experiments and Analyzing Data: A Model Comparison Perspective. Mahwah, NJ: Lawrence Erlbaum Associates.
Merchant, H., Luciana, M., Hooper, C., Majestic, S., and Tuite, P. (2008a). Interval timing and Parkinson’s disease: heterogeneity in temporal performance. Exp. Brain Res. 184, 233–248.
Merchant, H., Zarco, W., and Prado, L. (2008b). Do we have a common mechanism for measuring time in the hundreds of millisecond range? Evidence from multiple-interval timing tasks. J. Neurophysiol. 99, 939–949.
Moreau, C., Ozsancak, C., Blatt, J. L., Derambure, P., Destee, A., and Defebvre, L. (2007). Oral festination in Parkinson’s disease: biomechanical analysis and correlation with festination and freezing of gait. Mov. Disord. 22, 1503–1506.
Nakamura, R., Nagasaki, H., and Narabayashi, H. (1978). Disturbances of rhythm formation in patients with Parkinson’s disease: part I. Characteristics of tapping response to the periodic signals. Percept. Mot. Skills 46, 63–75.
O’Boyle, D. J., Freeman, J. S., and Cody, F. W. (1996). The accuracy and precision of timing of self-paced, repetitive movements in subjects with Parkinson’s disease. Brain 119(Pt 1), 51–70.
Pastor, M. A., Jahanshahi, M., Artieda, J., and Obeso, J. A. (1992). Performance of repetitive wrist movements in Parkinson’s disease. Brain 115(Pt 3), 875–891.
Peters, M. (1989). The relationship between variability of intertap intervals and interval duration. Psychol. Res. 51, 38–42.
Pope, P. A., Praamstra, P., and Wing, A. M. (2006). Force and time control in the production of rhythmic movement sequences in Parkinson’s disease. Eur. J. Neurosci. 23, 1643–1650.
Raudenbush, S. W., and Bryk, A. S. (2002). Hierarchical Linear Models: Applications and Data Analysis Methods. Newbury Park, CA: Sage.
R Development Core Team (2011). R: a language and environment for statistical computing. R Foundation for Statistical Computing, Vienna, Austria. Available at: http://www.R-project.org/.
Snijders, T., and Bosker, R. (1999). Multilevel Analysis: An Introduction to Basic and Applied Multilevel Analysis. London: Sage.
Spencer, R. M., and Ivry, R. B. (2005). Comparison of patients with Parkinson’s disease or cerebellar lesions in the production of periodic movements involving event-based or emergent timing. Brain Cogn. 58, 84–93.
Stegemöller, E. L., Simuni, T., and MacKinnon, C. (2009). Effec of movement frequency on repetitive finger movements in patients with Parkinson’s disease. Mov. Disord. 24, 1162–1169.
Tiffin, J., and Asher, E. J. (1948). The Purdue pegboard; norms and studies of reliability and validity. J. Appl. Psychol. 32, 234–247.
Wing, A. M., and Kristofferson, A. B. (1973a). Response delays and timing of discrete motor responses. Percept. Psychophys. 14, 5–12.
Wing, A. M., and Kristofferson, A. B. (1973b). Timing of interresponse intervals. Percept. Psychophys. 13, 455–460.
Yahalom, G., Simon, E. S., Thorne, R., Peretz, C., and Giladi, N. (2004). Hand rhythmic tapping and timing in Parkinson’s disease. Parkinsonism Relat. Disord. 10, 143–148.
Appendix
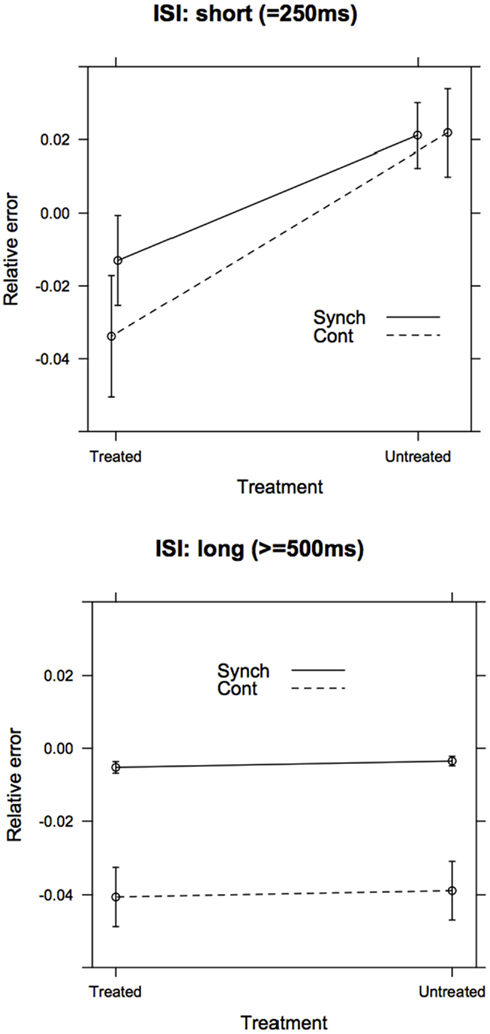
Figure A1. Separate post hoc models for the accuracy (relative error) of short (ISI = 250 ms) and long (ISI ≥ 500 ms) intervals. As predicted, the Group (treated vs. untreated) × Task Phase (Synchronization vs. Continuation) interaction was significant in the Short ISI model, but not in the Long ISI model.
Keywords: motor timing, Parkinson’s disease, temporal processing, synchronization, continuation, dopamine, linear mixed model
Citation: Jones CRG, Claassen DO, Yu M, Spies JR, Malone T, Dirnberger G, Jahanshahi M and Kubovy M (2011) Modeling accuracy and variability of motor timing in treated and untreated Parkinson’s disease and healthy controls. Front. Integr. Neurosci. 5:81. doi: 10.3389/fnint.2011.00081
Received: 01 August 2011; Paper pending published: 14 September 2011;
Accepted: 26 November 2011; Published online: 23 December 2011.
Edited by:
Warren H. Meck, Duke University, USAReviewed by:
Regina H. Silva, Federal University of Rio Grande do Norte, BrazilJohn F. Araujo, Federal University of Rio Grande do Norte, Brazil
Copyright: © 2011 Jones, Claassen, Yu, Spies, Malone, Dirnberger, Jahanshahi and Kubovy. This is an open-access article distributed under the terms of the Creative Commons Attribution Non Commercial License, which permits non-commercial use, distribution, and reproduction in other forums, provided the original authors and source are credited.
*Correspondence: Catherine R. G. Jones, Department of Psychology, University of Essex, Colchester, Essex, CO4 3SQ, UK. email:Y3Jnam9uZXNAZXNzZXguYWMudWs=; Michael Kubovy, Department of Psychology, University of Virginia, P. O. Box 400400, Charlottesville, VA 22904-4400, USA. e-mail:a3Vib3Z5QHZpcmdpbmlhLmVkdQ==


 Tim Malone4
