 Hannah J. Penn
 Michael D. Simone-Finstrom
 Lilia I. de Guzman2
- 1USDA ARS, Sugarcane Research Unit, Houma, LA, United States
- 2USDA ARS, Honey Bee Breeding, Genetics and Physiology Research Laboratory, Baton Rouge, LA, United States
Nutrition is an important component of social insect colony health especially in the face of stressors such as parasitism and viral infections. Honey bees are known to preferentially select nectar and pollen based on macronutrient and phytochemical contents and in response to pathogen loads. However, given that honey bees live in colonies, collective foraging decisions may be impacted directly by forager infection status but also by colony health. This field experiment was conducted to determine if honey bee viral infections are correlated with pollen and nectar foraging and if these associations are impacted more by colony or forager infection. By comparing regressions with and without forager and colony variables and through structural equation models, we were able to determine the relative contributions of colony and forager virus loads on forager decisions. We found that foragers had higher numbers and levels of BQCV and CBPV but lower levels of DWV viruses than their respective colonies. Overall, individuals appeared to forage based a combination of their own and colony health but with greater weight given to colony metrics. Colony parasitism by Varroa mites, positively correlated with both forager and colony DWV-B levels, was negatively associated with nectar weight. Further, colony DWV-B levels were negatively associated with individually foraged pollen protein: lipid ratios but positively correlated with nectar weight and sugar content. This study shows that both colony and forager health can simultaneously mediate individual foraging decisions and that the importance of viral infections and parasite levels varies with foraging metrics. Overall, this work highlights the continued need to explore the interactions of disease, nutrition, and genetics in social interactions and structures.
Introduction
Honey bees [Apis mellifera Linnaeus (Hymenoptera: Apidae)] are important pollinators for agricultural production. In North America, particularly in high-value crops such as almonds, their contribution is an estimated $1 billion annually (1, 2). However, in recent years, concerns over colony health have increased based on the rates of annual colony loss (40% in 2017–2018) (3, 4). Nutrition is a critical component of colony health in honey bees [Apis mellifera Linnaeus (Hymenoptera: Apidae)] as it impacts the production of brood, overwintering survival, and disease susceptibility (5–10). Pollen and nectar assist in regulating bee immune response, enabling the bee to maintain functionality despite stressors (8, 11). For instance, pollen consumption upregulates vitellogenin expression associated with bee health (12), while honey (processed nectar) consumption upregulates detoxification genes (13).
Within the honey bee colony, foragers are responsible for scouting and collecting food items like nectar and pollen then transporting items back to the nest where items will be distributed or stored by food storing bees for later consumption (14, 15). The need for collective foraging is communicated to foragers through the availability of food storer bees and storage sites as well as chemical cues obtained via trophallaxis and olfactory signals (14, 16–20). Olfactory cues from previously obtained food items may also prime foragers to select specific foraging sites or target particular plant species (21, 22).
Once in the field, foragers are able to assess the nutritional quality and quantity of food items, recruiting more foragers to productive patches and plants (23–26). For instance, pollen can vary greatly in macronutrient content (12–60% protein, 1–20% lipid) (27, 28), which can then be detected and selectively foraged by honey bees (29–32). Collectively foraged food items are then returned to the nest, where, after storage, nurse bees feed developing larvae (though they do not necessarily assess macronutrient contents themselves) (33–35).
Food items from different plant taxa have differential impacts on honey bee immune pathways and susceptibility to stressors (5, 36–40). For instance, sunflower pollen has been shown to decrease Crithidia replication in bees and alter immunity-related gene expression (41–43). Similarly, a combination of clover and partridge pea pollen reduces virus-induced mortality relative to single source pollen (44). Whereas, bees consuming eucalyptus pollen experienced lower expression of immune genes but higher loads of Nosema compared to bees consuming polyfloral pollen (45). Food source interactions with immune pathways may be due, in part, to particular macronutrient profiles that enable bees to overcome stressors (6, 46–48). Protein helps repair and build tissues while lipids provide energy for bees (12, 38). Bees given pollen with lower protein: lipid (P:L) ratios had higher survival under stress than those given pollen with higher P:L ratios (49). Similarly, pollen containing higher fat content was found to reduce Deformed wing virus (DWV) levels (50).
The type of pathogen or parasite, however, appears to impact how immune response interacts with different macronutrients, which is not unexpected as honey bee viruses differ in how they are transmitted, where within the body they proliferate, and associated symptoms (51, 52). Fungal pathogens induced lipid-rich pollen foraging, which increased survival of infected individuals (53). Whereas, pollen containing higher protein levels has been shown to alter bee immune responses to Nosema spp. infections, increasing survival and diminishing spore loads (41, 54–56). Similarly, pollen high in protein and amino acids can confer protection from Israeli acute paralysis virus (IAPV)-induced bee mortality (57). Infection or parasitism itself may alter forager food preferences (58). Healthy honey bee foragers exhibit a greater frequency and duration of foraging trips and focus more on pollen than nectar relative to foragers infected with Nosema apis (Zander) (37).
Foraging for plant-derived resources may be influenced by infection at the colony or individual bee level (9, 59–62). Bee foragers face the dilemma on whose needs to forage for—themselves or the colony as a whole—as foragers are responsible for communicating information about floral resources to the rest of the colony in addition to their collective foraging tasks (63–65). In ants, foragers selecting high-carbohydrate diets can increase levels of social immunity against fungal pathogens in the colony with individual foragers benefitting from group immunity and colony-level nutrition (66). Honey bee resin foraging has been noted to be influenced by colony-level Varroa mite infestation (61), providing suggestive evidence that colony infection/infestation status influences individual foraging (59). Despite clear colony drivers in some foraging decisions, individual infection status (in terms of preference or ability) could override these priorities (47, 67), meaning that forager needs may not be entirely aligned with colony-level benefits (68). For instance, Nosema-infected honey bees have been shown to forage for items that enhance their own health status (69); and the same may hold true for honey bees facing viral challenges (70, 71).
Given that colony health relies both on collective foraging and social immunity, but these facets are mediated by individual bees, we wanted to assess the interplay of these two aspects of colony life. First, we determined if honey bees forage on macronutrients based on infection status; and then we assessed if foragers altered their preferences in response to their own or colony viral loads. This was overlayed with a preliminary investigation of variation in these responses among different honey bee stocks (i.e., distinct commercially produced populations or specific lines bred for particular traits of interest such as resistance to Varroa mite parasitism). To do this, we evaluated individual pollen foraging in terms of protein and lipid content, individual nectar foraging (quantity and sugar content), as well as colony and forager viral loads. We predicted that increased mite and viral loads would result in an increase in collected pollen protein content (41, 72). Further, given that viral infections also pre-dispose Hymenopterans to increased foraging on high-sugar sources (37, 73), we expected that higher virus levels would result in higher sugar content of nectar loads. Prior work has indicated that individual action may be based on a combination of individual ability (67, 69) and social immunity or collective foraging requirements (9, 59–62). But given that individual health status influences how well an individual can forage for the colony, we expected that foragers would collect food items based primarily individual rather than colony infection status.
Materials and Methods
Source Colonies and Sample Collection
An apiary was established at the Baton Rouge, LA, USDA Honey Bee Breeding, Genetics and Physiology Research Laboratory (30°22′56″N, 91°10′40″W) with nine colonies (three from each of the following stocks: Italian, Pol-Line, and Russian) using packaged bees (~0.90 kg or 7,000 worker bees per package). Pol-Line and Russian queens were sourced from the same USDA lab; mite-susceptible Italian queens were sourced from a commercial queen producer. Packages were installed on 23 April 2019 and supplied with sugar water for the first month via in-hive feeders. Colonies were equalized as necessary on 13 May and 5 June with additional brood and food (combination of pollen and nectar) frames. Colonies were sampled a minimum 6 weeks after the last brood supplement to allow time for the worker populations to reflect queen genetics. Colony and pollen forager sampling was completed once per month during the weeks of 22 July (time 1), 19 August (time 2), and 9 September 2019 (time 3). Nectar foragers were only collected for time 1 to streamline later collection periods.
Colony-level pollen preferences were determined using pollen traps for 4 days, with the pollen collected daily, mixed with previous days' samples from the same colony for that sampling period, and stored at −20°C for nutritional analyses. Throughout the course of study observation, colonies were not treated with miticide in order to obtain an accurate representation of naturally occurring Varroa mite levels. To estimate Varroa mite levels per 100 bees, ~300 nurse bees were sampled from brood frames per colony (stored at −20°C), washed using detergent, then bees and mites were counted (74, 75). A pool of 50 adult bees per colony was simultaneously sampled from two brood frames then stored at −80°C for colony viral analyses.
To sample nectar and pollen foragers, colony entrances were closed between 09:00 and 11:00, and returning foragers were collected using scintillation vials (1 forager/vial). Each vial was placed on ice for 2 min to reduce movement and prevent swallowing of the honey stomach contents. Pollen loads were removed from the corbiculae of each bee bearing pollen (N = 24/colony/time) and stored at −20°C for nutritional analyses. For each nectar forager (N = 24/colony), honey stomach content was collected into a pre-weighed microcapillary tube by gently squeezing the abdomen. Nectar load was assessed via weight measurements of the microcapillary tubes after sample collection (76). Microcapillary tube contents were then exuded onto a digital refractometer (MISCO Palm Abbe Digital Fluid Refractometer, Solon, OH, USA) for analysis of sugar content (Brix) (77). Due to maximum refractometer detection limitations, nectar loads >85% sugar content were designated as >85%. All collected pollen and nectar foragers were stored individually at −80°C for subsequent forager viral analysis.
Pollen Nutritional Analyses
For colony-level pollen nutritional analyses, 10 g of pollen collected via pollen traps from each colony for each time point were sent to the Agricultural Chemistry Laboratory (Louisiana State University, AgCenter, Baton Rouge, LA, USA) for analyses of crude protein (5 g) and fat content (5 g). For forager-level pollen analyses, pollen pellets (from both corbiculae of the same individual bee) were weighed and then one pellet was analyzed for protein content and one for lipid content. For protein analysis, pellets were individually homogenized using a handheld pestle, vortexed, and analyzed for total soluble protein using a Bradford Assay (Bio-Rad DC protein assay kit). Protein standards (0.28, 0.24, 0.2, 0.16, 0.12, 0.08, 0.04, and 0 mg/mL) were created using BSA (Bio-Rad). Five microliters of each sample and standard in triplicate were combined with 245 μL of Bradford reagent (Bio-Rad), incubated for 5 min, and analyzed using a spectrophotometer (SpectraMax Plus Microplate Reader) at 595 λ. For analysis of lipid content, pellets were individually dried in a desiccator at room temperature for 24 h, weighed, and analyzed using a modified chloroform-extraction (78, 79). Samples were vortexed with 0.2 mL 2% sodium sulfate. One milliliter of chloroform-methanol (2:1) was added, vortexed, then centrifuged 2,180 G for 5 min at room temperature. Three hundred microliters of the layer below the supernatant was combined with 0.6 mL of deionized water, vortexed, centrifuged again, and incubated at 90°C for 20 min. Three hundred microliters of 10 N sulfuric acid (Thermo Fisher Scientific, Waltham, MA, USA) was added, then samples were incubated at 90°C for 20 min followed by a 2-min ice bath for samples to reach room temperature. Hundred microliters of each sample was read on a spectrophotometer (SpectraMax Plus Microplate Reader) at 540 λ. Samples were compared against canola oil standards (0.20, 0.18, 0.15, 0.12, 0.09, 0.06, 0.03, and 0.015 mg/mL).
Viral Analyses
For colony-level viral analyses, nurse bee pools (N = 27 samples each, representing a pool of 50 bees/colony to generally approximate colony viral loads) were placed in 50 mL homogenization vials pre-fitted with ceramic beads then homogenized using a bead mill (Omni-Inc Bead Ruptor Elite, Kennesaw, GA, USA). For forager-level viral analyses, a subset of bees (N = 378 foragers total) from each colony and time was selected based on being at the high (N = 162 bees, N = 6 bees/colony/time) and low (N = 162 bees, N = 6 individual bees/colony/time) range of individually collected pollen protein levels or the high (N = 27 bees, N = 3 individual bees/colony) and low (N = 27 bees, N = 3 individual bees/colony) range of sugar content (Brix). Individual bees were homogenized by hand at 5°C in a metal bead bucket using sterilized plastic pestles. Following homogenization, 200 μL of Promega Lysis buffer and 200 μL of Promega Homogenization solution (Promega Corporation, Madison, Wisconsin, USA) were added to each sample. All samples were briefly vortexed then centrifuged for 10 min at 4°C at 14,000 rpm. Total sample RNA was then extracted from 400 μL cleared lysate using the Maxwell RSC 48 simplyRNA cartridges per manufacturer recommended protocol (Promega Corporation, Madison, Wisconsin, USA). RNA was stored in 0.6 mL elution tubes wrapped in parafilm (Bemis NA, Neenah, Wisconsin, USA) at −80°C until cDNA synthesis.
Before cDNA synthesis, frozen RNA samples were thawed on 5°C metal beads, briefly vortexed, then centrifuged. Each RNA sample was quantified via spectrophotometry (NanoDrop One, Thermo-Fisher Scientific Inc., Waltham, Massachusetts, USA) twice using 1 μL of sample each time. The mean ng/μL NanoDrop One readings were calculated per sample then used to determine the volume of sample RNA template and nuclease-free water required to reach a sample concentration of 100 ng of RNA. cDNA was then synthesized using 0.2 mL PCR strip tubes in two steps using Qiagen Quantitect Reverse Transcriptase kits (Thermo-Fisher Scientific Inc., Waltham, Massachusetts, USA). For step one, 2 μL of gDNA wipeout was added to the mix of RNA and water for a total reaction volume of 14 μL per sample. Samples were incubated per manufacturer protocol at 42°C for 2 min in a Bio-Rad T100 Thermal Cycler (Bio-Rad, Hercules, California, USA). Samples were then briefly vortexed and centrifuged before the addition of 6 μL of Step 2 Master Mix consisting of 4 μL 5X Buffer, 1 μL of RT Primer mix, and 1 μL of RT enzyme per sample. Samples were again briefly vortexed and centrifuged then placed into the Bio-Rad T100 Thermal Cycler (42°C for 25 min then 95°C for 3 min) per manufacturer protocol. Transcribed cDNA was in strips tubes were wrapped in parafilm and stored at −80°C until RT-qPCR.
For analyses of both colony and forager viral profiles, samples were analyzed for eight viruses (primers in Table 1): Acute bee paralysis virus (ABPV), Black queen cell virus (BQCV), Chronic bee paralysis virus (CBPV), Deformed wing virus genotype A (DWV-A), Deformed wing virus genotype B (DWV-B), Israeli acute paralysis virus (IAPV), Kashmir bee virus (KBV), and Lake Sinai virus (LSV), following well-established protocols (85–87). The reference gene β-actin was used to ensure sample quality (88). Each sample was replicated three times per primer pair for RT-qPCR analyses. All RT-qPCR reactions consisted of 5 μL SsoFast Universal SYBR Green supermix (Bio-Rad, Hercules, California, USA), 3 μL nuclease-free water (Promega Corp., Madison, WI), 0.5 μL forward primer, 0.5 μL reverse primer, and 1 μL cDNA from each sample. All reactions were run in Bio-Rad CFX96 or CFX Connect Thermal Cyclers (Bio-Rad, Hercules, California, USA) with all reactions of a specific primer occurring in the same machine. The PCR thermal cycling protocol for the DWV-A and CBPV primer pairs was 95°C for 5 min followed by 40 cycles of 95°C for 5 s and 53.5°C for 10 s then 72°C for 10 s; while the protocol for ABPV, β-actin, BQCV, DWV-B, KBV, and LSV was 95°C for 5 min followed by 40 cycles of 95°C for 5 s and 52.5°C for 10 s then 72°C for 10 s. The PCR cycling protocol for the IAPV primer pairs was 95°C for 5 min followed by 40 cycles of 95°C for 5 s and 53.5°C for 10 s then 72°C for 10 s. The thermal protocols included a melt-curve dissociation analysis to confirm product size. BQCV, CBPV, DWV-A, and DWV-B results were quantified using the Standard Curve Method using linearized plasmid constructs for pooled colony samples as well as individual nectar and pollen foragers. Quantified virus levels were log transformed for analyses and graphical representation; all other viruses were counted as positive for any cycle threshold (Ct) value registered at <40 cycles.
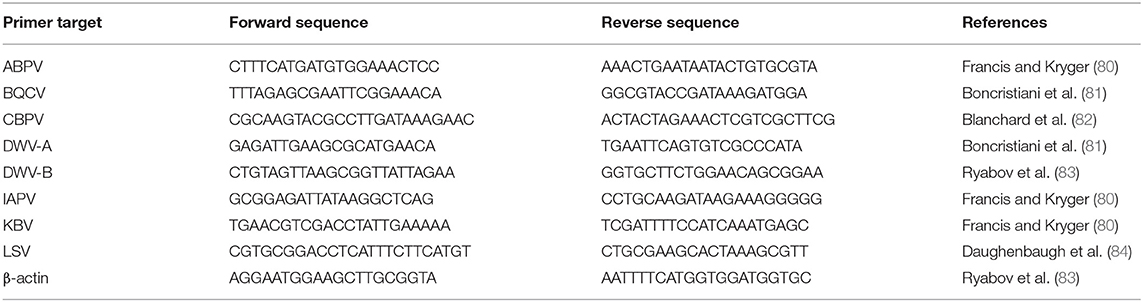
Table 1. Primers used for virus detection and sample quality.
Statistical Analyses
All analyses were conducted in JMP Pro 16.0.0 Pro (SAS Institute, Cary, NC, USA). Forager viral loads were compared to those of their respective colonies with the Kruskal-Wallis test. General associations among variables were determined using Spearman's rank correlation coefficient. To determine contribution of individual and colony level virus loads to individual foraging (% protein, % lipid, protein to lipid ratio (P:L), and nectar weight], we used the generalized regression function with a gaussian distribution. Independent variables included sampling month, Varroa mites per 100 bees (mites), and virus panel data [the total number of viruses (Virus), BQCV levels, CBPV levels, DWV-A levels, and DWV-B levels] for both the foragers and the colony as a whole. The variables representing the presence/absence of ABPV, BQCV, CBPV, IAPV, LSV, and KBV were not included as variation was not large enough to be meaningful, but these data can be found in the Supplementary Material. Due to the 85% cutoff for Brix measurements, nectar sugar content was grouped into low (0–33.0%), medium (33.1–66.0%), and high (66.1–85%) categories. The contribution of virus panel data to sugar content was evaluated using an ordered logit model in the generalized regression function using the same independent variables as above. Bee stock was added to some figures for demonstration purposes but was not included in the models due to small sample size per stock.
The relative contribution of forager and colony disease load to individual forager selection was initially evaluated by using model selection criteria (-log likelihood, AICc, BIC, and R2). The full model (as described above) was compared against models including only forager and only colony virus panel data. The relative contribution of colony vs. individual forager viral infections to individual foraging decisions was further analyzed using structural equation models (SEMs). In SEMs, measured variables (manifest variables) can be combined into a larger representative latent variable that describes some larger, unmeasured factor (89–91). Based on our a priori hypothesis that individual and colony level disease can contribute differentially to foraging preferences, we contrasted two sets of models for nectar and pollen foraging. Individual forager (i) and colony (c) manifest variables (virus number and log-transformed BQCV, CBPV, DWV-A, and DWV-B levels) were combined into two respective latent factors representing viral infection of the two sources (Forager and Colony). To account for potential interactions between observed colony and individual viral infection, all models allowed Forager and Colony latent factors to covary without specifying directionality. For nectar foragers, we modeled both Forager and Colony disease latent factors with direct relationships to a Nectar latent factor (nectar weight and sugar content manifest variables). We also repeated the nectar SEMs with nectar weight and sugar content manifest variables individually. As these models were not a good fit for nectar, we only present them in the Supplementary Materials. For pollen foragers, we modeled time as directly related to both latent disease factors and modeled both latent disease factors with direct relationships to the Pollen latent factor (% protein and % lipid manifest variables). We then modeled the latent disease factors against the individual pollen manifest variables. Model fit was assessed with a combination of the comparative fit index (CFI), root mean square error of approximation (RMSEA) with priority given to models closest to optimal values of CFI (>0.9) and RMSEA (<0.1) (92, 93). Models were estimated using maximum likelihood with 1,000 iterations. All SEM results are presented as standardized estimates to directly compare the contributions of colony and individual forager viral infection to foraging decisions.
Results
Viral Loads and Varroa Infestation Rate
Colony Varroa and Viral Loads
Colony mite levels were generally very low (mean 3.218 ± 1.004 mites/100 bees), with an increase over time (July: 1.271 ± 0.342; August: 2.281 ± 0.635; September: 6.102 ± 2.772). The higher mite levels in September were driven primarily by two colonies with mites loads over 20 mites per 100 bees (one Italian and one Russian colony). Colonies were infected with a mean of 5.123 ± 0.152 viruses over the entire observation period (Supplementary Tables 1, 2). Colony virus number was positively correlated (using Spearman's ρ) with colony levels of CBPV (Table 2). Colony DWV-B levels were also positively correlated with colony CBPV levels and Varroa mite levels (Table 2).
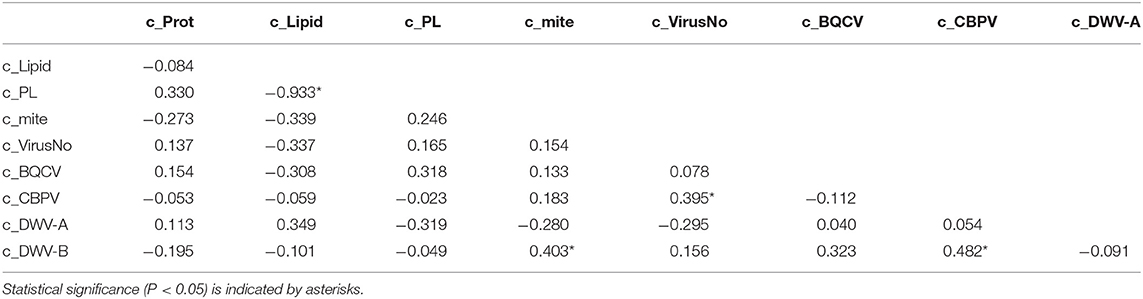
Table 2. Spearman's ρ correlation values for colony (c) and individual pollen forager (i) values of pollen protein, lipid, P:L ratio, virus number, and viral loads of BQCV, CBPV, DWV-A, and DWV-B.
Pollen Forager Viral Loads
Pollen foragers often differed in their virus loads from the pooled colony samples with the exception being total virus number (Figure 1). Pollen foragers exhibited an overall mean of 4.706 ± 0.027 viruses (Supplementary Tables 3, 4). When split out by observation month, pollen foragers did not differ from colonies in virus number except in August (July: P = 0.475; August: P = 0.020; September: P = 0.650). Overall, pollen foragers (105.647±0.021) had greater BQCV than the colony samples (104.713±0.181) with all timepoints being different (July: P = 0.015; August: P = 0.004; September: P < 0.001). CBPV was similar in colonies (101.895±0.455) and pollen foragers (100.751±0.039) over time except for September (July: P = 0.972; August: P = 0.536; September: P < 0.001). Foragers had lower levels of DWV-A (104.217±0.026) and DWV-B (106.581±0.055) than their associated colonies (DWV-A: 107.555±0.486; DWV-B: 108.880±0.449). This held for all time points (DWV-A: July: P < 0.001; August: P < 0.001; September: P < 0.001; DWV-B July: P = 0.149; August: P = 0.009; September: P < 0.001).
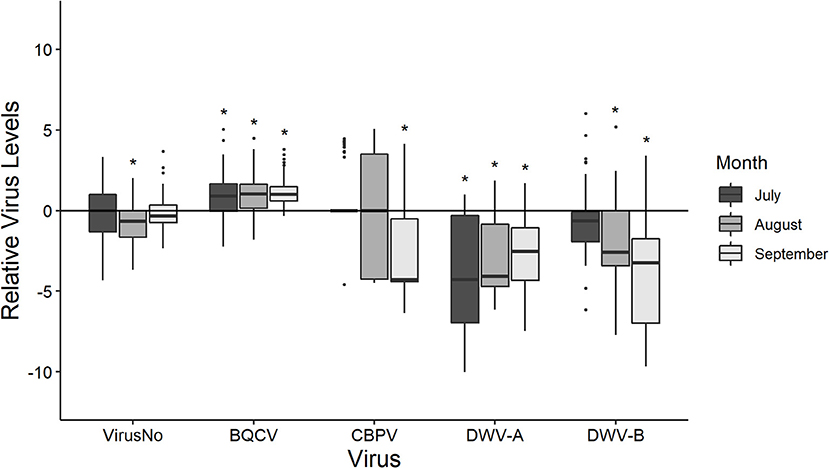
Figure 1. The disease levels of pollen foragers scaled to that their respective colonies at each time point (y-axis = 0). Boxplots are in the style of Tukey, with horizontal lines indicating median values while box limits indicate upper and lower quartiles. This was conducted for the total number of viruses (VirusNo) detected within the sample, log-transformed BQCV, CBPV, DWV-A, and DWV-B levels. Asterisks indicate significant differences between forager values and colony values as determined by Kruskal-Wallis test (P < 0.05).
Pollen forager virus loads were associated (using Spearman's ρ) with other viral infections at the individual level as well as those at the colony level (Table 3). Individual forager virus number was positively correlated with individual DWV-A and DWV-B levels as well as colony CBPV levels. Forager BQCV was negatively correlated with forager DWV-B levels, colony mite levels, and colony CBPV levels. Forager BQCV was only positively correlated with colony BQCV levels. Similarly, forager CBPV positively correlated with colony CBPV levels. Forager CBPV levels were negatively correlated with forager DWV-A and DWV-B levels as well as colony CBPV. Forager DWV-A was positively associated with individual DWV-B, colony CBPV, and colony DWV-B but was not associated with colony DWV-A. Forager DWV-B levels were positively correlated with all colony metrics except for colony BQCV, which was a negative association.
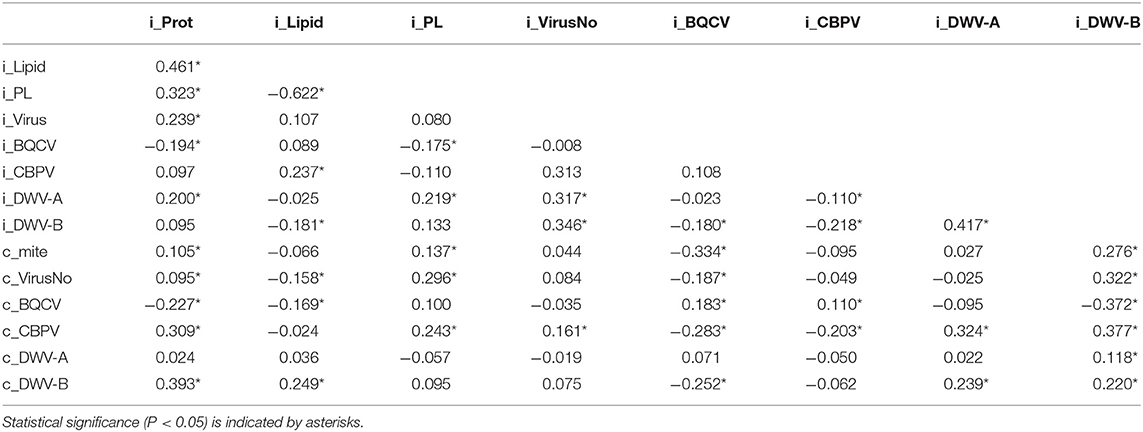
Table 3. Spearman's ρ correlation values for colony (c) and individual pollen forager (i) values of pollen protein, lipid, P:L ratio, virus number, and viral loads of BQCV, CBPV, DWV-A, and DWV-B.
Nectar Forager Viral Loads
Nectar foragers also differed in their virus loads from the pooled colony samples with the exception being DWV-B (Figure 2). Overall, nectar foragers had a greater number of viruses (5.315 ± 0.098; Supplementary Tables 5, 6) as well as levels of BQCV (106.185±0.197) and CBPV (102.874±0.349) than the colony samples. Nectar foragers had lower DWV-A levels (105.413±0.129) but not DWV-B levels (107.352±0.231) compared to the associated colonies.
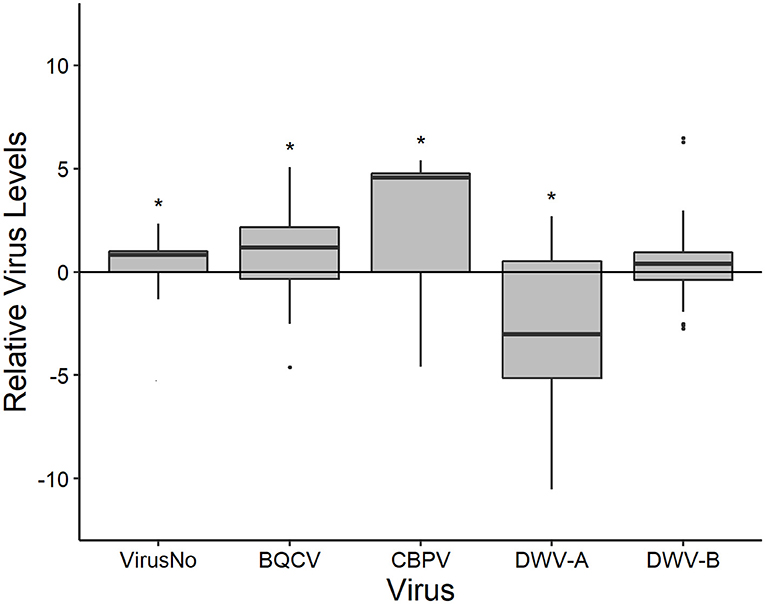
Figure 2. The disease levels of nectar foragers scaled to that their respective colonies (y-axis = 0). Boxplots are in the style of Tukey, with horizontal lines indicating median values while box limits indicate upper and lower quartiles. This was conducted for the total number of viruses (VirusNo) detected within the sample, log-transformed BQCV, CBPV, DWV-A, and DWV-B levels. Asterisks indicate significant differences between forager values and colony values as determined by Kruskal-Wallis test (P < 0.05).
Nectar forager virus loads were primarily associated (using Spearman's ρ) with viral infections at the individual level (Table 4). Individual nectar forager virus number was positively correlated with forager BQCV, CBPV, and DWV-A levels. Nectar Forager BQCV levels were positively correlated with individual CBPV, and DWV-A while forager DWV-A was positively correlated with forager DWV-B and colony CBPV. Finally, nectar forager DWV-B levels were positively correlated with colony Varroa mite and colony DWV-B levels.
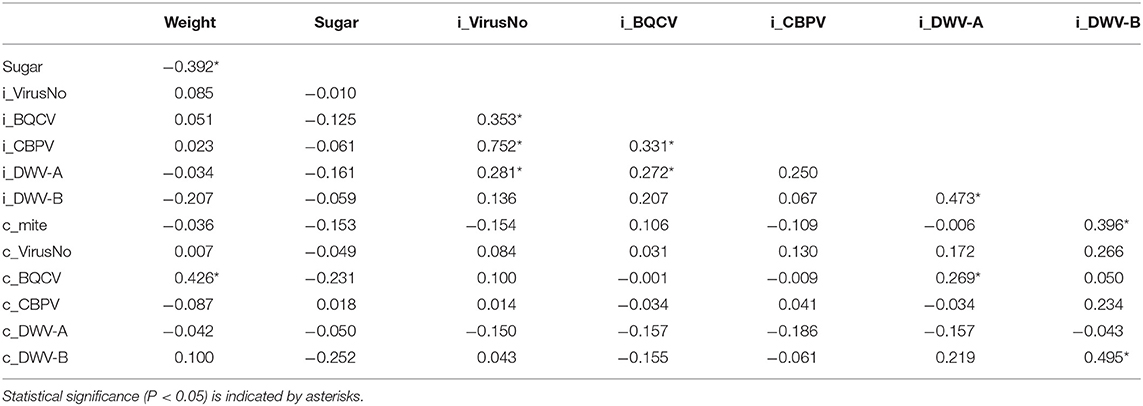
Table 4. Spearman's ρ correlation values for colony (c) and individual nectar forager (i) values of nectar weight (mg), sugar content (Brix), Virus number, and viral loads of BQCV, CBPV, DWV-A, and DWV-B.
Viral Interactions With Foraging
Pollen Foraging
Protein Content
The range of % protein in pollen dry weight varied more for foragers (0.531–33.948%) than the combined colony sample (10.5–18.4%). The mean protein content of individual pollen pellets (8.789 ± 0.180%) was lower than the pooled colony sample pellets (15.078 ± 0.390%). The protein content of the pollen pellets increased throughout the observation period, with September having significantly greater protein content than August and August having higher levels than July (Tukey HSD, P < 0.05).
Protein content of the forager's pollen pellet was correlated (using Spearman's ρ) with a combination of forager and colony virus metrics (Table 3). Forager and colony BQCV statuses were negatively associated with individually foraged pollen protein content. Forager pollen protein content was positively correlated with forager virus number and forager DWV-A. Forager pollen protein content was further correlated with colony Varroa mite levels, virus number, CBPV levels, and DWV-B levels. However, when we analyzed protein content of forager-collected pollen using regression, month of collection was the only significant variable (Table 5; Supplementary Table 7).
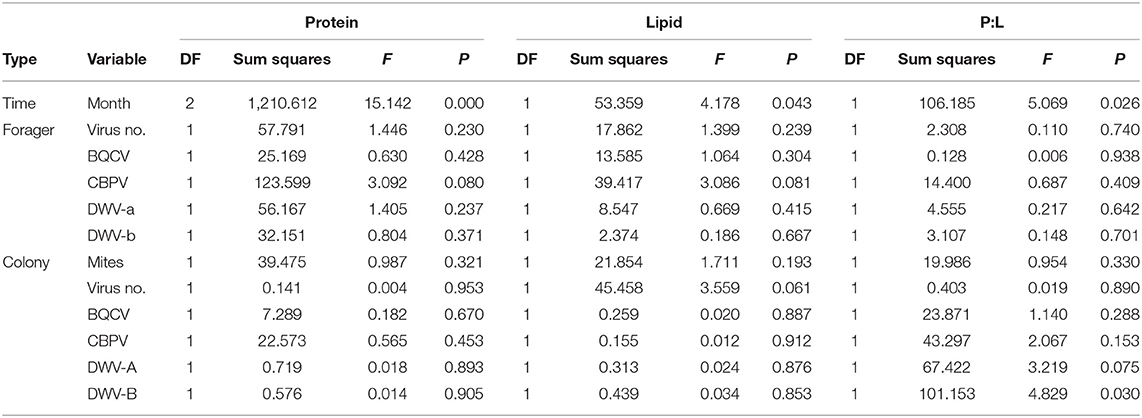
Table 5. Individual pollen forager generalized regression model effect test summaries for the percentage of protein and lipid in the collected pollen (dry weight) as well as the protein to lipid ratio (P:L).
Lipid Content
The range of % lipid in pollen dry weight varied more for foragers (0.095–15.384%) than the combined colony sample (0.70–3.14%). The mean lipid content of individual pollen pellets (4.966 ± 0.137%) was higher than the pooled colony sample pellets (1.908 ± 0.137%). The lipid content of the pollen increased throughout the observation period, with September having significantly greater lipid content than July (Tukey HSD, P < 0.05).
Lipid content of the forager's pollen pellet was also correlated (using Spearman's ρ) with a combination of forager and colony virus metrics, though the directionally if these associations differed based on if they were due to forager or colony infection (Table 3). For instance, while colony DWV-B was positively associated with individually foraged pollen lipid content, forager DWV-B levels were negatively associated with lipid content. Forager CBPV was also positively correlated while colony virus number and colony BQCV were negatively correlated. Again, when we analyzed lipid content of forager-collected pollen using regression, month of collection was the only significant variable (Table 5; Supplementary Table 7), though colony virus number was marginally negatively associated with lipid content (P = 0.059), matching the Spearman's ρ.
P:L Ratio
The range of individually foraged pollen P:L ratios again varied more for foragers (0.100–30.358) than the combined colony samples (4.342–15.586), potentially as a function of the high variability of both protein and lipid contents in the individually foraged pellets. The mean P:L individual pollen pellets (3.464 ± 0.174) was lower than the pooled colony sample pellets (9.369 ± 0.754). The P:L ratio of the pollen increased throughout the observation period, with September having significantly greater protein content than July (Tukey HSD, P < 0.05).
Like both the individual protein and lipid components, the P:L ratio of the individually foraged pollen pellet was associated (using Spearman's ρ) with a combination of forager and colony virus metrics (Table 3). Individually foraged pollen P:L was positively correlated with forager DWV-A as well as colony virus number and colony CBPV. Further, P:L was negatively associated with forager BQCV. Further, the regression model for P:L content indicated that month of collection and colony DWV-B levels were significant (Table 5; Supplementary Table 7), with higher colony DWV-B levels negatively associated with P:L ratios of individually foraged pollen (Figure 3; Supplementary Figure 1). Some of the P:L ratio interactions with forager and colony viral infections appeared to be contingent on bee stock (Supplementary Figures 5, 6), as aspect requiring further study.
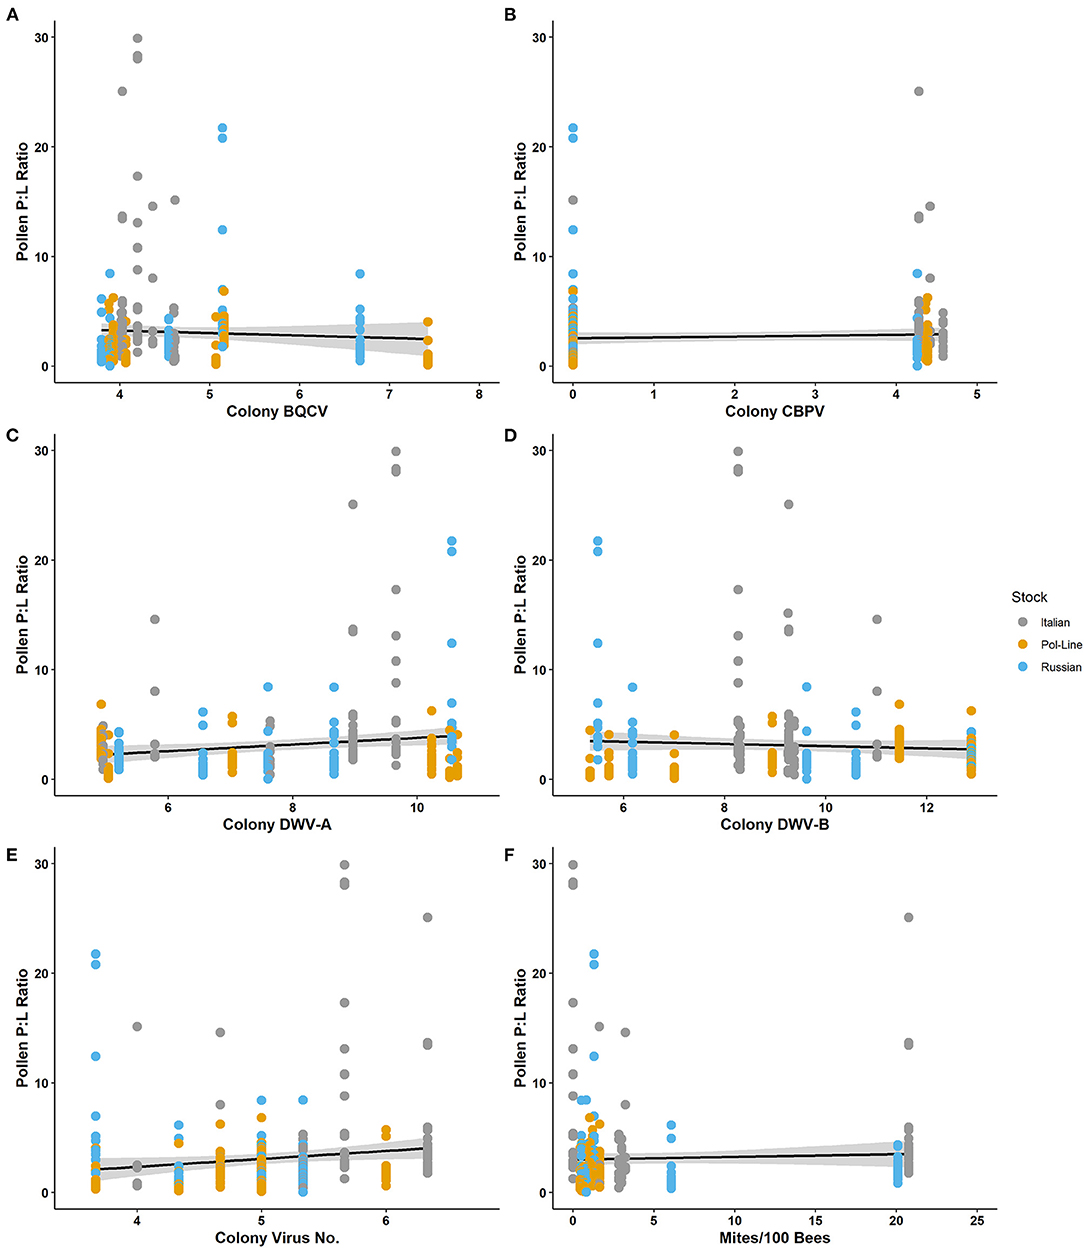
Figure 3. Protein: lipid ratios of individually foraged pollen relative to log-transformed colony level levels of (A) BQCV, (B) CBPV, (C) DWV-A, (D) DWV-B, (E) virus number, and (F) mites per 100 bees.
Nectar Foraging
Nectar Load Weight
Nectar weight ranged from 1.10 to 31.70 mg with a mean of 14.34 ± 1.16. Nectar weight was positively associated with colony BQCV (Table 4). The regression model for nectar weight also indicated that colony BQCV levels as well as colony mite levels were significant (Table 6; Supplementary Table 8). Increased colony BQCV levels were positively correlated with weight while higher mite levels were associated with a decrease in weight (Figure 4; Supplementary Figure 2). While not significant (P = 0.06), both forager and colony DWV-B levels appeared to potentially interact with weight but with opposite directionality (Supplementary Table 8). As with individually foraged pollen P:L ratios, individually foraged nectar weight appeared to interact with bee stock in terms of correlations with colony viral infections (Supplementary Figures 7–9), requiring further investigation.
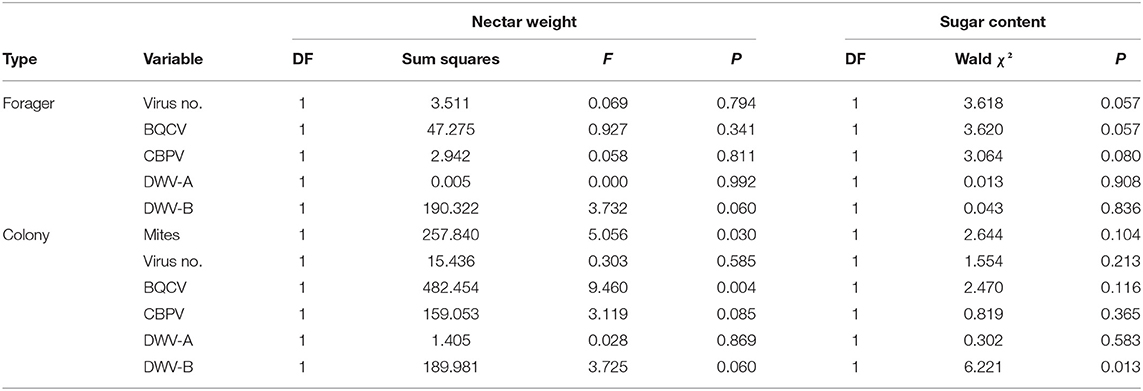
Table 6. Individual nectar forager generalized regression model effect test summaries for the nectar weight (mg) as well as the nectar sugar content (Brix, categorized into low, medium, and high values for an ordered logit).
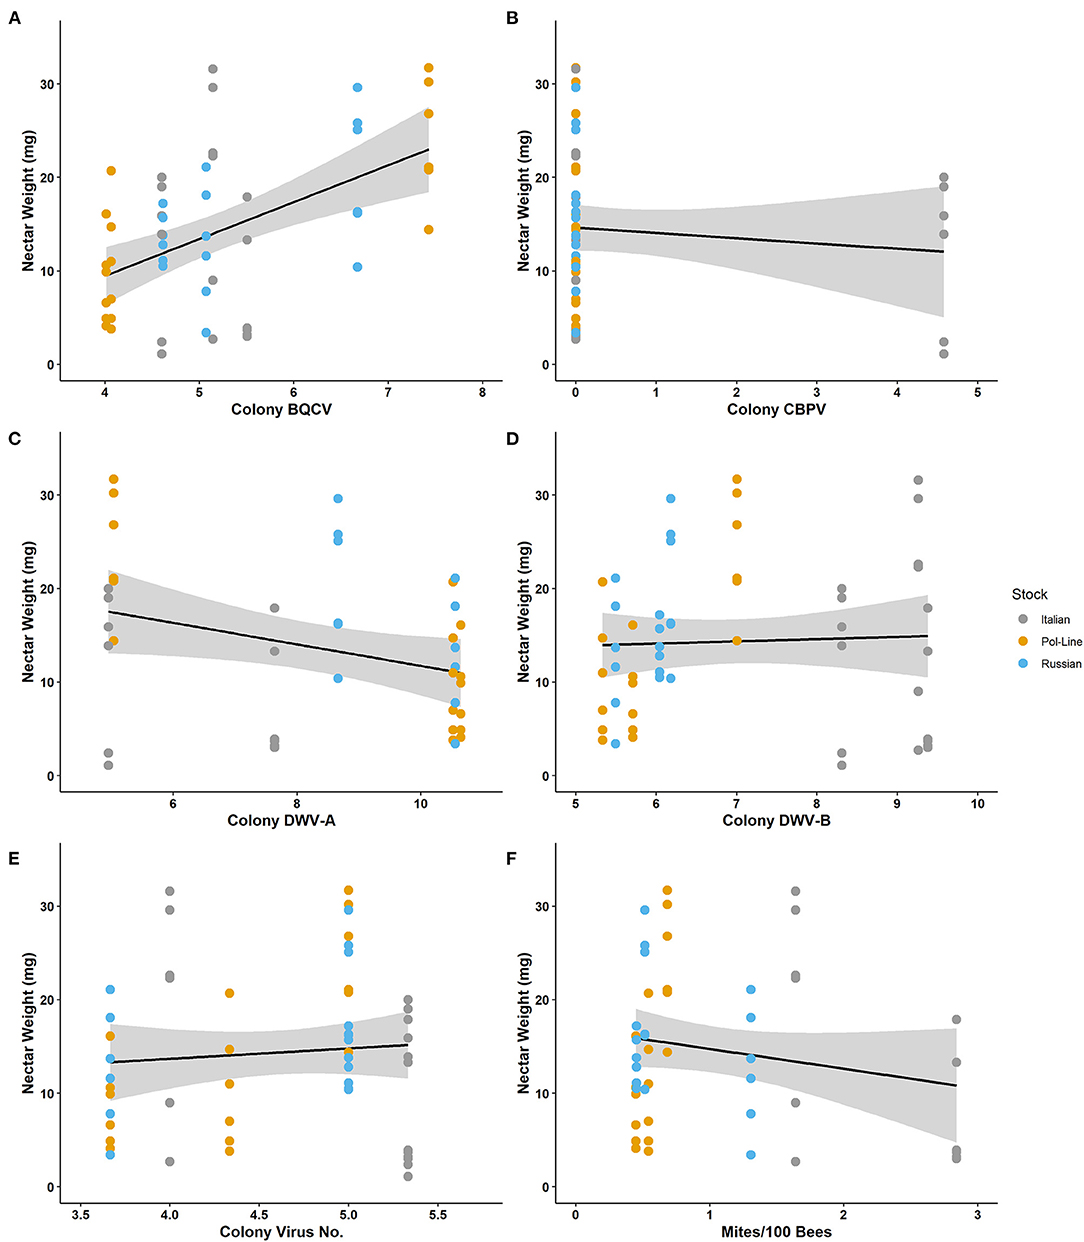
Figure 4. Nectar weight (mg) collected by individual foragers relative to log-transformed colony level levels of (A) BQCV, (B) CBPV, (C) DWV-A, (D) DWV-B, (E) virus number, and (F) mites per 100 bees.
Sugar Content (Brix)
Sugar content (Brix) was without categorization ranged from 21.6 to 85% with a mean of 56.27 ± 3.45. No variables aside from nectar weight were significantly associated (using Spearman's ρ) with sugar content as a continuous variable (Table 4). The only variable of potential note was colony DWV-B, with a marginal association (P = 0.066). Since sugar content measurements were artificially bounded at 85%, regressions used low (0–33.0%), medium (33.1–66.0%), and high (66.1–85%) categories as the dependent variable. The categories had an observed probability of 0.223 (low), 0.370 (medium), and 0.407 (high). The sugar content regression model using ordered logit, indicated that only colony DWV-B levels were significant (Table 6; Supplementary Table 8), with higher colony DWV-B levels being positively associated with nectar sugar content (Supplementary Figures 3, 4).
Relative Contribution Individual vs. Colony Infection
Pollen Foraging
When we compared the regression models with and without forager and colony virus panel data (Table 7), models with only colony variables had a higher R2 but also higher AICc and BIC values compared to the forager only models. For each aspect of pollen foraging, the full models with both forager and colony variables exhibited the best combination performance (in terms of R2, AICc, and BIC), indicating that a combination of forager and colony virus levels was impacting protein content of individually foraged pollen.
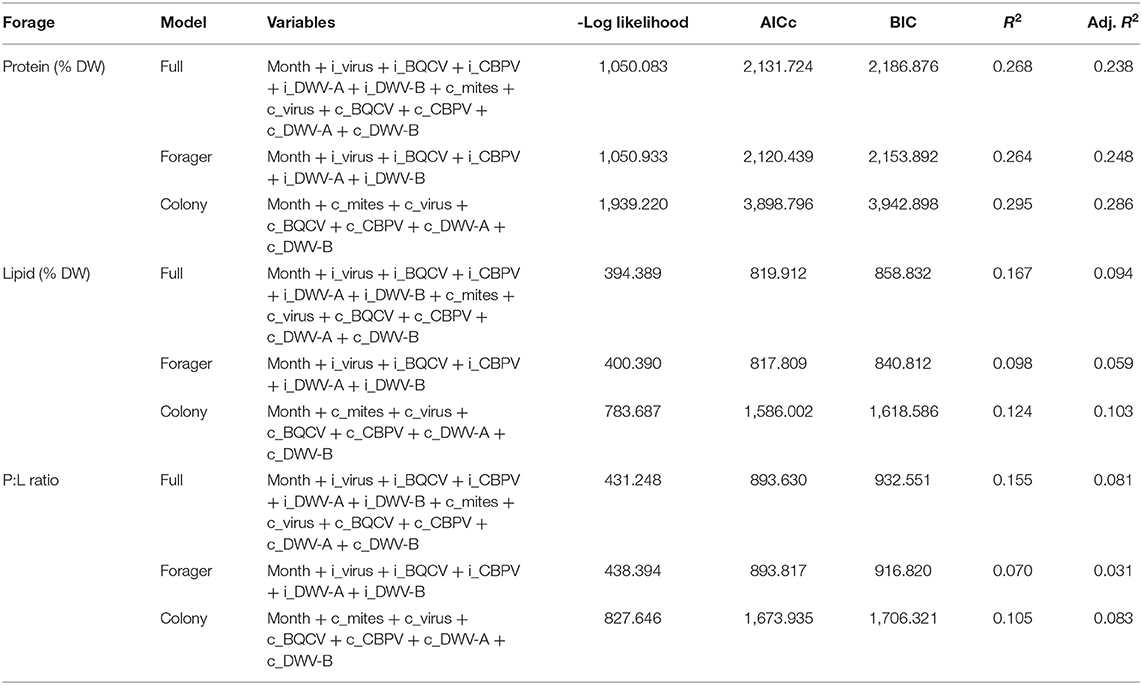
Table 7. Pollen model selection criteria comparing the full model with individual virus and colony virus metrics using several selection criteria.
The structural equation model (SEM) analyzing the relative contributions of individual pollen forager viral infection and colony viral infection to individual pollen foraging on protein was relatively strong (χ2 = 670.793, CFI = 0.677, RMSEA = 0.137). The SEM (Figure 5A) indicated that the Colony (Wald Z = −9.336, P < 0.001) and Forager latent factors (Wald Z = 4.851, P = 0.327) had significant impacts on the individually foraged pollen protein content. Like the regression comparison, while both Forager and Colony factors contributed to individual pollen foraging decisions, the Colony factors contributed to a greater degree than Forager factors. Time had a significant effect on Colony (Wald Z = −38.213, P < 0.001) and Forager latent factors (Wald Z = 5.379, P < 0.001), with a greater relative impact on Colony. Further, the Colony and Forager latent factors significantly covaried (Wald Z = −3.282, P < 0.001), indicating the virus levels of one impacted the other (though directionality was not tested in this model). The SEM for lipid content (Figure 5B) was similarly strong (χ2 = 649.554, CFI = 0.656, RMSEA = 0.135). Unlike the protein SEM, the lipid SEM indicated that the Colony latent factors (Wald Z = 2.468, P = 0.014) but not the Forager latent factors (Wald Z = 1.552, P = 0.121) contributed to individually foraged lipid content. Time impacted both Colony (Wald Z = 36.596, P < 0.001) and Forager latent factors (Wald Z = 3.897, P < 0.001), with time having a larger impact on Colony factors than Forager factors. Colony and Forager latent factors again significantly covaried (Wald Z = −2.257, P = 0.024).
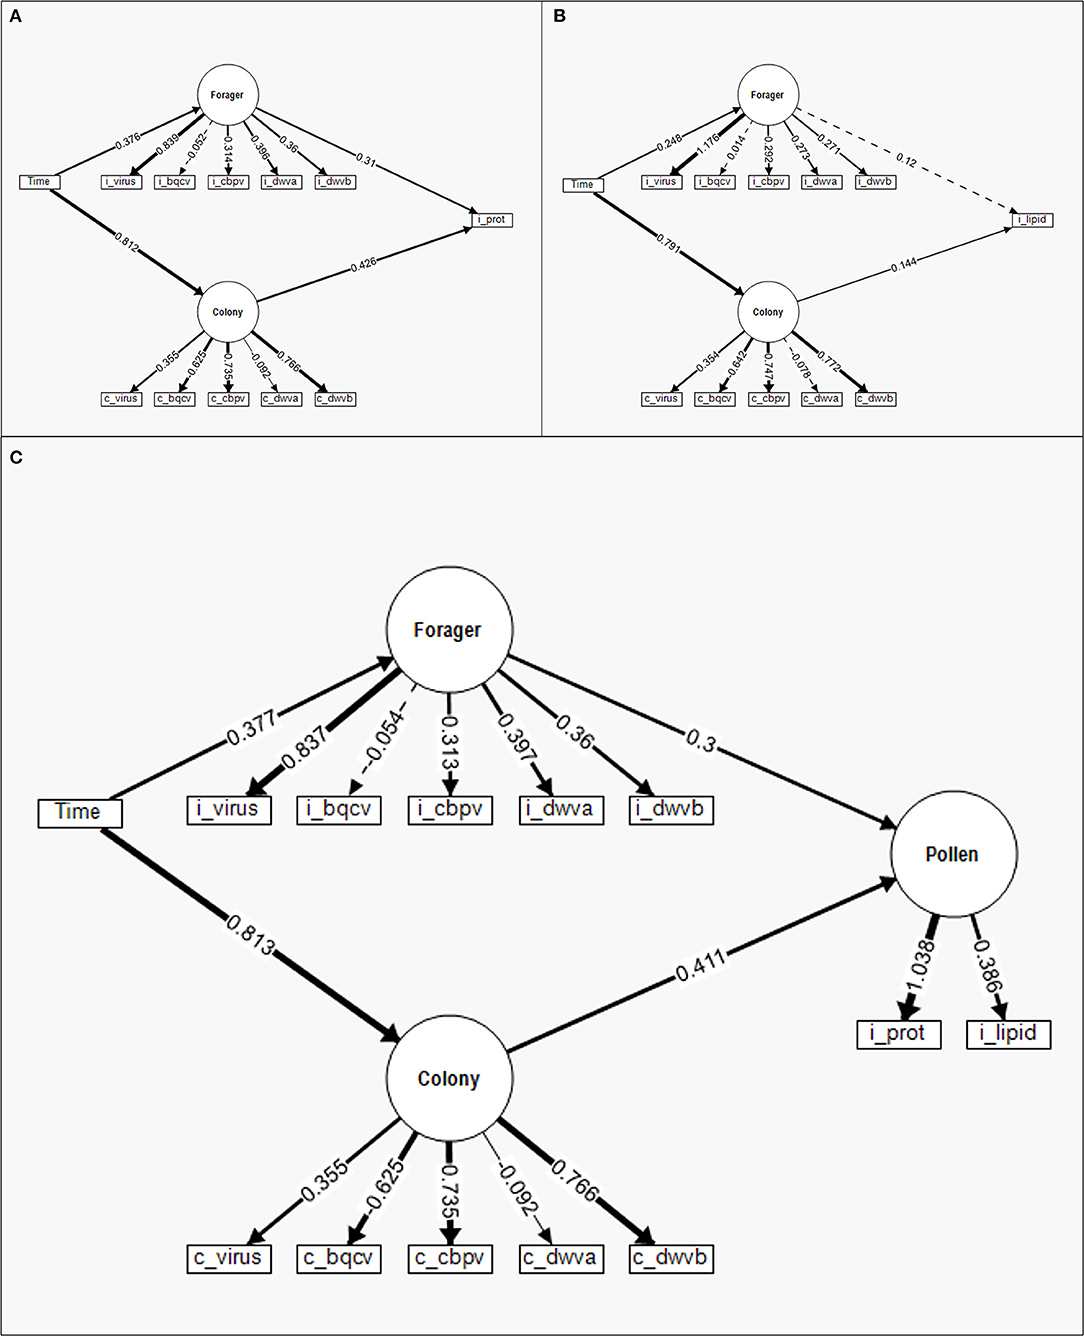
Figure 5. Structural equation models (SEM) to compare the standardized relative contribution of colony-level (c) disease (Colony) and individual (i) forager disease (Forager) to individual pollen foraging for (A) protein content, (B) lipid content, and (C) a latent variable combining protein and lipid content. Measured manifest variables are represented by boxes while latent factors are indicated by circles. Regression parameter estimates (given numbers) are standardized for comparison of variable contribution and presented in relation to the directed link (arrows) between variables. Solid lines indicate significant effects while dashed lines are insignificant. The line density indicates the relationship strength while the ± indicate the directionality of the relationship.
The combined protein and lipid SEM (Figure 5C) had model strength in line with the two component SEMS (χ2 = 701.015, CFI = 0.679, RMSEA = 0.127). In this model, the protein and lipid content of individually foraged pollen was combined into one Pollen latent factor. The results of this model were similar to prior model comparisons (Table 3), where both Colony (Wald Z = 6.597, P < 0.001) and Forager latent factors (Wald Z = 4.171, P < 0.001) significantly contributed to the Pollen latent factor, with Colony contributing to a greater extent. As with the prior two SEMs, time significantly impacted Colony (Wald Z = 38.187, P < 0.001) and Forager (Wald Z = 5.387, P < 0.001) latent factors with a greater impact on Colony. Additionally, Colony and Forager latent factors significantly covaried (Wald Z = −3.296, P = 0.001).
Nectar Foraging
The nectar regression models with and without forager and colony virus panel data (Table 8) indicated that the models with only colony variables had both the higher R2 and the lower AICc and BIC values compared to the forager only models. However, the full models with both forager and colony variables still exhibited the best combination performance (in terms of R2, AICc, and BIC).
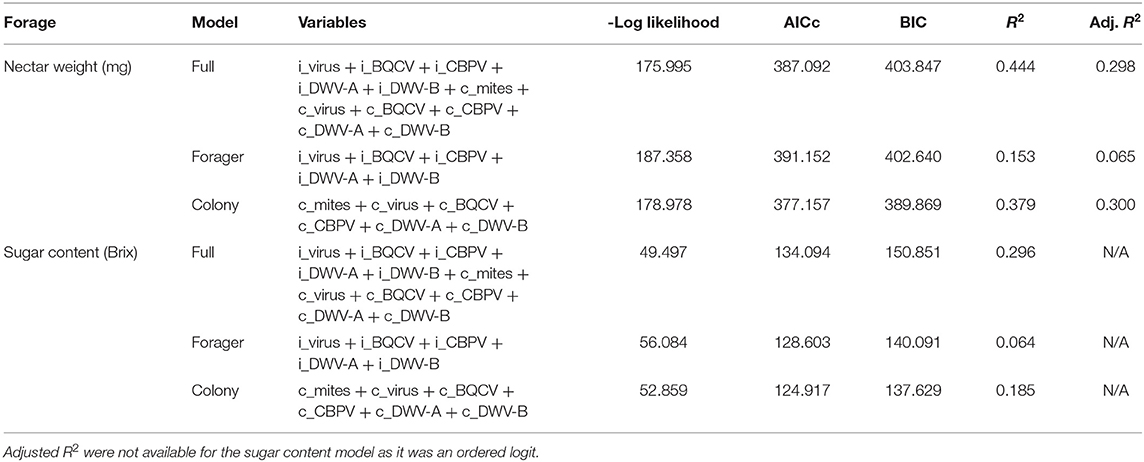
Table 8. Nectar model selection criteria comparing the full model with individual virus and colony virus metrics using several selection criteria.
The SEM for nectar weight (mg) (Figure 6A) was a weaker model than any of the pollen SEMS (χ2 = 146.942, CFI = 0.479, RMSEA = 0.215). Unlike the pollen SEMs, neither Colony (Wald Z = 1.032, P = 0.302) nor Forager (Wald Z = 0.796, P = 0.426) latent factors significantly influenced nectar weight. Colony and Forager latent factors also did not covary in the nectar weight SEM (Wald Z = 0.827, P = 0.408). The SEM for nectar sugar content (Brix) (Figure 6B) had similarly poor model strength (χ2 = 573.549, CFI = 0, RMSEA = 0.484). As with the nectar weight SEM, neither Colony (Wald Z = −1.078, P = 0.281) nor Forager (Wald Z = −0.586, P = 0.558) latent factors significantly influenced nectar sugar content. However, with the sugar content SEM, Colony and Forager latent factors did covary (Wald Z = 2.940, P = 0.003). When nectar weight and sugar content were combined into a single Nectar latent factor, the resulting model failed to converge under 1,000 model iterations and was not used.
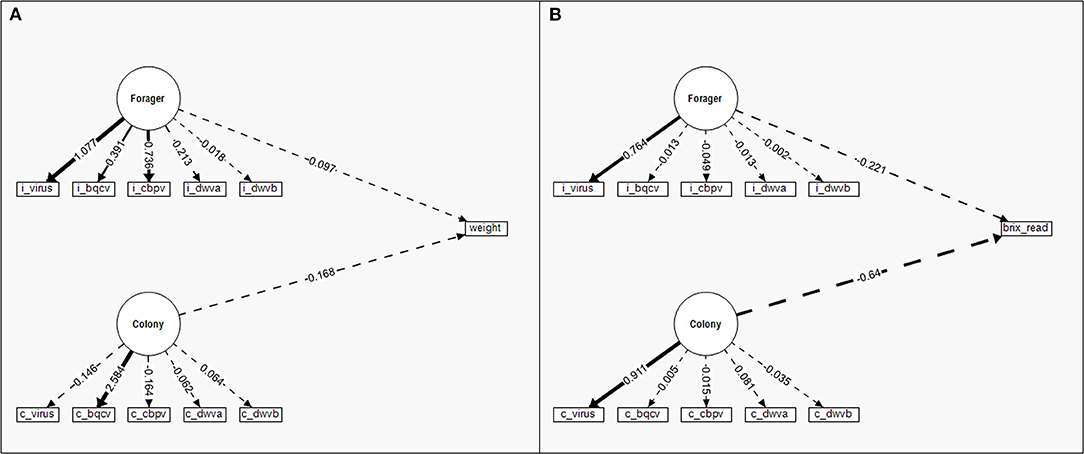
Figure 6. Structural equation models (SEM) to compare the standardized relative contribution of colony-level (c) disease (Colony) and individual (i) forager disease (Forager) to individual nectar foraging for (A) nectar weight and (B) nectar sugar content (Brix readings rather than categories as used in the regression). Measured manifest variables are represented by boxes while latent factors are indicated by circles. Regression parameter estimates (given numbers) are standardized for comparison of variable contribution and presented in relation to the directed link (arrows) between variables. Solid lines indicate significant effects while dashed lines are insignificant. The line density indicates the relationship strength while the ± indicate the directionality of the relationship.
Discussion
It has been previously shown that honey bee selectively foraging on plant resources (such as pollen, nectar or resin) is related to the reduction of infection rates (9, 59, 94, 95). Pollen and nectar, in particular, assist in regulating bee immune response by impacting vitellogenin, detoxification, and metabolism-related gene expression, enabling the bee to maintain functionality (8, 11–13). Furthermore, the nutritional profile of the pollen can itself aid in survival after infection (57) since protein helps repair and build tissues while lipids provide energy for bees (12, 38). Recent evidence has also shown that certain natural plant products may reduce impacts of viral infection (96). Our study evaluated the protein and lipid content of individually foraged pollen as well as the weight and sugar content of collected nectar in relation to honey bee viral infection. Further, we investigated whether these interactions at the individual forager level were based primarily on colony or individual forager viral infections.
Interactions of Disease and Foraging
The range of bee viruses and foraged pollen macronutrient profiles from our study generally matched that of previous studies. Most colonies tested positive for a suite of viruses—ABPV, BQCV, CBPV, DWV-A, DWV-B, IAPV, and LSV—similar to previous studies (97–99). The overall range of colony-foraged pollen protein (Range = 10.5–18.4%) and lipid contents (Range = 0.7–3.14%) were within the range of prior work on US honey bees (100). The variation in individually foraged pollen protein (Range 0.03–33.95%) and lipid contents (Range = 0.095–15.384%) was greater than in colony-collected pollen. This is expected as each forager sample may represent pollen from a single plant species targeted by that individual on a single day (101, 102), while the colony sample was an amalgamation of individual samples over 4 days. Given that all colonies were based within the same apiary, colonies had an equal opportunity to forage from the same floral resources (103) and differences were due in colony-level variation such as viral infection (6, 46–48).
The first goal of this work was to determine if Varroa mites and viral loads were correlated with differences in pollen macronutrient (protein and lipid) and nectar foraging. Prior work has shown that high-protein pollen can increase honey bee survival when faced with infection while high-lipid diets may increase susceptibility to pathogens (41, 57, 72). Therefore, we expected that higher mite and viral loads would generally increase foraging on higher-protein pollen. With the Spearman's correlation we found that higher mite numbers were positively associated with pollen protein content, but no association was found using generalized regression. However, the mite loads in our colonies remained relatively low throughout the study and may not have been variable enough to obtain the most reliable data in this regard. The viruses differed in their correlation with individually foraged pollen protein and lipid contents based on the type of virus and if the individual or colony was infected. The correlations and regressions indicated that colony DWV-B levels were negatively associated with the pollen P:L ratio and positively with lipid content, whereas the total number of viruses at the colony level was negatively associated with lipid content and positively with P:L ratios.
In addition to altering pollen foraging preferences, microbial infections have the potential to change bees' ability to perceive sugar content and nectar foraging behaviors (37, 67, 104, 105). While we expected that higher viral loads would also be associated with an increase in nectar sugar content, we found that this was only the case with colony DWV-B infections. Nectar load weights also significantly increased with higher colony BQCV levels and marginally increased with higher colony DWV-B levels, another indication that different stressors may induce differential foraging (53, 56). However, individual forager DWV-B infections tended (though marginally) to decrease nectar load weight, indicating some tradeoff of individual ability and colony health (47, 67).
These foraging interactions based on virus type suggest differential immune responses and subsequent nutritional requirements in response to different viruses (106–109). For instance, honey bee transcriptional and immune responses differ greatly from bacteria and Nosema to viral infections and between viral infections such as IAPV and DWV (110, 111). Further, energetic costs to honey bees differs with parasite or pathogen identity (104, 108). Work by Annoscia et al. (38) indicated that bees infested with Varroa mites, often associated with DWV levels, and fed pollen diets had up-regulated genes related to lipid metabolism; whereas, Rutter et al. (112) indicated that IAPV interacted with diet via carbohydrate metabolism-related genes. The impact of diet on immune function in the face of viral stressors may also vary with time of year and gut microbiota community structure (113–115).
Not only does diet alter honey bee ability to overcome viral challenges, but it also alters honey bee physiological responses to another stressor—pesticides. Individual bees fed lower P:L diets exhibited longer lifespans than those fed high P:L diets when both sets were exposed to pesticides, potentially due to these diets also altering expression of genes like Vg (vitellogenin) and Defensin-1 (49). Viruses and Varroa infestation can interact with pesticide exposure to make bees more susceptible to the other stressor; though the strength of these interactions depends on the combination of pesticide and virus (116). Varroa mite infestation and DWV infection increase bee susceptibility to insecticides and vice versa (117, 118). Similarly, thiamethoxam exposure increased CBPV loads (119), and thiacloprid increased BQCV viral loads in honey bees (120). The interactions of pesticides and viral infection may be due to how both types of stressors impact bee immune response and gene expression (116, 121). This is demonstrated particularly well by how winter vs. summer bees respond to either stressor—winter bees are generally more susceptible to both stressors and have lower immune gene expression than summer bees (113, 115). Similarly, colonies in agricultural landscapes (where they are likely to encounter pesticides) with access to more floral resources in the summer, have higher Vg expression and greater winter survival rates than colonies with access to poorer food resources in the summer (122). This highlights the need to study the complex interactions of multiple stressors and the potential benefits of increased access to high quality nutrition or more targeted nutritional supplement strategies based on colony states or environmental pressures.
Importance of Collective Foraging
Bees are known to adjust gross foraging preferences based on the demands of the colony and social immunity requirements (66, 123, 124). Therefore, the second aspect of this study was to determine if individual honey bee foragers selected food items based primarily on their individual or colony's viral infections. Our data indicate that despite the tensions between individual benefits and social immunity (47, 63), the impact of colony viral infections appeared to outweigh individual infection in both the SEMs and regression comparisons. This may be due, in part, to the differences in infection levels between foragers and colonies—forager viral infections except for BQCV had lower levels and were less variable than those found in the colony-representative nurse bee samples, meaning that nurse bee infections may be more acute or there is survival bias by the time bees become foragers. So, while individual forager infection might reduce foraging efficiency (125), collective foraging decisions are directed by social immunity needs.
The importance of social immunity in collective foraging decisions is also compatible with prior observations of collective foraging of forager groups being dispatched to several food patches rather than individuals comparing food quality across patches (15, 24, 126, 127). These foragers make individual decisions about a food patch that depend on nutritional content and availability of food items that then accumulate across foragers for a collective outcome (128). However, if collective foraging is impacted by colony viral infection, individual foragers must be able to detect shifts in colony viral loads. This may occur via infection or parasitism-induced alterations to the bee cuticular hydrocarbon profile, signaling to nestmates (like foragers) changes in health status that may result in nestmate (forager) behavioral changes (129–132). For instance, in colonies with high Varroa mite loads, foragers changed dancing locations to be closer to the frame periphery relative to colonies with lower mite levels (133). Like the overall colony need for food resources, changes in chemical cues based on infection and/or parasitism may indicate to foragers that macronutrient preferences need to be adjusted.
Since several of the viruses found to influence bee foraging are vectored by Varroa mites (134, 135), we expected to potentially observe foraging differences based on the interaction of mite resistant bee stocks and viruses (52, 136, 137). Preliminary data (Figures 3, 4; Supplementary Figures 1, 2, 5–9) indicate that two mite-resistant stocks may be more responsive to viral infection in terms of P:L ratios and nectar load weights than the susceptible Italian stock. However, the mite resistant stocks did not appear to fully align with each other in how and for which viruses they changed their foraging. Given that the mechanism of mite resistance differs between Pol-Line and Russian stocks (136, 137), we might expect that the two genotypes also differ in their immune response and related nutritional requirements when infected with mite-vectored viruses (138). While preliminary due to low colony sample sizes per stock, these observations indicate that overall mite resistance may influence the host's likelihood to forage in response to pathogens (86, 103, 139, 140) but that the genetic separation of mite-resistant genotypes may further differentiate responses to viruses (52, 141). The incorporation of host genetics into future investigations of host-pathogen interactions is critical for understanding more global effects of pathogen challenges, particularly given the potential of Varroa mites becoming resistant to current miticides and in relation to mite-vectored viruses (142–146).
Conclusion
Our observational field study evaluated foraging preferences associated with differences in naturally occurring viral infection levels between colonies and individual foragers with preliminary data across bee stocks with varying resistance to Varroa mites. Overall, we found that higher colony virus numbers generally decreased lipid foraging, with levels of viruses like DWV-B exhibiting differential interactions that may further interact with mite-resistant bee stocks. Varroa mite levels also decreased nectar load weights while select virus levels (BQCV and DWV-B) increased load weight and sugar content, respectively. When we evaluated the relative importance of colony and individual viral loads on individual foraging, we found that foragers exhibit preferences based primarily on colony virus loads. Taken together, these data indicate differential foraging responses for different viral infections and collective foraging may be an important aspect of social immunity in honey bees. Overall, this work highlights the continued need to explore the combined and complex interactions among disease, nutrition, and genetics in social networks.
Data Availability Statement
The raw data supporting the conclusions of this article will be made available by the authors, without undue reservation.
Author Contributions
HP, MS-F, and LG: conceptualization, methodology, and funding acquisition. RD, HP, and MS-F: formal analysis. RD, PT, HP, and LG: investigation. MS-F and LG: resources. RD, PT, and MS-F: validation. RD and HP: data curation. HP: writing—original draft preparation and visualization. PT, RD, MS-F, and LG: writing—review and editing. MS-F: supervision. RD: project administration. All authors have read and agree to the published version of the manuscript.
Funding
This research was funded by Project Apis m. and the National Honey Board Grant Number 58-6050-9-001, the Louisiana Beekeepers Association, and the USDA ARS.
Author Disclaimer
Mention of trade names or commercial products in this publication is solely for the purpose of providing specific information and does not imply recommendation or endorsement by the U.S. Department of Agriculture. USDA is an equal opportunity provider and employer.
Conflict of Interest
The authors declare that the research was conducted in the absence of any commercial or financial relationships that could be construed as a potential conflict of interest.
Publisher's Note
All claims expressed in this article are solely those of the authors and do not necessarily represent those of their affiliated organizations, or those of the publisher, the editors and the reviewers. Any product that may be evaluated in this article, or claim that may be made by its manufacturer, is not guaranteed or endorsed by the publisher.
Acknowledgments
We would like to thank Tyler Williams and Vincent Ricigliano with assistance in viral analysis and nutrient content analyses methods. We would also like to thank Sharon O'Brien, Christian Moreau, and Hunter Martin for assistance in forager collections as well as Molly Carlson and RaeDiance Fuller with weighing pollen and capillary tubes. Finally, we would like to thank Frank Rinkevich, Arian Avalos, and Michael Cunningham-Minnick for their input on the manuscript draft.
Supplementary Material
The Supplementary Material for this article can be found online at: https://www.frontiersin.org/articles/10.3389/finsc.2022.894482/full#supplementary-material
References
1. Southwick EE, Southwick L. Estimating the economic value of honey bees (Hymenoptera: Apidae) as agricultural pollinators in the United States. J Econ Entomol. (1992) 85:621–33. doi: 10.1093/jee/85.3.621
2. Goodrich BK, Williams JC, Goodhue RE. The great bee migration: supply analysis of honey bee colony shipments into California for almond pollination services. Am J Agric Econ. (2019) 101:1353–72. doi: 10.1093/ajae/aaz046
3. Fahey R, Rennich K, Nessa A, Swan N, Steinhauer N, Eversole H. 2016 – 2017 National Honey Bee Disease Survey Report. U.S. Department of Agriculture APHIS (2018). Available online at: http://www.aphis.usda.gov/plant_health/plant_pest_info/honey_bees/downloads/2016-2017-National-Survey-Report.pdf (accessed February 16, 2021).
4. Bruckner S, Steinhauer N, Aurell SD, Caron DM, Ellis JD, Fauvel AM. 2018 - 2019 Honey Bee Colony Losses in the United States: Preliminary Results. Bee Informed Partnership (2019). Available online at: https://beeinformed.org/wp-content/uploads/2019/11/2018_2019-Abstract.pdf (accessed June 3, 2020).
5. Alaux C, Ducloz F, Crauser D, Conte YL. Diet effects on honeybee immunocompetence. Biol Lett. (2010) 6:562–5. doi: 10.1098/rsbl.2009.0986
6. DeGrandi-Hoffman G, Chen Y, Huang E, Huang MH. The effect of diet on protein concentration hypopharyngeal gland development and virus load in worker honey bees (Apis mellifera L). J Insect Physiol. (2010) 56:1184–91. doi: 10.1016/j.jinsphys.2010.03.017
7. DeGrandi-Hoffman G, Chen Y, Rivera R, Carroll M, Chambers M, Hidalgo G, et al. Honey bee colonies provided with natural forage have lower pathogen loads and higher overwinter survival than those fed protein supplements. Apidologie. (2016) 47:186–96. doi: 10.1007/s13592-015-0386-6
8. Pasquale GD, Salignon M, Conte YL, Belzunces LP, Decourtye A, Kretzschmar A, et al. Influence of pollen nutrition on honey bee health: do pollen quality and diversity matter? PLoS ONE. (2013) 8:e72016. doi: 10.1371/journal.pone.0072016
9. Erler S, Moritz RFA. Pharmacophagy and pharmacophory: mechanisms of self-medication and disease prevention in the honeybee colony (Apis mellifera). Apidologie. (2016) 47:389–411. doi: 10.1007/s13592-015-0400-z
10. Ricigliano VA, Mott BM, Floyd AS, Copeland DC, Carroll MJ, Anderson KE. Honey bees overwintering in a southern climate: longitudinal effects of nutrition and queen age on colony-level molecular physiology and performance. Sci Rep. (2018) 8:10475. doi: 10.1038/s41598-018-28732-z
11. Azzouz-Olden F, Hunt A, DeGrandi-Hoffman G. Transcriptional response of honey bee (Apis mellifera) to differential nutritional status and Nosema infection. BMC Genom. (2018) 19:628. doi: 10.1186/s12864-018-5007-0
12. Alaux C, Dantec C, Parrinello H, Le Conte Y. Nutrigenomics in honey bees: Digital gene expression analysis of pollen's nutritive effects on healthy and Varroa-parasitized bees. BMC Genom. (2011) 12:496. doi: 10.1186/1471-2164-12-496
13. Mao W, Schuler MA, Berenbaum MR. Honey constituents up-regulate detoxification and immunity genes in the western honey bee Apis mellifera. PNAS. (2013) 110:8842–6. doi: 10.1073/pnas.1303884110
14. Seeley TD. Social foraging in honey bees: how nectar foragers assess their colony's nutritional status. Behav Ecol Sociobiol. (1989) 24:181–99. doi: 10.1007/BF00292101
15. Seeley TD. The Wisdom of the Hive: The Social Physiology of Honey Bee Colonies. Cambridge, MA: Harvard University Press (1995).
16. Camazine S. The regulation of pollen foraging by honey bees: how foragers assess the colony's need for pollen. Behav Ecol Sociobiol. (1993) 32:265–72. doi: 10.1007/BF00166516
17. Grozinger CM, Sharabash NM, Whitfield CW, Robinson GE. Pheromone-mediated gene expression in the honey bee brain. PNAS. (2003) 100:14519–25. doi: 10.1073/pnas.2335884100
18. Leoncini I, Conte YL, Costagliola G, Plettner E, Toth AL, Wang M, et al. Regulation of behavioral maturation by a primer pheromone produced by adult worker honey bees. PNAS. (2004) 101:17559–64. doi: 10.1073/pnas.0407652101
19. Ben-Shahar Y. The foraging gene, behavioral plasticity, and honeybee division of labor. J Comp Physiol A. (2005) 191:987–94. doi: 10.1007/s00359-005-0025-1
20. Ma R, Villar G, Grozinger CM, Rangel J. Larval pheromones act as colony-wide regulators of collective foraging behavior in honeybees. Behav Ecol. (2018) 29:1132–41. doi: 10.1093/beheco/ary090
21. Farina WM, Grüter C, Díaz PC. Social learning of floral odours inside the honeybee hive. Proc Royal Soc B. (2005) 272:1923–8. doi: 10.1098/rspb.2005.3172
22. Arenas A, Fernández VM, Farina WM. Floral odor learning within the hive affects honeybees' foraging decisions. Naturwissenschaften. (2007) 94:218–22. doi: 10.1007/s00114-006-0176-0
23. Dyer FC, Seeley TD. Dance dialects and foraging range in three Asian honey bee species. Behav Ecol Sociobiol. (1991) 28:227–33. doi: 10.1007/BF00175094
24. de Vries H, Biesmeijer JC. Modelling collective foraging by means of individual behaviour rules in honey-bees. Behav Ecol Sociobiol. (1998) 44:109–24. doi: 10.1007/s002650050522
25. Mallinger RE, Prasifka JR. Bee visitation rates to cultivated sunflowers increase with the amount and accessibility of nectar sugars. J Appl Entomol. (2017) 141:561–73. doi: 10.1111/jen.12375
26. Ruedenauer FA, Biewer NW, Nebauer CA, Scheiner M, Spaethe J, Leonhardt SD. Honey bees can taste amino and fatty acids in pollen, but not sterols. Front Ecol Evol. (2021) 9:404. doi: 10.3389/fevo.2021.684175
27. Roulston TH, Cane JH. Pollen nutritional content and digestibility for animals. Plant Syst Evol. (2000) 222:187–209. doi: 10.1007/BF00984102
28. Roulston TH, Cane JH, Buchmann SL. What governs protein content of pollen: Pollinator preferences, pollen–pistil interactions, or phylogeny? Ecol. Monogr. (2000) 70:617–43. doi: 10.1890/0012-9615(2000)070[0617:WGPCOP]2.0.CO;2
29. Cook SM, Awmack CS, Murray DA, Williams IH. Are honey bees' foraging preferences affected by pollen amino acid composition? Ecol. Entomol. (2003) 28:622–7. doi: 10.1046/j.1365-2311.2003.00548.x
30. Altaye SZ, Pirk CWW, Crewe RM, Nicolson SW. Convergence of carbohydrate-biased intake targets in caged worker honeybees fed different protein sources. J Exp Biol. (2010) 213:3311–8. doi: 10.1242/jeb.046953
31. Hendriksma HP, Shafir S. Honey bee foragers balance colony nutritional deficiencies. Behav Ecol Sociobiol. (2016) 70:509–17. doi: 10.1007/s00265-016-2067-5
32. Arenas A, Kohlmaier MG. Nectar source profitability influences individual foraging preferences for pollen and pollen-foraging activity of honeybee colonies. Behav Ecol Sociobiol. (2019) 73:34. doi: 10.1007/s00265-019-2644-5
33. Paoli PP, Donley D, Stabler D, Saseendranath A, Nicolson SW, Simpson SJ, et al. Nutritional balance of essential amino acids and carbohydrates of the adult worker honeybee depends on age. Amino Acids. (2014) 46:1449–58. doi: 10.1007/s00726-014-1706-2
34. Corby-Harris V, Snyder L, Meador C, Ayotte T. Honey bee (Apis mellifera) nurses do not consume pollens based on their nutritional quality. PLoS ONE. (2018) 13:e0191050. doi: 10.1371/journal.pone.0191050
35. Stabler D, Al-Esawy M, Chennells JA, Perri G, Robinson A, Wright GA. Regulation of dietary intake of protein and lipid by nurse-age adult worker honeybees. J Exp Biol. (2021) 224:jeb230615. doi: 10.1242/jeb.230615
36. DeGrandi-Hoffman G, Chen Y. Nutrition, immunity and viral infections in honey bees. Curr Opin Insect Sci. (2015) 10:170–6. doi: 10.1016/j.cois.2015.05.007
37. Lach L, Kratz M, Baer B. Parasitized honey bees are less likely to forage and carry less pollen. J Invertebr Pathol. (2015) 130:64–71. doi: 10.1016/j.jip.2015.06.003
38. Annoscia D, Zanni V, Galbraith D, Quirici A, Grozinger C, Bortolomeazzi R, et al. Elucidating the mechanisms underlying the beneficial health effects of dietary pollen on honey bees (Apis mellifera) infested by Varroa mite ectoparasites. Sci Rep. (2017) 7:1–13. doi: 10.1038/s41598-017-06488-2
39. Dolezal AG, Toth AL. Feedbacks between nutrition and disease in honey bee health. Curr Opin Insect Sci. (2018) 26:114–9. doi: 10.1016/j.cois.2018.02.006
40. Barascou L, Sene D, Barraud A, Michez D, Lefebvre V, Medrzycki P, et al. Pollen nutrition fosters honeybee tolerance to pesticides. R Soc Open Sci. (2021) 8:210818. doi: 10.1098/rsos.210818
41. Giacomini JJ, Leslie J, Tarpy DR, Palmer-Young EC, Irwin RE, Adler LS. Medicinal value of sunflower pollen against bee pathogens. Sci Rep. (2018) 8:14394. doi: 10.1038/s41598-018-32681-y
42. Adler LS, Fowler AE, Malfi RL, Anderson PR, Coppinger LM, Deneen PM, et al. Assessing chemical mechanisms underlying the effects of sunflower pollen on a gut pathogen in bumble bees. J Chem Ecol. (2020) 46:649–58. doi: 10.1007/s10886-020-01168-4
43. Fowler AE, Stone EC, Irwin RE, Adler LS. Sunflower pollen reduces a gut pathogen in worker and queen but not male bumble bees. Ecol Entomol. (2020) 45:1318–26. doi: 10.1111/een.12915
44. Zhang G, St. Clair AL, Dolezal A, Toth AL, O'Neal M. Honey bee (Hymenoptera: Apidea) pollen forage in a highly cultivated agroecosystem: limited diet diversity and its relationship to virus resistance. J Econ Entomol. (2020) 113:1062–72. doi: 10.1093/jee/toaa055
45. Castelli L, Branchiccela B, Garrido M, Invernizzi C, Porrini M, Romero H, et al. Impact of nutritional stress on honeybee gut microbiota, immunity, and Nosema ceranae infection. Microb Ecol. (2020) 80:908–19. doi: 10.1007/s00248-020-01538-1
46. Cotter SC, Simpson SJ, Raubenheimer D, Wilson K. Macronutrient balance mediates trade-offs between immune function and life history traits. Funct Ecol. (2011) 25:186–98. doi: 10.1111/j.1365-2435.2010.01766.x
47. Poissonnier L-A, Lihoreau M, Gomez-Moracho T, Dussutour A, Buhl J. A theoretical exploration of dietary collective medication in social insects. J Insect Physiol. (2017) 106:78–87. doi: 10.1016/j.jinsphys.2017.08.005
48. Dinh H, Mendez V, Tabrizi ST, Ponton F. Macronutrients and infection in fruit flies. Insect Biochem Mol Biol. (2019) 110:98–104. doi: 10.1016/j.ibmb.2019.05.002
49. Crone MK, Grozinger CM. Pollen protein and lipid content influence resilience to insecticides in honey bees (Apis mellifera). J Exp Biol. (2021) 224:jeb242040. doi: 10.1242/jeb.242040
50. Alshukri BM, Al-Esawy MT. Reduced deformed wing virus of Apis mellifera L. nurses by high fat diets under laboratory conditions. J Plant Prot Res. (2021) 61:57–62. doi: 10.24425/jppr.2021.136269
51. Chen YP, Siede R. Honey bee viruses. Adv Virus Res. (2007) 70:33–80. doi: 10.1016/S0065-3527(07)70002-7
52. Penn Hannah J, Simone-Finstrom MD, Lang S, Chen Y, Healy KB. Host genotype and tissue type determine DWV infection intensity. Front Insect Sci. (2021) 1:756690. doi: 10.3389/finsc.2021.756690
53. Foley K, Fazio G, Jensen AB, Hughes WOH. Nutritional limitation and resistance to opportunistic Aspergillus parasites in honey bee larvae. J Invertebr Pathol. (2012) 111:68–73. doi: 10.1016/j.jip.2012.06.006
54. Rinderer TE, Dell Elliott K. Worker honey bee response to infection with Nosema apis: influence of diet. J Econ Entomol. (1977) 70:431–3. doi: 10.1093/jee/70.4.431
55. Ardia DR, Gantz JE, Schneider CB, Strebel S. Costs of immunity in insects: an induced immune response increases metabolic rate and decreases antimicrobial activity. Funct Ecol. (2012) 26:732–9. doi: 10.1111/j.1365-2435.2012.01989.x
56. Jack CJ, Uppala SS, Lucas HM, Sagili RR. Effects of pollen dilution on infection of Nosema ceranae in honey bees. J Insect Physiol. (2016) 87:12–9. doi: 10.1016/j.jinsphys.2016.01.004
57. Dolezal AG, Carrillo-Tripp J, Judd TM, Allen Miller W, Bonning BC, Toth AL. Interacting stressors matter: diet quality and virus infection in honeybee health. R Soc Open Sci. (2019) 6:181803. doi: 10.1098/rsos.181803
58. Lee KP, Cory JS, Wilson K, Raubenheimer D, Simpson SJ. Flexible diet choice offsets protein costs of pathogen resistance in a caterpillar. Proc R Soc B. (2006) 273:823–9. doi: 10.1098/rspb.2005.3385
59. Simone-Finstrom MD, Spivak M. Increased resin collection after parasite challenge: a case of self-medication in honey bees? PLoS ONE. (2012) 7:e34601. doi: 10.1371/journal.pone.0034601
60. Gherman BI, Denner A, Bobiş O, Dezmirean DS, Mărghitaş LA, Schlüns H, et al. Pathogen-associated self-medication behavior in the honeybee Apis mellifera. Behav Ecol Sociobiol. (2014) 68:1777–84. doi: 10.1007/s00265-014-1786-8
61. Pusceddu M, Piluzza G, Theodorou P, Buffa F, Ruiu L, Bullitta S, et al. Resin foraging dynamics in Varroa destructor-infested hives: a case of medication of kin? Insect Sci. (2019) 26:297–310. doi: 10.1111/1744-7917.12515
62. Spivak M, Goblirsch M, Simone-Finstrom M. Social-medication in bees: the line between individual and social regulation. Curr Opin Insect Sci. (2019) 33:49–55. doi: 10.1016/j.cois.2019.02.009
63. Lihoreau M, Buhl J, Charleston MA, Sword GA, Raubenheimer D, Simpson SJ. Nutritional ecology beyond the individual: a conceptual framework for integrating nutrition and social interactions. Ecol Lett. (2015) 18:273–86. doi: 10.1111/ele.12406
64. Lihoreau M, Gómez-Moracho T, Pasquaretta C, Costa JT, Buhl J. Social nutrition: en emerging field in insect science. Curr Opin Insect Sci. (2018) 28:73–80. doi: 10.1016/j.cois.2018.05.003
65. Brosi BJ, Delaplane KS, Boots M, de Roode JC. Ecological and evolutionary approaches to managing honeybee disease. Nat Ecol Evol. (2017) 1:1250. doi: 10.1038/s41559-017-0246-z
66. Kay AD, Bruning AJ, van Alst A, Abrahamson TT, Hughes WOH, Kaspari M. A carbohydrate-rich diet increases social immunity in ants. Proc R Soc B. (2014) 281:20132374. doi: 10.1098/rspb.2013.2374
67. Mayack C, Naug D. Energetic stress in the honeybee Apis mellifera from Nosema ceranae infection. J Invertebr Pathol. (2009) 100:185–8. doi: 10.1016/j.jip.2008.12.001
68. Evans JD, Pettis JS. Colony-level impacts of immune responsiveness in honey bees, Apis mellifera. Evolution. (2005) 59:2270–4. doi: 10.1111/j.0014-3820.2005.tb00935.x
69. Ferguson JA, Northfield TD, Lach L. Honey bee (Apis mellifera) pollen foraging reflects benefits dependent on individual infection status. Microb Ecol. (2018) 76:482–91. doi: 10.1007/s00248-018-1147-7
70. Evans JD, Schwarz RS. Bees brought to their knees: microbes affecting honey bee health. Trends Microbiol. (2011) 19:614–20. doi: 10.1016/j.tim.2011.09.003
71. Gisder S, Genersch E. Viruses of commercialized insect pollinators. J Invertebr Pathol. (2017) 147:51–9. doi: 10.1016/j.jip.2016.07.010
72. Adamo SA, Bartlett A, Le J, Spencer N, Sullivan K. Illness-induced anorexia may reduce trade-offs between digestion and immune function. Anim Behav. (2010) 79:3–10. doi: 10.1016/j.anbehav.2009.10.012
73. Hsu H-W, Chiu M-C, Shoemaker D, Yang C-CS. Viral infections in fire ants lead to reduced foraging activity and dietary changes. Sci Rep. (2018) 8:13498. doi: 10.1038/s41598-018-31969-3
74. Branco MR, Kidd NAC, Pickard RS. A comparative evaluation of sampling methods for Varroa destructor (Acari: Varroidae) population estimation. Apidologie. (2006) 37:452–61. doi: 10.1051/apido:2006010
75. Dietemann V, Nazzi F, Martin SJ, Anderson DL, Locke B, Delaplane KS, et al. Standard methods for Varroa research. J Apic Res. (2013) 52:1–54. doi: 10.3896/IBRA.1.52.1.09
76. Pankiw T, Page RE. Genotype and colony environment affect honeybee (Apis mellifera L.) development and foraging behavior. Behav Ecol Sociobiol. (2001) 51:87–94. doi: 10.1007/s002650100408
77. Pankiw T, Page RE Jr. The effect of genotype, age, sex, and caste on response thresholds to sucrose and foraging behavior of honey bees (Apis mellifera L.). J Comp Physiol A. (1999) 185:207–13. doi: 10.1007/s003590050379
78. Van Handel E, Day JF. Assay of lipids, glycogen and sugars in individual mosquitoes: correlations with wing length in field-collected Aedes vexans. J Am Mosq Control Assoc. (1988) 4:549–50.
79. Vaudo AD, Patch HM, Mortensen DA, Tooker JF, Grozinger CM. Macronutrient ratios in pollen shape bumble bee (Bombus impatiens) foraging strategies and floral preferences. PNAS. (2016) 113:E4035–42. doi: 10.1073/pnas.1606101113
80. Francis R, Kryger P. Single assay detection of acute bee paralysis virus, Kashmir bee virus and Israeli acute paralysis virus. J Apicult Sci. (2012) 56:137–47. doi: 10.2478/v10289-012-0014-x0
81. Boncristiani H, Underwood R, Schwarz R, Evans JD, Pettis J. Direct effect of acaricides on pathogen loads and gene expression levels in honey bees Apis mellifera. J Insect Physiol. (2012) 58:613–20. doi: 10.1016/j.jinsphys.2011.12.011
82. Blanchard P, Ribière M, Celle O, Lallemand P, Schurr F, Olivier V, et al. Evaluation of a real-time two-step RT-PCR assay for quantitation of Chronic bee paralysis virus (CBPV) genome in experimentally-infected bee tissues and in life stages of a symptomatic colony. J Virol Methods. (2007) 141:7–13. doi: 10.1016/j.jviromet.2006.11.021
83. Ryabov EV, Wood GR, Fannon JM, Moore JD, Bull JC, Chandler D, et al. A virulent strain of deformed wing virus (DWV) of honeybees (Apis mellifera) prevails after Varroa destructor-mediated, or in vitro, transmission. PLoS Path. (2014) 10:e1004230. doi: 10.1371/journal.ppat.1004230
84. Daughenbaugh KF, Martin M, Brutscher LM, Cavigli I, Garcia E, Lavin M, et al. Honey bee infecting Lake Sinai viruses. Viruses (2015) 7:3285–309. doi: 10.3390/v7062772
85. Pirk CWW, Miranda JR, de Kramer M, Murray TE, Nazzi F, Shutler D, et al. Statistical guidelines for Apis mellifera research. J Apic Res. (2013) 52:1–24. doi: 10.3896/IBRA.1.52.4.13
86. de Guzman LI, Frake AM, Simone-Finstrom M. Comparative flight activities and pathogen load of two stocks of honey bees reared in gamma-irradiated combs. Insects. (2017) 8:127. doi: 10.3390/insects8040127
87. Simone-Finstrom M, Aronstein K, Goblirsch M, Rinkevich F, de Guzman L. Gamma irradiation inactivates honey bee fungal, microsporidian, and viral pathogens and parasites. J Invertebr Pathol. (2018) 153:57–64. doi: 10.1016/j.jip.2018.02.011
88. Lourenço AP, Mackert A, dos Santos Cristino A, Simões ZLP. Validation of reference genes for gene expression studies in the honey bee, Apis mellifera, by quantitative real-time RT-PCR. Apidologie (2008) 39:372–85. doi: 10.1051/apido:2008015
89. Malaeb ZA, Summers JK, Pugesek BH. Using structural equation modeling to investigate relationships among ecological variables. Environ Ecol Stat. (2000) 7:93–111. doi: 10.1023/A:1009662930292
90. Grace JB. Structural equation modeling for observational studies. J Wildl Manag. (2008) 72:14–22. doi: 10.2193/2007-307
91. Fan Y, Chen J, Shirkey G, John R, Wu SR, Park H, et al. Applications of structural equation modeling (SEM) in ecological studies: an updated review. Environ Process. (2016) 5:19. doi: 10.1186/s13717-016-0063-3
92. Hu L, Bentler PM. Cutoff criteria for fit indexes in covariance structure analysis: conventional criteria versus new alternatives. Struct Equ Modeling. (1999) 6:1–55. doi: 10.1080/10705519909540118
93. Eisenhauer N, Bowker MA, Grace JB, Powell JR. From patterns to causal understanding: structural equation modeling (SEM) in soil ecology. Pedobiologia. (2015) 58:65–72. doi: 10.1016/j.pedobi.2015.03.002
94. Drescher N, Klein A-M, Neumann P, Yañez O, Leonhardt SD. Inside honeybee hives: impact of natural propolis on the ectoparasitic mite Varroa destructor and viruses. Insects. (2017) 8:15. doi: 10.3390/insects8010015
95. Palmer-Young EC, Tozkar CÖ, Schwarz RS, Chen Y, Irwin RE, Adler LS, et al. Nectar and pollen phytochemicals stimulate honey bee (Hymenoptera: Apidae) immunity to viral infection. J Econ Entomol. (2017) 110:1959–72. doi: 10.1093/jee/tox193
96. Boncristiani DL, Tauber JP, Palmer-Young EC, Cao L, Collins W, Grubbs K, et al. Impacts of diverse natural products on honey bee viral loads and health. Appl Sci. (2021) 11:10732. doi: 10.3390/app112210732
97. Chen Y, Zhao Y, Hammond J, Hsu H, Evans J, Feldlaufer M. Multiple virus infections in the honey bee and genome divergence of honey bee viruses. J Invertebr Pathol. (2004) 87:84–93. doi: 10.1016/j.jip.2004.07.005
98. Amiri E, Meixner M, Nielsen SL, Kryger P. Four categories of viral infection describe the health status of honey bee colonies. PLoS ONE. (2015) 10:e0140272. doi: 10.1371/journal.pone.0140272
99. D'Alvise P, Seeburger V, Gihring K, Kieboom M, Hasselmann M. Seasonal dynamics and co-occurrence patterns of honey bee pathogens revealed by high-throughput RT-qPCR analysis. Ecol Evol. (2019) 9:10241–52. doi: 10.1002/ece3.5544
100. Roulston TH, Buchmann SL. A phylogenetic reconsideration of the pollen starch–pollination correlation. Evol Ecol Res. (2000) 2:627–43. Available online at: http://www.evolutionary-ecology.com/abstracts/v02/1186.html
103. Kutzer MAM, Kurtz J, Armitage SAO. Genotype and diet affect resistance, survival, and fecundity but not fecundity tolerance. J Evol Biol. (2018) 31:159–71. doi: 10.1111/jeb.13211
104. Martín-Hernández R, Botías C, Barrios L, Martínez-Salvador A, Meana A, Mayack C, et al. Comparison of the energetic stress associated with experimental Nosema ceranae and Nosema apis infection of honeybees (Apis mellifera). Parasitol Res. (2011) 109:605–12. doi: 10.1007/s00436-011-2292-9
105. Li Z, Chen Y, Zhang S, Chen S, Li W, Yan L, et al. Viral infection affects sucrose responsiveness and homing ability of forager honey bees, Apis mellifera L. PLoS ONE. (2013) 8:e77354. doi: 10.1371/journal.pone.0077354
106. Chen YP, Pettis JS, Corona M, Chen WP, Li CJ, Spivak M, et al. Israeli acute paralysis virus: epidemiology, pathogenesis and implications for honey bee health. PLoS Path. (2014) 10:e1004261. doi: 10.1371/journal.ppat.1004261
107. Doublet V, Paxton RJ, McDonnell CM, Dubois E, Nidelet S, Moritz RFA, et al. Brain transcriptomes of honey bees (Apis mellifera) experimentally infected by two pathogens: black queen cell virus and Nosema ceranae. Genom Data. (2016) 10:79–82. doi: 10.1016/j.gdata.2016.09.010
108. Kurze C, Mayack C, Hirche F, Stangl GI, Le Conte Y, Kryger P, et al. Nosema spp. infections cause no energetic stress in tolerant honeybees. Parasitol Res. (2016) 115:2381–8. doi: 10.1007/s00436-016-4988-3
109. Lester PJ, Buick KH, Baty JW, Felden A, Haywood J. Different bacterial and viral pathogens trigger distinct immune responses in a globally invasive ant. Sci Rep. (2019) 9:1–10. doi: 10.1038/s41598-019-41843-5
110. Azzami K, Ritter W, Tautz J, Beier H. Infection of honey bees with acute bee paralysis virus does not trigger humoral or cellular immune responses. Arch Virol. (2012) 157:689–702. doi: 10.1007/s00705-012-1223-0
111. Galbraith DA, Yang X, Niño EL, Yi S, Grozinger C. Parallel epigenomic and transcriptomic responses to viral infection in honey bees (Apis mellifera). PLoS Path. (2015) 11:e1004713. doi: 10.1371/journal.ppat.1004713
112. Rutter L, Carrillo-Tripp J, Bonning BC, Cook D, Toth AL, Dolezal AG. Transcriptomic responses to diet quality and viral infection in Apis mellifera. BMC Genom. (2019) 20:412. doi: 10.1186/s12864-019-5767-1
113. Steinmann N, Corona M, Neumann P, Dainat B. Overwintering is associated with reduced expression of immune genes and higher susceptibility to virus infection in honey bees. PLoS ONE. (2015) 10:e0129956. doi: 10.1371/journal.pone.0129956
114. Dosch C, Manigk A, Streicher T, Tehel A, Paxton RJ, Tragust S. The gut microbiota can provide viral tolerance in the honey bee. Microorganisms. (2021) 9:871. doi: 10.3390/microorganisms9040871
115. Alburaki M, Madella S, Vu P, Corona M. Influence of honey bee seasonal phenotype and emerging conditions on diet behavior and susceptibility to imidacloprid. Apidologie. (2022) 53:12. doi: 10.1007/s13592-022-00922-9
116. Harwood GP, Dolezal AG. Pesticide–virus interactions in honey bees: challenges and opportunities for understanding drivers of bee declines. Viruses. (2020) 12:566. doi: 10.3390/v12050566
117. Annoscia D, Di Prisco G, Becchimanzi A, Caprio E, Frizzera D, Linguadoca A, et al. Neonicotinoid clothianidin reduces honey bee immune response and contributes to Varroa mite proliferation. Nat Commun. (2020) 11:5887. doi: 10.1038/s41467-020-19715-8
118. Zhu Y-C, Yao J, Wang Y. Varroa mite and deformed wing virus infestations interactively make honey bees (Apis mellifera) more susceptible to insecticides. Environ Pollut. (2022) 292:118212. doi: 10.1016/j.envpol.2021.118212
119. Coulon M, Schurr F, Martel A-C, Cougoule N, Begaud A, Mangoni P, et al. Influence of chronic exposure to thiamethoxam and Chronic bee paralysis virus on winter honey bees. PLoS ONE. (2019) 14:e0220703. doi: 10.1371/journal.pone.0220703
120. Doublet V, Labarussias M, de Miranda JR, Moritz RFA, Paxton RJ. Bees under stress: sublethal doses of a neonicotinoid pesticide and pathogens interact to elevate honey bee mortality across the life cycle. Environ Microbiol. (2015) 17:969–83. doi: 10.1111/1462-2920.12426
121. Nazzi F, Pennacchio F. Honey bee antiviral immune barriers as affected by multiple stress factors: a novel paradigm to interpret colony health decline and collapse. Viruses. (2018) 10:159. doi: 10.3390/v10040159
122. Smart M, Pettis J, Rice N, Browning Z, Spivak M. Linking measures of colony and individual honey bee health to survival among apiaries exposed to varying agricultural land use. PLoS ONE. (2016) 11. doi: 10.1371/journal.pone.0152685
123. Fewell JH, Winston ML. Colony state and regulation of pollen foraging in the honey bee, Apis mellifera L. Behav Ecol Sociobiol. (1992) 30:387–93. doi: 10.1007/BF00176173
124. Hendriksma HP, Toth AL, Shafir S. Individual and colony level foraging decisions of bumble bees and honey bees in relation to balancing of nutrient needs. Front Ecol Evol. (2019) 7:00177. doi: 10.3389/fevo.2019.00177
125. Wells T, Wolf S, Nicholls E, Groll H, Lim KS, Clark SJ, et al. Flight performance of actively foraging honey bees is reduced by a common pathogen. Environ Microbiol Rep. (2016) 8:728–37. doi: 10.1111/1758-2229.12434
126. de Vries H, Biesmeijer JC. Self-organization in collective honeybee foraging: emergence of symmetry breaking, cross inhibition and equal harvest-rate distribution. Behav Ecol Sociobiol. (2002) 51:557–69. doi: 10.1007/s00265-002-0454-6
127. Lemanski NJ, Cook CN, Ozturk C, Smith BH, Pinter-Wollman N. The effect of individual learning on collective foraging in honey bees in differently structured landscapes. Anim Behav. (2021) 179:113–23. doi: 10.1016/j.anbehav.2021.06.033
128. Lihoreau M, Charleston MA, Senior AM, Clissold FJ, Raubenheimer D, Simpson SJ, et al. Collective foraging in spatially complex nutritional environments. Philos Trans R Soc Lond, B. (2017) 372:20160238. doi: 10.1098/rstb.2016.0238
129. Dussaubat C, Maisonnasse A, Alaux C, Tchamitchan S, Brunet J-L, Plettner E, et al. Nosema spp. infection alters pheromone production in honey bees (Apis mellifera). J Chem Ecol. (2010) 36:522–5. doi: 10.1007/s10886-010-9786-2
130. Baracchi D, Fadda A, Turillazzi S. Evidence for antiseptic behaviour towards sick adult bees in honey bee colonies. J Insect Physiol. (2012) 58:1589–96. doi: 10.1016/j.jinsphys.2012.09.014
131. Murray ZL, Keyzers RA, Barbieri RF, Digby AP, Lester PJ. Two pathogens change cuticular hydrocarbon profiles but neither elicit a social behavioural change in infected honey bees, Apis mellifera (Apidae: Hymenoptera). Austral Entomol. (2016) 55:147–53. doi: 10.1111/aen.12165
132. Geffre AC, Gernat T, Harwood GP, Jones BM, Gysi DM, Hamilton AR, et al. Honey bee virus causes context-dependent changes in host social behavior. PNAS. (2020) 117:10406–13. doi: 10.1073/pnas.2002268117
133. Pusceddu M, Cini A, Alberti S, Salaris E, Theodorou P, Floris I, et al. Honey bees increase social distancing when facing the ectoparasite Varroa destructor. Sci Adv. (2021) 7:eabj1398. doi: 10.1126/sciadv.abj1398
134. Gisder S, Aumeier P, Genersch E. Deformed wing virus: replication and viral load in mites (Varroa destructor). J Gen Virol. (2009) 90:463–7. doi: 10.1099/vir.0.005579-0
135. Emsen B, Hamiduzzaman MM, Goodwin PH, Guzman-Novoa E. Lower virus infections in Varroa destructor-infested and uninfested brood and adult honey bees (Apis mellifera) of a low mite population growth colony compared to a high mite population growth colony. PLoS ONE. (2015) 10:e0118885. doi: 10.1371/journal.pone.0118885
136. de Guzman LI, Rinderer TE, Frake AM. Growth of Varroa destructor (Acari: Varroidae) populations in Russian honey bee (Hymenoptera: Apidae) colonies. Ann Entomol Soc Am. (2007) 100:187–95. doi: 10.1603/0013-8746(2007)100[187:GOVDAV]2.0.CO;2
137. Danka RG, Harris JW, Dodds GE. Selection of VSH-derived “Pol-line” honey bees and evaluation of their Varroa-resistance characteristics. Apidologie. (2016) 47:483–90. doi: 10.1007/s13592-015-0413-7
138. DeGrandi-Hoffman G, Corby-Harris V, Carroll M, Toth AL, Gage S, Watkins deJong E, et al. The importance of time and place: Nutrient composition and utilization of seasonal pollens by European honey bees (Apis mellifera L.). Insects. (2021) 12:235. doi: 10.3390/insects12030235
139. Khongphinitbunjong K, de Guzman LI, Tarver MR, Rinderer TE, Chen Y, Chantawannakul P. Differential viral levels and immune gene expression in three stocks of Apis mellifera induced by different numbers of Varroa destructor. J Insect Physiol. (2015) 72:28–34. doi: 10.1016/j.jinsphys.2014.11.005
140. Khongphinitbunjong K, de Guzman LI, Rinderer TE, Tarver MR, Frake AM, Chen Y, et al. Responses of Varroa-resistant honey bees (Apis mellifera L.) to Deformed wing virus. J Asia Pac Entomol. (2016) 19:921–7. doi: 10.1016/j.aspen.2016.08.008
141. Saelao P, Simone-Finstrom M, Avalos A, Bilodeau L, Danka R, de Guzman L, et al. Genome-wide patterns of differentiation within and among U.S. commercial honey bee stocks. BMC Genom. (2020) 21:704. doi: 10.1186/s12864-020-07111-x
142. Chen Y, Pettis JS, Evans JD, Kramer M, Feldlaufer MF. Transmission of Kashmir bee virus by the ectoparasitic mite Varroa destructor. Apidologie. (2004) 35:441–8. doi: 10.1051/apido:2004031
143. Di Prisco G, Annoscia D, Margiotta M, Ferrara R, Varricchio P, Zanni V, et al. A mutualistic symbiosis between a parasitic mite and a pathogenic virus undermines honey bee immunity and health. PNAS. (2016) 113:3203–8. doi: 10.1073/pnas.1523515113
144. Posada-Florez F, Childers AK, Heerman MC, Egekwu NI, Cook SC, Chen Y, et al. Deformed wing virus type A, a major honey bee pathogen, is vectored by the mite Varroa destructor in a non-propagative manner. Sci Rep. (2019) 9:12445. doi: 10.1038/s41598-019-47447-3
145. Rinkevich FD. Detection of amitraz resistance and reduced treatment efficacy in the Varroa Mite, Varroa destructor, within commercial beekeeping operations. PLoS ONE. (2020) 15:e0227264. doi: 10.1371/journal.pone.0227264
Keywords: Apis mellifera, Black queen cell virus (BQCV), Deformed wing virus (DWV), honey bee, macronutrient, nectar, pollen, social immunity
Citation: Penn HJ, Simone-Finstrom MD, de Guzman LI, Tokarz PG and Dickens R (2022) Colony-Level Viral Load Influences Collective Foraging in Honey Bees. Front. Insect Sci. 2:894482. doi: 10.3389/finsc.2022.894482
Received: 11 March 2022; Accepted: 13 April 2022;
Published: 17 May 2022.
Edited by:
Elke Genersch, Institute for Bee Research Hohen Neuendorf (LIB), GermanyReviewed by:
Sandra Barroso-Arévalo, Complutense University of Madrid, SpainCristian Villagra, Universidad Metropolitana de Ciencias de la Educación, Chile
Copyright © 2022 Penn, Simone-Finstrom, de Guzman, Tokarz and Dickens. This is an open-access article distributed under the terms of the Creative Commons Attribution License (CC BY). The use, distribution or reproduction in other forums is permitted, provided the original author(s) and the copyright owner(s) are credited and that the original publication in this journal is cited, in accordance with accepted academic practice. No use, distribution or reproduction is permitted which does not comply with these terms.
*Correspondence: Hannah J. Penn, aGFubmFoLnBlbm5AdXNkYS5nb3Y=; Michael D. Simone-Finstrom, bWljaGFlbC5zaW1vbmVmaW5zdHJvbUB1c2RhLmdvdg==