 Asem Surindro Singh1*†
 Machathoibi Chanu Takhellambam2*†
- 1Department of Neuroscience, National Centre for Biological Sciences, Tata Institute of Fundamental Research (TIFR), Bangalore, India
- 2Department of Biotechnology, Manipur University, Imphal, India
The foraging of honey bees is one of the most well-organized and admirable behaviors that exist among social insects. In behavioral studies, these beautiful insects have been extensively used for understanding time–space learning, landmark use, and the concept of learning. Highly organized behaviors such as social interaction and communication are systematically well-organized behavioral components of honey bee foraging. Over the last two decades, understanding the regulatory mechanisms underlying honey bee foraging at the cellular and molecular levels has been increasingly interested to several researchers. Upon the search of regulatory genes of brain and behavior, immediate early (IE) genes are considered as a good tool to begin the search investigation. Our two recent studies have demonstrated three IE genes, namely, Egr-1, Hr38, and Kakusei, playing a role in the daily foraging of bees and their association with learning and memory during foraging. These studies further evidence that IE genes can be used as a tool in finding the specific molecular/cellular players of foraging in honey bees and its behavioral components such as learning, memory, social interaction, and social communication. In this article, we provide the details of the method of sample collection at different times during foraging to investigate the foraging regulatory molecules.
Introduction
Honey bee foraging consists of several behavioral components that include search of food, identification and memorization of food source location, carrying and storing of food, and interaction and communication (1–6). Inside the artificial bee house, honey bees flew several times to and fro carrying pollen/nectar from the feeder to the hive. All these behaviors can be observed by feeding the bees few meters away from the hive inside the bee house. Generally, cap honey bees or European honey bee Apis mellifera is widely used for understanding behavioral dynamics of social insects. Though it looks small and tiny, this insect displays incredible means to communicate each other. During foraging, honey bees of the same colony share information and communicate each other through a typical movement called “waggle dance” of honey bees that looks like the numerical figure eight. For the first time, this waggle dance of bees was translated by Austrian ethologist Karl Ritter von Frisch, and he received the Nobel Prize in Physiology or Medicine in 1973 for his incredible effort toward investigating the sensory perceptions in honey bees (7–10).
So far, the foraging behavior of honey bees has been extensively studied and available data are plenty. This has opened incredible research opportunities for understanding the regulatory mechanisms in various ways in honey bees. However, the reports on the underlying mechanisms in the brain are very limited. In recent years, there is increasing research interest in this direction. Understanding cellular and molecular regulators of honey bee foraging not only would be confined within insects, but also can offer some guidelines/clues toward unwinding the complexity of neural circuitry systems and molecular underpinnings in higher animals and humans (11). Because humans and other large animals have many similar behavioral features with honey bees, there is sequence homology in the genes across various species.
Upon the search of foraging regulatory genes in the brain, to begin with IE genes is a promising way of investigation because they are well-known neural markers. The IE genes had been found to have persisting roles from the first stages of brain development into adulthood, showing possible inherent features in everyday brain activity (12). It also showed to have dramatic roles in phenotypic changes that occurred in neurons (13). There are many IE gene encoded transcription factors that are rapidly induced within the neurons, and some were delayed (14, 15) in response to different stimuli and cellular environments that result in neuronal capacities with short- and long-lasting phenotypic changes (12, 16). Following the stimulation, early response neurons react from milliseconds to minutes, which involve first and second messenger systems and phosphatases, whereas late response persists from hours to days and even to permanent changes coupled with gene expression changes (16, 17). The late response neurons were found to be linked to learning, memory, sensitization processes, and drug tolerance habits (16, 17). Remarkably, during the process of nerve stimulation, the IE genes have been noted as first activated genes that link to membrane events and nucleus (18). Therefore, regulation in the IE gene expression level is considered to be the first part in the general neuronal response to a natural stimulus. Thus, it is a promising way to start with IE genes in the planning of experimental strategies from scratch toward finding specific molecular and neuronal pathway that link to a specific behavior.
In our two recent studies, we have found the involvement of three IE genes, Egr-1, Hr-38, and Kakusei, in the daily foraging of honey bees as well as their possible role in learning and memory processing during foraging (4, 5). Moreover, the possible role of downstream genes of Egr-1, ecdysone receptor (EcR), dopamine/ecdysteroid receptor (DopEcR), dopamine decarboxylase (Ddc), and dopamine receptor 2 (Dr2) were also revealed. Subsequently, involvement of Hr38, EcR, and DopEcR, which are part of the ecdysteroid signaling pathway, in learning and memory processes, has also been indicated (4). In these studies, we have performed sample collections/behavioral experiments while the bees were on the process of foraging, and such an experiment was not reported before. Another interesting part of the study is that the behavioral experiments were performed in a more or less natural environment or may be considered as a semi-natural condition. The bee house is airy and the bees could fly back and forth and continued to forage without any disturbance or a negligible disturbance. In this article, we focus to highlight the method of sample collection in particular and the molecular experiments in detail that had been published briefly in our two previous articles (4, 5) with few additional data.
Materials and Methods
Behavioral Experiment and Sample Collection
European honey bee species (also known as cap honey bees) Apis mellifera colonies were purchased from the local bee keepers in Bangalore, Karnataka, India. The bee colonies were placed inside the bee house of the institute, National Center for Biological Sciences (NCBS), Tata Institute of Fundamental Research (TIFR), Bangalore, India. A. mellifera is one of the most common and widely domesticated honey bee species in the world. Therefore, this honey bee species is not endangered or threatened and available in almost every place in the world. Behavioral test was performed inside the bee house of NCBS, which is an outdoor flight cage. The bee house is 12 m in length, 5 m in height, and 2.5 m in width. The bees were fed with pollen in a green plastic plate and 1 M sucrose solution in a yellow plastic plate. The distance of feeders from the beehive was 10 m, and the two feeders were kept 1.5 m apart from each other. The bees were fed every day from 14:00 to 17:00 h.
Sample collection was started after the foraging bees had learned and already adapted about the location of feeders and had visited the feeders for several days. The collected samples were subjected to gene expression profiling, and for this, only nectar foragers were collected. The procedures were briefly described in our two previous articles (4, 5), and in this article, we described the method in detail.
Sample Collection Procedure and Grouping
Sample Collection During Foraging
For the 0-min group sample, the first arriving foragers at the feeder plate were caught before presenting the sucrose solution on the plate and the caught bees were immediately flash frozen in liquid nitrogen. For catching the bees, 50-ml falcon tubes with tiny pores were used. As soon as the first collection was over, sucrose solution was poured on the plate, and some of the first arriving foragers were gently marked using Uni POSCA Paint Markers (Uni Mitsubishi Pencil, UK) on the head while they are drinking sucrose solution and time count was immediately started. The marked bees that arrived on the feeder during their repeated trips were gently caught at a series of different time points with 15-min intervals up to 2 h. The time points were 15, 30, 45, 60, 75, 90, 105, and 120 min. After catching, the bees were immediately flash frozen in liquid nitrogen. About 24 bees were collected in a day from 14:00 h to 16:00 h, i.e., one to two bees for each time point and continued in the same manner in the following days until 5 bees were obtained for each time point group. The collected samples were stored at −80°C for further experiment.
Sample Collection for Before and After Foraging Groups
For collecting the before-foraging samples, some first arriving bees on the feeder at 14:00 h were paint-marked (in the same way as above) and collected in the following morning at 09:00 h inside the hive, before they started flying out from the hive for foraging. In the case of after-foraging samples, the bees that were paint-marked were caught in the hive in the evening at 18:00 h of the same day of paint marking after the bees finished foraging. Gentle care had been taken always during the collection procedure in order not to disturb the bees' normal behavior and to avoid inducing stress phenomena; in this way, minimal interactions between the collector and the bees could be accounted (19–21). The caught bees were immediately flash frozen in liquid nitrogen and stored at −80°C for further processing. In this case, five bees in each group were collected at the same time on the same day of collection.
Sample Collection for Food Unrewarded Group
This group consisted of only the foraging bees collected on the empty feeder plate, and the collection was done for 1 h at four time points with intervals of 15 min. The 0-min samples were collected at 14:00 h on the empty feeder plate and immediately followed by paint marking of some bees (in the same way as above) for the collection in the four subsequent time points. Since bees had to be collected without food reward in the remaining four time points, a simple trick was applied. A small amount of 1 M sucrose solution was presented on the plate to let the bees continue foraging on the feeder but a little portion was allowed to be accessible to the bees for drinking by covering the sucrose solution with a transparent bowl. This way, the marked bees were stopped from drinking sucrose solution and assured that they did not touch the sucrose solution while some unmarked bees were allowed to drink. The paint-marked bees were caught as soon as they landed on the feeder plate. About one to two bees were collected in each day and the collection was done from 14:00 to 16:00 h, and each group had five bees at least. The bees were immediately flash frozen in liquid nitrogen as soon as they were caught and stored at −80°C for further experiments.
Gene Expression Profiling
Brain Dissection
The frozen bees at −80°C were removed and lyophilized at −50°C with vacuum at 0.420 mBar for 20 min, using a lyophilizer (Freeze Zone1 PlusTM 4.5 L cascade Freeze Dry System, Labconco Corporation, Kanas City). The bee head was placed in a glass chamber containing 100% ethanol placed on a dry ice platform and the brain dissection was performed under a light microscope. Soon after the dissection, the whole brain was immediately placed into a 1.5-ml Eppendorf tube placed on dry ice, and 500 μl of Trizol (Trizol Reagent, Ambion RNA, Life Technology) was added. Thus, a prepared sample was ready for total RNA preparation. The same procedure was followed for every bee brain dissection.
RNA Preparation and cDNA Conversion
The frozen sample was thawed after placing on ice and the brain was homogenized using an electronic homogenizer (Micro-Grinder Pestle Mixer, RPI Research Products International) with pestle (Micro-Tube Sample Pestles, Research Products International). By centrifugation at 10,000 g for 5 min at 4°C, the total RNA, protein, DNA, and cell debris fractions were separated. The upper clear fraction containing RNA was removed gently, leaving the lower portion containing genomic DNA, tissue debris, and the protein fractions. Thus, the total RNA was extracted. Then, cDNA was prepared from the total RNA, by using the kits supplied by Invitrogen (Thermo Fisher Scientific). The manufacturer's protocol was followed in cDNA preparation.
Quantitative Real-Time PCR
The prepared cDNA from each brain as in the above was subjected to qPCR using a 7900HT Fast Real Time PCR System (Applied Biosystem, Singapore). The qPCR reaction mixture for each sample was prepared in 200-μl microcentrifuge tubes with 10-μl reaction volume that contained cDNA, oligonucleotide primers (Sigma-Aldrich) specific to target genes, and SYBR Green [KAPA Syber1 FAST PCR Master Mix (2X) ABI Prism1]. The qPCR cycles followed Applied Biosystem protocol. Rp49 was used as endogenous control in every qPCR run. The details of the target genes and the oligonucleotide primers are provided in Table 1.
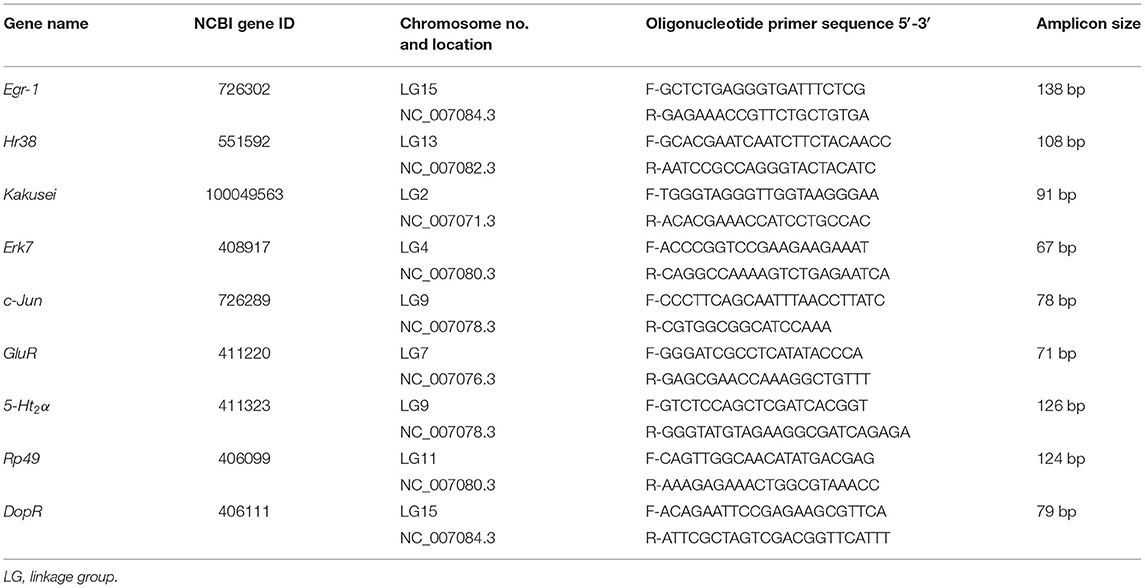
Table 1. Gene locations, oligonucleotide primers, and the qPCR product amplicon sizes.
In order to examine the efficiency of qPCR amplification of the target genes, a positive and negative control were also used in every qPCR run. In case of positive control, instead of cDNA, 20 times diluted genomic DNA prepared from the whole honey bee [using the method by (22)] was added, whereas for negative control, neither genomic DNA nor cDNA was added in the PCR reaction mixture. The rest of the PCR master mix components in both the positive and negative control was the same as that of the target genes. For standard curve, cDNA was used as template with five different concentrations that were serially diluted by 10-fold. The amplification of target genes by qPCR was confirmed by gel electrophoresis in 2% agarose gel (Figure 1). Amplification of single amplicon was also examined from the machine-generated melt curve or dissociation curve. We used the relative standard curve method for relative gene expression analysis. The standard curve with a correlation coefficient (R2) value >0.98 and close to 1 was considered for further analysis (Figure 1). The CT values thus generated were used for the relative gene expression analysis.
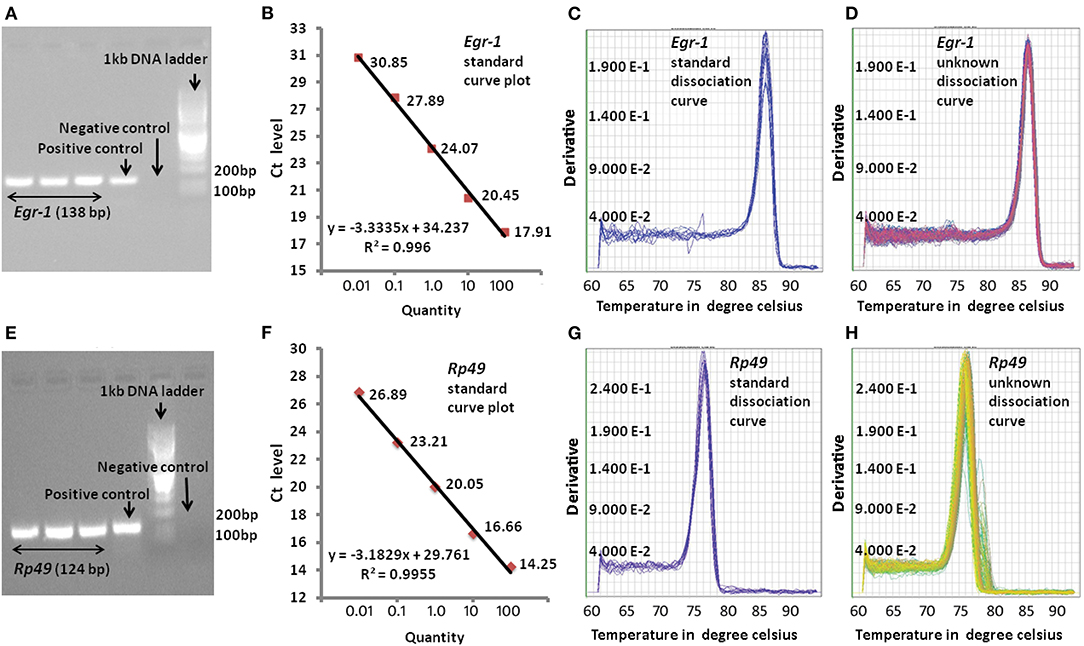
Figure 1. Representative pictures of qPCR analysis. (A) qPCR product gel electrophoresis for Egr-1 on 2% agarose gel, (B) standard curve for Egr-1 with R2 = 0.0993, (C) dissociation curve for Egr-1 standard cDNA amplification, (D) dissociation curve for Egr-1 unknown cDNA amplification, (E) qPCR product gel electrophoresis for Rp49 on 2% agarose gel, (F) standard curve for Rp49 with R2 = 0.994, (G) dissociation curve for RP49 standard cDNA amplification, and (H) dissociation curve for Rp49 unknown cDNA amplification.
Statistical Analysis
The relative gene expression level was calculated using the relative standard curve method with the help of SDS 2.4 software provided with the 7900HT Fast Real system. The standard deviation was calculated following Applied Biosystem's “Guide to performing relative quantification of gene expression using real-time quantitative PCR.” The fold changes at all the time points were determined relative to time t0, and the statistical significance was examined using one-way ANOVA with Tukey–Kramer post-hoc multiple comparison test and the analysis was carried out with the help of GraphPad InStat software (23). Normal distribution of each comparing group was tested using the D'Agostino & Pearson omnibus normality test.
Results
Expression Analysis for Target Genes by qPCR
The expression profiles for all the target genes were measured with the help of qPCR. Highly efficient qPCR results were considered for the relative gene expression analysis. Efficiency of each qPCR result was investigated at different stages before analyzing the relative gene expression levels of target gene with respect to the house keeping gene Rp49. Gel electrophoresis of qPCR products were performed for confirming the specific amplification of the target genes, without/negligible primer dimer formation and free of non-specific gene amplification. Standard curve plots with correlation coefficient (R2) value >0.98 and close to 1 were taken as considerably accurate in the relative measurement of the unknown amount of expression of the target genes. The dissociation curves or melting curves were further examined for the specific amplification of the target genes in each cycle of the qPCR. A representative picture of efficiency checking is shown in Figure 1.
IE Genes, Egr-1, Hr-38, and Kakusei Expression During Foraging, Before Foraging, and After Foraging
In this study, we have combined most of our recent published data in two different journals (4, 5). A total of nine genes have been considered including a house keeping gene Rp49. The eight genes are Egr-1, Hr38, Kakusei, c-Jun (Jra), Erk7, GluR, 5-Ht2α, and DopR, and further details of these genes are provided in Table 1. Among the four IE genes, Egr-1, Hr38, Kakusei, and c-Jun (Jra), we observed that Egr-1, Hr38, and Kakusei were found to have significant transient overexpression during the reward foraging within 2 h. The results are summarized in Figure 2 and further details of the statistical significance are provided in Table 2. The other four genes Erk7, GluR, 5-Ht2α, and DopR as well as c-Jun (Jra) were found to have no statistical difference in their expression during foraging as shown in Figure 3. Furthermore, there is no expression change in case of before and after foraging groups except for Hr38 exp. 2 (p < 0.05).
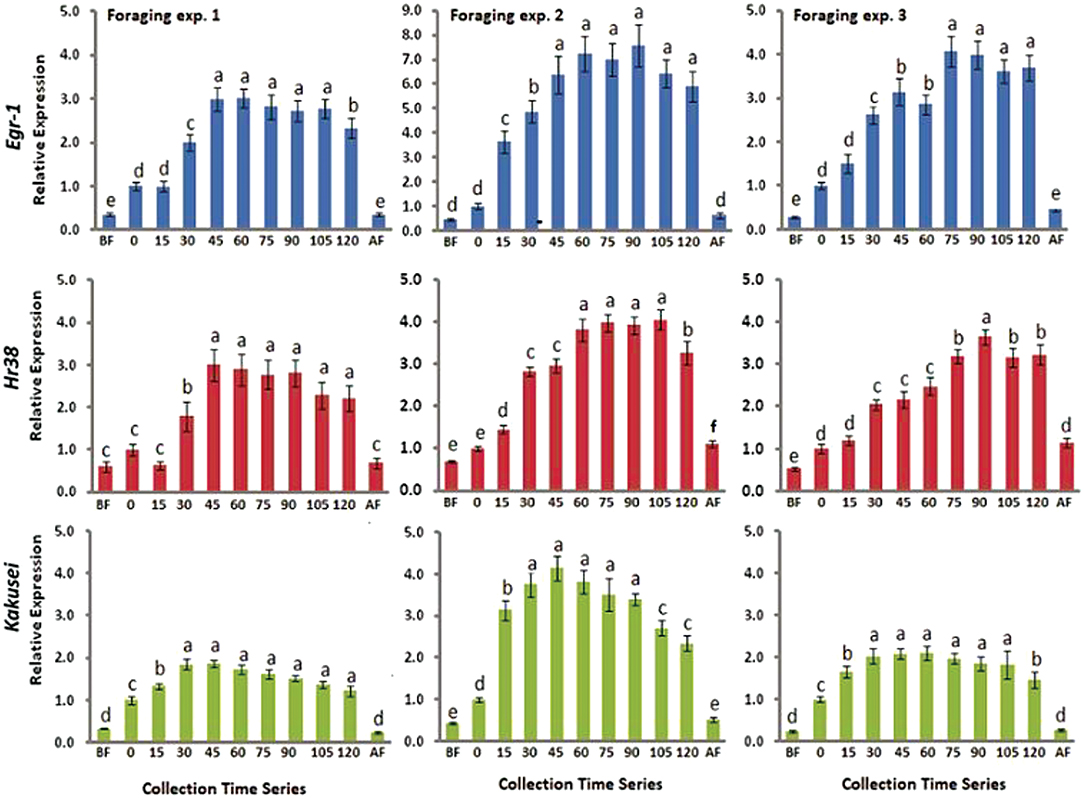
Figure 2. Bar graphs for three IE gene expression during, before, and after foraging. Blue, red, and green represent Egr-1, Hr38, and Kakusei expression during foraging at a known feeder. Data are shown as fold changes with respect to 0 min (mean value was set as 1), which indicates the presentation of the feeder and start of continuous foraging. BF, before foraging and AF, after foraging. Foraging experiments 1, 2, and 3 represent three independent replicate experiments. Statistical significance was calculated using one-way ANOVA with Tukey-Kramer post-hoc multiple comparison tests and significant levels were represented by p-values. p ≥ 0.05 is considered to have no significant difference and p < 0.05 is considered to be significantly different between the means. The statistical difference between the adjacent groups is represented by letters a, b, c. Same letters above the adjacent error bars represent no significant difference and different letters represent a significant difference. Sample size for each time point is n = 5.
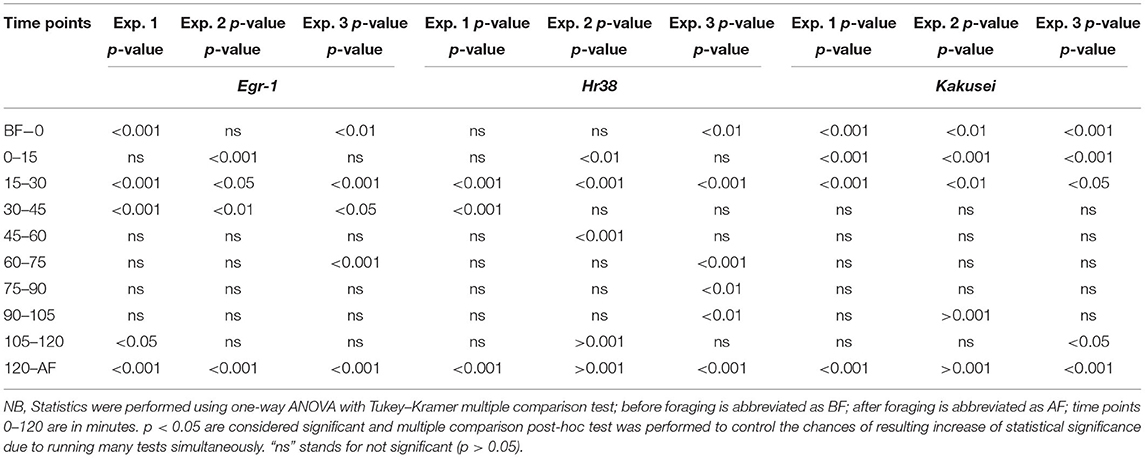
Table 2. Statistical significance analysis for Egr-1, Hr38, and Kakusei at different points in 2 h of sample collection during food reward foraging, after foraging, and before foraging.
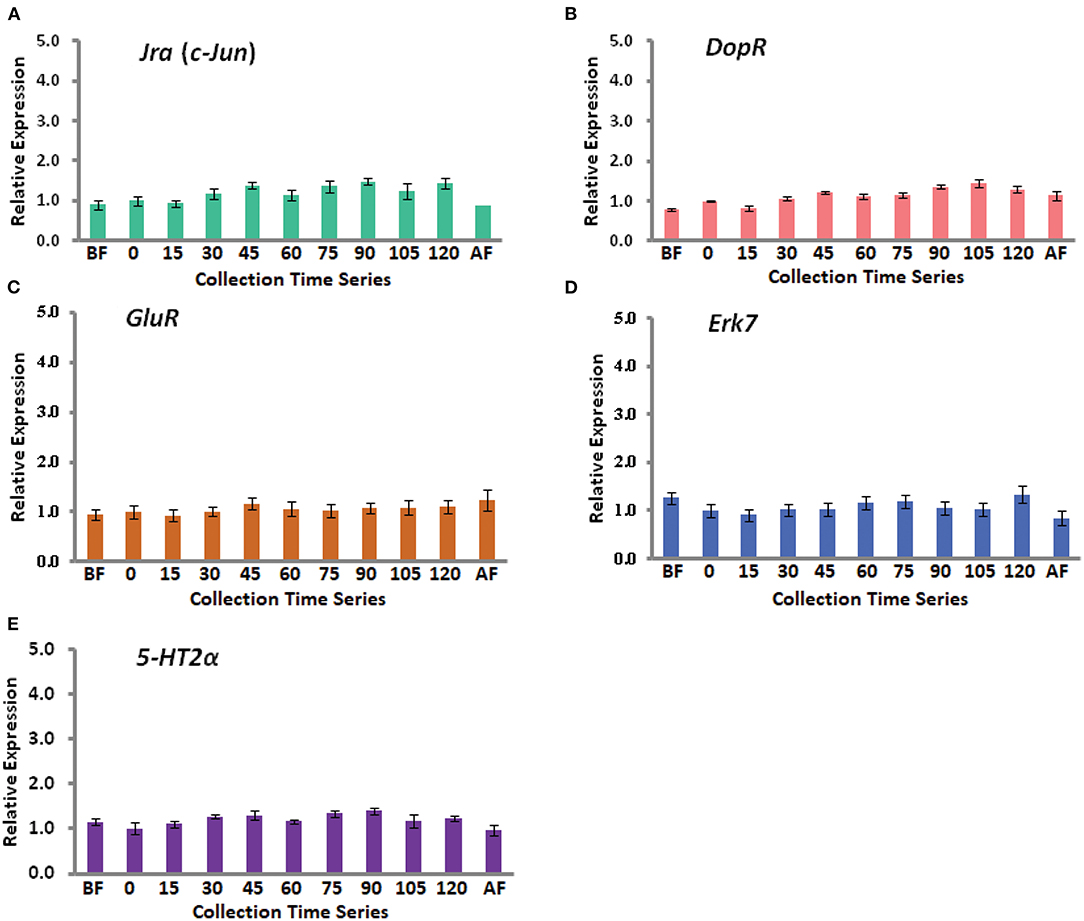
Figure 3. Gene expression profile for the five insignificant genes. (A) With green bars, (B) with red bars, (C) with brown bars, (D) with blue bars, and (E) with violet bars represent Jra (c-Jun), DopR, GluR, Erk7, and 5-HT2α expression during the food reward foraging. The fold changes differences were measured with respect to 0 min (mean value was set as 1 at this time point). Each time point has a sample size of n = 5.
Egr-1, Hr-38, and Kakusei Expression During Foraging at the Extended Hour
In another experiment, we collected the samples for 1 h with 15-min intervals, which is after 2 h of reward foraging, from 16:00 h to 17:00 h, during which bees were continuing feeding. These data have not been published before. It may be noted that the bees had been fed since 14:00 h, as everyday routine. This experiment was conducted because we further wanted to check if there might be any change in the gene expression during the later hour of foraging. We did not find any change in gene expression of all the three genes Egr-1, Hr38, and Kakusei, as shown in Figure 4A. This shows that the transient overexpression occurred only within the first 2 h of reward foraging.
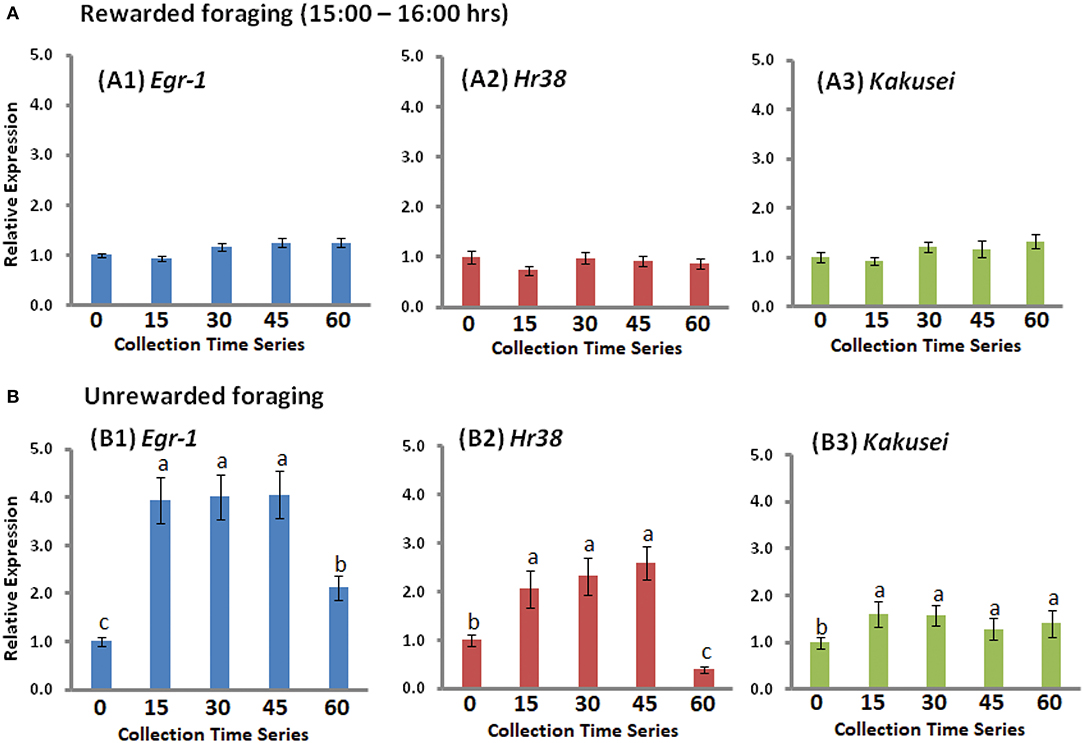
Figure 4. (A) The expression profile of Egr-1 (blue), Hr38 (red), and Kakusei (green) during the extended collection hour (15:00 h−16:00 h). (B) The expression of Egr-1 (blue), Hr38 (red), and Kakusei (green) during unrewarded foraging. The fold change differences were calculated with respect to 0 min (mean value was set as 1 at this time point). Each time point has a sample size of n = 5. For statistics, one-way ANOVA with Tukey–Kramer post-hoc multiple comparison test was performed. p ≥ 0.05 is considered to have no significant difference and p < 0.05 is considered to be significantly different between the means. The statistical difference between the adjacent groups is represented by letters a, b, or c. Same letters above the adjacent error bars represent no significant difference and different letters represent a significant difference. Sample size for each time point is n = 5.
IE Genes, Egr-1, Hr-38, and Kakusei Expression Level During Unrewarded Foraging
In case of unrewarded foraging, the three IE genes Egr-1, Hr38, and Kakusei were increased in the first 15 min of foraging upon the presentation of empty feeder plate and no further increase thereafter, as the food was not rewarded to the bees. The statistical significance between the 0-min and 15-min group for the three genes are presented with p < 0.001 for Egr-1/Hr38 and p < 0.01 for Kakusei. Subsequently, between 45 min and 60 min, the significant difference for Egr-1 and Hr38 is leveled with p < 0.001 and not significant for Kakusei. Gene expression level began to reduce at about 45 min. The summary of this result for Egr-1, Hr38, and Kakusei is figuratively presented in Figure 4B.
Discussion
Our recent publications have supported that IE genes can be used as tools in searching for cellular and molecular mechanisms underlying the foraging behavior of honey bees (3–5, 24). In those studies, we investigated the role of IE gene involvement during the daily foraging and with the examination of reasonably longer duration, which was for 2 h, during the foraging. However, we have not published in detail about the method we used, basically about sample collection at different time points in 2 h during the daily rewarded foraging of bees. Here, we report the detailed method with the addition of a small amount of unpublished data, shown in Figure 4A.
All these data clearly show that the three IE genes, Egr-1, Hr38, and Kakusei, were transiently expressed during the first 2 h of rewarded foraging and after which the three genes have no significant role, as indicated by their expression levels that continued to decline, even though the bees continued foraging with food reward. This indicates the presence of active roles of the downstream genes of these IE genes in the subsequent hours of foraging. From these results, one may have an idea of choosing an appropriate time during foraging to test other IE genes as well as their upstream or downstream molecular players and designed further experiments for finding specific roles they play in the specific behavioral features of honey bees during foraging. Our findings also have indicated the possible role of those three IE genes in learning and memory processing and associative learning. Further research is needed in order to find the specific molecular pathways underlying those behaviors. The advantage of working with this method is that the behavioral experiments were performed in more or less natural conditions as the bees continued foraging without showing any visible disturbance at a stretch of 2 h or more of sample collection. Therefore, we assumed that little inconvenience caused by paint marking to the bees is negligible. These results also display to choose a specific time point for sample collection during rewarded/unrewarded foraging in the further studies of Egr-1, Hr38, and Kakusei associated genes. It would be more interesting if we could categorically study the specific age group of the foraging bees in case there may be variations in the gene expression level among the different age groups of foraging bees and, moreover, examine the overexpression of the target proteins that could further validate our data to the next level; these are the limitations of this study.
In other reports, Beckmann and Wilce (18) mentioned that IE gene encoded proteins can be individually regulated in different regions of the brain depending on the type of the stimuli. This suggests that the same/different IE gene expression at different parts of the brain induced by different stimuli may signal to perform different behavioral tasks; in other words, different behaviors correspond to IE gene expression at different parts of the brain depending on the type of the stimulus. The IE genes also rapidly and transiently induced within minutes of stimulation in the absence of de novo protein synthesis, and regulation of IE gene production is necessary for the cells, because in turn it can activate the downstream target molecules that typically function as a part of a network of constitutively expressed proteins (25). Furthermore, different IE genes reach their peak levels at different times even though they expressed immediately after the stimulation (26, 27). Our data agree with the report, as in the case of three genes we investigated, Kakusei reached its peak earlier than Egr-1 and Hr-38. These several lines of evidences clearly reveal that it is a good choice to start with IE genes when we need to start from scratch for unwinding the molecular and cellular mechanisms underlying specific behaviors of honey bees during foraging, such as learning, memory, social interaction, and social communication.
Data Availability Statement
The datasets presented in this study can be found in online repositories. The names of the repository/repositories and accession number(s) can be found in the article/supplementary material.
Author Contributions
All authors listed have made a substantial, direct and intellectual contribution to the work, and approved it for publication.
Funding
This work was completed with the help of Research Associate Fellowship provided by Council of Scientific and Industrial Research, Government of India, Award No. 09/860(0167)/2015—EMR-1 and Bridging Postdoctoral Fellowship by the National Center for Biological Sciences, TIFR, India, to AS.
Conflict of Interest
The authors declare that the research was conducted in the absence of any commercial or financial relationships that could be construed as a potential conflict of interest.
Publisher's Note
All claims expressed in this article are solely those of the authors and do not necessarily represent those of their affiliated organizations, or those of the publisher, the editors and the reviewers. Any product that may be evaluated in this article, or claim that may be made by its manufacturer, is not guaranteed or endorsed by the publisher.
Acknowledgments
Dr. Axel Brockmann was gratefully acknowledged for providing the facilities to perform and complete the experiments in his lab. The National Center for Biological Sciences (NCBS), TIFR, India, was gratefully acknowledged for the fellowships provided to AS in successfully completing this project.
References
1. Frisch KV. Tanzsprache und Orientierung der Bienen. Berlin; Heidelberg: Springer Verlag (1965). doi: 10.1007/978-3-642-94916-6
3. Singh AS. Immediate early genes as search tool for finding cellular and molecular events underlying social behaviors of honeybees: a brief commentary. Nova Med Health Adv Med Biol. (2019) 153:181–91.
4. Singh AS, Shah A, Brockmann A. Honey bee foraging induces upregulation of early growth response protein 1, hormone receptor 38 and candidate downstream genes of the ecdysteroid signalling pathway. Insect Mol Biol. (2018) 27:90–8. doi: 10.1111/imb.12350
5. Singh AS, Machathoibi T, Cappelletti P, Feligioni M. Immediate early gene kakusei potentially plays a role in the daily foraging of honey bees. PLoS One. (2020) 15:e0222256. doi: 10.1371/journal.pone.0222256
6. Shah A, Jain R, Brockmann A. Egr-1: a candidate transcription factor involved in molecular processes underlying time-memory. Front Psychol. (2018) 9:865. doi: 10.3389/fpsyg.2018.00865
7. Michelsen A. Karl von Frisch lecture. Signals and flexibility in the dance communication of honey bees. J Comparat Physiol A. (2003) 189:165–74. doi: 10.1007/s00359-003-0398-y
8. Von Frisch K. The Dance Language and Orientation of Bees. Cambridge, MA: Harvard University Press (1993). doi: 10.4159/harvard.9780674418776
9. Riley J, Greggers U, Smith A, Reynolds D, Menzel R. The flight paths of honey bees recruited by the waggle dance. Nature. (2005) 435:205–7. doi: 10.1038/nature03526
10. Seeley TD, Visscher PK, Passino KM. Group decision making in honey bee swarms. Am Sci. (2006) 94:220–9. doi: 10.1511/2006.59.220
11. Singh AS. Genetic predominance of autism spectrum disorder and finding the risk genes. OA Autism. (2014) 2:8.
12. Loebrich S, Nedivi E. The function of activity-regulated genes in the nervous system. Physiol Rev. (2009) 89:1079–103. doi: 10.1152/physrev.00013.2009
13. Dijkmans TF, van Hooijdonk LW, Schouten TG, Kamphorst JT, Fitzsimons CP, Vreugdenhil E. Identification of new Nerve Growth Factorresponsive immediate-early genes. Brain Res. (2009) 1249:19–33. doi: 10.1016/j.brainres.2008.10.050
14. Friedman WJ, Altiok N, Fredholm BB, Persson H. Mechanisms of nerve growth factor mRNA regulation by interleukin-1 beta in hippocampal cultures: role of second messengers. J Neurosci Res. (1992) 33:37–46. doi: 10.1002/jnr.490330106
15. Kaczmarek L. Molecular biology of vertebrate learning: is c-fos a new beginning? J. Neurosci Res. (1993) 34:377–81. doi: 10.1002/jnr.490340402
16. Hughes P, Dragunow M. Induction of immediate-early genes and the control of neurotransmitter-regulated gene expression within the nervous system. Pharmacol Rev. (1995) 47:133–78.
17. Clayton DF. The genomics of memory and learning in songbirds. Annu Rev Genomics Hum Genet. (2013) 14:45–65. doi: 10.1146/annurev-genom-090711-163809
18. Beckmann AM, Wilce PA. Egr transcription factors in the nervous system. Neurochem Int. (1997) 31:477–510. doi: 10.1016/S0197-0186(96)00136-2
19. Abbott KR, Dukas R. Honey bees consider flower danger in their waggle dance. Anim Behav. (2009) 78:633–5. doi: 10.1016/j.anbehav.2009.05.029
20. Bateson M, Desire S, Gartside SE, Wright GA. Agitated honey bees exhibit pessimistic cognitive biases. Curr Biol. (2011) 21:1070–3. doi: 10.1016/j.cub.2011.05.017
21. Nieh JC. A negative feedback signal that is triggered by peril curbs honey bee recruitment. Curr Biol. (2010) 20:310–5. doi: 10.1016/j.cub.2009.12.060
22. Evans JD, Schwarz RS, Chen YP, Budge G, Cornman RS, Delarua P, et al. Standard methodologies for molecular research in Apis mellifera. In: Dietemann V, Ellis JD, Neumann P, editors. The Coloss Beebook, Volume I: Standard Methods for Apis mellifera research Journal of Apicultural Research. Vol. 52. Coloss Honey Bee Research Associaton; University of Bern (2013). p. 1–54. doi: 10.3896/IBRA.1.52.4.11
23. Motulsky HJ. Analyzing Data with GraphPad Prism. San Diego, CA: GraphPad Software Inc. (1999). Available online at: www.graphpad.com (accessed August 15, 2021).
24. Sommerlandt FMJ, Brockmann A, Rossler W, Spaethe J. Immediate early genes in social insects: a tool to identify brain regions involved in complex behaviors and molecular processes underlying neuroplasticity. Cell Mol Life Sci. (2019) 76:637–51. doi: 10.1007/s00018-018-2948-z
25. Perez-Cadahia B, Drobic B, Davie JR. Activation and function of immediate-early genes in the nervous system. Biochem Cell Biol. (2011) 89:61–73. doi: 10.1139/O10-138
26. Bottai D, Guzowski JF, Schwarz MK, Kang SH, Xiao B, Lanahan A, et al. Synaptic activity-induced conversion of intronic to exonic sequence in Homer 1 immediate early gene expression. J Neurosci. (2002) 22:167–75. doi: 10.1523/JNEUROSCI.22-01-00167.2002
Keywords: honey bee foraging, learning and memory, immediate early genes expression, Egr-1 (early growth response protein 1), Hr-38, Kakusei
Citation: Singh AS and Takhellambam MC (2021) A Method to Study Honey Bee Foraging Regulatory Molecules at Different Times During Foraging. Front. Insect Sci. 1:723297. doi: 10.3389/finsc.2021.723297
Received: 10 June 2021; Accepted: 18 August 2021;
Published: 22 September 2021.
Edited by:
Peng He, Guizhou University, ChinaReviewed by:
Lin Liu, South China Normal University, ChinaLiu Fangzhou, Cornell University, United States
Copyright © 2021 Singh and Takhellambam. This is an open-access article distributed under the terms of the Creative Commons Attribution License (CC BY). The use, distribution or reproduction in other forums is permitted, provided the original author(s) and the copyright owner(s) are credited and that the original publication in this journal is cited, in accordance with accepted academic practice. No use, distribution or reproduction is permitted which does not comply with these terms.
*Correspondence: Asem Surindro Singh, YXNlbXN1cmVuQGdtYWlsLmNvbQ==; Machathoibi Chanu Takhellambam, bWFjaGF0aG9pYmkyMDA4QGdtYWlsLmNvbQ==
†These authors have contributed equally to this work