 Bingxin Zhang1
 Dong Zheng1
 Shuxia Zhu1Xinyi Zhang1
 Quanqiang Wang1
 Zhili Lin1Ziwei Zheng1
 Shujuan Zhou1Zixing Chen2
 Sisi Zheng1Enqing Lan2Luning Cui1Hansen Ying2Yu Zhang1Xuanru Lin1Qiang Zhuang1Honglan Qian1Xudong Hu1Yan Zhuang1Qianying Zhang1Zhouxiang Jin2*
 Songfu Jiang1*
 Yongyong Ma1,3,4*
- 1Department of Hematology, The First Affiliated Hospital of Wenzhou Medical University, Wenzhou, Zhejiang, China
- 2Department of Hepatobiliary Surgery, The Second Affiliated Hospital and Yuying Children’s Hospital of Wenzhou Medical University, Wenzhou, Zhejiang, China
- 3Key Laboratory of Intelligent Treatment and Life Support for Critical Diseases of Zhejiang, Wenzhou, Zhejiang, China
- 4Zhejiang Engineering Research Center for Hospital Emergency and Process Digitization, Wenzhou, Zhejiang, China
Background: Disulfidptosis is an emerging type of programmed cell death related to ROS accumulation and aberrant disulfide bond formation. Multiple myeloma (MM) is the second most prevalent hematologic malignancy characterized by a high synthesis rate of disulfide bond-rich proteins and chronic oxidative stress. However, the relationship between disulfidptosis and MM is still unclear.
Methods: Using the non-negative matrix factorization and lasso algorithm, we constructed the disulfidptosis-associated subtypes and the prognostic model on the GEO dataset. We further explored genetic mutation mapping, protein-protein interactions, functional enrichment, drug sensitivity, drug prediction, and immune infiltration analysis among subtypes and risk subgroups. To improve the clinical benefits, we combined risk scores and clinical metrics to build a nomogram. Finally, in vitro experiments examined the expression patterns of disulfidptosis-related genes (DRGs) in MM.
Results: By cluster analysis, we obtained three subtypes with C2 having a worse prognosis than C3. Consistently, C2 exhibited significantly lower sensitivity to doxorubicin and lenalidomide, as well as a higher propensity for T-cell depletion and a non-responsive state to immunotherapy. Similarly, in the subsequent prognostic model, the high-scoring group had a worse prognosis and a higher probability of T-cell dysfunction, immunotherapy resistance, and cancer cell self-renewal. DRGs and risk genes were widely mutated in cancers. Subtypes and risk subgroups differed in ROS metabolism and the p53 signaling pathway. We further identified eight genes differentially expressed in risk subgroups as drug targets against MM. Then 27 drugs targeting the high-risk group were predicted. Based on the DRGs and risk genes, we constructed the miRNA and TF regulatory networks. The nomogram of combined ISS, age, and risk score showed good predictive performance. qRT-PCR of cell lines and clinical specimens provided further support for prognostic modeling.
Conclusion: Our research reveals the prognostic value of disulfidptosis in MM and provides new perspectives for identifying heterogeneity and therapeutic targets.
1 Introduction
Multiple myeloma (MM) is the second most common hematologic malignancy characterized by malignant transformation of plasma cells in the bone marrow, whose uncontrolled growth may lead to hypercalcemia, renal injury, anemia, and destructive bone damage (1). Although the treatment paradigm for MM has made great strides in the past, a cure remains out of reach for most patients. Many patients eventually develop resistance to the standard therapies, which ultimately leads to relapse. The treatment of relapse-refractory MM, especially in patients with risk characteristics, remains a clinical challenge (2). Malignant transformation of plasma cells is frequently accompanied by molecular biological aberrations. The presence of potential molecular drivers leads to heterogeneity in the clinical course (3, 4). The International Staging System (ISS) is based on two simple laboratory indicators: serum albumin and β2-microglobulin (β2-MG) levels. The revised ISS (R-ISS) further combines high-risk genetic abnormalities, lactate dehydrogenase (LDH) levels, and ISS. The ISS and R-ISS are the most widely used prognostic evaluation systems for MM (5). However, there are still limitations to the heterogeneity and prognostic evaluation of MM patients based on the above staging (6). Therefore, it is imperative to develop reliable and effective prognostic biomarkers to identify high-risk features in MM and to guide customized and optimal treatment.
In addition, there is growing evidence that cancer cells exhibit altered metabolic profiles associated with increased demand for metabolic gene reorganization (7–9). A recent study reported an emerging type of metabolism-related programmed cell death, namely “disulfidptosis” (10). During glucose deprivation, SLC7A11-mediated cystine uptake leads to the accumulation of ROS and the formation of abnormal disulfide bonds by consuming intracellular NADPH, thereby promoting cell death by disrupting the conformation of cytoskeletal proteins (10).
Oxidative stress and mutational risk are two important pathogenic mechanisms in MM, and the former can in turn lead to the accumulation of the latter (11, 12). As a tumor with a high protein synthesis and secretion load (13), MM relies on the thioredoxin (Trx) system to reduce endoplasmic reticulum stress and oxidative stress (14). These cells secrete large amounts of immunoglobulins and cytokines requiring the support of rearranged disulfide bonds (13, 15, 16). It relies on the protein disulfide isomerase (PDI) to fold and preserve its structural integrity (17, 18). In addition, actin polymerization is an important process by which myeloma cells home to the BM and interact with its protective microenvironment. However, current studies on the relationship between disulfidptosis and MM remain to be further explored.
In our study, distinct clustering features were identified to explore the heterogeneity of MM based on disulfidptosis-related molecular characteristics. The model associated with disulfidptosis was developed to characterize the immune microenvironment, assess drug sensitivity, and predict the prognosis and immunotherapy sensitivity of MM. Disulfidptosis may provide new avenues for MM risk stratification and metabolic therapy.
2 Materials and methods
2.1 Data acquisition
The Gene Expression Omnibus (GEO) database (http://www.ncbi.nlm.nih.gov/geo/) was utilized to obtain the gene expression and clinical data of the MM patients (GSE136337, GSE24080, and GSE4204). We normalized the three datasets to increase the comparability between the data. GSE136337 was used to construct tumor subtypes and prognostic models, while the other two were used as validation sets. We screened samples with complete survival information (GSE136337, n = 424; GSE24080, n = 556; GSE4204, n = 534). Subjects with complete clinical data were further identified (GSE136337, n = 415; GSE24080, n = 556). Table 1 summarizes the included datasets.
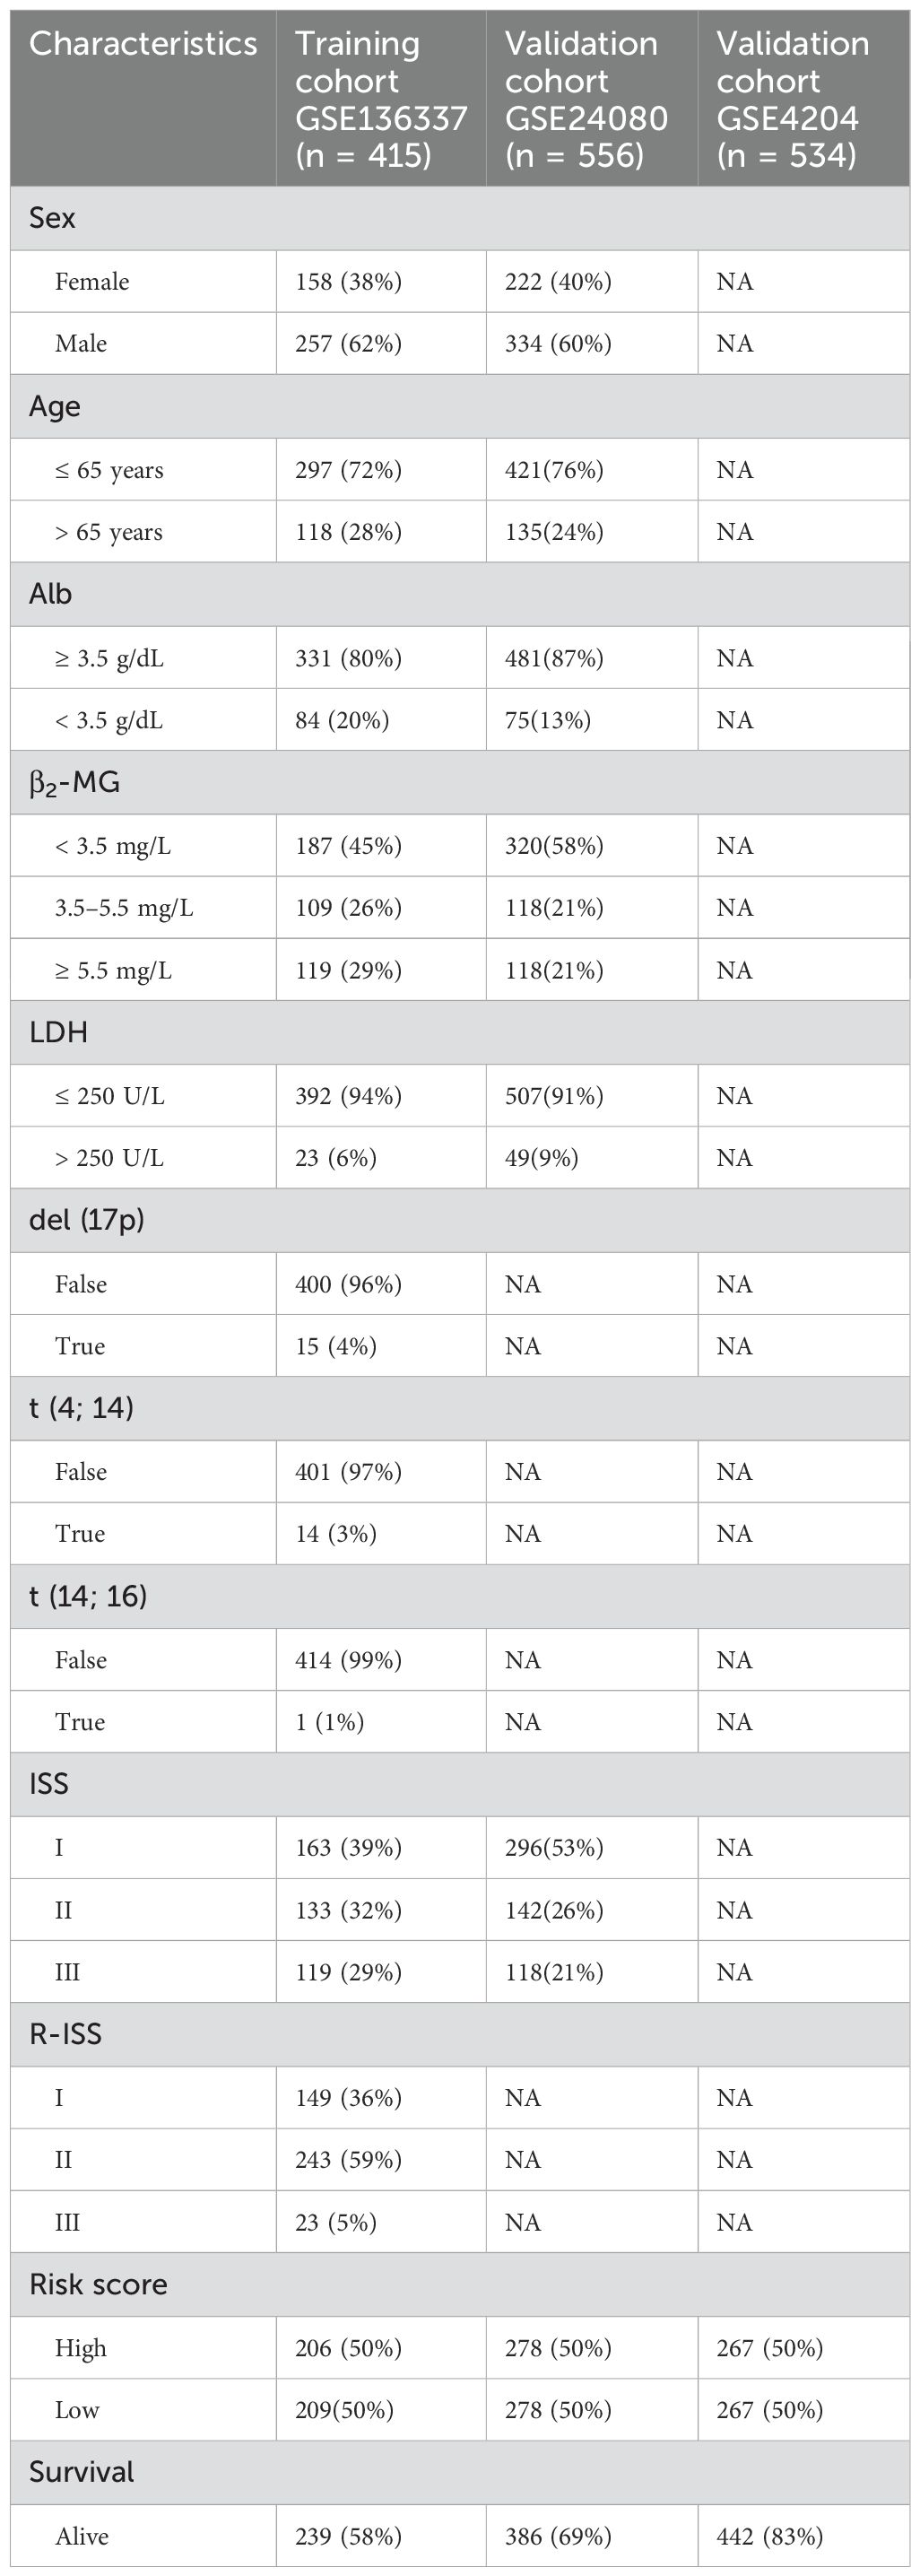
Table 1. Clinical covariates of the training and validation cohorts.
15 disulfidptosis-related genes (DRGs) include SLC7A11, SLC3A2, ABI2, BRK1, CYFIP1, NCKAP1, RPN1, RAC1, WASF2, GYS1, NDUFS1, NUBPL, NDUFA11, LRPPRC, and OXSM (19).
2.2 Gene interaction and the genetic variant landscape
Based on the Pearson correlation coefficients, we used the “circlize” R package to explore the genetic interactions among the DRGs. For proteomics, the STRING database (version 11.5) (20) provides a way to visualize the correlations between the proteins regulated by these genes. Due to limited data on myeloma in The Cancer Genome Atlas, we conducted a pan-cancer analysis of mutations in DRGs and risk genes using Gene Set Cancer Analysis (https://guolab.wchscu.cn/GSCA/#/) (21). The mutation status and loci in cancers were further obtained with the cBioPortal for Cancer Genomics (http://www.cbioportal.org/).
2.3 Identification and validation of disulfidptosis-related isoforms
Unsupervised clustering of MM samples is performed using the nonnegative matrix factorization (NMF) clustering algorithm (22). The “lee” function is selected and 500 iterations are performed. The number of clusters k was set from 2 to 6. We choose the optimal rank based on the inflection point at which cophenetic values begin to drop significantly (23–26). The discrimination between the isoforms (C1, C2, and C3) was further validated using principal component analysis (PCA). Since C1 contained a small number of individuals (n = 12), Kaplan-Meier curves were generated to assess the variations in survival between C2 and C3.
2.4 Comprehensive analyses of subtypes
To evaluate the variations in medication sensitivity among the clusters, the “pRRophetic” package was utilized. With the “limma” package, differentially expressed genes (DEGs) between C2 and C3 were screened as candidate genes for subsequent prognostic models. To further screen out key DEGs with significant biological significance for constructing prognostic models, we set the threshold criteria as FC > 1.5 and adjusted P < 0.05. Then we explored the biological mechanisms underlying the disulfidptosis-related isoforms via the Kyoto Encyclopedia of Genes and Genomes (KEGG) analysis and Gene Ontology (GO) analysis (P < 0.05, FDR-q < 0.25).
2.5 Construction and evaluation of the prognostic model
Prognosis-associated DEGs were further identified by Cox regression analysis to serve as candidate genes for prognostic model construction (P < 0.05). Then, we used the “glmnet” package (27) and conducted 10-fold cross-validation to construct a lasso Cox regression prognostic model based on lambda. min. Lambda.min directly corresponds to the minimum of the cross-validation error under preserving more features, and it is chosen to provide more accurate prediction results and help identify potential biomarkers. Depending on the median score, the individuals were classified into low- and high-risk subgroups. To evaluate the prognostic prediction effectiveness, the area under the curve (AUC) was computed using the “timeROC” package.
2.6 Exploration of biological functions and drug targets based on the model
In the differential analysis among the risk groups, we set lower thresholds (FC > 1.2, adjusted P < 0.05) for comprehensive exploration of gene expression changes, and performed KEGG and Gene Set Enrichment Analysis (GSEA v4.2.2 software, P < 0.05 and FDR-q < 0.25) to explore potential biological functions.
We subsequently explored the genes targeted by MM drugs among DEGs between risk subgroups through the DrugBank database (https://go.drugbank.com/) (28). Furthermore, to identify more effective treatments targeting the high-risk group, we employed human cancer cell line gene expression data from the Cancer Cell Line Encyclopedia (https://depmap.org/portal/) as a training set and calculated dose-response AUC to quantify the drug sensitivity of the high-risk subgroup by using the “pRRophetic” package. The AUC was negatively associated with drug responsibility. The Cancer Therapeutics Response Portal (CTRP) (https://portals.broadinstitute.org/ctrp.v2.1/) (29) and PRISM Repurposing (https://depmap.org/portal/prism/) (30) are sources of drug sensitivity data. Next, we conducted differential drug response analysis between the highest and lowest risk score deciles (log2FC > 0.1). Then compounds that showed a negative correlation with the risk score were examined (Spearman’s r < -0.2) (31).
2.7 Analysis of miRNA and transcription factors
Based on miRWalk database (current version: January 2022) (http://129.206.7.150/), we searched in the “Disease” column (DOID: 9538#multiple myeloma) and finally obtained miRNAs related to MM. Then we intersected them with DEGs among clusters and risk subgroups. In addition, we inputted DRGs and prognostic genes into the Cistrome DB database (http://dbtoolkit.cistrome.org/) (Default parameters) and obtained transcription factors (TFs) that regulate these genes. The miRNA and TF regulatory networks were finally visualized by Cytoscape (v3.9.1).
2.8 Characterization of the immunophenotype and immunotherapy responsiveness among subgroups
The number of immune cells in the tumor microenvironment across subtypes was determined using the single-sample gene set enrichment analysis (ssGSEA) and the xCell (32). Tumor immune dysfunction and exclusion (TIDE) was performed to analyze the function and infiltration level of T cells (33). Both TIDE (33) and immunophenotype score (IPS) (34) can assess the sensitivity of immune checkpoint blockade (ICB). IPS addresses the immunological phenotype of the cells from four perspectives (“antigen-presenting (AP), effector cells (EC), suppressor cells (SC), and checkpoints (CP)”). The indicator balance resulted in the generation of a total score (z-score, AZ). Greater z-scores and lower TIDE were associated with increased immunotherapy responsiveness (33, 34). Moreover, we conducted a correlation analysis between prognostic genes and immune-related genes, pathways, and functions (35). To assess the self-renewal ability of the samples, the mRNA expression-based stemness index (mRNAsi) was calculated according to transcriptomic and epigenetic characteristics (36).
2.9 Establishing a predictive nomogram
Through univariate and multivariate Cox regression, we screened for independent prognostic factors to be included in the construction of a nomogram. The construction of the nomogram is achieved through the “rms” package. For the internal validation, a calibration curve was developed. Time-ROC curves for 1-, 3- and 5-year survival compared between the nomogram and other factors (37).
2.10 Cell lines and cell culture
Cells for RPMI8226, MM1.R, U266, NCI-H929, and LP-1 were purchased from Fenghui Biotechnology Co., Ltd (Hunan, China). The cells were grown in RPMI-1640 media (Gibco, Shanghai, China) containing 10% fetal bovine serum, 0.1 mg/ml streptomycin, and 100 U/ml penicillin G. The medium was then incubated with the cells at 37°C and 5% CO2 in a humid environment.
2.11 Patients
50 MM patients from the First Affiliated Hospital of Wenzhou Medical University were included in the study. Additionally, BM from 24 healthy donors served as a control group for cell lines and patient samples. The clinical characteristics of the patients are shown in Table 2. All samples were taken with the subjects’ informed consent. This research was approved by the Ethics Committee in Clinical Research of the First Affiliated Hospital of Wenzhou Medical University and followed the Declaration of Helsinki.
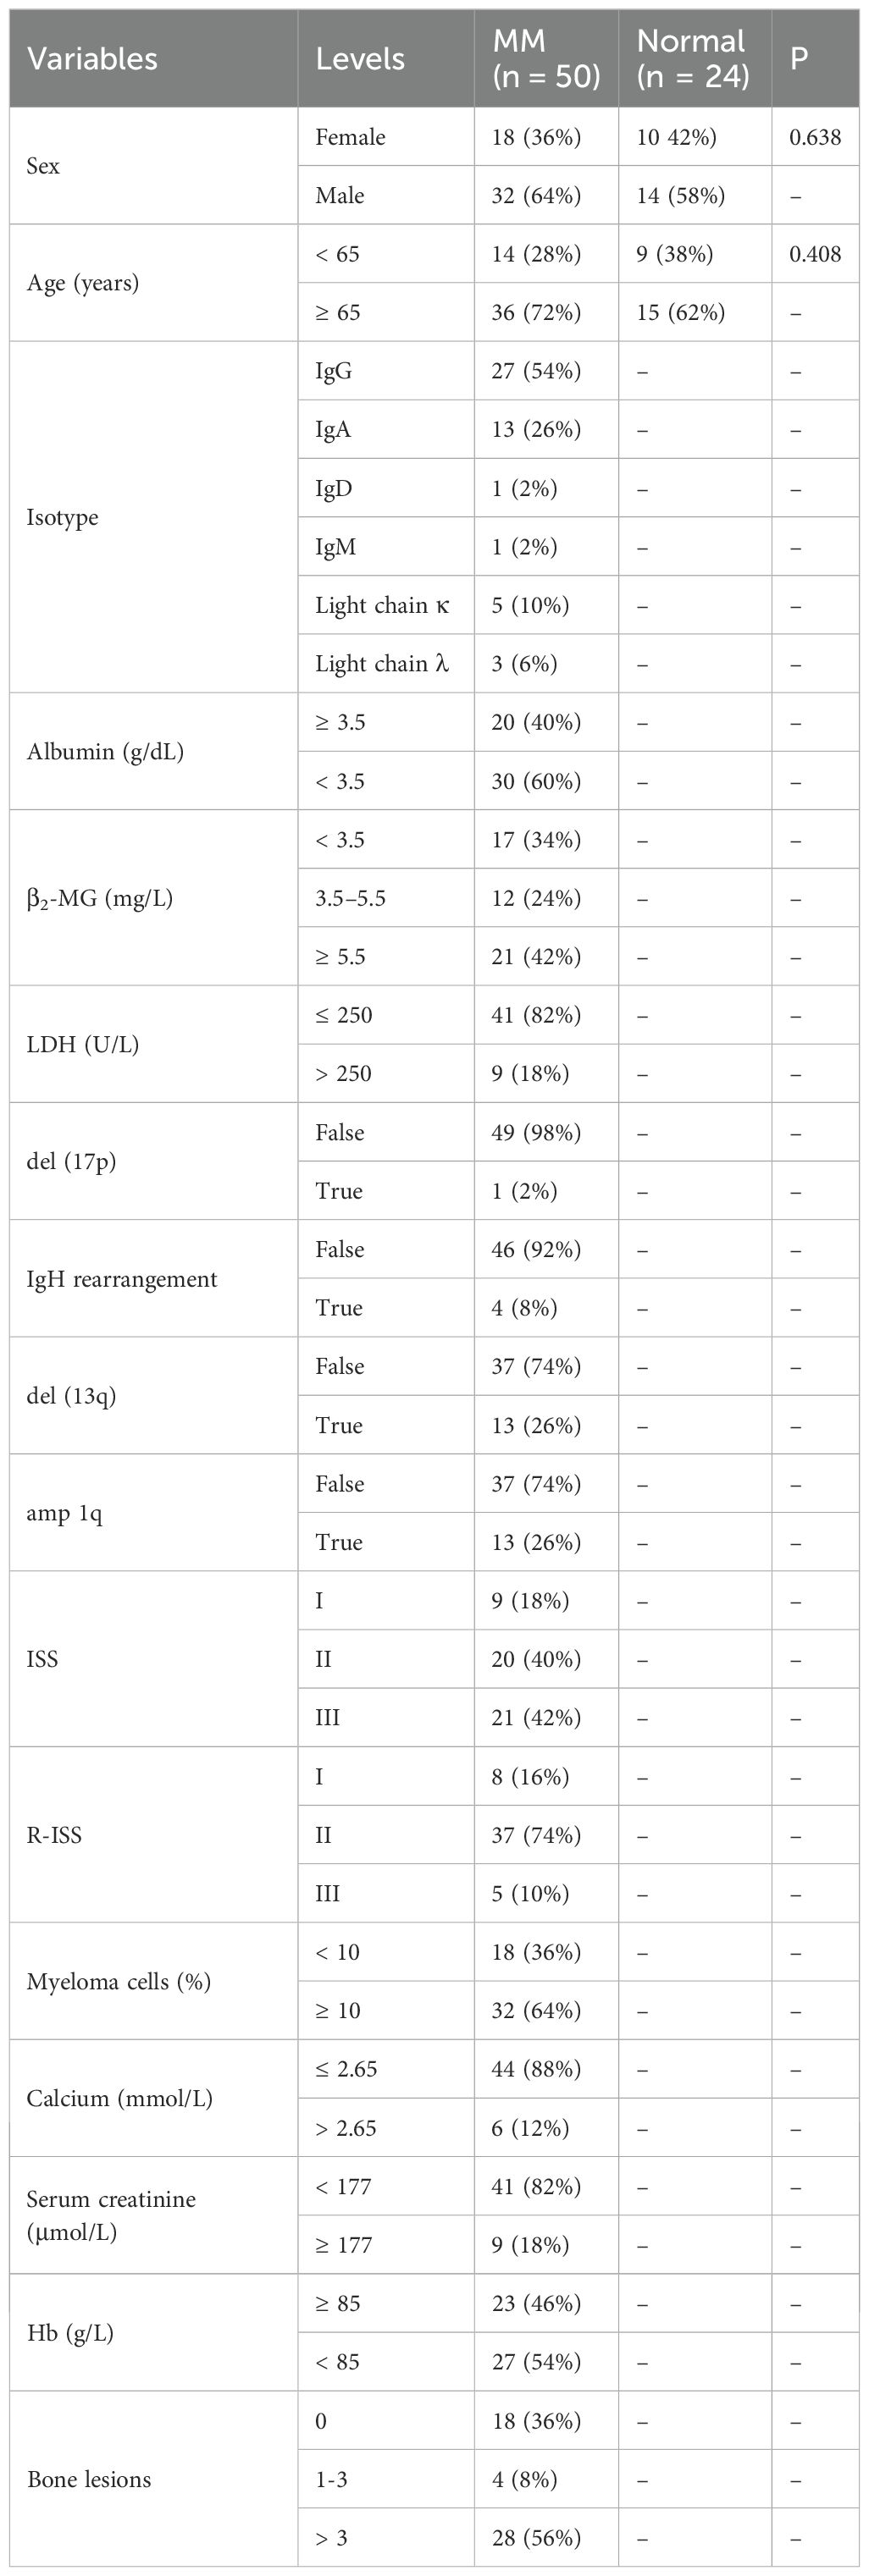
Table 2. The clinical features of the subjects included in this experiment.
2.12 RNA extraction, reverse transcription, and quantitative real-time PCR
RNA was extracted from bone marrow samples by Righton DNA&RNA Blood and Tissue Kit (Righton Bio, Shanghai, China), followed by reverse transcription with the cDNA Synthesis Kit (Vazyme, Nanjing, China). Finally, quantitative PCR was performed using Taq Pro Universal SYBR qPCR Master Mix (Vazyme, Nanjing, China). Internal controls were implemented using β-ACTIN. The comparative threshold cycle (Ct) approach was used to determine relative expression (38). The primer sequences used are as follows:
CR2 forward primer: 5′‐AAAGGGCTGGAACCAAGGAA‐3′;
CR2 reverse primer: 5′‐GACAGGAGCAAGTGAACGGGA‐3′;
DIRAS3 forward primer: 5′‐CTGCCGACCATTGAAAATACCT‐3′;
DIRAS3 reverse primer: 5′‐GACTGAGTAGACCAGGACGAAGG‐3′;
FOSB forward primer: 5′‐GAGACAGATCAGTTGGAGGAAGAA‐3′;
FOSB reverse primer: 5′‐CACAAACTCCAGACGTTCCTTC‐3′;
GJB2 forward primer: 5′‐GAGTGAATTTAAGGACATCGAGGAG‐3′;
GJB2 reverse primer: 5′‐TGCATGGAGAAGCCGTCGTA-3′;
HK2 forward primer: 5′‐TTGGAGCCACCACTCACCCTA‐3′;
HK2 reverse primer: 5′‐GAGCCCATTGTCCGTTACTTTC-3′;
KIF21B forward primer: 5′‐GTCAAGGTGGCCGTCAGGAT‐3′;
KIF21B reverse primer: 5′‐TTCTTGCCAGGTGTCCAGGTC-3′;
LY6E forward primer: 5′‐AATCTGTACTGCCTGAAGCCGA‐3′;
LY6E reverse primer: 5′‐CCAAATGTCACGAGATTCCCA-3′;
PLTP forward primer: 5′‐GCTGGCTCTGATCCCATTACAG‐3′;
PLTP reverse primer: 5′‐AATCCCGCATGGTTCGTCA-3′;
SHROOM3 forward primer: 5′‐CTCACGGACATCAAGCTCAACAA‐3′;
SHROOM3 reverse primer: 5′‐CCTTTCTTCATTACTGGCATCTTCA-3′;
TEAD1 forward primer: 5′‐CCAACCATTCTTACAGTGACCCAT‐3′;
TEAD1 reverse primer: 5′‐TCAAACCTTGCATACTCCGTCTC-3′;
β-ACTIN forward primer: 5′‐TCAAGATCATTGCTCCTCCTGAG‐3′;
β-ACTIN reverse primer: 5′‐ACATCTGCTGGAAGGTGGACA‐3′.
2.13 Statistical analyses
R 4.1.1, SPSS 24.0, and GraphPad Prism 9.0.0 were employed in statistical analyses. For comparison of differences, Student’s t-test and ANOVA were used for normal data, while the Wilcoxon test corresponded to skewed data. Multiple comparisons use FDR to correct P-values. As for correlation analysis, Pearson correlation was applied to the bivariate normal distribution, otherwise Spearman rank analysis was used. Survival analysis was performed using the Kaplan-Meier method and the log-rank test was used to compare survival probabilities.
3 Results
3.1 Gene interaction and the genetic variant landscape
The study design is presented in Figure 1. These genes were closely related to each other (Figures 2A, B). In addition, these genes exhibited widespread mutations in cancer. CYFIP1 had the highest mutation rate (19%), followed by LRPPRC (18%) and NCKAP1 (17%) (Figure 2C). Moreover, missense mutations were the most common type of mutation (Figure 2C). The cBioPortal analysis further validated the extensive mutation status of CYFIP1 in multiple cancers (Figure 2D). Figure 2E demonstrated the mutation site of CYFIP1.
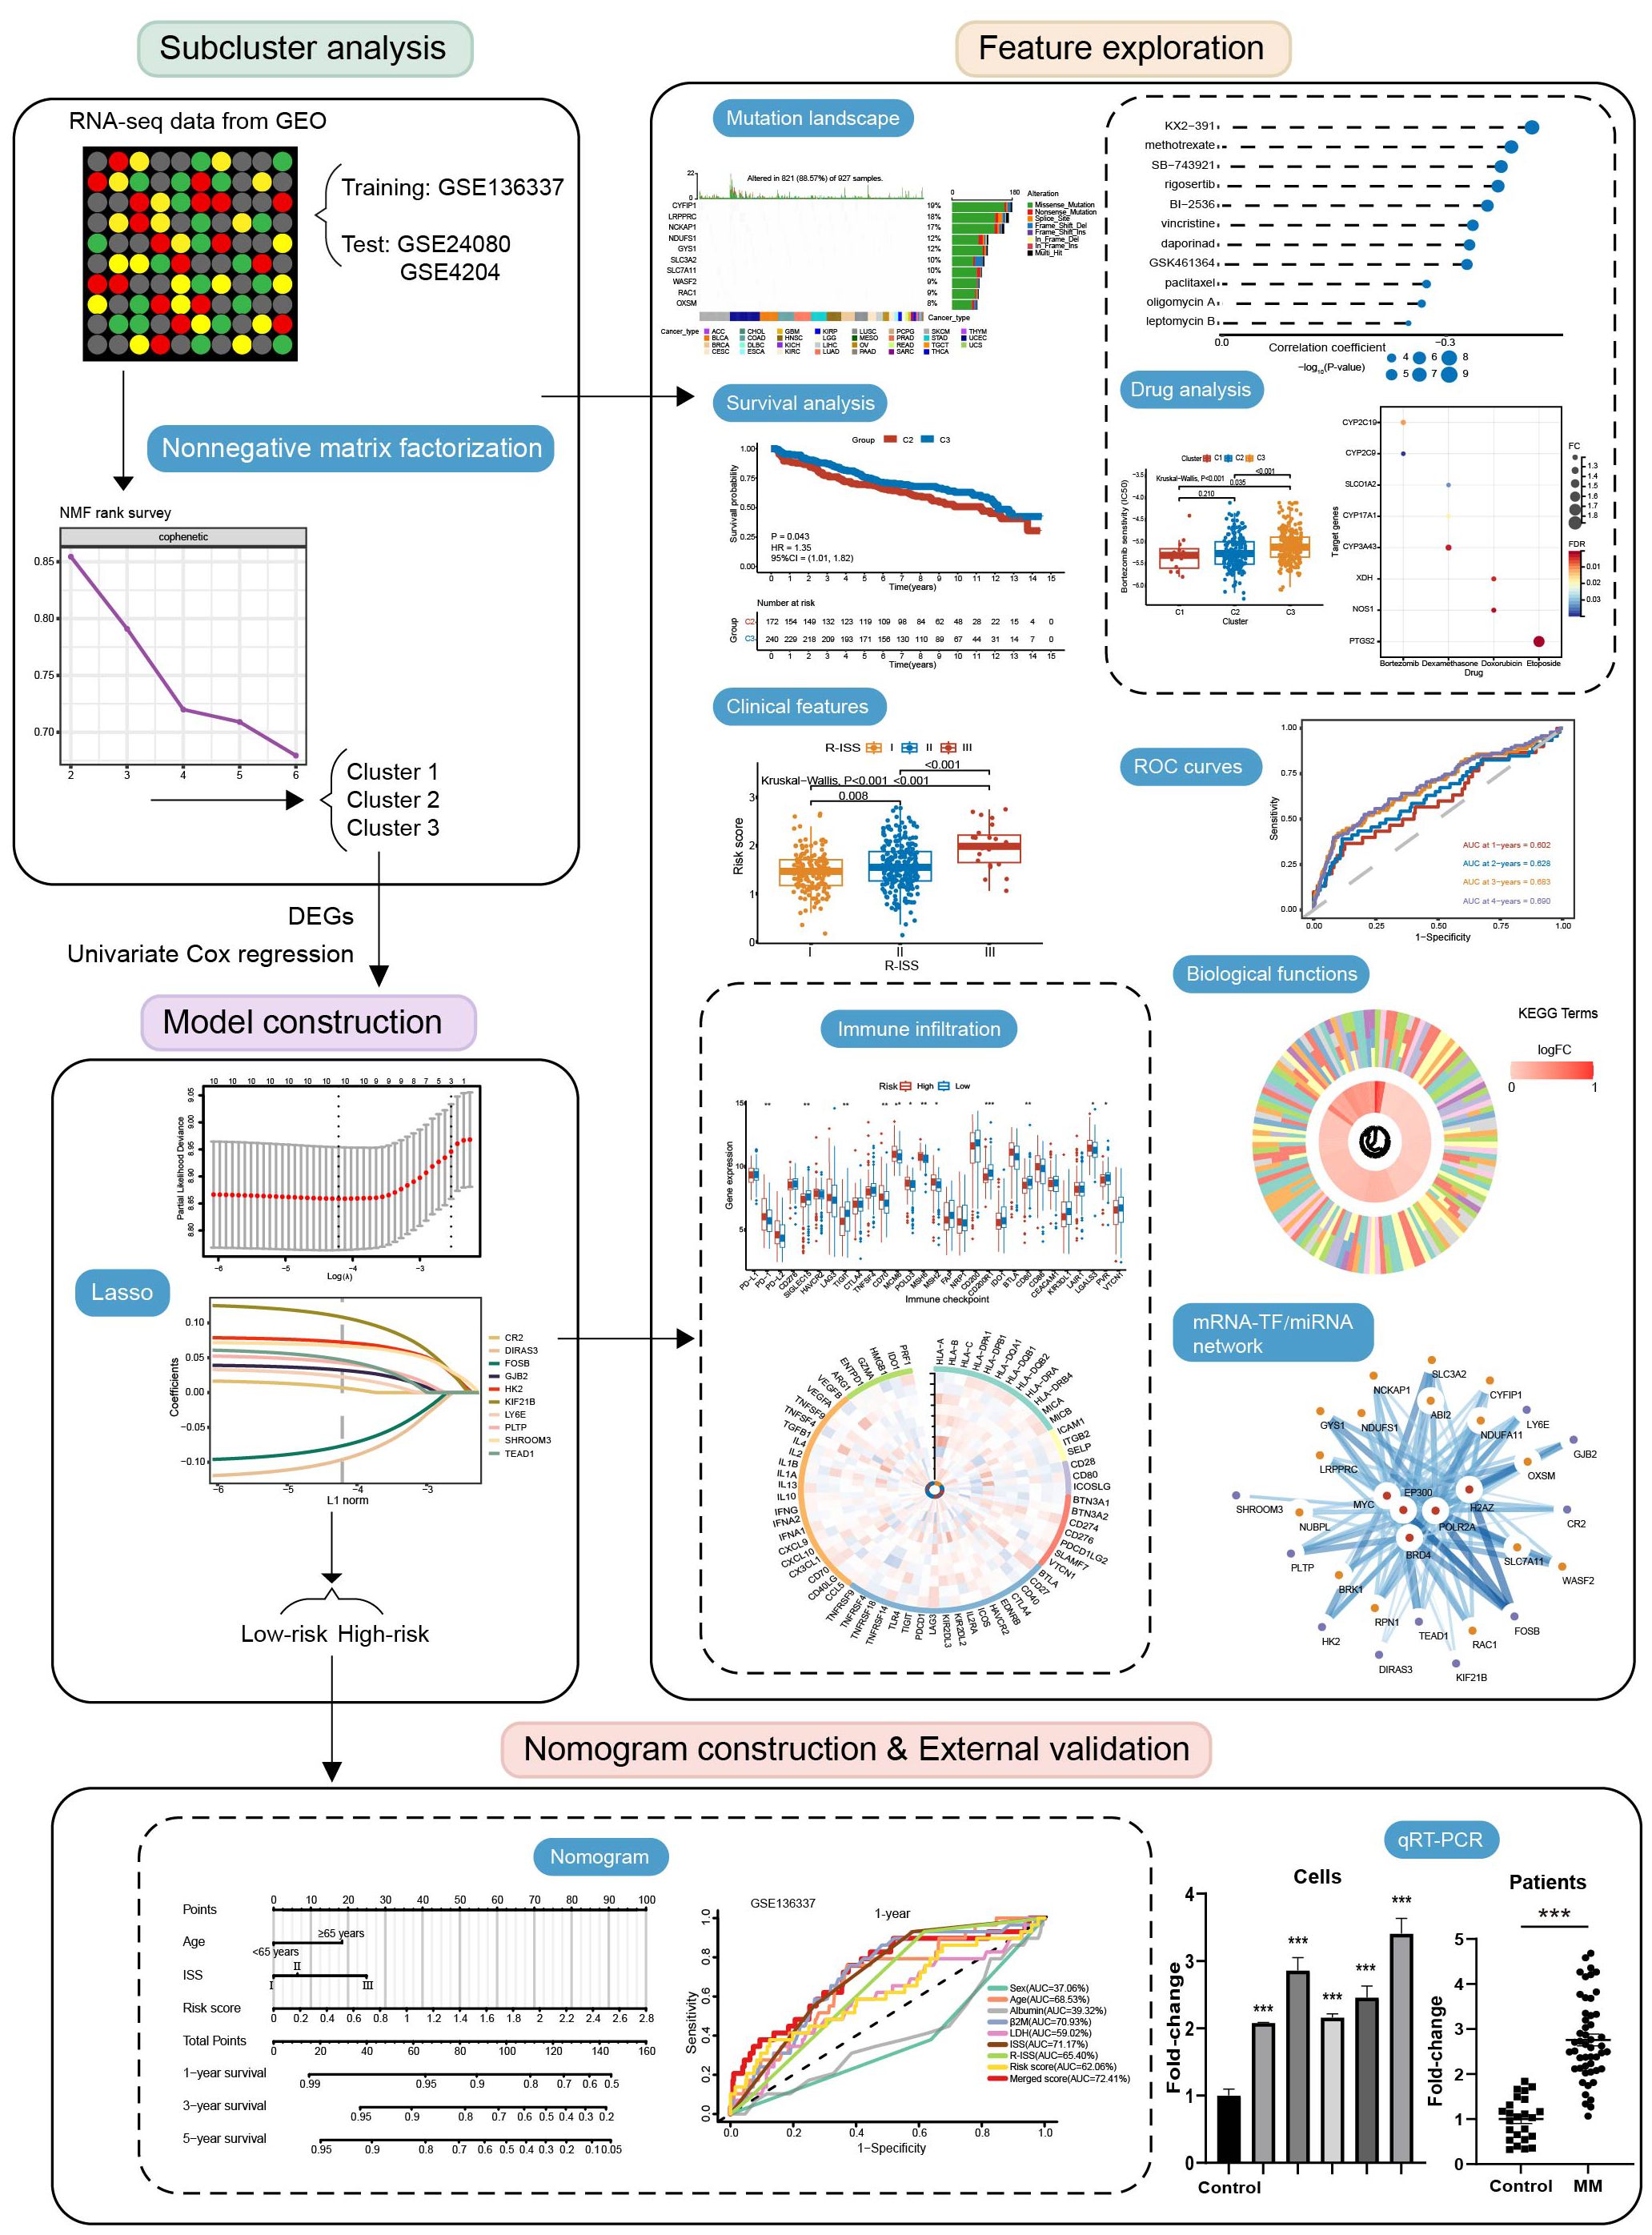
Figure 1. Flow chart of the study.
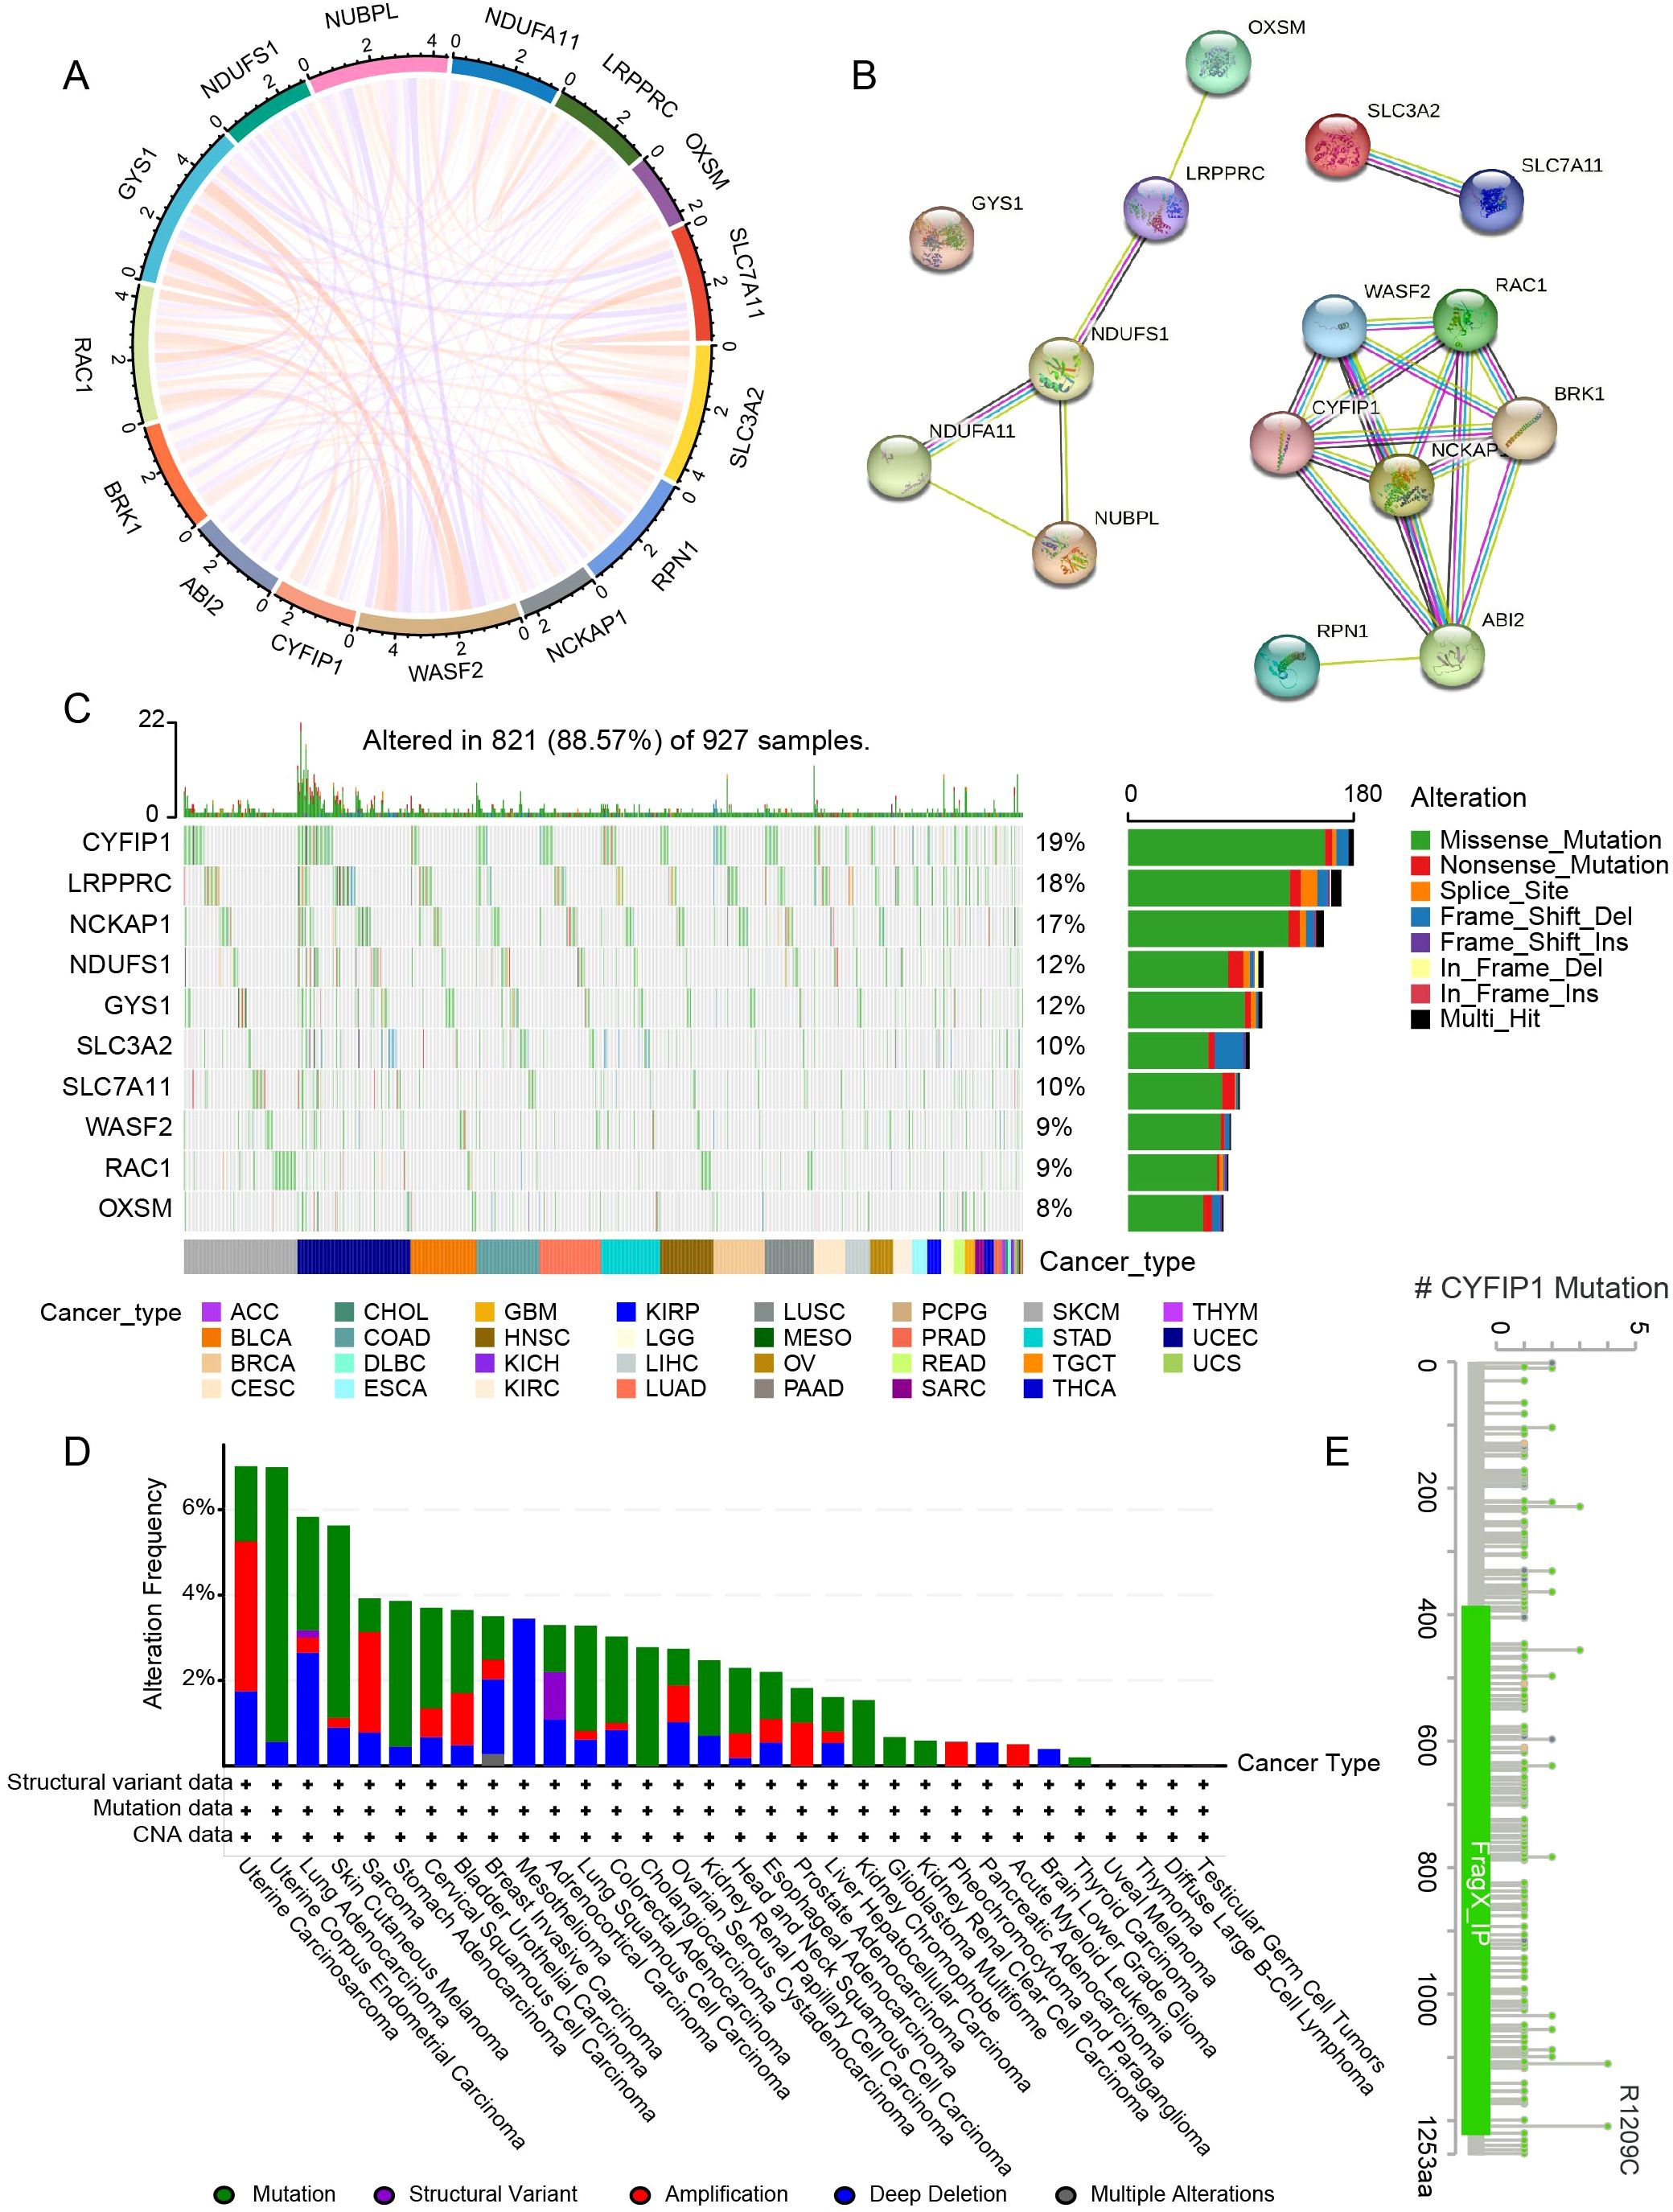
Figure 2. Gene interactions and the genetic variant landscape of DRGs. (A) The correlation network of DRGs. (B) The protein-protein interaction network of DRGs. (C) Pan-cancer analysis of the mutation landscape of DRGs. (D) The mutation status of CYFIP1 in cancers from the cBioPortal. (E) Major mutation sites of CYFIP1.
3.2 Identification and validation of disulfidptosis-related isoforms
The training set was clustered using the NMF algorithm. The decrease of cophenetic value is obviously slowed down after rank=3 (Figure 3A). And there is a clear block structure in the consensus matrix at rank=3 (Figure 3A), indicating a high stability of the clustering results. The accuracy and stability of this clustering analysis was further demonstrated by PCA (Figure 3B). We selected the top three suppressor hits, SLC7A11, SLC3A2 and RPN1, from the CRISPR-Cas9 screening in Liu et al.’s study (10). Differential analysis revealed that the expression levels of these three genes in C1 were higher than those in C2 and C3 (P < 0.01) (Figure 3C). And the expression of SLC3A2 in C2 was higher than that in C3 (P < 0.001) (Figure 3C). This suggests that they are more susceptible to disulfidptosis. Furthermore, Kaplan-Meier curve revealed that C2 had worse survival than C3 (P = 0.043) (Figure 3D). Similar results were replicated in the GSE4204 validation set (P = 0.002) (Figures 3E, F).
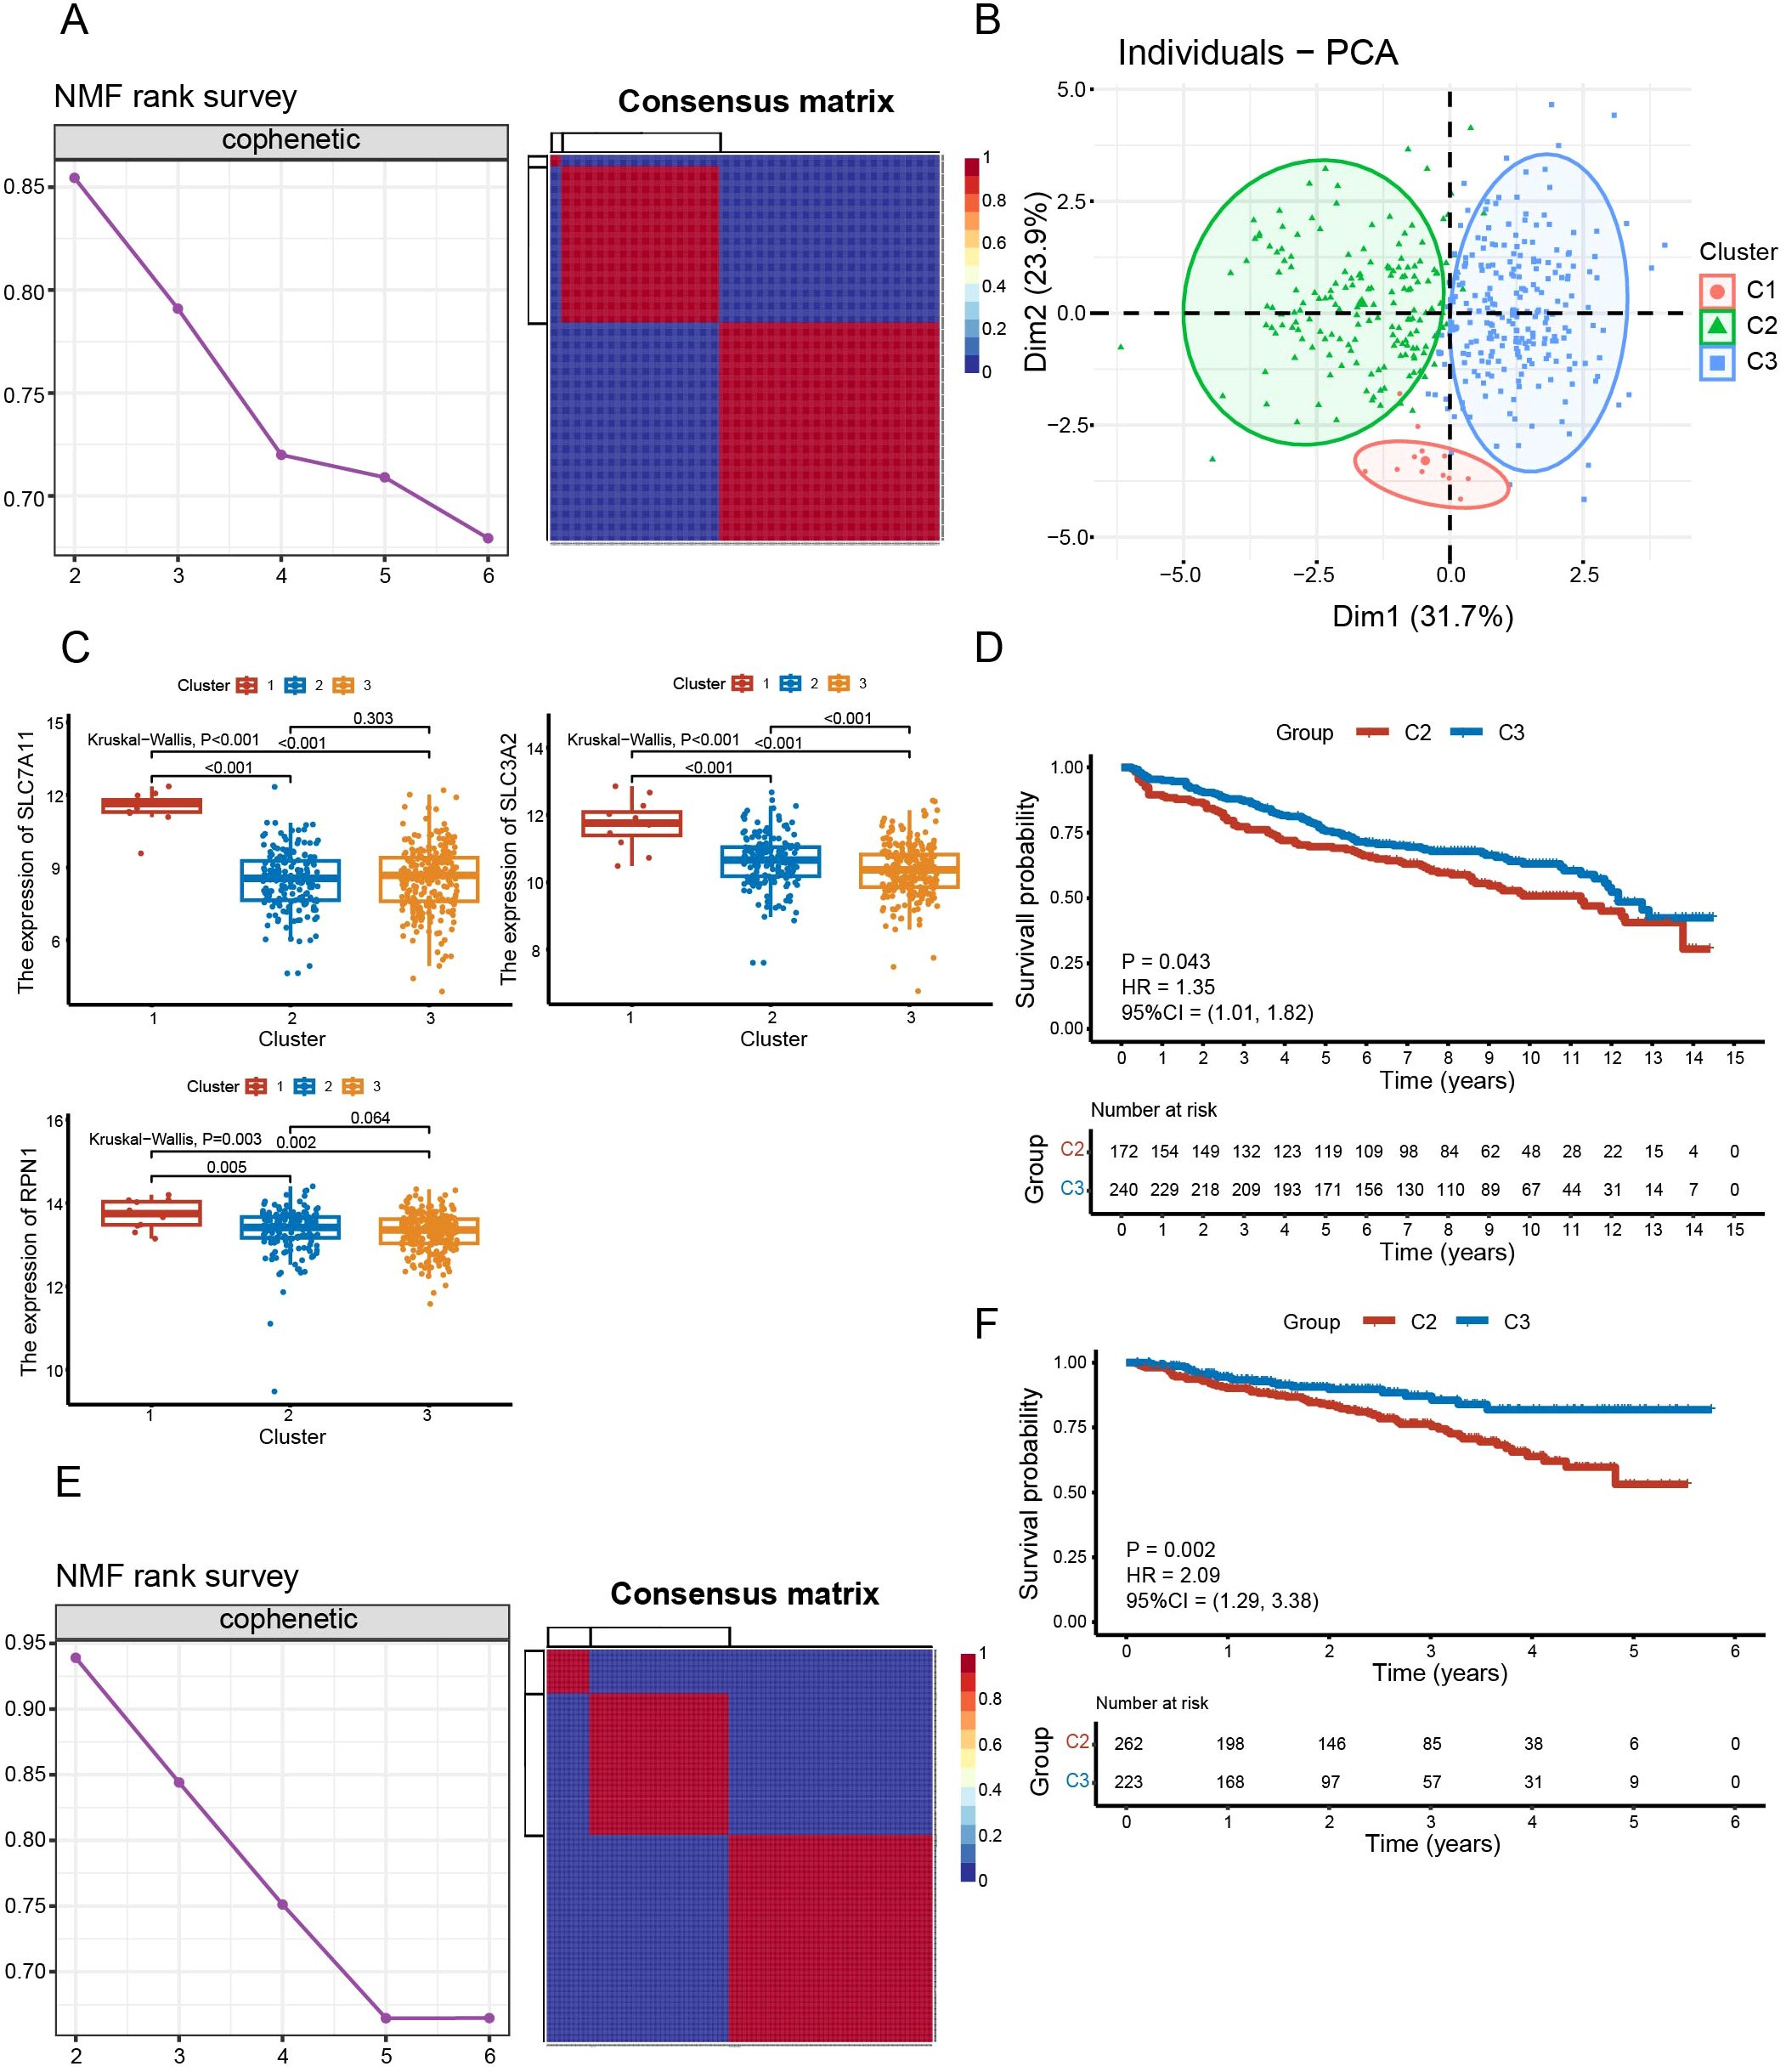
Figure 3. Identification and validation of disulfidptosis-related isoforms. (A) The cophenetic curve of NMF clustering at ranks = 2 to 6 and the consensus matrix when rank = 3 in the training dataset. (B) Principal component analysis of three clusters. (C) Comparison of expression levels of SLC7A11, SLC3A2 and RPN1 between subgroups. (D) Survival analysis between C2 and C3 in the training set (P = 0.043). (E) The cophenetic curve of NMF clustering at rank = 2 to 6 and the consensus matrix when rank = 3 in validation dataset GSE4204. (F) Survival analysis between C2 and C3 in the validation set GSE4204 (P = 0.002).
3.3 Comprehensive analyses of subtypes
Additionally, we found heterogeneity in drug responsiveness between the two subtypes (Figure 4A). C1 and C2 were more sensitive to bortezomib than C3 (P < 0.05) (Figure 4A). While on doxorubicin and lenalidomide, C3 was more sensitive than C2 (P < 0.01) (Figure 4A).
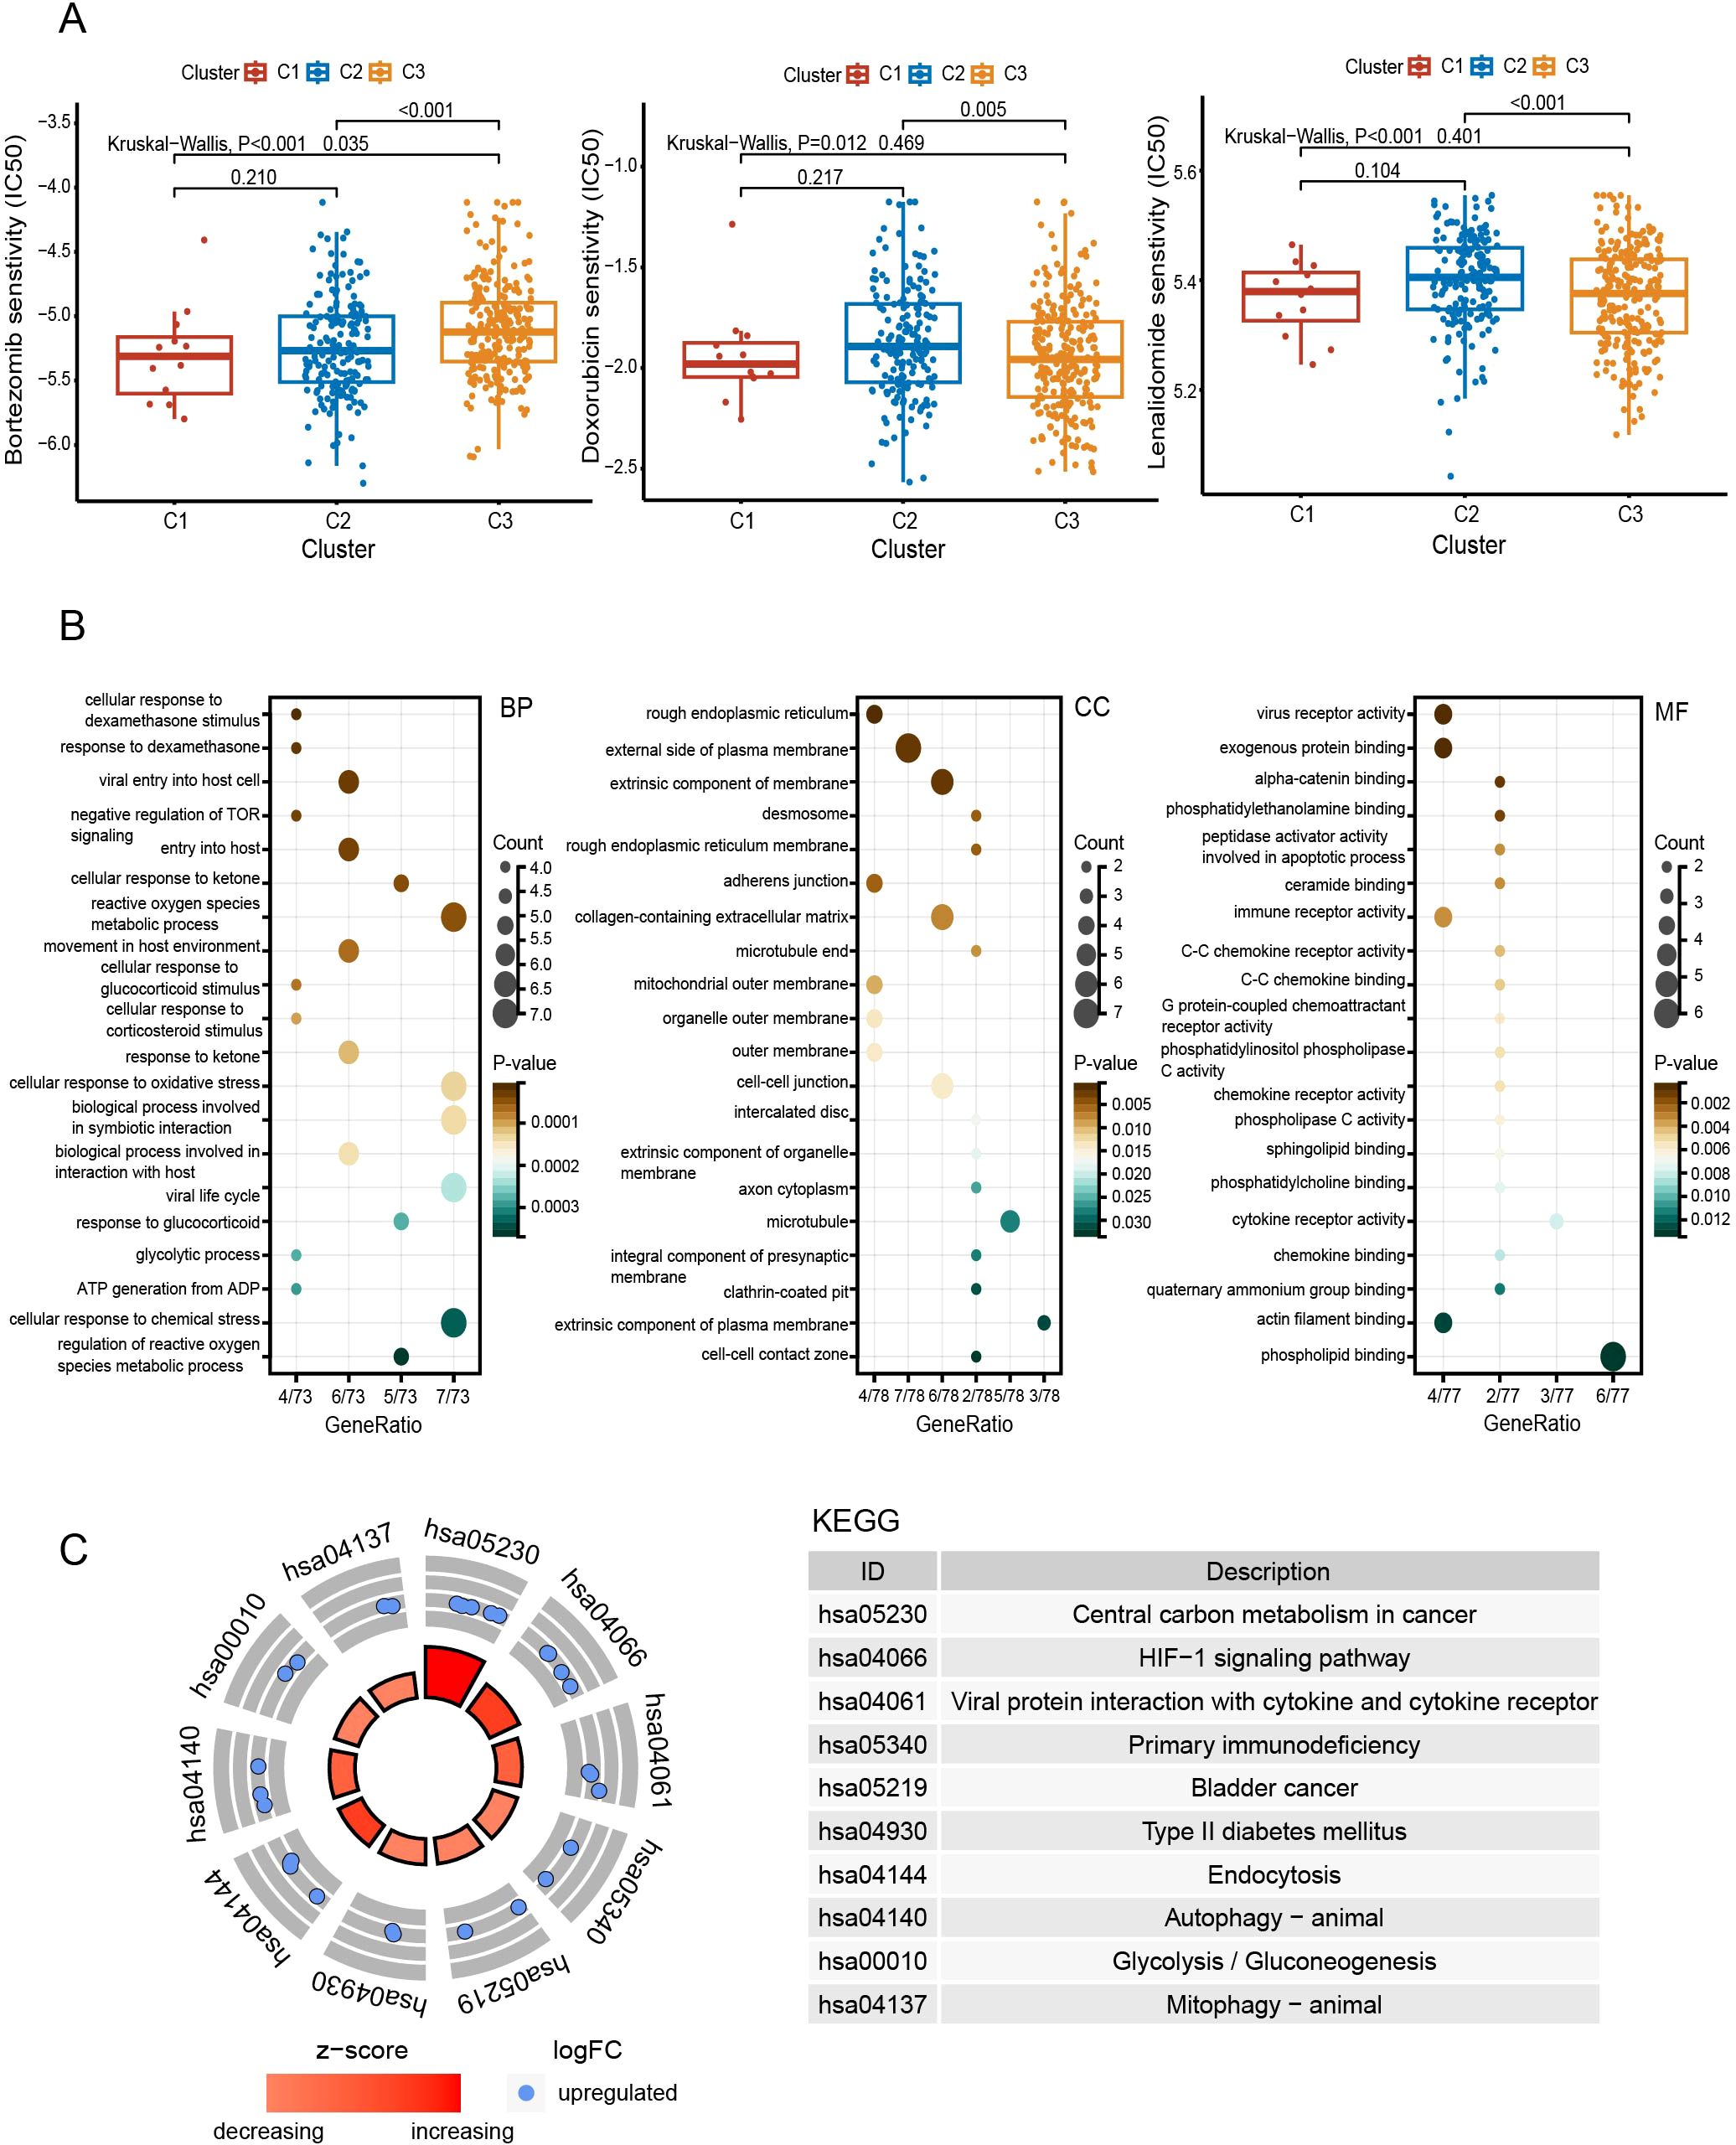
Figure 4. Comprehensive analyses of subtypes. (A) Comparison of drug sensitivity between subgroups. (B) Functional enrichment analysis with GO. (C) KEGG pathway enrichment analysis. BP, biological process; CC, cellular component; MF, molecular function.
Compared to C3, the pathways enriched in C2 include the HIF-1 signaling pathway, autophagy, glycolysis, actin filament binding, and cellular responses to dexamethasone and oxidative stress (Figures 4B, C).
C2 had higher levels of activated CD8+ T cells and central memory CD8+ T cells (P < 0.05), while C3 was enriched in effector memory CD4+ T cells and NK cells (P < 0.05) (Figure 5A). In the xCell algorithm, C1 showed the lowest immunity score, followed by C2 (P<0.05) (Figure 5B). However, the stroma score of C2 was higher than that of C3 (P<0.001). Further analysis of T cells revealed that the T-cell exclusion was highest in C1, followed by C2 (P < 0.01) (Figure 5C). Additionally, C2 was more prone to T-cell dysfunction (P < 0.05). The TIDE of C1 and C2 was higher than that of C3 (P < 0.05), indicating a greater possibility of immune escape and resistance to immunotherapy in C1 and C2.
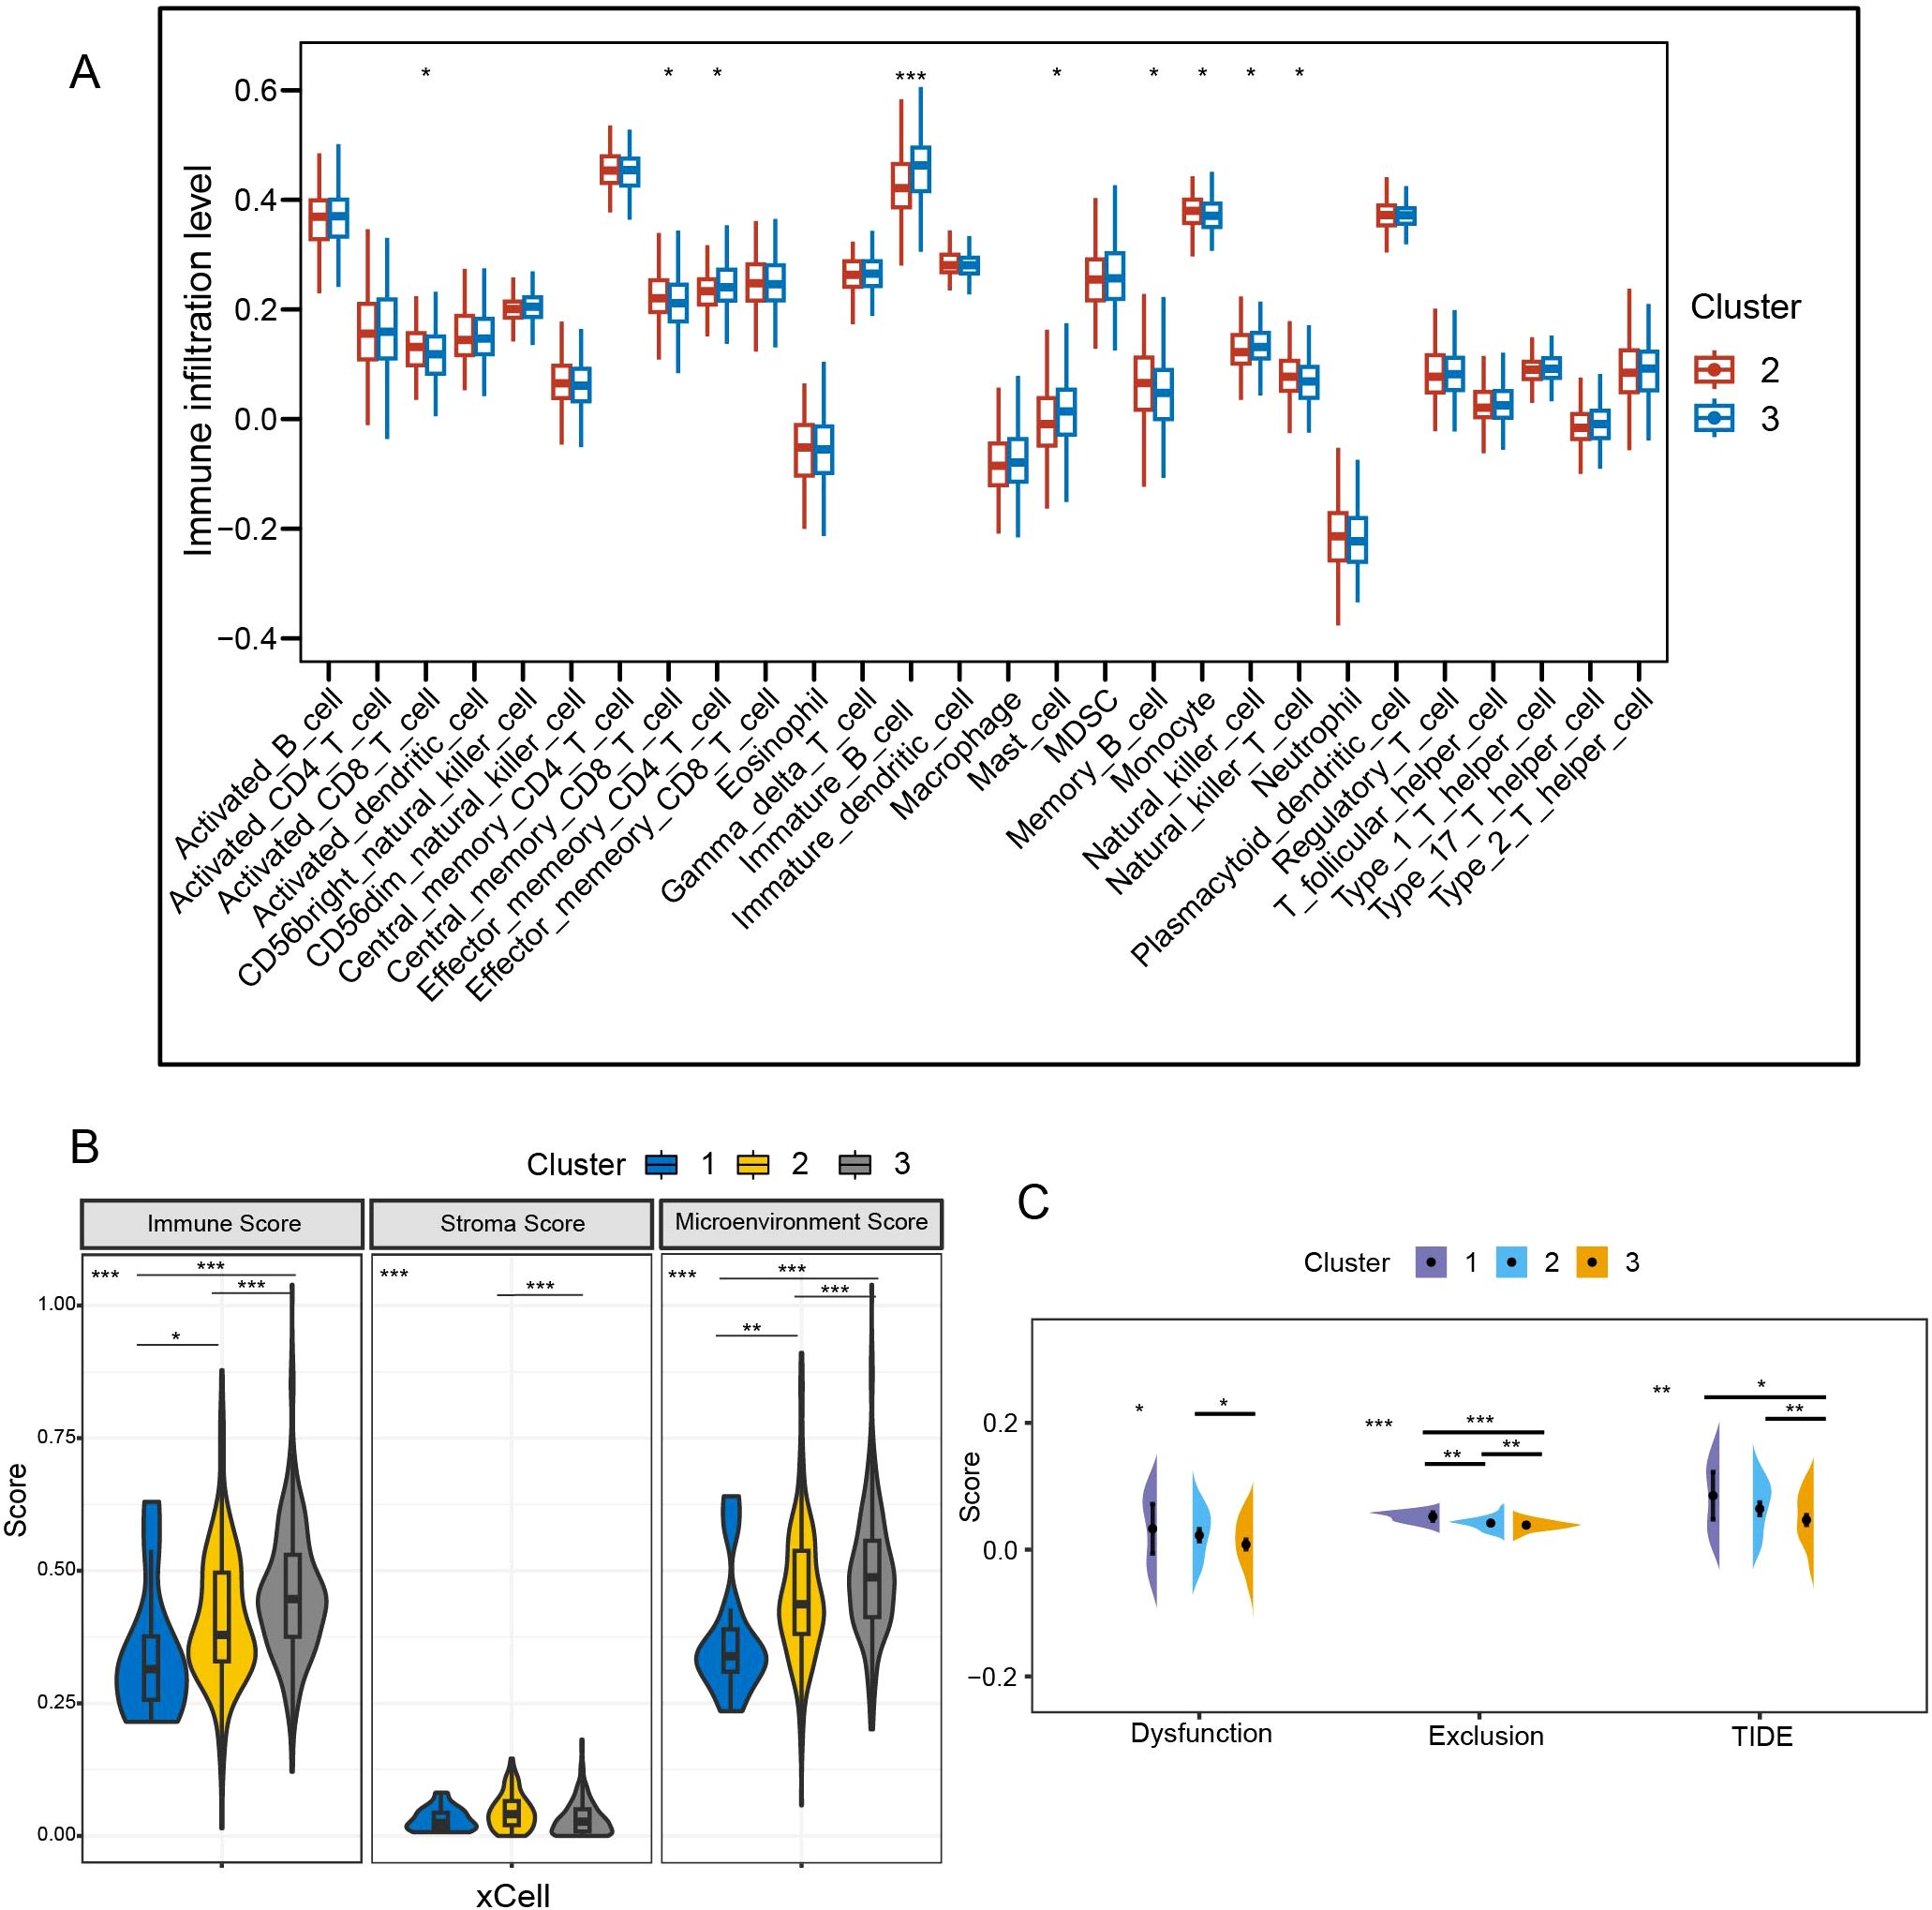
Figure 5. Comparative analysis of immune background between clusters. (A) Analysis of intersubtype immune cell infiltration with ssGSEA. (B) Immunological comparison between subtypes with xCell algorithm. (C) Assessment of T-cell dysfunction and exclusion. TIDE, tumor immune dysfunction and exclusion; *P < 0.05; **P < 0.01; ***P < 0.001.
3.4 Construction and evaluation of the prognostic model
We further included 90 DEGs in Cox regression analysis (P<0.05) and ultimately obtained 10 candidate genes. Using the lasso algorithm, a prognostic model related to disulfidptosis was constructed as follows (λ = 0.015) (Figure 6A): risk score = (0.0068 × CR2) + (0.0670 × SHROOM3) + (0.0226 × LY6E) + (0.0468 × TEAD1) + (0.0322 × GJB2) + (0.0724 × HK2) + (0.1084 × KIF21B) + (0.0425 × PLTP) - (0.0961 × DIRAS3) - (0.0763 × FOSB). The sample was separated into high- and low-risk categories according to median scores. The risk score, age, and ISS proved to be independent prognostic factors (Figure 6B).
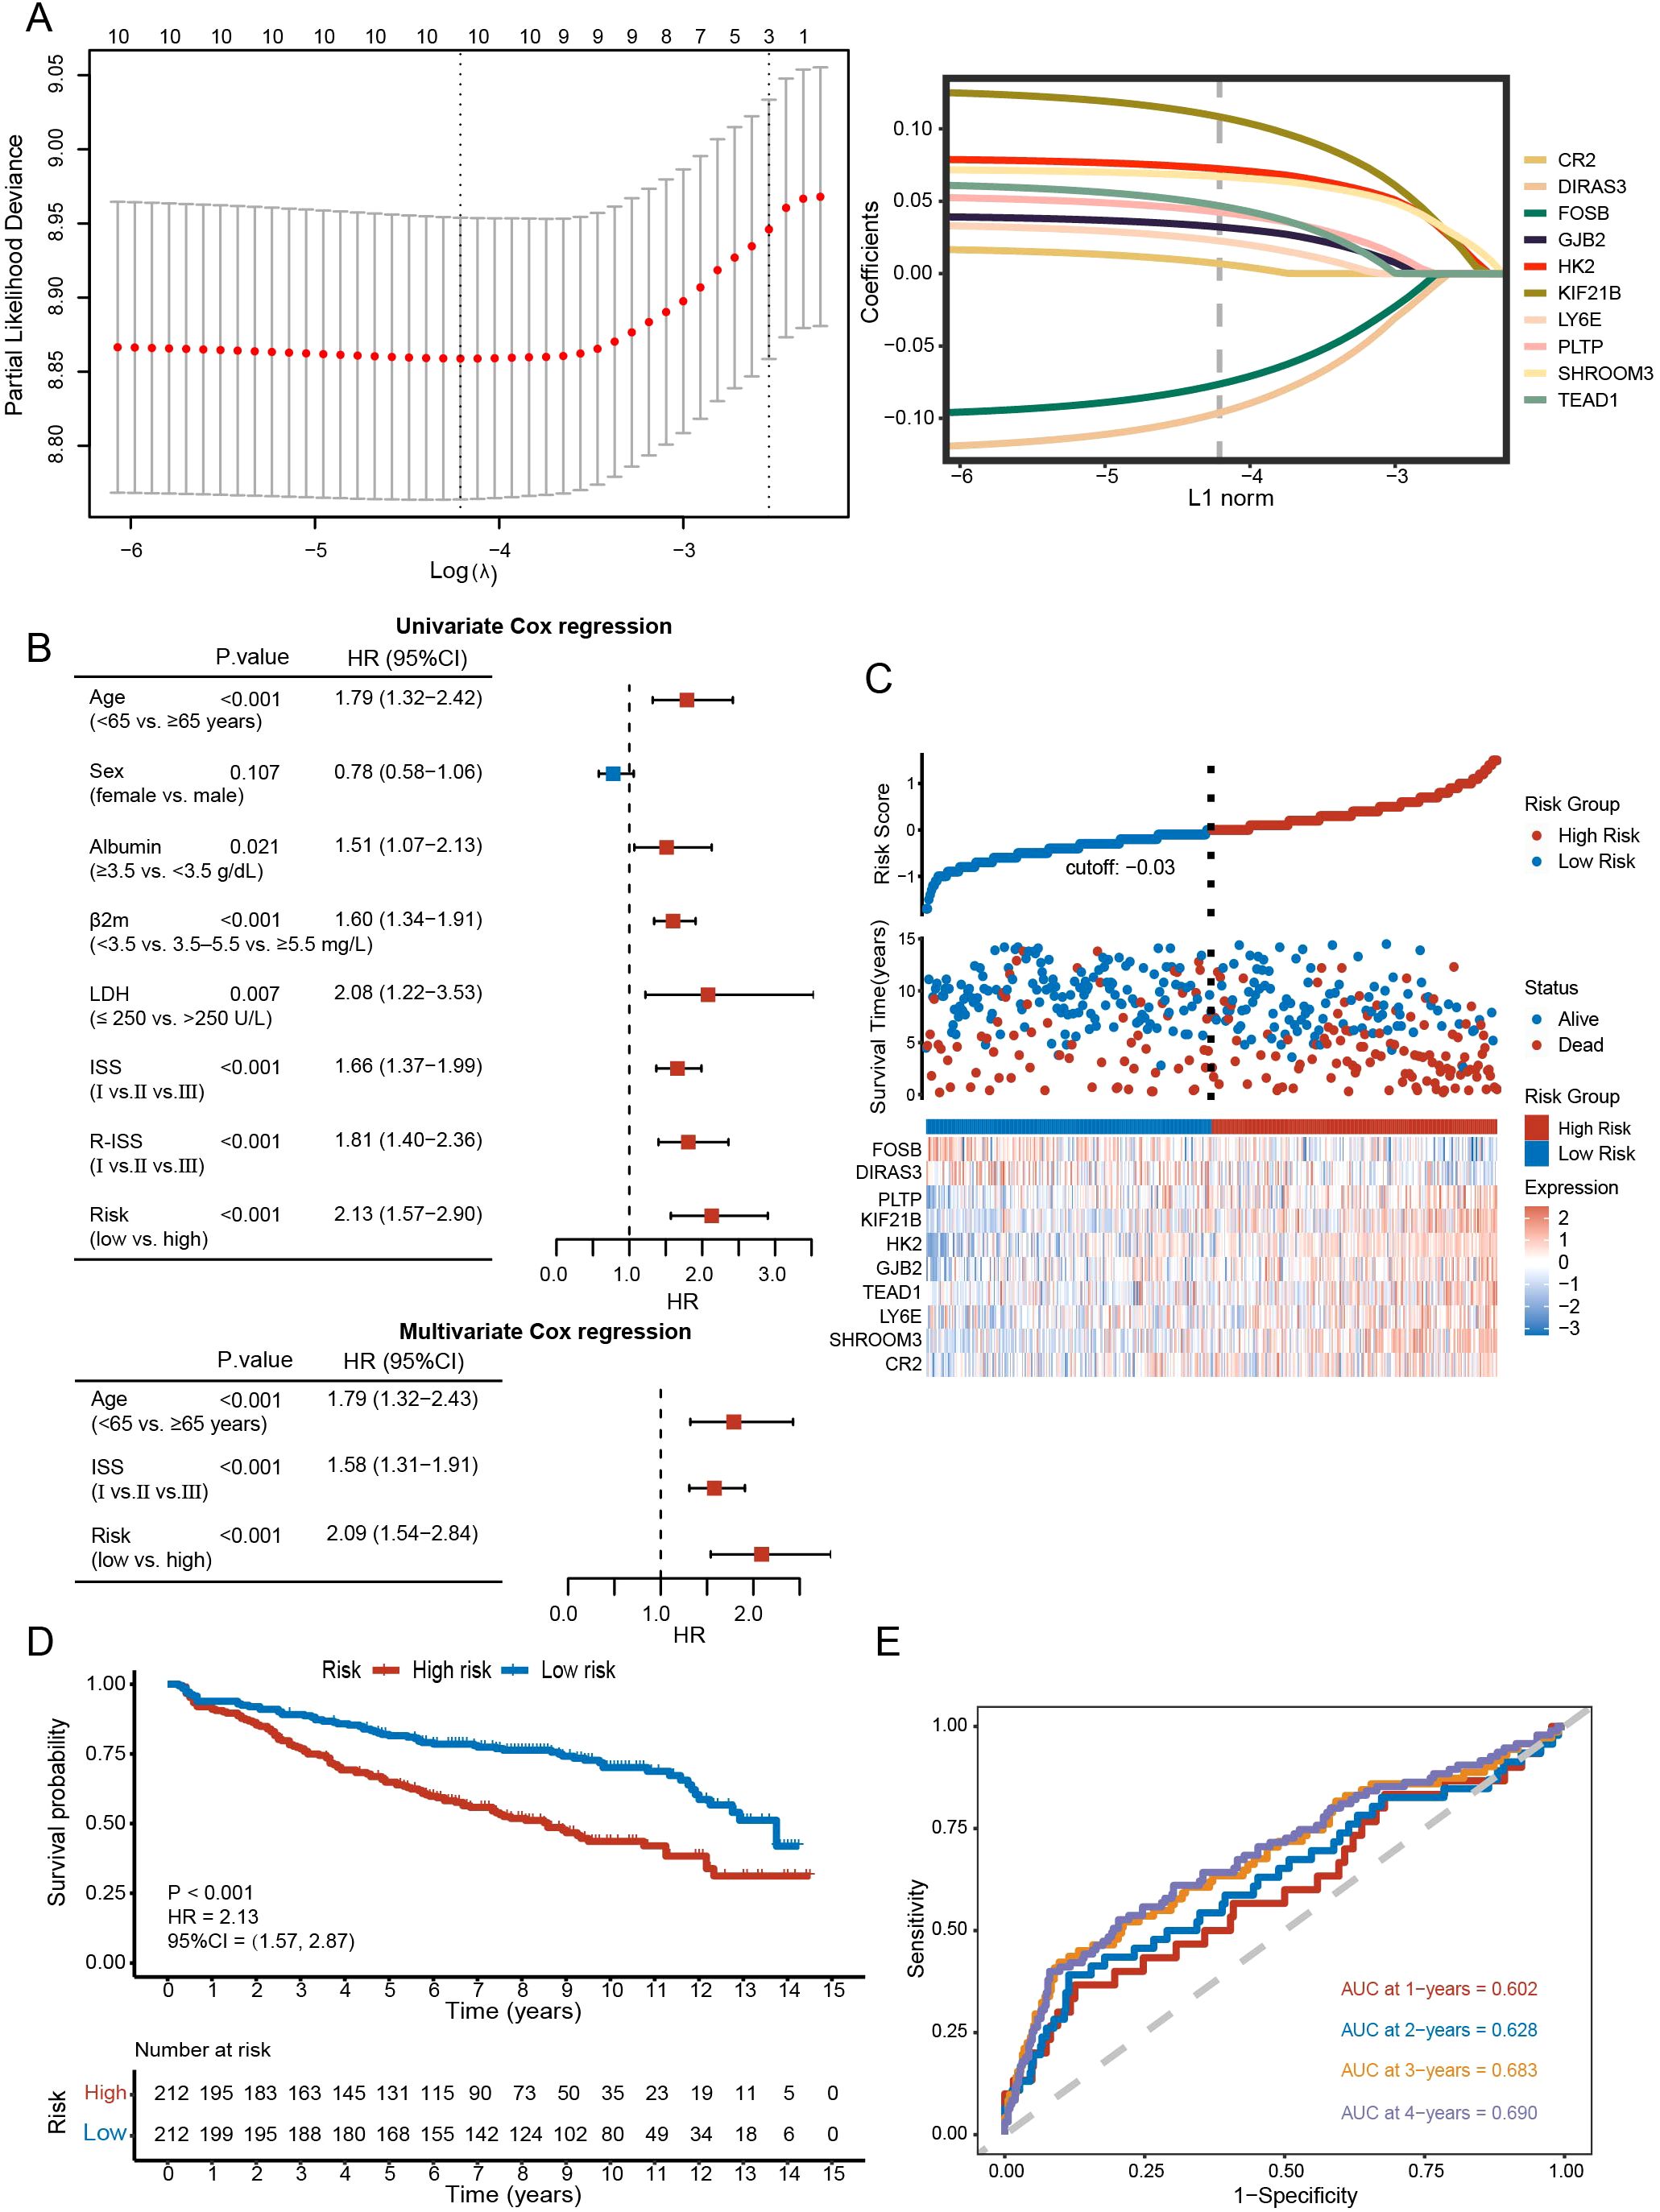
Figure 6. Construction and evaluation of the prognostic model. (A) Prognostic model constructed with lasso algorithm. (B) Univariate and multivariate analysis. (C) Distribution of survival status between high- and low-risk groups and gene expression heatmap of the prognostic model. (D) Kaplan-Meier curve of high- and low-risk groups (P < 0.001). (E) The sensitivity and specificity of the model were assessed by time-ROC analysis.
Figure 6C and Supplementary Figure 1A revealed differences in survival and gene expression between the high- and low-risk subgroups. In both the training and validation sets, higher scorers fared worse in terms of survival (GSE136337: HR = 2.13, 95% CI = 1.57-2.87, P < 0.001; GSE24080: HR = 1.76, 95% CI = 1.30-2.40, P < 0.001; GSE4204: HR = 1.76, 95% CI = 1.16-2.67, P = 0.008) (Figure 6D; Supplementary Figure 1B). In the training set, the Brier scores for 1-, 2-, 3-, and 4-year survival of the model were 0.050, 0.057, 0.102, and 0.129, respectively. This further validates the stability of the model. AUCs of the 1-, 2-, 3-, and 4-year survival were 0.602, 0.628, 0.683, and 0.690, respectively, in the GSE136337 (Figure 6E), 0.631, 0.682, 0.710, and 0.648 in the GSE24080, 0.663, 0.707, 0.697, and 0.648 in the GSE4204 (Supplementary Figure 1C).
3.5 Construction and evaluation of the prognostic model
The risk subgroups differed in clinical risk indicators (Figure 7A). Those with high levels of LDH and β2-MG had higher risk scores, in contrast to albumin (P < 0.05). Higher ISS or R-ISS staging was more concentrated in the high-rated group (P < 0.05). Consistently, C2 with a worse prognosis favored higher risk scores (P < 0.05). In the genetic landscape, KIF21B (32%), CR2 (31%), and SHROOM3 (27%) were the three genes with the highest mutation rates (Figure 7B). Based on the 1215 DEGs, we found that high-risk groups were enriched in pathways including p53 signaling pathway, proteasome, TCA cycle, oxidative phosphorylation, PI3K-Akt signaling pathway, chemical carcinogenesis, and JAK-STAT signaling pathway (Figures 7C, D).
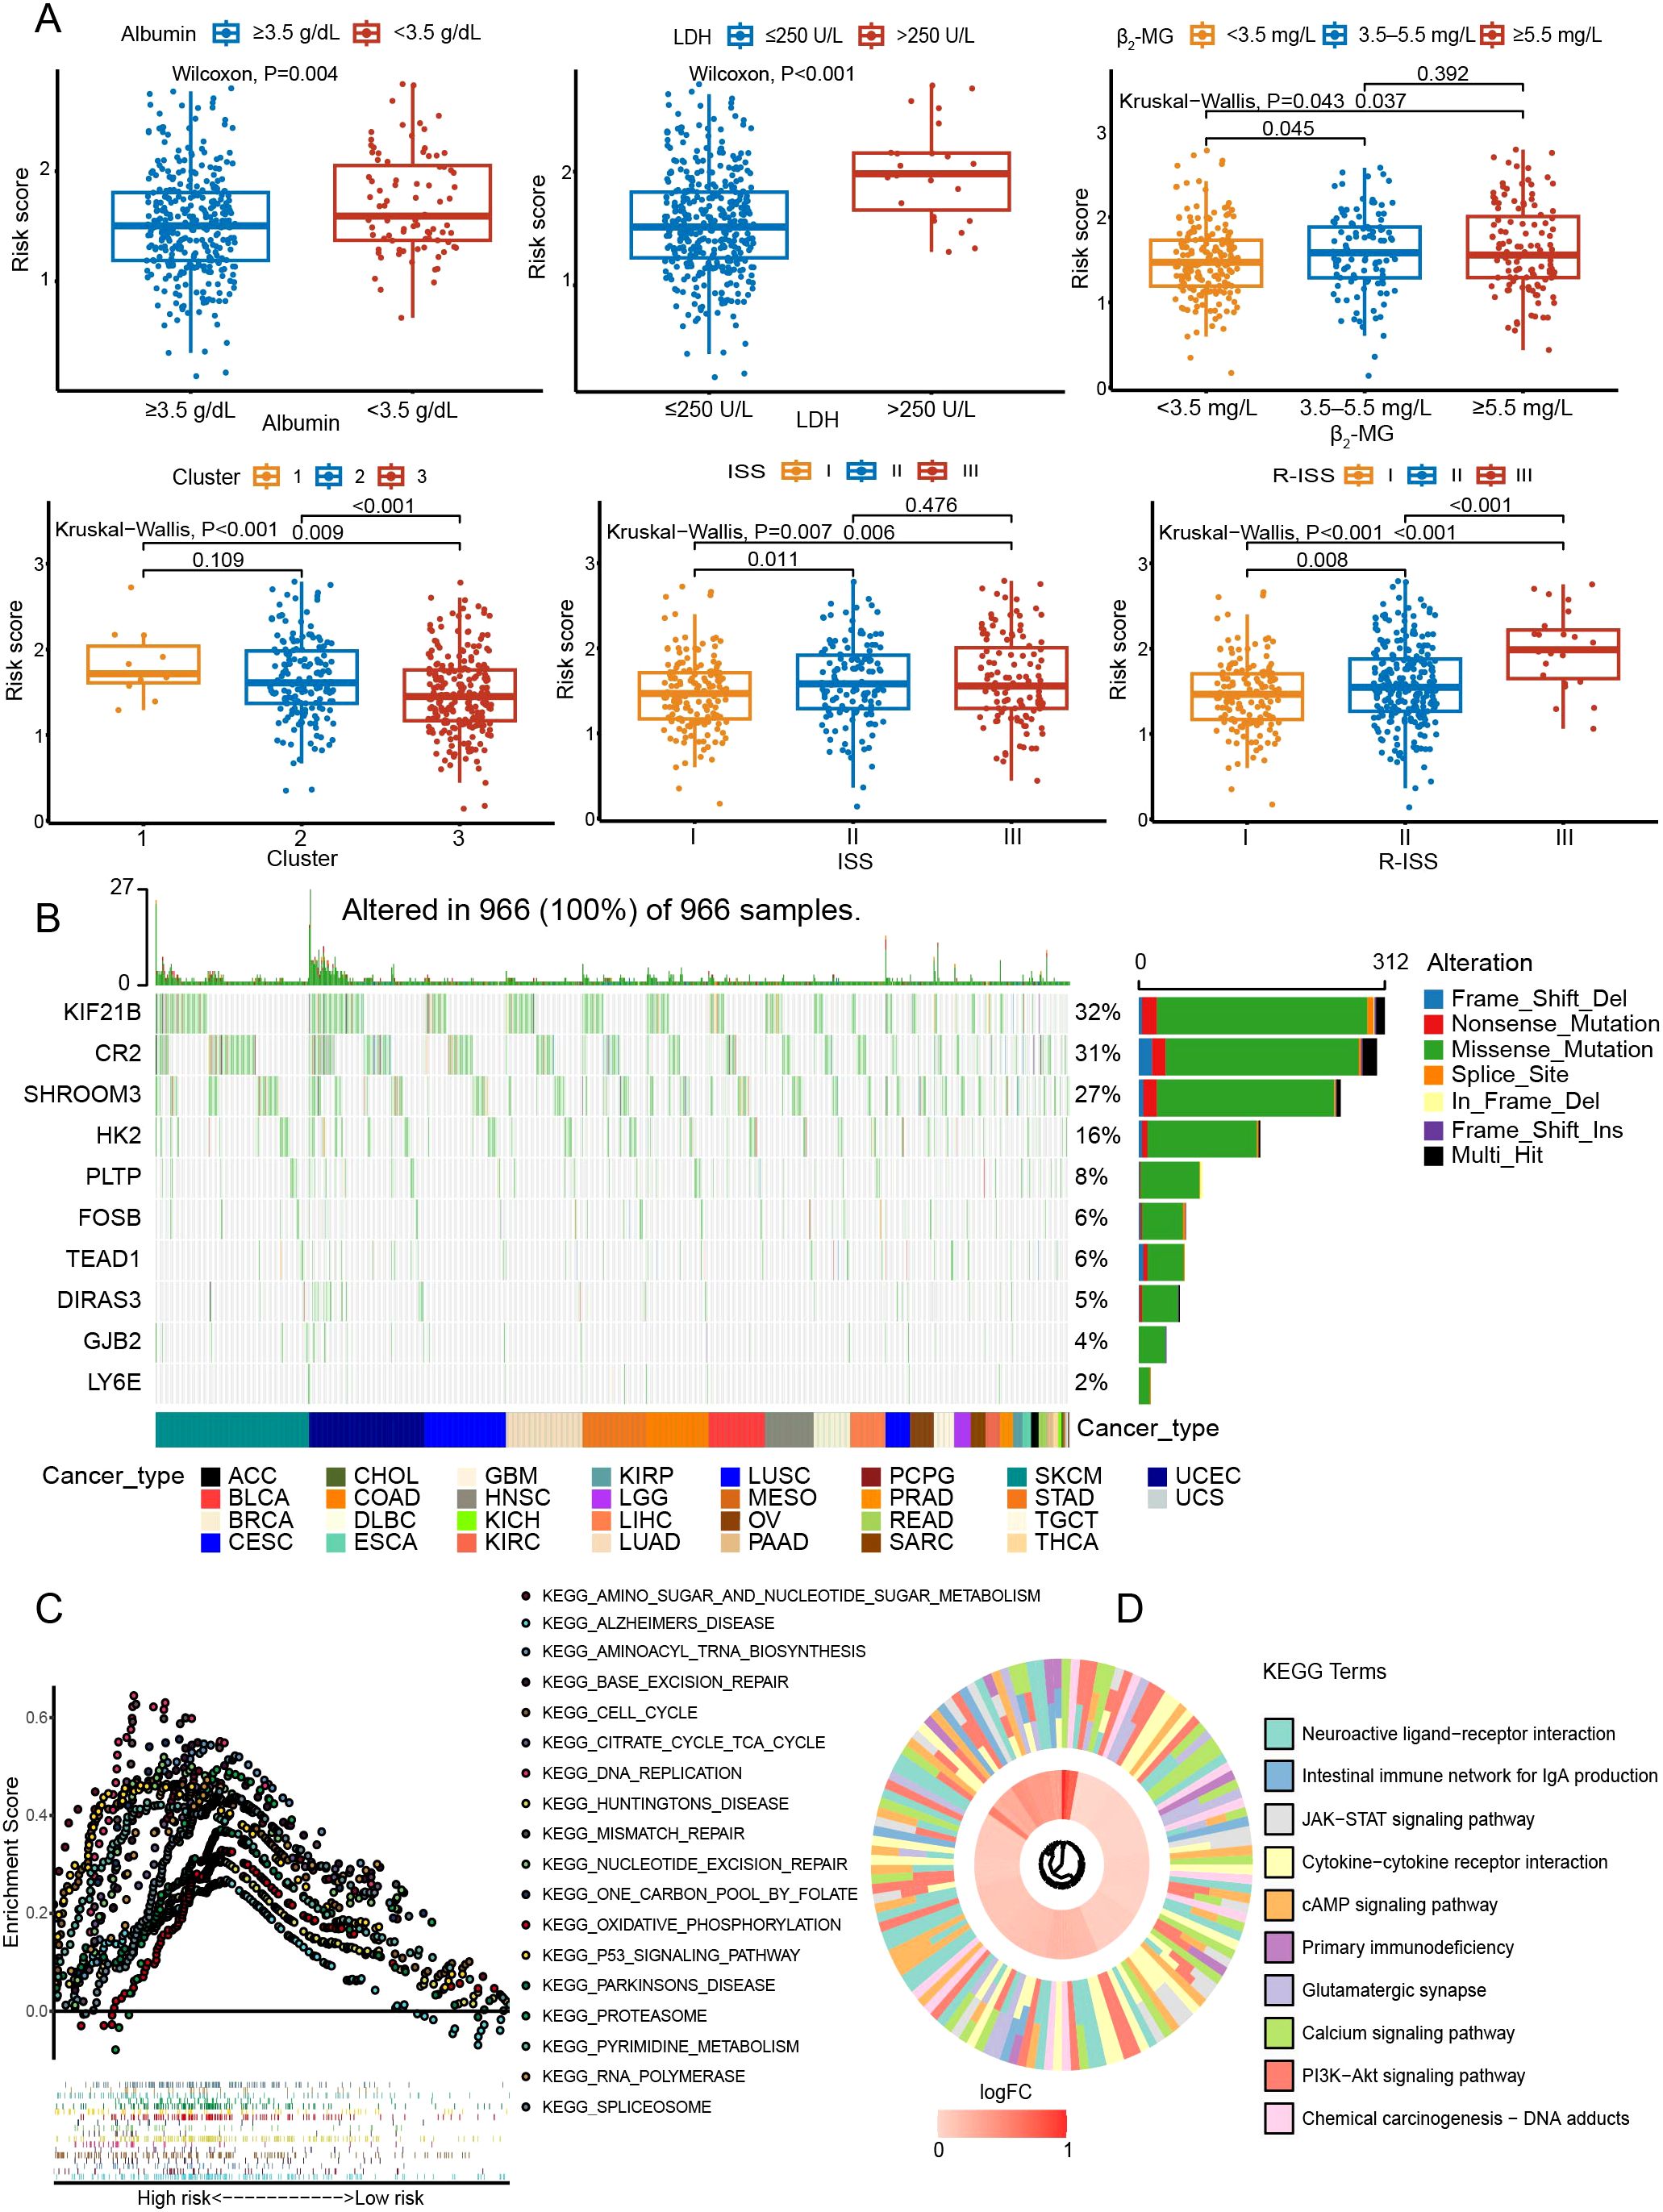
Figure 7. Exploration of the mutation landscape and pathways in the prognostic model. (A) Relationships between the risk score and various clinical characteristics. (B) The mutation landscape of genes in the model. (C) Exploration of biological functions with GSEA. (D) KEGG pathway enrichment analysis.
3.6 Comparative analysis of immune background between risk subgroups
In terms of the immune checkpoint, the high-risk group had higher expression levels of PD-1, CD70, MCM6, POLD3, MSH6, MSH2, and LGALS3 (P < 0.05) (Figure 8A). For immunity, prognostic genes were closely associated with immune-related pathways and functional status (Figure 8B). For example, the expression of suppressive immune genes was generally favorably connected with GJB2, whereas the stimulatory immune genes were negatively correlated. Furthermore, T cells in the high-risk group were more susceptible to exclusion (P < 0.001) (Figure 8C). In addition, we discovered a positive correlation (r = 0.44, P < 0.001) between mRNAsi and the risk score (Figure 8D). A greater chance of recurrence was evident in the high-scoring group.
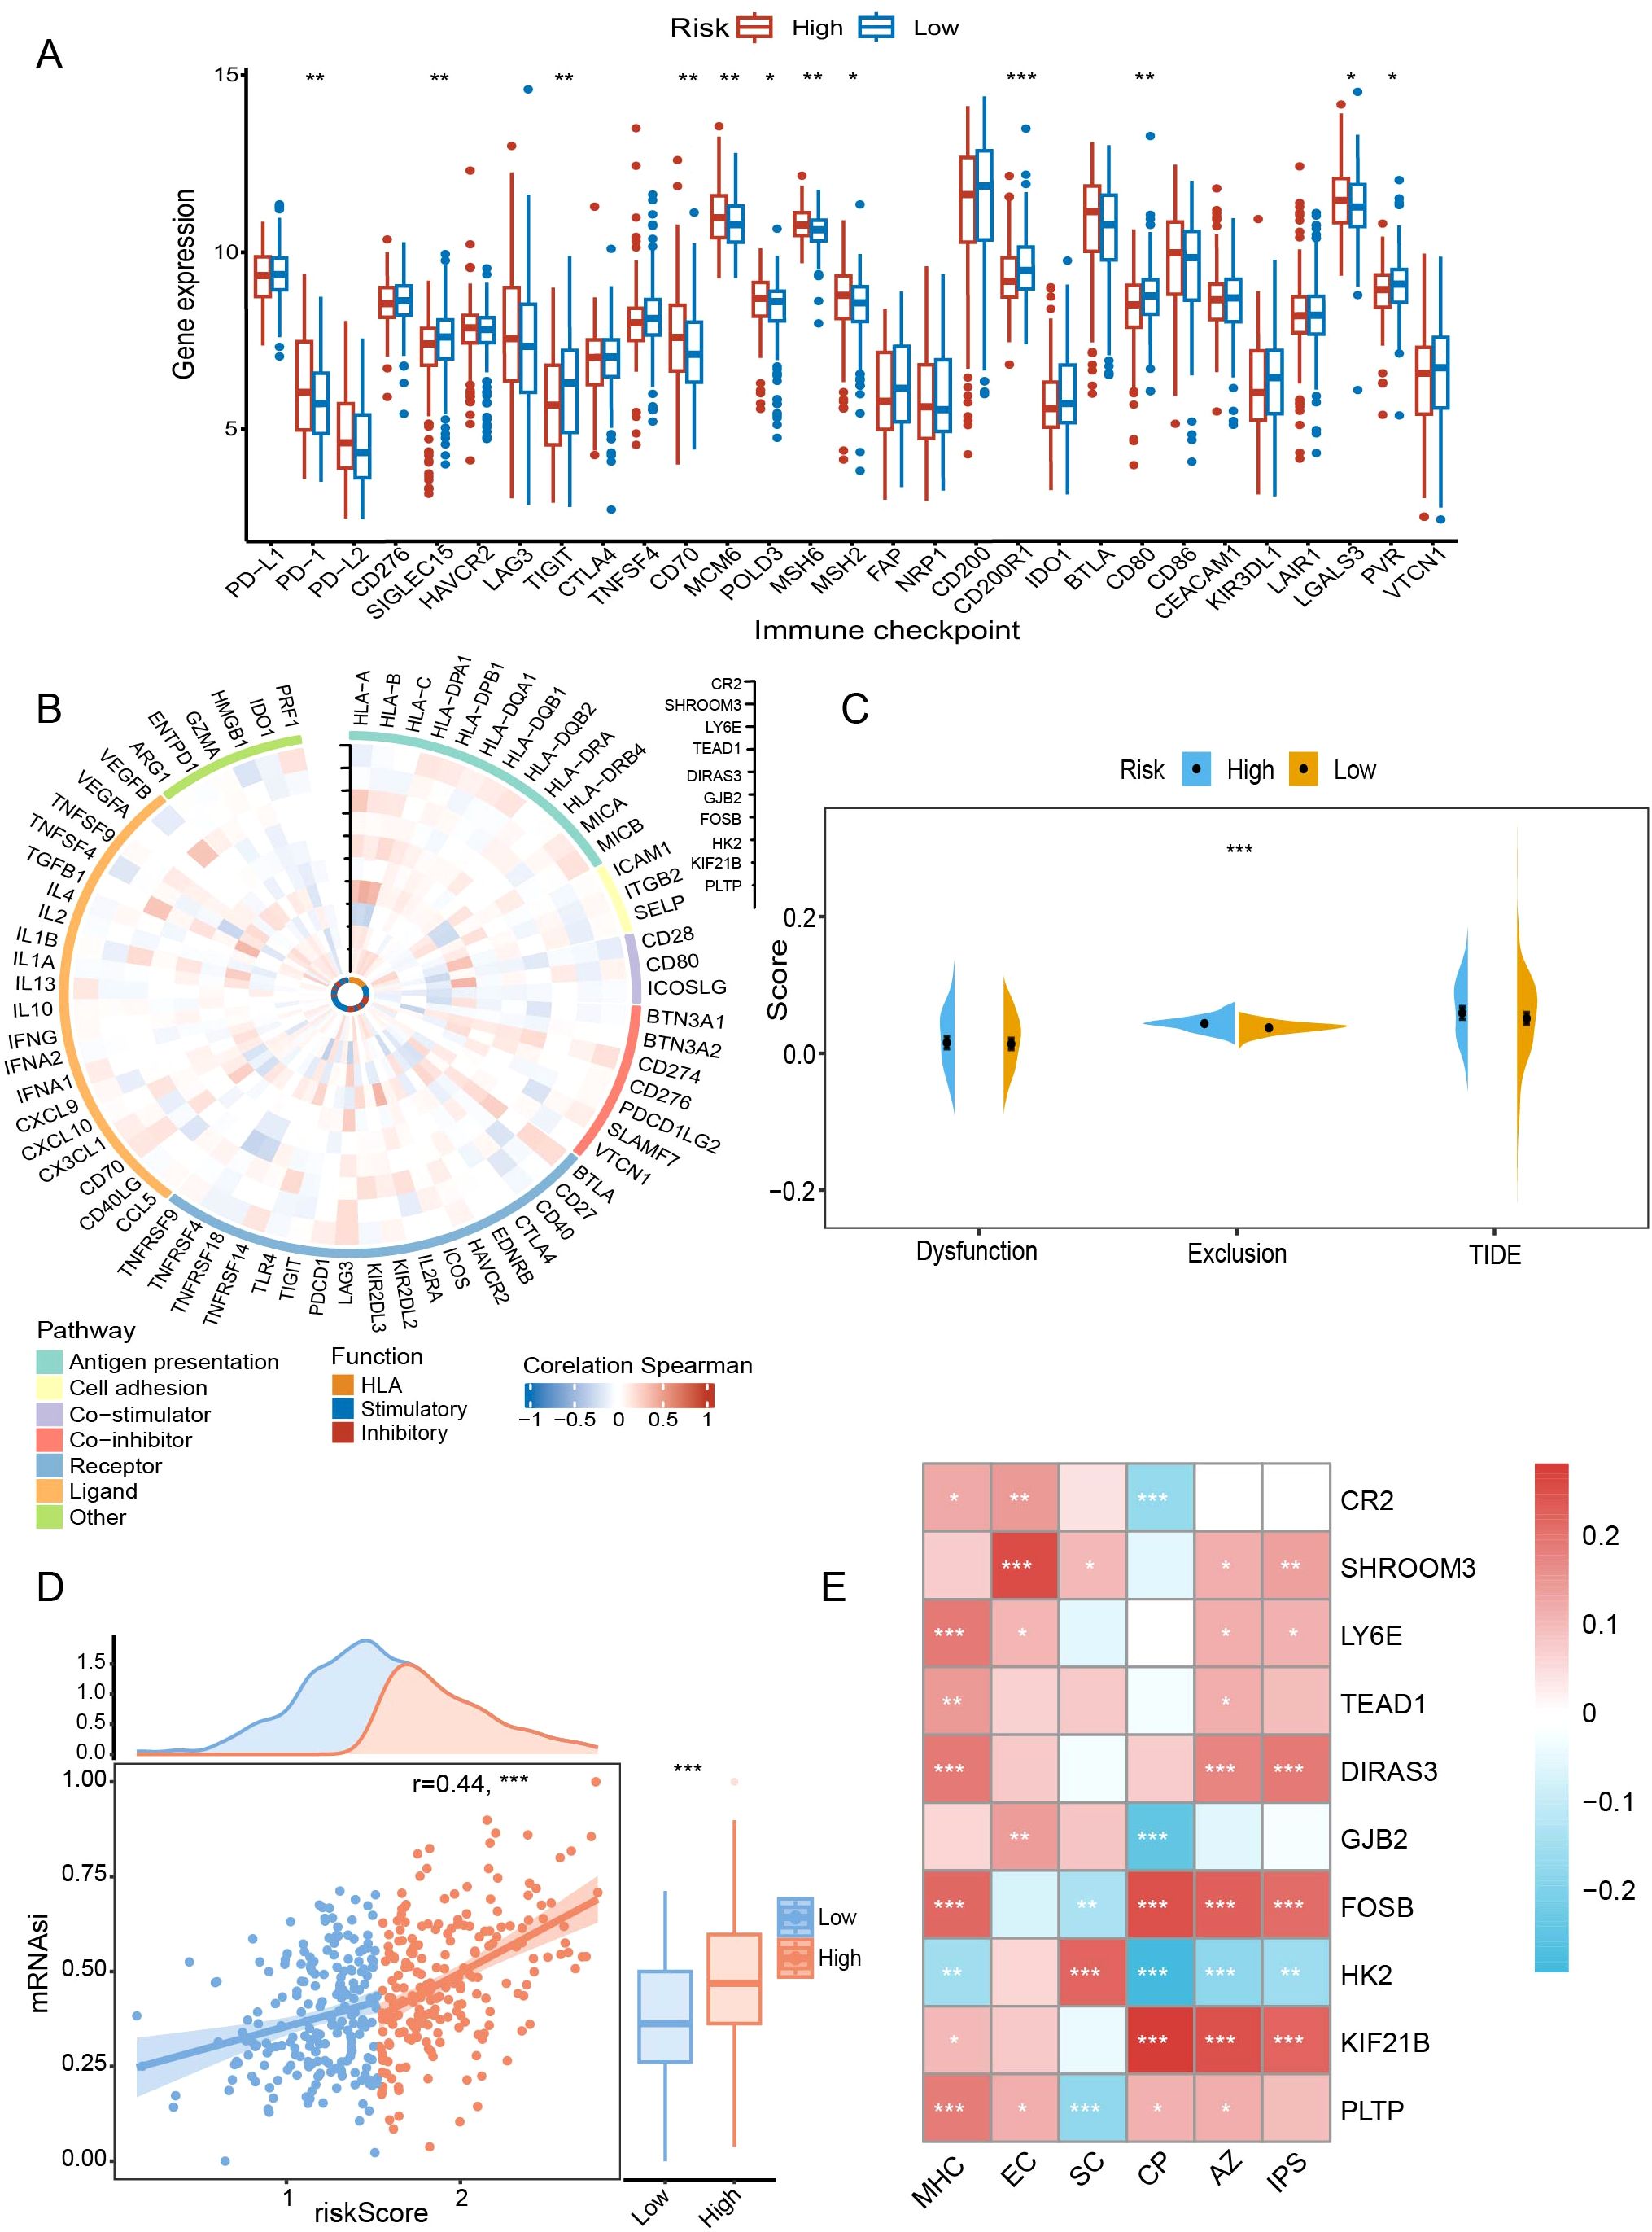
Figure 8. Comparative analysis of immune background between risk subgroups. (A) Comparison of immune checkpoints between risk subgroups. (B) Correlations of prognostic genes with immune-related pathways and functions. (C) Assessment of T-cell dysfunction and exclusion. (D) Correlation of risk scores with mRNAsi scores. (E) Association of prognostic genes with IPS-related scores. mRNAsi, mRNA expression-based stemness index; TIDE, tumor immune dysfunction and exclusion; IPS, immunophenotype score; MHC, antigen presentation; EC, effector cells; SC, suppressor cells; CP, checkpoint marker; AZ, z-score. *P < 0.05; **P < 0.01; ***P < 0.001.
In subsequent immunophenotypic analyses, DIRAS3 and FOSB were positively correlated with antigen presentation-associated markers (P < 0.001), whereas HK2 was negatively correlated (P < 0.01) (Figure 8E). Similarly, in terms of inhibitory cell-associated features, FOSB showed a negative correlation (P < 0.01), whereas the opposite was true for HK2 and SHROOM3 (P < 0.05) (Figure 8E). Finally, DIRAS3 and FOSB correlated with higher total scores (P < 0.001) (Figure 8E), which was associated with greater ICB responsiveness.
3.7 Targeted drug prediction and the network of mRNAs and interrelated miRNAs, TFs
A total of 27 compounds were predicted to potentially target people in high-risk groups (CTRP: paclitaxel, methotrexate, BI-2536, oligomycin A, daporinad, vincristine, GSK461364, leptomycin B, SB-743921, rigosertib, KX2-391; PRISM: cabazitaxel, danusertib, TAS-103, gemcitabine, BNC105, AMG900, verubulin, OTX015, rigosertib, G-1, tipifarnib, 10-hydroxycamptothecin, barasertib-HQPA, ispinesib, SNS-314, taltobulin, genz-644282). All compounds had lower AUCs in the high-scoring subgroup (P < 0.05) (Figures 9A, B). In addition, we further identified eight genes among DEGs in risk subgroups as targets of drugs commonly used in MM through the DrugBank database: CYP2C19, CYP2C9, SLCO1A2, CYP17A1, CYP3A43, XDH, NOS1, and PTGS2 (Figure 9C).
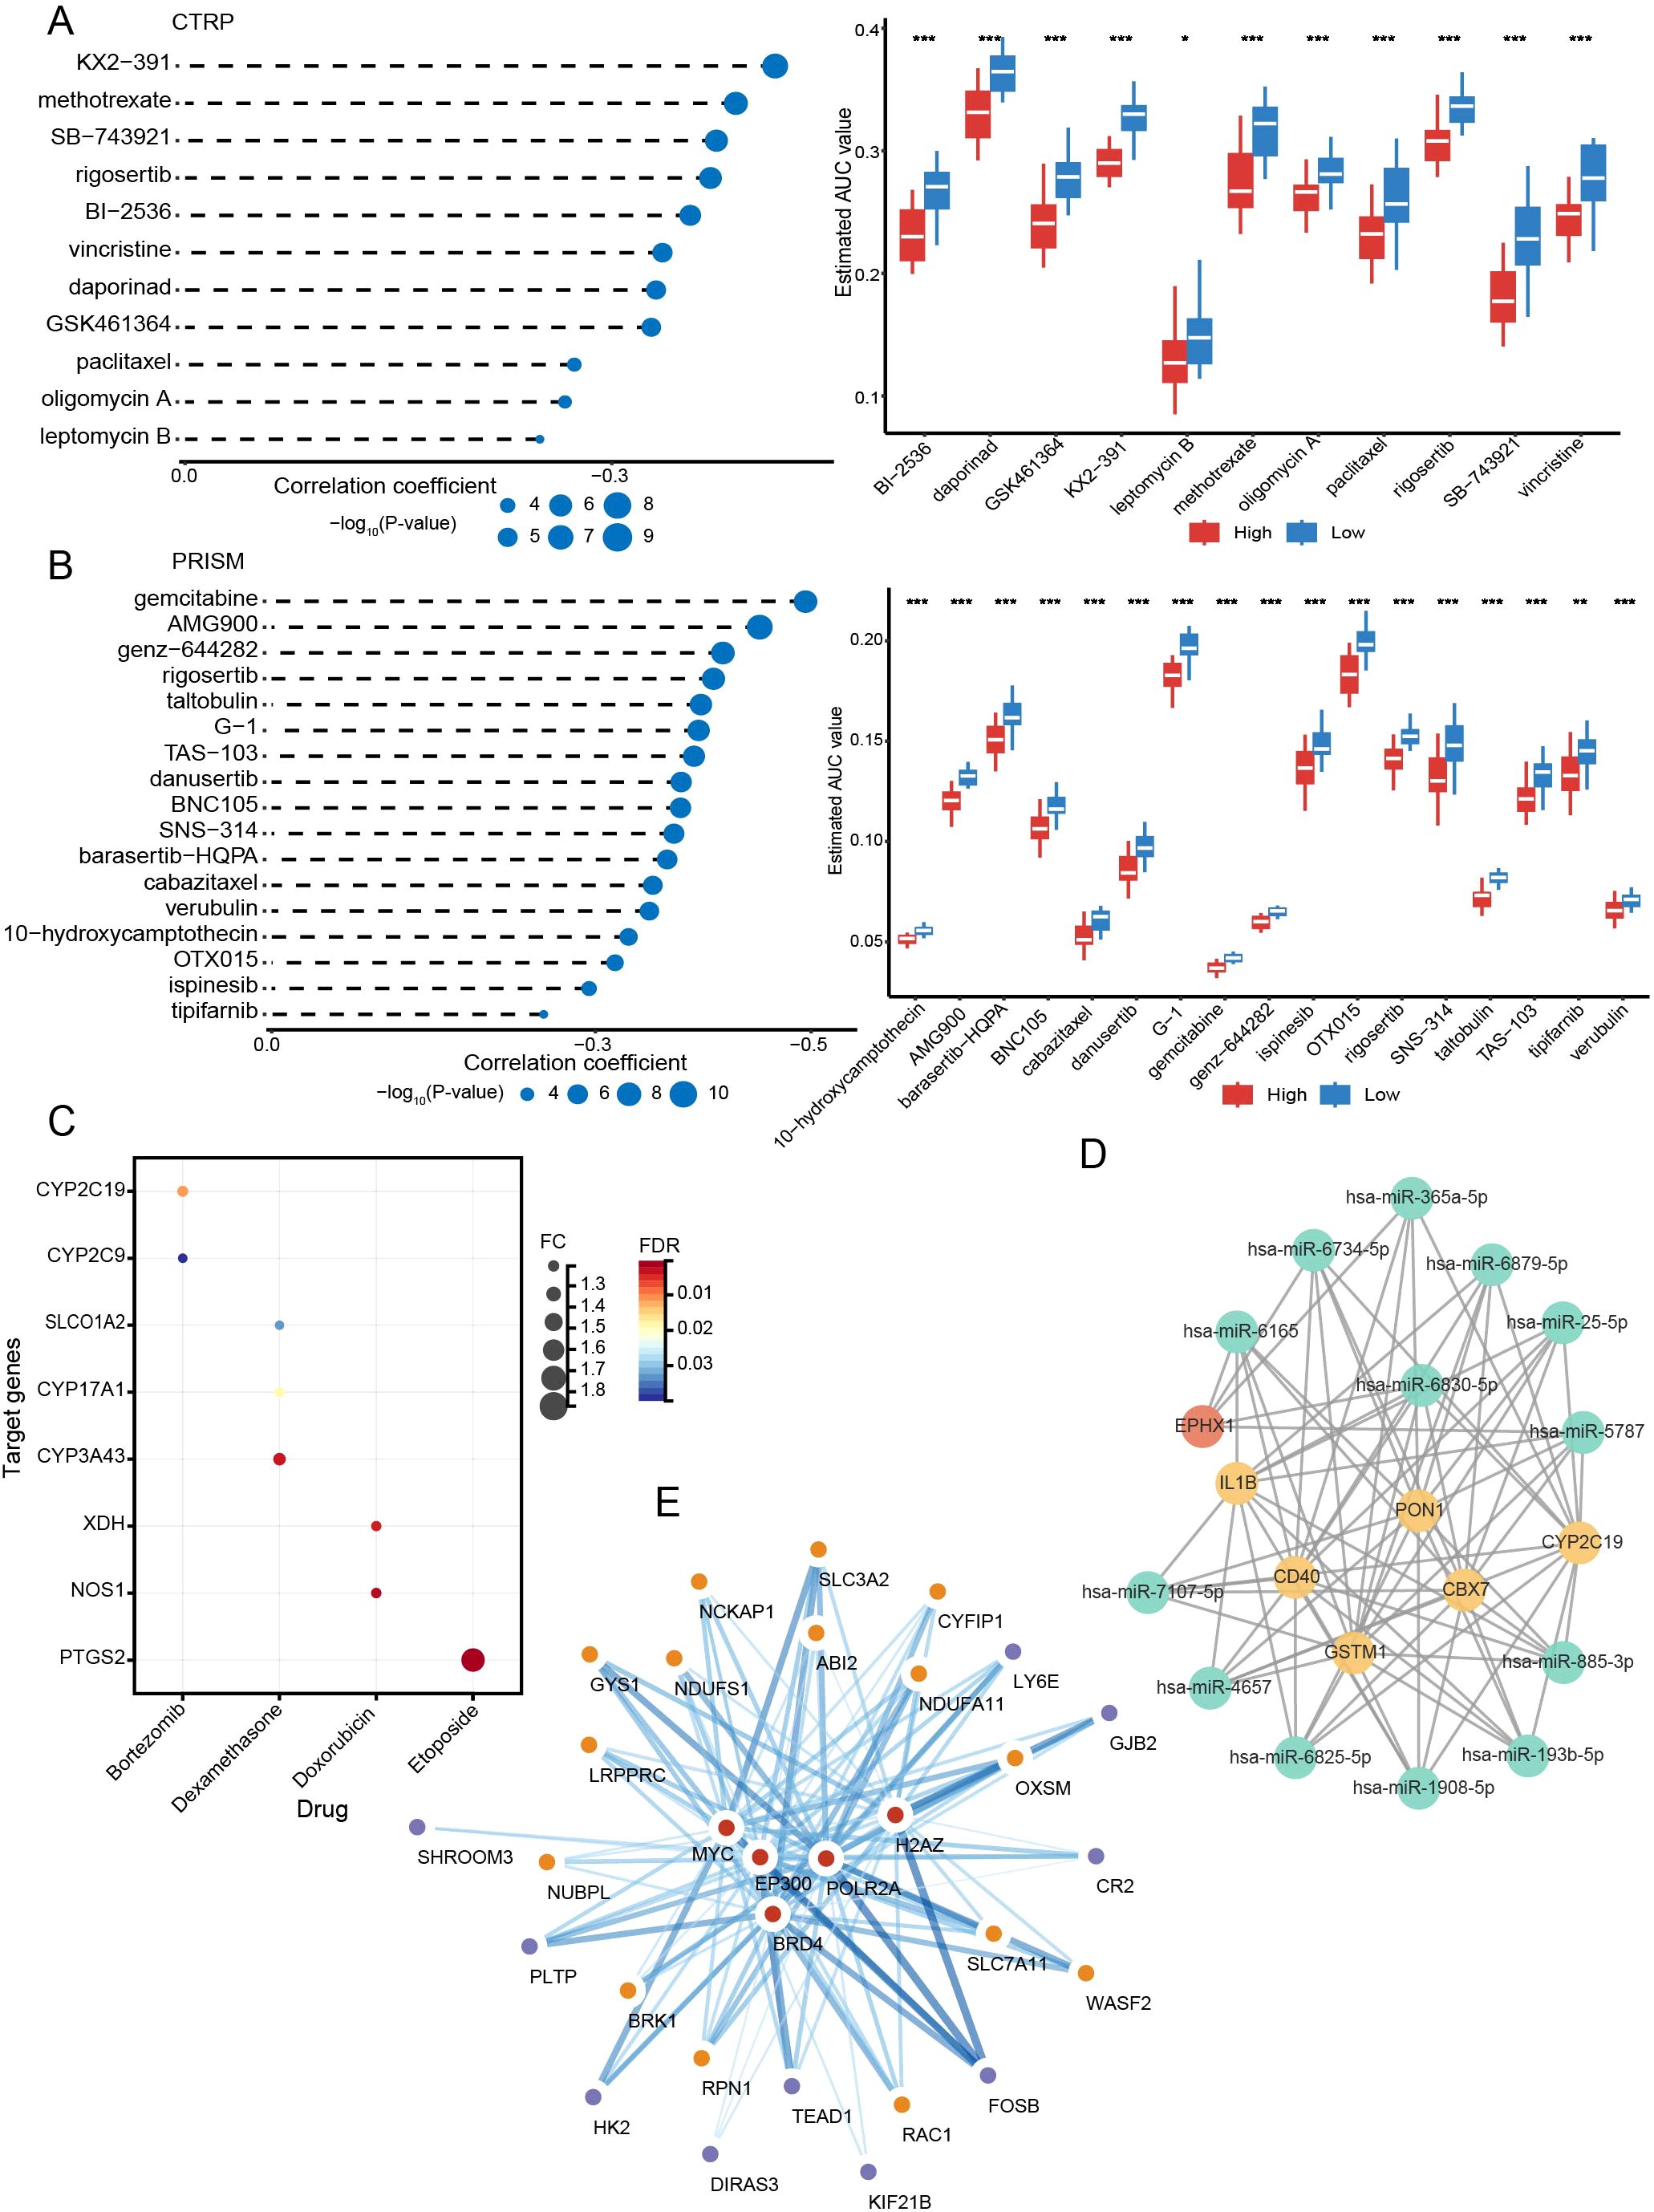
Figure 9. Targeted drug prediction and the network of mRNAs and interrelated miRNAs, TFs. (A) The results of correlation analysis and differential drug response analysis in CTRP. (B) The results of correlation analysis and differential drug response analysis in PRISM. (C) Drug target analysis. (D) mRNA-miRNA network. (E) mRNA-TF network. *P < 0.05; **P < 0.01; ***P < 0.001.
Using the miRWalk database, we predicted 13 miRNAs that were closely interlinked with DEGs between subtypes and risk subgroups (miR-365a-5p, miR-6734-5p, miR-6165, miR-6879-5p, miR-25-5p, miR-6830-5p, miR-5787, miR-7107-5p, miR-4657, miR-6825-5p, miR-1908-5p, miR-193b-5p, miR-885-3p) (Figure 9D). With the Cistrome DB database, five possible TFs (BRD4, EP300, MYC, POLR2A, and H2AZ) may regulate the expression of DRGs and prognostic risk genes (Figure 9E).
3.8 Establishing a predictive nomogram
Nomograms can visualize complex regression equations and facilitate the prediction of the probability of an individual’s outcome in medical research and clinical practice. Based on existing data, we constructed a nomogram by combining age, ISS, and the risk score (Figure 10A). Self-validation was obtained in the calibration curve (Figure 10B). The 1-, 3-, and 5-year AUCs exceeded those of the ISS and R-ISS (GSE136337: 72.41%, 72.77%, and 72.63%; GSE24080: 69.36%, 71.88%, and 68.33%) (Figures 10C, D).
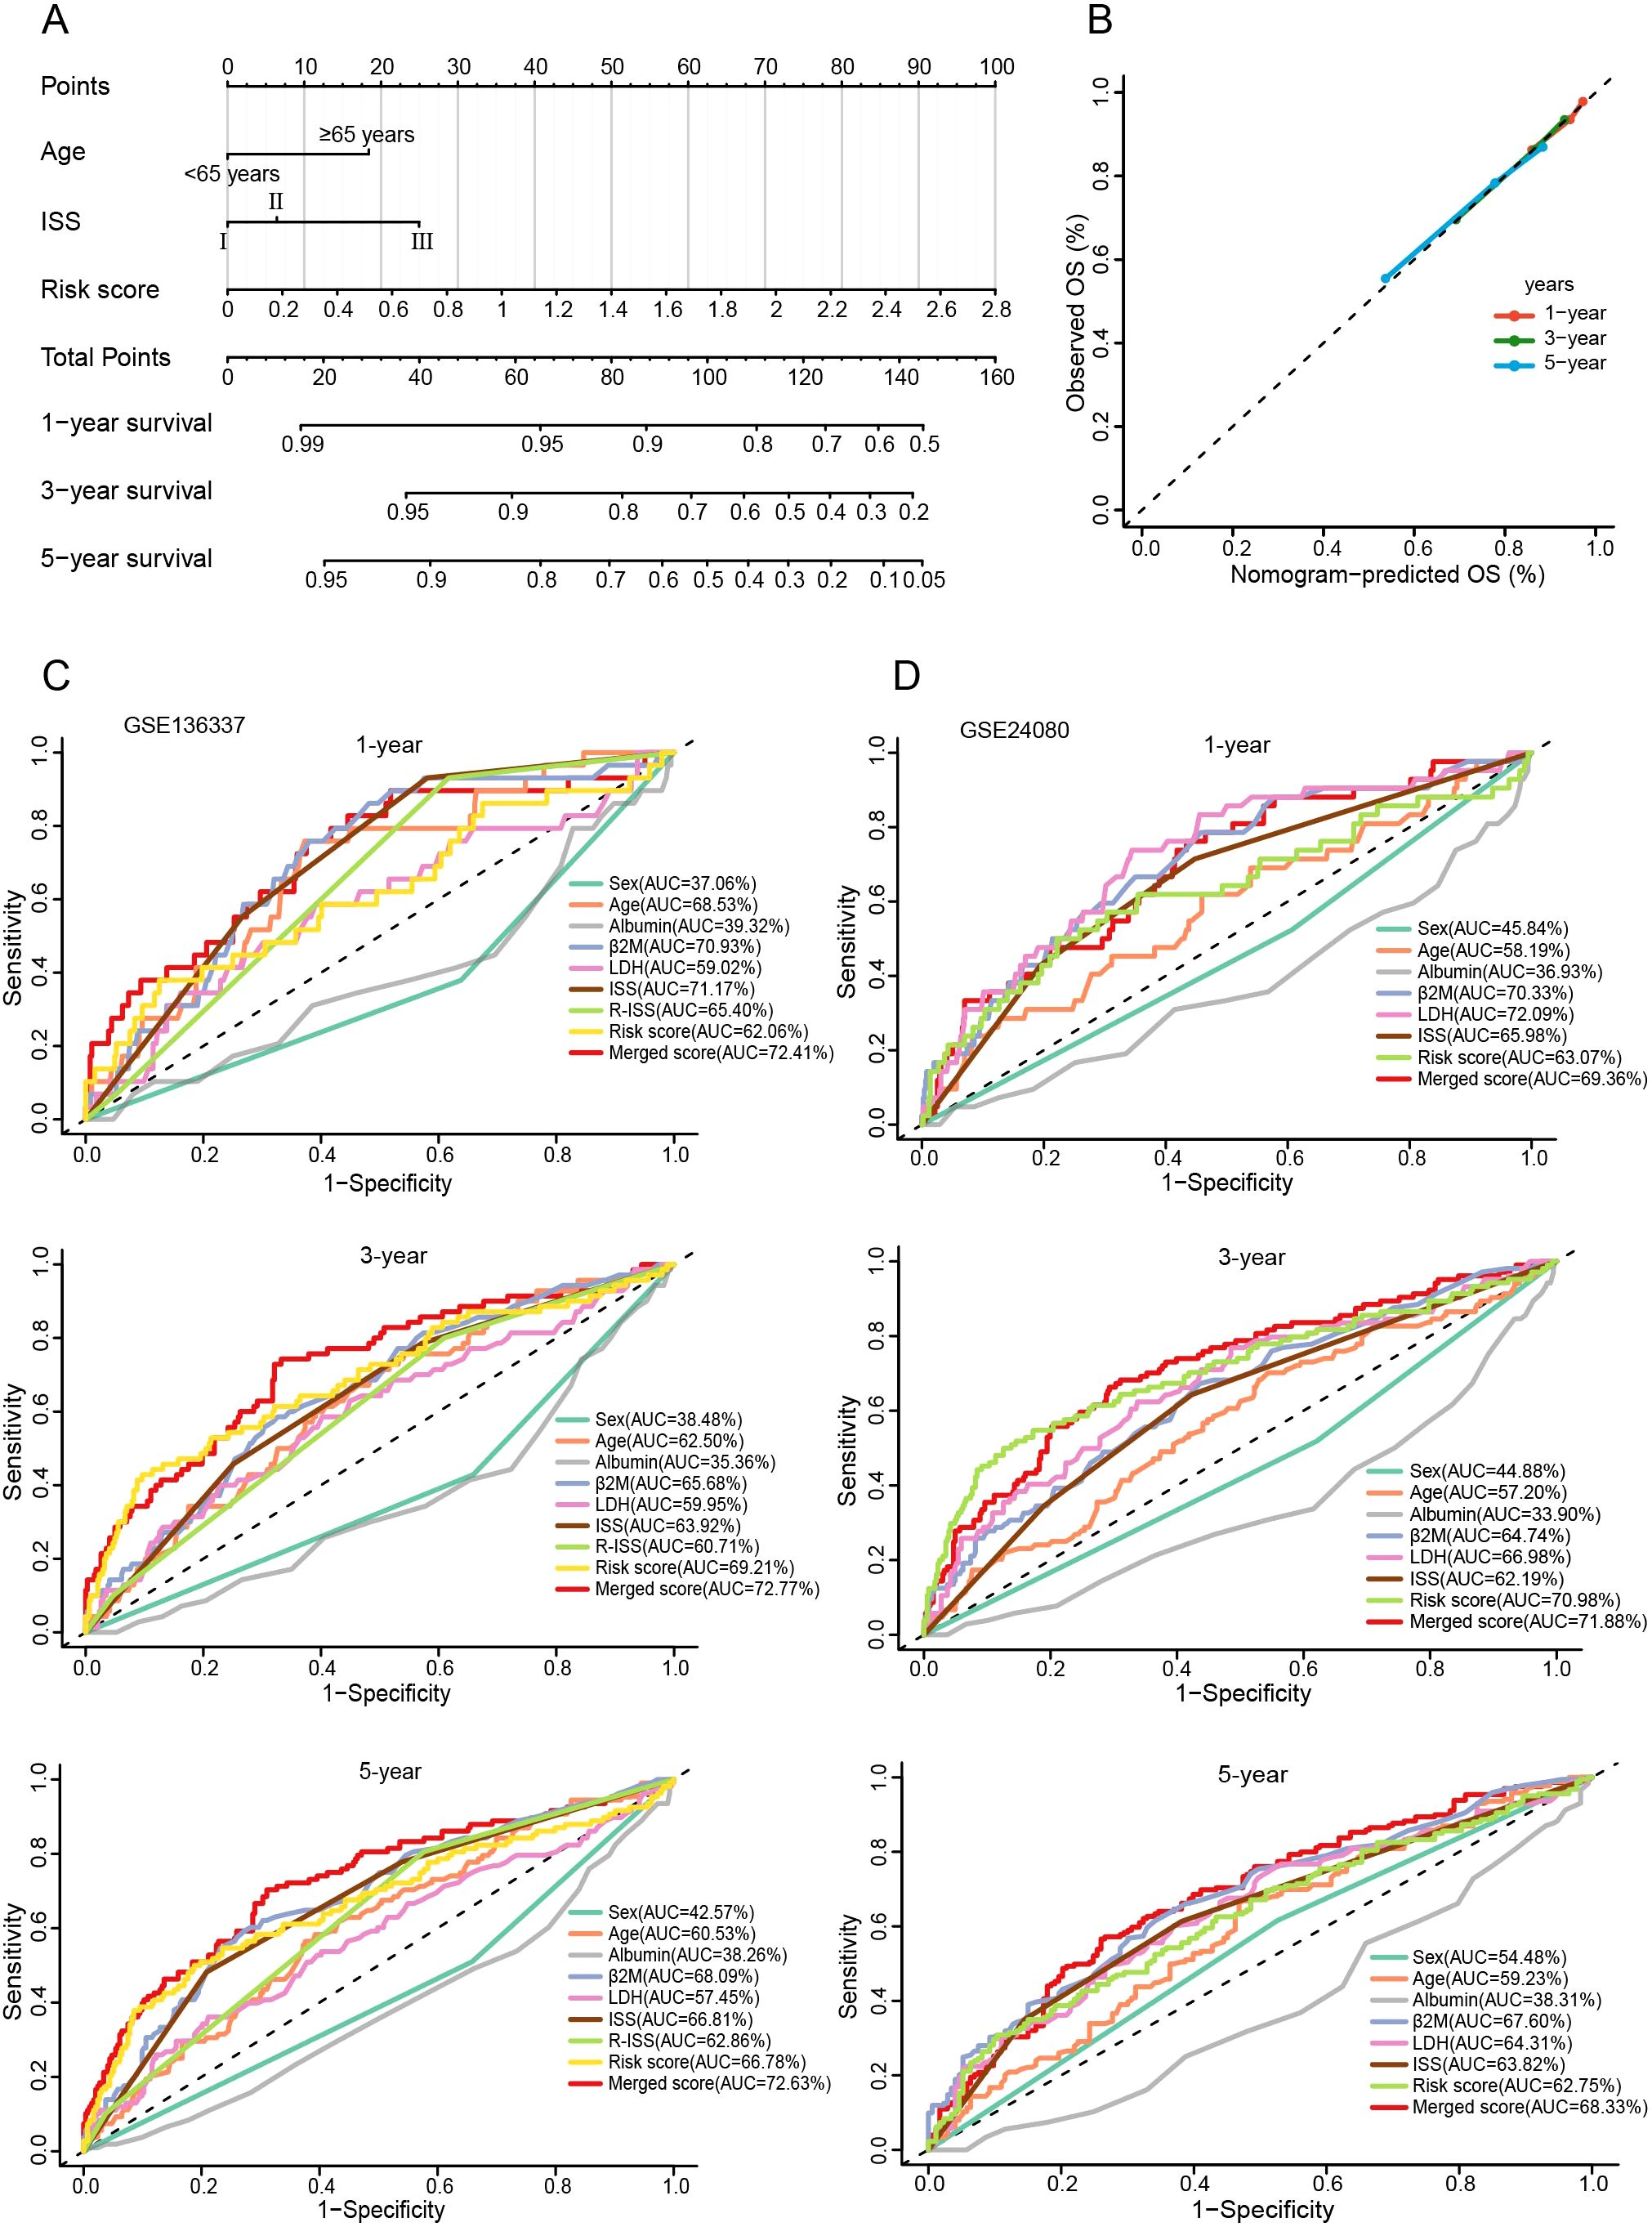
Figure 10. Construction and evaluation of the nomogram. (A) The nomogram assembling age, ISS, and risk score. (B) Calibration curve of the nomogram. (C, D) Time-ROC curves for 1-, 3-, and 5-year survival predictions for the nomograms compared with other clinical traits.
3.9 External validation with experiments
The expression levels of CR2, GJB2, HK2, KIF21B, LY6E, PLTP, SHROOM3, and TEAD1 were upregulated in all cell lines used in the experiments (RPMI8226, MM1.R, U266, NCI-H929, and LP-1) (P < 0.05), in contrast to FOSB (P < 0.001). DIRAS3 was downregulated in MM1.R, U266, and LP-1 (P < 0.001) (Figure 11). We next performed further validation in collected clinical BM specimens. Consistently, DIRAS3 and FOSB showed a trend of downregulation in MM patients relative to normal subjects (P < 0.001), whereas the other genes showed the opposite trend (P < 0.001) (Figure 12).
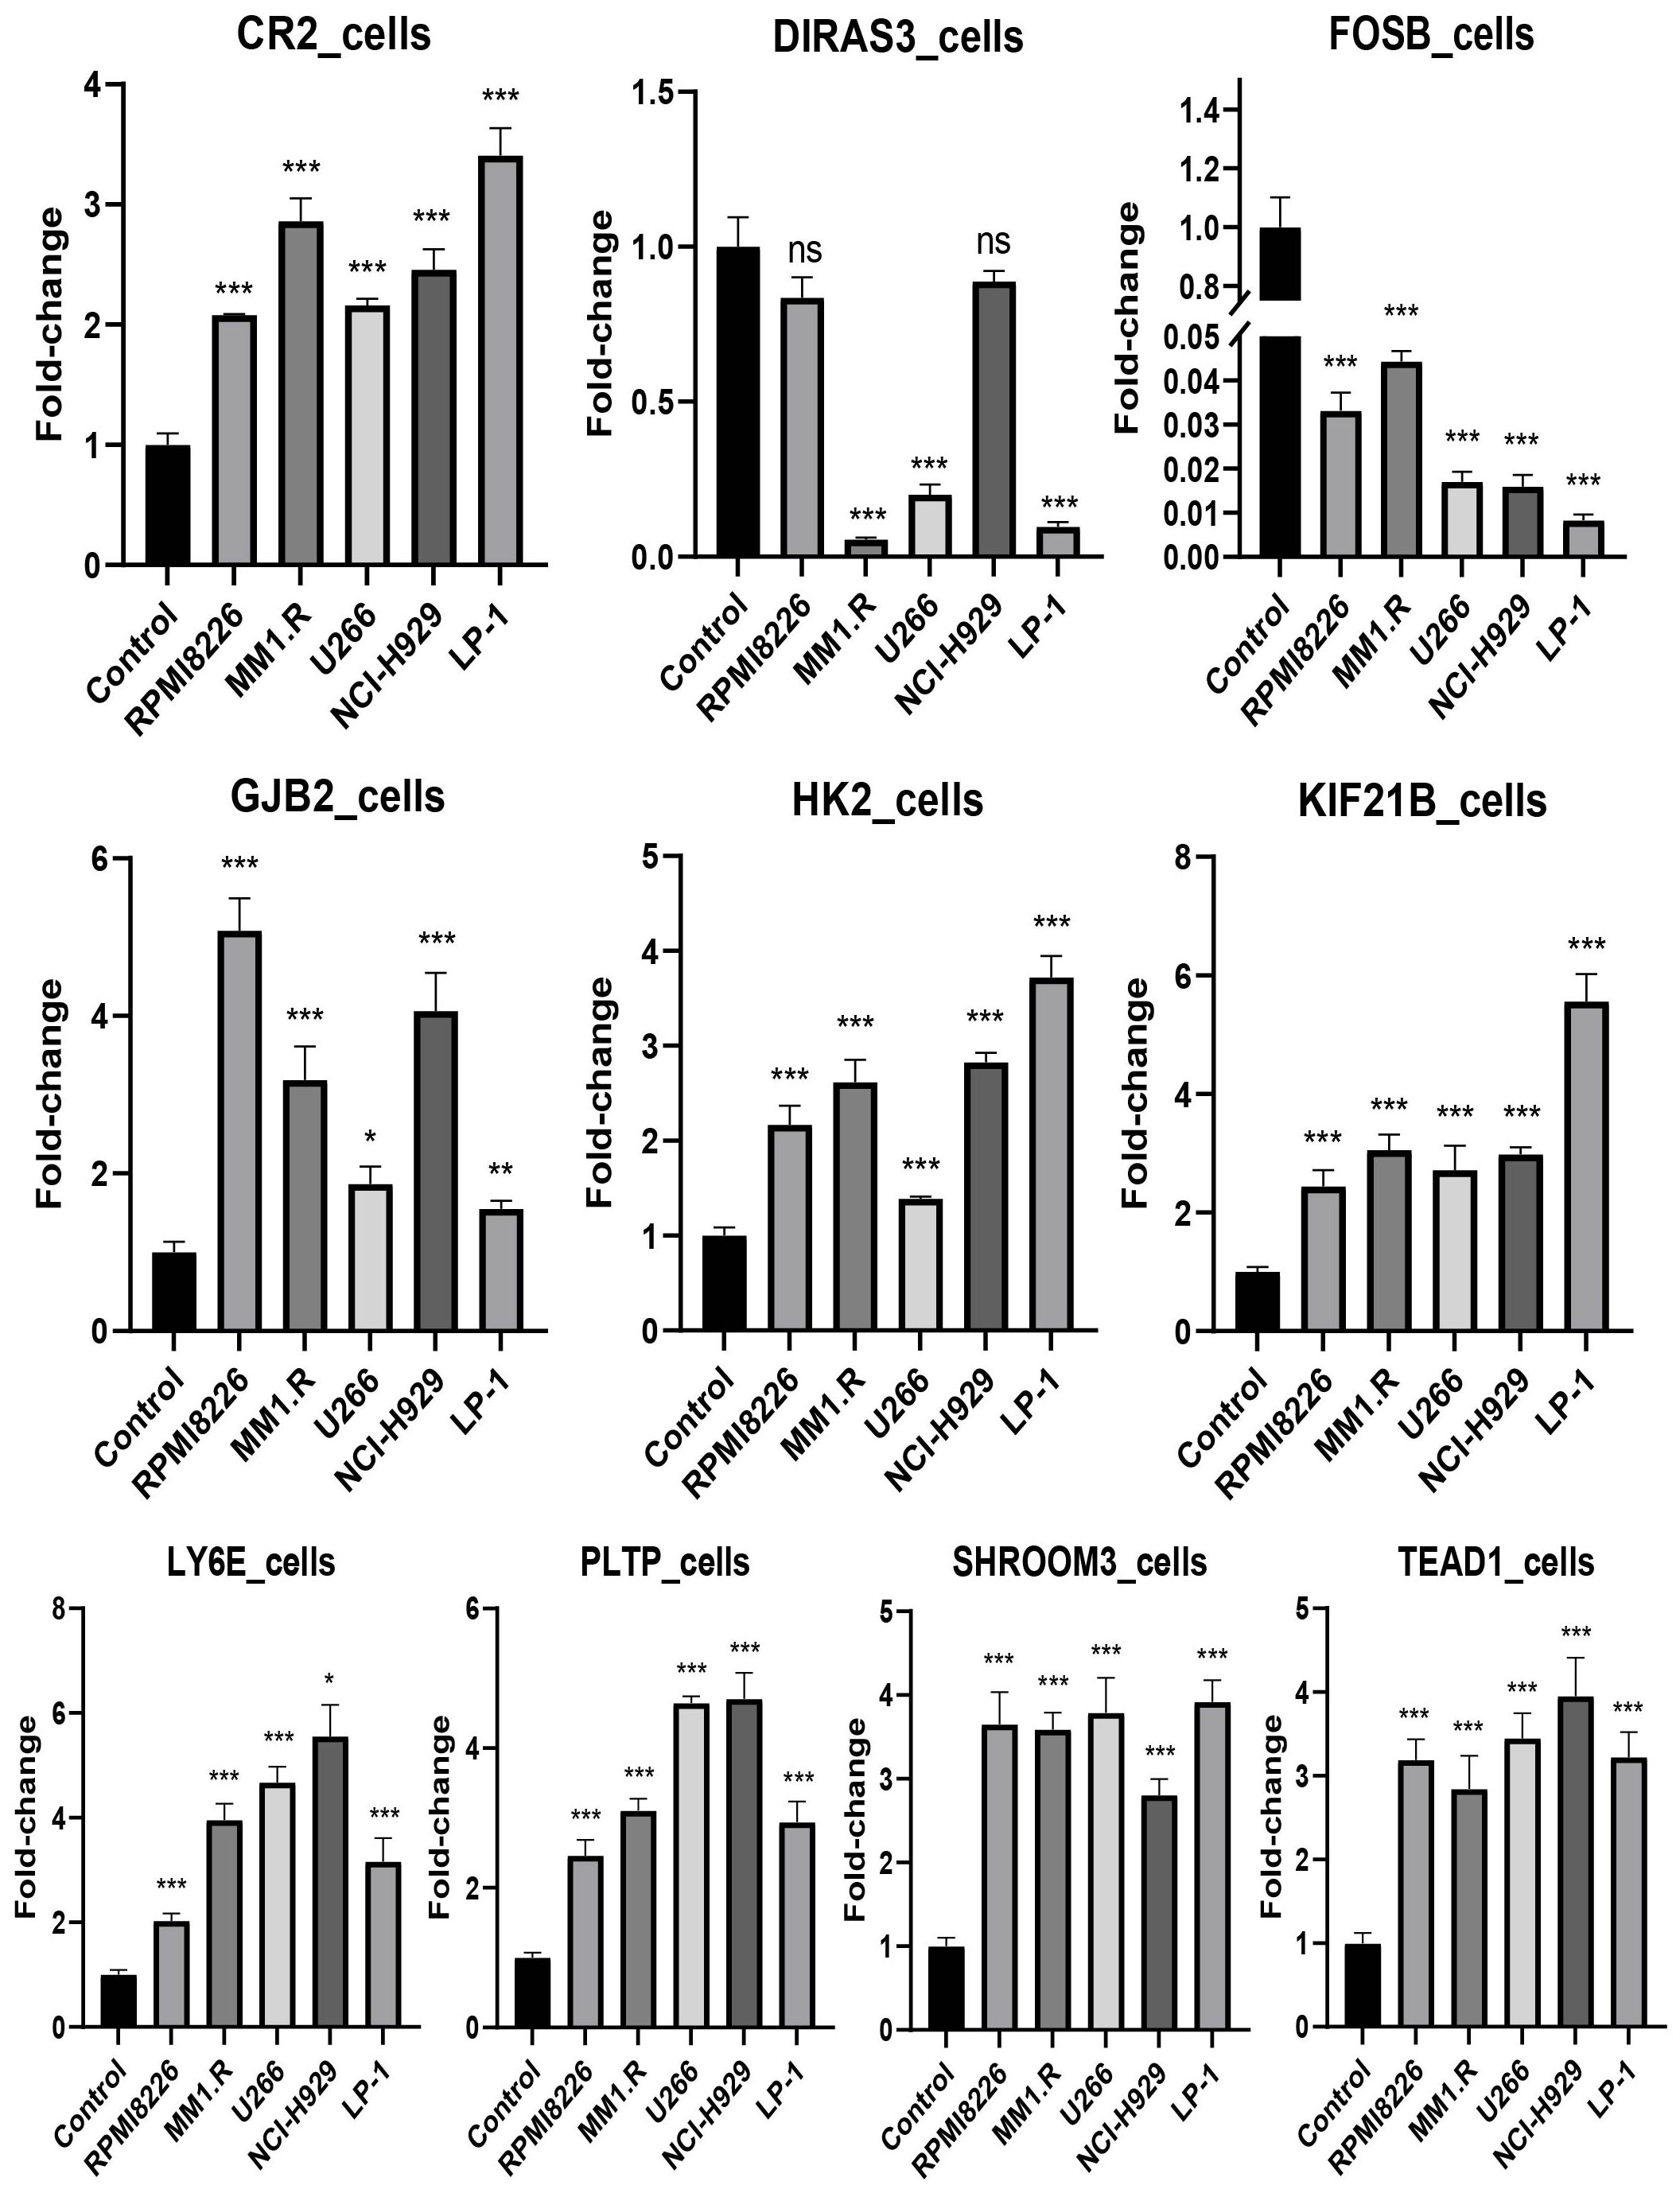
Figure 11. Experimental validation in cell lines (mean ± SEM). ns, no significance; *P < 0.05; **P < 0.01; ***P < 0.001. The experiments were independently repeated 3 times.
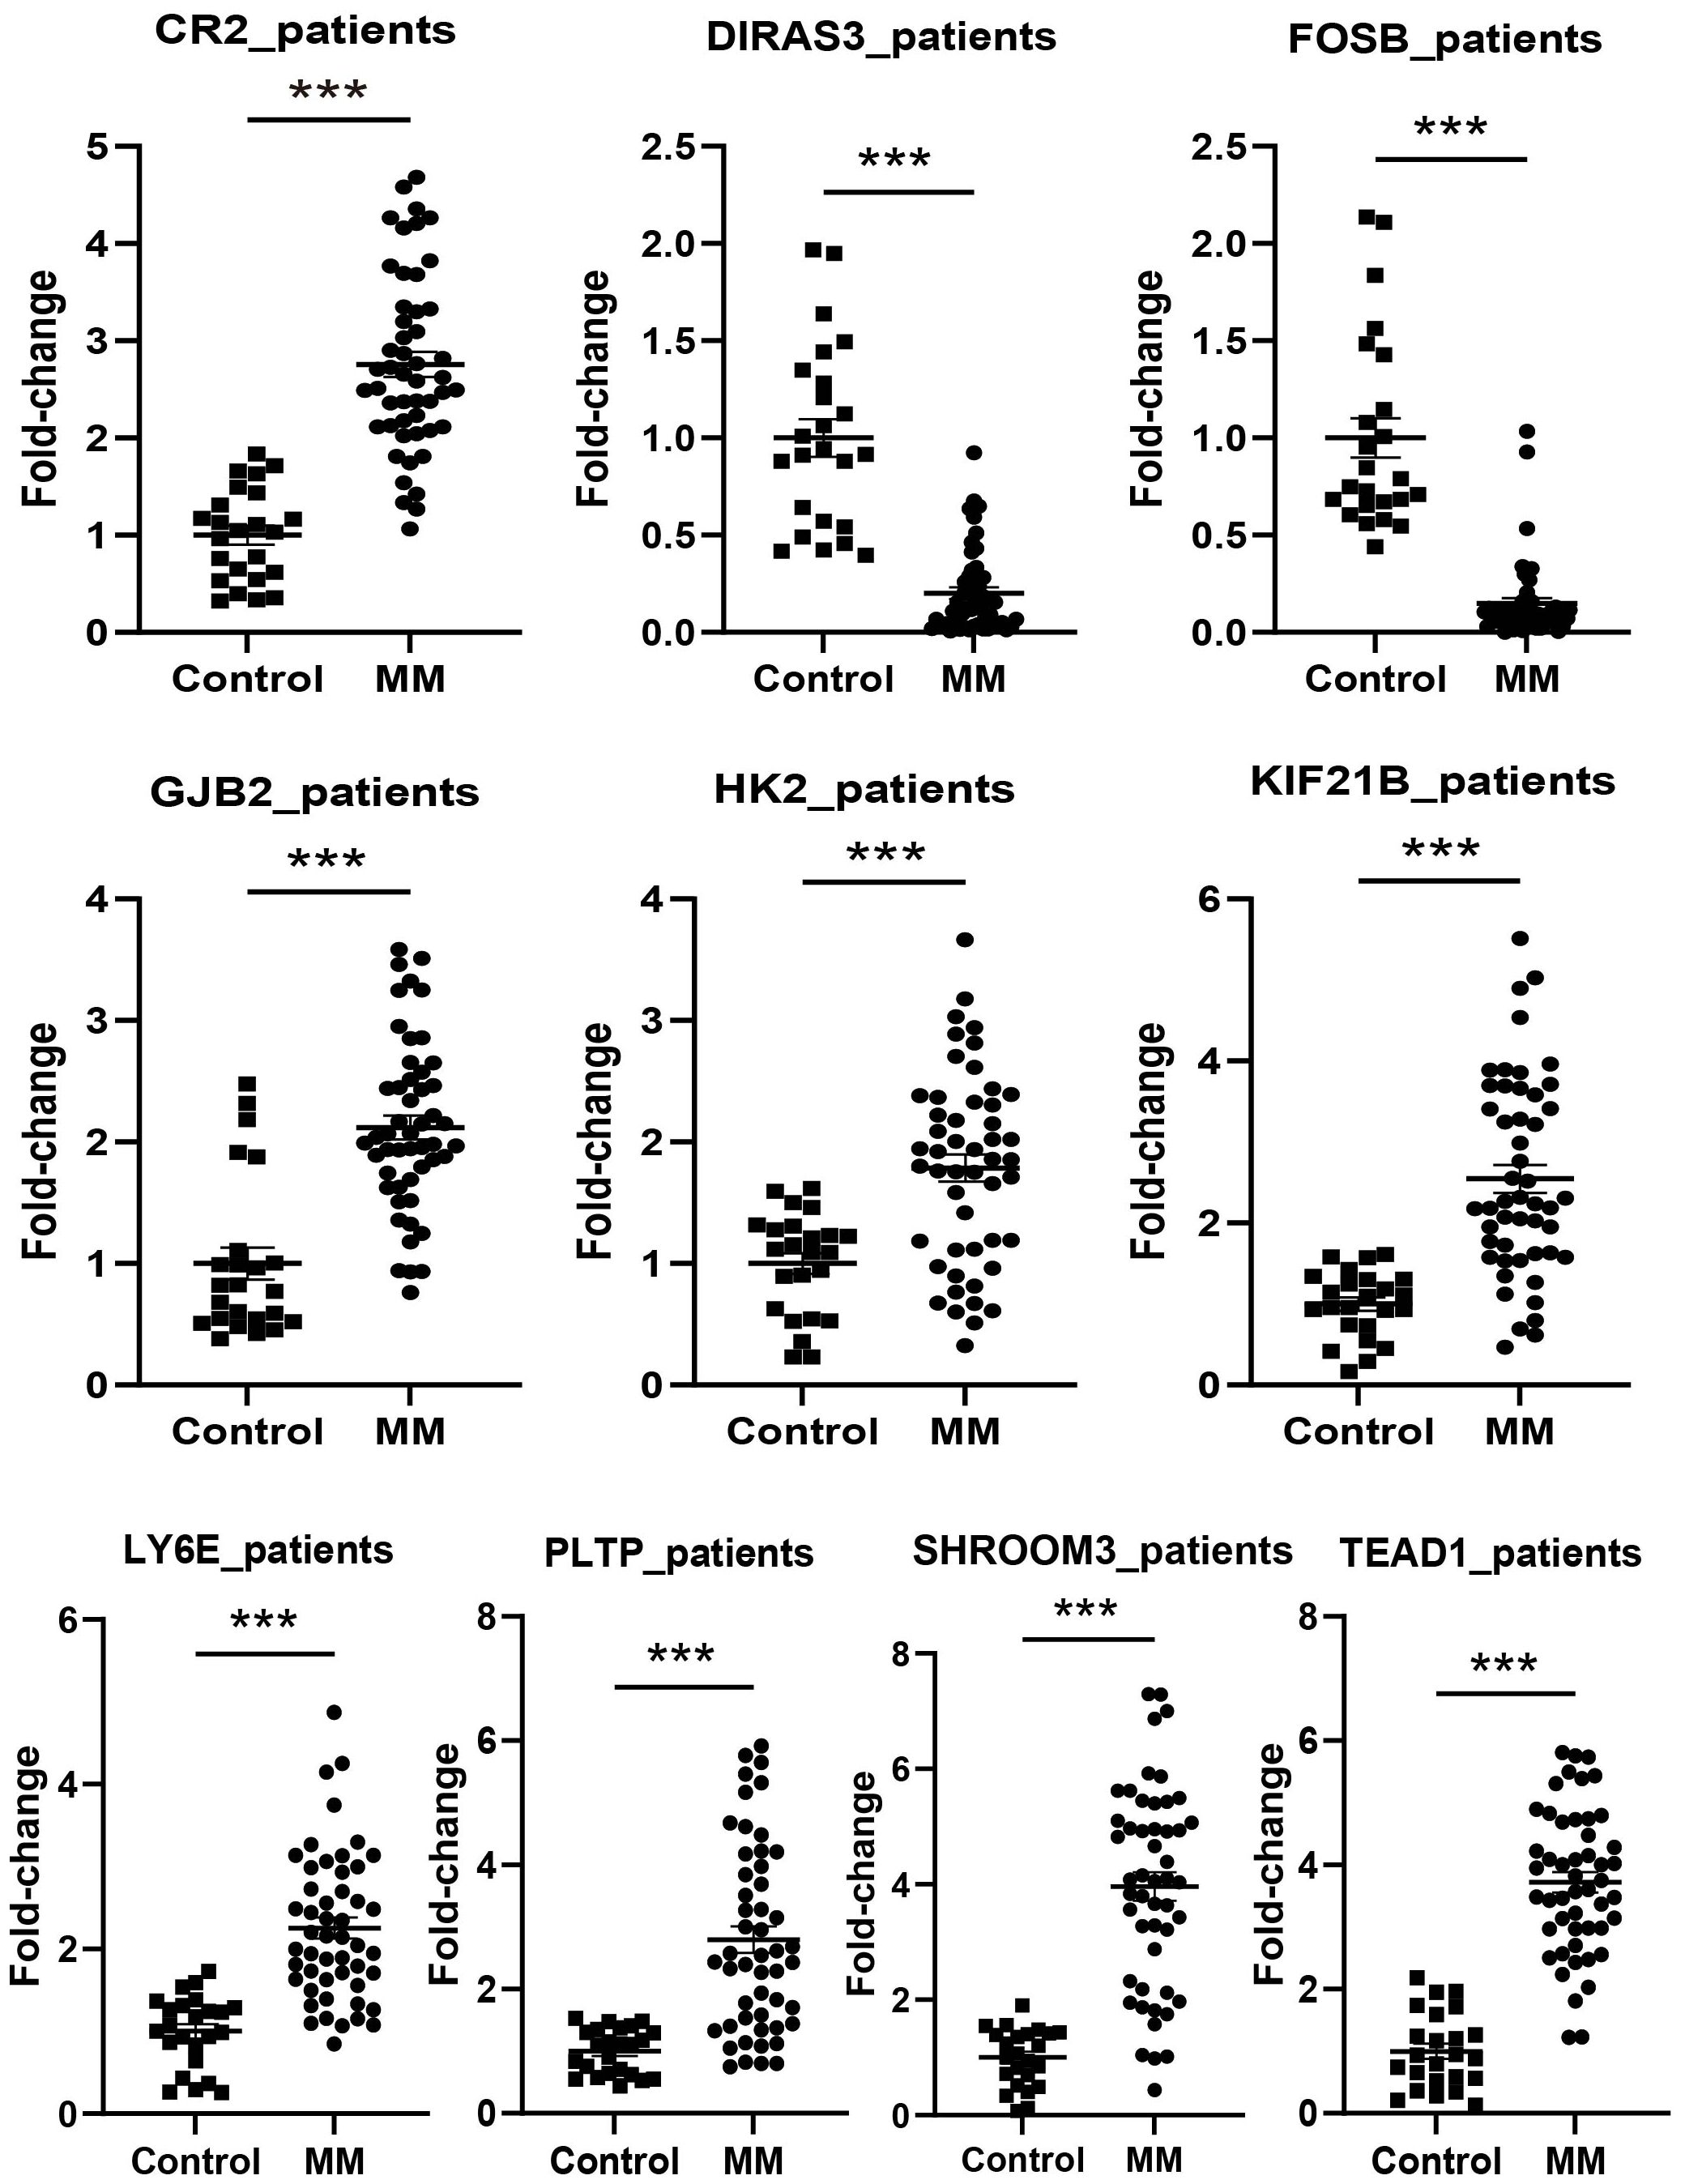
Figure 12. Experimental validation in patients (Control: n = 24, MM: n = 50). ***P < 0.001.
4 Discussion
The development of biomarkers for MM is rapidly evolving, driven by new technologies, based on a deeper understanding of the biological mechanisms of tumors, with the goal of personalized patient management. Metabolic reprogramming is the key feature of tumors, which frequently causes tumor cells to become highly dependent on particular metabolic routes. Targeting tumor metabolism has gained widespread attention in the era of precision medicine (39).
Disulfidptosis describes a novel form of programmed cell death. Under glucose deprivation, SLC7A11 dominates disulfide and ROS accumulation, mediating aberrant disulfide bond formation and F-actin collapse (10). Moreover, thiol oxidizers and GLUT inhibitors were shown to facilitate this process (10). The potential effects of disulfidptosis in cancers such as hepatocellular carcinoma (40), pancreatic ductal adenocarcinoma (41), glioblastoma (39), and gastric cancer (42) have been revealed. However, the specific role that disulfidptosis plays in MM is unclear.
In our study, we identified three subtypes based on DRGs. Liu et al. screened out the top three suppressor hits through CRISPR-Cas9: SLC7A11, SLC3A2 and RPN1 (10). These three genes play a key role in disulfidptosis. They were expressed at higher levels in C1 than in C2 and C3. The expression of SLC3A2 in C2 was higher than that in C3. Additionally, compared with C3, the upregulated pathways in C2 included ROS metabolism and actin binding, etc. All these indicate that C1 and C2 are more susceptible to the perturbation of disulfidptosis. Survival analysis showed that C2 had a worse survival outcome than C3. Such prognostic differences may be due to the enrichment of C2 in pathways such as HIF-1 signaling pathway and autophagy, its resistance to doxorubicin and lenalidomide, and its higher likelihood of T-cell dysfunction and rejection. Meanwhile, C1 has the lowest immune score and the highest level of T-cell exclusion. C1 and C2 were more likely to undergo immune escape, suggesting a poorer response to immunotherapy. However, in the future, GLUT inhibitors that promote disulfidptosis may be an effective therapeutic strategy for targeting C1 and C2.
MM, characterized by high glucose consumption, has been found to rely on multiple glucose transporters for survival (43). Multiple inhibitors can induce apoptosis and autophagy in MM cells through glucose deprivation, and reduce resistance to traditional chemotherapeutic agents such as melphalan and bortezomib (44, 45). A high synthesis rate of disulfide bond-rich proteins is another feature of MM, depending on redox balance for proper protein folding (46, 47). The upregulated Trx system in various tumors, including MM, provides a platform for clearing ROS interference in malignant plasma cells (14, 48, 49). The high expression of PDI in relapsed and refractory MM endows them with precise regulation of protein folding and further resistance to proteasome inhibitors (PIs) (17, 18, 50). Not surprisingly, both Trx inhibitors and PDI inhibitors exhibited anti-MM efficacy in vitro and in vivo, even against PI-resistant cells (14, 51–53). Actin-related genes are considered candidate driver genes for MM (54–56). Actin polymerization can mediate the homing of MM cells to the BM ecological niche and their interactions with protective components of the microenvironment, which is strongly associated with the pathogenesis, invasiveness, and drug resistance of MM (57, 58). Furthermore, several DRGs have been found to play important roles in MM. SLC3A2, which acts as an amino acid exchanger, is one of the most abundant proteins on the surface of myeloma cells (59), providing support for the secretion of copious amounts of antibodies by MM cells (60). Its knockdown prevents B cells from proliferating and differentiating into plasma cells (61). Moreover, SLC3A2 has been shown to drive mTORC1 activity in MM to increase invasiveness (62) and is a target for immunomodulatory drug activity (63). The phosphorylation of RPN1 contributes to the correct assembly of the 26S proteasome. Phosphorylation blockade results in cell growth inhibition and mitochondrial dysfunction (64). RPN1 is aberrantly activated in MM and its mediation of aberrant endoplasmic reticulum autophagy may be tied to the genesis and development of MM (65, 66). RAC1 belongs to the Ras proto-oncogene superfamily and regulates cell proliferation, cytoskeletal reorganization, and cell migration (67, 68). RAC1 is involved in the adhesion of myeloma cells in the BM, which contributes to drug resistance and invasiveness (57, 69). Next, we constructed a prognostic model based on DEGs between subtypes. In both the training and validation sets, the high-scoring group showed a worse prognosis. Similarly, the biological differences behind the distinct subgroups were mainly enriched in oxidative phosphorylation, proteasome, p53, PI3K-AKT, and JAK-STAT signaling pathways. Several studies have revealed the associations between these pathways and the pathogenesis of MM (70–76). In addition, we observed that T cells in the high-scoring subgroup microenvironment were more susceptible to rejection and had a higher likelihood of relapse.
Moreover, we performed a drug target analysis. Some predicted drugs targeting the high-risk group have already been studied in myeloma. There is evidence that paclitaxel has anti-MM stem cell action (77), and synergistically interferes with mitosis and induces apoptosis with other drugs such as dexamethasone (78, 79). In a phase II study of relapsed refractory MM, paclitaxel showed certain clinical benefits (77). Polo-like kinase inhibitor BI-2536 is a cell cycle regulator and its killing effect has been validated in MM cells and xenograft models (80, 81). The VAD regimen (vincristine, doxorubicin, and dexamethasone) is widely recognized as the standard initial induction regimen for MM. It induces early tumor load reduction and less toxicity to BM stem cells (82). Leptomycin B, an inhibitor of nuclear translocation with potent antitumor effects, was found to increase the sensitivity of myeloma cells to doxorubicin (83). The output protein inhibitors have shown the effect of inducing apoptosis in MM cells, inhibiting osteolysis, and improving survival (84, 85), and several clinical trials are underway (84). As a KSP inhibitor, SB-743921 was discovered the function of inducing MM cell death by blocking the NF-κB signaling pathway (86). It is presently being researched in clinical trials related to myeloma, leukemia, and solid tumors (87, 88). Drug-resistant MM cells have reportedly been effectively targeted by gemcitabine through its inhibition of DNA damage repair (89–91). The autologous stem-cell transplant regimen consisting of gemcitabine, busulfan, and melphalan demonstrated greater efficacy than a high-dose melphalan regimen (92). Rigosertib has been identified in both CTRP and PRISM, suggesting its great potential as a new therapeutic tool for MM. Rigosertib is a multi-kinase inhibitor, showing high potency against a wide range of tumors both in vivo and in vitro (93). It is being evaluated in several clinical trials for refractory B-cell malignancies (e.g., MM and chronic lymphocytic leukemia) (94). Although some of the predicted drugs are not standard agents in MM treatment, the above studies show their antitumor effects in MM. Our future studies will further explore the potential of these drugs in combination therapy and specific subtype-targeted therapies through in vivo and in vitro experiments.
The miRNA/TF-mRNA network was further constructed to clarify the regulatory interactions of the candidate genes. miR-193 inhibition was found to induce overexpression of the anti-regulatory protein MCL-1 in MM (95). As a well-known oncogenic cluster (96, 97), by blocking p53 and turning on the PI3K/AKT pathway, miR-25 promotes MM proliferation (98, 99). Upregulation of miR-365 was reported to inhibit myeloma cell proliferation (100). Among TFs, bromodomain-containing (BRD)-4 is a promising therapeutic target for regulating the expression of oncogenes such as MYC in multiple cancers, including MM (101). Consistent with previous drug prediction analyses, bromodomain inhibitor OTX015 has great therapeutic potential in MM with the ability to modulate NF-κB, cell cycle, EGFR, and proliferative signaling pathways (102). It shows strong antiproliferative properties in vitro MM assays, promotes osteoblast differentiation and inhibits osteoclast activity in vivo (102). Furthermore, phase I trials demonstrated the favorable anti-MM activity and safety profile of OTX015 (103, 104). Another TF, EP300, is one of the most frequently altered genes in MM chromatin regulators (105). Inhibition of EP300 BRDs leads to apoptosis, cycle arrest, and synergistic enhancement of NK cell-mediated cytotoxicity through inhibition of IRF4 and MYC (106, 107). A related inhibitor, CCS1477, is also being assessed in a clinical trial (NCT04068597, 2019-08-09) that includes MM.
In the subsequent prediction of 1-, 3-, and 5-year survival, the nomogram combining age, ISS, and risk score demonstrated higher accuracy than R-ISS and ISS in both the training and validation datasets. This reflects the potential feasibility of using disulfidptosis-related scores for survival prediction in clinical practice.
The genes that make up the prognostic model are also closely related to MM. Overexpressed in many malignancies, HK2 is a crucial enzyme that catalyzes the initial stage of glycolysis (108–110). Additionally, aberrant activation of HK2 is linked to poor outcomes and PI resistance in myeloma patients (111, 112). Targeting HK2 has emerged as a promising treatment for myeloma (113, 114). As a crucial component of the Hippo signaling pathway, TEAD1 regulates cell division, proliferation, and death (115). The cytotoxicity of carfilzomib was found to be related to a decrease in TEAD1 expression (116). KIF21B, belonging to the kinesin family, participates in the intracellular transport of membrane organelles. Its overexpression is an important feature of high-risk MM (117). Extensively and abundantly expressed in malignancies, LY6E is a GPI-anchored cell surface protein that controls T lymphocyte activation (118). It is crucial for TGF-β, PI3K/Akt signaling pathway, and HIF-1 transcription (119), and is closely associated with the progression, immune escape, stem cell-like features, and drug resistance of multiple cancers (118, 120). Currently, anti-LY6E antibodies have shown antitumor activity and acceptable safety in phase I trials of refractory malignant tumors (NCT02092792) (121). GJB2 has been found a supportive role as a junction protein in acute myeloid leukemia, potentially linked to development and chemotherapy sensitivity (122, 123). Encoding lipid transfer proteins, PLTP is important in tumor growth (124–126). The type 2 complement receptor (CR2) has recently been redefined as an inhibitory co-receptor that mediates the inhibition of human B lymphocyte function, including the release of cytokines and antibodies (127). SHROOM3 is crucial for regulating cytoskeletal proteins and has been identified as a novel coding variant in high-risk neuroblastoma (128). DIRAS3, which encodes a tumor suppressor factor, can mediate the inhibition of cell growth and malignant transformation (129). Furthermore, MM endothelial cells exhibit suppressed DIRAS3 expression, which may be related to their high-risk excessive angiogenesis phenotype (130). FOSB is considered a regulatory factor for cell proliferation, differentiation, and transformation. Research has demonstrated that the BM microenvironment can assist MM cell survival by inhibiting FOSB (131).
Our study still has several limitations. Firstly, additional validation of our model in a larger multicenter population is required. The prognostic value of the model in our clinical samples needs to be evaluated in subsequent studies. Second, given the limited number of MM datasets in public databases, the selected validation sets lacked important clinical information such as R-ISS. Future studies should focus on multicenter data integration and exploration of new prognostic markers to further enhance the clinical value of the model. Finally, it is necessary to improve experiments based on more samples and mechanisms in the future.
Conclusion
Our investigation explored the heterogeneity of MM by identifying subgroups with different prognoses based on disulfidptosis. The disulfidptosis-related feature is significant for predicting the survival and treatment responsiveness of MM. Disulfidptosis is expected to become a new tool of risk stratification and personalized targeted therapy for MM.
Data availability statement
The data presented in this study are deposited in the GEO database repository, with accession numbers GSE136337, GSE24080 and GSE4204.
Ethics statement
The studies involving humans were approved by the Ethics Committee in Clinical Research of the First Affiliated Hospital of Wenzhou Medical University. The studies were conducted in accordance with the local legislation and institutional requirements. The participants provided their written informed consent to participate in this study. Written informed consent was obtained from the individual(s) for the publication of any potentially identifiable images or data included in this article.
Author contributions
BZ: Formal Analysis, Investigation, Visualization, Writing – original draft. DZ: Data curation, Writing – original draft. SZhu: Data curation, Writing – original draft. XZ: Writing – original draft, Data curation. QW: Writing – original draft, Data curation. ZL: Data curation, Writing – original draft. ZZ: Data curation, Writing – original draft. SZho: Resources, Writing – review & editing. ZC: Writing – original draft. SZhe: Writing – original draft, Data curation. EL: Writing – original draft. LC: Writing – original draft. HY: Writing – original draft. YuZ: Resources, Writing – review & editing. XL: Resources, Writing – review & editing. QZhu: Resources, Writing – review & editing. HQ: Resources, Writing – review & editing. XH: Resources, Writing – review & editing. YaZ: Resources, Writing – review & editing. QZha: Resources, Writing – review & editing. ZJ: Supervision, Writing – review & editing. SJ: Resources, Supervision, Writing – review & editing. YM: Conceptualization, Funding acquisition, Resources, Supervision, Writing – review & editing.
Funding
The author(s) declare that financial support was received for the research and/or publication of this article. This study was granted by the National Natural Science Foundation (No. 82270212), the Natural Science Foundation of Zhejiang province (No. LY20H080003), the Wenzhou Municipal Science and Technology Bureau (No. Y20220716), and the Discipline Cluster of Oncology, Wenzhou Medical University, China (No. z2-2023023).
Conflict of interest
The authors declare that the research was conducted in the absence of any commercial or financial relationships that could be construed as a potential conflict of interest.
Generative AI statement
The author(s) declare that no Generative AI was used in the creation of this manuscript.
Publisher’s note
All claims expressed in this article are solely those of the authors and do not necessarily represent those of their affiliated organizations, or those of the publisher, the editors and the reviewers. Any product that may be evaluated in this article, or claim that may be made by its manufacturer, is not guaranteed or endorsed by the publisher.
Supplementary material
The Supplementary Material for this article can be found online at: https://www.frontiersin.org/articles/10.3389/fimmu.2025.1559317/full#supplementary-material
Abbreviations
MM, Multiple myeloma; ISS, International Staging System; β2-MG, β2-microglobulin; R-ISS, revised ISS; LDH, lactate dehydrogenase; Trx, thioredoxin; PDI, protein disulfide isomerase; BM, bone marrow; GEO, the Gene Expression Omnibus; DRGs, disulfidptosis-related genes; NMF, non-negative matrix factorization; PCA, Principal component analysis; DEGs, differentially expressed genes; GO, the Gene Ontology; KEGG, the Kyoto Encyclopedia of Genes and Genomes; AUC, area under the curve; GSEA, Gene Set Enrichment Analysis; CTRP, Cancer Therapeutics Response Portal; TFs, transcription factors; ssGSEA, single-sample gene set enrichment analysis; TIDE, tumor immune dysfunction and exclusion; ICB, immune checkpoint blockade; IPS, immunophenotype score; MHC, antigen presentation; EC, effector cells; SC, suppressor cells; CP, checkpoint markers; AZ, z-score; mRNAsi, mRNA expression-based stemness index; PIs, proteasome inhibitors; BRD, bromodomain containing.
References
1. Cowan AJ, Green DJ, Kwok M, Lee S, Coffey DG, Holmberg LA, et al. Diagnosis and management of multiple myeloma: A review. JAMA. (2022) 327:464–77. doi: 10.1001/jama.2022.0003
2. Rodriguez-Otero P, Paiva B, San-Miguel JF. Roadmap to cure multiple myeloma. Cancer Treat Rev. (2021) 100:102284. doi: 10.1016/j.ctrv.2021.102284
3. Sonneveld P, Avet-Loiseau H, Lonial S, Usmani S, Siegel D, Anderson KC, et al. Treatment of multiple myeloma with high-risk cytogenetics: A consensus of the international myeloma working group. Blood. (2016) 127:2955–62. doi: 10.1182/blood-2016-01-631200
4. Pawlyn C, Davies FE. Toward personalized treatment in multiple myeloma based on molecular characteristics. Blood. (2019) 133:660–75. doi: 10.1182/blood-2018-09-825331
5. Palumbo A, Avet-Loiseau H, Oliva S, Lokhorst HM, Goldschmidt H, Rosinol L, et al. Revised international staging system for multiple myeloma: A report from international myeloma working group. J Clin Oncol. (2015) 33:2863–9. doi: 10.1200/JCO.2015.61.2267
6. Cho H, Yoon DH, Lee JB, Kim SY, Moon JH, Do YR, et al. Comprehensive evaluation of the revised international staging system in multiple myeloma patients treated with novel agents as a primary therapy. Am J Hematol. (2017) 92:1280–6. doi: 10.1002/ajh.24891
7. Bloedjes TA, de Wilde G, Guikema JEJ. Metabolic effects of recurrent genetic aberrations in multiple myeloma. Cancers (Basel). (2021) 13:396. doi: 10.3390/cancers13030396
8. Pavlova NN, Thompson CB. The emerging hallmarks of cancer metabolism. Cell Metab. (2016) 23:27–47. doi: 10.1016/j.cmet.2015.12.006
9. Kroemer G, Pouyssegur J. Tumor cell metabolism: cancer’s achilles’ Heel. Cancer Cell. (2008) 13:472–82. doi: 10.1016/j.ccr.2008.05.005
10. Liu X, Nie L, Zhang Y, Yan Y, Wang C, Colic M, et al. Actin cytoskeleton vulnerability to disulfide stress mediates disulfidptosis. Nat Cell Biol. (2023) 25:404–14. doi: 10.1038/s41556-023-01091-2
11. Gupte A, Mumper RJ. Elevated copper and oxidative stress in cancer cells as a target for cancer treatment. Cancer Treat Rev. (2009) 35:32–46. doi: 10.1016/j.ctrv.2008.07.004
12. Sharma A, Tripathi M, Satyam A, Kumar L. Study of antioxidant levels in patients with multiple myeloma. Leuk Lymphoma. (2009) 50:809–15. doi: 10.1080/10428190902802323
13. Masciarelli S, Sitia R. Building and operating an antibody factory: redox control during B to plasma cell terminal differentiation. Biochim Biophys Acta. (2008) 1783:578–88. doi: 10.1016/j.bbamcr.2008.01.003
14. Raninga PV, Di Trapani G, Vuckovic S, Bhatia M, Tonissen KF. Inhibition of thioredoxin 1 leads to apoptosis in drug-resistant multiple myeloma. Oncotarget. (2015) 6:15410–24. doi: 10.18632/oncotarget.3795
15. Fonseca R, Bergsagel PL, Drach J, Shaughnessy J, Gutierrez N, Stewart AK, et al. International myeloma working group molecular classification of multiple myeloma: spotlight review. Leukemia. (2009) 23:2210–21. doi: 10.1038/leu.2009.174
16. Ribatti D. Edelman’s view on the discovery of antibodies. Immunol Lett. (2015) 164:72–5. doi: 10.1016/j.imlet.2015.02.005
17. Freedman RB, Hirst TR, Tuite MF. Protein disulphide isomerase: building bridges in protein folding. Trends Biochem Sci. (1994) 19:331–6. doi: 10.1016/0968-0004(94)90072-8
18. Kersteen EA, Raines RT. Catalysis of protein folding by protein disulfide isomerase and small-molecule mimics. Antioxid Redox Signal. (2003) 5:413–24. doi: 10.1089/152308603768295159
19. Tsvetkov P, Coy S, Petrova B, Dreishpoon M, Verma A, Abdusamad M, et al. Copper induces cell death by targeting lipoylated tca cycle proteins. Science. (2022) 375:1254–61. doi: 10.1126/science.abf0529
20. Szklarczyk D, Franceschini A, Kuhn M, Simonovic M, Roth A, Minguez P, et al. The string database in 2011: functional interaction networks of proteins, globally integrated and scored. Nucleic Acids Res. (2011) 39:D561–8. doi: 10.1093/nar/gkq973
21. Liu CJ, Hu FF, Xie GY, Miao YR, Li XW, Zeng Y, et al. Gsca: an integrated platform for gene set cancer analysis at genomic, pharmacogenomic and immunogenomic levels. Brief Bioinform. (2023) 24:bbac558. doi: 10.1093/bib/bbac558
22. Brunet JP, Tamayo P, Golub TR, Mesirov JP. Metagenes and molecular pattern discovery using matrix factorization. Proc Natl Acad Sci U.S.A. (2004) 101:4164–9. doi: 10.1073/pnas.0308531101
23. Gaujoux R, Seoighe C. A flexible R package for nonnegative matrix factorization. BMC Bioinf. (2010) 11:367. doi: 10.1186/1471-2105-11-367
24. Li D, Li M, Zhuo Z, Guo H, Zhang W, Xu Y, et al. Edf1 accelerates ganglioside gd3 accumulation to boost cd52-mediated cd8(+) T cell dysfunction in neuroblastoma. J Exp Clin Cancer Res. (2025) 44:36. doi: 10.1186/s13046-025-03307-9
25. Shao J, Zhao T, Liu J, Kang P. Targeting liver cancer stem cells: the prognostic significance of mrpl17 in immunotherapy response. Front Immunol. (2024) 15:1519324. doi: 10.3389/fimmu.2024.1519324
26. Chen G, Zhang G, Zhu Y, Wu A, Fang J, Yin Z, et al. Identifying disulfidptosis subtypes in hepatocellular carcinoma through machine learning and preliminary exploration of its connection with immunotherapy. Cancer Cell Int. (2024) 24:194. doi: 10.1186/s12935-024-03387-1
27. Friedman J, Hastie T, Tibshirani R. Regularization paths for generalized linear models via coordinate descent. J Stat Softw. (2010) 33:1–22. doi: 10.18637/jss.v033.i01
28. Wishart DS, Feunang YD, Guo AC, Lo EJ, Marcu A, Grant JR, et al. Drugbank 5.0: A major update to the drugbank database for 2018. Nucleic Acids Res. (2018) 46:D1074–D82. doi: 10.1093/nar/gkx1037
29. Rees MG, Seashore-Ludlow B, Cheah JH, Adams DJ, Price EV, Gill S, et al. Correlating chemical sensitivity and basal gene expression reveals mechanism of action. Nat Chem Biol. (2016) 12:109–16. doi: 10.1038/nchembio.1986
30. Corsello SM, Nagari RT, Spangler RD, Rossen J, Kocak M, Bryan JG, et al. Discovering the anti-cancer potential of non-oncology drugs by systematic viability profiling. Nat Cancer. (2020) 1:235–48. doi: 10.1038/s43018-019-0018-6
31. Yang C, Chen J, Li Y, Huang X, Liu Z, Wang J, et al. Exploring subclass-specific therapeutic agents for hepatocellular carcinoma by informatics-guided drug screen. Brief Bioinform. (2021) 22:bbaa295. doi: 10.1093/bib/bbaa295
32. Aran D. Cell-type enrichment analysis of bulk transcriptomes using xcell. Methods Mol Biol. (2020) 2120:263–76. doi: 10.1007/978-1-0716-0327-7_19
33. Jiang P, Gu S, Pan D, Fu J, Sahu A, Hu X, et al. Signatures of T cell dysfunction and exclusion predict cancer immunotherapy response. Nat Med. (2018) 24:1550–8. doi: 10.1038/s41591-018-0136-1
34. Charoentong P, Finotello F, Angelova M, Mayer C, Efremova M, Rieder D, et al. Pan-cancer immunogenomic analyses reveal genotype-immunophenotype relationships and predictors of response to checkpoint blockade. Cell Rep. (2017) 18:248–62. doi: 10.1016/j.celrep.2016.12.019
35. Thorsson V, Gibbs DL, Brown SD, Wolf D, Bortone DS, Ou Yang TH, et al. The immune landscape of cancer. Immunity. (2018) 48:812–30.e14. doi: 10.1016/j.immuni.2018.03.023
36. Malta TM, Sokolov A, Gentles AJ, Burzykowski T, Poisson L, Weinstein JN, et al. Machine learning identifies stemness features associated with oncogenic dedifferentiation. Cell. (2018) 173:338–54.e15. doi: 10.1016/j.cell.2018.03.034
37. Blanche P, Dartigues JF, Jacqmin-Gadda H. Estimating and comparing time-dependent areas under receiver operating characteristic curves for censored event times with competing risks. Stat Med. (2013) 32:5381–97. doi: 10.1002/sim.5958
38. Livak KJ, Schmittgen TD. Analysis of relative gene expression data using real-time quantitative pcr and the 2(-delta delta C(T)) method. Methods. (2001) 25:402–8. doi: 10.1006/meth.2001.1262
39. Stine ZE, Schug ZT, Salvino JM, Dang CV. Targeting cancer metabolism in the era of precision oncology. Nat Rev Drug Discovery. (2022) 21:141–62. doi: 10.1038/s41573-021-00339-6
40. Shi M, Li X, Guo Y, Zhang Y, Xu J, Yan L, et al. Gaudichaudione H enhances the sensitivity of hepatocellular carcinoma cells to disulfidptosis via regulating nrf2-slc7a11 signaling pathway. Adv Sci (Weinh). (2025) 12:e2411131. doi: 10.1002/advs.202411131
41. Yao HF, Ge J, Chen J, Tang X, Li C, Hu X, et al. Casc8 activates the pentose phosphate pathway to inhibit disulfidptosis in pancreatic ductal adenocarcinoma though the C-myc-glut1 axis. J Exp Clin Cancer Res. (2025) 44:26. doi: 10.1186/s13046-025-03295-w
42. Zhang H, Hu J, Li Y, Liu Y, Shen H, Wang Z, et al. Comprehensive analysis and experimental validation of disulfidptosis-associated prognostic signature and immune microenvironment characterization of gastric cancer. Cancer Immunol Immunother. (2025) 74:116. doi: 10.1007/s00262-024-03883-3
43. Wei C, Bajpai R, Sharma H, Heitmeier M, Jain AD, Matulis SM, et al. Development of glut4-selective antagonists for multiple myeloma therapy. Eur J Med Chem. (2017) 139:573–86. doi: 10.1016/j.ejmech.2017.08.029
44. Ramani P, Headford A, May MT. Glut1 protein expression correlates with unfavourable histologic category and high risk in patients with neuroblastic tumours. Virchows Arch. (2013) 462:203–9. doi: 10.1007/s00428-012-1370-4
45. Matsumoto T, Jimi S, Migita K, Takamatsu Y, Hara S. Inhibition of glucose transporter 1 induces apoptosis and sensitizes multiple myeloma cells to conventional chemotherapeutic agents. Leuk Res. (2016) 41:103–10. doi: 10.1016/j.leukres.2015.12.008
46. Zhang J, Ye ZW, Chen W, Culpepper J, Jiang H, Ball LE, et al. Altered redox regulation and S-glutathionylation of bip contribute to bortezomib resistance in multiple myeloma. Free Radic Biol Med. (2020) 160:755–67. doi: 10.1016/j.freeradbiomed.2020.09.013
47. Vincenz L, Jager R, O’Dwyer M, Samali A. Endoplasmic reticulum stress and the unfolded protein response: targeting the achilles heel of multiple myeloma. Mol Cancer Ther. (2013) 12:831–43. doi: 10.1158/1535-7163.MCT-12-0782
48. Lincoln DT, Ali Emadi EM, Tonissen KF, Clarke FM. The thioredoxin-thioredoxin reductase system: over-expression in human cancer. Anticancer Res. (2003) 23:2425–33.
49. Kim SJ, Miyoshi Y, Taguchi T, Tamaki Y, Nakamura H, Yodoi J, et al. High thioredoxin expression is associated with resistance to docetaxel in primary breast cancer. Clin Cancer Res. (2005) 11:8425–30. doi: 10.1158/1078-0432.CCR-05-0449
50. Hasipek M, Grabowski D, Guan Y, Alugubelli RR, Tiwari AD, Gu X, et al. Therapeutic targeting of protein disulfide isomerase pdia1 in multiple myeloma. Cancers (Basel). (2021) 13:2649. doi: 10.3390/cancers13112649
51. Lin QD, Liu LN, Liu XY, Yan Y, Fang BJ, Zhang YL, et al. Experimental study on thioredoxin redox inhibitor 1-methylpropyl 2-imidazolyl disulfide promoting apoptosis of multiple myeloma cells in vitro and in vivo. Eur Rev Med Pharmacol Sci. (2022) 26:1283–92. doi: 10.26355/eurrev_202202_28121
52. Robinson RM, Basar AP, Reyes L, Duncan RM, Li H, Dolloff NG. Pdi inhibitor lti6426 enhances panobinostat efficacy in preclinical models of multiple myeloma. Cancer Chemother Pharmacol. (2022) 89:643–53. doi: 10.1007/s00280-022-04425-3
53. Robinson RM, Reyes L, Duncan RM, Bian H, Strobel ED, Hyman SL, et al. Tuning isoform selectivity and bortezomib sensitivity with a new class of alkenyl indene pdi inhibitor. Eur J Med Chem. (2020) 186:111906. doi: 10.1016/j.ejmech.2019.111906
54. Lohr JG, Stojanov P, Carter SL, Cruz-Gordillo P, Lawrence MS, Auclair D, et al. Widespread genetic heterogeneity in multiple myeloma: implications for targeted therapy. Cancer Cell. (2014) 25:91–101. doi: 10.1016/j.ccr.2013.12.015
55. Walker BA, Mavrommatis K, Wardell CP, Ashby TC, Bauer M, Davies FE, et al. Identification of novel mutational drivers reveals oncogene dependencies in multiple myeloma. Blood. (2018) 132:587–97. doi: 10.1182/blood-2018-03-840132
56. Maura F, Bolli N, Angelopoulos N, Dawson KJ, Leongamornlert D, Martincorena I, et al. Genomic landscape and chronological reconstruction of driver events in multiple myeloma. Nat Commun. (2019) 10:3835. doi: 10.1038/s41467-019-11680-1
57. Azab AK, Azab F, Blotta S, Pitsillides CM, Thompson B, Runnels JM, et al. Rhoa and rac1 gtpases play major and differential roles in stromal cell-derived factor-1-induced cell adhesion and chemotaxis in multiple myeloma. Blood. (2009) 114:619–29. doi: 10.1182/blood-2009-01-199281
58. Parmo-Cabanas M, Bartolome RA, Wright N, Hidalgo A, Drager AM, Teixido J. Integrin alpha4beta1 involvement in stromal cell-derived factor-1alpha-promoted myeloma cell transendothelial migration and adhesion: role of camp and the actin cytoskeleton in adhesion. Exp Cell Res. (2004) 294:571–80. doi: 10.1016/j.yexcr.2003.12.003
59. Ferguson ID, Patino-Escobar B, Tuomivaara ST, Lin YT, Nix MA, Leung KK, et al. The surfaceome of multiple myeloma cells suggests potential immunotherapeutic strategies and protein markers of drug resistance. Nat Commun. (2022) 13:4121. doi: 10.1038/s41467-022-31810-6
60. Boothby M, Rickert RC. Metabolic regulation of the immune humoral response. Immunity. (2017) 46:743–55. doi: 10.1016/j.immuni.2017.04.009
61. Cantor J, Browne CD, Ruppert R, Feral CC, Fassler R, Rickert RC, et al. Cd98hc facilitates B cell proliferation and adaptive humoral immunity. Nat Immunol. (2009) 10:412–9. doi: 10.1038/ni.1712
62. Yang Y, Bolomsky A, Oellerich T, Chen P, Ceribelli M, Haupl B, et al. Oncogenic ras commandeers amino acid sensing machinery to aberrantly activate mtorc1 in multiple myeloma. Nat Commun. (2022) 13:5469. doi: 10.1038/s41467-022-33142-x
63. Heider M, Eichner R, Stroh J, Morath V, Kuisl A, Zecha J, et al. The imid target crbn determines hsp90 activity toward transmembrane proteins essential in multiple myeloma. Mol Cell. (2021) 81:1170–86 e10. doi: 10.1016/j.molcel.2020.12.046
64. Liu X, Xiao W, Zhang Y, Wiley SE, Zuo T, Zheng Y, et al. Reversible phosphorylation of rpn1 regulates 26s proteasome assembly and function. Proc Natl Acad Sci U.S.A. (2020) 117:328–36. doi: 10.1073/pnas.1912531117
65. Zhao S, Mo X, Wen Z, Ren L, Chen Z, Lin W, et al. Comprehensive bioinformatics analysis reveals the hub genes and pathways associated with multiple myeloma. Hematology. (2022) 27:280–92. doi: 10.1080/16078454.2022.2040123
66. Chojnacki M, Mansour W, Hameed DS, Singh RK, El Oualid F, Rosenzweig R, et al. Polyubiquitin-photoactivatable crosslinking reagents for mapping ubiquitin interactome identify rpn1 as a proteasome ubiquitin-associating subunit. Cell Chem Biol. (2017) 24:443–57.e6. doi: 10.1016/j.chembiol.2017.02.013
67. Etienne-Manneville S, Hall A. Rho gtpases in cell biology. Nature. (2002) 420:629–35. doi: 10.1038/nature01148
68. Boureux A, Vignal E, Fort P. Evolution of the rho family of ras-like gtpases in eukaryotes. Mol Biol Evol. (2007) 24:203–16. doi: 10.1093/molbev/msl145
69. Martinez-Moreno M, Leiva M, Aguilera-Montilla N, Sevilla-Movilla S, Isern de Val S, Arellano-Sanchez N, et al. In vivo adhesion of Malignant B cells to bone marrow microvasculature is regulated by alpha4beta1 cytoplasmic-binding proteins. Leukemia. (2016) 30:861–72. doi: 10.1038/leu.2015.332
70. Ogiya D, Liu J, Ohguchi H, Kurata K, Samur MK, Tai YT, et al. The jak-stat pathway regulates cd38 on myeloma cells in the bone marrow microenvironment: therapeutic implications. Blood. (2020) 136:2334–45. doi: 10.1182/blood.2019004332
71. Zollinger A, Stuhmer T, Chatterjee M, Gattenlohner S, Haralambieva E, Muller-Hermelink HK, et al. Combined functional and molecular analysis of tumor cell signaling defines 2 distinct myeloma subgroups: akt-dependent and akt-independent multiple myeloma. Blood. (2008) 112:3403–11. doi: 10.1182/blood-2007-11-119362
72. Hsu JH, Shi Y, Hu L, Fisher M, Franke TF, Lichtenstein A. Role of the akt kinase in expansion of multiple myeloma clones: effects on cytokine-dependent proliferative and survival responses. Oncogene. (2002) 21:1391–400. doi: 10.1038/sj.onc.1205194
73. Abdi J, Rastgoo N, Li L, Chen W, Chang H. Role of tumor suppressor P53 and micro-rna interplay in multiple myeloma pathogenesis. J Hematol Oncol. (2017) 10:169. doi: 10.1186/s13045-017-0538-4
74. Feng X, Guo J, An G, Wu Y, Liu Z, Meng B, et al. Genetic aberrations and interaction of nek2 and tp53 accelerate aggressiveness of multiple myeloma. Adv Sci (Weinh). (2022) 9:e2104491. doi: 10.1002/advs.202104491
75. Gandolfi S, Laubach JP, Hideshima T, Chauhan D, Anderson KC, Richardson PG. The proteasome and proteasome inhibitors in multiple myeloma. Cancer Metastasis Rev. (2017) 36:561–84. doi: 10.1007/s10555-017-9707-8
76. Evans LA, Anderson EA, Jessen E, Nandakumar B, Atilgan E, Jevremovic D, et al. Overexpression of the energy metabolism transcriptome within clonal plasma cells is associated with the pathogenesis and outcomes of patients with multiple myeloma. Am J Hematol. (2022) 97:895–902. doi: 10.1002/ajh.26577
77. Jain T, Dueck AC, Kosiorek HE, Ginos BF, Mayo A, Reeder CB, et al. Phase ii trial of nab-paclitaxel in patients with relapsed or refractory multiple myeloma. Am J Hematol. (2016) 91:E504–E5. doi: 10.1002/ajh.24548
78. Kroning R, Lichtenstein A. Taxol can induce phosphorylation of bcl-2 in multiple myeloma cells and potentiate dexamethasone-induced apoptosis. Leuk Res. (1998) 22:275–86. doi: 10.1016/s0145-2126(97)00170-7
79. Zhu K, Gerbino E, Beaupre DM, Mackley PA, Muro-Cacho C, Beam C, et al. Farnesyltransferase inhibitor R115777 (Zarnestra, tipifarnib) synergizes with paclitaxel to induce apoptosis and mitotic arrest and to inhibit tumor growth of multiple myeloma cells. Blood. (2005) 105:4759–66. doi: 10.1182/blood-2004-11-4307
80. Stewart HJ, Kishikova L, Powell FL, Wheatley SP, Chevassut TJ. The polo-like kinase inhibitor bi 2536 exhibits potent activity against Malignant plasma cells and represents a novel therapy in multiple myeloma. Exp Hematol. (2011) 39:330–8. doi: 10.1016/j.exphem.2010.12.006
81. Evans RP, Dueck G, Sidhu R, Ghosh S, Toman I, Loree J, et al. Expression, adverse prognostic significance and therapeutic small molecule inhibition of polo-like kinase 1 in multiple myeloma. Leuk Res. (2011) 35:1637–43. doi: 10.1016/j.leukres.2011.07.016
82. Zervas K, Dimopoulos MA, Hatzicharissi E, Anagnostopoulos A, Papaioannou M, Mitsouli C, et al. Primary treatment of multiple myeloma with thalidomide, vincristine, liposomal doxorubicin and dexamethasone (T-vad doxil): A phase ii multicenter study. Ann Oncol. (2004) 15:134–8. doi: 10.1093/annonc/mdh026
83. Turner JG, Marchion DC, Dawson JL, Emmons MF, Hazlehurst LA, Washausen P, et al. Human multiple myeloma cells are sensitized to topoisomerase ii inhibitors by crm1 inhibition. Cancer Res. (2009) 69:6899–905. doi: 10.1158/0008-5472.CAN-09-0484
84. Mahipal A, Malafa M. Importins and exportins as therapeutic targets in cancer. Pharmacol Ther. (2016) 164:135–43. doi: 10.1016/j.pharmthera.2016.03.020
85. Sakakibara K, Saito N, Sato T, Suzuki A, Hasegawa Y, Friedman JM, et al. Cbs9106 is a novel reversible oral crm1 inhibitor with crm1 degrading activity. Blood. (2011) 118:3922–31. doi: 10.1182/blood-2011-01-333138
86. Song IS, Jeong YJ, Nyamaa B, Jeong SH, Kim HK, Kim N, et al. Ksp inhibitor sb743921 induces death of multiple myeloma cells via inhibition of the nf-kappab signaling pathway. BMB Rep. (2015) 48:571–6. doi: 10.5483/bmbrep.2015.48.10.015
87. Talapatra SK, Anthony NG, Mackay SP, Kozielski F. Mitotic kinesin eg5 overcomes inhibition to the phase I/ii clinical candidate sb743921 by an allosteric resistance mechanism. J Med Chem. (2013) 56:6317–29. doi: 10.1021/jm4006274
88. Yin Y, Sun H, Xu J, Xiao F, Wang H, Yang Y, et al. Kinesin spindle protein inhibitor sb743921 induces mitotic arrest and apoptosis and overcomes imatinib resistance of chronic myeloid leukemia cells. Leuk Lymphoma. (2015) 56:1813–20. doi: 10.3109/10428194.2014.956319
89. Nieto Y, Thall P, Valdez B, Andersson B, Popat U, Anderlini P, et al. High-dose infusional gemcitabine combined with busulfan and melphalan with autologous stem-cell transplantation in patients with refractory lymphoid Malignancies. Biol Blood Marrow Transplant. (2012) 18:1677–86. doi: 10.1016/j.bbmt.2012.05.011
90. Gruber J, Geisen F, Sgonc R, Egle A, Villunger A, Boeck G, et al. 2’,2’-difluorodeoxycytidine (Gemcitabine) induces apoptosis in myeloma cell lines resistant to steroids and 2-chlorodeoxyadenosine (2-cda). Stem Cells. (1996) 14:351–62. doi: 10.1002/stem.140351
91. Weick JK, Crowley JJ, Hussein MA, Moore DF, Barlogie B, Southwest Oncology G. The evaluation of gemcitabine in resistant or relapsing multiple myeloma, phase ii: A southwest oncology group study. Invest New Drugs. (2002) 20:117–21. doi: 10.1023/a:1014493007347
92. Nieto Y, Valdez BC, Pingali SR, Bassett R, Delgado R, Nguyen J, et al. High-dose gemcitabine, busulfan, and melphalan for autologous stem-cell transplant in patients with relapsed or refractory myeloma: A phase 2 trial and matched-pair comparison with melphalan. Lancet Haematol. (2017) 4:e283–e92. doi: 10.1016/S2352-3026(17)30080-7
93. Monfort-Vengut A, de Carcer G. Lights and shadows on the cancer multi-target inhibitor rigosertib (on-01910.Na). Pharmaceutics. (2023) 15:1232. doi: 10.3390/pharmaceutics15041232
94. Roschewski M, Farooqui M, Aue G, Wilhelm F, Wiestner A. Phase I study of on 01910.Na (Rigosertib), a multikinase pi3k inhibitor in relapsed/refractory B-cell Malignancies. Leukemia. (2013) 27:1920–3. doi: 10.1038/leu.2013.79
95. Algarin EM, Quwaider D, Campos-Laborie FJ, Diaz-Tejedor A, Mogollon P, Vuelta E, et al. Stroma-mediated resistance to S63845 and venetoclax through mcl-1 and bcl-2 expression changes induced by mir-193b-3p and mir-21-5p dysregulation in multiple myeloma. Cells. (2021) 10:559. doi: 10.3390/cells10030559
96. Mehlich D, Garbicz F, Wlodarski PK. The emerging roles of the polycistronic mir-106b approximately 25 cluster in cancer - a comprehensive review. BioMed Pharmacother. (2018) 107:1183–95. doi: 10.1016/j.biopha.2018.08.097
97. Guarnieri AL, Towers CG, Drasin DJ, Oliphant MUJ, Andrysik Z, Hotz TJ, et al. The mir-106b-25 cluster mediates breast tumor initiation through activation of notch1 via direct repression of nedd4l. Oncogene. (2018) 37:3879–93. doi: 10.1038/s41388-018-0239-7
98. Zi Y, Zhang Y, Wu Y, Zhang L, Yang R, Huang Y. Downregulation of microrna−25−3p inhibits the proliferation and promotes the apoptosis of multiple myeloma cells via targeting the pten/pi3k/akt signaling pathway. Int J Mol Med. (2021) 47:8. doi: 10.3892/ijmm.2020.4841
99. Kumar M, Lu Z, Takwi AA, Chen W, Callander NS, Ramos KS, et al. Negative regulation of the tumor suppressor P53 gene by micrornas. Oncogene. (2011) 30:843–53. doi: 10.1038/onc.2010.457
100. Gao Y, Miao Y, Zhang W, Ru X, Hou L. Microrna-365 induces apoptosis and inhibits invasion of human myeloma cells by targeting homeobox A9 (Hoxa9). Environ Toxicol Pharmacol. (2021) 85:103627. doi: 10.1016/j.etap.2021.103627
101. Loven J, Hoke HA, Lin CY, Lau A, Orlando DA, Vakoc CR, et al. Selective inhibition of tumor oncogenes by disruption of super-enhancers. Cell. (2013) 153:320–34. doi: 10.1016/j.cell.2013.03.036
102. Shi J, Song S, Han H, Xu H, Huang M, Qian C, et al. Potent activity of the bromodomain inhibitor otx015 in multiple myeloma. Mol Pharm. (2018) 15:4139–47. doi: 10.1021/acs.molpharmaceut.8b00554
103. Gu J, Song S, Han H, Xu H, Fan G, Qian C, et al. The bet bromodomain inhibitor otx015 synergizes with targeted agents in multiple myeloma. Mol Pharm. (2018) 15:5387–96. doi: 10.1021/acs.molpharmaceut.8b00880
104. Amorim S, Stathis A, Gleeson M, Iyengar S, Magarotto V, Leleu X, et al. Bromodomain inhibitor otx015 in patients with lymphoma or multiple myeloma: A dose-escalation, open-label, pharmacokinetic, phase 1 study. Lancet Haematol. (2016) 3:e196–204. doi: 10.1016/S2352-3026(16)00021-1
105. Zhang L, Zhang R, Wang J, Chen Y, Qiao C, Shi Q, et al. Identification of clinical implications and potential prognostic models of chromatin regulator mutations in multiple myeloma. Clin Epigenet. (2022) 14:93. doi: 10.1186/s13148-022-01314-7
106. Abruzzese MP, Bilotta MT, Fionda C, Zingoni A, Soriani A, Vulpis E, et al. Inhibition of bromodomain and extra-terminal (Bet) proteins increases nkg2d ligand mica expression and sensitivity to nk cell-mediated cytotoxicity in multiple myeloma cells: role of cmyc-irf4-mir-125b interplay. J Hematol Oncol. (2016) 9:134. doi: 10.1186/s13045-016-0362-2
107. Zhu Y, Wang Z, Li Y, Peng H, Liu J, Zhang J, et al. The role of crebbp/ep300 and its therapeutic implications in hematological Malignancies. Cancers (Basel). (2023) 15:1219. doi: 10.3390/cancers15041219
108. Patra KC, Wang Q, Bhaskar PT, Miller L, Wang Z, Wheaton W, et al. Hexokinase 2 is required for tumor initiation and maintenance and its systemic deletion is therapeutic in mouse models of cancer. Cancer Cell. (2013) 24:213–28. doi: 10.1016/j.ccr.2013.06.014
109. Wang L, Xiong H, Wu F, Zhang Y, Wang J, Zhao L, et al. Hexokinase 2-mediated warburg effect is required for pten- and P53-deficiency-driven prostate cancer growth. Cell Rep. (2014) 8:1461–74. doi: 10.1016/j.celrep.2014.07.053
110. Wolf A, Agnihotri S, Micallef J, Mukherjee J, Sabha N, Cairns R, et al. Hexokinase 2 is a key mediator of aerobic glycolysis and promotes tumor growth in human glioblastoma multiforme. J Exp Med. (2011) 208:313–26. doi: 10.1084/jem.20101470
111. Abe Y, Ikeda S, Kitadate A, Narita K, Kobayashi H, Miura D, et al. Low hexokinase-2 expression-associated false-negative (18)F-fdg pet/ct as a potential prognostic predictor in patients with multiple myeloma. Eur J Nucl Med Mol Imaging. (2019) 46:1345–50. doi: 10.1007/s00259-019-04312-9
112. Maiso P, Huynh D, Moschetta M, Sacco A, Aljawai Y, Mishima Y, et al. Metabolic signature identifies novel targets for drug resistance in multiple myeloma. Cancer Res. (2015) 75:2071–82. doi: 10.1158/0008-5472.CAN-14-3400
113. Xu S, Zhou T, Doh HM, Trinh KR, Catapang A, Lee JT, et al. An hk2 antisense oligonucleotide induces synthetic lethality in hk1(-)Hk2(+) multiple myeloma. Cancer Res. (2019) 79:2748–60. doi: 10.1158/0008-5472.CAN-18-2799
114. Ikeda S, Abe F, Matsuda Y, Kitadate A, Takahashi N, Tagawa H. Hypoxia-inducible hexokinase-2 enhances anti-apoptotic function via activating autophagy in multiple myeloma. Cancer Sci. (2020) 111:4088–101. doi: 10.1111/cas.14614
115. Zhao B, Li L, Lei Q, Guan KL. The hippo-yap pathway in organ size control and tumorigenesis: an updated version. Genes Dev. (2010) 24:862–74. doi: 10.1101/gad.1909210
116. Riz I, Hawley RG. Increased expression of the tight junction protein tjp1/zo-1 is associated with upregulation of taz-tead activity and an adult tissue stem cell signature in carfilzomib-resistant multiple myeloma cells and high-risk multiple myeloma patients. Oncoscience. (2017) 4:79–94. doi: 10.18632/oncoscience.356
117. Agnelli L, Forcato M, Ferrari F, Tuana G, Todoerti K, Walker BA, et al. The reconstruction of transcriptional networks reveals critical genes with implications for clinical outcome of multiple myeloma. Clin Cancer Res. (2011) 17:7402–12. doi: 10.1158/1078-0432.CCR-11-0596
118. Upadhyay G. Emerging role of lymphocyte antigen-6 family of genes in cancer and immune cells. Front Immunol. (2019) 10:819. doi: 10.3389/fimmu.2019.00819
119. Yeom CJ, Zeng L, Goto Y, Morinibu A, Zhu Y, Shinomiya K, et al. Ly6e: A conductor of Malignant tumor growth through modulation of the pten/pi3k/akt/hif-1 axis. Oncotarget. (2016) 7:65837–48. doi: 10.18632/oncotarget.11670
120. AlHossiny M, Luo L, Frazier WR, Steiner N, Gusev Y, Kallakury B, et al. Ly6e/K signaling to tgfbeta promotes breast cancer progression, immune escape, and drug resistance. Cancer Res. (2016) 76:3376–86. doi: 10.1158/0008-5472.CAN-15-2654
121. Tolaney SM, Do KT, Eder JP, LoRusso PM, Weekes CD, Chandarlapaty S, et al. A phase I study of dlye5953a, an anti-ly6e antibody covalently linked to monomethyl auristatin E, in patients with refractory solid tumors. Clin Cancer Res. (2020) 26:5588–97. doi: 10.1158/1078-0432.CCR-20-1067
122. Reikvam H, Ryningen A, Saeterdal LR, Nepstad I, Foss B, Bruserud O. Connexin expression in human acute myeloid leukemia cells: identification of patient subsets based on protein and global gene expression profiles. Int J Mol Med. (2015) 35:645–52. doi: 10.3892/ijmm.2014.2045
123. Foss B, Tronstad KJ, Bruserud O. Connexin-based signaling in acute myelogenous leukemia (Aml). Biochim Biophys Acta. (2010) 1798:1–8. doi: 10.1016/j.bbamem.2009.10.014
124. Dong W, Gong H, Zhang G, Vuletic S, Albers J, Zhang J, et al. Lipoprotein lipase and phospholipid transfer protein overexpression in human glioma cells and their effect on cell growth, apoptosis, and migration. Acta Biochim Biophys Sin (Shanghai). (2017) 49:62–73. doi: 10.1093/abbs/gmw117
125. Bianchini G, Qi Y, Alvarez RH, Iwamoto T, Coutant C, Ibrahim NK, et al. Molecular anatomy of breast cancer stroma and its prognostic value in estrogen receptor-positive and -negative cancers. J Clin Oncol. (2010) 28:4316–23. doi: 10.1200/JCO.2009.27.2419
126. Sardana G, Marshall J, Diamandis EP. Discovery of candidate tumor markers for prostate cancer via proteomic analysis of cell culture-conditioned medium. Clin Chem. (2007) 53:429–37. doi: 10.1373/clinchem.2006.077370
127. Kovacs KG, Macsik-Valent B, Matko J, Bajtay Z, Erdei A. Revisiting the coreceptor function of complement receptor type 2 (Cr2, cd21); coengagement with the B-cell receptor inhibits the activation, proliferation, and antibody production of human B cells. Front Immunol. (2021) 12:620427. doi: 10.3389/fimmu.2021.620427
128. Przybyla W, Gjersvoll Paulsen KM, Mishra CK, Nygard S, Engebretsen S, Ruud E, et al. Whole exome sequencing of high-risk neuroblastoma identifies novel non-synonymous variants. PloS One. (2022) 17:e0273280. doi: 10.1371/journal.pone.0273280
129. Bildik G, Liang X, Sutton MN, Bast RC Jr., Lu Z. Diras3: an imprinted tumor suppressor gene that regulates ras and pi3k-driven cancer growth, motility, autophagy, and tumor dormancy. Mol Cancer Ther. (2022) 21:25–37. doi: 10.1158/1535-7163.MCT-21-0331
130. Ria R, Todoerti K, Berardi S, Coluccia AM, De Luisi A, Mattioli M, et al. Gene expression profiling of bone marrow endothelial cells in patients with multiple myeloma. Clin Cancer Res. (2009) 15:5369–78. doi: 10.1158/1078-0432.CCR-09-0040
Keywords: multiple myeloma, disulfidptosis, prognostic gene signature, tumor microenvironment, oxidative stress, immunotherapy, targeted drugs
Citation: Zhang B, Zheng D, Zhu S, Zhang X, Wang Q, Lin Z, Zheng Z, Zhou S, Chen Z, Zheng S, Lan E, Cui L, Ying H, Zhang Y, Lin X, Zhuang Q, Qian H, Hu X, Zhuang Y, Zhang Q, Jin Z, Jiang S and Ma Y (2025) Leveraging a disulfidptosis-based signature to characterize heterogeneity and optimize treatment in multiple myeloma. Front. Immunol. 16:1559317. doi: 10.3389/fimmu.2025.1559317
Received: 12 January 2025; Accepted: 26 March 2025;
Published: 16 April 2025.
Edited by:
Cristina Maccalli, Sidra Medicine, QatarReviewed by:
Xiuli Wu, Jinan University, ChinaPan Chen, Central South University, China
Geraldine O’Connor, University of Central Lancashire, United Kingdom
Copyright © 2025 Zhang, Zheng, Zhu, Zhang, Wang, Lin, Zheng, Zhou, Chen, Zheng, Lan, Cui, Ying, Zhang, Lin, Zhuang, Qian, Hu, Zhuang, Zhang, Jin, Jiang and Ma. This is an open-access article distributed under the terms of the Creative Commons Attribution License (CC BY). The use, distribution or reproduction in other forums is permitted, provided the original author(s) and the copyright owner(s) are credited and that the original publication in this journal is cited, in accordance with accepted academic practice. No use, distribution or reproduction is permitted which does not comply with these terms.
*Correspondence: Zhouxiang Jin, d3pqaW56eEAxNjMuY29t; Songfu Jiang, amlhbmdzb25nZnVAMTg5LmNu; Yongyong Ma, bWF5eUB3bXUuZWR1LmNu