 Seik-Soon Khor
 Kouyuki Hirayasu
 Yosuke Kawai1
 Hie Lim Kim
 Masao Nagasaki
 Katsushi Tokunaga
94% of researchers rate our articles as excellent or good
Learn more about the work of our research integrity team to safeguard the quality of each article we publish.
Find out more
METHODS article
Front. Immunol., 07 April 2025
Sec. Molecular Innate Immunity
Volume 16 - 2025 | https://doi.org/10.3389/fimmu.2025.1559301
This article is part of the Research TopicA New Perspective in Immune Polymorphism (The HLA, KIR, and LILR genes)View all 10 articles
There are ten leukocyte immunoglobulin (Ig)-like receptor (LILR) genes, i.e., five genes encoding activating receptors (LILRA1, LILRA2, LILRA4, LILRA5, and LILRA6) characterized by their truncated cytoplasmic tails, and five genes encoding inhibitory receptors (LILRB1, LILRB2, LILRB3, LILRB4, and LILRB5) characterized by their extended cytoplasmic tails containing immunoreceptor tyrosine-based inhibitory motifs (ITIMs). Among these, LILRB3, LILRA6, and LILRA3 are known for harboring high frequencies of copy number variations (CNVs). However, the presence of CNVs in the leukocyte receptor complex (LRC) region complicates single nucleotide polymorphism (SNP) association analysis within commercially available SNP microarray datasets. This study introduces LILR Genotype Imputation with Attribute Bagging (LIBAG), a novel method for determining CNVs in LILRB3, LILRA6, and LILRA3 from commercially available SNP genotyping array datasets. LILRA6 CNV imputation accuracy peaked at 98.0% for the Infinium Japanese Screening Array, followed by 97.4% for Axiom Japonica V2, 97.3% for Axiom Japonica Array NEO, and 94.3% for Axiom Japonica V1, with the lowest recorded accuracy of 93.6% for the Axiom Genome-wide ASI1 array. For the 1000 Genomes Project (1kGP) dataset, LILRA6 CNV imputation achieved peak accuracies of 94.5% for 1kGP-EAS (East Asian), 86.6% for 1kGP-AMR (Admixed American), 83.8% for 1kGP-EUR European), and 75.0% for 1kGP-AFR (African), particularly after the 20 kb flanking region. Similarly, imputation accuracy for LILRA3 CNV progressively increased, peaking at the 80 kb flanking region. Accuracy reached 1kGP-AMR, reaching 99.2% and 98.9% for 1kGP-AFR, 98.7% for 1kGP-EUR, and 97.5% for 1kGP-EAS. Investigating the LILR copy number (CN) in diseases associated with HLA class I molecules will provide further insights into disease pathogenesis.
The leukocyte immunoglobulin (lg)-like receptor (LILR) gene family (also known as immunoglobulin-like transcript (ILT)) or LIR family) is mapped to the leukocyte receptor complex (LRC) region on chromosome 19q13.4. This region contains multigene families of the innate immune system belonging to the lg superfamily, such as killer lg-like receptors (KIR), leukocyte-associated lg-like receptors (LAIRs), natural cytotoxicity receptor 1 (NCR1) and the Fc-alpha receptor (FcAR) (1, 2). LILRs are classified into two major groups, i.e., LILRA and LILRB. LILRAs (Figure 1) consist of five activating receptors (LILRA1, LILRA2, LILRA4, LILRA5, and LILRA6), characterized by truncated cytoplasmic tails and interaction with the γ-chain of FcεRI through a charged arginine residue in the transmembrane domain. This interaction facilitates transduction of the activating signal via an immunoreceptor tyrosine-based activation motif (ITAM) (3). In contrast, LILRBs comprise five inhibitory receptors (LILRB1, LILRB2, LILRB3, LILRB4, and LILRB5), characterized by long cytoplasmic tail with immunoreceptor tyrosine-based inhibitory motifs (ITIM). LILRA3 is a soluble protein lacking both transmembrane and cytoplasmic domains (4, 5).
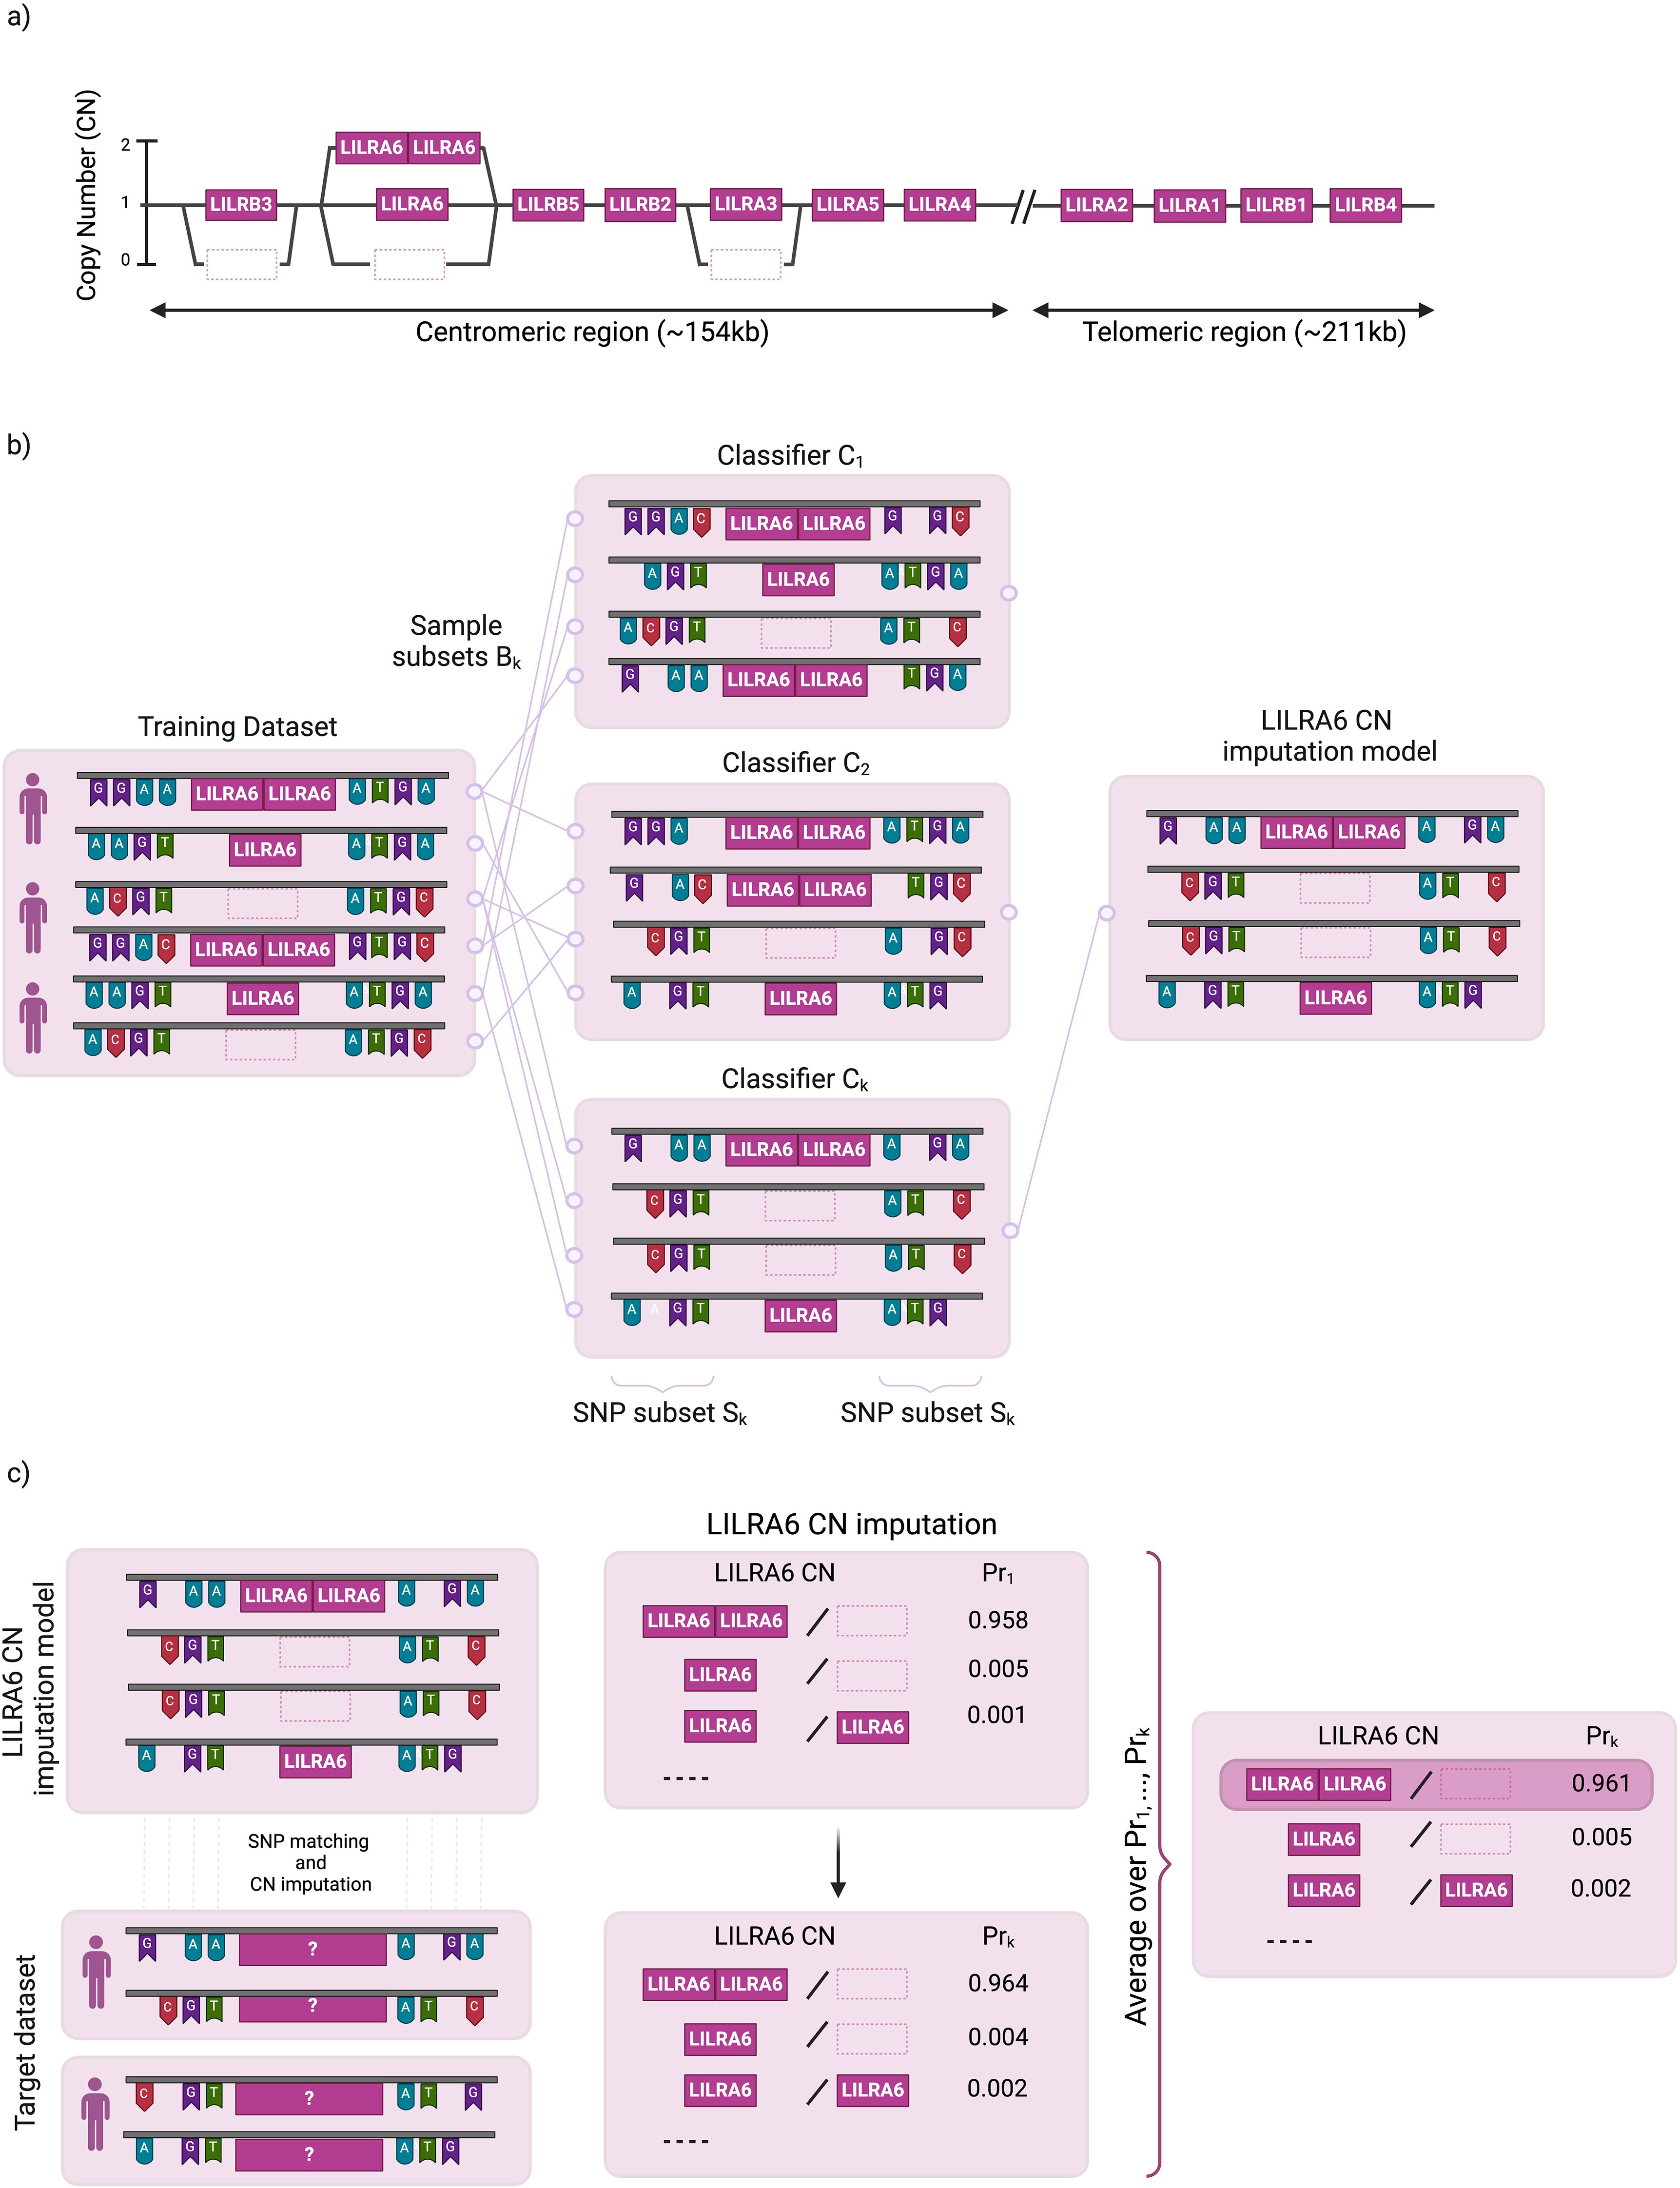
Figure 1. Schematic overview of LILR copy number (CN) imputation. (a) Copy Number Distribution of 11 LILR Genes (b) Overview of the LIBAG prediction algorithm. LIBAG constructs classifiers by taking K bootstrap samples from a reference set of individuals with known LILR CN and SNP genotypes. Each sample, Bk, includes some individuals multiple times, leaving approximately 37% as out-of-bag. For each Bk, a classifier Ck is trained using an optimal SNP subset Sk. (c) SNPs from the target dataset are aligned with those in the LILR CN model to estimate LILR CN for all K classifiers LILR CN with the highest aggregated probabilities (Prk) is determined as the final predicted LILR CN.
Immune cell types including myeloid and lymphoid lineages broadly express LILR genes. In contrast with KIRs, which interact with polymorphic epitopes on the α1 and α2 domains of HLA class I members, LILRs bind to conserved motif epitopes on the α3 domain and/or with the highly conserved β2-microglobulin structure (6). At the single-gene level, all four LILR receptors (LILRA1, LILRA3, LILRB1, and LILRB2) exhibit strong affinity for HLA class I molecules, especially LILRB1 and LIRB2 (7–9).
Similar to the neighboring KIR genes, LILR genes exhibit high levels of copy number variation (CNV) and allelic variations (9, 10); LILRA6 shows a CNV ranging from 0 to 4 copies per haplotype, a result of nonallelic homologous recombination between LILRB3 and LILRA6 (9, 11, 12). In addition, 0–2 copies of LILRA3 have been detected in 48 human cell lines sourced from the International Histocompatibility Working Group (12). LILRA3 with a deficiency in the extracellular domain (13) and LILRA3 with a premature termination codon have also been reported (14, 15). However, experimental CNV determination of LILRA6 and LILRA3 remains laborious because of the homology (98%) between LILRB3 and LILRA6. In this paper, we propose a novel method to determine LILR CNV from whole-genome sequencing (WGS) datasets and a novel SNP-based imputation method to determine the CNV of LILRs that show CNV (LILRB3, LILRA6, and LILRA3). This project is part of the 19th International HLA & Immunogenetics Workshop (https://ihiw19.org/), focusing on the “Leukocyte Receptor Complex (LRC) Structure and Polymorphism.”
A total of 418 Tokyo Healthy Control (THC) samples were collected from healthy Japanese individuals in Tokyo, Japan; 182 Japanese individuals from a replication cohort were recruited from the National Hospital Organization Nagasaki Medical Center (NMC), Nagasaki, Japan. Healthy control participants were confirmed to have no significant disease at sample collection. All the healthy individuals This study was approved by the Ethical Committee of the National Center for Global Health and Medicine and National Hospital Organization Nagasaki Medical Center. Written informed consent was obtained from all participants.
Short-read whole-genome sequencing (srWGS) 175 1kGP-AFR (African), 268 1kGP-AMR (Admixed American), 140 1kGP-EAS (East Asian) and 100 1kGP-EUR (European) were downloaded from the International Genome Sample Resource database (https://www.internationalgenome.org/data-portal/data-collection/30x-grch38). The SNP microarray dataset, genotyped using the Illumina Omni2.5 microarray (Illumina, CA, US), was downloaded from http://ftp.1000genomes.ebi.ac.uk/vol1/ftp/release/20130502/supporting/hd_genotype_chip/.
Genome-wide SNP genotyping was performed on 418 Japanese THC samples using the following arrays: Axiom Genome-wide ASI1 array (Thermo Fisher Scientific, MA, US), Axiom Japonica V1 (Thermo Fisher Scientific, MA, US), Axiom Japonica V2 (Thermo Fisher Scientific, MA, US), Axiom Japonica Array NEO (Thermo Fisher Scientific, MA, US) and Infinium Japanese Screening Array (Illumina, CA, US). CEL format output files were generated according to the manufacturer’s recommended procedure. Genotyping of each variant was performed using Apt software (ver. 2.10.2.2). All samples met quality control criteria as defined by the manufacturer’s recommended workflows. Probe intensity clustering results were classified using SNPolisher. Quality controls for SNPs involved removing autosomal SNPs with a frequency of ≤ 5%, a call ≤ 95%, and deviation from Hardy–Weinberg equilibrium (p < 1e-5).
CNV of LILRB3, LILRA6, and LILRA3 was determined from the short-read whole-genome sequencing (srWGS) dataset for both the Japanese and 1kGP sample sets using the JoGo-LILR CNV Caller (16) (https://jogo.csml.org/JoGo-LILR/). Briefly, the JoGo-LILR CN Caller (16) employs three sequential steps in determining the CN: mapping whole-genome sequencing reads to GRCh38 with decoy sequences (GRCh38DH); calculating normalized read depths for LILRB3, LILRA6, and LILRA3 using CNVNator (17); and calling of CN types and estimating CN haplotypes based on the LILRB3, LILRA6, and LILRA3 cluster plots generated in step 2. Internal validation of the results was performed using the trio datasets from the 1kGP data.
LIBAG is a novel method for determining CNV in LILRB3, LILRA6, and LILRA3 from commercially available SNP genotyping array datasets (Figure 1). This method combines attribute bagging, an ensemble classifier method, with haplotype inference for SNPs and LILR CNV. Attribute bagging improves the accuracy and stability of imputation references through bootstrap aggregation and random variable selection (18).
LIBAG constructs classifiers by taking K bootstrap samples from a reference set of individuals with known LILR CN and SNP genotypes. Each sample, Bk, includes some individuals multiple times, leaving approximately 37% as out-of-bag. For each Bk, a classifier Ck is trained using an optimal SNP subset Sk (Figure 1). LIBAG was used to select a random subset of SNPs (Sk) flanking LILRB3, LILRA6, and LILRA3 for each bootstrapped sample. This subset was optimized by iteratively adding SNPs until maximum imputation accuracy is achieved, based on out-of-bag samples (samples that are not included in the current bootstrapped samples). The conditional probability of each possible LILR CN was calculated using estimated haplotype frequencies for the selected SNP subset, allowing the classifier to predict the LILR CN by maximizing posterior probabilities. Subsequently, an ensemble prediction was generated by averaging the posterior probabilities across all the individual classifiers. This method avoids overfitting and improves the CN prediction stability. To predict the CN for LILR genes of a new individual, LIBAG combines the probabilities from all classifiers and selects the LILR CN with the highest average probability.
Simulation studies on the flanking SNPs region, ranging from 10 to 100kb, were conducted to maximize LILR CNV imputation accuracy while minimizing computer power consumption. A call threshold (CT) was generated for each imputed LILR CNV pair, representing the confidence of the imputation. CT cutoff evaluations were performed to determine the delicate balance between call rate and imputation accuracy.
After constructing the LILR CN imputation model (Figure 1), the SNPs in the target dataset are matched to the SNPs set in our LILR CN imputation model to impute all possible LILR CN for all K classifiers. We leverage the aggregation of the K predictors to maximize imputation accuracy; LILR CN with the highest aggregated probabilities (Pr) is determined as the final predicted LILR CN.
External validation of the generated LILR gene imputation references was performed by comparing the LILR CNV calling results with the LILR CNV imputation results in the 182 NMC Japanese dataset.
LIBAG, an imputation toolkit developed as an integral component of the pre-existing HIBAG R statistics package (18, 19), facilitates CNV imputation within LILRB3, LILRA6, and LILRA3. This CNV imputation process is compatible with various commercially available SNP genotyping array datasets, including those from Thermo Fisher Scientific (MA, USA) and Illumina (CA, USA). In order to facilitate a high-quality LILR CNV imputation system for the datasets from these two companies (Figure 1), we have built a high-quality LILR CNV imputation system consisting of SNP data from genome-wide SNP microarray genotyping and LILR CNV genotyping data generated using the JoGo-LILR CN Caller. Once the LILR CNV imputation system is built, imputation can be performed by matching SNPs between the LILR CNV imputation model and the target dataset. Call thresholds, representing the confidence of LILR CNV imputation quality, were assigned to each imputed LILR CNV haplotype set.
The JoGo-LILR CN Caller was used to call the LILR CNV for LILRB3, LILRA6, and LILRA3 from the WGS dataset, comprising Japanese and 1kGP datasets. In the Japanese dataset (Figure 2A), LILRB3, LILRA6, and LILRA3 CNVs exhibited uneven distributions. LILRA6 showed the most CNV polymorphism (92.6% 1CN, 5.1% 2CN, 1.9% 0CN), followed by LILRA3 (75% 0CN, 24% 1CN). LILRB3 displayed the least CNV polymorphism (0.3% of 0CN, 99.6% of 1CN).
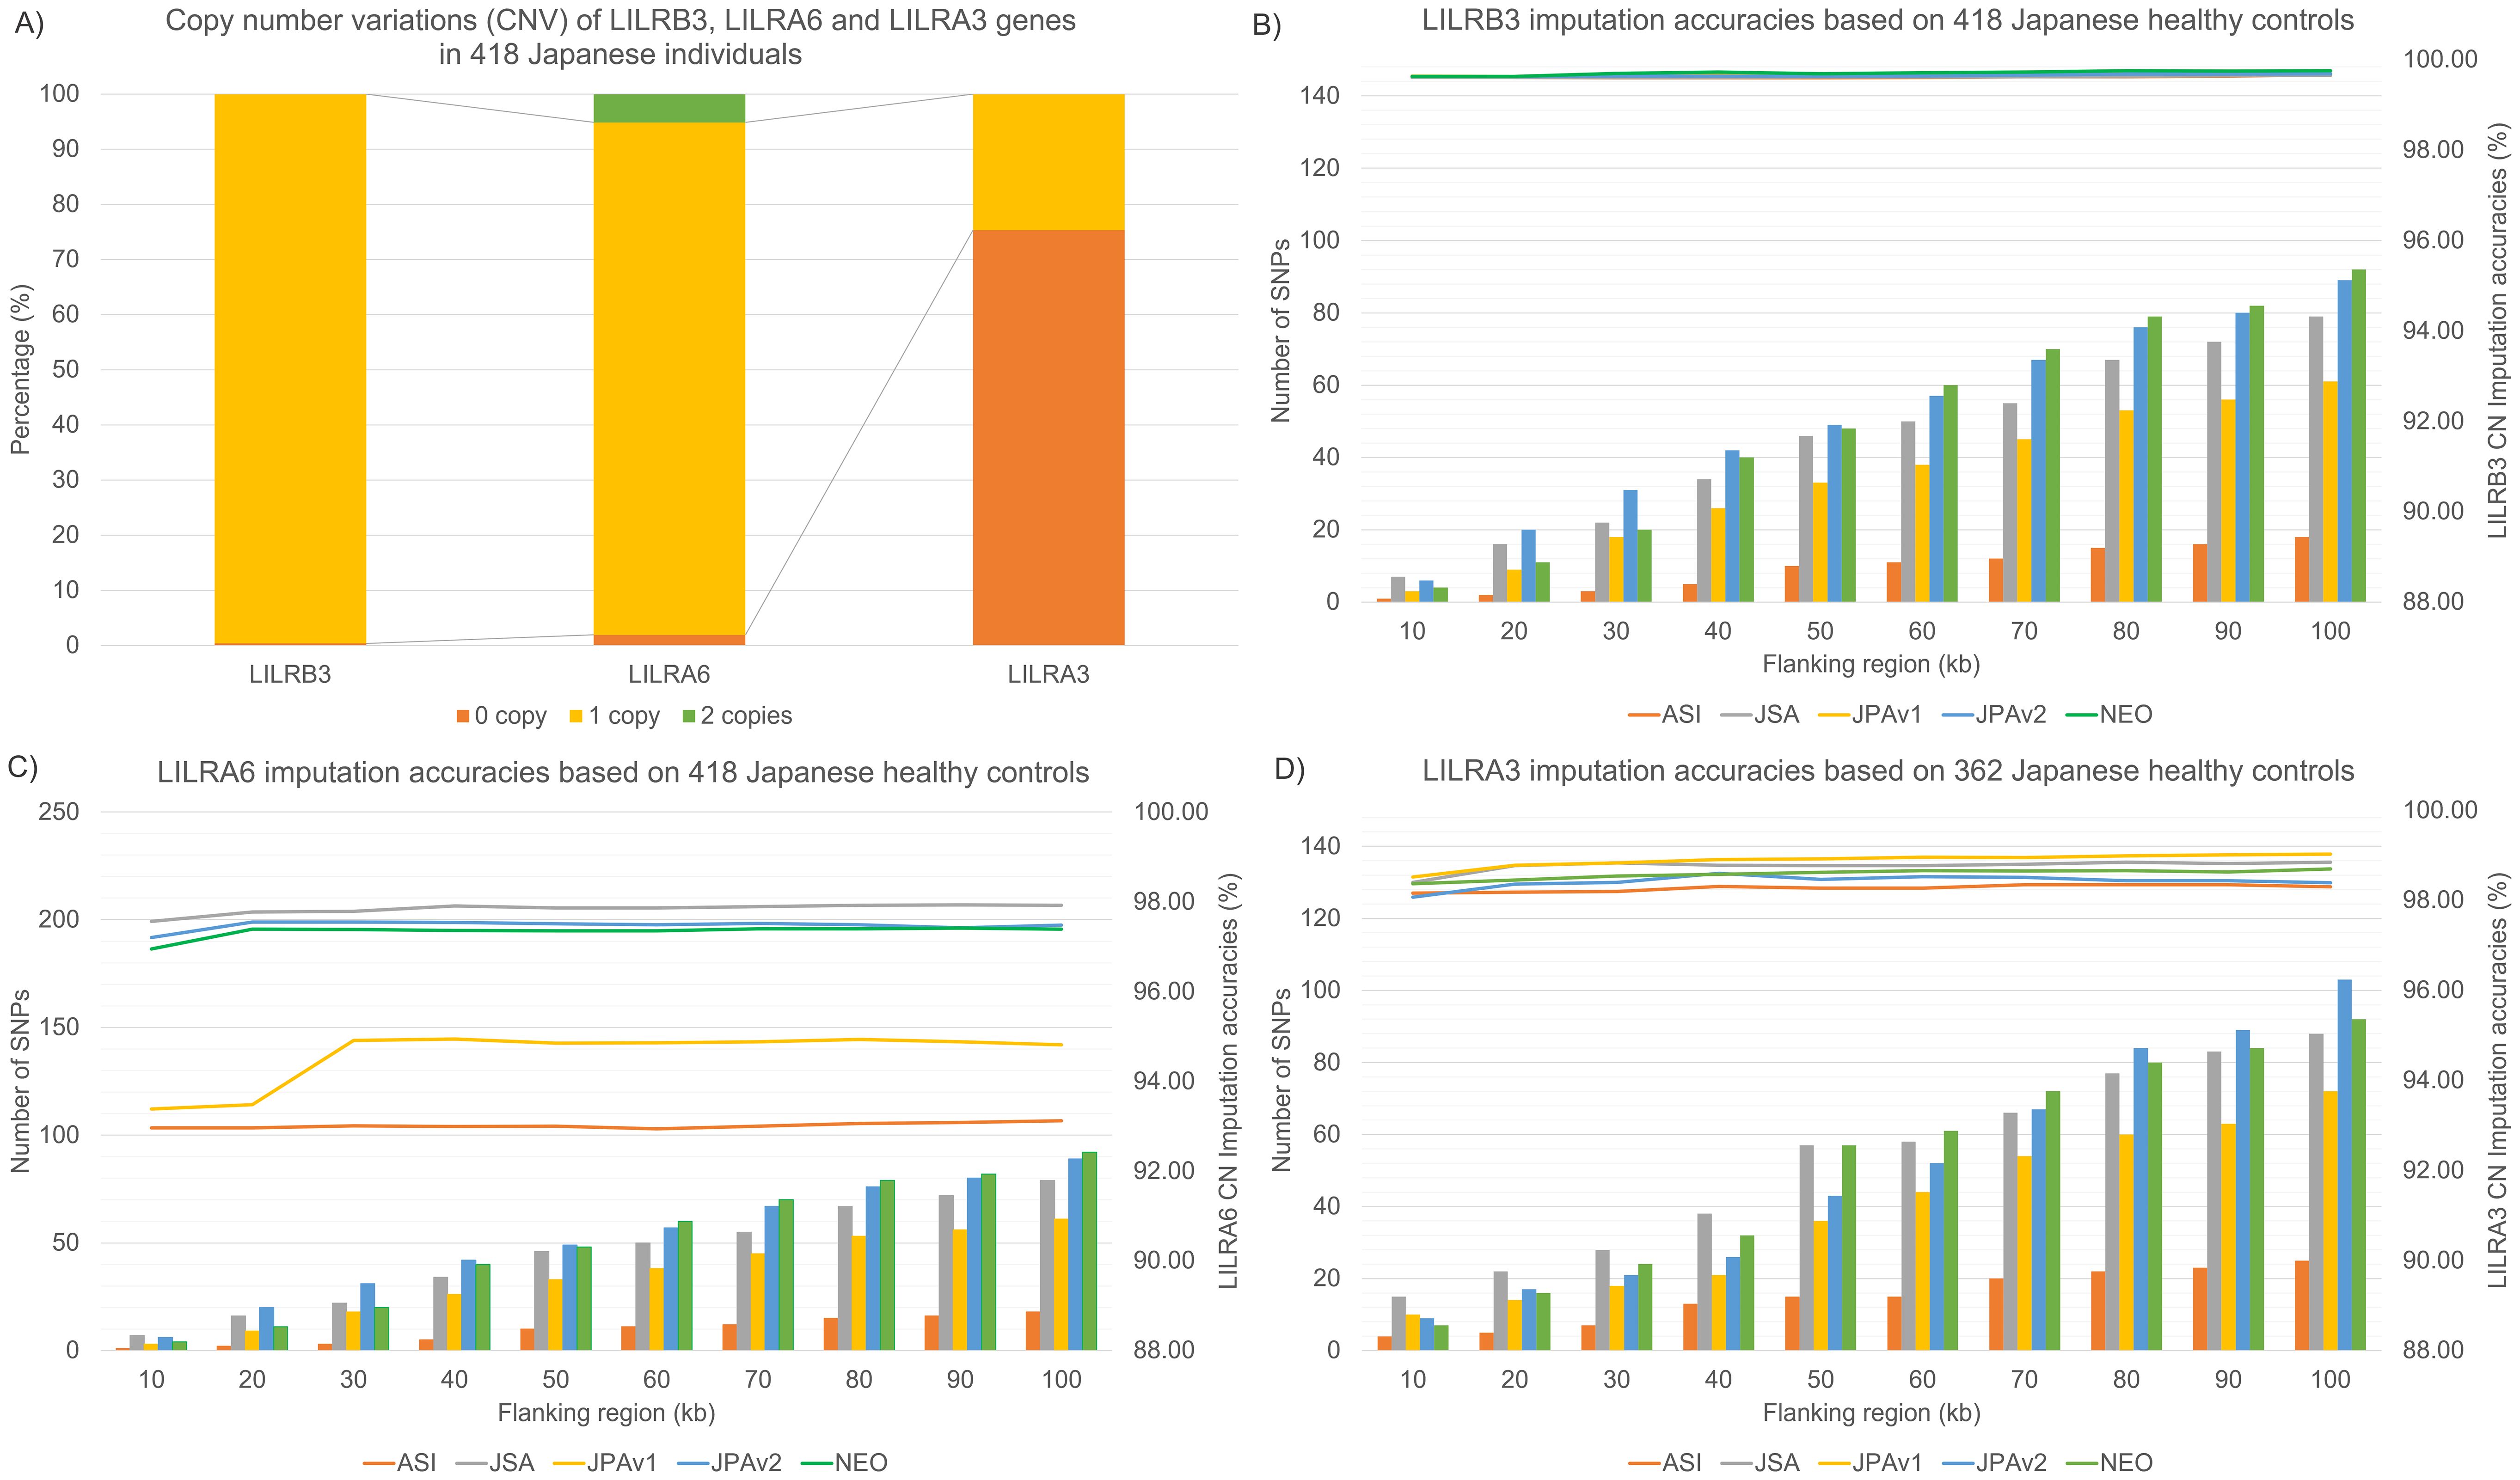
Figure 2. CN distributions of LILRs in the Japanese population and CN imputation accuracies across five Asian/Japanese-specific SNP microarray platforms. (A) CN distribution of LILRB3, LILRA6, and LILRA3 in 418 Japanese individuals. (B) Internal validations of LILRB3 CN imputation accuracies across five SNP microarray platforms, including the number of SNPs used for model building in flanking regions spanning from 10–100 kb around the LILRB3 gene (C) Internal validations of LILRA6 CN imputation accuracies across five SNP microarray platforms and the number of SNPs used for model building in flanking regions spanning from 10–100 kb around the LILRA6 gene (D) Internal validations of LILRA3 CN imputation accuracies across five SNP microarray platforms, including the number of SNPs used for model building in flanking regions spanning from 10–100 kb around the LILRA3 gene.
Similarly, LILRA6 CN exhibited the most polymorphism in the 1kGP dataset (Figure 3B). 1kGP-AFR showed five CN types: 56.6% 1CN, 24.3% 2CN, 14.3% 0CN, 4.6% 3CN, and 0.3% 4CN. Both 1kGP-AMR and 1kGP-EUR showed five CN types: 75.4% 1CN, 21.5% 2CN, 1.7% 0CN, 1.3% 3CN, and 0.2% 4CN; 67.5% 1CN, 29.0% 2CN, 1.5% 0CN, 1.0% 3CN, and 1.0% 4CN. Finally, 1kGP-EAS showed only three CN types: 91.8% 1CN, 4.3% 2CN, 3.9% 0CN.
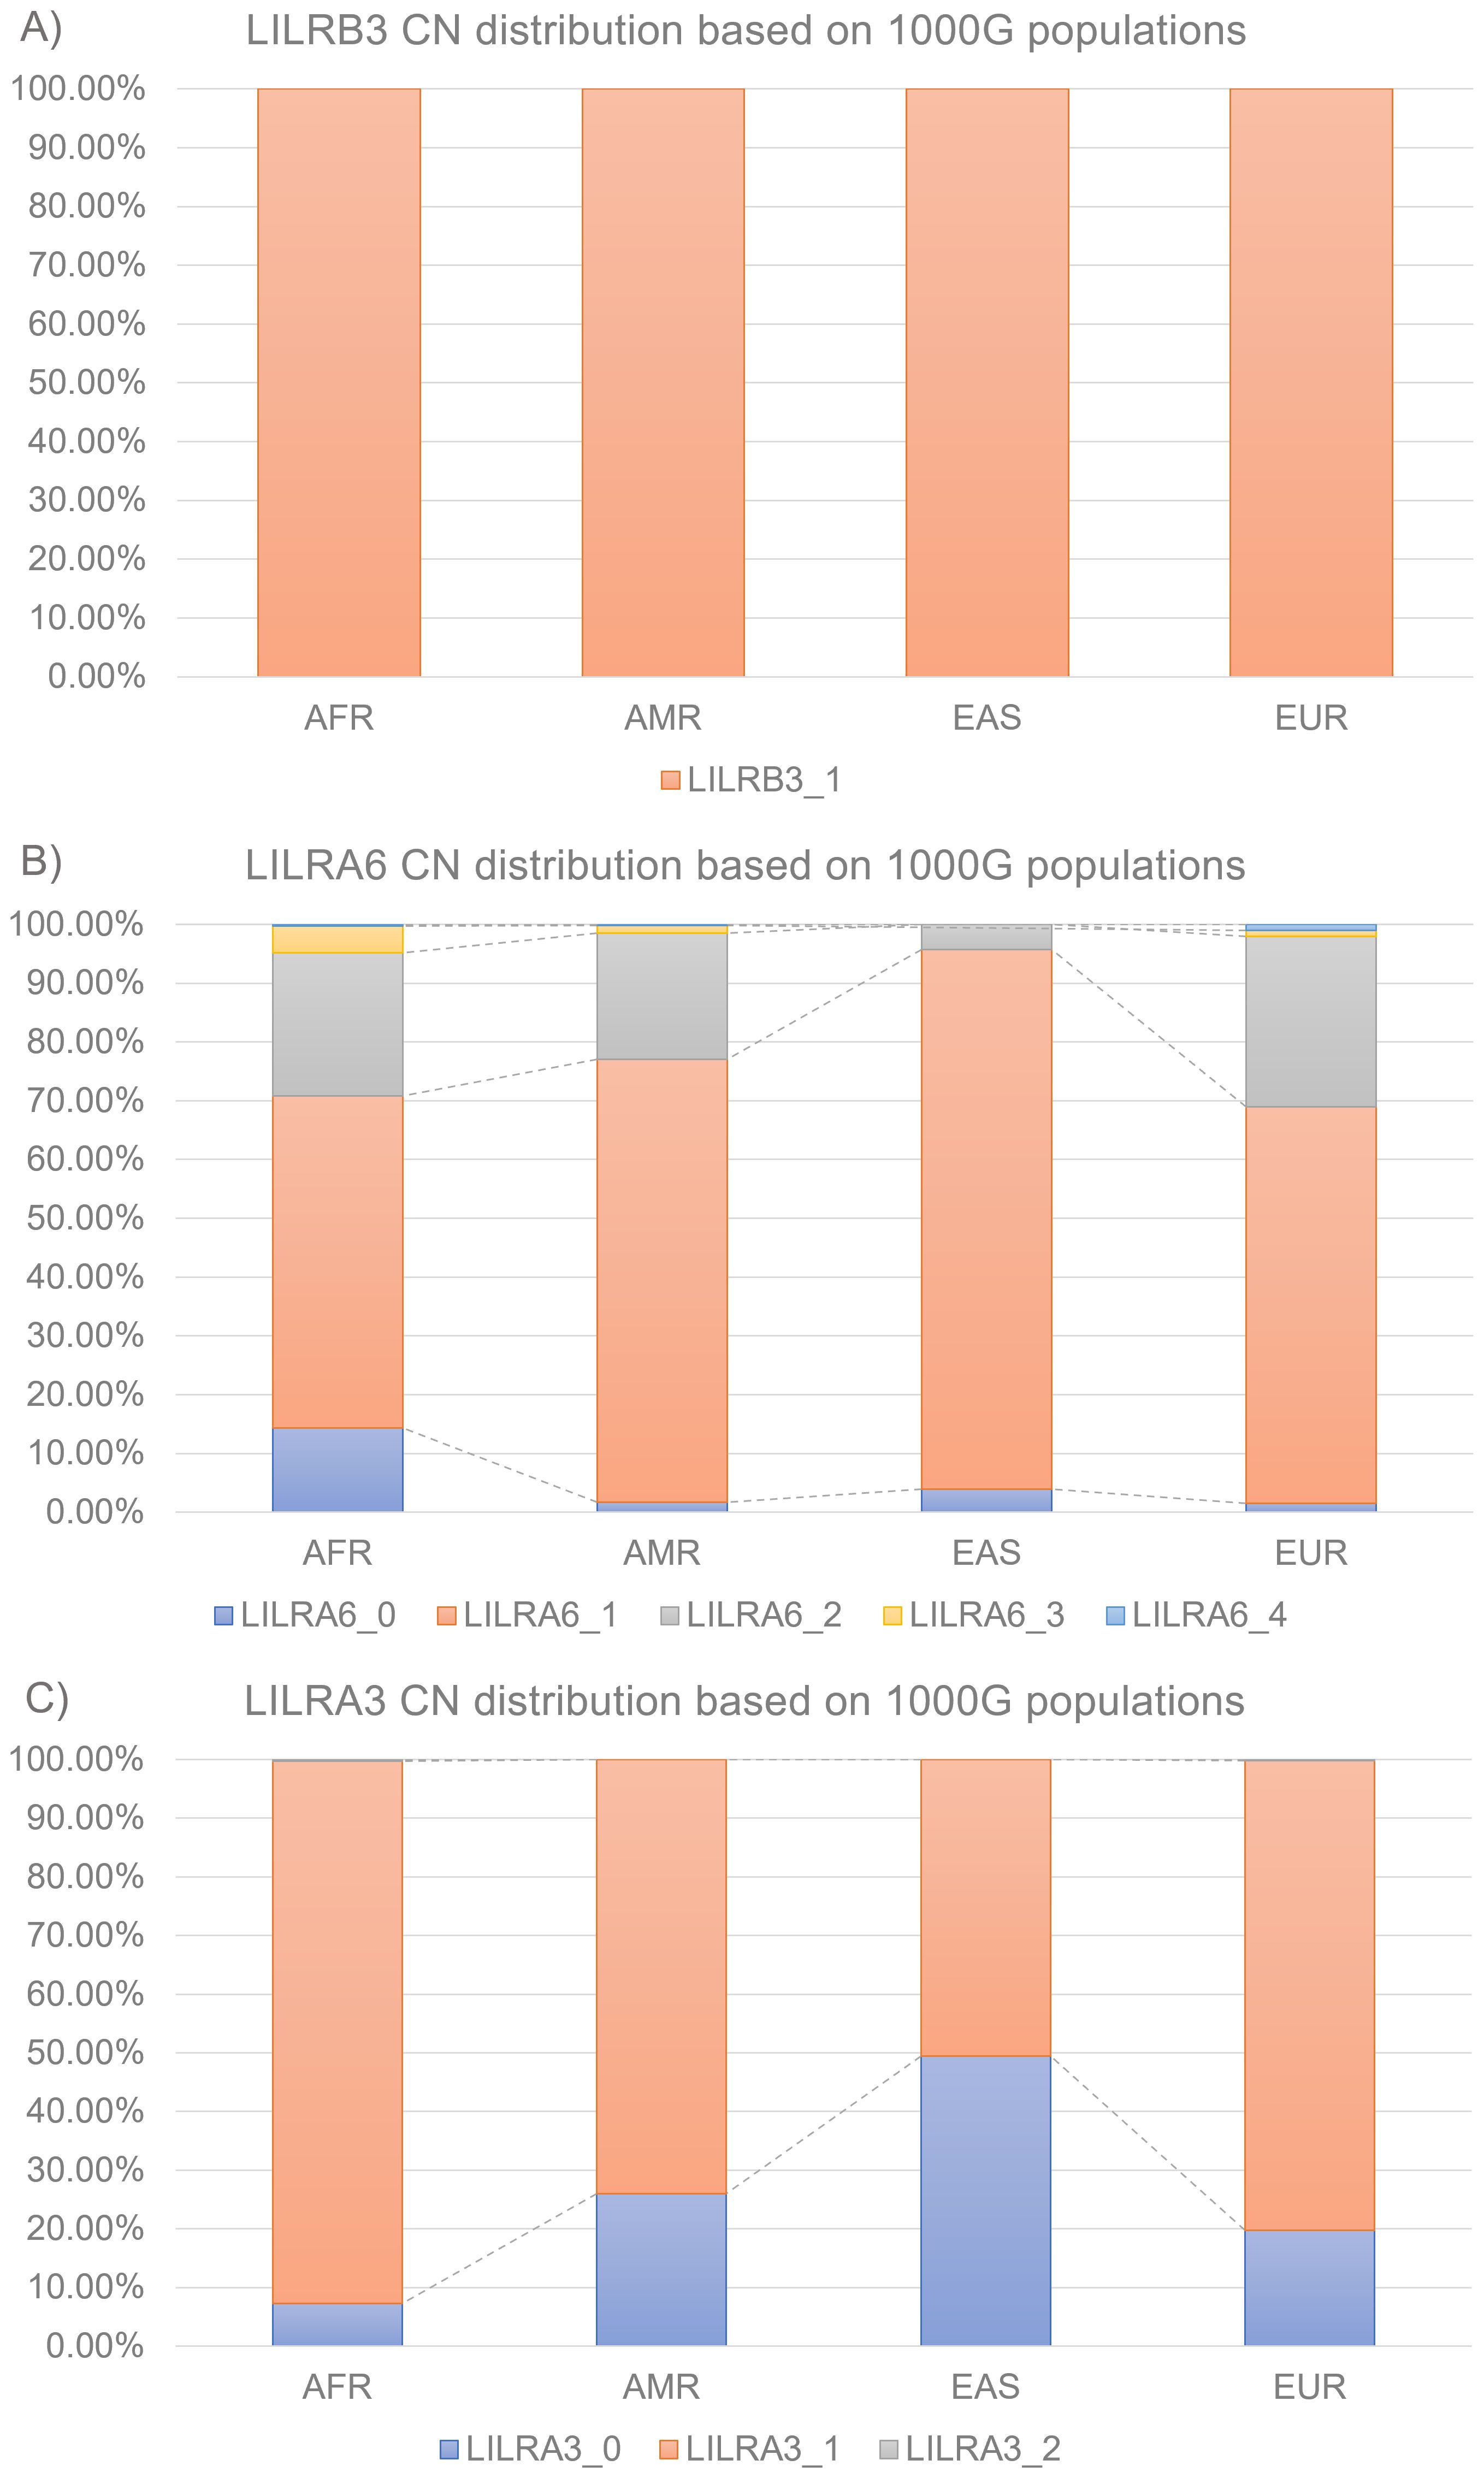
Figure 3. Distributions of LILR CN across the 1000 Genome Project super-populations (A) LILRB3 (B) LILRA6 (C) LILRA3. AFR, African; AMR, Admixed American; EAS, East Asian; EUR, European; CN, Copy Number.
LILRA3 was the second most polymorphic LILR identified in this study (Figure 3C). Both 1kGP-AFR and 1kGP-EUR showed three CN types: 92.5% 1CN, 7.3% 0CN, and 0.3% 2CN; and 80.1% 1CN, 19.8% 0CN, and 0.2% 2CN. However, 1kGP-AMR and 1kGP-EAS showed only two CN types: 74.0% 1CN, 26.0% 0CN, 50.5% 1CN, and 49.5% 0CN.
Finally, LILRB3 showed no CNV in the 1kGP dataset with all samples carrying 1CN (Figure 3A).
Simulation studies were performed on the SNP region flanking 10–100 kb from the center of LILRB3, LILRA6, and LILRA3. The objective was to improve the LILR CNV imputation accuracy while reducing computer power usage. The number of SNPs used for LILR imputation varied based on the evaluated SNP genotyping array. For instance, (Figures 2B–D) the Axiom Genome-wide ASI1 array, an earlier SNP genotyping version, contained the fewest usable SNPs, ranging from 1 to 18 SNPs. In contrast, Japanese-specific SNP genotyping arrays such as the Infinium Japanese Screening Array with 7-79 SNPs, Axiom Japonica V1 with 3-61 SNPs, Axiom Japonica V2 with 6-89 SNPs, and Axiom Japonica Array NEO with 4-92 SNPs, exhibit a wide range of usable SNPs for LILR CNV imputation.
Internal validations assessed LILR CNV imputation accuracies (Figures 2B–D) over an SNP region extending 10–100 kb from the center of the LILRB3, LILRA6, and LILRA3 genes. We found a clear relationship between the number of SNPs utilized in the LILR imputation model and the imputation accuracies; for example, the CNV imputation accuracies for LILRA6 (Figure 2C) and LILRA3 (Figure 2D) increased notably from the 20 kb to the 30 kb flanking region before plateauing beyond 30 kb. LILR CNV imputation accuracy also depends heavily on SNPs’ availability across various SNP genotyping arrays. Specifically, the LILRA6 CNV imputation accuracy peaked at 98.0% for the Infinium Japanese Screening Array, followed by 97.4% for Axiom Japonica V2, 97.3% for Axiom Japonica Array NEO, and 94.3% for Axiom Japonica V1, with the lowest recorded accuracy of 93.6% for the Axiom Genome-wide ASI1 array. In contrast, LILRA3 and LILRB3 CNV imputation accuracies demonstrated minimal variation (98.4-99.0% and 99.7-99.8%, respectively) across the five SNP genotyping arrays. A Japanese dataset (182 NMC; Table 1), SNP genotyped using the Axiom Japonica V2 array, served as an independent validation set. Imputation accuracies for LILR CNV in this set closely matched those of the internal validation test results: LILRB3 achieved 100% accuracy, while LILRA3 and LILRA6 achieved 98.1% and 96.7% accuracy, respectively.
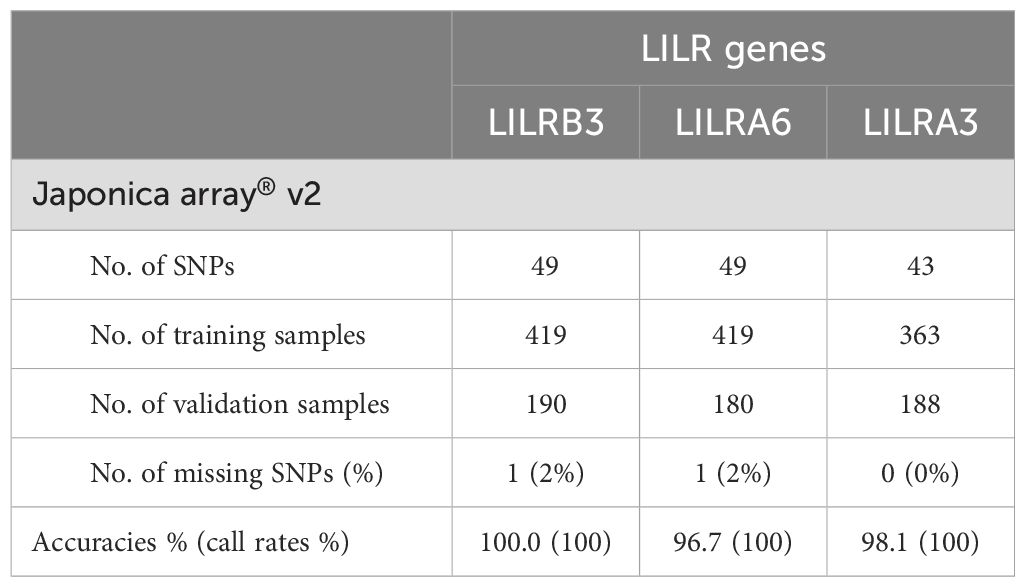
Table 1. Summary of prediction accuracies (call rate) based on LILR Japanese model as reference for independent Japanese validation set model as reference on independent Japanese validation set.
Furthermore, using our internal validation results, we predicted the most likely miscalled CNVs before quality control in the Japanese dataset (Supplementary Table 1). For example, miscalled LILRA6 CN0 and CN2 were most commonly mistaken for LILRA6 CN1. Conversely, miscalled LILRA6 CN1 was frequently referred to as LILRA6 CN2.
All 1kGP samples were genotyped using the Illumina Omni2.5 microarray. A minor discrepancy was observed in the number of SNPs available within the 10-100kb flanking region across different populations. For instance, in the case of LILRA6 (Figure 4B), the 1kGP-EAS population exhibited the fewest SNPs, ranging from 10–165, which were utilized for the LILR CNV imputation model. This was followed by the 1kGP-EUR with SNPs ranging from 13–177, the 1kGP-AFR with 17–215 SNPs, and finally, the 1kGP-AMR with 18–219 SNPs. A similar trend was observed for LILRB3 (Figure 4A) and LILRA3 (Figure 4C).
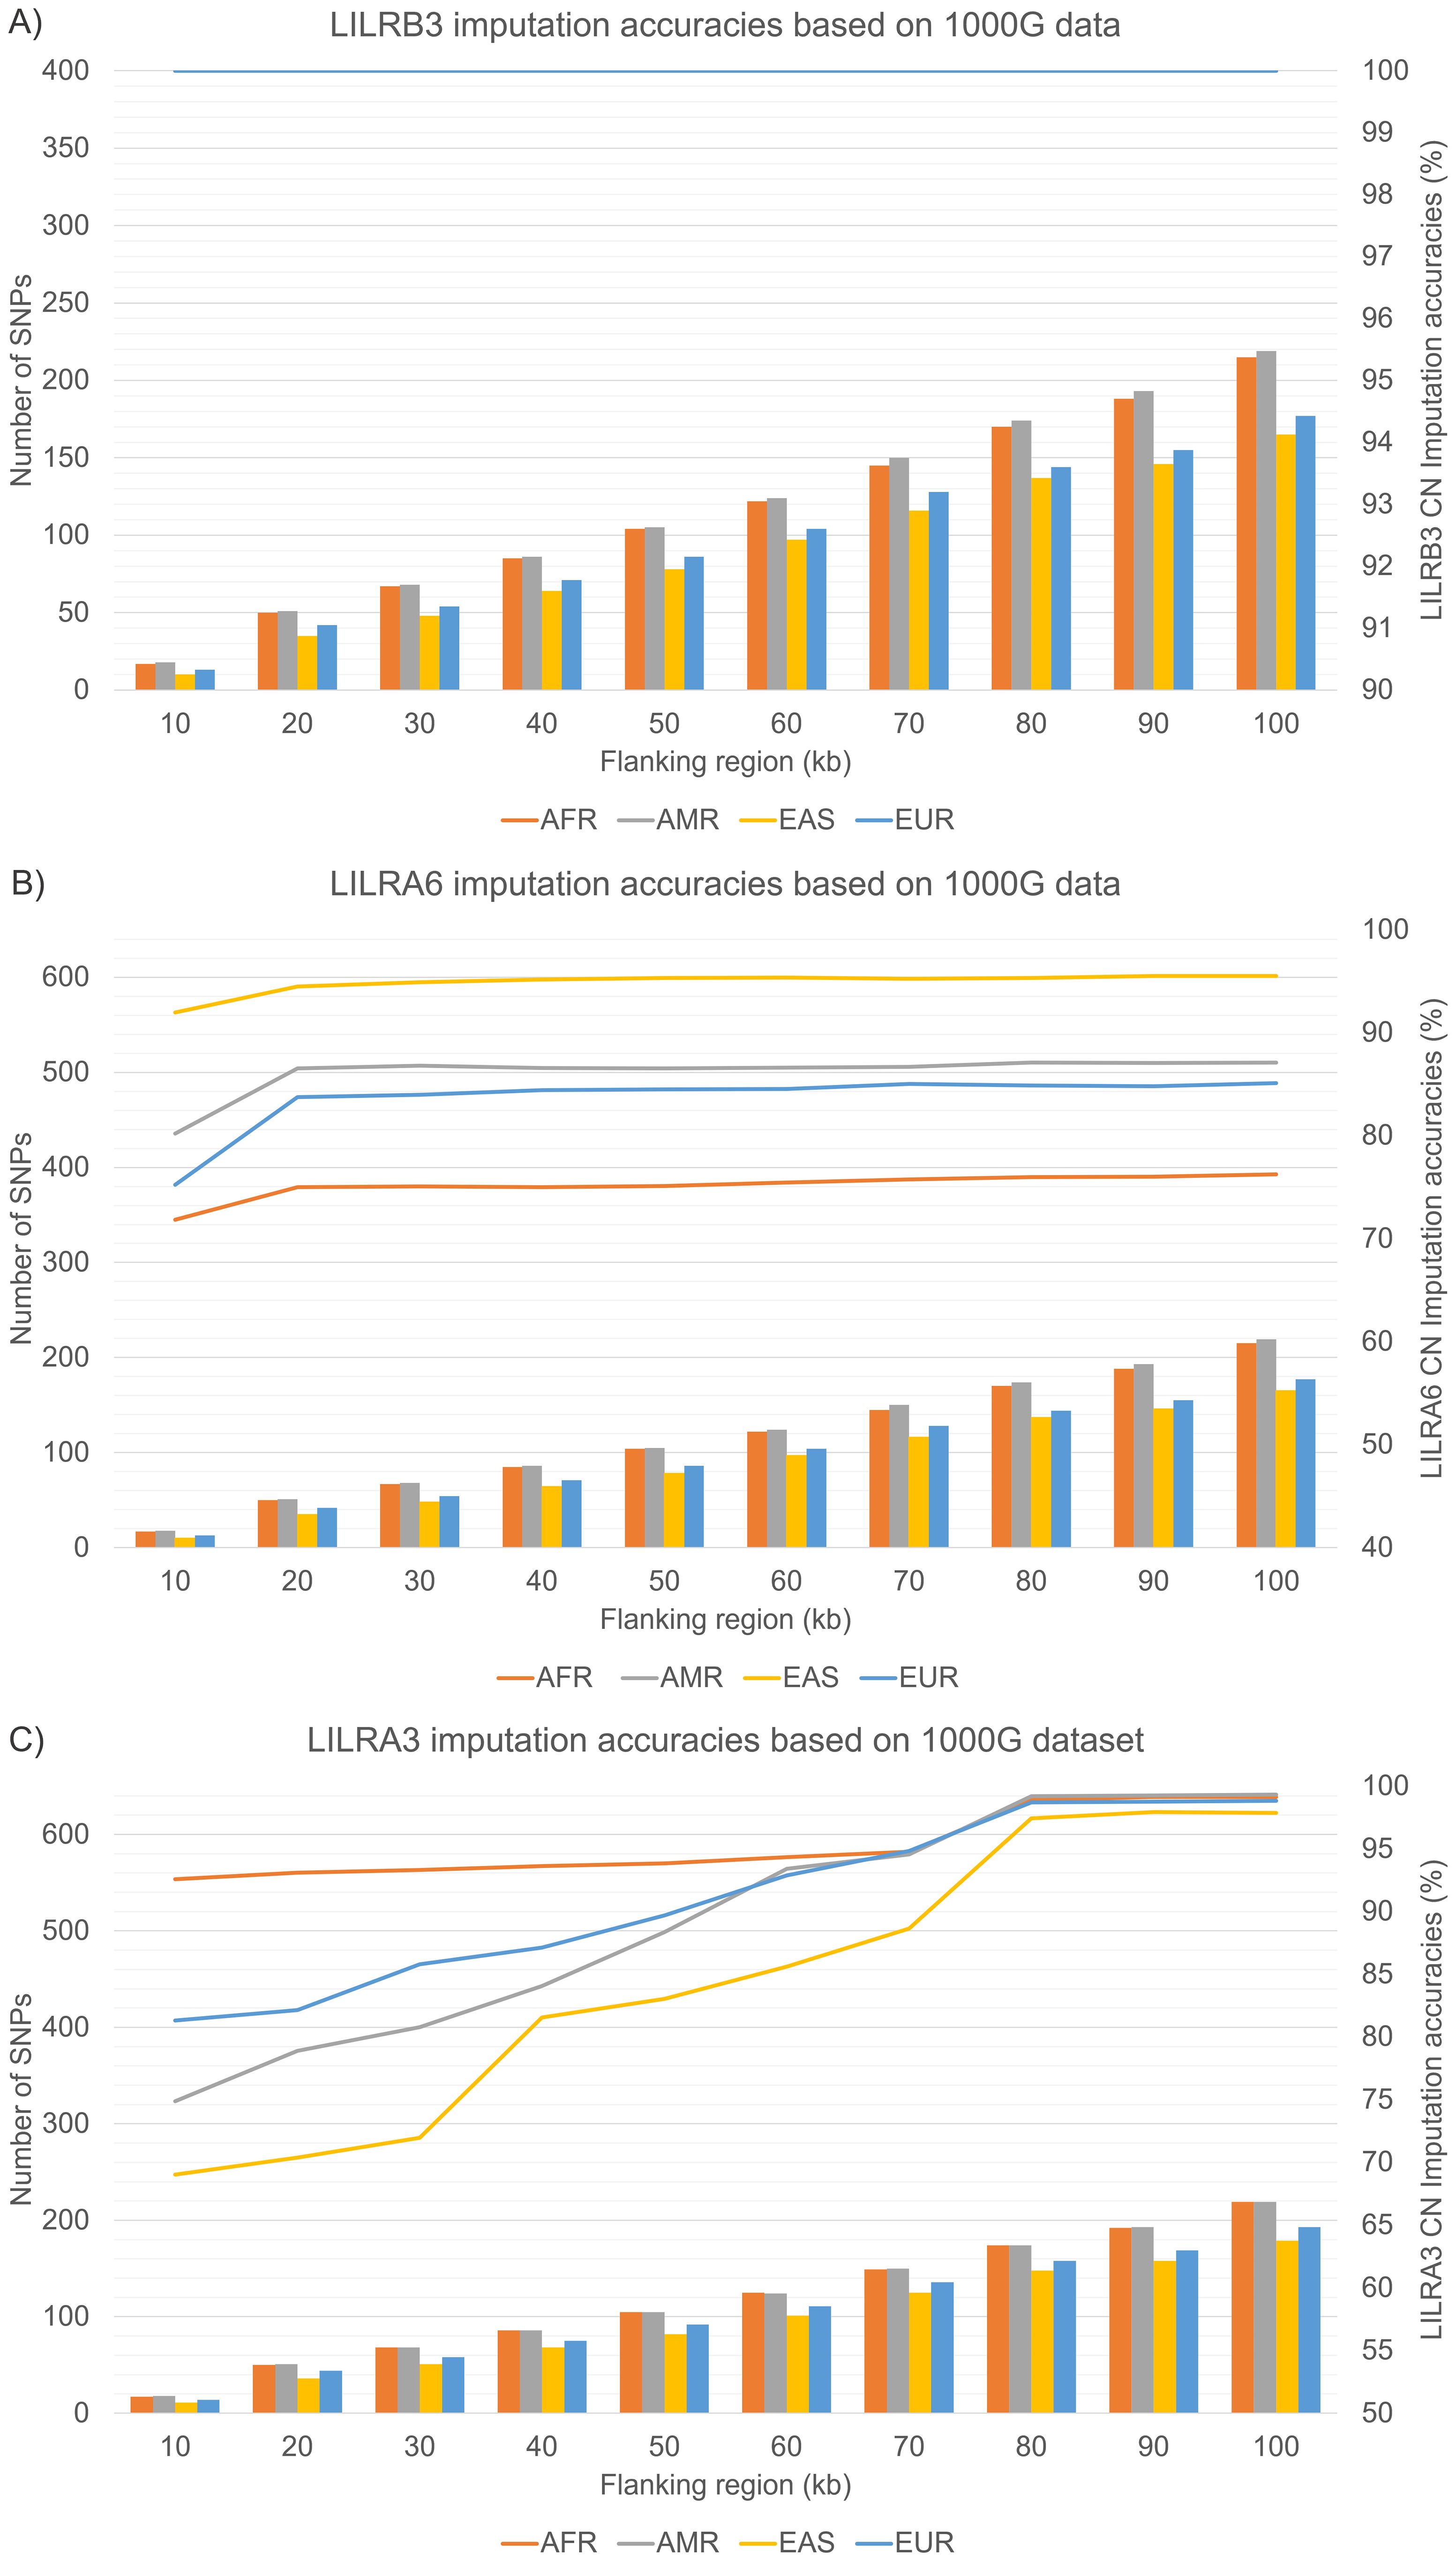
Figure 4. Internal validation of LILRs CN imputation accuracies across four 1000 Genome Project superpopulations. (A) LILRB3 (B) LILRA6 (C) LILRA3. AFR, African; AMR, Admixed American; EAS, East Asian; EUR, European; CN, Copy Number.
In our internal validation test (Figures 4A–C), LILRB3 achieved 100% accuracy, attributable to the lack of CNV in the dataset. In contrast, LILRA6’s CNV imputation reached peak accuracies of 94.5% (1kGP-EAS), 86.6% (1kGP-AMR), 83.8% (1kGP-EUR), and 75.0% (1kGP-AFR), particularly beyond the 20 kb flanking region. Similarly, LILRA3 CNV imputation accuracy gradually increased, peaking at the 80 kb flanking region: with 1kGP-AMR reaching 99.2% and 98.9% for 1kGP-AFR, 98.7% for 1kGP-EUR, and 97.5% for 1kGP-EAS.
Moreover, we forecast the most probable CNV misidentifications across all miscalls before quality control in the 1kGP dataset (Supplementary Table 2). Our analysis miscalled LILRA6 (0CN, 2CN, or 3CN) was most often identified as LILRA6 1CN. Similarly, LILRA3 1CN is most likely to be misclassified as 0CN, and vice versa.
Call thresholds, reflecting confidence in LILR CNV imputation quality, were established for each imputed CNV pair. The optimal cutoff for CT was determined by internal validation, considering CNV imputation success rates (call rates). Overly stringent CT can diminish call rates, while overly lenient CTs would fail to adequately exclude low-quality imputed CNVs.
In the Japanese dataset (Figure 5), a 0.5 CT effectively filtered low-quality imputed CNVs, as shown by the accuracy results, while improving sample call rates. This trend was observed across all five SNP genotyping arrays examined in this study. Conversely, a CT exceeding 0.75 significantly reduces call rates and is therefore not recommended. For LILRB3 (Supplementary Table 3), among the 5 SNP genotyping arrays, the sensitivity (SEN) ranged from 89.9% to 100%. The specificity (SPE) also ranged from 89.9% to 100%. The Positive Predictive Value (PPV) ranged from 95.4% to 99.8%, while the Negative Predictive Value (NPV) ranged from 95.4% to 99.8%. Subsequently, for LILRA6 (Supplementary Table 4), among the 5 SNP genotyping arrays, the SEN varied from 26.3% to 100.0% (notably low SEN for the Affymetrix Axiom™ Japonica Array™ NEO for LILRA6 2CN at 26.3%). The SPE ranged from 18.5% to 100% (notably low SPE for the Affymetrix Axiom™ Japonica Array™ NEO for LILRA6 1CN at 18.5%). The PPV varied from 88.2% to 100%, and the NPV ranged from 90.5% to 100%. Lastly, for LILRA3 (Supplementary Table 5), among the 5 SNP genotyping arrays, the SEN varied from 89.9% to 99.3%, the SPE varied from 89.9% to 99.3%, the PPV varied from 95.4% to 98.9%, and the NPV varied from 95.4% to 98.9%.
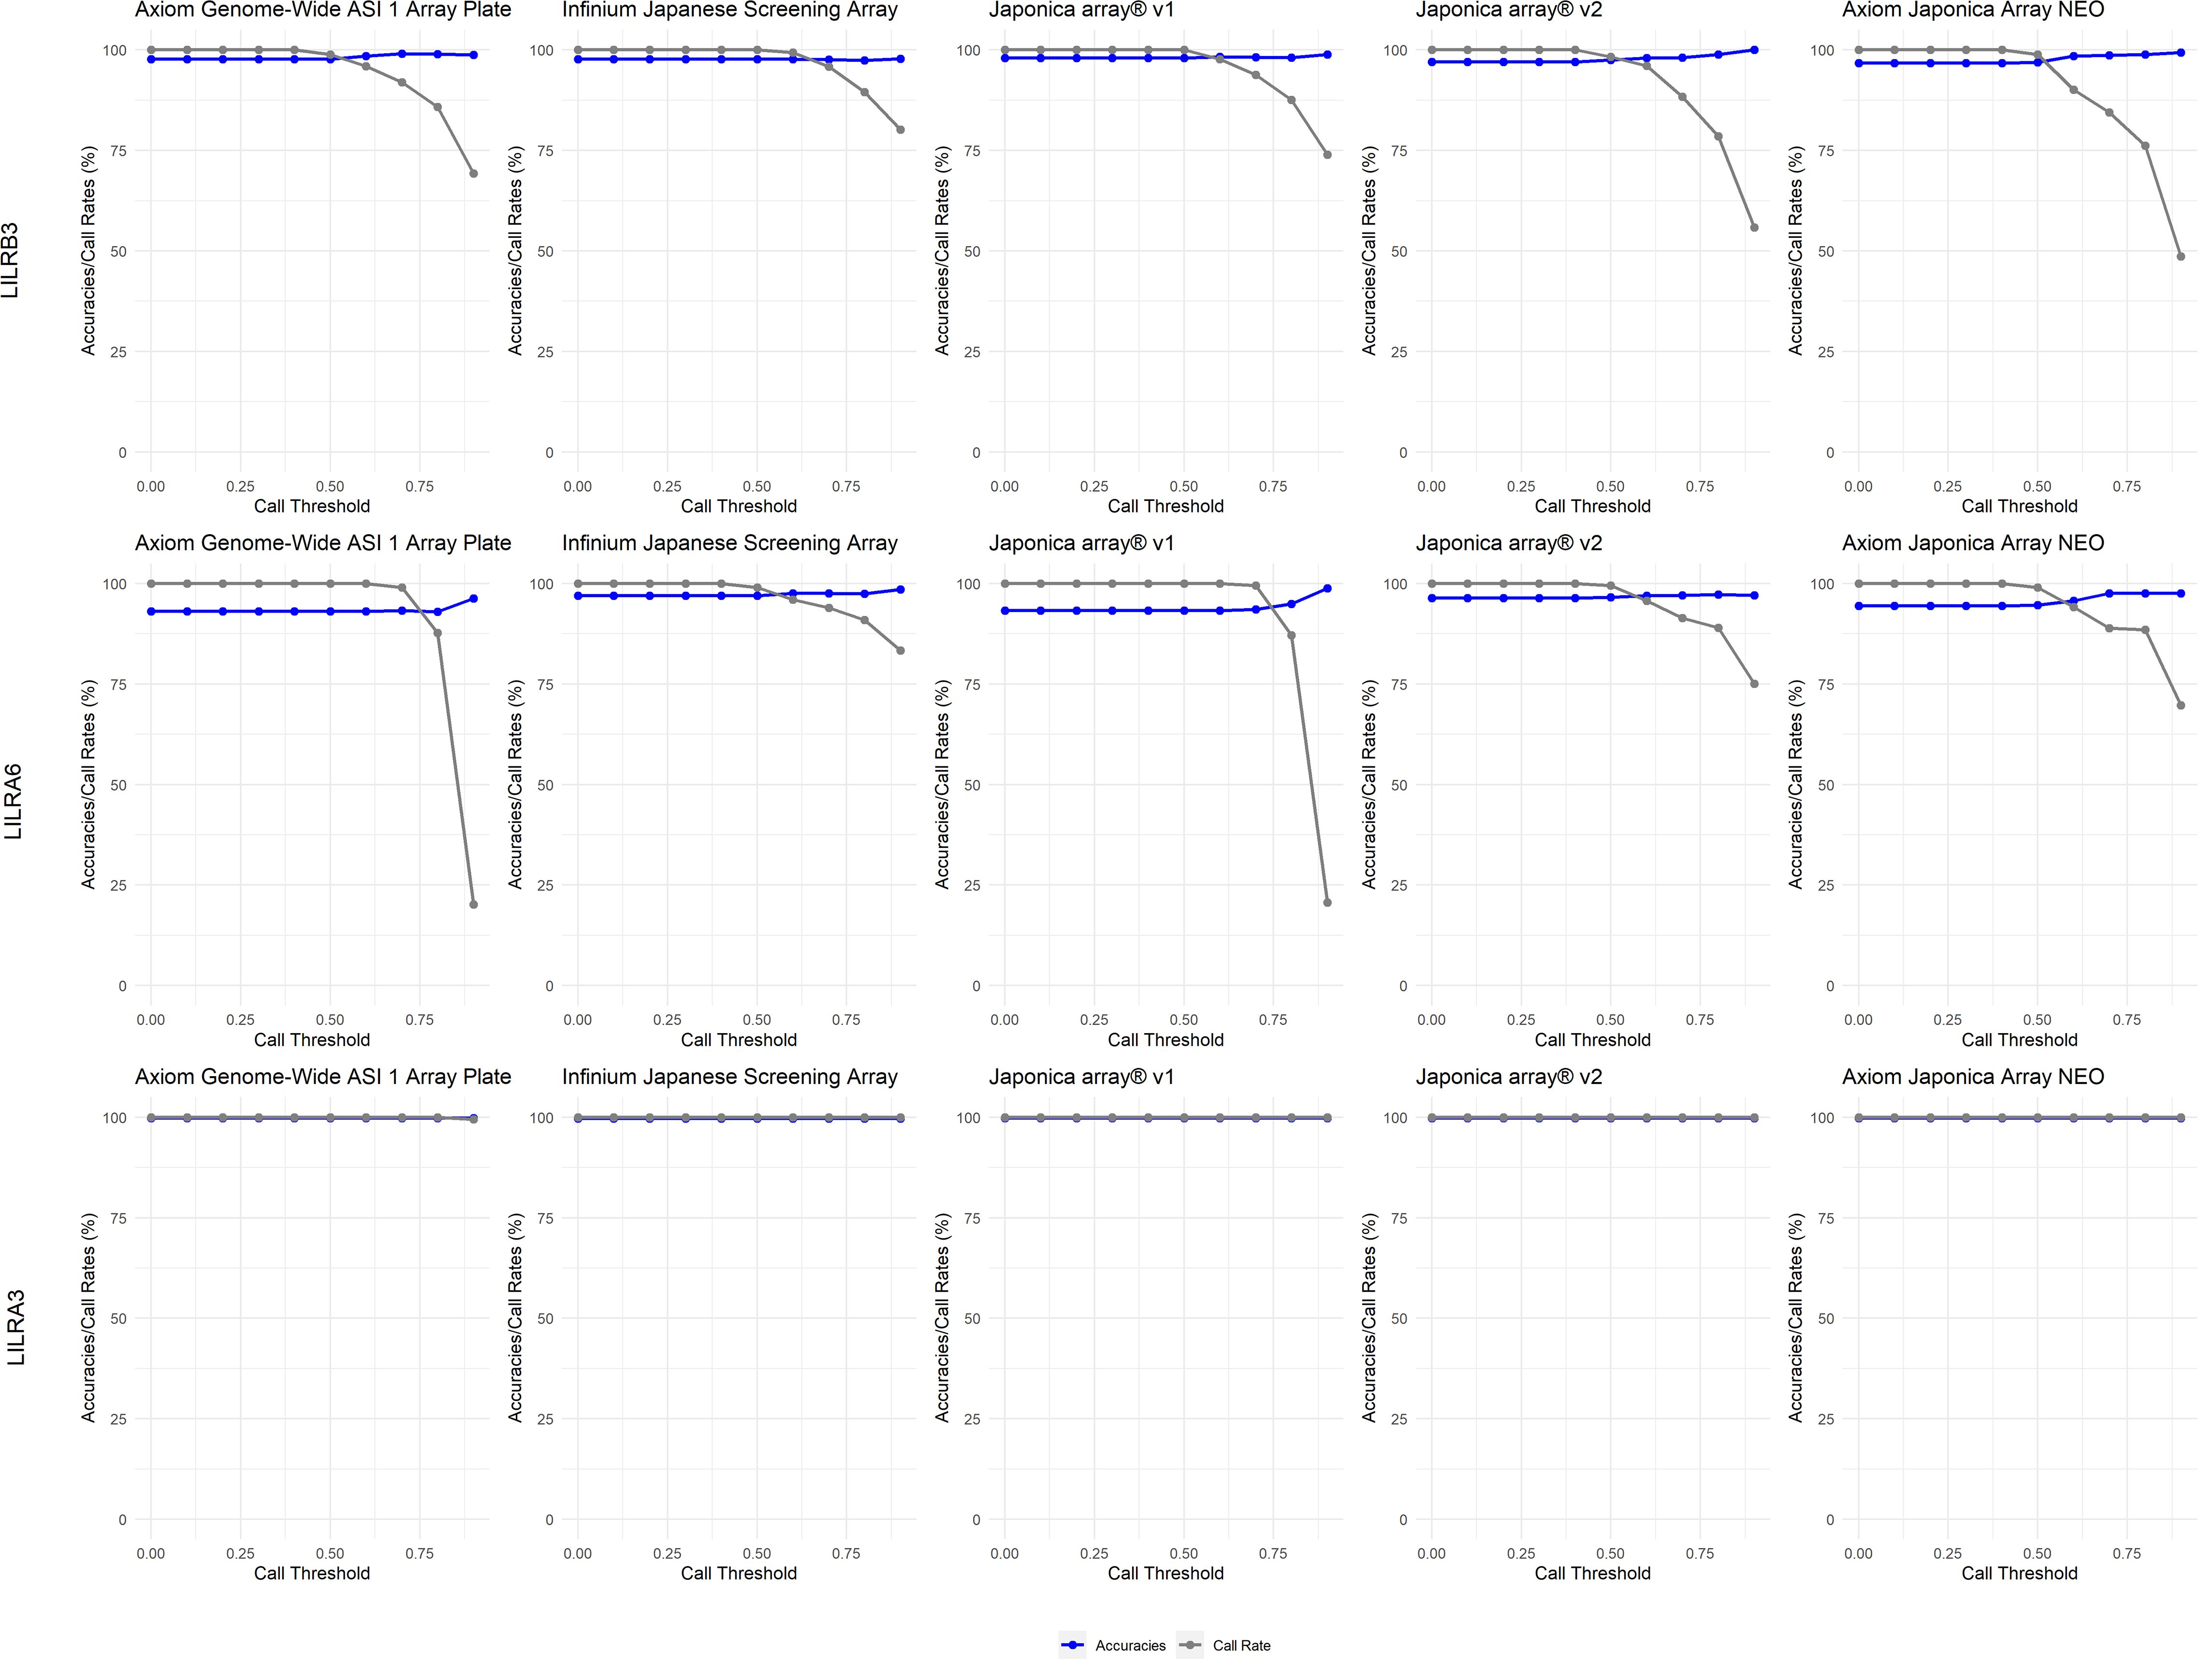
Figure 5. Call threshold evaluations of LILRB3, LILRA6 and LILRA3 on five Asian/Japanese-specific SNP genotyping arrays: Axiom Genome-Wide ASI 1 Array Plate, Infinium Japanese Screening Array, Japonica array®v1, Japonica array®v2 and Axiom Japonica Array NEO.
Generally, a 0.5 CT is also suitable for the 1kGP dataset (Figure 6), except for 1kGP-EUR for LILRA6, where 0.4 is essential to maximize the call rate.
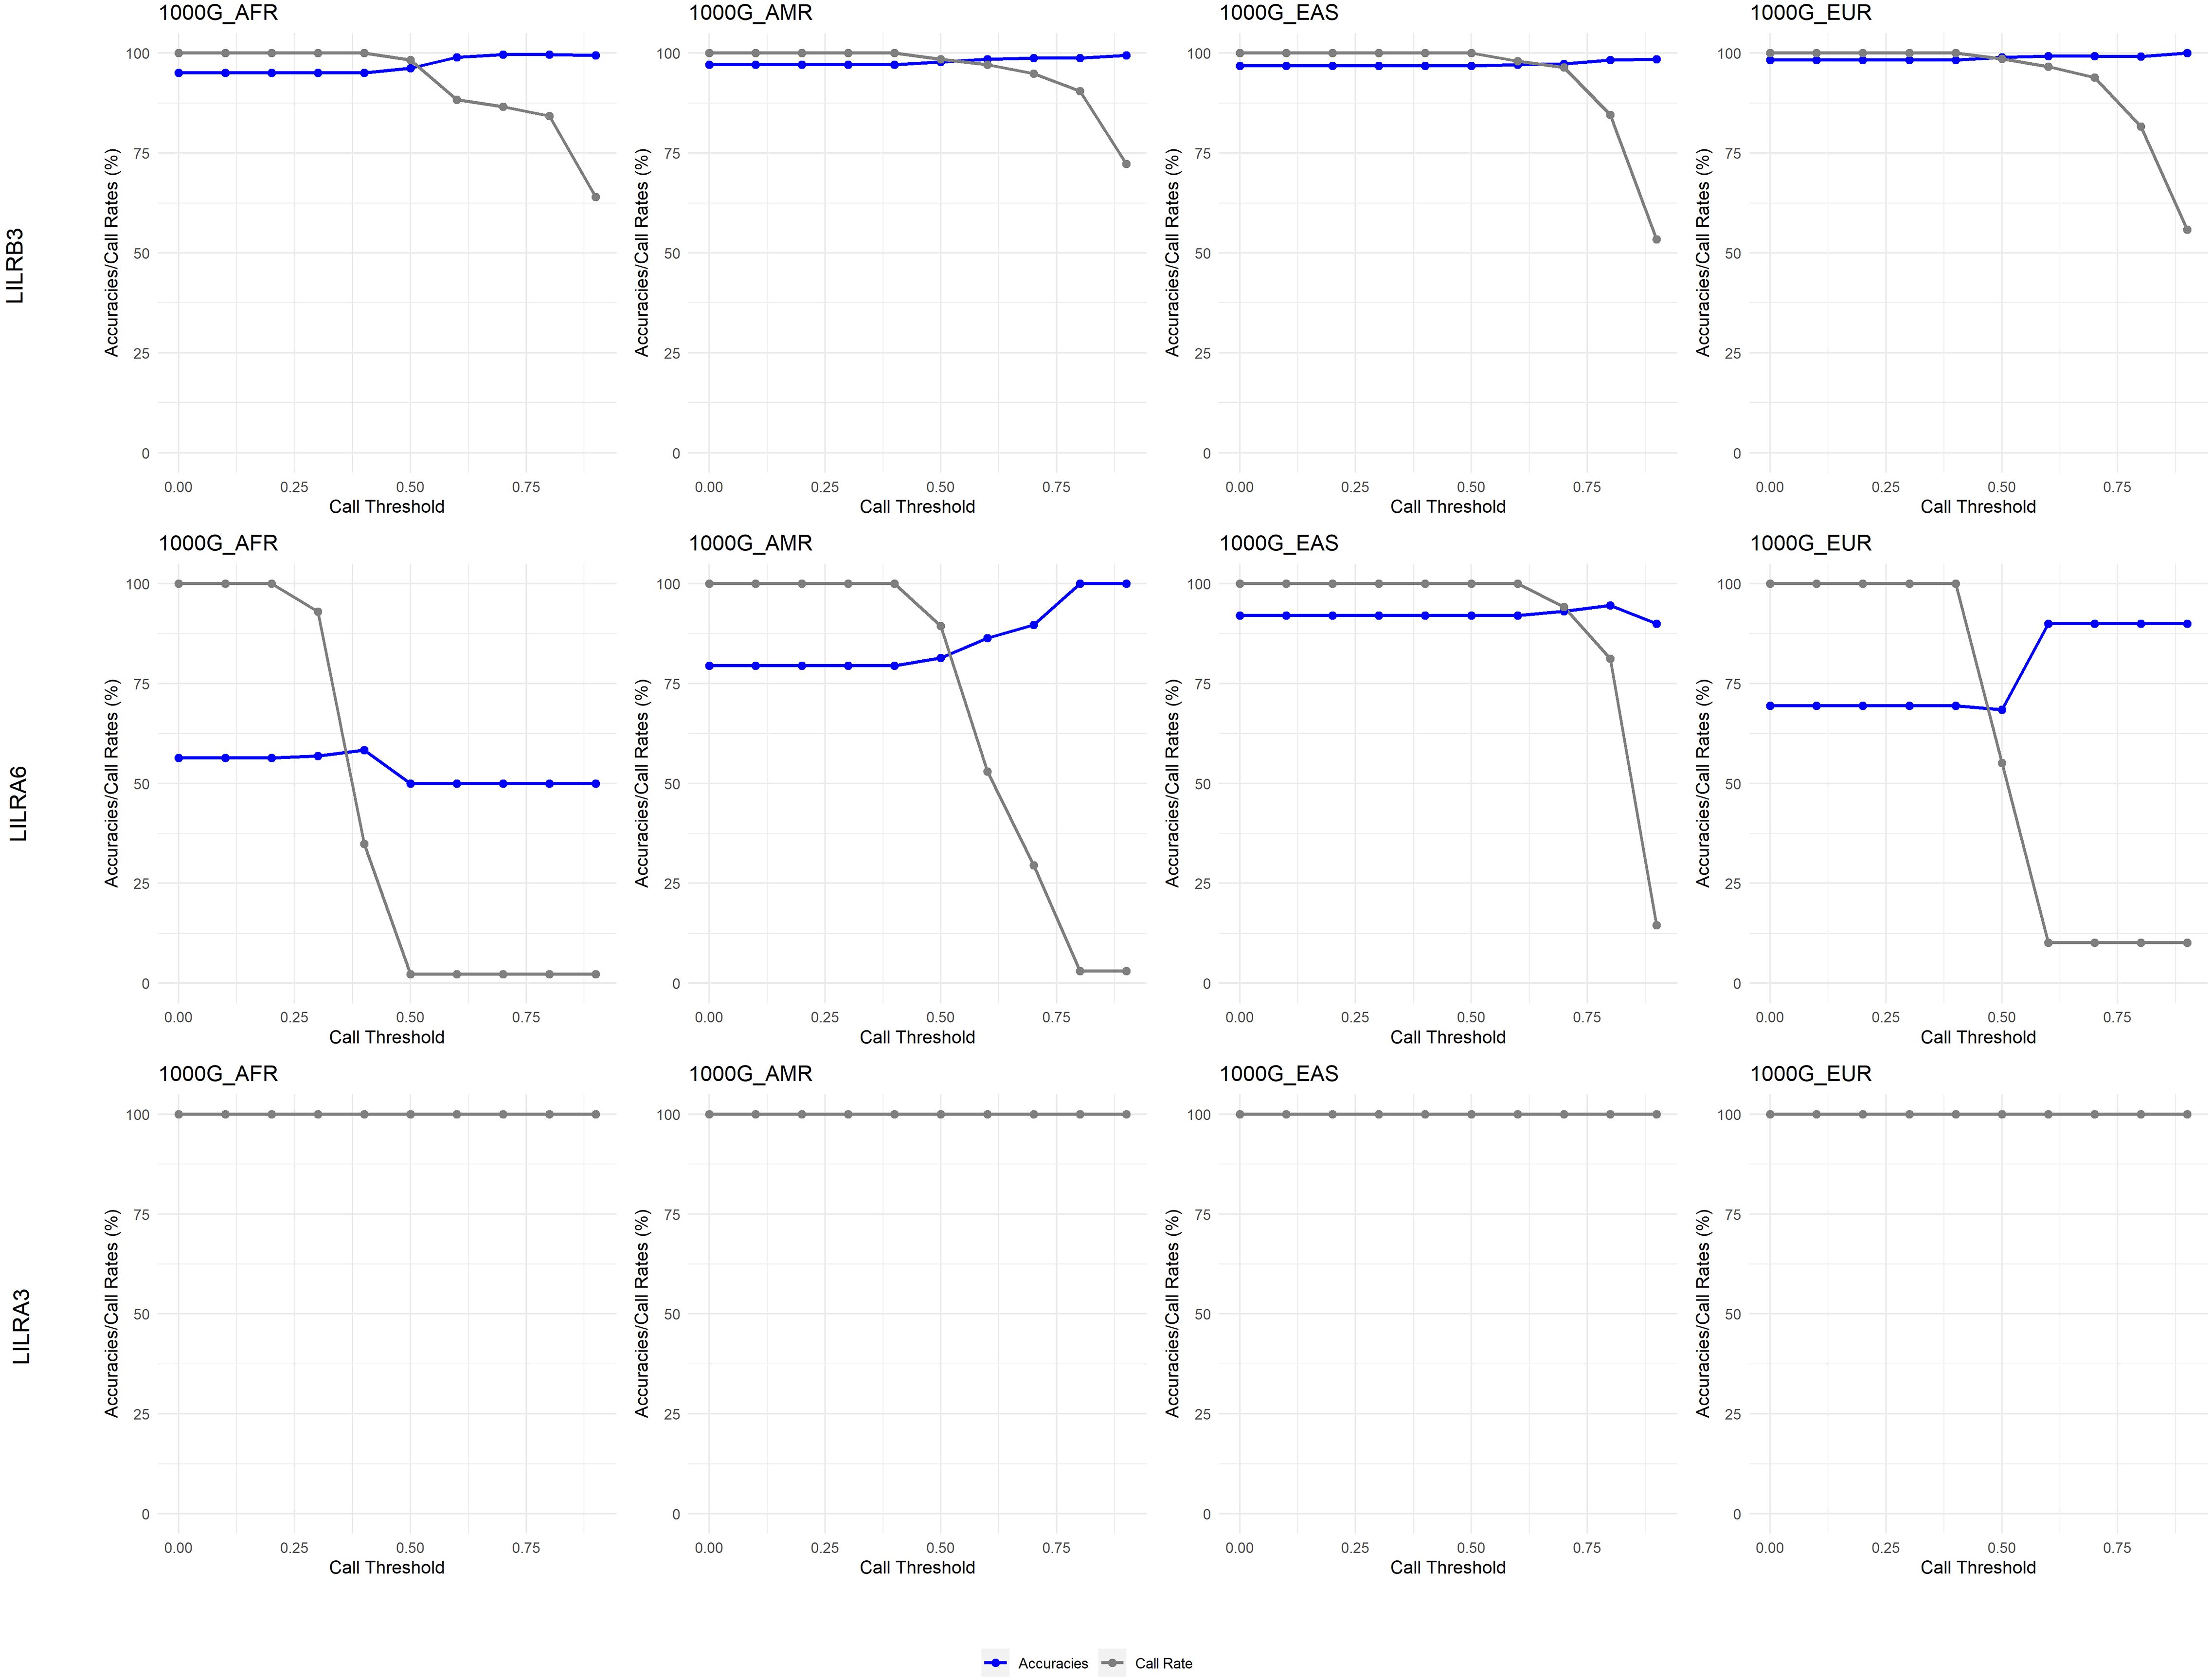
Figure 6. Call threshold evaluations of LILRB3, LILRA6 and LILRA3 across four 1000 Genome Project superpopulations. AFR, African; AMR, Admixed American; EAS, East Asian; EUR, European; CN, Copy Number.
This study introduced LIBAG, a tool designed for CNV imputation, exclusively using SNP genotype data from SNP microarray datasets. The current version focuses on three LILR genes with known substantial CNV: LILRB3, LILRA6, and LILRA3. CNV in the LRC region complicates the design of distinct SNPs on conventional SNP genotyping arrays that adequately account for CNV in this area. Therefore, instead of relying on SNPs within the LILR genes, which exhibit high CN, LIBAG utilizes SNPs in their flanking regions of LILRB3, LILRA6, and LILRA3. This approach mitigates the issue of inadequate SNPs in LILR regions and facilitates CNV imputation for these genes.
In this study, we successfully developed a population-specific LILR CN imputation system and validated it internally and externally. Using a Japanese dataset genotyped on five distinct SNP microarray platforms, we directly assessed LILR CN imputation efficiency (Figure 2). SNP density surrounding the LILR and LILR CN distribution were directly linked to LILR CN accuracy. LILRA6 CN accuracies reached up to 98.0% with the Infinium Japanese Screening Array, while LILRA3 and LILRB3 CN accuracies remained stable at approximately 99%. External validation using an independent NMC dataset corroborated the interval validation results, achieving 96.7% accuracy for LILRA6 and 98.1% for LILRA3. This finding highlights the robustness of the LILR-CN imputation panel. Our findings indicate that population-specific SNP microarrays, such as the Infinium Japanese Screening Array and Axiom Japonica arrays, are more efficient at capturing population-specific CNV, as demonstrated by the CN distribution across various populations (Figures 2, 3).
LILR receptors interact with conserved HLA motif epitopes located within the α3 domain and/or the highly conserved β2 microglobulin structure. Inhibitory LILRB receptors, recognize HLA class I molecules, particularly those expressing non-classical HLA-G (20). These interactions trigger inhibitory signals, suppressing the immune response mediated by HLA class I proteins, thereby promoting immune tolerance (21).
Genome-wide association studies (GWAS) have revealed that several LILRs are associated with diseases, such as Takayasu arteritis (LILRB3/LILRA3) (22, 23) and prostate cancer (LILRA3) (24). The effect of CNV on these conditions requires further investigation; however, a positive correlation exists between the relative expression levels of LILRA6/LILRB3 mRNA and the CNV genotype, with higher copies of LILRA6 resulting in an elevated LILRA6/LILRB3 ratio (25). Therefore, higher LILRA6 copy numbers may induce a shift towards an activation phenotype. Additional functional and large-scale population-based case-control studies will offer insights into the functional significance of CNV for these LILRs. Case-control analysis of disease should be accompanied by an examination of classical HLA class I molecules, including HLA-A, -B, and -C, as well as non-classical HLA-G, and their interactions with LILRs.
Publicly available short-read whole-genome sequencing (srWGS) data were downloaded from the International Genome Sample Resource database (https://www.internationalgenome.org/data-portal/data-collection/30x-grch38). The SNP microarray dataset, genotyped using the Illumina Omni2.5 microarray (Illumina, CA, US), was downloaded from http://ftp.1000genomes.ebi.ac.uk/vol1/ftp/release/20130502/supporting/hd_genotype_chip/ .
The studies involving humans were approved by The University of Tokyo National Center for Global Health and Medicine National Hospital Organization Nagasaki Medical Center (NMC). The studies were conducted in accordance with the local legislation and institutional requirements. The participants provided their written informed consent to participate in this study.
S-SK: Conceptualization, Formal Analysis, Investigation, Methodology, Project administration, Software, Validation, Visualization, Writing – original draft, Writing – review & editing. KH: Funding acquisition, Investigation, Methodology, Validation, Writing – review & editing. YK: Methodology, Project administration, Resources, Writing – review & editing. HK: Resources, Supervision, Writing – review & editing. MN: Conceptualization, Data curation, Funding acquisition, Investigation, Methodology, Project administration, Resources, Software, Writing – review & editing. KT: Conceptualization, Funding acquisition, Investigation, Project administration, Supervision, Writing – review & editing.
The author(s) declare that financial support was received for the research and/or publication of this article. This work was supported by the Japan Agency for Medical Research and Development under grant numbers JP22fk0210111 to MN and KT, JP23wm0225036 to KH, and JST FOREST Program (Grant Number JPMJFR230J, Japan) to KH. The infrastructure of the Omics Science Center Secure Information Analysis System, Medical Institute of Bioregulation at Kyushu University, provides the (part of) computational resources (https://sis.bioreg.kyushu-u.ac.jp/). This work was supported in part by the MEXT Cooperative Research Project Program, Medical Research Center Initiative for High-Depth Omics, and CUREJPMXP1323015486 for MIB at Kyushu University. This work was partly supported by the Cooperative Research Project Program of the Medical Institute of Bioregulation at Kyushu University. MN received grants from the Japan Agency for Medical Research and Development (AMED) (Grant Numbers JP21wm0425009, JP22fk0210111, JP22tm0424222, JP23ek0109675, JP23ek0109672, JP23fk0210138, JP23ek0210194, JP24gm2010001), JST NBDC (grant number JPMJND2302), and JSPS KAKENHI (grant number JP21H02681). This work was partially supported by the “Joint Usage/Research Center for Interdisciplinary Large-scale Information Infrastructures” and “High Performance Computing Infrastructure” in Japan (Project ID: jh200047-NWH, jh210018-NWH, jh220014, jh230016, and jh240015).
Figure 1 is created in BioRender. Khor, S. (2025) https://biorender.com/o7tfw5d.
The authors declare that the research was conducted in the absence of any commercial or financial relationships that could be construed as a potential conflict of interest.
The author(s) declared that they were an editorial board member of Frontiers, at the time of submission. This had no impact on the peer review process and the final decision.
The author(s) declare that no Generative AI was used in the creation of this manuscript.
All claims expressed in this article are solely those of the authors and do not necessarily represent those of their affiliated organizations, or those of the publisher, the editors and the reviewers. Any product that may be evaluated in this article, or claim that may be made by its manufacturer, is not guaranteed or endorsed by the publisher.
The Supplementary Material for this article can be found online at: https://www.frontiersin.org/articles/10.3389/fimmu.2025.1559301/full#supplementary-material
1. Volz A, Wende H, Laun K, Ziegler A. Genesis of the ILT/LIR/MIR clusters within the human leukocyte receptor complex. Immunol Rev. (2001) 181:39–51. doi: 10.1034/j.1600-065x.2001.1810103.x
2. Barrow AD, Trowsdale J. The extended human leukocyte receptor complex: diverse ways of modulating immune responses. Immunol Rev. (2008) 224:98–123. doi: 10.1111/j.1600-065X.2008.00653.x
3. Nakajima H, Samaridis J, Angman L, Colonna M. Human myeloid cells express an activating ILT receptor (ILT1) that associates with Fc receptor gamma-chain. J Immunol. (1999) 162:5–8. doi: 10.4049/jimmunol.162.1.5
4. Borges L, Hsu ML, Fanger N, Kubin M, Cosman D. A family of human lymphoid and myeloid Ig-like receptors, some of which bind to MHC class I molecules. J Immunol. (1997) 159:5192–6. doi: 10.4049/jimmunol.159.11.5192
5. Colonna M, Nakajima H, Navarro F, Lopez-Botet M. A novel family of Ig-like receptors for HLA class I molecules that modulate function of lymphoid and myeloid cells. J Leukoc Biol. (1999) 66:375–81. doi: 10.1002/jlb.66.3.375
6. Brown D, Trowsdale J, Allen R. The LILR family: modulators of innate and adaptive immune pathways in health and disease. Tissue Antigens. (2004) 64:215–25. doi: 10.1111/j.0001-2815.2004.00290.x
7. Jones DC, Kosmoliaptsis V, Apps R, Lapaque N, Smith I, Kono A, et al. HLA class I allelic sequence and conformation regulate leukocyte Ig-like receptor binding. J Immunol. (2011) 186:2990–7. doi: 10.4049/jimmunol.1003078
8. Ryu M, Chen Y, Qi J, Liu J, Fan Z, Nam G, et al. LILRA3 binds both classical and non-classical HLA class I molecules but with reduced affinities compared to LILRB1/LILRB2: structural evidence. PloS One. (2011) 6:e19245. doi: 10.1371/journal.pone.0019245
9. Hirayasu K, Sun J, Hasegawa G, Hashikawa Y, Hosomichi K, Tajima A, et al. Characterization of LILRB3 and LILRA6 allelic variants in the Japanese population. J Hum Genet. (2021) 66:739–48. doi: 10.1038/s10038-021-00906-0
10. Hirayasu K, Arase H. Functional and genetic diversity of leukocyte immunoglobulin-like receptor and implication for disease associations. J Hum Genet. (2015) 60:703–8. doi: 10.1038/jhg.2015.64
11. Bashirova AA, Apps R, Vince N, Mochalova Y, Yu XG, Carrington M. Diversity of the human LILRB3/A6 locus encoding a myeloid inhibitory and activating receptor pair. Immunogenetics. (2014) 66:1–8. doi: 10.1007/s00251-013-0730-9
12. Lopez-Alvarez MR, Jones DC, Jiang W, Traherne JA, Trowsdale J. Copy number and nucleotide variation of the LILR family of myelomonocytic cell activating and inhibitory receptors. Immunogenetics. (2014) 66:73–83. doi: 10.1007/s00251-013-0742-5
13. Torkar M, Haude A, Milne S, Beck S, Trowsdale J, Wilson MJ. Arrangement of the ILT gene cluster: a common null allele of the ILT6 gene results from a 6.7-kbp deletion. Eur J Immunol. (2000) 30:3655–62. doi: 10.1002/1521-4141(200012)30:12<3655::AID-IMMU3655>3.0.CO;2-Y
14. Hirayasu K, Ohashi J, Kashiwase K, Takanashi M, Satake M, Tokunaga K, et al. Long-term persistence of both functional and non-functional alleles at the leukocyte immunoglobulin-like receptor A3 (LILRA3) locus suggests balancing selection. Hum Genet. (2006) 119:436–43. doi: 10.1007/s00439-006-0152-y
15. Hirayasu K, Ohashi J, Tanaka H, Kashiwase K, Ogawa A, Takanashi M, et al. Evidence for natural selection on leukocyte immunoglobulin-like receptors for HLA class I in Northeast Asians. Am J Hum Genet. (2008) 82:1075–83. doi: 10.1016/j.ajhg.2008.03.012
16. Nagasaki M, Hirayasu K, Khor SS, Otokozawa R, Sekiya Y, Kawai Y, et al. JoGo-LILR caller: Unveiling and navigating the complex diversity of LILRB3-LILRA6 copy number haplotype structures with whole-genome sequencing. Hum Immunol. (2025) 86:111272. doi: 10.1016/j.humimm.2025.111272
17. Abyzov A, Urban AE, Snyder M, Gerstein M. CNVnator: an approach to discover, genotype, and characterize typical and atypical CNVs from family and population genome sequencing. Genome Res. (2011) 21:974–84. doi: 10.1101/gr.114876.110
18. Zheng X, Shen J, Cox C, Wakefield JC, Ehm MG, Nelson MR, et al. HIBAG–HLA genotype imputation with attribute bagging. Pharmacogenomics J. (2014) 14:192–200. doi: 10.1038/tpj.2013.18
19. Khor SS, Yang W, Kawashima M, Kamitsuji S, Zheng X, Nishida N, et al. High-accuracy imputation for HLA class I and II genes based on high-resolution SNP data of population-specific references. Pharmacogenomics J. (2015) 15:530–7. doi: 10.1038/tpj.2015.4
20. Baia D, Pou J, Jones D, Mandelboim O, Trowsdale J, Muntasell A, et al. Interaction of the LILRB1 inhibitory receptor with HLA class Ia dimers. Eur J Immunol. (2016) 46:1681–90. doi: 10.1002/eji.201546149
21. Zeller T, Munnich IA, Windisch R, Hilger P, Schewe DM, Humpe A, et al. Perspectives of targeting LILRB1 in innate and adaptive immune checkpoint therapy of cancer. Front Immunol. (2023) 14:1240275. doi: 10.3389/fimmu.2023.1240275
22. Renauer PA, Saruhan-Direskeneli G, Coit P, Adler A, Aksu K, Keser G, et al. Identification of susceptibility loci in IL6, RPS9/LILRB3, and an intergenic locus on chromosome 21q22 in takayasu arteritis in a genome-wide association study. Arthritis Rheumatol. (2015) 67:1361–8. doi: 10.1002/art.39035
23. Terao C, Yoshifuji H, Matsumura T, Naruse TK, Ishii T, Nakaoka Y, et al. Genetic determinants and an epistasis of LILRA3 and HLA-B*52 in Takayasu arteritis. Proc Natl Acad Sci U.S.A. (2018) 115:13045–50. doi: 10.1073/pnas.1808850115
24. Xu J, Mo Z, Ye D, Wang M, Liu F, Jin G, et al. Genome-wide association study in Chinese men identifies two new prostate cancer risk loci at 9q31.2 and 19q13.4. Nat Genet. (2012) 44:1231–5. doi: 10.1038/ng.2424
Keywords: LILR, LIBAG, imputation, copy number, SNP, GWAS, CNV, HLA
Citation: Khor S-S, Hirayasu K, Kawai Y, Kim HL, Nagasaki M and Tokunaga K (2025) LILR genotype imputation with attribute bagging (LIBAG): leukocyte immunoglobulin-like receptor copy number imputation system. Front. Immunol. 16:1559301. doi: 10.3389/fimmu.2025.1559301
Received: 12 January 2025; Accepted: 17 March 2025;
Published: 07 April 2025.
Edited by:
Fuminori Tokunaga, Osaka Metropolitan University, JapanReviewed by:
Aruna Pal, West Bengal University of Animal and Fishery Sciences, IndiaCopyright © 2025 Khor, Hirayasu, Kawai, Kim, Nagasaki and Tokunaga. This is an open-access article distributed under the terms of the Creative Commons Attribution License (CC BY). The use, distribution or reproduction in other forums is permitted, provided the original author(s) and the copyright owner(s) are credited and that the original publication in this journal is cited, in accordance with accepted academic practice. No use, distribution or reproduction is permitted which does not comply with these terms.
*Correspondence: Seik-Soon Khor, c2Vpa3Nvb25AZ21haWwuY29t
Disclaimer: All claims expressed in this article are solely those of the authors and do not necessarily represent those of their affiliated organizations, or those of the publisher, the editors and the reviewers. Any product that may be evaluated in this article or claim that may be made by its manufacturer is not guaranteed or endorsed by the publisher.
Research integrity at Frontiers
Learn more about the work of our research integrity team to safeguard the quality of each article we publish.