 Matias G. Perez1*
 Victoria Gillan1
 William M. Anderson1
 François Gerbe2
 Fabien Herbert2
 Tom N. McNeilly3
 Rick M. Maizels4
 Philippe Jay2
 Eileen Devaney1
 Collette Britton1*
- 1School of Biodiversity, One Health and Veterinary Medicine, University of Glasgow, Glasgow, United Kingdom
- 2Institute of Functional Genomics (IGF), University of Montpellier, CNRS, Inserm, Montpellier, France
- 3Disease Control Department, Moredun Research Institute, Penicuik, United Kingdom
- 4Centre for Parasitology, School of Infection and Immunity, University of Glasgow, Glasgow, United Kingdom
Pathogens have developed multiple strategies to modulate host immune defense mechanisms. Understanding how this is achieved has potential to inform novel therapeutics for diseases caused by immune dysfunction. Parasitic helminths are masters of immune evasion, via release of secreted products, resulting in chronic infection. Helminths secrete small regulatory microRNA (miRNAs), which can interact with host cells. Here we show that a single parasite miRNA (miR-5352), conserved across gastrointestinal (GI) nematodes, suppresses IL-13-induced GI epithelial cell differentiation and cytokine responses, and promotes stem cell maintenance. Mechanistically, this is achieved through targeted repression of critical host factors, including Klf-4 and the IL-22 receptor, together with modulation of Wnt and Notch signalling pathways. Nematode miR-5352 shows seed sequence conservation with mammalian miR-92a family members, indicating that through convergent evolution, GI nematodes exploit a host miRNA regulatory network to suppress host innate responses, promote tissue regeneration and establish a favourable environment for chronic infection.
1 Introduction
To successfully establish and survive for a protracted time in a host, parasites extensively modulate immune defense mechanisms. Helminth parasites that inhabit the gastrointestinal (GI) tract are among the most ubiquitous and successful pathogens. They infect over 1.5 billion people (1) and are a major cause of livestock production losses globally (2, 3). The success of these parasites can be attributed to their ability to manipulate host immune responses by modifying surrounding tissue and limiting inflammation, leading to a chronic infection with minimal tissue damage (4). Characterisation of proteins produced and secreted by helminths has led to the discovery of several immunomodulators (5, 6). Little is known, however, about the targets and effects of helminth secreted small RNAs, including microRNAs (miRNAs).
MiRNAs were first identified as regulators of developmental timing in the free-living model nematode Caenorhobditis elegans (7, 8). This seminal work defined a fundamental principle governing how gene expression is regulated (9) (Nobel Prize in Physiology or Medicine 2024 (10)). MiRNAs modulate gene expression post-transcriptionally by binding to the 3’UTR of their target mRNAs, resulting in inhibition of protein translation and transcript degradation (11). The repertoires of miRNAs expressed and secreted by various helminth species have been described, including those from GI dwelling and filaria nematodes (12–14). The secretion of helminth miRNAs has stimulated interest that they function as potential regulators of host gene expression, and for filarial nematodes, could also be potential diagnostic markers of infection due to their detection in host serum (12, 14). MiRNAs in helminth excretory-secretory (ES) products are present within extracellular vesicles (EVs) or in non-vesicular forms. While helminth EVs have been shown to modulate host cell gene expression (12, 15–18), the targets and effects of specific secreted helminth miRNAs on host GI cells have not been examined.
Following GI helminth infection, epithelial tuft cells, the first sensors and responders to GI parasites, secrete the cytokine IL-25, which activates type 2 innate lymphoid cells (ILC2s) to release the type-2 cytokines, IL-4 and IL-13 (19–21). The resulting tuft and goblet (mucous) cell hyperplasia initiates the weep and sweep response that promotes helminth expulsion (19). While parasite presence can stimulate epithelial cell responses, some parasites also modulate this response, leading to chronic infection. Nematode ES products are therefore complex, comprising activators and suppressors of host immunity. Secreted products from adult worms of the murine nematode Heligmosomoides polygyrus can suppress tuft and goblet cell expansion in response to treatment with IL-4 and IL-13, in vitro and in vivo (22), but the specific parasite molecules involved have not been identified.
To establish in the gut, parasitic helminths modulate the epithelium of the GI tract. The GI epithelium is ordered into stem cells (SC), transient-amplifying (TA) cells and differentiated cell compartments (23, 24). The unique ability of GI epithelial tissue to continuously regenerate is mediated by SC located in gastric glands or intestinal crypts (25, 26). In the small intestine (SI), epithelial cell fate depends on the transcription factors Atoh1 and Hes1, which regulate Lgr5+ SC to follow secretory or absorptive cell lineages, respectively (27). Secretory cells include goblet, tuft, enteroendocrine, parietal, surface mucous and Paneth cells, while absorptive cells comprise enterocytes (28). Additionally, signalling pathways, including Wnt, Notch, Hippo and BMP regulate cell renewal and maintain homeostasis of the GI tract (24, 29). The different cell types help maintain GI epithelial barrier integrity and immune tolerance at steady state, and play specific roles in response to bacterial, parasitic and viral infections (30). Perturbations in GI epithelial cell activity and tolerance can lead to inflammatory bowel diseases (IBD), such as Crohn’s and ulcerative colitis (31).
The parasite molecules and mechanisms involved in altering epithelial cell fate are not known. Interaction of parasite miRNAs with host target genes is a mechanism that requires further investigation. We previously reported the miRNA repertoire of the important veterinary nematode Haemonchus contortus (32), a blood-feeding ovine abomasum (gastric) parasite related to human hookworms. H. contortus is studied extensively as a model nematode for drug discovery, vaccine development and anthelmintic resistance because of the high-quality genome resources available (33). We identified a group of 23 miRNAs in ES products released from H. contortus parasitic L4 larvae and adult stages, including a cluster containing hco-miR-5352. Intriguingly, miR-5352 is conserved in other GI parasitic nematodes, including human-infective hookworms and Ascaris suum, but is not reported in tissue dwelling nematodes (34). This led us to speculate that this miRNA could be important in parasite interaction with the host gut environment. Consistent with this, miR-5352 was detected in abomasal tissue and draining lymph nodes of H. contortus-infected animals, indicating release in vivo and potential to modulate host gene expression (34).
Here, we demonstrate that H. contortus ES products and miR-5352 alone can suppress the differentiation of GI epithelial secretory cells required for innate immunity. Transfection of murine and ovine GI organoids with a mimic of miR-5352 maintained organoid stemness and suppressed the effects of IL-13 on tuft and mucous cell differentiation. Mechanistically, this is achieved by repression of key host target genes including transcription factor Krüppel-like factor 4 (Klf4), IL-22 receptor subunit alpha 1 (Il22ra1) and modulators of Wnt and Notch signalling pathways. Notably, nematode miR-5352 shows seed sequence conservation with mammalian miR-92a family members. Our data indicate that through convergent evolution, GI nematodes hijack a host miRNA regulatory network to suppress host innate responses and promote GI epithelial regeneration and homeostasis, creating an environmental niche for their survival.
2 Materials and methods
2.1 Animal and parasite samples
Animal procedures were performed at Moredun Research Institute (MRI) under license as required by the UK Animals Scientific Procedures Act 1986, with ethical approval from MRI Animal Experiments Committee. Ovine abomasum (gastric) tissues for organoid cultures were obtained from four different naïve animals raised at MRI under conditions designed to exclude accidental infection with helminth parasites. Tissue was removed using a sterile scalpel and placed into sterile ice-cold Hank’s buffered saline solution (HBSS; Sigma) to be transported to the laboratory.
Adult H. contortus parasites, MHco3(ISE) strain, were obtained from three different male lambs infected with 5,000 H. contortus third stage (L3) larvae. Adults were collected at post-mortem at day 42 post-infection (p.i). The abomasum was opened and washed with 0.9% saline solution to remove and collect the worms, which were then extensively washed in saline solution and transported to the laboratory in HBSS.
2.2 Culture of ovine abomasum and small intestine 3D organoids
Gastric glands were obtained from the fundic gastric fold of ovine abomasum. The gastric glands were extracted, and organoid cultures established from gland stem cells as described by Smith et al. (35). Briefly, gastric glands were resuspended in 1 ml advanced DMEM/F12 (12634-010; Gibco) containing 1X B27 supplement minus vitamin A (12587-010; Gibco), 25 µg/ml gentamicin and 100 U/ml penicillin/streptomycin and counted using 10 µl of the suspension under the microscope in a Petri dish. Between 300 to 350 gastric glands per well were seeded into 24-well flat-bottomed plates (Corning) using 50 µl of Matrigel (Corning). After incubation for 20 min at 37°C, 650 µl of IntestiCult Organoid Growth Media (OGM) (STEMCELL Technologies, 6005) with 50 µg/ml gentamicin was added. To maintain organoid stemness, inhibitors were added: i) selective Rho kinase inhibitor: Y-27632 (10µM) (Cambridge Bioscience, 10005583-1 mg-CAY) ii) selective TGF-β receptor type I (TGF-βRI) kinase inhibitor:LY2157299 (500nM) (Cambridge BioScience, 15312-1 mg-CAY) and iii) selective p38 MAP kinase inhibitor: SB202190 (10 µM) (Enzo Life Science, ALX-270-268-M001) as previously reported by Smith et al. (35). Organoids were established and grown at 37°C in 5% CO2 with a change of medium every 2-3 days. Organoids were passaged three times by dissociation and reseeded at 300 to 350 organoids per well in 50 µl Matrigel (Corning®, CLS356231-1EA), prior to experimental treatments. For specific experiments to increase stem cell differentiation, IntestiCult™ Organoid Differentiation Medium (ODM) (Catalog # 100-0214) was used. Ovine small intestinal (SI) organoids were provided by Dr David Smith (MRI) and cultured under the same conditions as for abomasum organoids.
2.3 Murine small intestine tuft cell reporter 3D organoids
Organoids from mice combining conditional (Cre-dependent) tdTomato reporter allele known as Ai14 (Gt (ROSA)26Sortm14(CAG-tdTomato)Hze; JAX:007908) and inducible, tuft cell-specific, Cre enzyme (Dclk1-CreERT2) alleles were generated at University of Montpellier by PJ, FH, FG. Details of the Dclk1-CreERT2 allele (Dclk1tm1.1(cre/ERT2)Jay) are available from Mouse Genome Informatics (MGI) (https://www.informatics.jax.org/allele/MGI:5563428).
Tamoxifen was added at final concentration of 0.5 μM for one day to induce recombination. Organoids were cultured in IntestiCult OGM with 50 µg/ml gentamicin, at 37°C in 5% CO2. The medium was changed every 2-3 days, and organoids were passaged three times by dissociation and reseeding before experimental treatments (36). The phenotype of organoids was checked using an EVOS M5000 Imaging System (Thermo Fisher Scientific) three days after tamoxifen treatment.
2.4 Preparation of H. contortus excretory-secretoryproducts
One hundred H. contortus adults (50 males and 50 females) were collected from three different infected animals and washed six times in warm HBSS. Further washes were carried in HBSS plus penicillin/streptomycin (2U/ml), followed by washing for 20 minutes in HBSS gentamicin (0.5 μg/ml) then worms were rewashed four more times with HBSS. Finally, worms were cultured in 50 ml of HBSS without phenol red (Sigma H864) at 37°C in 5% CO2. Medium containing ES products was collected at 24 h, centrifuged at 1500 g for 5 minutes and filtered through a 0.22 μm filter to remove released eggs and hatched L1 stages from adult ES. The ES was stored at -80°C until use.
H. contortus ES was used neat or was concentrated using Vivaspin 2, membrane of 3,000 MWCO PED following the manufacturer’s instructions. H. polygyrus ES (1.5 mg/ml) was prepared as previously described by Johnston et al. (37). Qubit® Protein Assay Kit was used for protein quantitation of ES following the manufacturer’s instruction. Concentrated ES was used at 10 µg/ml and neat ES at 2 µg/ml final concentration. The protein concentration for all conditions is shown in Supplementary Table S1.
2.5 miRNA mimic uptake assay
To optimize the uptake of miRNA mimics into organoid cells, preliminary transfection experiments were performed using Cy3-labeled Hco-miR-5352 mimic at a final concentration of 100 nM. Transfection was performed using i) Cy3-labeled Hco-miR-5352 mimic mixed with 300 organoids and incubated for 1 hr at 37°C in 5% CO2, ii) Cy3-labeled Hco-miR-5352 mimic mixed first with lipofectamine TM 3000 reagent according to the manufacturer’s instructions, iii) Cy3-labeled Hco-miR-5352 mimic mixed with DharmaFECT TM according to the manufacturer’s instructions. Organoids were resuspended in advanced DMEM/F12 and plated in 30 μl of Matrigel into 8-well chamber-slide with 400 μl of IntestiCult OGM media for 12 h at 37°C in 5% CO2. For imaging, the organoids were prepared as described in O’Rourke et al. (2016) with some modifications. Briefly, the culture media was removed and replaced with ice-cold 10% buffered formalin from Cell Path (BAF-6000-08A). For fixation, samples were kept at room temperature for 20 minutes, washed twice with immunofluorescence (IF) buffer (0.1% Tween20 in PBS), then 300 μl of DAPI (1 μg/ml) were added for 5 min. The wells were washed three times with 300 μl IF buffer. Finally, slides were mounted using ProLong Gold antifade mountant (P10144, Thermo Fisher Scientific) and imaged by inverted confocal microscopy using a Zeiss LSM 710 Zeiss Zen Black operating software.
2.6 H. contortus miRNA mimics and transfection into GI organoids
To study effects of miR-5352 on host epithelial cell gene expression, we used double-stranded RNA oligonucleotide mimic (miRIDIAN microRNA Mimic-Dharmacon™) at a final concentration of 50 nM (miR-5352 mimic). The final concentration was selected by testing the dose–dependent effects of miRNA mimics (25, 50 and 100 nM) on predicted target gene expression (38). The universal miRIDIAN Mimic Negative Control – DharmaconTM (Catalog Item: CN-0001000-01-50) and scrambled version of miR-5352 (DharmaconTM), both at final concentration of 50nM and with identical design and modifications as miRIDIAN miR-5352 mimic, were used to determine miR-5352 sequence-specific effects (sequences of miRNA mimics shown in Supplementary Table S2).
Organoids were treated with 400 ng/ml of IL-13 (for ovine abomasum or SI organoids, recombinant ovine IL-13, Kingfisher Biotech, INC; or for murine SI organoids, recombinant murine IL-13, PeproTech 210-13) to increase the number of secretory epithelial cells, similar to natural infection, as performed in Drurey et al. (22). In our experiments, IL-4 was not added since it shares the receptor subunit IL-4Rα with IL-13 (19). Organoids without IL-13 were used as controls. To study the effect of miR-5352 mimic on IL-22RA1 expression, organoids were treated with 2ng/ml of recombinant ovine IL-22, BIO-RAD (PSP007) or murine IL-22 recombinant protein, PeproTech® (210-22-10UG). Organoids were transfected with miR-5352 mimic or miRNA control mimic at a final concentration of 50 nM for 1 hr at 37°C, after which the organoids were carefully mixed with Matrigel and transferred into appropriate culture wells with IntesiCult OGM media and corresponding inhibitors for ovine abomasum organoids or without inhibitors for murine SI tuft cell reporter organoids. Organoids were cultured for 2 or 4 days before RNA extraction, 4 days for immunofluorescence assay (IFA) and 12 days for phenotypic studies, in which IL-13 and miR-5352 mimic or control mimic were added every two days when media was changed. Images for phenotypic studies were taken every two days under EVOS M5000 Imaging System (Thermo Fisher Scientific) and inverted confocal microscopy.
2.7 Immunofluorescence confocal microscopy
Immunofluorescence staining was carried out as previously described by O’Rourke et al. (39) with some modifications. Briefly, abomasum and SI organoids were fixed in 10% paraformaldehyde for 20 min at room temperature. Following fixative removal and washing with IF buffer, permeabilization solution was added for 20 min. Primary antibodies (anti-POU2F3, anti-Ki67, anti-KLF4, anti-MUC2, anti-LGR5, anti-CTNNB1) all diluted in blocking solution (IF buffer containing 1% bovine serum albumin (BSA)), were incubated overnight in a humidified chamber at 4°C. Secondary antibodies goat anti-rabbit IgG (H+L) Cross-Adsorbed Secondary Antibody, Alexa Fluor™ 488 and 647 (Thermo Fisher) were incubated at room temperature for 1 h. ProLong Gold (Invitrogen) was added before viewing under a Confocal Zeiss LSM 880. Antibodies are detailed in Supplementary Table S3.
2.8 RNA extraction and RT-qPCR
Total RNA was extracted using RNeasy Micro Kit (QIAGEN) from three wells of ~ 300 organoids each, following manufacturer’s instructions. DNase I was added directly to the column membrane and incubated for 15 min at room temperature and RNA was eluted in 50 μl of RNase-free water. RNA concentration was determined using Qubit™ RNA High Sensitivity (HS) (Thermo Fisher). Samples were stored at -80°C until use. PolyA tailing of RNA and cDNA synthesis was carried out using the miRNA 1st-Strand cDNA Synthesis Kit (Agilent Technologies) according to the manufacturer’s instructions and SuperScript TM III (Invitrogen 18080044). RT-qPCR was performed using the Brilliant III Ultra-Fast SYBR QPCR Master Mix (Agilent Technologies 600882). Samples were analysed using the AriaMx-Real-Time machine and software (Agilent Technologies). All RT-qPCR reactions were carried out at least in triplicate from three biological replicates (organoids originating from three different animals) at day 2 after treatments. Organoids without IL-13 stimulation were included as control, and the expression of predicted miRNA target genes was standardized to expression of ovine Actin (ACTB) or murine Glyceraldehyde 3-phosphate dehydrogenase (GAPDH) as reference genes using the formula reported by Pfaffl et al. (40). To find an appropriate reference gene for normalization of the qPCRs, four ovine and murine genes were analysed by two programs: BestKeeper (41) and NormFinder (42). The gene with Cp standard deviation ≤0.5 with coefficient of correlation ~1 according to BestKeeper analysis and a low stability index according to NormFinder analysis was chosen (Supplementary Figure S1). Primer efficiency was calculated by standard curve using 1:10 serial dilution of cDNA samples. Statistical analyses and plots were generated using the fgStatistics (43). PCR primer sequences are shown in Supplementary Table S4.
2.9 Bioinformatic prediction of Hco-miRNA target genes
To identify potential target mRNAs of H. contortus secreted miRNAs, the 3’ UTRs of ovine (Oar_V4.0; NCBI GCF_000298735.2) and bovine (ARS-UCD 1.2; NCBI GCF_002263795.1) were obtained using the BioMart tool from ensembl.org (44). Bovine 3’UTRs were included in target prediction as the bovine genome is currently better annotated than the ovine genome. MiRanda and RNAhybrid algorithms (45, 46) were used to predict target genes in both genomes for Hco-miR-5352 and the ten most abundant Hco-miRNAs secreted from H. contortus adult and L4 stage, a total of 23 Hco-miRNAs (34). MiRanda parameters used were: i) strict seed pairing; ii) score threshold: 140; iii) energy threshold: -17 kcal/mol; iv) gap open penalty: -9; v) gap extend penalty: -4; vi) scaling parameter: 4. For RNAhybrid, parameters used were: i) energy threshold -20 kcal/mol ii) no G:U in the seed iii) helix constraint 2 to 8. TargetScan (Version 8.0) was also used for supporting predictions, using default settings and canonical target sites of 7mer and 8mer (47) predicted in bovine 3’UTR. Target genes predicted by at least two of the three algorithms were considered high confidence targets. The orthologs between ovine and bovine were obtained using eggNOG-mapper v2 (48). All the data was integrated using R/Bioconductor package ‘dplyr’ version 1.0.10 (49). Dr. Tom’s network platform of BGI (https://biosys.bgi.com) was applied to construct and visualize the biological-term classification and enrichment analysis.
2.10 RNA-seq
Ovine abomasum organoids were exposed to four different conditions for 48 h before RNA extraction and sequencing i) medium alone (control) ii) Stimulated with IL-13 (IL-13) iii) Stimulated with IL-13 and transfected with miRNA mimic-control (control mimic+IL-13) iv) Stimulated with IL-13 and transfected with miR-5352 mimic (miR-5352 +IL-13). Four biological replicates were used for each condition (n=4). Total RNA was extracted using RNeasy Micro Kit (QIAGEN) from three wells of ~ 300 organoids, following manufacturer’s instructions. The RNA concentration was determined using Qubit™ RNA High Sensitivity (HS) (Thermo Fisher), and quality and integrity determined using Bioanalyzer. For each sample, 1 µg of total RNA was used for RNA-seq analysis. All library synthesis and sequencing were conducted at BGI (Hong-Kong). DNBseq technology was used with a sequencing length of PE 150. RNA-seq data is available in Sequence Read Archive (SRA) accession number PRJNA1102187.
2.11 Transcriptional analysis of abomasum organoids
Quality control of RNA sequencing data was performed on the raw reads using the filtering software SOAPnuke (version v1.5.2) with parameters -l 15 -q 0.2 -n 0.05 (50). The filtered clean reads were then aligned to the reference genome Ovis_aries (NCBI: GCF_000298735.2_Oar_v4.0). For this purpose, the hierarchical indexing for spliced alignment of transcripts (HISAT2, v2.0.4, http://www.ccb.jhu.edu/software/hisat) was used, based on Burrows-Wheeler transformation and Ferragina-Manzini (FM) with parameters –sensitive –no-discordant –no-mixed -I 1 -X 1000 -p 8 –rna-strandness RF (51). Clean reads were aligned to the reference genome using Bowtie2 (52) (v2.2.5), using the following parameters-q –sensitive –dpad 0 –gbar 99999999 –mp 1,1 –np 1 –score-min L,0,-0.1 -p 16 -k 200, to allow gene or transcript expression to be quantified. RSEM (53) (v1.2.8); parameters:-p 8 –forward-prob 0 –paired-end was used to calculate the gene expression level of each sample. The overall analysis of transcriptome sequencing was also performed, including the transcript randomness using a Perl script for sequence saturation analysis. After alignment, statistics of the mapping rate and the distribution of reads on the reference sequence were used to determine whether the alignment results passed QC. For principal component analysis (PCA) standardized method z-score (by row) and normalized read counts as method of grouping were used. Differential gene detection was studied by DESeq2 method (54), based on the principle of negative binomial distribution. Volcano plots were generated using Log2FC>1 for IL-13/CONTROL and Log2FC>0.5 for MIMIC/CONTROL MIMIC conditions to identify genes altered by miRNA regulation, which can be a mild modulatory effect. According to the results of differential gene detection, the R package pheatmap (https://cran.r-project.org/web/packages/pheatmap/) was used. Reads were also mapped to the bovine genome (ARS-UCD 1.2); percentage mapping was lower than to the ovine genome. The R package clusterProfiler was used for GSEA analysis using GO: BP terms, and tuft or mucous cell gene sets (55) with default settings.
3 Results
3.1 H. contortus ES suppresses IL-13 mediated GI secretory cell differentiation
To determine whether H. contortus secreted products can modulate host epithelial cell responses driven by type-2 cytokines, murine and ovine GI organoids were treated with adult worm ES together with IL-13. Ovine organoids were derived from stem cells in the abomasum (gastric tissue), the location in which H. contortus parasites reside. After exposure to IL-13 alone, there was a characteristic “budding” phenotype, first observed 12 h after IL-13 exposure and not observed in untreated organoids (Figure 1A). IL-13 treatment increased expression of Pou2f3, a marker of murine and ovine tuft cells (19, 55), and Muc6, a mucin expressed in gastric mucosa (56) (Figure 1B), indicating that IL-13 promotes differentiation of ovine abomasal secretory cells. Expression of Hes1, which promotes non-secretory enterocytes and is a downstream target gene of the Notch1 signalling pathway (57) also increased with IL-13 treatment (Figure 1B). In the presence of IL-13 and H. contortus total ES, organoids showed significantly reduced expression of Pou2f3 and Muc6, but increased expression of Hes1, as observed in murine SI organoids treated with IL-13 plus H. polygyrus ES (22). While H. contortus ES alone did not alter Pou2f3 or Muc6 expression relative to untreated organoids, expression of Hes1 was increased (Figure 1B). Previous studies reported increased expression of Hes1 during chronic, but not acute, infection with the murine colonic nematode Trichuris muris, associated with an increase in cell proliferation and crypt size (58).
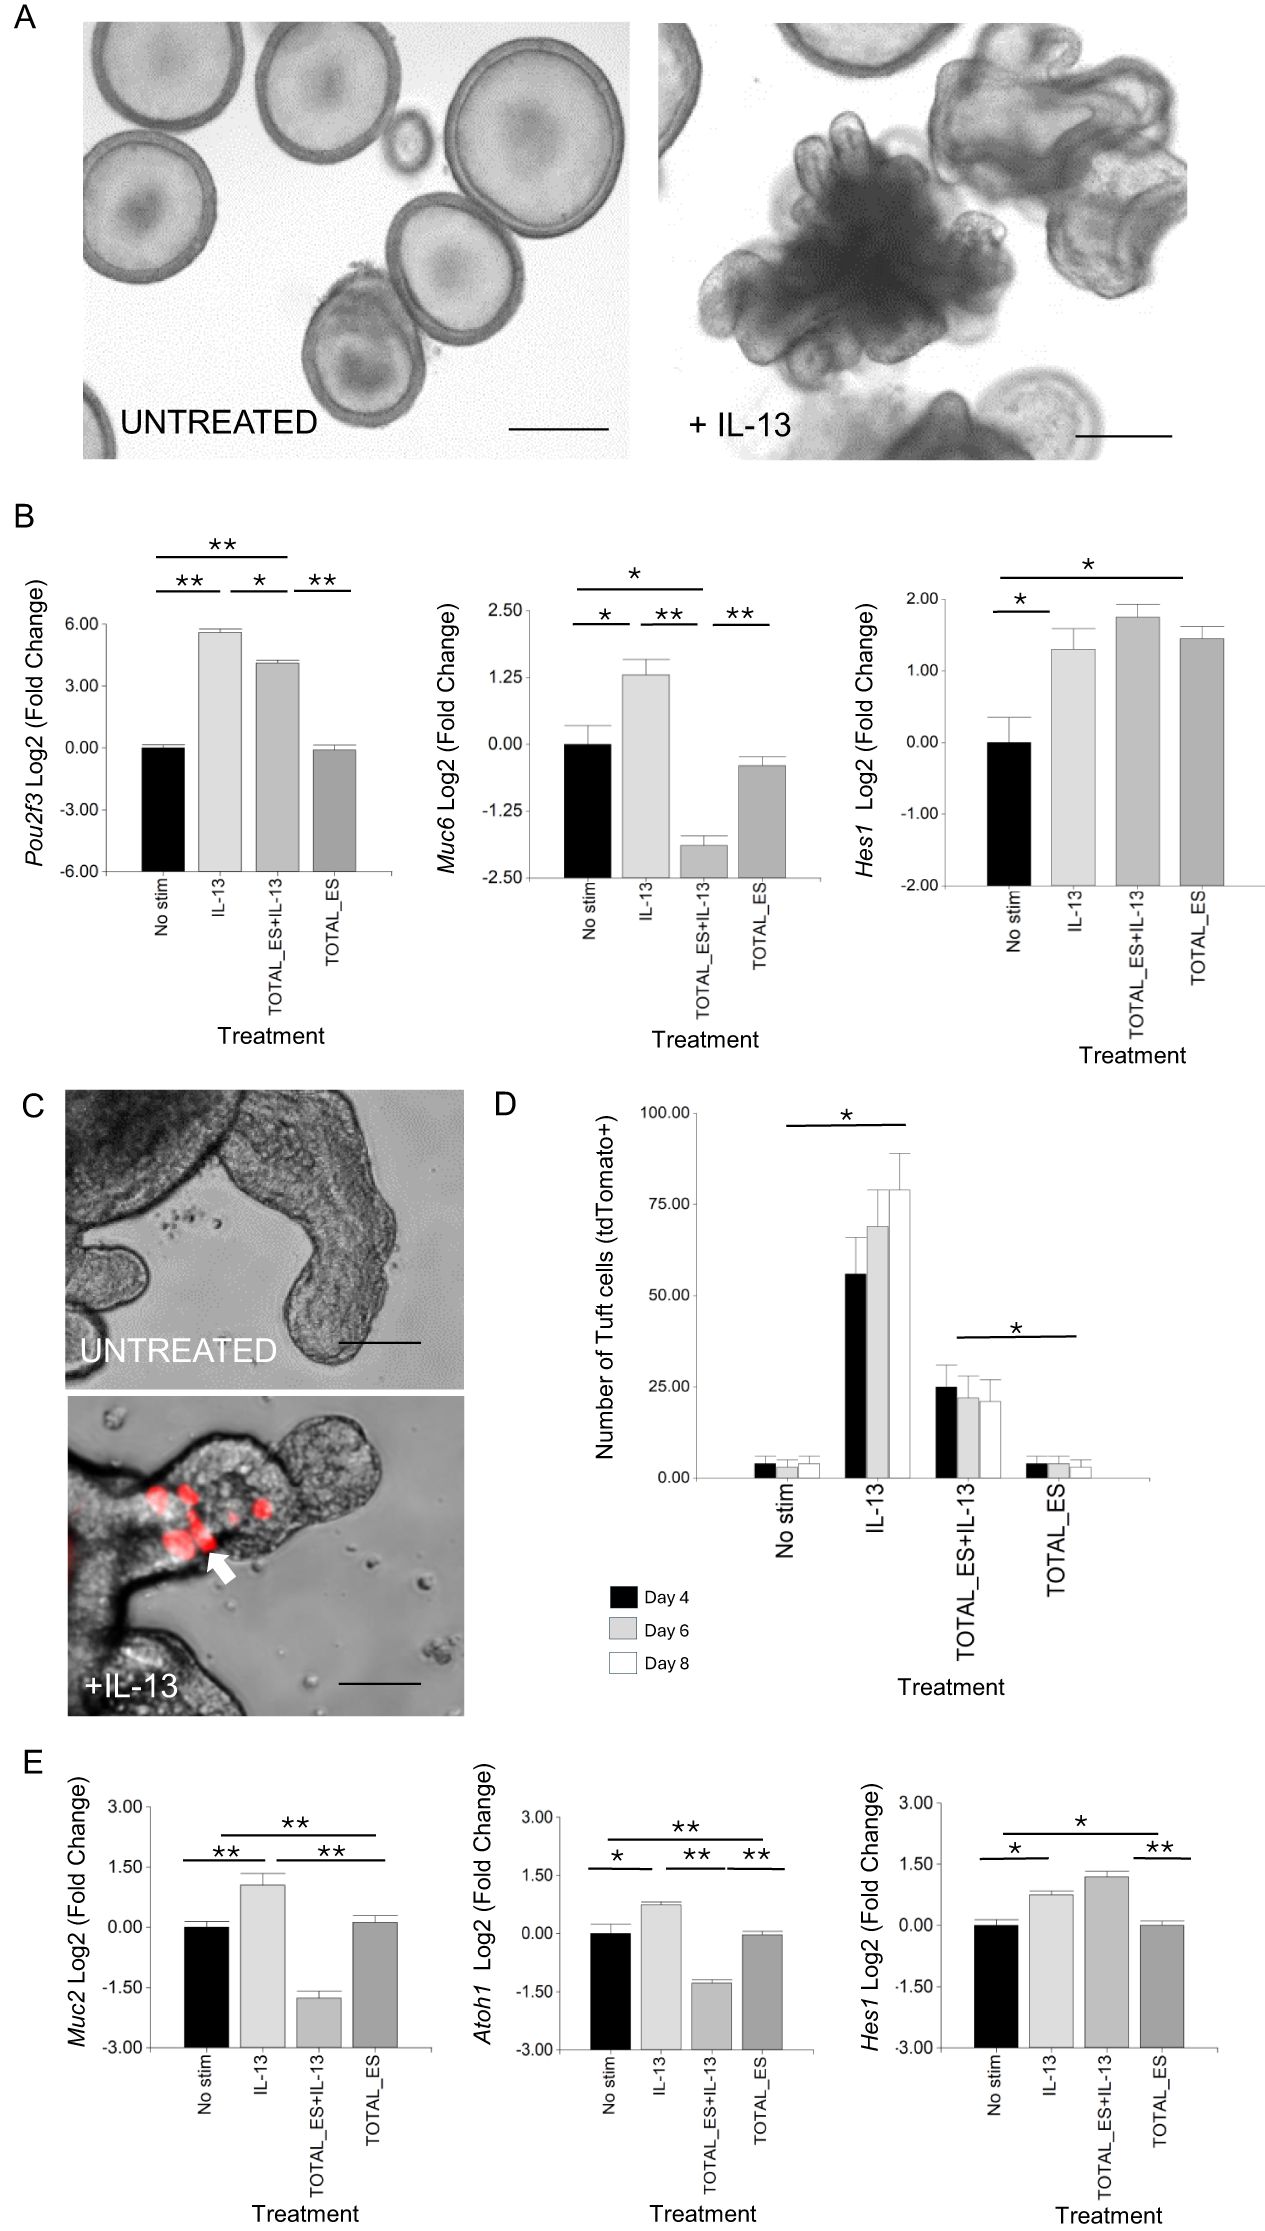
Figure 1. H contortus ES suppresses effects of IL-13 on GI organoid cell differentiation. (A) Representative image of ovine abomasal organoids treated or not with IL-13 and cultured in organoid growth medium (OGM) for 4 days. (B) RT-qPCR of canonical tuft cell marker Pou2f3, mucous cell marker Muc6 and transcription factor Hes1 in ovine abomasal organoids. RNA was from unstimulated organoids (No stim) or treated with IL-13 alone, IL-13 plus total H contortus ES or total H contortus ES alone. Log2 fold change of RT-qPCR values compared with unstimulated control in three independent biological replicates +/-SD. (C) Representative images of Dclk1 tdTomato+ tuft cells (arrow) in murine SI organoids, untreated or treated with IL-13 in OGM for 4 days at 37°C. (D) Number of Dclk1 tdTomato+ cells in murine SI organoids at 4, 6, and 8 days after no stimulation, treatment with IL-13, IL-13 plus H contortus total ES or H contortus total ES alone +/- SD. Graph shows the average number of tdTomato+ cells from at least 5 images and in total represents 500 organoids per treatment. Statistics calculated with a two-tailed t-test on mean of biological replicates (n=3) compared to untreated organoids. (E) RT-qPCR expression of Muc2, Atoh1 and Hes1 in murine SI reporter organoids. RNA was from unstimulated organoids (No stim), those treated with IL-13 alone, IL-13 plus total H contortus ES, or total H contortus ES alone. Log2 fold change of RT-qPCR values are compared with unstimulated control in three independent biological replicates +/- SD. Statistical analysis was by ordinary one-way ANOVA with Tukey’s multiple comparisons test. H contortus total ES at 2 µg/ml. *, P < 0.05; **, P < 0.01. Scale bars = 200 µm.
Effects of H. contortus ES on GI epithelial responses to IL-13 were also examined in murine organoids. For this, we employed murine SI organoids in which tdTomato was expressed under the control of the promoter of the tuft cell-associated gene Dclk1 (19) (Ai14; Dclk1-CreERT2). This facilitated real time imaging of murine SI tuft cells. Following IL-13 treatment, there was a significant increase in tdTomato+ cells (10-fold at day 4), which was suppressed by co-incubation with H. contortus total ES (Figures 1C, D). H. contortus ES alone had no effect on the number of SI tuft cells (tdTomato+), as observed for ovine abomasal tuft cells. IL-13 treatment also resulted in increased expression of murine SI goblet cell marker Muc2 (59), secretory cell promoting transcription factor Atoh1/Math1 (60) and Hes1, which in the SI promotes differentiation of absorptive cells (27) (Figure 1E). These IL-13 mediated effects were modulated by incubation of organoids with H. contortus total ES. Muc2 and Atoh1 expression were reduced, while Hes1 levels increased (Figure 1E). In the SI, Hes1 negatively regulates Atoh1, resulting in an increase in absorptive cells and reduction in cells of the secretory lineage (60). Atoh1 expression was not detected by RT-qPCR in ovine abomasal organoids, suggesting that other transcription factors regulate the epithelial secretory lineage in gastric tissue (61). Our data indicate that H. contortus total ES suppresses IL-13 induced secretory cell development in both murine and ovine GI organoids.
Previous studies reported development of “spheroid” SI organoids which failed to bud or differentiate, in the presence of H. polygyrus ES prepared by concentration over a 3kDa cut-off membrane (22, 62). Similar foetal-like undifferentiated regions were also observed in murine SI tissue following H. polygyrus infection (63). We examined the effect of concentrated H. contortus ES on ovine abomasal organoids, and on ovine and murine SI organoids, and compared this to treatment with H. polygyrus concentrated ES. Spheroids were induced in all three organoid types with ES from either species, albeit less obviously in abomasal organoids which have a low level of budding under standard (control) conditions (Supplementary Figure S2 at 12 h after incubation with ES). Notably, in the presence of concentrated ES, ovine SI organoids showed greater budding and fewer spheroids compared to murine SI organoids, and there was less spheroid formation in ovine or murine SI organoids treated with H. contortus ES compared with H. polygyrus ES (Supplementary Figure S2). Therefore, at high concentration, ES components from the two nematode species induce spheroid formation, with H. polygyrus ES having a slightly more potent effect.
3.2 miR-5352 mimic modulates epithelial cell gene expression and reduces organoid budding
MicroRNA miR-5352 is expressed uniquely in parasitic stages of nematodes infecting the GI tract and of the lumen dwelling lungworm Dicytocaulus viviparus, and is present in H. contortus and H. polygyrus ES (12, 34). We speculated that this miRNA may modulate host gene expression at mucosal sites, and could be involved in altering organoid responses to IL-13. To test this, we firstly optimised delivery of a synthetic miRNA into GI organoids using a Cy3-labeled mimic of miR-5352 (100 nM, details in Materials & Methods). Transfection with labelled miRNA mimic alone or with lipofectamine resulted in uptake in only a few organoid cells (Figure 2A), while inclusion of DharmaFECT reagent increased transfection efficacy, with Cy3 observed in many organoid cells (Figure 2A).
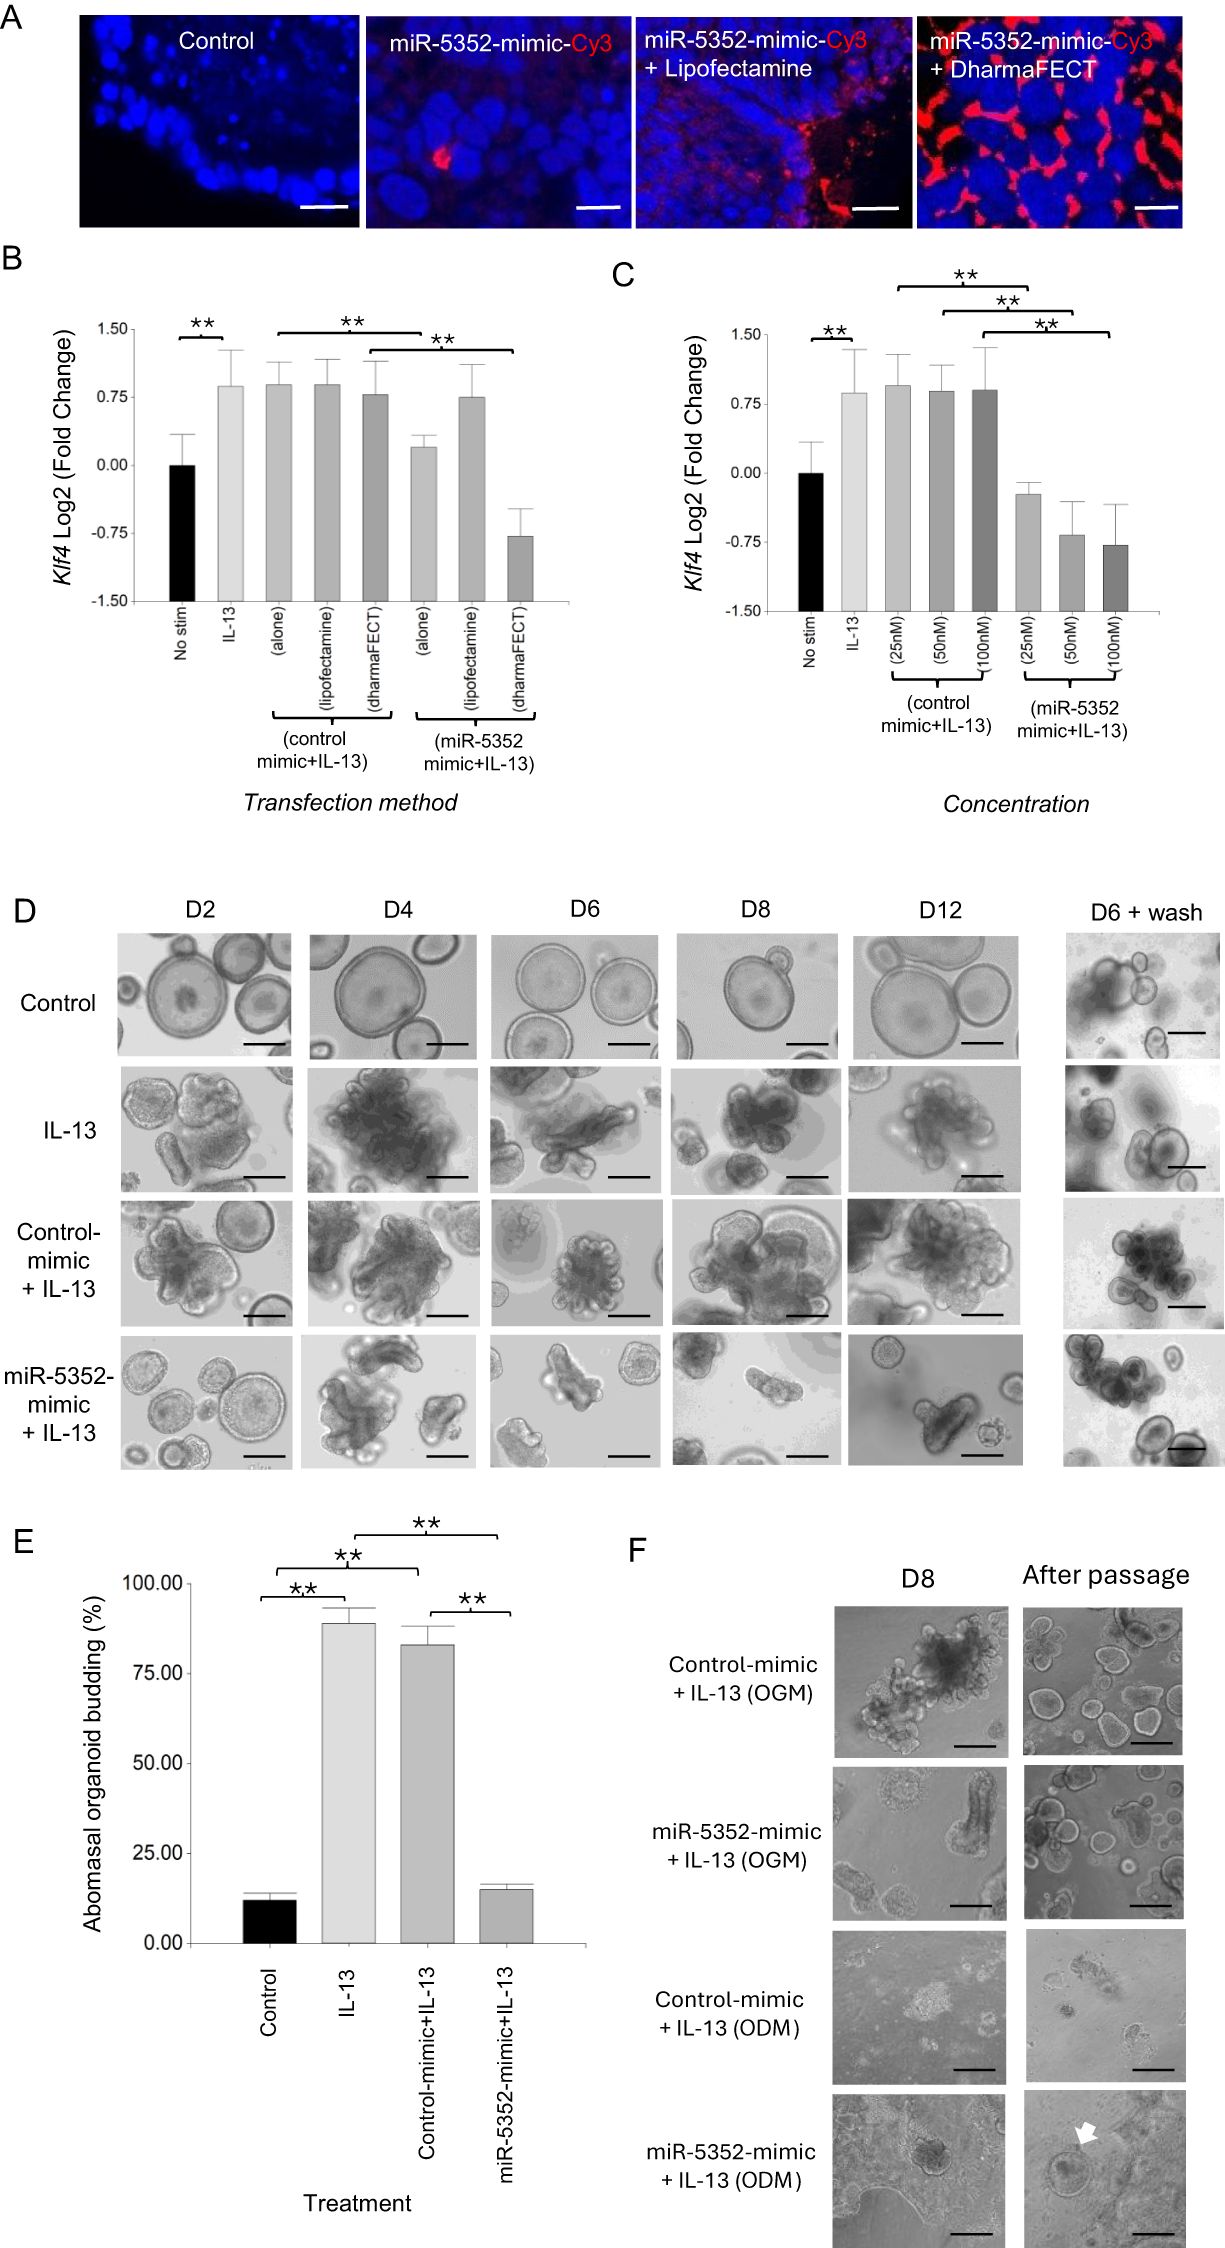
Figure 2. Transfection of ovine abomasal organoids with miR-5352 mimic suppresses IL-13-mediated differentiation. (A) Confocal microscopy of DAPI stained ovine abomasal organoids. Control (no treatment) or incubated with miR-5352 mimic-Cy3 alone, miR-5352 mimic-Cy3 + Lipofectamine, miR-5352 mimic-Cy3 + DharmaFECT. Red, Cy3 mimic and blue, DAPI stained nuclei. Scale bars = 10 µm. (B) Expression of predicted miR-5352 target gene Klf4 in ovine abomasal organoids with no stimulation, treated with IL-13 alone, control mimic + IL13 (alone, with Lipofectamine, or DharmaFECT reagent), or miR-5352 mimic + IL-13 (alone, with Lipofectamine, or DharmaFECT reagent). miRNA mimics at 100 nM final conc. (C) Expression of Klf4 in ovine abomasal organoids with no stimulation, treated with IL-13 alone, control mimic + IL-13 or miR-5352 mimic + IL-13, using DharmaFECT as transfection reagent and miRNA mimic at 25, 50, 100 nM. Log2 fold change of RT-qPCR values were compared with non-stimulated control in three independent biological replicates +/-SD. Statistical analysis was by ordinary one-way ANOVA with Tukey’s multiple comparisons test; **, P < 0.01. (D) Representative images of abomasal control (unstimulated) organoids, stimulated with IL-13, stimulated with IL-13 + control mimic (50nM) or stimulated with IL-13 + miR-5352 mimic (50nM) at days 2, 4, 6, 8 and 12 of culture. D6 + wash shows the same treated organoids growing normally in OGM 6 days after removal of IL-13 and mimics. Scale bars: 100 µm. (E) Average percentage of budding organoids at day 2 after miR mimic transfection. Graph represents the average of at least 5 images and in total represents 500 organoids per treatment. Statistics calculated with a two-tailed t-test on mean of biological replicates (n=3) compared to control. **, P < 0.01. (F) Representative images of abomasal organoids transfected with control mimic (50nM) or with miR-5352 mimic (50nM), stimulated with IL-13 and cultured for 8 days in organoid growth media (OGM, with Rho kinase, TGF-β receptor type I and p38 MAP kinase inhibitors) or organoid differentiation media (ODM), and the same treated organoids after wash and passage in OGM alone. White arrow in ODM indicates re-grow of abomasal organoids. Scale bars: 100 µm.
Ovine abomasal organoids were then transfected with unlabelled miR-5352 mimic and gene expression examined by RT-qPCR. We focussed initially on a bioinformatically-predicted target mRNA of miR-5352 (see below), encoding Kruppel-like transcription factor KLF4. KLF4 is enriched in the GI tract and is essential for goblet cell differentiation and maintaining GI homeostasis by preventing over-proliferation of epithelial cells (64–66). In the presence of IL-13, expression of Klf4 was increased in ovine abomasal organoids relative to untreated organoids (Figures 2B, C). In contrast, IL-13 plus miR-5352 mimic resulted in a significant reduction in Klf4 expression, with greatest suppression observed using DharmaFECT reagent, consistent with increased miRNA delivery (Figures 2B, C). Treatment of organoids with IL-13 plus control miRNA mimic (universal miRIDIAN Mimic Negative Control or a scrambled miR-5352 mimic), resulted in no suppression of Klf4 relative to IL-13 alone (Figures 2B, C, Supplementary Figure S3). Klf4 suppression occurred using a range of miR-5352 concentrations (25-100nM) and was dose–dependent (Figure 2C). Based on these data, all further transfections were performed using DharmaFECT reagent and parasite miRNA mimic at 50nM, a concentration similar to that used in previous studies with other miRNA mimics (38, 67).
To test any effect of miR-5352 mimic on organoid differentiation, ovine abomasal organoids were transfected with miR-5352 or control mimic and organoid morphology examined over the course of 12 days with mimic replaced every 2-3 days. As described above, IL-13 was added to organoids to promote cell differentiation, similar to IL-13 responses to nematode infection in vivo (22). IL-13 alone or IL-13 plus control mimic resulted in organoid budding, first observed after 48 h and increased throughout the 12-day period (Figures 2D, E). In contrast, in the presence of IL-13 and miR-5352 mimic, organoids failed to bud after 48 h and were similar to unstimulated organoids (control) (Figures 2D, E). Some budding occurred after 4 days in culture, but this was limited, and organoids started to collapse or remained smaller in size and less differentiated than those in IL-13 alone or IL-13 plus control mimic (Figure 2D). MiR-5352-treated organoids were still viable after 12 days; when treated organoids were washed and cultured in standard organoid growth medium (OGM, containing inhibitors to block cell differentiation) without IL-13 for six days, organoids recovered their round shape and grew normally (Figure 2D). These results indicate that miR-5352 can suppress differentiation of ovine abomasal organoids induced by IL-13 and, while miR-5352-treated organoids appeared abnormal, stem cells were still viable allowing organoid regrowth.
Maintenance of GI organoid stem cells following miR-5352 mimic transfection was examined further using organoid differentiation medium (ODM). This lacks inhibitors of Rho kinase, TGF-β receptor type I and p38 MAP kinase, and promotes greater cell differentiation, compared to organoid growth medium (OGM). When grown in ODM and IL-13, abomasal organoids initially showed budding but then took on a 2-dimensional appearance and stopped budding, suggesting a rapid increase in cell differentiation (Figure 2F). This occurred with ODM and IL-13 plus control mimic or IL-13 plus miR-5352 mimic, but not when grown in OGM and IL-13. Notably, after removal of ODM and passage in OGM, only those organoids grown in the presence of IL-13 and miR-5352 mimic were able to re-grow and differentiate/bud, while those grown in ODM and IL-13 plus control mimic did not re-grow (Figure 2F). This indicates that miR-5352 mimic helps maintain cell stemness, enabling organoid/tissue renewal.
3.3 miR-5352 mimic suppresses GI organoid differentiation
To examine changes in specific cell markers following abomasal organoid transfection with miR-5352 mimic, RT-qPCR was carried out. Expression of Pou2f3 and Klf4 was reduced, while that of stem cell markers Olfm4 and Lgr5 was increased relative to control mimic, in the presence of IL-13 (Figure 3A). These changes in expression were supported by IFA, while Ki67+ cell numbers were similar in the presence of control or miR-5352 mimic (Figure 3B). Similarly, murine SI Dclk1 tdTomato reporter organoids stimulated with IL-13 and transfected with miR-5352 showed a reduced number of tdTomato+ cells relative to IL-13 plus control mimic, indicating suppression of murine tuft cell differentiation (Figure 3C, Supplementary Supplementary Figure S3). There was also a reduction of Klf4 and Muc2 expression (Figure 3D), and a corresponding decrease in the number of KLF4+ and MUC2+ cells by IFA. Ki67+ cell numbers were slightly increased in the presence miR-5352 mimic in SI organoids (Figure 3E). These data indicate that, remarkably miR-5352 mimic alone can reduce the stimulatory differentiation effects of IL-13 on both ovine and murine GI organoids, limiting the expansion of tuft and mucous-secreting cells, while promoting stem cell maintenance.
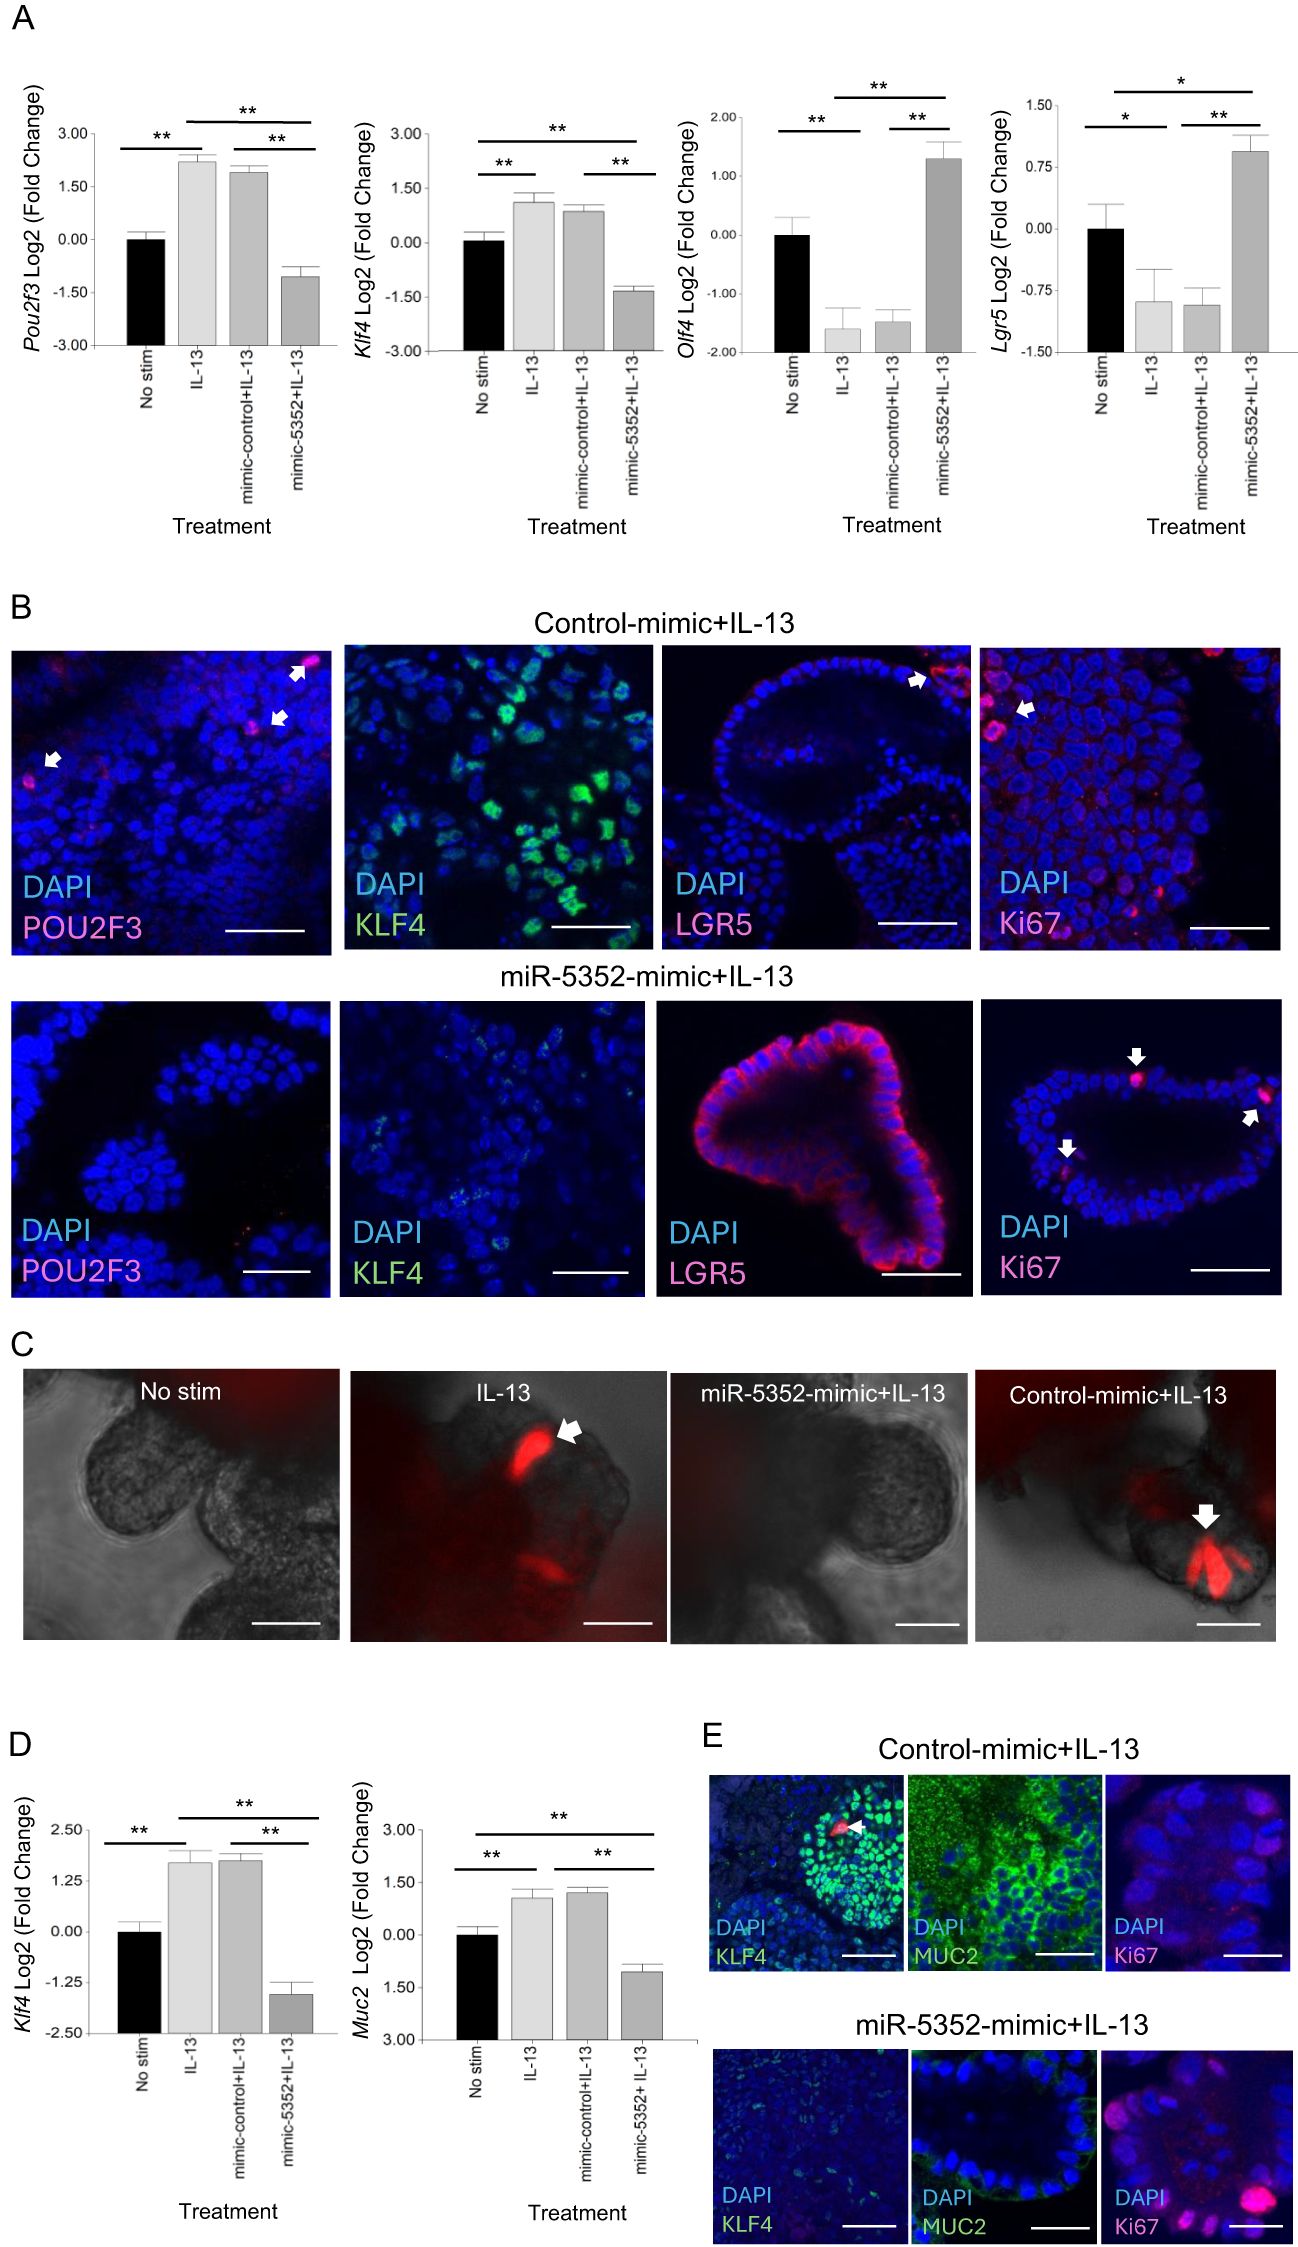
Figure 3. miR-5352 mimic suppresses IL-13-induced secretory cell expansion and promotes stemness. (A) Expression of Pou2f3, Klf4, Olfm4 and Lgr5 in ovine abomasal organoids following no stimulation, IL-13 stimulation, IL-13 plus control mimic or IL-13 plus miR-5352 mimic (day 2 of culture in OGM). (B) Confocal microscopy showing POU2F3+, KLF4+, LGR5+ and Ki67+ cells in ovine abomasal organoids incubated with IL-13 plus control mimic or miR-5352 mimic (day 4 of culture). (C) Representative images of Dclk1 tdTomato+ cells (arrows) in murine SI reporter organoids with no stimulation, after treatment with IL-13, IL-13 plus miR-5352 mimic or IL-13 plus control mimic (day 4 of culture). (D) Expression of Klf4 and Muc2 in murine SI organoids following no stimulation, IL-13 stimulation, IL-13 plus control mimic or IL-13 plus miR-5352 mimic (day 2 of culture). (E) Confocal microscopy showing KLF4+, MUC2+ and Ki67+ cells in murine SI organoids incubated with IL-13 plus control mimic or miR-5352 mimic (day 4 of culture). Log2 fold change of qRT-PCR values are compared with non-stimulated control in three independent biological replicates. Scale bars: 20µm. *, P < 0.05; **, P < 0.01.
3.4 Opposing effects of IL-13 and miR-5352 on global gene expression in abomasal organoids
The impact of miR-5352 on gene expression was examined at a global level. Ovine abomasal organoids alone (control), stimulated with IL-13, IL-13 plus control mimic or IL-13 plus miR-5352 mimic were subject to bulk RNA-seq and gene expression profiles compared initially by principal component analysis (PCA) (four biological replicates per condition cultured for 48 h; RNA-seq data are available at PRJNA1102187 and output data summarised in Supplementary Table S5). Samples from the same treatment condition clustered together, with IL-13 inducing diametrically opposite effects on PC1 and PC2 compared with unstimulated controls with the majority of variance (98.41%) (Figure 4A). Gene expression profiles of samples treated with IL-13 plus control mimic overlapped with those of IL-13 alone, with a few genes showing a small change in expression (Figure 4A, Supplementary Figure S4). Notably, IL-13 plus miR-5352 mimic treated samples showed a shift in PC2. The RNA-seq data confirmed that ovine gastric epithelial cells are highly responsive to IL-13, and that the changes in gene expression induced by IL-13 are modulated by miR-5352.
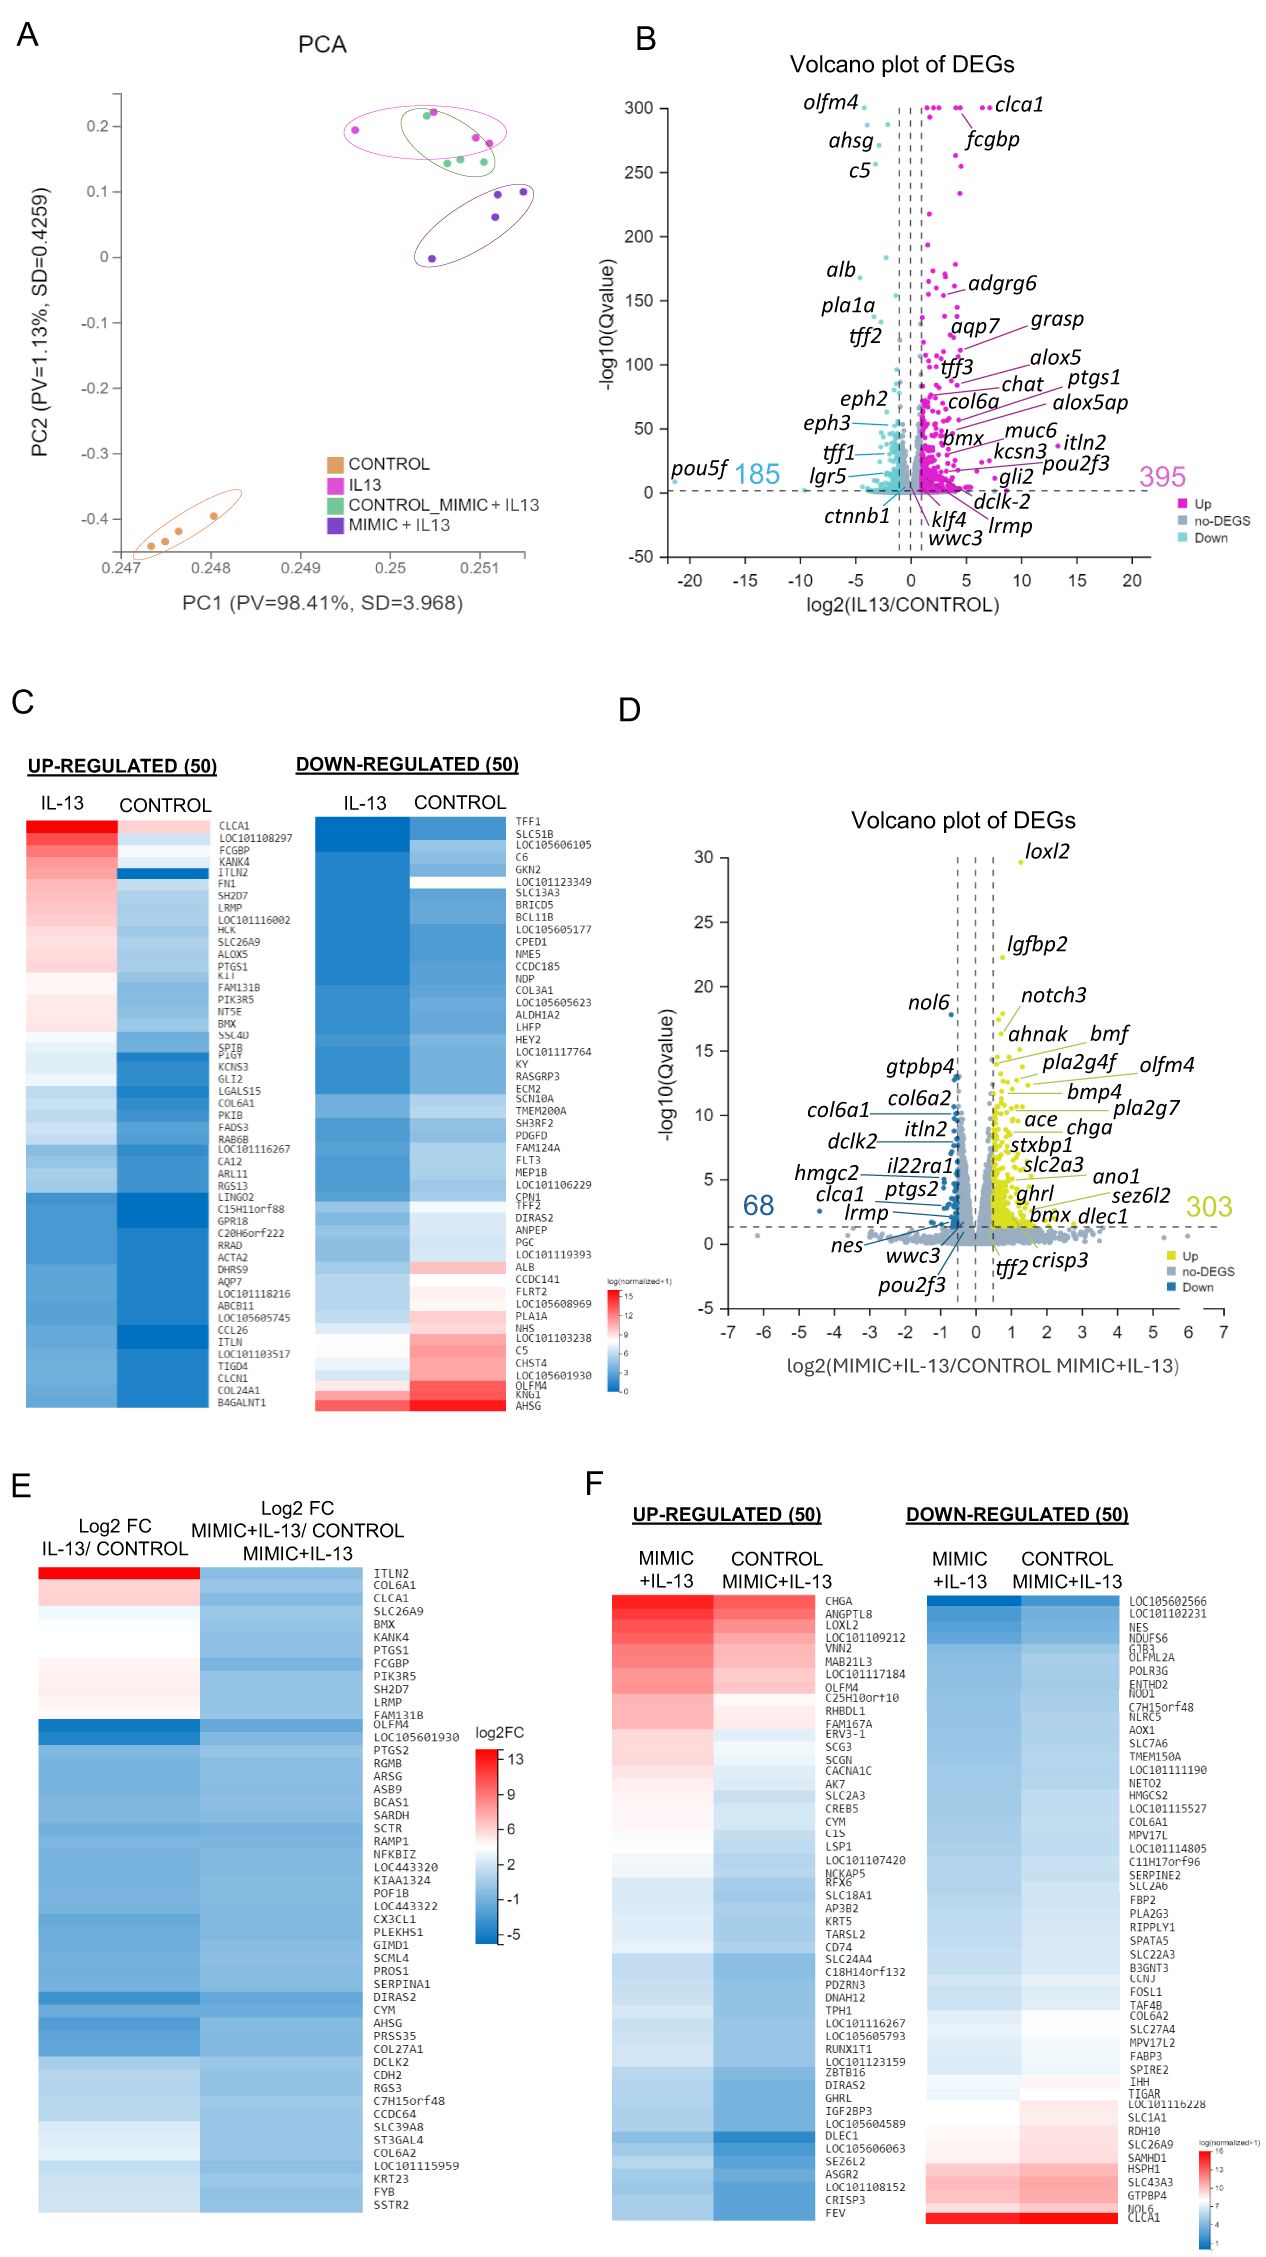
Figure 4. IL-13 and miR-5352 mimic have opposing effects on gene expression in ovine abomasal organoids. (A) Principal component analysis (PCA) plot of RNA-seq in 2 dimensions, with each dot representing a biological sample (n=4 per treatment group). PV is proportion of variance and SD is standard deviation. (B) Volcano plot of differentially expressed genes (DEGs), IL-13 vs. control group of mean normalized expression counts. Pink represents up-regulated DEGs, light blue represents down-regulated genes and grey represents non-DEG. (C) Heat map showing expression level of 50 most up- and down-regulated variant genes from IL-13 treated vs control organoids using normalised average read counts, standardized method: log(value+1). (D) Volcano plot of DEGs in organoids treated with IL-13 plus miR-5352 mimic versus IL-13 plus control mimic of mean normalized expression counts. Yellow represents up-regulated genes, blue represents down-regulated genes, and grey represents non-DEG. (E) Heat map showing expression difference (Log2 fold change) of 50 variant genes with opposite direction of regulation in IL-13/control vs miR-5352 mimic plus IL-13/control mimic plus IL-13. (F) Heat map showing expression level of 50 most up and down-regulated variant genes from IL-13 plus miR-5352 mimic vs IL-13 plus control mimic using normalised average read counts, standardized method: log(value+1). In Volcano plots, x-axis represents the fold change of the difference after conversion to log2, and the y-axis represents the significance value after conversion to-log10. In Heatmaps: colours indicate level of expression from low (blue) to high (red).
We identified a total of 56,081 transcripts and 16,179 differentially expressed genes (DEGs) using a likelihood ratio test across all conditions. Treatment with IL-13 alone resulted in altered expression of 580 genes relative to unstimulated control organoids (395 up-regulated, 185 down-regulated, q-value < 0.05 and log2FC > 1) (Figure 4B; Supplementary Table S6). Up-regulated genes included intelectin Itln2, associated with type 2 responses to nematode infection (68), Clca1 and Fcgbp, expressed in mucous-producing cells, Ptgs1, Alox5, Pou2f3, and Adgrg6, highly enriched in ovine abomasal tuft cells based on our previous single cell (sc) RNA-seq analysis (55), and potassium voltage-gated channel subfamily S member 3 (Kcns3) involved in cell cycle regulation and proliferation (69) (Figure 4B). Among the most down-regulated genes in the presence of IL-13 were GI stem cell marker Olfm4 (70), tumour-associated glycoprotein Ahsg, embryonic stem cell transcription factor Pou5f, and intestinal stem cell niche regulators ephrin-B2 (EphB2) and ephrin-B3 (EphB3) (71). These findings align with the role of IL-13 in promoting GI epithelial cell differentiation (Figure 4B). Expression profiles of the top 50 most up- and down-regulated genes are shown in Figure 4C.
We then evaluated the gene modulatory effects of miR-5352 mimic on IL-13-treated organoids. Comparison of transcriptional profiles of IL-13-treated ovine abomasal organoid with miR-5352 versus control mimic identified 371 DEGs (303 up-regulated and 68 down-regulated; q-value < 0.05 and log2FC > 0.5) (Figure 4D, Supplementary Table S7). The high number of DEGs most likely indicates secondary effects of miR-5352 on the organoids, in addition to direct regulation of miRNA target genes. Up-regulated genes included Loxl2 involved in senescence and tumour suppression (72), insulin-like growth factor Lgfbp2, Notch3, involved in maintaining stemness of cancer cells (73) and Olfm4. Down-regulated genes included Nol6 nucleolar protein that stimulates cell growth and gastric cancer (74), GTP binding protein 4 gtpbp4, involved in cell cycle regulation, Itln2, tuft cell genes Dclk2 and Ptgs2 and mucous cell gene Clca1. Notably, 390 genes (q-value < 0.05) showed the opposite direction of regulation (opposite Log2FC) in abomasal organoids treated with IL-13 versus no treatment, compared to IL-13 plus miR-5352 mimic versus IL-13 plus control mimic (Figure 4E, Supplementary Table S8). These included Itln2, Clca1, Olfm4, and tuft cell genes Bmx, Ptgs1 and 2, Lrmp and Dclk2, indicating that the parasite miRNA is reversing some of the IL-13 stimulatory effects on organoid gene expression, especially on tuft, mucous and stem cells (Figure 4E). Expression profiles of the top 50 most up- and down-regulated genes in abomasal organoids treated with IL-13 plus miR-5352 relative to IL-13 plus control mimic are shown in Figure 4F.
3.5 miR-5352 promotes stemness and represses tuft and mucous cell gene set expression in ovine abomasal organoids
To describe the functional features of abomasal organoids treated with IL-13 or IL-13 plus miRNA mimic we implemented a gene set enrichment analysis (GSEA) on DEGs for Biological Process domain (GO: BP) terms (75). Consistent with the observed stimulatory effect on organoid cell differentiation, treatment with IL-13 caused a marked increase in normalized enrichment score (NES) associated with G1/S transition of mitotic cell cycle, stem cell differentiation, negative regulation of Notch signalling pathway which promotes renewal of intestinal and gastric stem cells (76, 77) (Figure 5A), regulation of cell shape and positive regulation of cell differentiation, among others (Supplementary Table S9). Conversely, GSEA for abomasal organoids treated with IL-13 plus miR-5352 mimic showed enrichment of terms associated with negative regulation of G1/S transition of mitotic cell cycle, cell cycle arrest, positive regulation of Notch signalling pathway (Figure 5B) and negative regulation of cell growth (Supplementary Table S10).
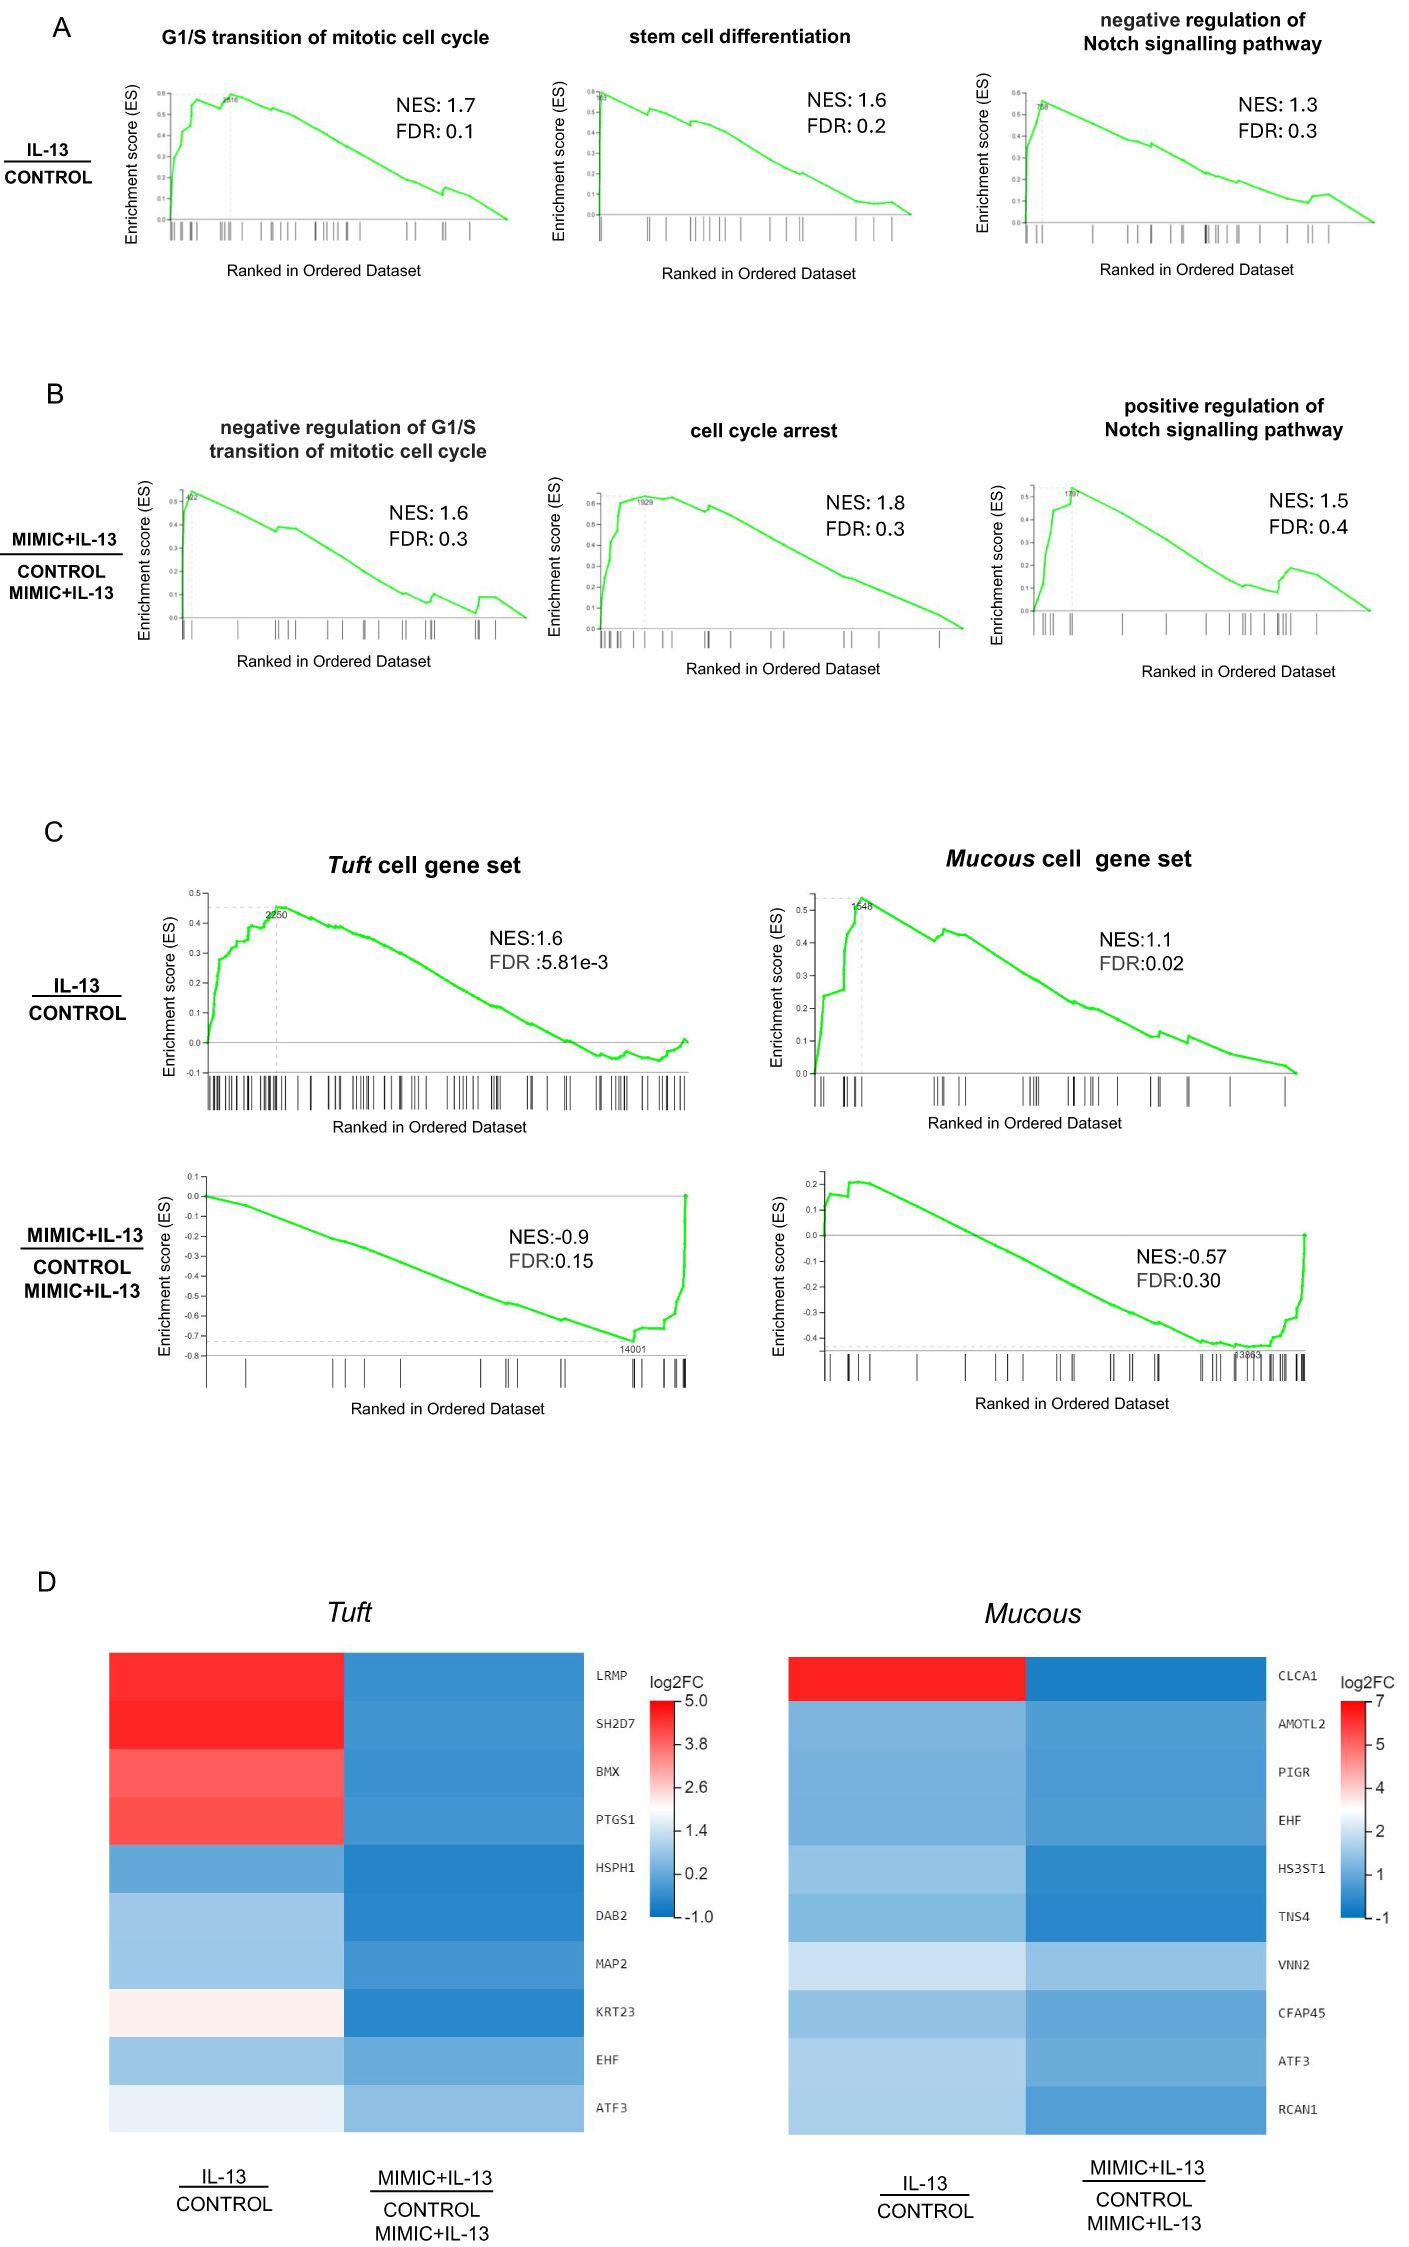
Figure 5. Gene sets associated with differentiation are enriched by IL-13 and suppressed by miR-5352. (A) Gene set enrichment analysis (GSEA) of genes expressed in ovine abomasal organoids treated with IL-13 vs. no treatment (control). Graphs depict the enrichment score (ES) on the y-axis, with positive values where gene sets are induced, and negative values where they are inhibited. Normalised enrichment score (NES) and false discovery rate (FDR) are indicated on each graph. Each black vertical line represents one gene in category GO: BP and its relative ranking against all genes analysed. (B) GSEA of genes expressed in organoids treated with IL-13 plus miR-5352 mimic vs. IL-13 plus control mimic. (C) GSEA of tuft or mucous cell gene sets (Hildersley et al., 2021) expressed in abomasal organoids exposed to IL-13 vs no treatment (control) and miR-5352 mimic plus IL-13 vs control mimic plus IL13. Each vertical bar on the x-axis represents an individual gene within the gene set for the stated cell type. (D) Heat map of tuft and mucous cell genes showing opposite direction of regulation (log2 fold change) in organoids treated with IL-13 vs. no treatment (control) and miR-5352 mimic + IL-13 vs. control mimic + IL13.
Additionally, using tuft and mucous gene sets identified by our previous scRNA-seq of abomasal mucosa (55), GSEA identified an enrichment for these genes when organoids were stimulated with IL-13 vs no treatment, and a reduction when organoids were treated with IL-13 plus miR-5352 compared to IL-13 plus control mimic (Figure 5C). Multiple tuft cell canonical genes, such as Lrmp, Bmx, Ptgs1, and mucous cell genes Clca1, Amotl2, Tns4, were suppressed by miR-5352 mimic treatment, even in the presence of IL-13 (Figure 5D). Reduced NES scores for these cellular gene sets further supports suppression of GI secretory cell differentiation by miR-5352.
3.6 H. contortus secreted miRNAs are predicted to target host signalling pathways and IL-22 response
Regulatory targets of miRNAs can be predicted in silico using bioinformatic programmes (45, 46). We applied three programmes (MiRanda, RNAhybrid and TargetScan) to predict target mRNAs of Hco-miR-5352 and the other 22 miRNAs identified in H. contortus ES (34). Merging bovine and ovine bioinformatic target prediction datasets for Hco-miR-5352 identified 54 potential target mRNAs, with 26 of these identified by at least two programmes, giving more confidence to the prediction data (Figure 6A, Supplementary Table S11). Fifty-one of the Hco-miR-5352 predicted target genes were also found to be targeted by other miRNAs present in H. contortus ES, including Hco-miR-5960, Hco-lin-4, Hco-miR-61, Hco-miR-43 and Hco-miR-5895. The latter three miRNAs are members of the Hco-miR-5352 cluster conserved across GI nematodes (34), suggesting that additional conserved parasite miRNAs are potentially involved in co-regulating host genes and may produce additive effects. Seven predicted target mRNAs, down-regulated in the presence of miR-5352 mimic from our abomasal organoid RNA-seq data, were predicted as hco-miR-5352 targets in only one of the two host species genomes; miRNAs binding site were manually identified in the 3´UTR, including for Il22ra1 (Supplementary Table S11).
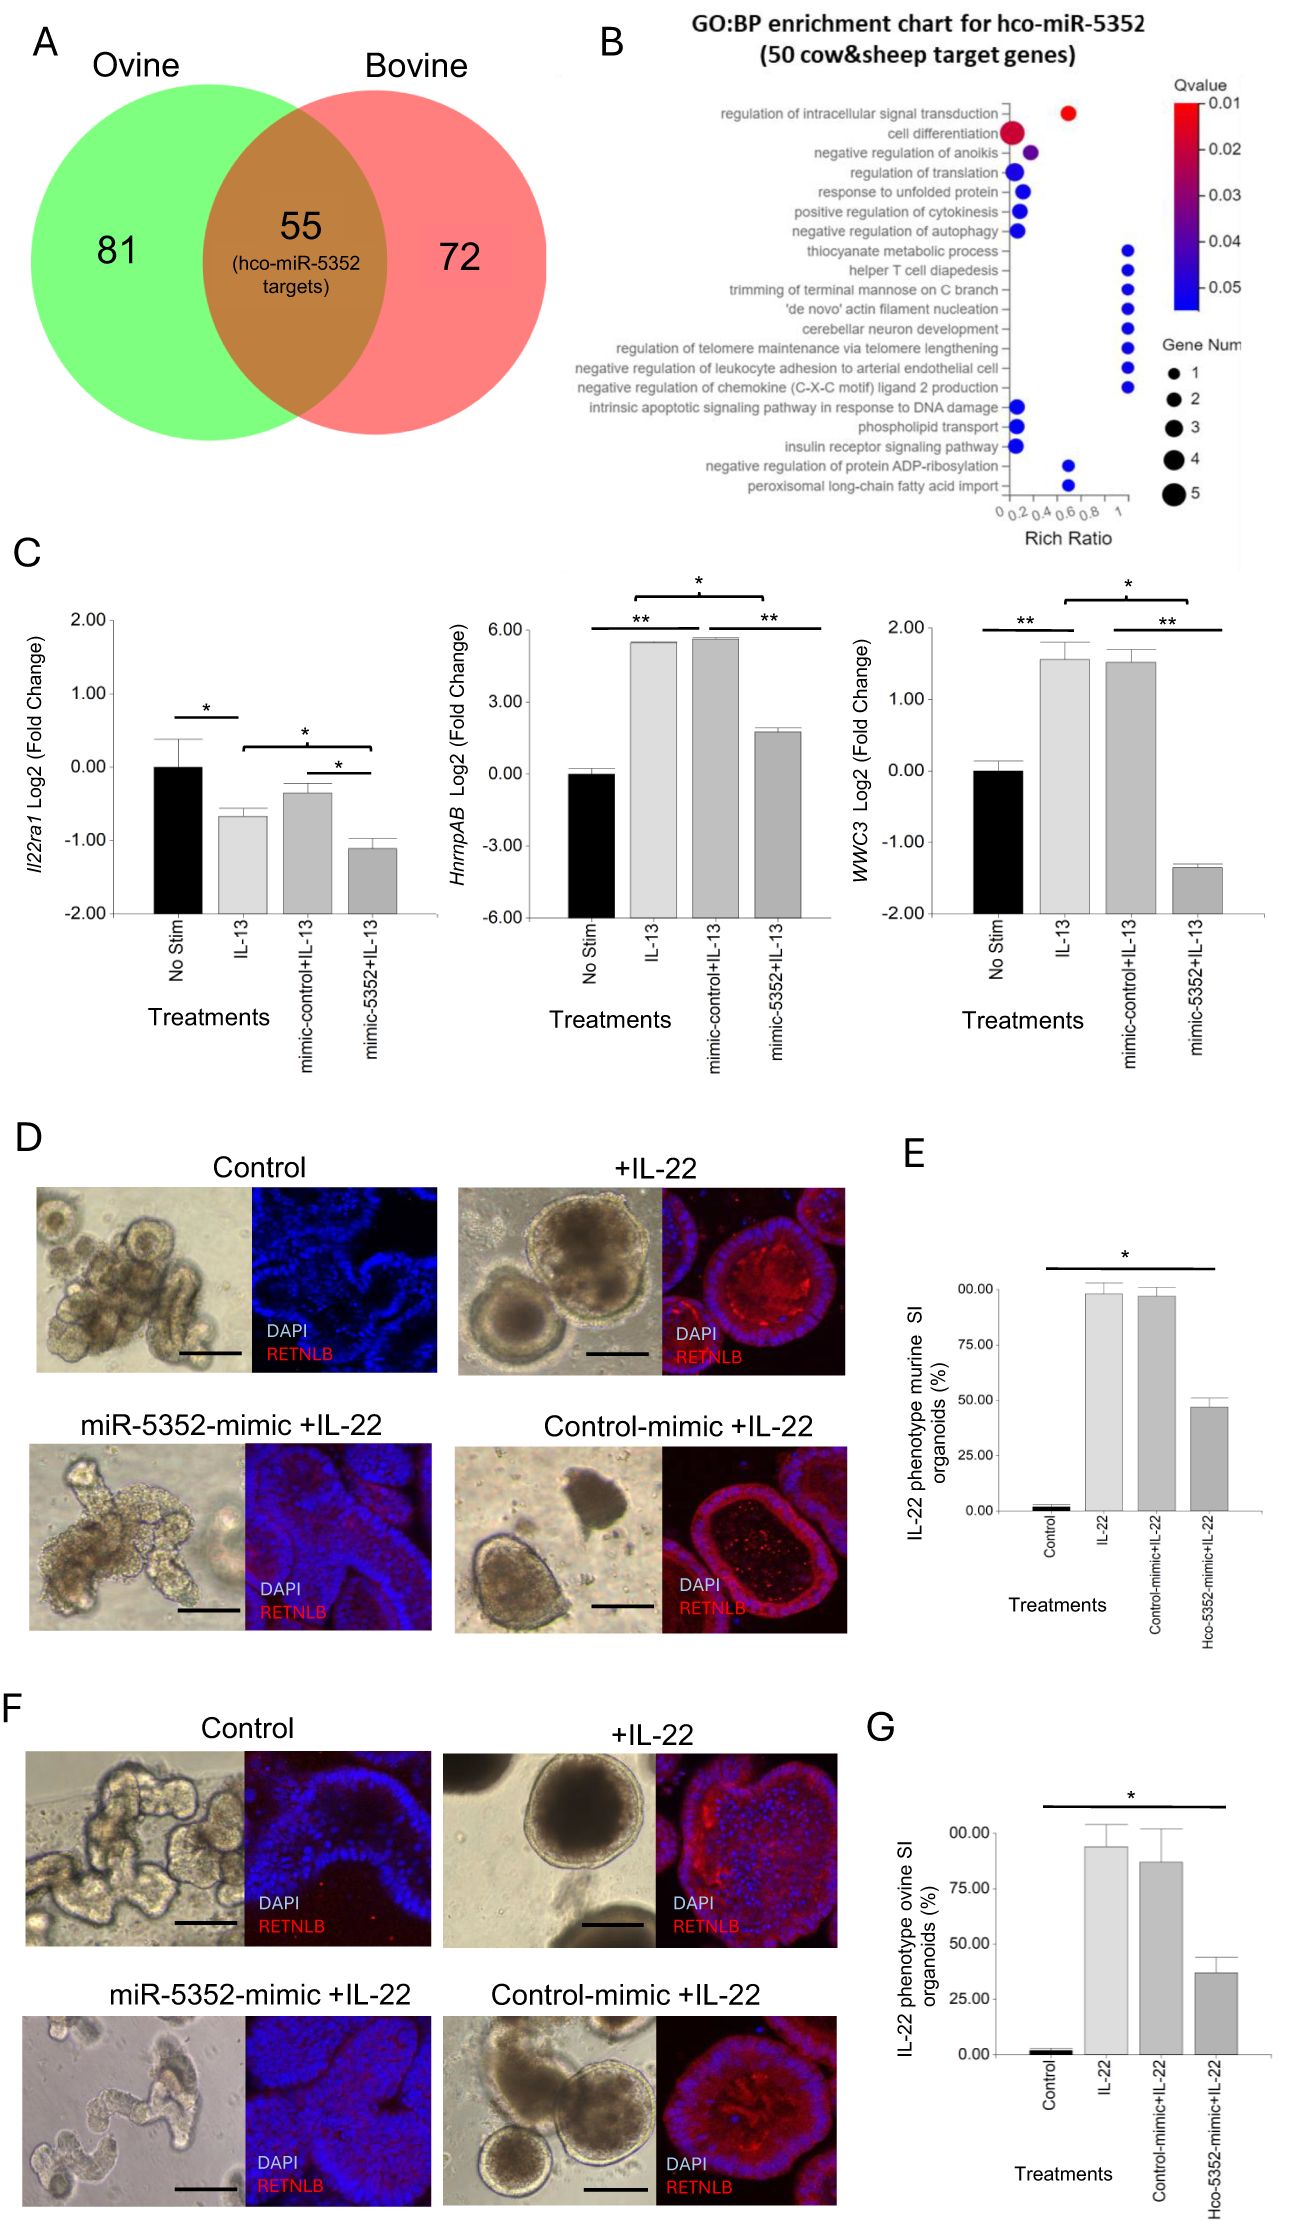
Figure 6. Hco-miR-5352 predicted target genes include host signalling pathways. (A) Venn diagram of hco-miR-5352 predicted targets from ovine and bovine bioinformatic genome predictions. (B) GO: Biological Process enrichment bubble chart of the 49 predicted target genes of Hco-miR-5352 in bovine and ovine genomes and expressed in ovine abomasal organoids by RNA-seq (q-value < 0.05). (C) RT-qPCR of selected hco-miR-5352 predicted target mRNAs from GI organoids following no treatment or treated with IL-13, IL-13 plus control mimic or IL-13 plus hco-miR-5352 mimic. Il22ra1 was amplified from murine SI organoids, WWC3 and hnrnpAB were amplified from ovine abomasal organoids, all at day 2 after treatment. Log2 fold change of RT-qPCR values are compared with non-stimulated control in three independent biological replicates. *, P < 0.05; **, P < 0.01. (D) Representative confocal microscopy images of murine SI control (untreated) organoids, treated with IL-22, or IL-22 plus control mimic (50nM) or IL-22 plus miR-5352 mimic (50nM) at day 4 after treatment, showing RELMB (Resistin-like beta, RETNLB) IFA. (E) Average percentage of IL-22 phenotype (small, non-budding, dark organoids) in murine SI organoids at day 4 after no treatment, or treatment with IL-22, IL-22 plus control mimic or IL-22 plus miR-5352 mimic. (F) Representative confocal images of ovine SI control (untreated) organoids, treated with IL-22, treated with IL-22 plus control mimic (50nM) or treated with IL-22 plus miR-5352 mimic (50nM) at day 4 after treatment (G) Average percentage of IL-22 phenotype in ovine SI organoids at day 4 after control, IL-22, IL-22 plus control mimic or IL-22 plus miR-5352 mimic treatment. Graphs represent the average of at least 5 images and in total represents 500 organoids per treatment. Statistics calculated with a two-tailed t-test on mean of biological replicates (n=3) compared to control. Scale bars: 300 µm.
Of the 61 total predicted Hco-miR-5352 targets, six were not found to be expressed in abomasal organoids by our bulk RNA-seq (Cluster of Differentiation 69 (CD69), nuclear receptor binding protein 2 (Nrbp2), Orthodenticle Homeobox 2 (Otx2), Alanyl-tRNA synthetase 1 (Aars1), cytochrome P450 family 4 subfamily V polypeptide 2 (Cyp4v2) and Coenzyme Q8A (Coq8a)) (Supplementary Table S11). The remaining predicted targets showed enrichment (q-value <0.05) for GO: BP terms regulation of signal transduction and cell differentiation (Figure 6B). From our ovine abomasal RNA-seq data, 23 of the 55 predicted targets (42%) were down-regulated following transfection with miR-5352 mimic plus IL-13 relative to control mimic plus IL-13. These down-regulated targets included: Il22ra1, encoding the receptor for cytokine IL-22 which modulates expression of mucins in the intestinal mucous layer (78) and promotes Paneth cell maturation by suppressing Wnt and Notch signalling pathways (79, 80); hnrnpAB (heterogeneous nuclear ribonucleoprotein A/B), which inhibits Notch signalling (81); and WWC3, which inhibits Wnt and promotes Hippo signalling (82) (Supplementary Table S11). RT-qPCR supported the RNA-seq data, with all three transcripts reduced in GI organoids 2 days after treatment with miR-5352 mimic plus IL-13 compared to IL-13 treatment alone or IL-13 plus control mimic (Figure 6C). Il22ra1 proved difficult to detect in ovine abomasal organoids. However, this transcript could be amplified from murine SI organoids, suggesting higher Il22ra1 expression in SI than in gastric epithelia. In contrast to hnrnpAB and WWC3, which increased following IL-13 treatment, expression of Il22ra1 decreased with IL-13 and decreased further following treatment with IL-13 plus miR-5352 mimic vs IL-13 plus control mimic (Figure 6C).
To test any reduction in response to IL-22 in the presence of miR-5352 mimic, murine and ovine SI organoids were treated with IL-22 and organoid morphology was examined over the course of 4 days. IL-22 alone or IL-22 plus control mimic resulted in a change in organoid phenotype relative to untreated control organoids, first observed after 12 h. This phenotype was characterised by reduced budding, a darker appearance and an increase of the goblet cell marker RELM-β (Resistin-like beta molecule) (Figure 6D, F), strongly induced by IL-22 (83, 84). In contrast, in the presence of IL-22 and miR-5352 mimic, 53% of the murine SI organoids (Figure 6D, E) and 63% of ovine SI organoids (Figure 6F, G) failed to show this IL-22 phenotype after 4 days and were similar to untreated organoids (control). These results, together with target prediction and RT-qPCR data, suggest that miR-5352 can suppress IL-22 effects by reducing expression of IL-22RA1 on epithelial cells.
3.7 miR-5352 suppresses Klf-4 and mimics a host regulatory mechanism
Another high confidence predicted target of hco-miR-5352 is the previously mentioned Kruppel-like transcription factor gene Klf4, which was down-regulated following miR-5352 mimic transfection of abomasal organoids, by RT-qPCR (Figures 2B, C); the read count for Klf-4 was also decreased by miR-5352 in our RNA-seq data, but this was not significant (Supplementary Table S11). KLF4 can bind to the transcriptional activation domain of β-catenin, inhibiting β-catenin-mediated transcription of Wnt-responsive genes, thus promoting cell differentiation (85) (Figure 7A). The expression of β-catenin (CTNNB1) was examined by RT-qPCR in abomasal organoids at 2 and 4 days after treatment with IL-13 alone, or IL-13 plus miR-5352 or control mimic. Levels were increased with miR-5352 mimic plus IL-13 relative to controls and were similar to unstimulated abomasal organoids (Figure 7B). These changes in expression were supported by CTNNB1 IFA in ovine abomasal (Figure 7C) and ovine SI (Figure 7D) organoids. In some cells, nuclear localisation of CTNNB1 was evident, suggesting cytoplasmic-nuclear shuttling of β-catenin and activation of the Wnt/β-catenin pathway in the presence of miR-5352 mimic (Figure 7C, D). This implies that miR-5352 mitigates the IL-13-mediated down-regulation of CTNNB1 (Figure 7B, Supplementary Table S6), potentially through direct suppression of Klf4 expression. Notably, recovery of CTNNB1 level was detected at day 4 after treatment, but not at day 2, suggesting a lag time between a reduction in Klf4 and increase in CTNNB1. Our target prediction data indicate that miR-5352 potentially modulates expression of multiple target genes involved in Wnt and Notch regulation: Klf4, Il22ra1, hnrnpAB and WWC3. From RNA-seq data, the miRNA-mediated down-regulation of these predicted targets is modest, as may be expected for miRNA activity (86). Additively, the overall effect is inhibition of tuft and mucous cell differentiation and promotion of stemness, via modulation of Wnt and Notch signalling.
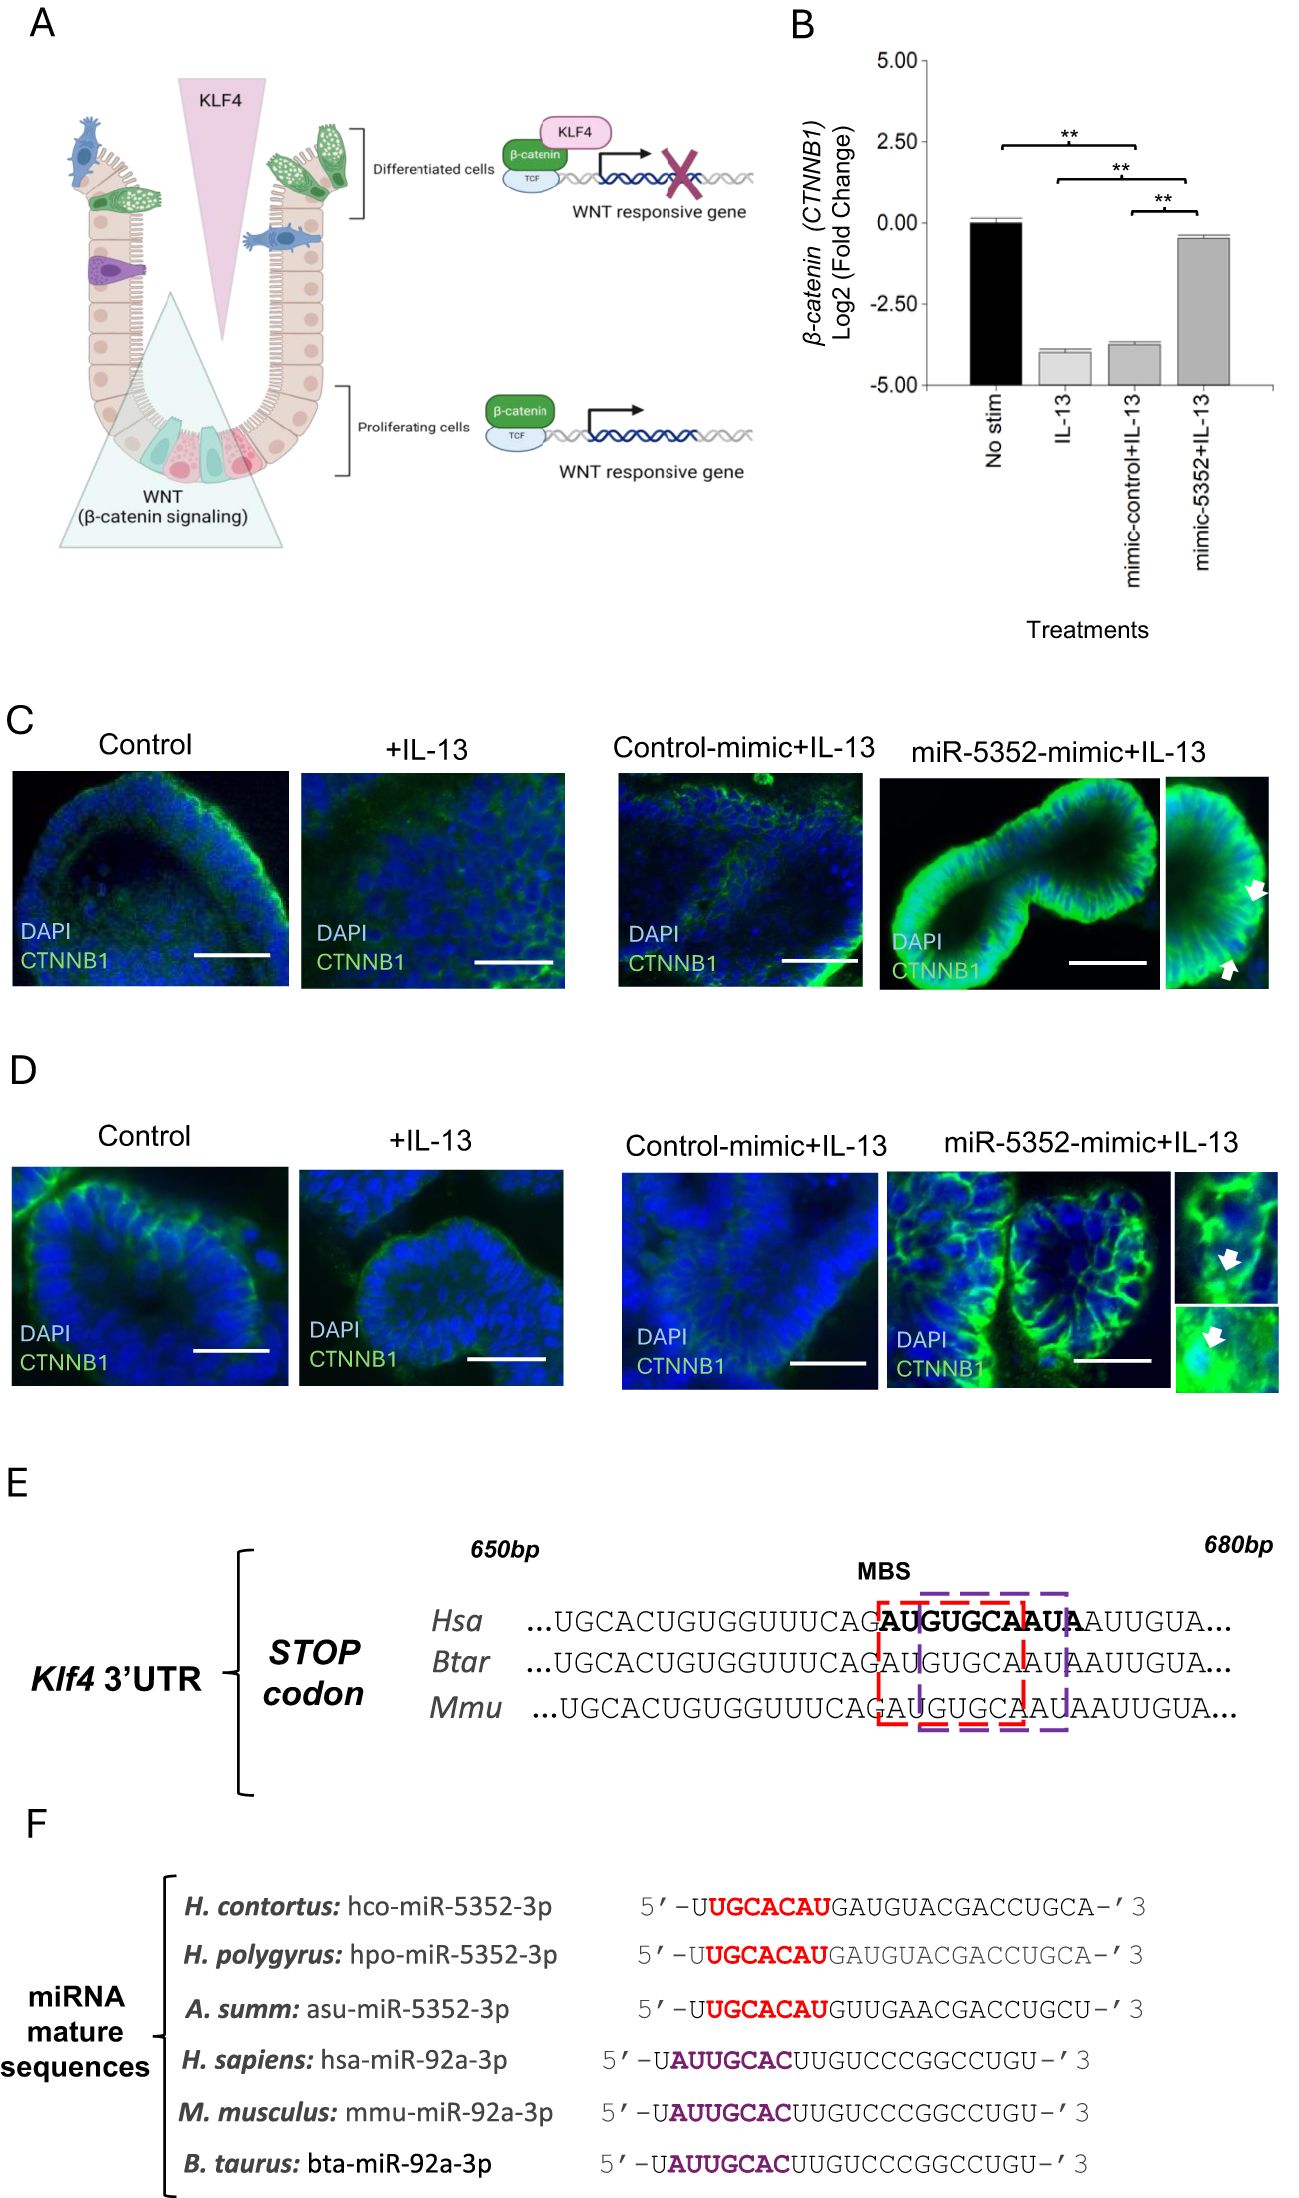
Figure 7. miR-5352 mediates suppression of Klf-4 Wnt signaling and can mimic a host regulatory mechanism. (A) Model for KLF4-mediated regulation of β-catenin (based on Ref 68.) KLF4 expressed in differentiated epithelial cells binds to β-catenin and suppresses β-catenin-dependent Wnt signalling, resulting in differentiation. Down-regulation of KLF4 relieves β-catenin suppression and promotes Wnt signalling and cell proliferation. (B) Expression of β-catenin (CTNNB1) in ovine abomasal organoids treated with IL-13, IL-13 plus control mimic or IL-13 plus miR-5352 mimic (day 4 after treatment). Log2 fold change of qRT-PCR values are compared with non-stimulated control in three independent biological replicates. *, P < 0.05; **, P < 0.01. (C) Confocal IFA microscopy showing CTNNB1+ cells in abomasal organoids untreated or incubated with IL-13 alone, IL-13 plus control mimic or miR-5352 mimic (day 4 of culture). Scale bars: 20µm. Arrows indicate CTNNB antibody localisation in the nuclei of epithelial cells. D) Confocal microscopy showing CTNNB1+ cells in ovine SI organoids untreated or incubated with IL-13 alone or IL-13 plus control mimic or miR-5352 mimic (day 4 of culture). Scale bars: 20µm. (E) Overlap of predicted miRNA binding site (MBS) for Hco-miR-5352 (red) and Hsa-miR-92a (purple) in Klf4 3’UTR from human, bovine and murine. MBS is approximately 670bp downstream of the stop codon (miRanda and RNAhybrid data). (F) Alignment of seed sequence (nucleotides 2-8) of miR-5352 sequences from GI nematode species (red) with mammalian (human, murine, bovine) miR-92a (purple). MirBase accession numbers: hco-miR-5352-3p, MI0020053; hpo-miR-5352-3p, MI0032733; asu-miR-5352-3p, MI0018601 (Ascaris suum); hsa-miR-92a-3p, MIMAT0000092; mmu-miR-92a-3p, MIMAT0000539; bta-miR-5352-3p, MIMAT0009383. MiR-5352 sequences identified in additional GI nematodes are detailed in Ref 34.
In humans, expression of Klf4 is regulated post-transcriptionally by Hsa-miR-92a (87, 88). By analysing the Klf-4 3’UTR sequence, we found that the predicted binding site for miR-5352 overlaps with that for Hsa-miR-92a and is conserved across humans, mice and ruminants (Figure 7E). The seed sequence (nucleotides 2-8) of Hco-miR-5352 partially aligns with mammalian miR-92a seed and is conserved across different GI nematodes (Figure 7F). This suggests that miR-5352 in GI nematodes may have evolved to mimic host miR-92a and can phenocopy effects on GI tissues, promoting cell stemness and reducing differentiation (88).
4 Discussion
Parasitic helminths are remarkable in establishing persistent infections within their hosts, often eliciting minimal inflammatory responses and employing a range of mechanisms to prevent or delay their expulsion (89). Here we report that ES products from H. contortus can suppress effects of the type-2 cytokine IL-13 on tuft and mucous cell differentiation in ovine and murine GI organoids. Remarkably, a single miRNA, miR-5352, present in ES from H. contortus, H. polygyrus and other GI nematodes (12, 34) achieved the same effect. We identified target mRNAs down-regulated following miRNA mimic transfection of organoids, and our data indicate that parasite-mediated enhancement of Wnt and Notch signalling are key mechanisms of miR-5352-mediated immunomodulation in host GI cells.
Helminth miRNAs have been sequenced from secreted EV or non-vesicular ES products (12, 15–18) and their interaction with host cells identify them as potential regulators of host gene expression. EVs released by H. polygyrus adult worms can down-regulate expression of host Il33r and Dusp1 in macrophage cells in vitro (12). Several EV miRNAs were proposed to be involved, but the precise mechanisms are not yet elucidated. The focus of this study, miR-5352, is enriched in non-vesicular ES released from H. contortus parasitic L4 larvae and adult stages, with lower abundance in EV (34). Notably, we show that the seed sequence of GI nematode miR-5352 is similar to host miR-92a (miR-25 family) and that the miRNAs have overlapping binding sites in the 3’UTR of target mRNA Klf4. Human miR-92a regulates host cell proliferation (90) and maintains stemness in the GI tract (91), consistent with our observed effects of miR-5352 mimic on GI organoids. In support of our findings, previous studies reported that miRNAs in helminth ES show sequence similarity to host miRNA sequences, including miR-100, let-7, lin-4 and bantam (12, 14, 34). Helminth secreted miRNAs may, therefore, represent a form of molecular mimicry to aid parasite survival, analogous to parasite proteins such as H. polygyrus TGF-β mimics which can mimic the biological functions of host TGF-β (92). From an evolutionary perspective, the conservation of miRNA and 3’UTR regulatory sequences across host and parasite suggests that mutational changes and potential host ‘resistance’ to parasite manipulation may be unlikely to occur (93), and that cross-species regulation may have arisen as parasites and hosts co-evolved towards a tolerance relationship.
The modulatory effects of hco-miR-5352 may be enhanced by the action of other H. contortus secreted miRNAs, including those from the same cluster, and/or other ES components, such as other small RNAs or proteins. Indeed, we found that some of the predicted targets of hco-miR-5352 could potentially be targeted by other miRNAs in ES of H. contortus and other helminths. As well as suggesting additive regulatory effects, this lends confidence to the predictions, since 3’UTRs with more than one target site are more likely to be genuine miRNA targets (94).
Additionally, our previous studies detected hco-miR-5352 (and other hco-miRs) in abomasal mucosa and mesenteric lymph nodes following H. contortus infection (34), suggesting that H. contortus miRNAs may modulate expression of epithelial and immune-associated genes. Further studies employing immune cells alone or co-culture of organoids with immune cells will help determine additional regulatory effects of helminth ES and miRNAs on host immune function and epithelial-immune cell cross-talk.
A number of miR-5352 targets identified here (Klf4, WWC3, hnrnpAB, Il22ra1) are involved in regulating Wnt and/or Notch signalling. MiR-mediated down-regulation of these target genes is predicted to enhance Wnt/Notch signalling, promoting GI epithelial cell stemness and reducing secretory cell differentiation. Drurey et al. (22) previously proposed that the increase in Hes1 following exposure of murine SI organoids to H. polygyus ES suppressed Atoh1, and subsequently secretory cell numbers, however the mechanism of Hes1 induction was not established. Our data suggest that miR-5352-driven suppression of target genes enhances Notch and expression of its downstream gene Hes1. Suppression of Il22ra1 by miR-5352 is a potential additional mechanism by which nematodes may modulate epithelial cell differentiation. IL-22, produced mainly by Th1, Th17 and ILC3 cells (95), promotes mucous/goblet cell hyperplasia, and production of the antimicrobial peptide RELM-β involved in the weep and sweep response (84, 96). IL-22 deficient mice show impaired expulsion of the SI nematode N. brasiliensis and colonic whipworm T. muris, despite strong type-2 cytokine responses (96). In a more recent study (97), IL-22 was found to synergise with IL-1β in production of antimicrobial peptides and neutrophil chemoattractant cytokine CXCL1 produced by ileum and colon epithelial cells, to more effectively clear Citrobacter rodentium infection. A reduction in neutrophil infiltration, resulting from reduced IL22RA1 levels, may be an additional mechanism enabling GI nematode survival.
Regulation of Il22ra1 by miR-92a and/or other miRNAs, may have evolved as a host feedback mechanism to limit mucous cell expansion. Recent studies have identified additional novel regulatory mechanisms for control or resolution of host GI immune responses and inflammation: BMP signalling induced by IL-13 was shown to restrict the increase in tuft cell numbers following IL-13 treatment or N. brasiliensis infection (84), while the IL-25 receptor IL-17RB present on tuft cells acts as a brake on their production of IL-25 that stimulates ILC2 cells (98). Multiple mechanisms are likely at play to limit innate and adaptive responses potentially associated with immunopathology or inappropriate activation, and these mechanisms may be exploited by nematodes for amelioration of immune defences.
Abomasal or SI organoids exposed to H. contortus ES or miR-5352 mimic alone showed relatively normal organoid growth morphology, albeit with less differentiation of secretory cells, and maintained a stem cell population capable of regrowth/renewal. This contrasts with the spheroid morphology observed after treatment of murine SI organoids with concentrated ES of H. polygyrus (22, 62) or ES of Ostertagia ostertagi L3 larvae (99). Spheroid or foetal-like regions of the SI were also reported following H. polygyrus infection (63). Spheroid formation is likely to be an extreme and localised effect of high concentration of ES, which interferes with both cell differentiation and renewal. While this response is not unique to H. polygyrus, ES from this nematode appears to have a more potent effect than H. contortus ES. As each helminth species has a different predilection site within the host, some differences between parasite ES effects may be expected. Detailed comparisons of ES components across species may be predicted to identify conserved and unique molecule(s) involved. Notably, data in Karo-Atar et al. (62) show that H. polygyrus ES also reduced expression of Il22ra1 and Klf4 in SI murine organoids, and increased expression of Lgr5 and Olfm4, although a causative mechanism was not proposed. Our findings suggest that this can be mediated by nematode miR-5352 alone, and may act in combination with other ES components, which can be examined in future studies.
Specific target genes and pathways regulated by helminth miRNAs can help reveal novel therapeutic approaches for GI parasite control and for immune- or damage-related disorders (100). “Helminth therapy” can be applied to autoimmune and chronic inflammatory disorders of the GI tract responsible for inflammatory bowel disease (IBD) (101) but the molecular mechanisms involved in reducing inflammation or repairing damaged tissue are unclear. We show that a single GI nematode secreted miRNA can regulate host genes to promote stem cell maintenance, regeneration of host GI epithelial tissue and potentially reduce inflammation and immune cell migration. Therapeutic intervention using miRNAs is an established approach that can modulate multiple gene networks using stable oligonucleotides to enhance (miRNA mimic) or interfere with (anti-miR) endogenous miRNAs (102). Notably, higher levels of IL-22 are associated with Crohn’s disease (103), thus miRNA-mediated suppression of Il22ra1 could help alleviate disease symptoms. Future studies testing delivery and stability of mimics and inhibitors of miR-5352 and other nematode miRNAs, will help evaluate their potential to influence infection outcome and treat immune-related disorders.
Data availability statement
The data presented in the study are deposited in the SRA repository, accession number BioProject: PRJNA1102187.
Ethics statement
The animal study was approved by Moredun Research Institute (MRI) under license as required by the UK Animals Scientific Procedures Act 1986, with ethical approval from MRI Animal Experiments Committee. The study was conducted in accordance with the local legislation and institutional requirements.
Author contributions
MP: Conceptualization, Data curation, Formal Analysis, Funding acquisition, Investigation, Methodology, Resources, Validation, Visualization, Writing – original draft, Writing – review & editing. VG: Methodology, Resources, Writing – review & editing. WA: Investigation, Validation, Writing – review & editing. FG: Resources, Writing – review & editing. FH: Resources, Writing – review & editing. TM: Funding acquisition, Resources, Writing – review & editing. RM: Funding acquisition, Resources, Writing – review & editing. PJ: Funding acquisition, Resources, Writing – review & editing. ED: Conceptualization, Funding acquisition, Resources, Supervision, Writing – review & editing. CB: Conceptualization, Funding acquisition, Investigation, Project administration, Resources, Supervision, Writing – review & editing.
Funding
The author(s) declare that financial support was received for the research and/or publication of this article. This work was supported by the Royal Society through a Newton International Fellowship (NIF\R1\201159) and McIntyre International Research Fellowship (University of Glasgow) to MGP, and by a Wellcome Collaborative Award (Ref 211814) to RMM, CB, ED, PJ, TNMcN.
Acknowledgments
The authors gratefully acknowledge Colin Loney, Imaging Manager (Medical Research Council-University of Glasgow Centre for Virus Research) for help with imaging, Dr David Smith (MRI) for provision of ovine small intestinal organoids, and Dr Roz Laing (University of Glasgow) for provision of Haemonchus contortus adult parasites. We thank Prof Brian Shiels for comments on the manuscript.
Conflict of interest
The authors declare that the research was conducted in the absence of any commercial or financial relationships that could be construed as a potential conflict of interest.
Generative AI statement
The author(s) declare that no Generative AI was used in the creation of this manuscript.
Publisher’s note
All claims expressed in this article are solely those of the authors and do not necessarily represent those of their affiliated organizations, or those of the publisher, the editors and the reviewers. Any product that may be evaluated in this article, or claim that may be made by its manufacturer, is not guaranteed or endorsed by the publisher.
Supplementary material
The Supplementary Material for this article can be found online at: https://www.frontiersin.org/articles/10.3389/fimmu.2025.1558132/full#supplementary-material
Supplementary Figure 1 | Reference gene selection for RT-qPCR data normalization by BestKeeper and NormFinder. Ovine Actin (ACTB) and mouse Glyceraldehyde 3-phosphate dehydrogenase (GAPDH) were the genes that showed a cycle threshold (Ct) standard deviation ≤0.5 with a coefficient of correlation ~1 according to BestKeeper analysis, and a low stability value according to NormFinder analysis (minimal expression variability).
Supplementary Figure 2 | Spheroid phenotype in GI organoids after H. contortus or H. polygyrus concentrated ES exposure for 12 h. Representative light microscopy images of ovine abomasal organoids, ovine small intestinal (SI) organoids, and murine SI organoids exposed to concentrated H. polygyrus (Hpoly) and or H. contortus (Hco) adult excretory-secretory (ES) products (10 µg/ml). Control shows organoids in growth medium alone and lower panels show organoids exposed to the flow-through of Hpoly or Hco ES after concentration (3kDa cut-off). White arrows indicate spheroid organoids identified by thinner membrane and more granular appearance. Scale bar = 300 µm.
Supplementary Figure 3 | (A) Expression of predicted miR-5352 target gene Klf4 in ovine abomasal organoids with no stimulation, treated with IL-13 alone, control mimic (miRIDIAN negative control sequence) + IL13 (alone, with Lipofectamine, or DharmaFECT reagent), or scrambled miR-5352 mimic + IL-13 (alone, with Lipofectamine, or DharmaFECT reagent). miRNA mimics at 100 nM final conc. (B) Expression of Klf4 in ovine abomasal organoids with no stimulation, treated with IL-13 alone, control mimic (miRIDIAN negative control sequence) + IL-13 or scrambled miR-5352 mimic + IL-13, using DharmaFECT as transfection reagent and miRNA mimic at 25, 50, 100 nM. Log2 fold change of RT-qPCR values were compared with non-stimulated control in three independent biological replicates +/- SD. Statistical analysis was by ordinary one-way ANOVA with Tukey’s multiple comparisons test; **, P < 0.01. (C) Representative images of Dclk1 tdTomato+ tuft cells in murine SI organoids, untreated (No stim), treatment with IL-13, control mimic (miRIDIAN negative control sequence) + IL-13, scrambled miR-5352 mimic + IL-13, and miR-5352 mimic + IL-13, using DharmaFECT as transfection reagent and mimics at 50 nM in OGM for 4 days at 37°C. (D) Number of Dclk1 tdTomato+ cells in murine SI organoids at 4 days after treatment with IL-13, control mimic + IL-13, scrambled miR-5352 mimic + IL-13, and miR-5352 mimic + IL-13, using DharmaFECT as transfection reagent and mimics at 50 nM. Graph shows the average number of tdTomato+ cells from 5 images (250 organoids per treatment). Statistics calculated with a two-tailed t-test on mean of biological replicates (n=2) compared to untreated organoids. Scale bars: 100 µm.
Supplementary Figure 4 | (A) Volcano plot of differential expression analysis (DESeq) in abomasal organoids treated with IL-13 plus control mimic vs. those treated with IL-13 alone and cultured for 48 h. x-axis represents the fold change of the difference after conversion to log2; y-axis represents the significance value after conversion to -log10. (B) Heat map showing expression level of genes from ovine abomasal organoids treated with IL-13 plus control mimic and IL-13 alone using normalised average read counts, standardized method: log (value+1). Colours indicate level of expression from low (blue) to high (red).
Supplementary Table 1 | Protein concentration of H. contortus ES different fractions.
Supplementary Table 2 | H. contortus miR-5352 mimic and control sequences used in organoid transfection experiments.
Supplementary Table 3 | Details of antibodies used in immunofluorescence experiments.
Supplementary Table 4 | Primer sequences of genes of interest and reference genes for ovine and murine RT-qPCRs.
Supplementary Table 5 | Ovine abomasal organoid RNA-seq results summary. RNA-seq output data, showing number of reads and mapping to reference genome Ovis aries v4.0.
Supplementary Table 6 | Differential expression analysis (DESeq) of ovine abomasal organoids treated with IL-13 vs. untreated abomasal organoids (CONTROL) in culture for 48 h.
Supplementary Table 7 | Differential expression analysis (DESeq) of ovine abomasal organoids transfected with Hco-miR-5352 mimic (MIMIC) vs. control mimic (CONTROL_MIMIC). Both were co-treated with IL-13 and cultured for 48 h.
Supplementary Table 8 | Abomasal genes with opposite direction of regulation in ovine abomasal organoids treated with IL-13 versus no treatment, compared to IL-13 plus Hco-miR-5352 mimic versus IL-13 plus control mimic.
Supplementary Table 9 | Gene set enrichment analysis (GSEA) for Biological Process domain (GO: BP) terms (ranked by NES value) of ovine abomasal organoids treated with IL-13 relative to control with no stimulation, after 48 h of culture. Relevant terms are highlight in grey.
Supplementary Table 10 | Gene set enrichment analysis (GSEA) for Biological Process domain (GO: BP) terms (ranked by NES value) of ovine abomasal organoids transfected with miR-5352 mimic relative to miRNA control mimic transfection, both treated with IL-13 and cultured for 48h. Relevant terms are highlight in grey.
Supplementary Table 11 | Bovine and ovine bioinformatic target prediction datasets for Hco-miR-5352, and expression from ovine abomasal RNA-seq.
References
1. World Health Organization. Soil-transmitted helminth infections (2024). Available online at: https://www.who.int/news-room/fact-sheets/detail/soil-transmitted-helminth-infections (Accessed December 2024).
2. Charlier J, Rinaldi L, Musella V, Ploeger HW, Chartier C, Vineer HR, et al. Initial assessment of the economic burden of major parasitic helminth infections to the ruminant livestock industry in Europe. Prev Vet Med. (2020) 182:105103. doi: 10.1016/j.prevetmed.2020.105103
3. USDA Foreign Agricultural Service. Beef and veal production—selected countries summary (2020). Washington, DC, USA: USDA. Available online at: https://apps.fas.usda.gov/psdonline/app/index.html/app/downloads (Accessed December 2024).
4. Wiedemann M, Voehringer D. Immunomodulation and immune escape strategies of gastrointestinal helminths and schistosomes. Front Immunol. (2020) 11:572865. doi: 10.3389/fimmu.2020.572865
5. Hewitson JP, Grainger JR, Maizels RM. Helminth immunoregulation: the role of parasite secreted proteins in modulating host immunity. Mol Biochem Parasitol. (2009) 167:1–11. doi: 10.1016/j.molbiopara.2009.04.008
6. Maizels R, Smits HH, McSorley HJ. Modulation of host immunity by helminths: expanding the repertoire of parasite effector molecules. Immunity. (2018) 49:801–80. doi: 10.1016/j.immuni.2018.10.016
7. Lee RC, Feinbaum RL, Ambros V. The C. elegans heterochronic gene lin-4 encodes small RNAs with antisense complementarity to lin-14. Cell. (1993) 75:843–54. doi: 10.1016/0092-8674(93)90529-Y
8. Reinhart J, Slack FJ, Basson M, Pasquinelli AE, Bettinger JC, Rougvie AE, et al. The 21-nucleotide let-7 RNA regulates developmental timing in Caenorhabditis elegans. Nature. (2000) 403:901–6. doi: 10.1038/35001607
9. Pasquinelli AE, Reinhart BJ, Slack F, Martindale MQ, Kuroda MI, Maller B. Conservation of the sequence and temporal expression of let-7 heterochronic regulatory RNA. Nature. (2000) 408:86–9. doi: 10.1038/35040556
10. The Nobel Prize in Physiology or Medicine 2024. This year’s Nobel Prize honors two scientists for their discovery of a fundamental principle governing how gene activity is regulated, in: The Nobel Prize (2024). Available online at: https://www.nobelprize.org/prizes/medicine/2024/press-release/ (Accessed November 2024).
11. Chekulaeva M, Filipowicz W. Mechanisms of miRNA-mediated post-transcriptional regulation in animal cells. Curr Opin Cell Biol. (2009) 21:452–60. doi: 10.1016/j.ceb.2009.04.004
12. Buck AH, Coakley G, Simbari F, McSorley HJ, Quintana JF, Le Bihan T, et al. Exosomes secreted by nematode parasites transfer small RNAs to mammalian cells and modulate innate immunity. Nat Commun. (2014) 5:5488. doi: 10.1038/ncomms6488
13. Britton C, Laing R, Devaney E. Small RNAs in parasitic nematodes – forms and functions. Parasitol. (2020) 147:855–64. doi: 10.1017/S0031182019001689
14. Quintana JF, Babayan SA, Buck AH. Small RNAs and extracellular vesicles in filarial nematodes: from nematode development to diagnostics. Parasite Immunol. (2017) 39:e12395. doi: 10.1111/pim.2017.39.issue-2
15. Liu J, Zhu L, Wang J, Qiu L, Chen Y, Davis RE, et al. Schistosoma japonicum extracellular vesicle miRNA cargo regulates host macrophage functions facilitating parasitism. PloS Pathog. (2019) 15:e1007817. doi: 10.1371/journal.ppat.1007817
16. Sotillo J, Robinson MW, Kimber MJ, Cucher M, Ancarola ME, Nejsum P, et al. The protein and microRNA cargo of extracellular vesicles from parasitic helminths - current status and research priorities. Int J Parasitol. (2020) 50:635–45. doi: 10.1016/j.ijpara.2020.04.010
17. Tran N, Ricafrente A, To J, Lund M, Marques TM, Gama-Carvalho M, et al. Fasciola hepatica hijacks host macrophage miRNA machinery to modulate early innate immune responses. Sci Rep. (2021) 11:6712. doi: 10.1038/s41598-021-86125-
18. Zhu L, Liu J, Dao J, Lu K, Li H, Gu H, et al. Molecular characterization of S. japonicum exosome-like vesicles reveals their regulatory roles in parasite-host interactions. Sci Rep. (2016) 6:25885. doi: 10.1038/srep25885
19. Gerbe F, Sidot E, Smyth DJ, Ohmoto M, Matsumoto I, Dardalhon V, et al. Intestinal epithelial tuft cells initiate type 2 mucosal immunity to helminth parasites. Nature. (2016) 529:226–30. doi: 10.1038/nature16527
20. Howitt MR, Lavoie S, Michaud M, Blum AM, Tran SV, Weinstock JV, et al. Tuft cells, taste-chemosensory cells, orchestrate parasite type 2 immunity in the gut. Science. (2016) 351:1329–33. doi: 10.1126/science.aaf1648
21. von Moltke J, Ming J, Liang HE, Locksley RM. Tuft-cell-derived IL-25 regulates an intestinal ILC2-epithelial response circuit. Nature. (2016) 529:221–5. doi: 10.1038/nature16161
22. Drurey C, Lindholm HT, Coakley G, Poveda MC, Löser S, Doolan R, et al. Intestinal epithelial tuft cell induction is negated by a murine helminth and its secreted products. J Exp Med. (2021) 219:e20211140. doi: 10.1084/jem.20211140
23. Umar S. Intestinal stem cells. Curr Gastroent Rep. (2010) 12:340–8. doi: 10.1007/s11894-010-0130-3
24. Flanagan DJ, Austin CR, Vincan E, Phesse TJ. Wnt signalling in gastrointestinal epithelial stem cells. Genes. (2018) 9:178. doi: 10.3390/genes9040178
25. Bankaitis ED, Ha A, Kuo CJ, Magness ST. Reserve stem cells in intestinal homeostasis and injury. Gastroenterol. (2018) 155:1348–61. doi: 10.1053/j.gastro.2018.08.016
26. Xiao S, Zhou L. Gastric stem cells: Physiological and pathological perspectives. Front Cell Dev Biol. (2020) 8:571536. doi: 10.3389/fcell.2020.571536
27. Allair JM, Crowley SM, Law HT, Chang S-Y, Ko H-J, Vallance BA. The intestinal epithelium: Central coordinator of mucosal immunity. Trends Immunol. (2018) 39:677–96. doi: 10.1016/j.it.2018.04.002
28. Greenwood-Van-Meerveld B, Johnson AC, Grundy D. Gastrointestinal physiology and function. Handb Exp Pharmacol. (2017) 239:1–16. doi: 10.1007/164_2016_118
29. Crosnier C, Stamataki D, Lewis J. Organizing cell renewal in the intestine: stem cells, signals and combinatorial control. Nat Rev Genet. (2006) 7:349–59. doi: 10.1038/nrg1840
30. Soderholm AT, Pedicord VA. Intestinal epithelial cells: at the interface of the microbiota and mucosal immunity. Immunology. (2019) 158:267–80. doi: 10.1111/imm.13117
31. Silva FA, Rodrigues BL, Ayrizono ML, Leal RF. The immunological basis of inflammatory bowel disease. Gastroenterol Res Pract. (2016) 2016:2097274. doi: 10.1155/2016/2097274
32. Winter AD, Weir W, Hunt M, Berriman M, Gilleard JS, Devaney E, et al. Diversity in parasitic nematode genomes: the microRNAs of Brugia pahangi and Haemonchus contortus are largely novel. BMC Genomics. (2012) 13:4. doi: 10.1186/1471-2164-13-4
33. Doyle SR, Tracey A, Laing R, Holroyd N, Bartley D, Bazant W, et al. Genomic and transcriptomic variation defines the chromosome-scale assembly of Haemonchus contortus, a model gastrointestinal worm. Commun Biol. (2020) 3:656. doi: 10.1038/s42003-020-01377-3
34. Gu HY, Marks ND, Winter AD, Weir W, Tzelos T, McNeilly TN, et al. Conservation of a microRNA cluster in parasitic nematodes and profiling of miRNAs in excretory-secretory products and microvesicles of Haemonchus contortus. PloS Negl Trop Dis. (2017) 11:e0006056. doi: 10.1371/journal.pntd.0006056
35. Smith D, Price DRG, Burrells A, Faber MN, Hildersley KA, Chintoan-Uta C, et al. The development of ovine gastric and intestinal organoids for studying ruminant host-pathogen interactions. Front Cell Infect Microbiol. (2021) 11:733811. doi: 10.3389/fcimb.2021.733811
36. Tan J, Liu Y, Li W, Chen G, Fang Y, He X, et al. A strainer-based platform for the collection and immunolabeling of mouse intestinal organoids. Int J Mol Sci. (2023) 24:13568. doi: 10.3390/ijms241713568
37. Johnston CJ, Robertson E, Harcus Y, Grainger JR, Coakley G, Smyth DJ, et al. Cultivation of Heligmosomoides polygyrus: an immunomodulatory nematode parasite and its secreted products. JoVE. (2015) 98):e52412. doi: 10.3791/52412
38. Buck AH, Perot J, Chisholm MA, Kumar DS, Tuddenham L, Cognat V, et al. Post-transcriptional regulation of miR-27 in murine cytomegalovirus infection. RNA. (2010) 16:307–15. doi: 10.1261/rna.1819210
39. O’Rourke KP, Dow LE, Lowe SW. Immunofluorescent staining of mouse intestinal stem cells. Bio Protoc. (2016) 6:e1732. doi: 10.21769/bioprotoc.1732
40. Pfaffl MW, Horgan GW, Dempfle L. Relative expression software tool (REST) for group-wise comparison and statistical analysis of relative expression results in real-time PCR. Nucleic Acids Res. (2002) 30:e36. doi: 10.1093/nar/30.9.e36
41. Pfaffl MW, Tichopad A, Prgomet C, Neuvians TP. Determination of stable housekeeping genes, differentially regulated target genes and sample integrity: BestKeeper—Excel-based tool using pair-wise correlations. Biotechnol Lett. (2004) 26:509–15. doi: 10.1023/b:bile.0000019559.84305.47
42. Andersen CL, Jensen JL, Ørntoft TF. Normalization of real-time quantitative reverse transcription-PCR data: A model-based variance estimation approach to identify genes suited for normalization, applied to bladder and colon cancer data sets. Cancer Res. (2004) 64:5245–50. doi: 10.1158/0008-5472.CAN-04-0496
43. Di Rienzo JA. fgStatistics. In: Statistical software for the analysis of experiments of functional genomics (2012). Available at: http://sites.google.com/site/fgStatistics/ (Accessed March 17, 2025).
44. Cunningham F, Allen JE, Allen J, Alvarez-Jarreta J, Amode MR, Armean IM, et al. Ensembl 2022. Nucleic Acids Res. (2022) 50:D988–95. doi: 10.1093/nar/gkab1049
45. Enright AJ, John B, Gaul U, Tuschl T, Sander C, Marks DS. MicroRNA targets in drosophila. Genome Biol. (2003) 5:R1. doi: 10.1186/gb-2003-5-1-r1
46. Krüger J, Rehmsmeier M. RNAhybrid: microRNA target prediction easy, fast and flexible. Nucleic Acids Res. (2006) 34:W451–4. doi: 10.1093/nar/gkl243
48. Cantalapiedra CP, Hernández-Plaza A, Letunic I, Bork P, Huerta-Cepas J. eggNOG-mapper v2: Functional annotation, orthology assignments, and domain prediction at the metagenomic scale. Mol Biol Evolut. (2021) 38:5825–9. doi: 10.1093/molbev/msab293
49. Wickham H, François R, Henry L, Müller K, Vaughan D. dplyr: A grammar of data manipulation (2023). Available online at: https://dplyr.tidyverse.org (Accessed December 12, 2024).
50. Cock PJA, Fields CJ, Goto N, Heuer ML, Rice PM. The Sanger FASTQ file format for sequences with quality scores, and the Solexa/Illumina FASTQ variants. Nucleic Acids Res. (2010) 38:1767–71. doi: 10.1093/nar/gkp1137
51. Kim D, Langmead B, Salzberg SL. HISAT: a fast spliced aligner with low memory requirements. Nat Methods. (2015) 12:357–60. doi: 10.1038/nmeth.3317
52. Langmead B, Salzberg SL. Fast gapped-read alignment with Bowtie 2. Nat Methods. (2012) 9:357–9. doi: 10.1038/nmeth.1923
53. Li B, Dewey CN. RSEM: accurate transcript quantification from RNA-Seq data with or without a reference genome. BMC Bioinf. (2011) 12:323. doi: 10.1186/1471-2105-12-323
54. Love MI, Huber W, Anders S. Moderated estimation of fold change and dispersion for RNA-seq data with DESeq2. Genome Biol. (2014) 15:550. doi: 10.1186/s13059-014-0550-8
55. Hildersley KA, McNeilly TN, Gillan V, Otto TD, Löser S, Gerbe F, et al. Tuft cells increase following ovine intestinal parasite infections and define evolutionarily conserved and divergent responses. Front Immunol. (2021) 12:781108. doi: 10.3389/fimmu.2021.781108
56. Babu SD, Jayanthi V, Devaraj N, Reis CA, Devaraj H. Expression profile of mucins (MUC2, MUC5AC and MUC6) in Helicobacter pylori infected pre-neoplastic and neoplastic human gastric epithelium. Mol Cancer. (2006) 19:10. doi: 10.1186/1476-4598-5-10
57. Koch U, Radtke F. Notch and cancer: a double-edged sword. Cell Mol Life Sci. (2007) 64:2746–62. doi: 10.1007/s00018-007-7164-1
58. Hasnain SZ, Thornton DJ, Grencis RK. Changes in the mucosal barrier during acute and chronic Trichuris muris infection. Parasite Immunol. (2011) 33:45–55. doi: 10.1111/j.1365-3024.2010.01258.x
59. McIntire MG, Soucy G, Vaughan TL, Shahsafaei A, Odze RD. MUC2 is a highly specific marker of goblet cell metaplasia in the distal esophagus and gastroesophageal junction. Am J Surg Pathol. (2011) 35:1007–13. doi: 10.1097/PAS.0b013e318218940d
60. Yang Q, Bermingham NA, Finegold MJ, Zoghbi HY. Requirement of Math1 for secretory cell lineage commitment in the mouse intestine. Science. (2001) 294:2155–8. doi: 10.1126/science.1065718
61. Kim TH, Shivdasani RA. Stomach development, stem cells and disease. Development. (2016) 143:554–65. doi: 10.1242/dev.124891
62. Karo-Atar D, Ouladan S, Javkar T, Joumier L, Matheson MK, Merritt S, et al. Helminth-induced reprogramming of the stem cell compartment inhibits type 2 immunity. J Exp Med. (2022) 219:e20212311. doi: 10.1084/jem.20212311
63. Nusse YM, Savage AK, Marangoni P, Rosendahl-Huber AKM, Landman TA, de Sauvage FJ, et al. Parasitic helminths induce fetal-like reversion in the intestinal stem cell niche. Nature. (2018) 559:109–13. doi: 10.1038/s41586-018-0257-1
64. Ghaleb AM, McConnell BB, Kaestner KH, Yang VW. Altered intestinal epithelial homeostasis in mice with intestine-specific deletion of the Kruppel-like factor 4 gene. Dev Biol. (2011) 349:310–20. doi: 10.1016/j.ydbio.2010.11.001
65. Katano T, Bialkowska AB, Yang VW. KLF4 regulates goblet cell differentiation in BMI1+ reserve intestinal stem cell lineage during homeostasis. Int J Stem Cells. (2020) 13:424–31. doi: 10.15283/ijsc20048
66. Katz JP, Perreault N, Goldstein BG, Lee CS, Labosky PA, Yang VW, et al. The zinc-finger transcription factor Klf4 is required for terminal differentiation of goblet cells in the colon. Development. (2002) 129:2619–28. doi: 10.1242/dev.129.11.2619
67. Santhakumar D, Forster T, Laqtom NN, Fragkoudis R, Dickinson P, Abreu-Goodger C, et al. Combined agonist-antagonist genome-wide functional screening identifies broadly active antiviral microRNAs. Proc Natl Acad Sci U S A. (2010) 107:13830–5. doi: 10.1073/pnas.1008861107
68. Li RW, Rinaldi M, Capuco AV. Characterization of the abomasal transcriptome for mechanisms of resistance to gastrointestinal nematodes in cattle. Vet Res. (2011) 42:114. doi: 10.1186/1297-9716-42-114
69. Lee J-H, Park J-W, Byun JK, Kim HK, Ryu PD, Lee SY, et al. Silencing of voltage-gated potassium channel Kv9.3 inhibits proliferation in human colon and lung carcinoma cells. Oncotarget. (2015) 6:8132–43. doi: 10.18632/oncotarget.3545
70. van der Flier LG, Haegebarth A, Stange DE, van de Wetering M, Clevers H. OLFM4 is a robust marker for stem cells in human intestine and marks a subset of colorectal cancer cells. Gastroenterology. (2009) 137:15–7. doi: 10.1053/j.gastro.2009.05.035
71. Holmberg J, Genander M, Halford MM, Annerén C, Sondell M, Chumley MJ, et al. EphB receptors coordinate migration and proliferation in the intestinal stem cell niche. Cell. (2006) 125:1151–63. doi: 10.1016/j.cell.2006.04.030
72. Moon HJ, Finney J, Ronnebaum T, Mure M. Human lysyl oxidase-like 2. Bioorg Chem. (2014) 57:231–41. doi: 10.1016/j.bioorg.2014.07.003
73. Xiu M, Wang Y, Li B, Wang X, Xiao F, Chen S, et al. The role of Notch3 signaling in cancer stemness and chemoresistance: Molecular mechanisms and targeting strategies. Front Mol Biosci. (2021) 8:694141. doi: 10.3389/fmolb.2021.694141
74. He L, Qian X, Ge P, Fan D, Ma X, Wu Q, et al. NOL6 regulates the proliferation and apoptosis of gastric cancer cells via regulating TP53I3, CDK4 and MCM7 expression. Front Oncol. (2022) 12:708081. doi: 10.3389/fonc.2022.708081
75. Subramanian A, Tamayo P, Mootha VK, Mukherjee S, Ebert BL, Gillette MA, et al. Gene set enrichment analysis: a knowledge-based approach for interpreting genome-wide expression profiles. Proc Natl Acad Sci USA. (2005) 102:15545–155550. doi: 10.1073/pnas.0506580102
76. Carroll TD, Newton IP, Chen Y, Blow JJ, Nathke I. Lgr5+ stem cells reside in an unlicensed G1 phase. J Cell Biol. (2018) 217:1667–85. doi: 10.1083/jcb.201708023
77. Demitrack ES, Samuelson LC. Notch regulation of gastrointestinal stem cells. J Physiol. (2016) 594:4791–803. doi: 10.1113/JP271667
78. Klotskova H-B, Kidess E, Nadal AL, Brugman S. The role of interleukin-22 in mammalian homeostasis: Friend and foe. Immun Inflamm Dis. (2023) 12:e1144. doi: 10.1002/iid3.1144
79. Sonnenberg GF, Fouser LA, Artis D. Border patrol: regulation of immunity, inflammation and tissue homeostasis at barrier surfaces by IL-22. Nat Immunol. (2011) 12:383–90. doi: 10.1038/ni.2025
80. Zhang X, Liu S, Wang Y, Hu H, Li L, Wu Y, et al. Interleukin-22 regulates the homeostasis of the intestinal epithelium during inflammation. Int J Mol Med. (2019) 43:1657–68. doi: 10.3892/ijmm.2019.4092
81. Yang J, Chan CY, Jiang B, Yu X, Zhu G-Z, Chen Y, et al. hnRNP I inhibits Notch signaling and regulates intestinal epithelial homeostasis in the zebrafish. PloS Genet. (2009) 5:e1000363. doi: 10.1371/journal.pgen.1000363
82. Han Q, Lin X, Zhang X, Jiang G, Zhang Y, Miao Y, et al. WWC3 regulates the Wnt and Hippo pathways via Dishevelled proteins and large tumour suppressor 1, to suppress lung cancer invasion and metastasis. J Pathol. (2017) 242:435–47. doi: 10.1002/path.4919
83. He GW, Lin L, DeMartino J, Zheng X, Staliarova N, Dayton T, et al. Optimized human intestinal organoid model reveals interleukin-22-dependency of paneth cell formation. Cell Stem Cell. (2021) 29:1718–20. doi: 10.1016/j.stem.2022.11.001
84. Lindholm HT, Parmar N, Drurey C, Campillo Poveda M, Vornewald PM, Ostrop J, et al. BMP signaling in the intestinal epithelium drives a critical feedback loop to restrain IL-13-driven tuft cell hyperplasia. Sci Immunol. (2022) 7:eabl6543. doi: 10.1126/sciimmunol.abl6543
85. Zhang W, Chen X, Kato Y, Evans PM, Yuan S, Yang J, et al. Novel cross talk of Kruppel-like factor 4 and beta-catenin regulates normal intestinal homeostasis and tumor repression. Mol Cell Biol. (2006) 26:2055–64. doi: 10.1128/MCB.26.6.2055-2064.2006
86. Lim LP, Lau NC, Garrett-Engele P, Grimson A, Schelter JM, Castle J, et al. Microarray analysis shows that some microRNAs downregulate large numbers of target mRNAs. Nature. (2005) 433:769–73. doi: 10.1038/nature03315
87. Lv H, Zhang Z, Wang Y, Li C, Gong W, Wang X. MicroRNA-92a promotes colorectal cancer cell growth and migration by inhibiting KLF4. Oncol Res. (2016) 23:283–90. doi: 10.3727/096504016X14562725373833
88. Zhang G-J, Li L-F, Yang G-D, Xia S-S, Wang R, Leng Z-W, et al. MiR-92a promotes stem cell-like properties by activating Wnt/β-catenin signaling in colorectal cancer. Oncotarget. (2017) 8:101760–70. doi: 10.18632/oncotarget.21667
89. Maizels RM, McSorley HJ. Regulation of the host immune system by helminth parasites. J Allergy Clin Immunol. (2016) 138:666–75. doi: 10.1016/j.jaci.2016.07.007
90. Tao XC, Zhang XY, Sun SB, Wu DQ. miR-92a contributes to cell proliferation, apoptosis and doxorubicin chemosensitivity in gastric carcinoma cells. Oncol Rep. (2019) 42:313–20. doi: 10.3892/or.2019.7168
91. Li L, Zhang J, Peng H, Jiang X, Liu Z, Tian H, et al. Knockdown of miR-92a suppresses the stemness of colorectal cancer cells via mediating SOCS3. Bioengineered. (2022) 13:5613–24. doi: 10.1080/21655979.2021.2022267
92. Johnston CJC, Smyth DJ, Kodali RB, White MPJ, Harcus Y, Filbey KJ, et al. A structurally distinct TGF-β mimic from an intestinal helminth parasite potently induces regulatory T cells. Nat Commun. (2017) 8:1741. doi: 10.1038/s41467-017-01886-6
93. Claycomb J, Abreu-Goodger C, Buck AH. RNA-mediated communication between helminths and their hosts: the missing links. RNA Biol. (2017) 14:436–41. doi: 10.1080/15476286.2016.1274852
94. McGeary SE, Lin KS, Shi CY, Pham TM, Bisaria N, Kelley GM, et al. The biochemical basis of microRNA targeting efficacy. Science. (2019) 366:eaav1741. doi: 10.1126/science.aav1741
95. Perusina Lanfranca M, Lin Y, Fang J, Zou W, Frankel T. Biological and pathological activities of interleukin-22. J Mol Med. (2016) 94:523–34. doi: 10.1007/s00109-016-1391-6
96. Turner JE, Stockinger B, Helmby H. IL-22 mediates goblet cell hyperplasia and worm expulsion in intestinal helminth infection. PloS Pathog. (2013) 9:e1003698. doi: 10.1371/journal.ppat.1003698
97. Overcast GR, Meibers HE, Eshleman EM, Saha I, Waggoner L, Patel KN, et al. IEC-intrinsic IL-1R signaling holds dual roles in regulating intestinal homeostasis and inflammation. J Exp Med. (2023) 220:e20212523. doi: 10.1084/jem.20212523
98. Feng X, Andersson T, Gschwend J, Fluchter P, Berest I, Muff JL, et al. Tuft cell IL-17RB restrains IL-25 bioavailability and reveals context-dependent ILC2 hypoproliferation. bioRxiv preprint. (2024). doi: 10.1101/2024.03.04.583299
99. Faber MN, Smith D, Price DRG, Steele P, Hildersley KA, Morrison LJ, et al. Development of bovine gastric organoids as a novel in vitro model to study host-parasite interactions in gastrointestinal nematode infections. Front Cell Infect Microbiol. (2022) 12:904606. doi: 10.3389/fcimb.2022.904606
100. Ryan SM, Eichenberger RM, Ruscher R, Giacomin PR, Loukas A. Harnessing helminth-driven immunoregulation in the search for novel therapeutic modalities. PloS Pathog. (2020) 16:e1008508. doi: 10.1371/journal.ppat.1008508
101. Maruszewska-Cheruiyot M, Donskow-Łysoniewska K, Doligalska M. Helminth therapy: Advances in the use of parasitic worms against inflammatory bowel diseases and its challenges. Helminthologia. (2018) 55:1–11. doi: 10.1515/helm-2017-0048
102. Perez MG, Grecco AR, Rosenzvit MC. MicroRNA interference. In: Xiao J, editor. MicroRNA: From Bench to Bedside. Elsevier Science, Amsterdam (2022). p. 33–55.
103. Brand S, Beigel F, Olszak T, Zitzmann K, Eichhorst ST, Otte JM, et al. IL-22 is increased in active Crohn’s disease and promotes proinflammatory gene expression and intestinal epithelial cell migration. Am J Physiol Gas- trointest Liver Physiol. (2006) 290:G827–38. doi: 10.1152/ajpgi.00513.2005
Keywords: nematode parasites, microRNAs, stem cells, tuft cells, organoids, innate immunity, IL-13
Citation: Perez MG, Gillan V, Anderson WM, Gerbe F, Herbert F, McNeilly TN, Maizels RM, Jay P, Devaney E and Britton C (2025) A secreted helminth microRNA suppresses gastrointestinal cell differentiation required for innate immunity. Front. Immunol. 16:1558132. doi: 10.3389/fimmu.2025.1558132
Received: 09 January 2025; Accepted: 07 March 2025;
Published: 27 March 2025.
Edited by:
Alisa Gruden-Movsesijan, Institute for the Application of Nuclear Energy (INEP), SerbiaReviewed by:
Denis Voronin, National Institute of Allergy and Infectious Diseases (NIH), United StatesMaria Doligalska, University of Warsaw, Poland
Copyright © 2025 Perez, Gillan, Anderson, Gerbe, Herbert, McNeilly, Maizels, Jay, Devaney and Britton. This is an open-access article distributed under the terms of the Creative Commons Attribution License (CC BY). The use, distribution or reproduction in other forums is permitted, provided the original author(s) and the copyright owner(s) are credited and that the original publication in this journal is cited, in accordance with accepted academic practice. No use, distribution or reproduction is permitted which does not comply with these terms.
*Correspondence: Matias G. Perez, bWF0aWFzLnBlcmV6QGdsYXNnb3cuYWMudWs=; Collette Britton, Y29sbGV0dGUuYnJpdHRvbkBnbGFzZ293LmFjLnVr