
94% of researchers rate our articles as excellent or good
Learn more about the work of our research integrity team to safeguard the quality of each article we publish.
Find out more
ORIGINAL RESEARCH article
Front. Immunol., 01 April 2025
Sec. Cancer Immunity and Immunotherapy
Volume 16 - 2025 | https://doi.org/10.3389/fimmu.2025.1552235
This article is part of the Research TopicCommunity Series in The Immunosuppressive Tumor Microenvironment and Strategies to Revert its Immune Regulatory Milieu for Cancer Immunotherapy: Volume IIView all 5 articles
 Siyuan Jiang1†Shiyu Zheng1†Chao Yao1†Dengchong Ning2
 Shaoyun Zou1Jiannan Zhan1Tianbi Lan3
 Tingzhuang Yi4*
 Zhenyi Jin5,6,7*
 Xiuli Wu1,6,7*
Background: γδ T cells are integral elements of the immune system and have shown therapeutic potential in the treatment of acute myeloid leukemia (AML). Nevertheless, the influence of distinct functional subsets, including the activating marker NKG2D, the immune exhaustion marker TIGIT, and the regulatory marker Foxp3, on therapeutic outcomes in AML patients remains unknown.
Methods: First, we analyzed RNA-seq data from 167 patients in The Cancer Genome Atlas (TCGA) database, concentrating on the correlations between NKG2D, TIGIT, and Foxp3 gene expressions and their association with prognosis in AML. We employed flow cytometry to assess the expression of these molecular markers on γδ T cells and the Vδ1/Vδ2 subsets in the peripheral blood of 25 de novo AML (AML-DN) patients, 15 patients in complete remission (CR), and 27 healthy controls (HCs). We also analyzed the relationship between the expression frequencies of NKG2D, TIGIT, and Foxp3 on γδ T cells and their subsets, and their clinical outcomes.
Results: Based on data from TCGA database, we found that a high expression level of NKG2D in combination with a low expression level of TIGIT was significantly associated with longer overall survival (OS) in AML patients. Clinical data revealed that γδ T cells from AML-DN patients exhibited higher expression levels of TIGIT and Foxp3, whereas NKG2D expression was lower compared to that of HCs. Notably, the expression of the NKG2D+TIGIT− Vδ1 subset was significantly reduced in AML-DN patients compared to CR patients. Univariate logistic regression and Cox regression analyses further indicated that a high expression of the NKG2D+TIGIT− Vδ1 subset was associated with better clinical prognosis.
Conclusion: This study indicates that NKG2D+TIGIT− Vδ1 T cells are strongly correlated with improved prognosis in AML, and future research should investigate their potential in adoptive immunotherapy to advance more personalized and precise treatment strategies.
Acute myeloid leukemia (AML) is one of the most prevalent hematological malignancies, characterized by the accumulation of immature myeloid precursors, which leads to the suppression of normal hematopoiesis (1). Despite significant advances in our understanding of AML, the standard treatment regimen remains induction chemotherapy followed by consolidation chemotherapy or hematopoietic stem cell transplantation, with generally poor outcomes, particularly in non-acute promyelocytic leukemia (non-APL; M3) subtypes (2, 3). Additionally, there are currently no effective treatments available to prevent the adverse consequences of relapsed or refractory disease and to achieve sustained complete remission (CR) in AML patients (4). Recent studies have demonstrated that T-cell immunodeficiency is a common feature in AML, leading to the emergence of adoptive T-cell immunotherapy as a promising approach to enhance anti-leukemia therapy (5).
It is well known that γδ T cells are a small subgroup of T cells in human peripheral blood (PB). Human γδ T cells can be divided into two main groups according to their T-cell receptor (TCR) usage of the Vδ1 and Vδ2 chains. The majority of γδ T cells in PB is Vδ2 subset, which is paired with Vγ9 chain. The Vδ1 subgroup exists in the mucosal epithelium and has adaptability (1). As the bridge between adaptive and innate immune systems, activated γδ T cells can promote the anti-tumor function of adaptive immune cells and participate in various immune responses during cancer progression (2). γδ T cells can show broad antigen specificity and natural killer-like (NK-like) cytotoxicity with the absence of the major histocompatibility complex (MHC) molecules, which is why γδ T cells are essential for adoptive T-cell immunotherapy (3, 4). There are many approaches to anti-tumor therapy using γδ T cells, of which the use of chimeric antigen receptor (CAR) T cells has been shown to be well tolerated and highly efficient (3). Despite the advantages that could be exploited, some obstacles need to be addressed for the development of γδ T-cell immunotherapies. One of the most important reasons is that γδ T cells have different functional subsets, and not all the γδ T-cell subsets perform anti-leukemia functions (5). Some expanded γδ T-cell clones and subsets could promote cancer progression by inhibiting anti-tumor responses and enhancing cancer angiogenesis, which may be associated with a poor prognosis of leukemia (6, 7). It needs to be further improved, so it is particularly important to introduce the clustering method of γδ T-cell functional subsets.
Natural killer group 2, member D (NKG2D) is an important activating receptor in natural killer (NK) cells and some kinds of T cells like γδ T cells (8). The engagement of this receptor on NK cells and γδ T cells to legends expressed on tumor cells will induce cell-mediated cytotoxicity and have target cells destroyed (9). In the context of AML, several studies have shown that NKG2D-mediated cytotoxicity of γδ T cells is a key defense mechanism against leukemia (10, 11). T-cell immunoglobulin and immunoreceptor tyrosine-based inhibitory motif domain (TIGIT) is a recently identified immune inhibitory receptor that inhibits immune cell responses at multiple steps of the cancer-immunity cycle (12). TIGIT prevents tumor cell killing by NK cells and cytotoxic T cells and enhances the immune suppressive activity of regulatory T cells through the combination with its legends (13). Our previous research found that TIGIT on memory γδ TCM cells has been associated with poor prognosis in AML (14, 15). High expression of TIGIT on γδ T cells may inhibit their cytotoxic function, leading to impaired immune responses against leukemia cells (16). The regulatory subset of γδ T cells that express the transcription factor forkhead box p3 (Foxp3), termed γδ regulatory T cells (γδ Tregs), has been confirmed to be at low frequencies in tumor-infiltrating leukocytes (TILs) and human PB (17). Similar to the conventional Tregs, inhibitory receptors are expressed on γδ Tregs, and the mechanisms by which their suppressive activity is mediated have been reported (18). Foxp3+ Tregs are typically enriched in tumors such as AML and contribute to the formation of an immunosuppressive environment that inhibits anti-tumor immune responses (19). In this study, we hypothetically define the NKG2D+ γδ T-cell subset as the activated subset, the TIGIT+ γδ T-cell subset as exhausted subsets, and the Foxp3+ γδ T-cell subset as the regulatory subset, thus evaluating the expression differences of different functional subsets of γδ T cells in AML patients and healthy controls (HCs) and their correlation with the outcome and prognosis of AML patients. As a result, we can obtain more effective results than traditional clustering and make a more accurate diagnosis and further targeted treatment.
Using RNA-seq data from 167 patients in The Cancer Genome Atlas (TCGA) database, this study analyzed the correlation between the NKG2D, TIGIT, and FOXP3 genes, as well as their associations with the prognosis of AML patients. The study included AML patient samples from de novo AML (AML-DN) and CR patients, as well as healthy individuals, with participants aged 18 to 90 years. Patients with other underlying conditions or infections were excluded. A total of 25 PB samples were collected from AML-DN patients, including 11 men and 14 women (median age: 61 years, range: 25–88 years) as well as 15 PB samples from CR patients, including eight men and seven women (median age: 54 years, range: 31–79 years) in the First Affiliated Hospital of JNU database from 1 May 2018 to 1 May 2020. The clinical data of the patients are listed in Table 1. PB from 27 healthy individuals (HIs) were recruited as controls, with no underlying diseases or infections. The AML patients were diagnosed and classified in accordance with the French–American–British (FAB) classification. There were six pairs of pre- and post-chemotherapy samples in this patient population. The human PB samples were obtained with the consent of both patients and healthy donors. This study was conducted according to the guidelines of the Medical Ethics Committees of the Health Bureau of the Guangdong Province in China, and ethical approval was obtained from the Ethics Committee of the First Affiliated Hospital of Jinan University.

Table 1. Clinical information for the AML-DN patients.
Peripheral blood mononuclear cells (PBMCs) were isolated from AML patients and HIs and then incubated with the following antibodies: CD3-APC-H7 (Clone SK7), TCR γδ-PerCP-Cy5.5 (Clone B1), Vδ1-FITC (Clone TS8.2), Vδ2-PE-Cy7 (Clone B6), NKG2D-BV510 (Clone 1D11), TIGIT-BV421 (Clone A15153G), BV510 isotype control (Clone MOPC-21), and BV421 isotype control (Clone G155-178) (BioLegend, San Diego, CA, USA; BD Biosciences, San Jose, CA, USA). Extracellular staining was carried out according to the instructions of the manufacturers. Five microliters of each conjugated fluorescent antibody mentioned above were incubated with 300 µL of each PB sample at room temperature for 20 minutes in the dark. Three milliliters of 1 × RBC Lysis Buffer (BD Biosciences, USA) was used for lysing erythrocytes for 10 minutes in the dark. Samples were completely washed with PBS, followed by centrifugation at 350 × g for 5 minutes. The cells were first surface stained as described above. Then, 500 µL of Fixation Buffer (BioLegend, USA) was added, and the cells were incubated in the dark for 20 minutes. Following fixation, 1 mL of Intracellular Staining Perm Wash Buffer (1×) (BioLegend, USA) was added, and the cells were centrifuged at 350 × g for 5 minutes. The supernatant was discarded, and 5 µL of Foxp3-AF647 (Clone 150D) (BioLegend, San Diego, CA, USA) flow cytometry antibody was added to the cells. In the isotype control tube, 5 µL of AF647 isotype control (Clone MOPC-21) (BioLegend, San Diego, CA, USA) was added. The samples were mixed thoroughly and incubated at room temperature, protected from light, for 20 minutes. After incubation, the cells were washed twice with 1 mL of Intracellular Staining Perm Wash Buffer (1×) by centrifuging at 350 × g for 5 minutes each time. Then, all samples were resuspended with 200 µL PBS for analysis by flow cytometry. All samples were analyzed using a BD Verse flow cytometer (BD Biosciences, USA), and the FlowJo version 10.8.1. software (Treestar) was used to analyze the data.
The clinical data and RNA expression profiles of 167 AML patients were obtained from TCGA database. The relationships among the NKG2D, TIGIT, and FOXP3 genes, as well as their associations with the prognosis of AML patients, were assessed using the Kaplan–Meier survival curve analysis and Pearson’s correlation analysis.
All data are represented as medians. Groups were tested for normal distribution using the Kolmogorov–Smirnov test. Statistical differences between two and among three groups were analyzed using the Mann–Whitney U and Kruskal–Wallis tests, respectively. Appropriate corrections for multiple comparisons were also made using Dunn’s multiple comparisons test method. For paired samples, the Wilcoxon signed-rank test was used for comparison. Spearman’s rank coefficient was used to analyze correlations. Logistic regression was used to analyze the associations between the frequencies of γδ T cells and their subsets and the outcome of AML patients performed. The Cox regression method was used to analyze between-group survival differences. The explanatory variables included the proportions of γδ T cells and their subgroups. For the AML RNA-seq data in TCGA database, the optimal cutoff value was determined based on the minimum p-value obtained from the Cox proportional hazards survival analysis. Subsequently, the samples were categorized into high- and low-expression groups according to this optimal threshold. Then, the relationship between the expression levels of the NKG2D, TIGIT, and FOXP3 genes and the clinical prognosis of AML patients was determined using the Kaplan–Meier survival analysis, which was performed using the R package survminer. The correlation among these three genes was also analyzed using Pearson’s correlation analysis. All statistical tests were two-tailed. p-Values less than 0.05 were considered statistically significant (*p < 0.05; **p < 0.01; ***p < 0.001). All calculations were performed using the GraphPad Prism 10.3 software (GraphPad Software Inc., San Diego, CA, USA) and SPSS.
RNA-seq data were first utilized from 167 AML patients in TCGA-LAML database (https://portal.gdc.cancer.gov/) to investigate the relationship between NKG2D, TIGIT, and FOXP3 gene expression levels and their prognostic implications. Based on the optimal cut-off values for the expression levels of these genes, patients were categorized into high- and low-expression groups. Subsequently, the Kaplan–Meier survival curves were constructed for comparative analysis. Initial analysis revealed a positive correlation between elevated NKG2D expression and improved overall survival (OS) (NKG2Dhigh vs. NKG2Dlow, 2-year OS: 43.3% vs. 25.9%, p = 0.060) (Figure 1A). Conversely, increased levels of TIGIT (TIGIThigh vs. TIGITlow, 2-year OS: 19.4% vs. 43.6%, p = 0.039) and FOXP3 (FOXP3high vs. FOXP3low, 2-year OS: 19.8% vs. 43.9%, p = 0.028) (Figure 1A) were associated with poorer OS. Significant positive correlations were observed between NKG2D and TIGIT (R = 0.73, p < 0.001) (Figure 1B), NKG2D and FOXP3 (R = 0.53, p < 0.001), and TIGIT and FOXP3 (R = 0.62, p < 0.001) (Figure 1B).
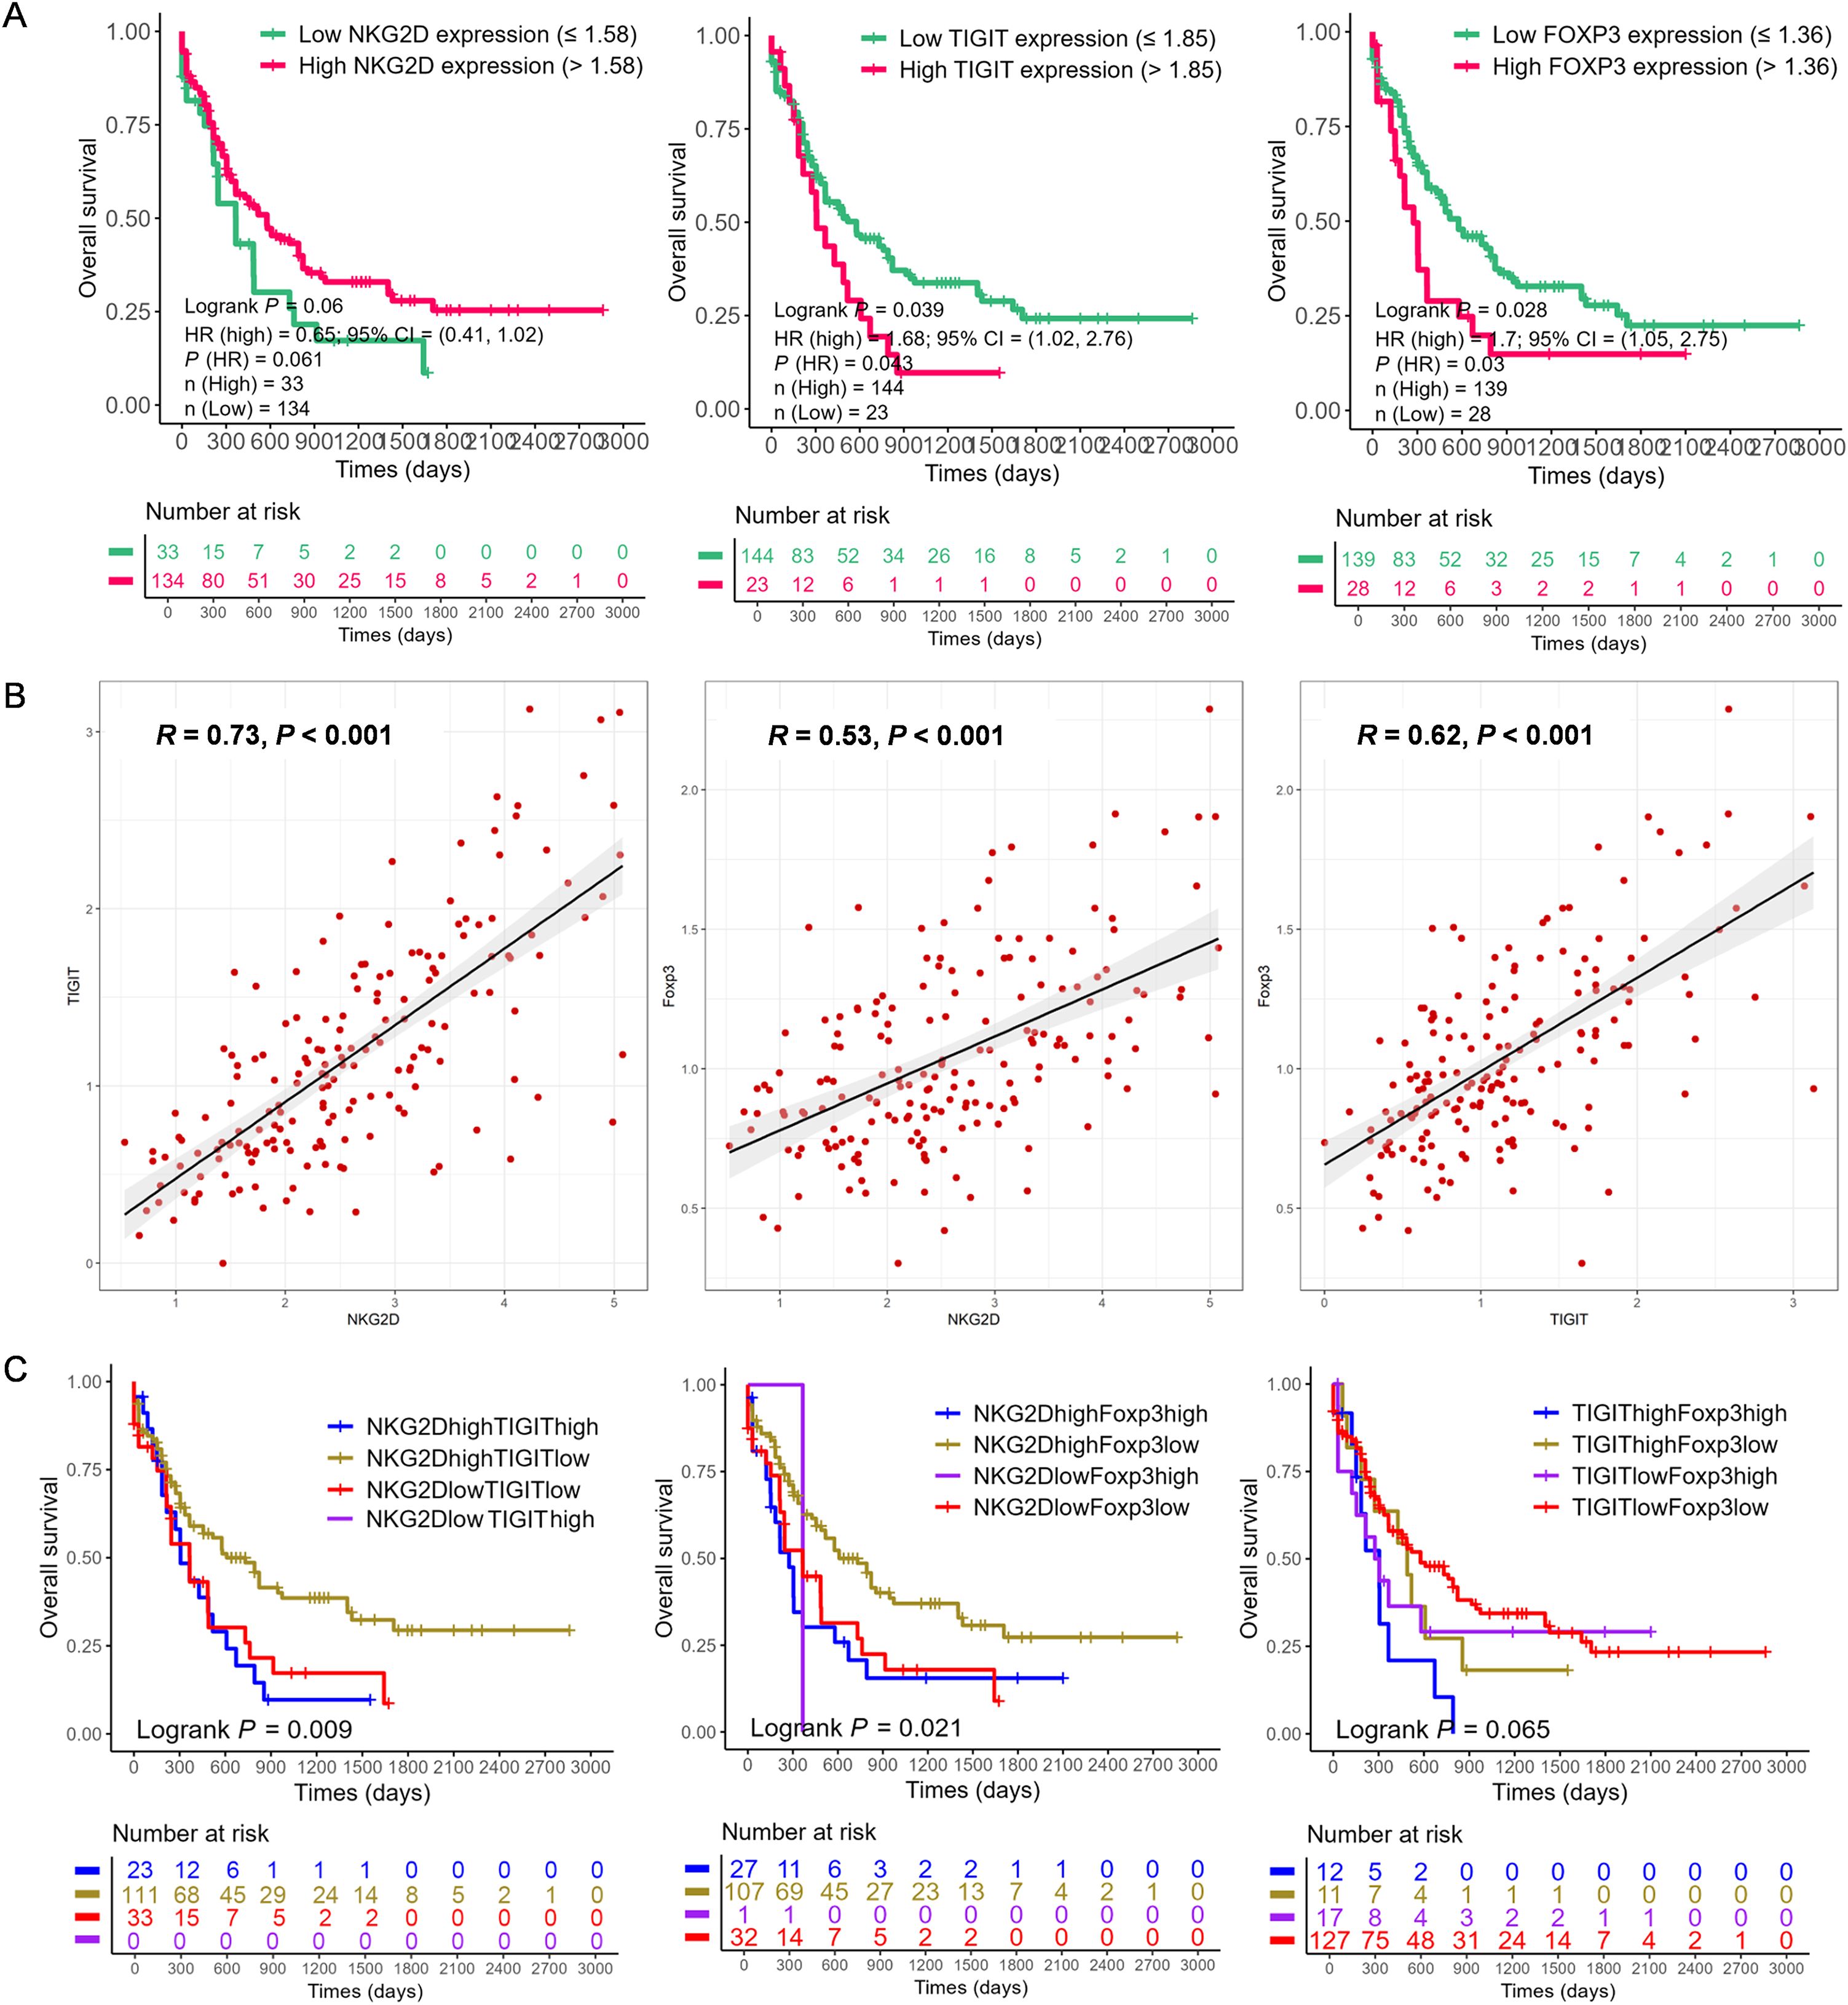
Figure 1. The correlation and prognosis of NKG2D, TIGIT, and FOXP3 gene expression in AML based on The Cancer Genome Atlas (TCGA) data. (A) Based on the optimal cut-off value of the gene expression levels, the NKG2D, TIGIT, and FOXP3 genes were classified into high expression (red line) and low expression (green line) groups, which were plotted in Kaplan–Meier curves (top) with the number of AML patients at risk (bottom). For NKG2D, high vs. low expression showed a trend toward better prognosis (p = 0.06). For TIGIT and FOXP3, high expression was significantly associated with prognosis (p = 0.039 and p = 0.028, respectively). (B) Correlation analysis of the expression levels of NKG2D, TIGIT, and FOXP3 genes. (C) Quartile analysis of gene pairs (NKG2D/TIGIT, NKG2D/FOXP3, and TIGIT/FOXP3) was conducted to assess the impact on AML prognosis. The gene pairs were categorized into four groups based on high or low expression levels determined by the best cut-off value. Among these, the NKG2Dhigh/TIGITlow group (p = 0.009) and the NKG2Dhigh/FOXP3low group (p = 0.021) exhibited significantly better prognoses. AML, acute myeloid leukemia.
Further analysis categorized patients into groups based on the single high expression, single low expression, co-high expression, and co-low expression of NKG2D, TIGIT, and FOXP3 genes. The Kaplan–Meier analysis indicated that NKG2DhighTIGITlow expression was associated with better OS (p = 0.009) (Figure 1C), as well as NKG2DhighFOXP3low expression (p = 0.021), while NKG2DlowFOXP3high expression correlated significantly with poorer OS (p = 0.021) (Figure 1C). Additionally, patients with higher levels of TIGITlowFOXP3low genes showed better OS (p = 0.065) (Figure 1C), whereas those with higher levels of TIGIThighFOXP3high genes had poorer OS (p = 0.065) (Figure 1C). These findings underscore the potential prognostic significance of NKG2D, TIGIT, and FOXP3 gene expression levels in AML, suggesting their roles in disease progression and clinical outcomes.
In this study, we characterized the distributions of γδ T and their cell subsets in PB from HIs (n = 27), untreated AML-DN patients (n = 25), and CR patients (n = 15), which included six paired samples of AML-DN and CR. A decreased percentage of γδ T cells was found in the AML-DN group compared to HIs (median: 3.88% vs. 8.40%, p < 0.001) and AML-CR (median: 3.88% vs. 6.59%, p = 0.007) (Figures 2A, B). In addition, the proportion of Vδ1 cells was higher in the AML-DN group when compared with HIs (median: 14.80% vs. 8.30%, p = 0.008) and the CR group (median: 14.80% vs. 6.98%, p = 0.005). A lower frequency of Vδ2 cells was found in the AML-DN group compared with the HIs (median: 53.20% vs. 76.30%, p = 0.031) (Figure 2B). We further analyzed the expression of the non-Vδ1/Vδ2 subset and found no significant differences among the AML-DN, CR, and HI groups (Supplementary Figure S1A).
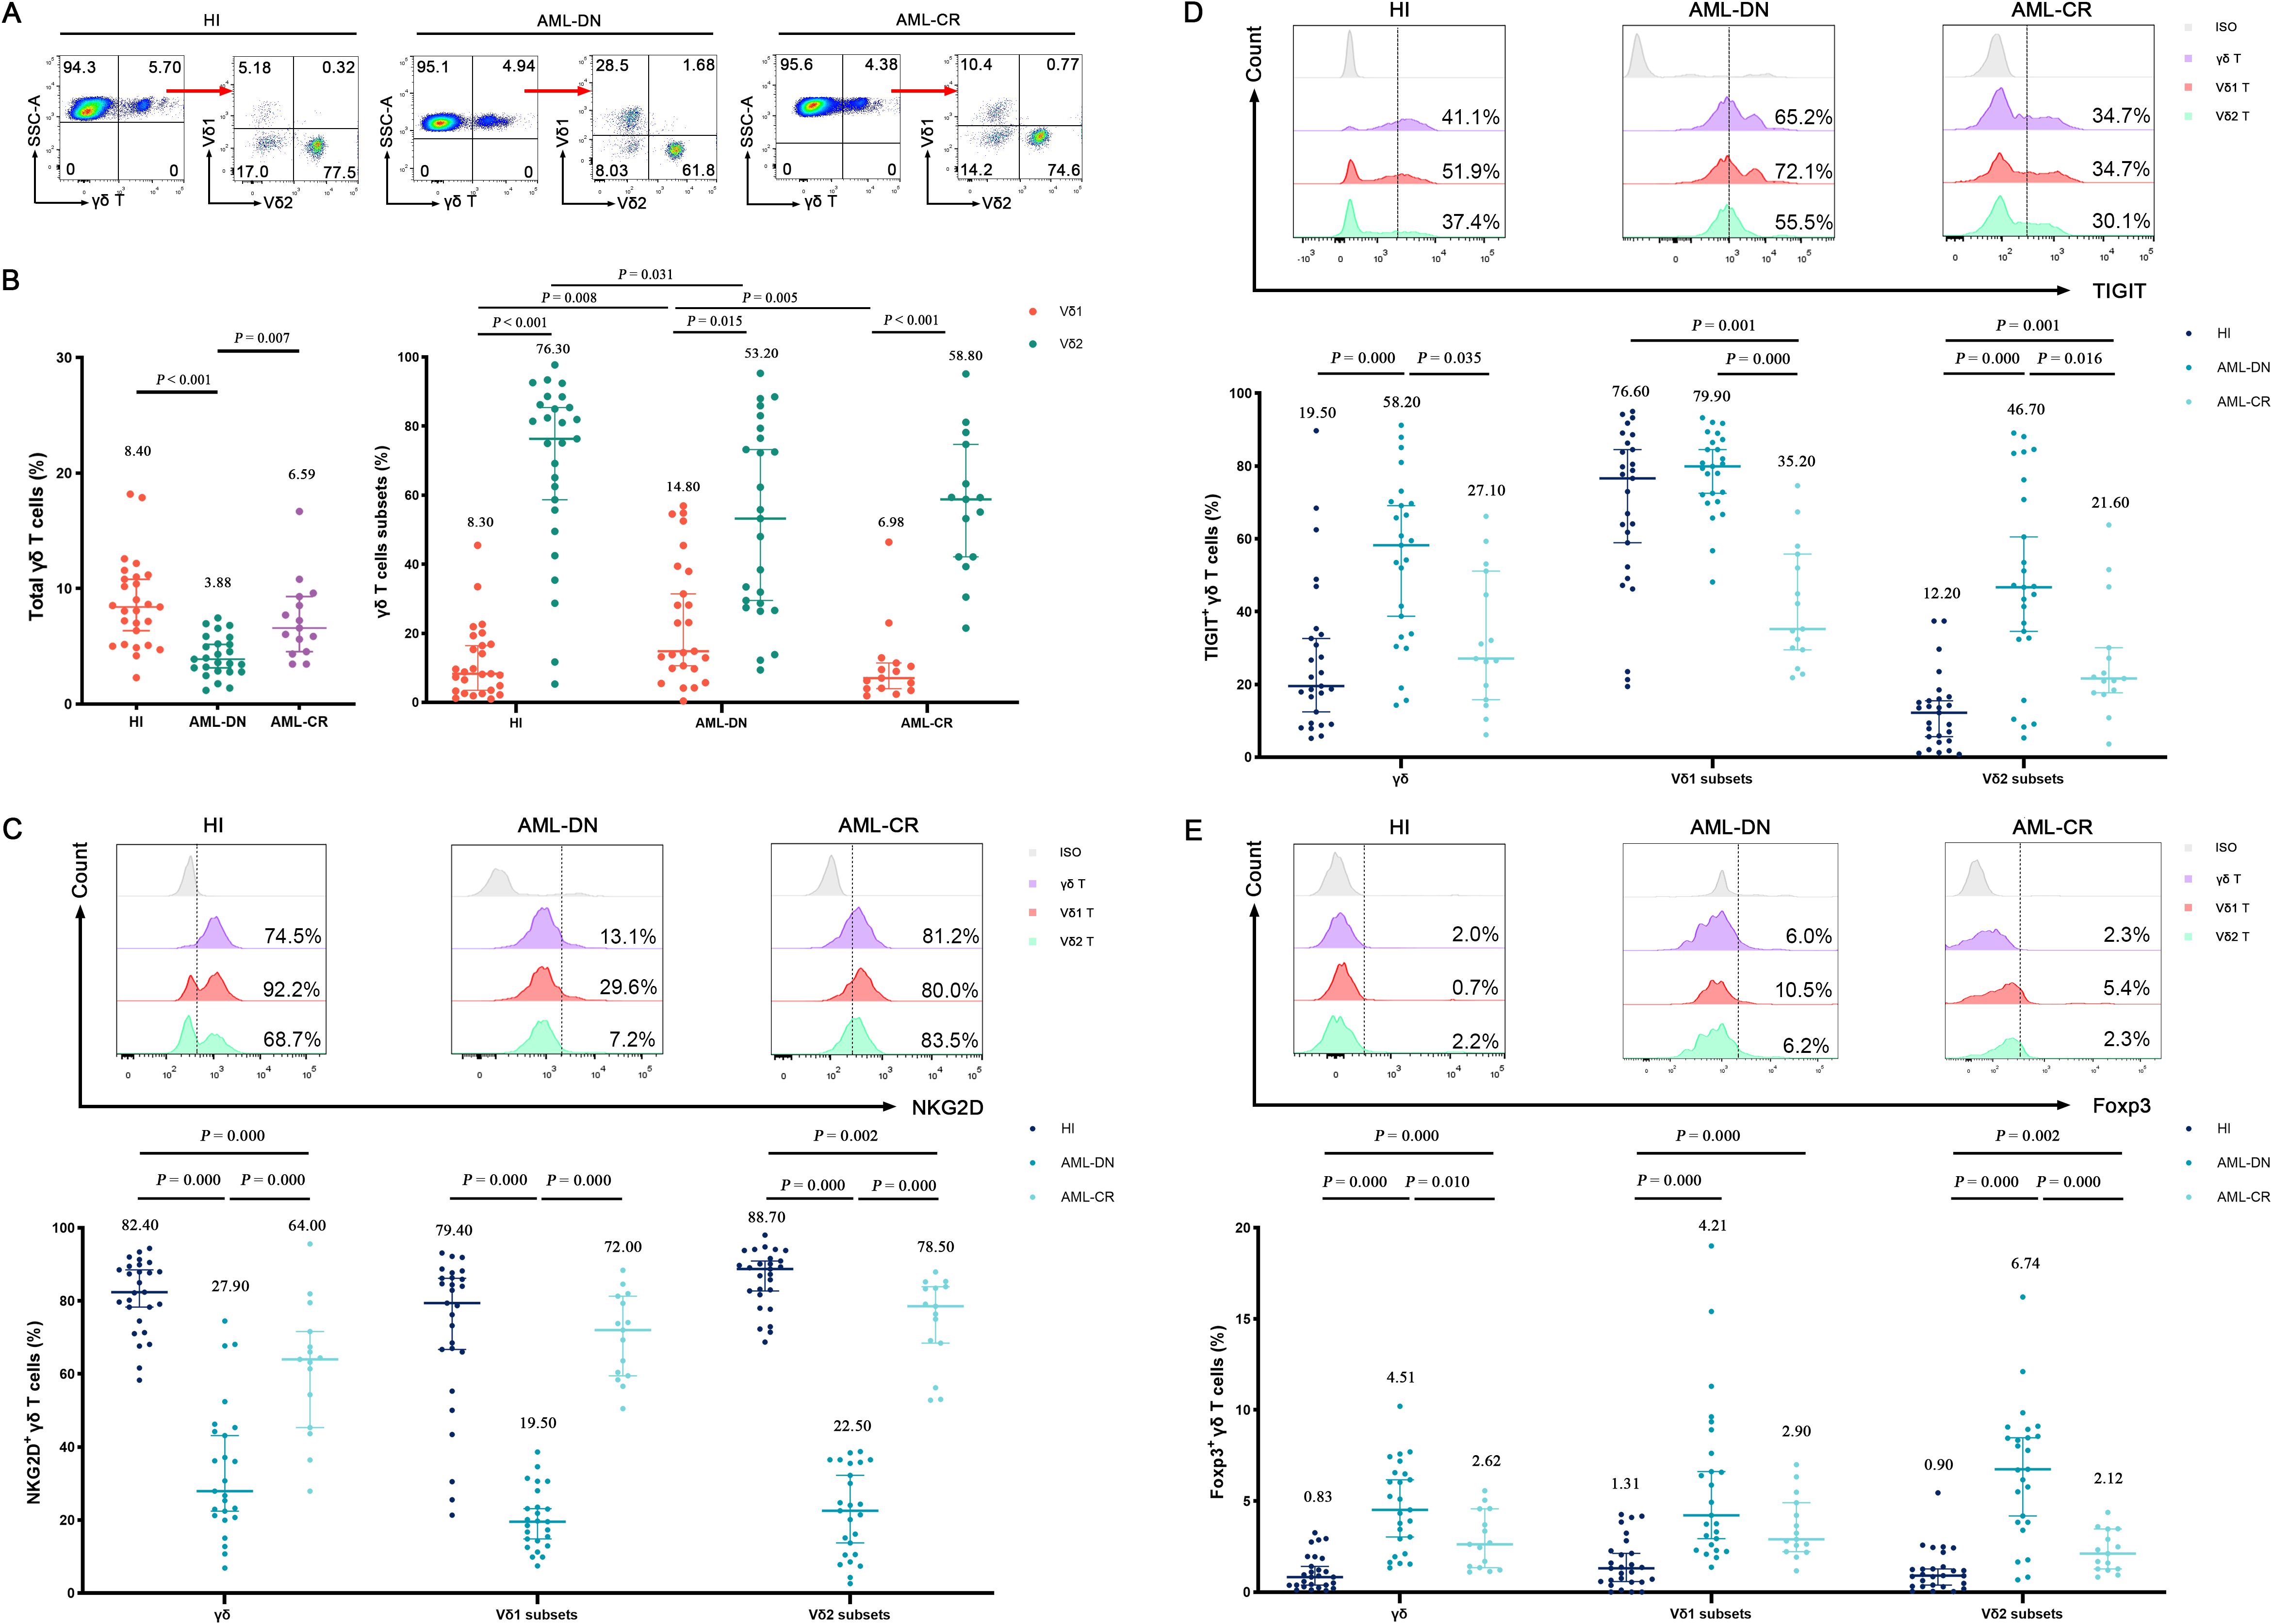
Figure 2. Distribution and frequency of NKG2D, TIGIT, and Foxp3 expression in γδ T-cell, Vδ1, and Vδ2 cell subpopulations from PB of AML-DN patients, CR patients, and HIs. (A) γδ T cells were gated from CD3+ T cells and further identified as Vδ1 and Vδ2 subpopulations in HIs and AML patients using flow cytometry analysis. (B) Comparison of the percentages of γδ T cells and their subsets (Vδ1 and Vδ2), both of which are derived from the total γδ T cells on the left, across AML-DN patients, CR patients, and HIs. (C–E) Expression levels of NKG2D, TIGIT, and FOXP3 in γδ T cells and their subsets (Vδ1 and Vδ2) were analyzed for AML-DN patients, CR patients, and HIs. The numbers above the scatter plots represent the median value of the data for each group. Statistical analyses were performed using the unpaired Mann–Whitney U test (B–E). PB, peripheral blood; AML-DN, de novo acute myeloid leukemia; CR, complete remission; HIs, healthy individuals.
We further accessed NKG2D, TIGIT, and Foxp3 expression patterns on γδ T cells in the AML group and HIs. First, the similar expression pattern of NKG2D on γδ T and its subset cells was AML-DN (median: 27.90%) < AML-CR (median: 64.00%) < HIs (median: 82.40%). Lower frequencies of NKG2D+ γδ (median: 27.90%), NKG2D+ Vδ1 (median: 19.50%), and NKG2D+ Vδ2 (median: 22.50%) in the AML-DN group were found compared with those in HIs and the CR group (Figure 2C; Supplementary Figure S2). Furthermore, the frequency of NKG2D+ Vδ2 in CR was statistically decreased compared with that of HIs (median: 78.50% vs. 88.70%, p = 0.002) (Figure 2C). Second, the expression patterns of TIGIT on γδ T and its subset cells were different from NKG2D expression, which showed HIs (median: 19.50%) < AML-CR (median: 27.1%) < AML-DN group (median: 58.20%) (Figure 2D; Supplementary Figure S2). A higher tendency of TIGIT+ γδ (median: 58.20% vs. 19.50%, p = 0.000), TIGIT+ Vδ1 (median: 79.90% vs. 76.60%, p = 0.193), and TIGIT+ Vδ2 (median: 46.70% vs. 12.20%, p = 0.000) was found in the AML-DN group compared with HIs (Figure 2D). Similar expression patterns of Foxp3 on γδ T and its subset cells were also found in AML, which showed HIs (median: 0.83%) < AML-CR (median: 2.62%) < AML-DN (median: 4.51%) (Figure 2E; Supplementary Figure S2). In the AML-DN group, there was a dramatically increased trend in Foxp3+ Vδ1 in the γδ T-cell subset (median: 4.21% vs. 1.31%, p = 0.000) and Foxp3+ Vδ2 in the γδ T-cell subset (median: 6.74% vs. 0.90%, p = 0.000) (Figure 2E). In the CR group, the Foxp3+ population was also found to be higher than these three subgroups in γδ T cells (median: 2.90% vs. 1.31%, p = 0.000; median: 2.12% vs. 0.90%, p = 0.002) (Figure 2E).
Interestingly, we found that the expression patterns of NKG2D, TIGIT, and Foxp3 in the non-Vδ1/Vδ2 subset were similar to those in the Vδ1 and Vδ2 subsets. Compared to the HIs, the percentage of NKG2D+ non-Vδ1/Vδ2 T cells was significantly decreased in the AML-DN group (median: 27.50% vs. 72.00%, p < 0.001), while the percentages of TIGIT+ non-Vδ1/Vδ2 T cells (median: 53.00% vs. 35.40%, p < 0.001) and Foxp3+ non-Vδ1/Vδ2 T cells (median: 5.87% vs. 0.99%, p < 0.001) were significantly increased. The expression trends in the CR group were intermediate between those of AML-DN and HIs (Supplementary Figure S1B). These findings revealed the distribution patterns of γδ T cells and their subpopulations in different disease states and explored the differences in the expression of marker molecules such as NKG2D, TIGIT, and Foxp3.
To further assess whether the co-expression of NKG2D and TIGIT on the surface of γδ T cells may correlate with the prognosis of AML, we classified γδ T cells into four distinct subsets: NKG2D−TIGIT+, NKG2D+TIGIT+, NKG2D+TIGIT−, and NKG2D−TIGIT− (Figures 3A, B, D; Supplementary Figure S2). There, we especially focused on two simple positive subsets: NKG2D+TIGIT− and NKG2D−TIGIT+. Interestingly, we observed a significant decrease in the frequency of NKG2D+TIGIT− subsets within the total γδ T cells (median: 7.18% vs. 64.10%, p = 0.000), as well as in the Vδ1 T cells (median: 3.08% vs. 17.20%, p = 0.000) and Vδ2 T cells (median: 6.55% vs. 77.30%, p = 0.000) in the AML-DN group compared to HIs (Figure 3D). In contrast, the frequency of NKG2D−TIGIT+ subsets was significantly higher in the total γδ T cells (median: 26.00% vs. 3.33%, p = 0.000), as well as in the Vδ1 T cells (median: 60.30% vs. 11.40%, p = 0.000) and Vδ2 T cells (median: 31.40% vs. 0.62%, p = 0.000) in the AML-DN group compared to HIs (Figure 3D). Compared with the CR group, the tendency of NKG2D+TIGIT− subsets expressing on the surface of total γδ T cells (median: 7.18% vs. 35.60%, p = 0.000), Vδ1 T cells (median: 3.08% vs. 35.30%, p = 0.000), and Vδ2 T cells (median: 6.55% vs. 52.00%, p = 0.000) was lower in the AML-DN group (Figure 3D). Likewise, the frequencies of NKG2D−TIGIT+ subsets expressing on the surface of total γδ T cells (median: 26.0% vs. 7.73%, p = 0.000), Vδ1 T cells (median: 60.30% vs. 10.30%, p = 0.000), and Vδ2 T cells (median: 31.40% vs. 3.95%, p = 0.000) were higher in the AML-DN group compared with the CR group (Figure 3D). We also observed the same pattern in the non-Vδ1/Vδ2 subset. Compared to AML-DN group, the percentage of NKG2D+TIGIT− non-Vδ1/Vδ2 T-cell subset was significantly increased in HIs (median: 23.90% vs. 7.50%, p < 0.001), whereas the proportion of NKG2D−TIGIT+ non-Vδ1/Vδ2 T-cell subset was significantly decreased (median: 31.10% vs. 5.53%, p < 0.001) (Supplementary Figure S1C).
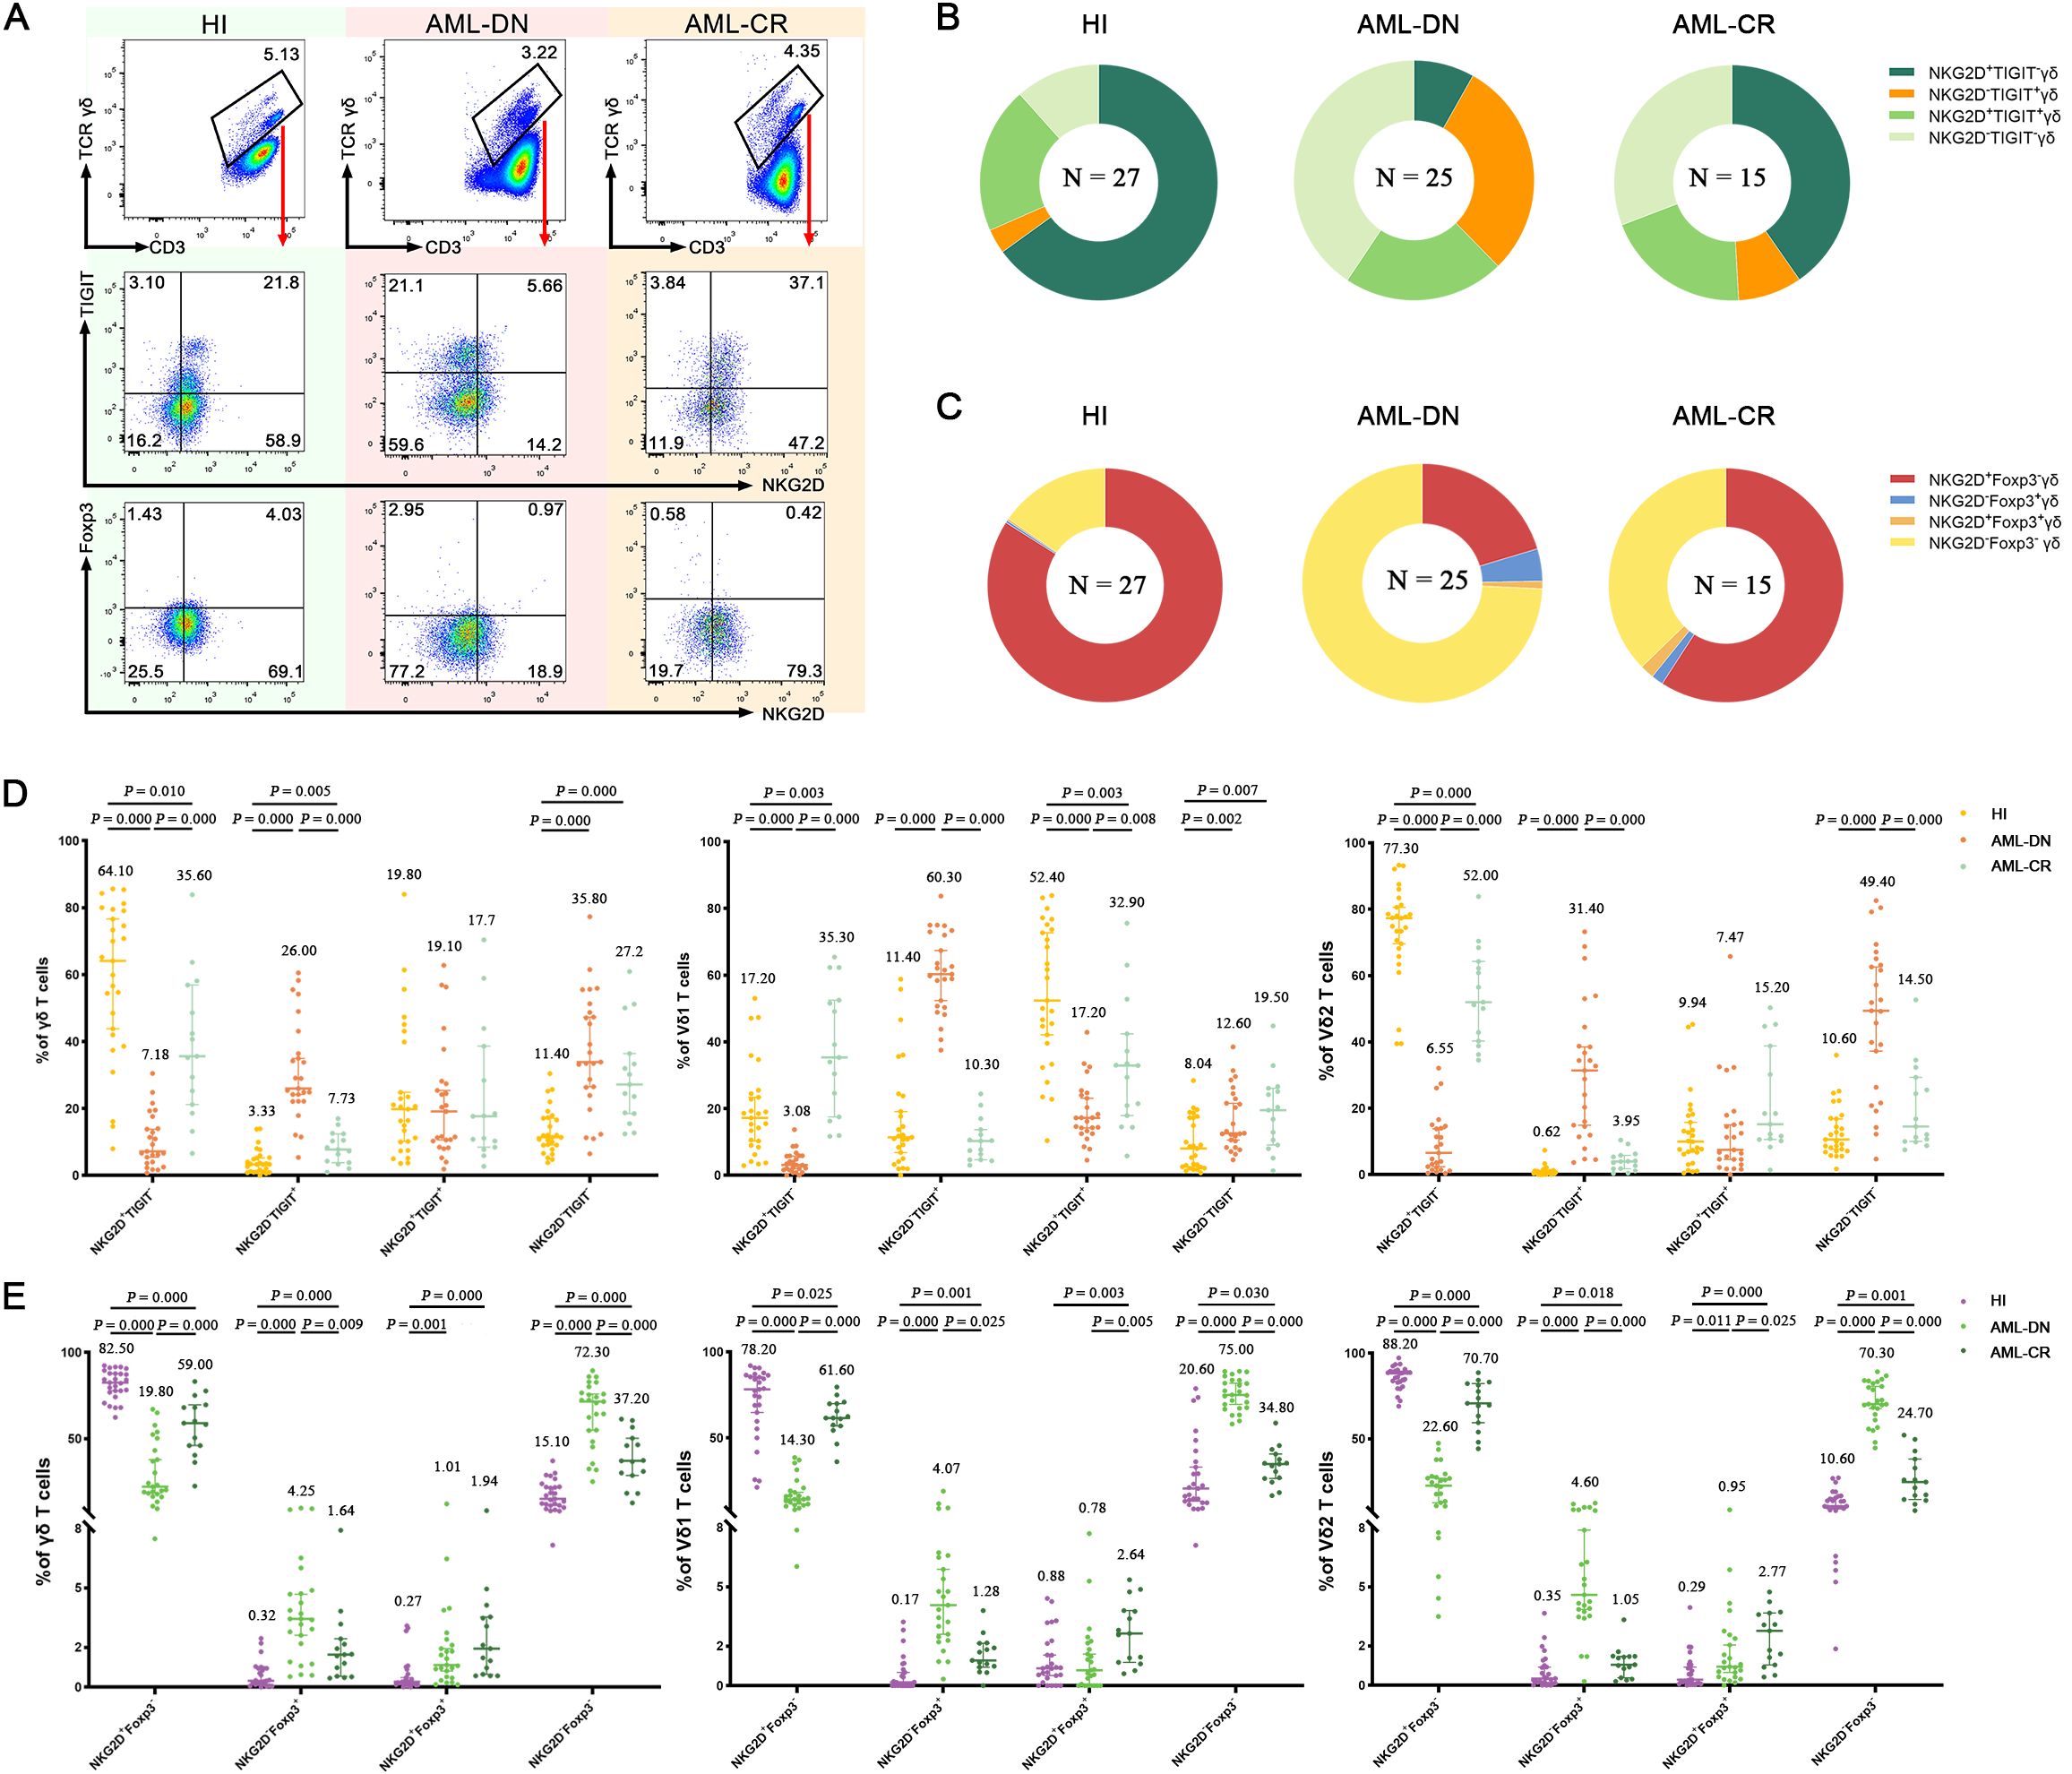
Figure 3. Co-expression of NKG2D, TIGIT, and Foxp3 in γδ, Vδ1, and Vδ2 cell subsets among AML-DN patients, CR patients, and HIs. (A) Flow cytometry analysis displaying the co-expression of NKG2D, TIGIT, and Foxp3 in γδ, Vδ1, and Vδ2 cell subsets from AML-DN patients, CR patients, and HIs. In this study, the gating strategy was carefully designed to ensure accurate identification of γδ T-cell subsets and their relevant markers. The gating was performed as follows: we first gated on CD3+ cells and further selected for γδ T cells by analyzing the CD3+/γδ T-cell population. Within the γδ T-cell population, Vδ1 and Vδ2 cells were identified based on specific marker expression, allowing for the analysis of these subsets individually. Subsequent gates were applied to identify the expression of NKG2D, TIGIT, and Foxp3 within the total γδ T-cell population, as well as separately within the Vδ1 and Vδ2 subsets. The specificity of antibody staining was validated using isotype-matched controls, as demonstrated in Supplementary Figure S1. (B) Pie charts illustrating the proportion of NKG2D, TIGIT, and Foxp3 co-expression in γδ, Vδ1, and Vδ2 subsets in AML-DN patients, CR patients, and HIs. (C) Quantitative comparison of NKG2D, TIGIT, and Foxp3 co-expression in total γδ, Vδ1, and Vδ2 subsets among AML-DN patients, CR patients, and HIs. The numbers above the scatter plots represent the median value of the data for each group (D, E). Data are presented as medians. The data were analyzed using the unpaired Mann–Whitney U test (B–E). AML-DN, de novo acute myeloid leukemia; CR, complete remission; HIs, healthy individuals.
Similarly, we described the expression difference of the other two single-positive subsets: NKG2D+Foxp3− and NKG2D−Foxp3+ in different γδ T-cell subgroups among His and the AML-DN and CR groups (Figures 3A, C, E; Supplementary Figure S2). We discovered that NKG2D+Foxp3− decreased in all γδ T subgroups: total γδ T cells (median: 19.80% vs. 82.50%, p = 0.000), Vδ1 T cells (median: 14.30% vs. 78.20%, p = 0.000), and Vδ2 T cells (median: 22.60% vs. 88.20%, p = 0.000) in the AML-DN group compared with the HIs (Figure 3E). Inversely, the frequency of NKG2D−Foxp3+ was increased in total γδ T cells (median: 4.25% vs. 0.32%, p = 0.000), Vδ1 T cells (median: 4.07% vs. 0.17%, p = 0.000), and Vδ2 T cells (median: 4.60% vs. 0.35%, p = 0.000) in the AML-DN group compared with the HIs (Figure 3E). Comparably, the lower tendency of NKG2D+Foxp3− subsets has been showed in total γδ T cells (median: 19.80% vs. 59.00%, p = 0.000), Vδ1 T cells (median: 14.30% vs. 61.60%, p = 0.000), and Vδ2 T cells (median: 22.60% vs. 75.00%, p = 0.000) in the AML-DN group compared with the CR group (Figure 3E). Simultaneously, a higher tendency of NKG2D−Foxp3+ subsets has been shown in total γδ T cells (median: 4.25% vs. 1.64%, p = 0.009), Vδ1 T cells (median: 4.07% vs. 1.28%, p = 0.025), and Vδ2 T cells (median: 4.60% vs. 1.05%, p = 0.000) in the AML-DN group compared with the CR group (Figure 3E). We further analyzed the correlation between the co-expression of NKG2D and Foxp3 in the non-Vδ1/Vδ2 subset. The results showed that the percentage of NKG2D+Foxp3− non-Vδ1/Vδ2 T cells was significantly reduced in both the AML-DN group (median: 26.80% vs. 71.30%, p < 0.001) and the CR group (median: 39.80% vs. 71.30%, p = 0.001) compared to HIs. In contrast, the percentage of NKG2D−Foxp3+ non-Vδ1/Vδ2 T cells was significantly increased in both the AML-DN group (median: 4.90% vs. 0.46%, p < 0.001) and the CR group (median: 2.17% vs. 0.46%, p = 0.001) compared to HIs (Supplementary Figure S1D).
Despite the increased insight into the phenotype of γδ T cells, whether these phenotypes correlate with clinical outcomes remains poorly understood. Therefore, we assessed the clinical outcomes of the 25 AML-DN patients (Table 1) and further analyzed the association among AML outcome, OS, and different subsets of γδ T cells. Logistic regression analyses indicated that several factors are associated with the clinical outcomes and prognosis of AML (Table 2). We further investigated whether the γδ T cells could be associated with OS. We selected 19 patients with OS exceeding 100 days from 25 AML-DN patients and then divided the 19 AML-DN patients into high and low groups based on the median frequency of the γδ T cells. There was a significant difference in the NKG2D+ γδ T-cell group (NKG2D+high γδ T cell vs. NKG2D+low γδ T cell 365-day OS: 100.0% vs. 29.6%, p = 0.003), NKG2D+ Vδ1 T cells (NKG2D+high Vδ1 T cell vs. NKG2D+low Vδ1 T cell 365-day OS: 100.0% vs. 37.5%, p = 0.017), and NKG2D+ Vδ2 T cells (NKG2D+high Vδ2 T cell vs. NKG2D+low Vδ2 T cell 365-day OS: 100.0% vs. 33.3%, p = 0.001) (Figure 4A). Furthermore, we analyzed the expression of NKG2D, TIGIT, and Foxp3 and found that the pairwise combinations of these three immune checkpoints connected with OS in AML patients.
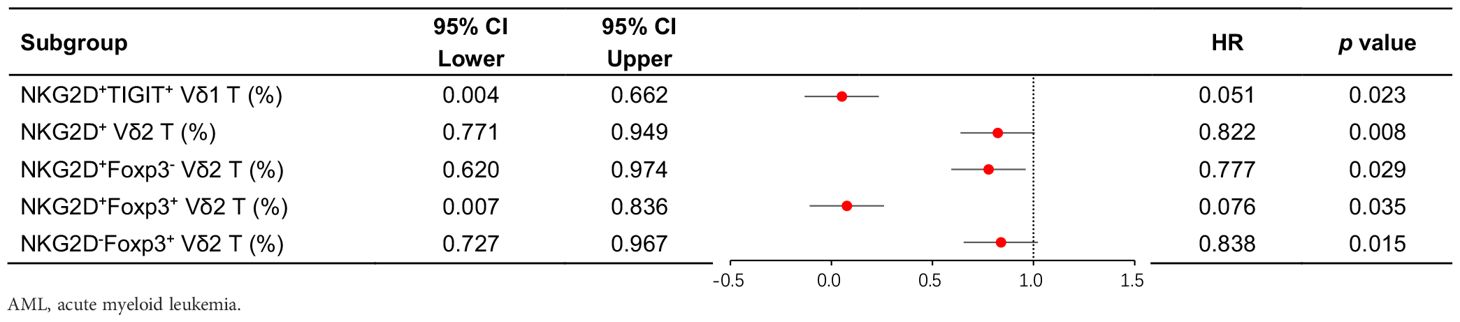
Table 2. Binary logistic regression analysis of the relationship between γδ T-cell subsets and clinical efficacy in AML-DN patients.
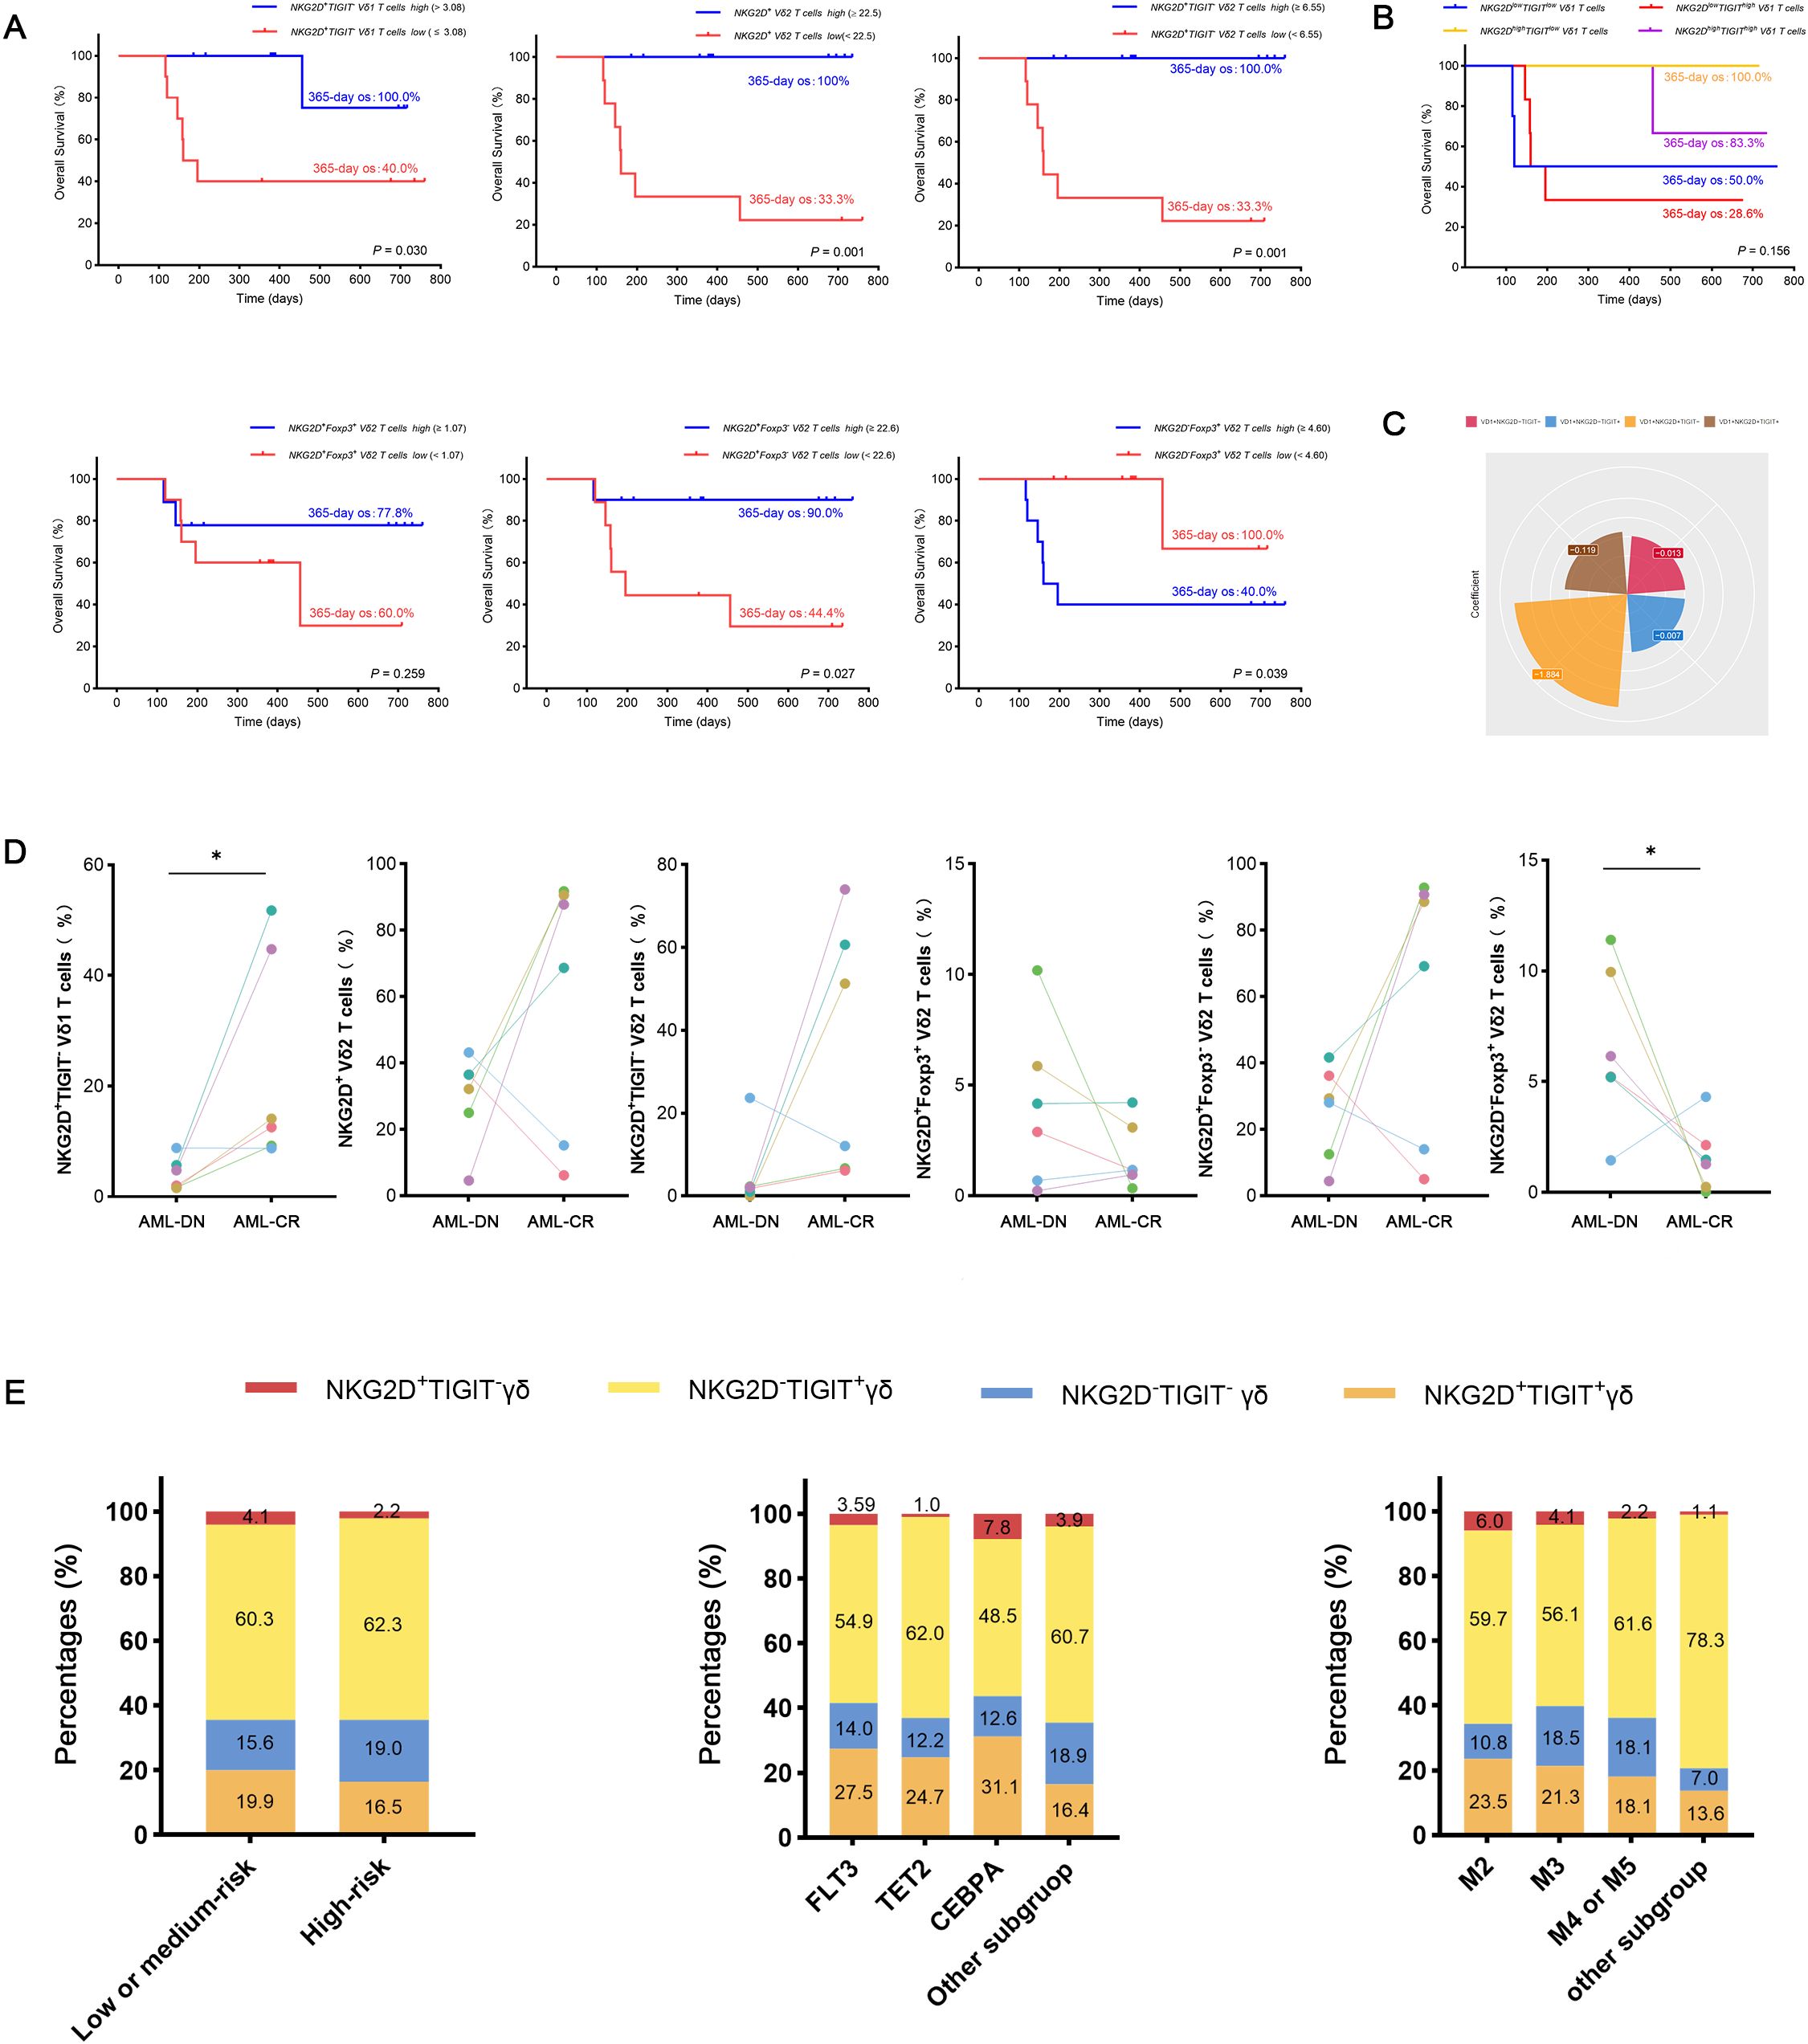
Figure 4. Analysis of OS and clinical outcomes in subgroups of AML-DN patients, focusing on NKG2D and TIGIT co-expression in Vδ1 T cells. (A) Kaplan–Meier analysis of OS stratified by the high and low expression of NKG2D+TIGIT− Vδ1 T cell subgroups (NKG2D+TIGIT− Vδ1 Thigh vs. NKG2D+TIGIT− Vδ1 Tlow) based on the median value. A significant difference in 365-day OS was observed (100% vs. 40%, p = 0.03). (B) Correlation between the proportions of the four subgroups defined by NKG2D and TIGIT co-expression in Vδ1 T cells and OS in AML-DN patients. (C) Contribution coefficient analysis of the NKG2D+ and TIGIT− co-expressing subpopulation within Vδ1 T cells to the prognosis of AML. (D) Paired analysis of clinical outcomes and prognoses in AML patients before and after treatment, highlighting subgroup dynamics. (E) Subgroup analysis of gene mutations, FAB classification, and risk stratification in AML patients, focusing on the NKG2D/TIGIT combined expression subgroups. OS, overall survival; AML-DN, de novo acute myeloid leukemia. *p < 0.05.
Among patients with low expression of NKG2D in total γδ T cells and Vδ2 T cells, concomitant high expression of TIGIT correlated with poor OS (NKG2DhighTIGITlow γδ T cell vs. NKG2DlowTIGIThigh γδ T cell 365-day OS: 100.0% vs. 50.0%, p = 0.003; NKG2DhighTIGITlow Vδ2 T cell vs. NKG2DlowTIGIThigh Vδ2 T cell 365-day OS: 100.0% vs. 50.0%, p = 0.032) (Figure 4B). Patients with low expression of NKG2D in Vδ2 T cells, together with high expression of Foxp3, also related to poor OS (NKG2DhighFoxp3low Vδ2 T cell vs. NKG2DlowFoxp3high Vδ2 T cell 365-day OS: 100.0% vs. 50.0%, p = 0.032) (Figure 4B). Moreover, univariate Cox regression analysis indicated that the frequencies of NKG2D+ γδ T cells, NKG2D+ Vδ2 T cells, NKG2D+TIGIT− Vδ1 T cells, NKG2D−Foxp3+ Vδ2 T cells, and NKG2D+Foxp3− Vδ2 T cells had significant differences in survival rates and were independent prognostic risk factors for AML prognosis (Table 3). A notable discrepancy was found among the NKG2D−TIGIT+ γδ T cells (NKG2D−TIGIT+high γδ T cell vs. NKG2D−TIGIT+low γδ T cell 365-day OS: 40.0% vs. 100.0%, p = 0.003) (Figure 4A). NKG2D+TIGIT− γδ T cells (NKG2D+TIGIT−high γδ T cell vs. NKG2D+TIGIT−low γδ T cell 365-day OS: 90.0% vs. 44.4%, p = 0.035), NKG2D+TIGIT− Vδ1 T cells (NKG2D+TIGIT−high Vδ1 T cell vs. NKG2D+TIGIT−low Vδ1 T cell 365-day OS: 100.0% vs. 40.0%, p = 0.030), and NKG2D+TIGIT− Vδ2 T cells (NKG2D+TIGIT−high γδ T cell vs. NKG2D+TIGIT−low γδ T cell 365-day OS: 100.0% vs. 33.3%, p = 0.001) also exhibited significant differences (Figure 4A). Also, the expression levels of NKG2D+Foxp3− Vδ2 T cells (NKG2D+Foxp3−high Vδ2 T cell vs. NKG2D+Foxp3−low Vδ2 T cell 365-day OS: 90.0% vs. 44.4%, p = 0.027) and NKG2D−Foxp3+ Vδ2 T cells (NKG2D−Foxp3+high T cell vs. NKG2D−Foxp3+low T cell 365-day OS: 40.0% vs. 100.0%, p = 0.039) correlate significantly with OS (Figure 4A).
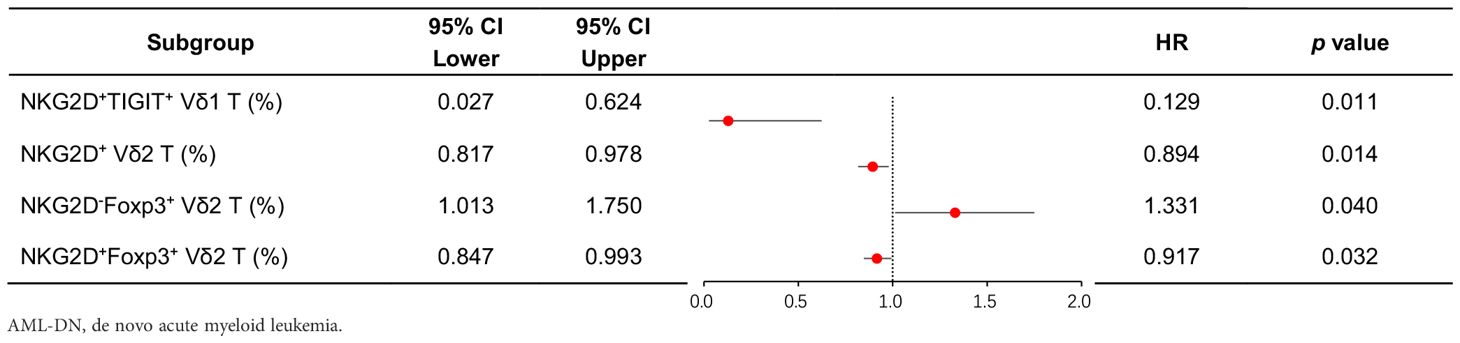
Table 3. Univariate Cox proportional hazards regression analysis of clinical treatment outcomes in AML-DN patients.
To further confirm the relevance of γδ T-cell subsets and clinical outcomes of AML patients, and meanwhile determine changes in the γδ T-cell subsets by chemotherapy, paired comparisons of the percentage of different γδ T-cell populations were conducted in six patients before and after chemotherapy. Notably, there was an increase in the frequencies of NKG2D+TIGIT− Vδ1 cells and NKG2D+Foxp3− Vδ2 cells in AML patients who achieved CR after chemotherapy (n = 6), which informed that these two subsets were intimately correlated with better outcomes (Figure 4D). The results suggest that the NKG2D+TIGIT− Vδ1 T-cell subset is a relatively sensitive survival predictor in AML. Subsequently, we compared the contribution coefficient analysis of the NKG2D/TIGIT co-expressing subpopulation in Vδ1 and found that the contribution coefficient of the NKG2D+TIGIT− Vδ1 cell subset was the highest, with the best prognosis in AML patients (Figure 4C). Therefore, we determined whether the subpopulations co-expressing NKG2D and TIGIT in Vδ1 exhibited different clinical characteristics. The results showed that the proportion of NKG2D+TIGIT− Vδ1 subpopulation was elevated in the low- or intermediate-risk groups. Compared to the TET and FLT3 genotypes, the proportion of NKG2D+TIGIT− Vδ1 subpopulation was higher in the CEBPA genotype group. In the FAB classification, the proportion was significantly lower in the M4 or M5 subgroups compared to the M2 and M3 subgroups (Figure 4E).
Current cancer immunotherapies are primarily based on αβ T cells, which heavily rely on MHC-mediated presentation of tumor-associated peptides or unique neoantigens, thus limiting their effectiveness and applicability in various scenarios. After years of preliminary clinical research, γδ T cells are now being explored as a viable and promising approach for cancer immunotherapy (20). γδ T cells comprise a relatively small subset of T cells in the PB of adult individuals. While there is substantial interindividual variability, γδ T cells usually account for anywhere between 1% and 10% of CD3+ T cells in human blood (21). The present study provides a phenotypic analysis of the PB γδ population in patients with AML (Figure 5). Human γδ T cells can be divided into two main groups according to their TCR usage of the Vδ1 and Vδ2 chains. Our results are consistent with previous findings that Vδ2 accounts for the majority of γδ T cells in PB, whereas Vδ1 accounts for a smaller proportion. Apart from Vγ9/Vδ2 and Vδ1, cells expressing one of the remaining Vγ (Vγ2, 3, 4, 5, or 8) or Vδ (Vδ3, 4, 5, or 6) elements on their surface are extremely rare among peripheral blood gd T lymphocytes (22). Vδ3 cells represent a rare and poorly studied γδ T-cell subset in the blood that can expand in the liver (23). Sequencing of the Vδ complementarity-determining region 3 revealed that nearly all non-Vδ1/Vδ2 cells utilized Vδ3 and that the tumor-infiltrating γδ T-cell clonotypes were unique to each patient (24). While no statistically significant differences were detected across groups within the non-Vδ1/Vδ2 subpopulation, this subset displayed expression patterns closely mirroring those observed in both Vδ1 and Vδ2 T-cell subsets. Importantly, this work extends our previous findings by providing functional evidence for the immunoregulatory capacity of γδ T cells in AML pathogenesis. We found that TIGIT and Foxp3 were generally expressed higher in total γδ T cells from AML-DN and CR patients, while they had lower expressions in HIs. Compared with that in the HIs, the expression of NKG2D was decreased in γδ T cells including Vδ1 T cells and Vδ2 T cells from the AML-DN and CR patients. The expression patterns of NKG2D, TIGIT, and Foxp3 in the non-Vδ1/Vδ2 subset were highly similar to those observed in the total γδ T-cell population, as well as in the Vδ1 and Vδ2 subsets. Furthermore, we analyzed the expression of NKG2D, TIGIT, and Foxp3 and found that the pairwise combinations of these three immune checkpoints connected with OS in AML patients. Our results show that highly expressed NKG2D was associated with well OS. Among patients with low expression of NKG2D in the total γδ T-cell group, concomitant high expression of TIGIT correlated with poor OS. Patients with low expression of NKG2D in total γδ T cells or Vδ2 T cells, together with high expression of Foxp3, also related to poor OS. Notably, there was an increase in the frequencies of NKG2D+TIGIT− Vδ1 cells and NKG2D−TIGIT+ Vδ2 cells in AML patients who achieved CR after chemotherapy, indicating the relevance of γδ T-cell subsets and clinical outcomes of AML patients. It provides new insights into the role of γδ T cells and immune checkpoint receptors, particularly TIGIT and NKG2D, in AML. Our findings highlight the complex dynamics of the immune microenvironment in AML and emphasize how immune checkpoint molecules, especially TIGIT, contribute to immune exhaustion, while NKG2D appears to support favorable clinical outcomes through its expression on γδ T cells.
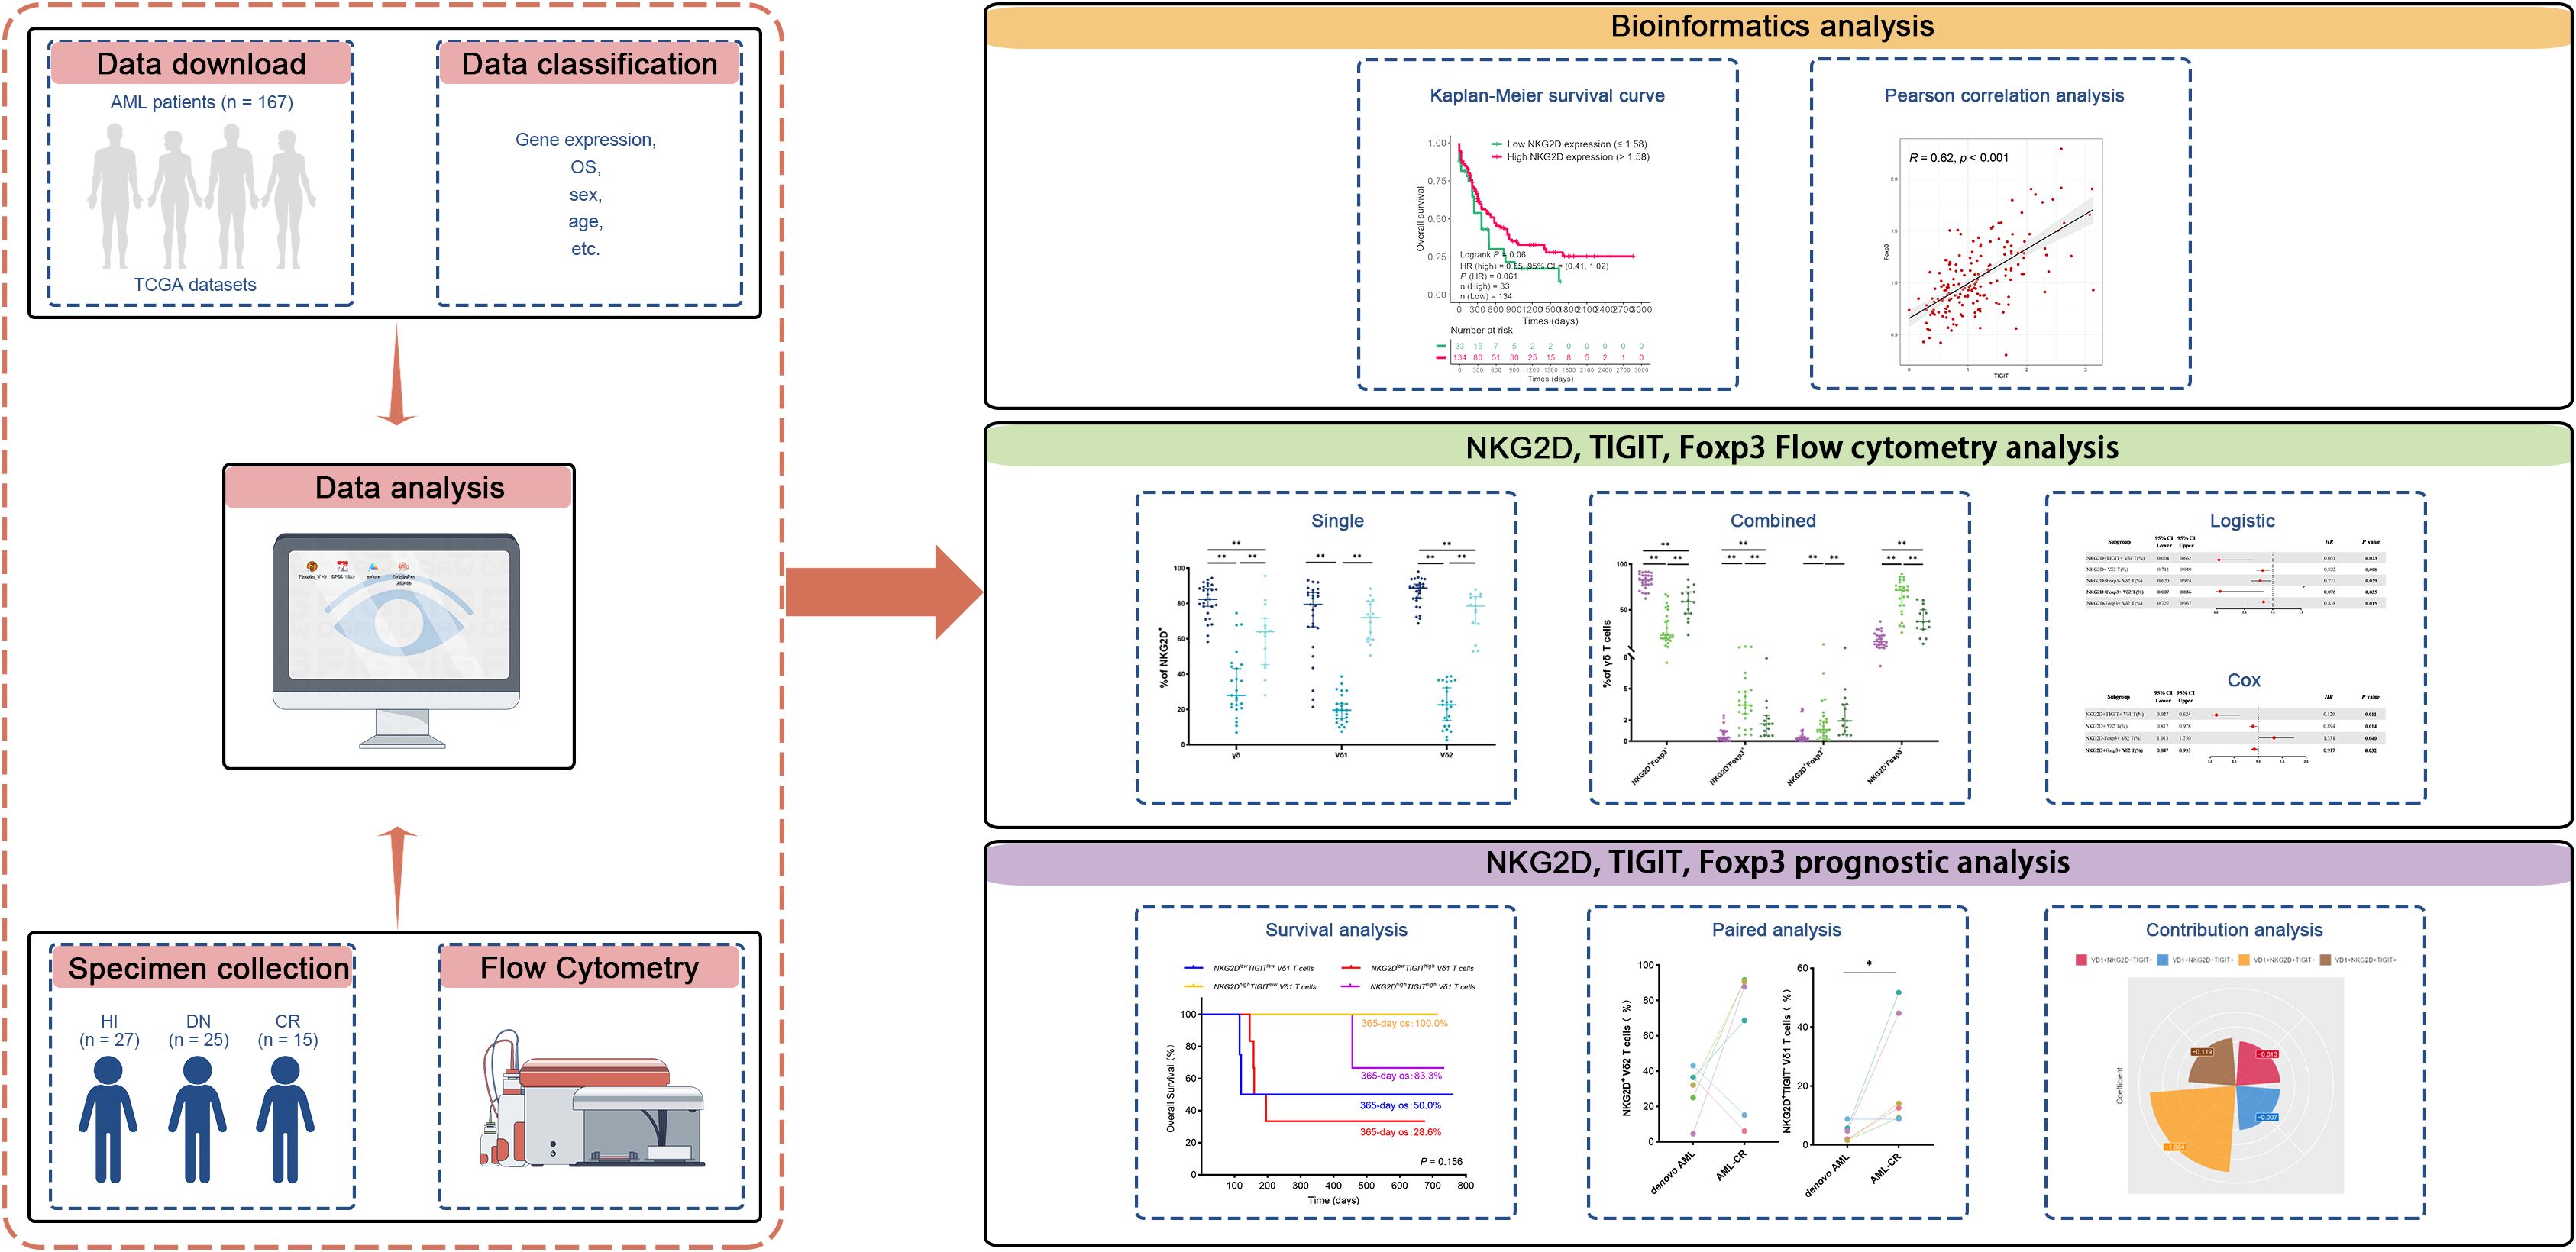
Figure 5. This study design schematic outlines the methodology. RNA-seq data from AML patients were downloaded from TCGA database, and clinical information was integrated to investigate the correlation between the expression of NKG2D, TIGIT, and FOXP3 genes and their relationship with clinical prognosis in AML patients. Flow cytometry analysis was conducted to evaluate the expression of molecular markers (NKG2D, TIGIT, and FOXP3) on γδ T cells and their Vδ1 and Vδ2 subpopulations in PB samples collected from 25 AML-DN patients, 15 CR patients, and 27 HIs. The analysis included both individual markers and their paired combinations. Paired samples from six patients who achieved CR after treatment were further analyzed to explore correlations with clinical treatment outcomes. Additionally, clinical data were utilized to predict OS in AML-DN patients. To assess the prognostic impact, univariate logistic regression, Cox regression, and contribution coefficient analyses were performed, focusing on the expression ratio of the NKG2D+TIGIT− Vδ1 T-cell subset and its relationship with clinical prognosis. AML, acute myeloid leukemia; TCGA, The Cancer Genome Atlas; PB, peripheral blood; AML-DN, de novo acute myeloid leukemia; CR, complete remission; HIs, healthy individuals; OS, overall survival.
γδ T cells are considered to have their niche at the crossroads of innate and adaptive immunity (25). They share features of the adaptive immune system, with their expression of clonally rearranged TCR genes, but at the same time are similar to innate immune cells, with the lack of need for antigen processing to activate their effector functions. Therefore, γδ T cells rapidly respond to TCR triggering. Moreover, γδ T cells frequently co-express functional receptors of innate immune cells, such as activating NK receptors such as NKG2D, NKp30, and/or NKp44, which directly trigger cytotoxic activity (26–29), in addition to certain Toll-like receptors (TLRs), which can provide costimulatory signals (30, 31). The NKG2D receptor also contributes to immune surveillance, as illustrated by increased tumor incidence in NKG2D-deficient mice (32). Therefore, different strategies were pursued to restore NKG2D-mediated recognition of malignant cells. In a recent study, anti-MICA and anti-MICB antibodies were used to inhibit the shedding of these ligands, resulting in enhanced NK cell cytotoxicity through NKG2D and additional FcγRIIIA activation (33). The loss or downregulation of NKG2D expression on immune cells is associated with poor prognosis and immune evasion, underscoring its importance in tumor surveillance (34, 35). As NKG2D is expressed on NK cells as well as on T-cell subsets, it may also represent a promising target for antibody-based immunotherapy (36).
TIGIT is another important immune checkpoint receptor that is expressed on effector CD4+ and CD8+ T cells, Tregs, and follicular T helper cells and is also found on NK and memory T cells. TIGIT binds to three ligands, including CD155 (PVR), CD112 (PVRL2, nectin-2), and CD113 (PVRL3), which are also parts of the PVR/NECTIN family (37, 38). In both mice and humans, TIGIT inhibits NK cell degranulation, cytokine production, and NK cell-mediated cytotoxicity against tumor cells expressing CD155 (12, 39). Some studies have shown that co-expression of TIGIT and PD-1 could lead to impaired protective anti-tumor responses; therefore, antibody co-blockade of TIGIT and PD-1 could enhance CD8+ T-cell effector function, resulting in significant tumor clearance (40, 41). In recent years, some studies have suggested that targeting immune checkpoints (ICs) can reverse the dysfunction of γδ T cells in the tumor microenvironment (TME) and enhance anti-tumor responses by improving γδ T-cell proliferation and activation, as well as boosting cytotoxicity (42). One of the emerging strategies for the treatment of TCM may be immunotherapy with Immune Checkpoint Blockades (ICBs) (43). Also recently, Hajiasghar-Sharbaf et al. showed that CD8+ T cells co-expressing PD-1 and TIGIT are highly frequent in chronic lymphocytic leukemia (CLL) (44). Another study showed an imbalance in the distribution of TIGIT and CD226 on γδ T cells, with a decrease in CD226+ γδ T cells and an increase in TIGIT+ γδ T cells in patients with AML-DN patients. In contrast, TIGIT−CD226+ γδ T cells were restored in AML patients who achieved CR after chemotherapy (45).
In this study, we further explored the distribution of TIGIT in different subpopulations of γδ T cells. Compared with the CR group, the tendency of the TIGIT+ Vδ1 subset expressing on the surface of the total γδ T-cell population was higher in the AML-DN group. It was also found that the tendency of TIGIT+ Vδ2 in γδ T cells was higher in the AML-DN group than in the CR group. Additionally, it was discovered that patients with AML-DN had a higher tendency of TIGIT+ Vδ2 in γδ T cells than did the CR group. This result may be supported by the findings of Brauneck et al. who found that γδ T cells in the bone marrow (BM) from patients with AML and MM showed an increased expression of the co-inhibitory molecules PD-1, TIGIT, TIM-3, or CD39 in contrast to HIs (16). Moreover, this study illustrated the increased expression of TIGIT on γδ T cells in AML-DN and CR patients, hypothesizing that these cells are functionally “exhausted”. These observations suggest that Vδ2 exhaustion may be a key driving factor in tumor immune evasion.
γδ T cells have different functional subsets, including regulatory T-cell subsets that express the Foxp3 (17). Foxp3-positive αβ T cells are traditional Tregs, and these cells have been observed to possess an immune regulatory function in patients (46, 47). The regulatory subset of γδ T cells that express Foxp3, termed γδ Tregs, has been reported to be at a low expression frequency in tumor-infiltrating leukocytes and human PB. However, the relevant underlying regulatory mechanism remains unclear. The number and functions of Tregs are reported to be enhanced in some solid tumors, facilitating immune escape (48, 49). It is reported that the percentages of Tregs were higher in AML-DN patients compared with HCs and AML patients in CR. Furthermore, AML-DN patients had higher mRNA expression of Foxp3 compared to that in AML patients in CR and HCs (19). Determining prognosis and treatment response in oncology patients drives personalized medicine strategies (50). Our previous study described the association between the expression levels of the PD-1 and FOXP3 genes and the OS in the BM leukemia cells AML patients based on TCGA database and described the expression pattern correlated with the poor OS (51). Consistently, our data also demonstrate an increasing trend in the Foxp3+ T-cell subsets in the Vδ1 and Vδ2 T-cell populations, which may be related to the primary reason for leukemia immunosuppression. Furthermore, our results show that high expression of NKG2D is associated with good OS, whereas high expression of TIGIT and Foxp3 is associated with poor survival. This finding has great importance for AML diagnosis and treatment. It also provides insight into how checkpoint dysregulation and subpopulation-specific depletion contribute to disease progression in other hematologic tumors or other malignancies.
In recent years, an increasing amount of basic research has focused on γδ T-cell development, antigen recognition, activation, and anti-tumor immune responses. In addition, the number of clinical trials of γδ T cell-based immunotherapy strategies is increasing (52). In addition to the previously reported that the high frequency of the PD-1+Foxp3+ γδ T subset is associated with poor clinical outcomes, we further speculate that the high frequency of the NKG2D+TIGIT− Vδ1 T subset is associated with favorable clinical outcomes, which could reinforce evidence of a link between NKG2D and TIGIT in γδ T cells. These results support the idea that the blockade of inhibitory immune checkpoint receptors or the addition of a co-stimulatory signal through activation may improve AML patient survival. This study not only enhances our understanding of the mechanisms underlying γδ T-cell dysfunction within the immune microenvironment of AML but, more importantly, bridges basic research and clinical translation. By developing prognostic models based on the expression patterns of γδ T-cell checkpoints, designing immunomodulatory regimens tailored to specific subpopulations, and exploring cross-tumor combinatory therapeutic strategies, this work is poised to usher in a new era of immunotherapy for a range of malignant tumors, including AML. Although we found a correlation between γδ T-cell functional subpopulations and clinical outcomes, the sample size was insufficient and was not validated by functional assays. Further studies are planned in the future to incorporate ex vivo and ex vivo functional assays to directly assess the cytotoxic potential or immunosuppressive activity of these subpopulations and explore the efficacy of AML immunotherapy.
The data presented in the study are deposited in the TCGA repository, accession number phs000178.
The studies involving humans were approved by Ethics Committee of the First Affiliated Hospital of Jinan University. The studies were conducted in accordance with the local legislation and institutional requirements. The participants provided their written informed consent to participate in this study. Written informed consent was obtained from the individual(s) for the publication of any potentially identifiable images or data included in this article.
SJ: Data curation, Formal Analysis, Investigation, Methodology, Software, Supervision, Validation, Visualization, Writing – original draft. SZh: Formal Analysis, Investigation, Methodology, Validation, Writing – original draft. CY: Formal Analysis, Investigation, Methodology, Writing – original draft. DN: Validation, Visualization, Writing – original draft. SZo: Software, Visualization, Writing – original draft. JZ: Formal Analysis, Validation, Writing – original draft. TL: Formal Analysis, Validation, Writing – original draft. TY: Conceptualization, Data curation, Project administration, Writing – review & editing. ZJ: Conceptualization, Data curation, Funding acquisition, Project administration, Resources, Supervision, Writing – review & editing. XW: Conceptualization, Data curation, Funding acquisition, Project administration, Resources, Supervision, Writing – review & editing.
The author(s) declare that financial support was received for the research and/or publication of this article. This study was supported by grants from the National Natural Science Foundation of China (82170220), the Guangdong Basic and Applied Basic Research Foundation (Nos. 2020A1515010817, 2022A1515010313, 2023A1515030271, and 2025A1515010192), the Science and Technology Program of Guangzhou City (No. 202201010164), the National Innovation and Entrepreneurship Training Program for Undergraduate (No. 202310559054), the Guangdong College Students’ Scientific and Technological Innovation (Nos. CX22446 and CX23304), and Research Foundation Ability Enhancement Project for Young and Middle aged Teachers in Guangxi Universities (No. 2021KY0558).
We would like to express our sincere gratitude to the Flow Facility of the Biological Translational Research Institute of Jinan University for their invaluable support and assistance throughout this project. We are also immensely grateful to the healthy volunteers who generously donated their blood, without whom this research would not have been possible. In addition, we would like to express our gratitude to Dakewe for the technical guidance.
The authors declare that the research was conducted in the absence of any commercial or financial relationships that could be construed as a potential conflict of interest.
The author(s) declare that no Generative AI was used in the creation of this manuscript.
All claims expressed in this article are solely those of the authors and do not necessarily represent those of their affiliated organizations, or those of the publisher, the editors and the reviewers. Any product that may be evaluated in this article, or claim that may be made by its manufacturer, is not guaranteed or endorsed by the publisher.
The Supplementary Material for this article can be found online at: https://www.frontiersin.org/articles/10.3389/fimmu.2025.1552235/full#supplementary-material
Supplementary Figure 1 | Distribution and frequency of NKG2D, TIGIT, and Foxp3 expression in non-Vδ1/Vδ2 T-cell subset from PB of AML-DN patients, CR patients, and HIs. (A) Comparison of the percentages of γδ T cells and their subsets (Vδ1, Vδ2, non-Vδ1/Vδ2). (B) Distribution and frequency of NKG2D, TIGIT, and Foxp3 expression in non-Vδ1/Vδ2 subset. (C) Co-Expression of NKG2D and TIGIT in non-Vδ1/Vδ2 subset. (D) Co-Expression of NKG2D and Foxp3 in non-Vδ1/Vδ2 subset. Data are presented as medians. The data were analyzed using the unpaired Mann-Whitney U test (A–D).
Supplementary Figure 2 | Isotype control validation for NKG2D, TIGIT, and Foxp3 antibodies in γδ T cells by flow cytometry. Isotype-matched control staining for NKG2D, TIGIT, and Foxp3 antibodies in γδ T cells is shown for one AML-DN patient, one CR patient, and one HI. γδ T cells were gated from CD3+ T cells, and the specificity of the target proteins was validated by comparing with corresponding isotype controls. The samples are from the same donor cohorts as those shown in Figure 3A.
1. Rigau M, Ostrouska S, Fulford TS, Johnson DN, Woods K, Ruan Z, et al. Butyrophilin 2a1 is essential for phosphoantigen reactivity by gammadelta T cells. Science. (2020) 367(6478). doi: 10.1126/science.aay5516
2. Dong R, Zhang Y, Xiao H, Zeng X. Engineering gammadelta T cells: recognizing and activating on their own way. Front Immunol. (2022) 13:889051. doi: 10.3389/fimmu.2022.889051
3. Park JH, Lee HK. Function of gammadelta T cells in tumor immunology and their application to cancer therapy. Exp Mol Med. (2021) 53:318–27. doi: 10.1038/s12276-021-00576-0
4. Hayday AC. Gammadelta T cell update: adaptate orchestrators of immune surveillance. J Immunol. (2019) 203:311–20. doi: 10.4049/jimmunol.1800934
5. Jin Z, Lan T, Zhao Y, Du J, Chen J, Lai J, et al. Higher tigit(+)Cd226(-) gammadelta T cells in patients with acute myeloid leukemia. Immunol Invest. (2022) 51:40–50. doi: 10.1080/08820139.2020.1806868
6. Zhao Y, Niu C, Cui J. Gamma-delta (Gammadelta) T cells: friend or foe in cancer development? J Transl Med. (2018) 16:3. doi: 10.1186/s12967-017-1378-2
7. Li Y, Li G, Zhang J, Wu X, Chen X. The dual roles of human gammadelta T cells: anti-tumor or tumor-promoting. Front Immunol. (2020) 11:619954. doi: 10.3389/fimmu.2020.619954
8. Lazarova M, Steinle A. The nkg2d axis: an emerging target in cancer immunotherapy. Expert Opin Ther Targets. (2019) 23:281–94. doi: 10.1080/14728222.2019.1580693
9. Dhar P, Wu JD. Nkg2d and its ligands in cancer. Curr Opin Immunol. (2018) 51:55–61. doi: 10.1016/j.coi.2018.02.004
10. Wu Z, Zhang H, Wu M, Peng G, He Y, Wan N, et al. Targeting the nkg2d/nkg2d-L axis in acute myeloid leukemia. BioMed Pharmacother. (2021) 137:111299. doi: 10.1016/j.biopha.2021.111299
11. Märklin M, Hagelstein I, Koerner SP, Rothfelder K, Pfluegler MS, Schumacher A, et al. Bispecific nkg2d-cd3 and nkg2d-cd16 fusion proteins for induction of nk and T cell reactivity against acute myeloid leukemia. J Immunother Cancer. (2019) 7:143. doi: 10.1186/s40425-019-0606-0
12. Chauvin JM, Zarour HM. Tigit in cancer immunotherapy. J Immunother Cancer. (2020) 8(2). doi: 10.1136/jitc-2020-000957
13. Harjunpaa H, Guillerey C. Tigit as an emerging immune checkpoint. Clin Exp Immunol. (2020) 200:108–19. doi: 10.1111/cei.13407
14. Hou Q, Wang P, Kong X, Chen J, Yao C, Luo X, et al. Higher tigit+ Γδ T(Cm) cells may predict poor prognosis in younger adult patients with non-acute promyelocytic aml. Front Immunol. (2024) 15:1321126. doi: 10.3389/fimmu.2024.1321126
15. Jin Z, Ye W, Lan T, Zhao Y, Liu X, Chen J, et al. Characteristic of tigit and dnam-1 expression on foxp3+ Γδ T cells in aml patients. BioMed Res Int. (2020) 2020:4612952. doi: 10.1155/2020/4612952
16. Brauneck F, Weimer P, Schulze Zur Wiesch J, Weisel K, Leypoldt L, Vohwinkel G, et al. Bone marrow-resident Vδ1 T cells co-express tigit with pd-1, tim-3 or cd39 in aml and myeloma. Front Med (Lausanne). (2021) 8:763773. doi: 10.3389/fmed.2021.763773
17. Kang N, Tang L, Li X, Wu D, Li W, Chen X, et al. Identification and characterization of foxp3(+) gammadelta T cells in mouse and human. Immunol Lett. (2009) 125:105–13. doi: 10.1016/j.imlet.2009.06.005
18. Zheng J, Qiu D, Jiang X, Zhao Y, Zhao H, Wu X, et al. Increased pd-1(+)Foxp3(+) gammadelta T cells associate with poor overall survival for patients with acute myeloid leukemia. Front Oncol. (2022) 12:1007565. doi: 10.3389/fonc.2022.1007565
19. Dong Q, Li G, Fozza C, Wang S, Yang S, Sang Y, et al. Levels and clinical significance of regulatory B cells and T cells in acute myeloid leukemia. BioMed Res Int. (2020) 2020:7023168. doi: 10.1155/2020/7023168
20. Mensurado S, Blanco-Domínguez R, Silva-Santos B. The emerging roles of Γδ T cells in cancer immunotherapy. Nat Rev Clin Oncol. (2023) 20:178–91. doi: 10.1038/s41571-022-00722-1
21. Parker CM, Groh V, Band H, Porcelli SA, Morita C, Fabbi M, et al. Evidence for extrathymic changes in the T cell receptor gamma/delta repertoire. J Exp Med. (1990) 171:1597–612. doi: 10.1084/jem.171.5.1597
22. Kabelitz D, Hinz T, Dobmeyer T, Mentzel U, Marx S, Böhme A, et al. Clonal expansion of vgamma3/vdelta3-expressing gammadelta T cells in an hiv-1/2-negative patient with cd4 T-cell deficiency. Br J Haematol. (1997) 96:266–71. doi: 10.1046/j.1365-2141.1997.d01-2027.x
23. Rodin W, Szeponik L, Rangelova T, Tamiru Kebede F, Österlund T, Sundström P, et al. [amp]]Gamma;δ T cells in human colon adenocarcinomas comprise mainly Vδ1, Vδ2, and Vδ3 cells with distinct phenotype and function. Cancer Immunol Immunother. (2024) 73:174. doi: 10.1007/s00262-024-03758-7
24. Barros-Martins J, Bruni E, Fichtner AS, Cornberg M, Prinz I. Omip-084: 28-color full spectrum flow cytometry panel for the comprehensive analysis of human Γδ T cells. Cytometry A. (2022) 101:856–61. doi: 10.1002/cyto.a.24564
25. Kalyan S, Kabelitz D. Defining the nature of human Γδ T cells: A biographical sketch of the highly empathetic. Cell Mol Immunol. (2013) 10:21–9. doi: 10.1038/cmi.2012.44
26. Groh V, Rhinehart R, Secrist H, Bauer S, Grabstein KH, Spies T. Broad tumor-associated expression and recognition by tumor-derived gamma delta T cells of mica and micb. Proc Natl Acad Sci U.S.A. (1999) 96:6879–84. doi: 10.1073/pnas.96.12.6879
27. Hudspeth K, Silva-Santos B, Mavilio D. Natural cytotoxicity receptors: broader expression patterns and functions in innate and adaptive immune cells. Front Immunol. (2013) 4:69. doi: 10.3389/fimmu.2013.00069
28. Correia DV, Lopes A, Silva-Santos B. Tumor cell recognition by Γδ T lymphocytes: T-cell receptor vs. Nk-Cell Receptors. Oncoimmunology. (2013) 2:e22892. doi: 10.4161/onci.22892
29. Simões AE, Di Lorenzo B, Silva-Santos B. Molecular determinants of target cell recognition by human Γδ T cells. Front Immunol. (2018) 9:929. doi: 10.3389/fimmu.2018.00929
30. Pietschmann K, Beetz S, Welte S, Martens I, Gruen J, Oberg HH, et al. Toll-like receptor expression and function in subsets of human gammadelta T lymphocytes. Scand J Immunol. (2009) 70:245–55. doi: 10.1111/j.1365-3083.2009.02290.x
31. Wesch D, Peters C, Oberg HH, Pietschmann K, Kabelitz D. Modulation of Γδ T cell responses by tlr ligands. Cell Mol Life Sci. (2011) 68:2357–70. doi: 10.1007/s00018-011-0699-1
32. Guerra N, Tan YX, Joncker NT, Choy A, Gallardo F, Xiong N, et al. Nkg2d-deficient mice are defective in tumor surveillance in models of spontaneous Malignancy. Immunity. (2008) 28:571–80. doi: 10.1016/j.immuni.2008.02.016
33. Ferrari de Andrade L, Tay RE, Pan D, Luoma AM, Ito Y, Badrinath S, et al. Antibody-mediated inhibition of mica and micb shedding promotes nk cell-driven tumor immunity. Science. (2018) 359:1537–42. doi: 10.1126/science.aao0505
34. Paczulla AM, Rothfelder K, Raffel S, Konantz M, Steinbacher J, Wang H, et al. Absence of nkg2d ligands defines leukaemia stem cells and mediates their immune evasion. Nature. (2019) 572:254–9. doi: 10.1038/s41586-019-1410-1
35. Baragaño Raneros A, Martín-Palanco V, Fernandez AF, Rodriguez RM, Fraga MF, Lopez-Larrea C, et al. Methylation of nkg2d ligands contributes to immune system evasion in acute myeloid leukemia. Genes Immun. (2015) 16:71–82. doi: 10.1038/gene.2014.58
36. Lutz S, Klausz K, Albici AM, Ebinger L, Sellmer L, Teipel H, et al. Novel nkg2d-directed bispecific antibodies enhance antibody-mediated killing of Malignant B cells by nk cells and T cells. Front Immunol. (2023) 14:1227572. doi: 10.3389/fimmu.2023.1227572
37. Anderson AC, Joller N, Kuchroo VK. Lag-3, tim-3, and tigit: co-inhibitory receptors with specialized functions in immune regulation. Immunity. (2016) 44:989–1004. doi: 10.1016/j.immuni.2016.05.001
38. Blake SJ, Dougall WC, Miles JJ, Teng MW, Smyth MJ. Molecular pathways: targeting cd96 and tigit for cancer immunotherapy. Clin Cancer Res. (2016) 22:5183–8. doi: 10.1158/1078-0432.Ccr-16-0933
39. Stanietsky N, Rovis TL, Glasner A, Seidel E, Tsukerman P, Yamin R, et al. Mouse tigit inhibits nk-cell cytotoxicity upon interaction with pvr. Eur J Immunol. (2013) 43:2138–50. doi: 10.1002/eji.201243072
40. Chauvin JM, Pagliano O, Fourcade J, Sun Z, Wang H, Sander C, et al. Tigit and pd-1 impair tumor antigen-specific cd8+ T cells in melanoma patients. J Clin Invest. (2015) 125:2046–58. doi: 10.1172/jci80445
41. Johnston RJ, Comps-Agrar L, Hackney J, Yu X, Huseni M, Yang Y, et al. The immunoreceptor tigit regulates antitumor and antiviral cd8(+) T cell effector function. Cancer Cell. (2014) 26:923–37. doi: 10.1016/j.ccell.2014.10.018
42. Gao Z, Bai Y, Lin A, Jiang A, Zhou C, Cheng Q, et al. Gamma delta T-cell-based immune checkpoint therapy: attractive candidate for antitumor treatment. Mol Cancer. (2023) 22:31. doi: 10.1186/s12943-023-01722-0
43. Wang P, Cai Q, Peng X, Dai Z, Liu J, Li W, et al. Increased co-expression of ctla4/lag3 predicted adverse clinical outcomes in patients with T-cell Malignancies. Cell Invest. (2025) 1:100004. doi: 10.1016/j.clnves.2024.100004
44. Hajiasghar-Sharbaf R, Asgarian-Omran H, Valadan R, Hossein-Nattaj H, Shekarriz R, Zaboli E, et al. Cd8+ T-cells co-expressing pd-1 and tigit are highly frequent in chronic lymphocytic leukemia. Iran J Allergy Asthma Immunol. (2021) 20:751–63. doi: 10.18502/ijaai.v20i6.8027
45. Jin Z, Lan T, Zhao Y, Du J, Chen J, Lai J, et al. Higher tigit(+)Cd226(-) Γδ T cells in patients with acute myeloid leukemia. Immunol Invest. (2022) 51:40–50. doi: 10.1080/08820139.2020.1806868
46. Li X, Kang N, Zhang X, Dong X, Wei W, Cui L, et al. Generation of human regulatory gammadelta T cells by tcrgammadelta stimulation in the presence of tgf-beta and their involvement in the pathogenesis of systemic lupus erythematosus. J Immunol. (2011) 186:6693–700. doi: 10.4049/jimmunol.1002776
47. Peng G, Wang HY, Peng W, Kiniwa Y, Seo KH, Wang RF. Tumor-infiltrating gammadelta T cells suppress T and dendritic cell function via mechanisms controlled by a unique toll-like receptor signaling pathway. Immunity. (2007) 27:334–48. doi: 10.1016/j.immuni.2007.05.020
48. Khalife E, Khodadadi A, Talaeizadeh A, Rahimian L, Nemati M, Jafarzadeh A. Overexpression of regulatory T cell-related markers (Foxp3, ctla-4 and gitr) by peripheral blood mononuclear cells from patients with breast cancer. Asian Pac J Cancer Prev. (2018) 19:3019–25. doi: 10.31557/apjcp.2018.19.11.3019
49. Sharma S, Khosla R, David P, Rastogi A, Vyas A, Singh D, et al. Cd4+Cd25+Cd127(Low) regulatory T cells play predominant anti-tumor suppressive role in hepatitis B virus-associated hepatocellular carcinoma. Front Immunol. (2015) 6:49. doi: 10.3389/fimmu.2015.00049
50. Hou S, Liu J, Zhu Y. Multi-omics advances for molecular characterization, precision medicine, and prognostic implications in leukemia. Cell Invest. (2025) 1:100007. doi: 10.1016/j.clnves.2025.100007
51. Zheng J, Qiu D, Jiang X, Zhao Y, Zhao H, Wu X, et al. Increased pd-1(+)Foxp3(+) Γδ T cells associate with poor overall survival for patients with acute myeloid leukemia. Front Oncol. (2022) 12:1007565. doi: 10.3389/fonc.2022.1007565
Keywords: acute myeloid leukemia, NKG2D, TIGIT, Foxp3, γδ T cells, prognosis, immune subsets
Citation: Jiang S, Zheng S, Yao C, Ning D, Zou S, Zhan J, Lan T, Yi T, Jin Z and Wu X (2025) Heterogeneity of γδ T-cell subsets and their clinical correlation in patients with AML. Front. Immunol. 16:1552235. doi: 10.3389/fimmu.2025.1552235
Received: 27 December 2024; Accepted: 10 March 2025;
Published: 01 April 2025.
Edited by:
Mazdak Ganjalikhani Hakemi, Istanbul Medipol University, TürkiyeReviewed by:
Michał Zarobkiewicz, Medical University of Lublin, PolandCopyright © 2025 Jiang, Zheng, Yao, Ning, Zou, Zhan, Lan, Yi, Jin and Wu. This is an open-access article distributed under the terms of the Creative Commons Attribution License (CC BY). The use, distribution or reproduction in other forums is permitted, provided the original author(s) and the copyright owner(s) are credited and that the original publication in this journal is cited, in accordance with accepted academic practice. No use, distribution or reproduction is permitted which does not comply with these terms.
*Correspondence: Xiuli Wu, c2l1bGllckAxNjMuY29t; Zhenyi Jin, amluemhlbnlpam51QDE2My5jb20=; Tingzhuang Yi, eXR6MjAwNzAxMDFAMTYzLmNvbQ==
†These authors have contributed equally to this work
Disclaimer: All claims expressed in this article are solely those of the authors and do not necessarily represent those of their affiliated organizations, or those of the publisher, the editors and the reviewers. Any product that may be evaluated in this article or claim that may be made by its manufacturer is not guaranteed or endorsed by the publisher.
Research integrity at Frontiers
Learn more about the work of our research integrity team to safeguard the quality of each article we publish.