
94% of researchers rate our articles as excellent or good
Learn more about the work of our research integrity team to safeguard the quality of each article we publish.
Find out more
ORIGINAL RESEARCH article
Front. Immunol., 13 February 2025
Sec. Autoimmune and Autoinflammatory Disorders: Autoinflammatory Disorders
Volume 16 - 2025 | https://doi.org/10.3389/fimmu.2025.1530327
 Spiros Georgakis1†
 Kalliopi Ioannidou1†
 Bernat Bramon Mora2
 Michail Orfanakis1Cloe Brenna1
 Yannick D. Muller3
 Perla M. Del Rio Estrada4,5
 Ashish A. Sharma4
 Giuseppe Pantaleo3
 Laurence de Leval1
 Denis Comte6
 Raphael Gottardo2,7
 Constantinos Petrovas1*
Introduction: Systemic lupus erythematosus (SLE) is characterized by dysregulated humoral immunity, leading to the generation of autoreactive B cells that can differentiate both within and outside of lymph node (LN) follicles.
Methods: Here, we employed spatial transcriptomics and multiplex imaging to investigate the follicular immune landscaping and the in situ transcriptomic profile in LNs from SLE individuals.
Results: Our spatial transcriptomic analysis revealed robust type I IFN and plasma cell signatures in SLE compared to reactive, control follicles. Cell deconvolution revealed that follicular T cell subsets are mainly affected by the type I IFN fingerprint of SLE follicles. Dysregulation of TFH differentiation was documented by i) the significant reduction of Bcl6hi TFH cells, ii) the reduced cell density of potential IL-4 producing TFH cell subsets associated with the impaired transcriptomic signature of follicular IL-4 signaling and iii) the loss of their correlation with GC-B cells. This profile was accompanied by a marked reduction of Bcl6hi B cells and an enrichment of extrafollicular CD19hiCD11chiTbethi, age-associated B cells (ABCs), known for their autoreactive potential. The increased prevalence of follicular IL-21hi cells further reveals a hyperactive microenvironment in SLE compared to control.
Discussion: Taken together, our findings highlight the altered immunological landscape of SLE follicles, likely fueled by potent inflammatory signals such as sustained type I IFN and/or IL-21 signaling. Our work provides novel insights into the spatial molecular and cellular signatures of SLE follicular B and TFH cell dynamics, and points to druggable targets to restore immune tolerance and enhance vaccine responses in SLE patients.
SLE represents the prototypic systemic autoimmune disease affecting predominantly women of childbearing age. Genetic and environmental factors lead to systemic and extensive dysregulation of both innate and adaptive arms of the immune system resulting in aberrant autoreactive responses. Two of the main interrelated hallmarks of SLE are the presence of autoantibodies (auto-Abs) in the patients’ sera, and the profound expression of type I IFN stimulated genes (ISGs) in blood and non-blood inflamed tissues (1–3). Autoantibodies bind to apoptotic or necrotic material released from dying cells and form immune complexes (ICs) that can activate IFN-producing cells, like plasmacytoid dendritic cells (pDCs), to secrete copious amounts of type I IFNs such as IFNα2 (4, 5). Subsequently, type I IFNs can potentiate autoreactive immune responses creating a deleterious feedback loop. Type I IFNs exert immunomodulatory effects on both the blood and secondary lymphoid tissues of SLE humoral responses at multiple levels including the enhancement of i) plasma cell differentiation and/or survival (6–8), ii) generation of non-canonical autoantibody secreting B cell subsets like age-associated-B cells (ABCs) (1–3), iii) TLR-fueled B cell-responsiveness to autoantigens (9) and by modulating T cell -mediated B cell maturation (10). The highly inflammatory microenvironment in SLE can affect both follicular (F) and extrafollicular (EF) responses taking place in lymph nodes (LNs) (11).
Previous findings have shown that most IgG autoantibodies detected in SLE patients’ sera are somatically mutated supporting the involvement of germinal centers (GCs) in SLE humoral responses while a fraction of antibody-secreting cell (ASCs) clones contained unmutated autoantibodies, a sign of GC-independent B cell differentiation (12). Notably, extrafollicular GC-independent responses are loosely regulated and can lead to the generation of autoreactive B cell clones (13). On the other hand, it is well-established that efficient GC-responses require T follicular cells (TFH) cells (14). These cells are mainly found in the follicles of secondary lymphoid organs and are characterized by their capacity to mediate B-cell clonal expansion, antigen-based affinity maturation and plasma cell differentiation in an IL-21- and IL-4- dependent manner (15). TFH cells can be phenotypically distinguished by their high expression of Bcl6, PD-1 and CXCR-5 (16, 17). Even if they represent a small fraction of T cells, TFH cells exhibit high phenotypic and functional heterogeneity (15, 18) as well as adaptiveness to tissue microenvironment (19). TFH cell subsets are endowed with distinct phenotypes, GC-localization patterns, and cytokine-secreting potential (18). Several studies provided evidence that deregulated somatic hypermutation taking place in GCs can give rise to autoantibody-secreting B cells highlighting the importance of proper TFH-mediated reactions (20–22). Previous findings also revealed that circulating TFH-like cells (CD4+PD1+CXCR5+) are up-regulated in SLE patients’ peripheral blood and correlated with SLE disease activity score (SLEDAI) (23). Whether circulating TFH-like cells represent blood counterparts of bona fide GC TFH cells or a memory subset (memory TFH) that leave GCs due to incomplete interaction with B cells is not well understood (24). Additionally, deregulated TFH cell responses in SLE might be the cause of impaired vaccine responses as previously reported (25, 26). Due to the difficulty in obtaining relevant human material, the in-situ investigation of the immune landscape of secondary lymphoid organs in SLE is still an understudied area of research.
Herein, by using a combination of spatial transcriptomics and multiplex imaging analysis of SLE with an active disease compared to reactive, non-autoimmune control LNs, we provide evidence for a profound type I IFN signature associated with an altered immune landscape characterized by dysregulated TFH and B cell dynamics, which may contribute to the generation of autoreactive B cell subsets in SLE LNs. Further understanding of deregulated GC responses is of great interest to ameliorate SLE symptoms and improve vaccine responses in SLE patients.
The tissue samples used in this study were obtained from the archives of the Institute of Pathology of Lausanne University Hospital, Switzerland (Supplementary Table S1, Supplementary Figure S1A). LN cells were obtained from the Centro de Investigacion en Enfermedades Infecciosas (CIENI), Instituto Nacional de Enfermedades Respiratorias (INER) in Mexico City, Mexico. All procedures were in accordance with the Declaration of Helsinki and approved by i) the Canton de Vaud-CER-VD, Switzerland for control LN tissues (#2021-01161), ii) the local research consent authorities for LN analysis and the reuse of clinical data from the five SLE patients at CHUV, with oral consent provided by the patients after a thorough explanation of the study by the investigators, and iii) the Research Committee and the Ethics in Research Committee of the National Institute of Respiratory Diseases “Ismael Cosío Villegas,” Mexico City as part of the ‘C71-18’ protocol.
Fresh tissues samples were promptly fixed overnight in formalin, following biopsy, and processed into paraffin embedded (FFPE) blocks using standard procedures. All subsequent tissue processing was carried out in our Institute. The blocks were sequentially cut into 4 μm sections and prepared on Superfrost glass slides (Thermo Scientific, Waltham, MA, USA, Ref. J1800AMNZ), dried overnight at 37°C and stored at 4°C. Before staining, the slides were heated on a metal hotplate (Stretching Table, Medite, Burgdorf, OTS 40.2025, Ref. 9064740715) at 65°C for 20 min. This melting step ensures the proper adherence, deparaffinization and optimal epitope exposure of the tissue section.
Transcriptomic profiling was performed using the commercially available platform GeoMx Digital Spatial Profiling (Nanostring) according to the manufacturer’s instructions. 4 µm FFPE tissue sections from SLE (N=4) and control (N=3) LN were used. Follicular Regions of Interest (ROIs, n=9-12) were identified based on the CD3, CD20, PD-1 in situ staining pattern (active follicles/characterized as CD20-dense areas populated by CD3+PD1+ cells were selected for analysis) before the probe-hybridization step. The average ROI area was 126336.4 µm² (± 59758.8728, SD) for control and 157725.2281 µm² (± 78722.80994, SD) for SLE ROIs.
For data Processing and quality control (QC), we followed standard GeoMx processing workflows (https://doi.org/10.18129/B9.bioc.GeoMxWorkflows.). The processing of DCC files and quality checks at various levels (segment, probe, and gene) were carried out with the help of the ‘GeoMxWorkflows’(https://doi.org/10.18129/B9.bioc.GeoMxWorkflows.),’GeomxTools’(https://doi.org/10.18129/B9.bioc.GeoMxWorkflows.) and ‘NanoStringNCTools’ (https://doi.org/10.18129/B9.bioc.NanoStringNCTools.). packages in R (version 4.3.2). First, we adjusted all zero expression counts to one to facilitate downstream data transformation. Next, we applied several quality control cut-offs recommended by NanoString, including: a minimum of 1000 reads, 80% trimming, stitching, and alignment, 50% sequencing saturation, a minimum negative control counts of 1, a maximum of 1000 reads observed in NTC wells, and a minimum area of 1000. In addition to the segment quality control, probes with an average expression count across segments below 10% of the average for other probes targeting the same gene were excluded. Likewise, we also removed probes deemed outliers in over 20% of segments, using Grubb’s test (https://doi.org/10.18129/B9.bioc.GeoMxWorkflows.) as the outlier detection method. Finally, we excluded segments where less than 5% of the genes in the panel were detected above the quantification limit (LOQ, calculated as two standard deviations beyond the mean), and genes falling below the LOQ in at least 10% of the segments.
To perform batch correction, we first normalized the raw data using the Trimmed Mean of M-values (TMM) method with the R package “standR” 15, which adjusts for differences in library sizes and composition between RNA-seq samples. We then applied the RUV-4 correction from the same package 16, which removes unwanted variations by identifying negative control genes and calculating scaling factors for batch correction. In our analysis, we identified several negative control genes and set the number of scaling factors to 2.
To correct for batch effects, we first normalized the dataset using the Trimmed Mean of M-values (TMM) method, implemented via the ‘standR’ package in R (https://doi.org/10.18129/B9.bioc.standR). This method adjusts for discrepancies in library size and composition between RNA-seq samples. Following this, we applied the RUV-4 correction (27), which uses negative control genes to calculate scaling factors and remove unwanted variability due to batch effects. In this study, we identified 300 negative control genes and set the number of scaling factor to 3 for the RUV-4 correction.
For the differential gene expression analysis, we employed the limma-voom workflow (28, 29). That is, we built a linear model using a design matrix that accounted for the treatment variable and RUV-4 correction scaling factors as covariates. We then identified differentially expressed genes between treatments based on an adjusted p-value cut-off of less than 0.05. Finally, we performed gene set enrichment analysis (GSEA) on the differentially expressed genes to identify biological pathways of interest (30). We applied the ‘fry’ method from the R package ‘limma’ (28) and used canonical pathway gene sets from the Reactome (https://doi.org/10.18129/B9.bioc.msigdb.). The results were then analyzed and visualized using the R package ‘vissE’ (https://doi.org/10.18129/B9.bioc.vissE).
To perform cell deconvolution on the GeoMx data, we followed the ‘SpatialDecon’ R package pipeline (31). We used lymph node single-cell RNA-seq data from HIV patients as our reference dataset. We focused on cells classified as T cells (CD4, CD8, TFH), B cells and dendritic cells. Likewise, we only considered genes expressed in immune and stromal cells (genes used in ‘safeTME’ cell profile matrix from ‘SpatialDecon’) and some additional immune cell-specific genes if needed. To avoid either different population sizes across or genetic variability within cell types to interfere with the deconvolution methods, we first clustered each cell type into smaller populations with well-defined gene signatures, using a k-means algorithm with a total of 15 centers (32). Then, using these new annotations, we generated the lymph-node specific cell profile matrix with ‘SpatialDecon’, and perform the deconvolution on the GeoMx data (31). To study the effects of deconvolution-derived cell proportions on gene expression, we designed several modelling strategies to address the relationship between the expression of specific genes and cell populations. Preliminary tests of the association between gene expression and deconvoluted data generated ΄noisy΄ results, mainly because our deconvolution approach yielded unsatisfactory outcomes in terms of successfully distinguishing the relevant T cell subsets. For this purpose, we merged all T cell populations together, considering that our imaging results proved that most T cells in our ROIs (follicles) are TFH. We used the R package ‘DESeq2’ (33) to model gene counts with a negative binomial regression as a function of the RUV-4 scaling factors, segment area, treatment, and the percentage for a given cell population. We applied two models: a first model without the treatment effect and a slope for the cell percentage, and a second model with the treatment effect and treatment-specific slopes for the cell percentage. These models allowed us to understand the extent to which the presence of a particular cell population in each segment is related to the expression levels of specific genes.
Cells from viremic HIV LNs were used for the generation of a data set to support the GeoMx cell deconvolution analysis. Briefly, FASTQ files were uploaded to Cell Ranger (10X Genomics cloud), and no depth normalization was carried out. The generated filtered count matrix was further analyzed using the Seurat package in R. Doublet cells were removed from the analysis using the DoubletFinder package in R. Cell annotations were performed using SingleR and the reference expression dataset was derived from the Monaco Immune Data atlas from the cell dex R package. Differentiation gene expression was assessed using the MAST R package. Sequencing data were deposited in the GEO database under the accession ID GSE288212.
Multiplex antibody staining was performed on the Ventana Discovery Ultra Autostainer (Roche Diagnostics) as previously described (34). Briefly, the procedure is consisted of consecutive rounds of antigen retrieval, antibody blocking steps (using the Opal blocking/antibody diluent solution) for non-specific binding of antibodies, staining with primary antibodies (details on antibodies, clones and panel are listed in Supplementary Tables S2, S3), incubation with secondary HRP-labeled antibodies for 16 min, then detection with optimized fluorescent Opal tyramide signal amplification (TSA) dyes (Opal 7-color Automation IHC kit, from Akoya, Ref. NEL821001KT). Repeated antibody denaturation cycles were introduced. Tissue sections stained with Alexa-Conjugated antibodies (panel 5) were incubated with the primary Ab for 90 min and with the secondary Ab (if needed) for 90 min at RT. Just for panel 5, a cycling staining approach was followed. After staining with Alexa-conjugated Abs, the Ab complexes were dissociated using a citric acid-based buffer and a second staining cycle followed with Opal-coupled Abs. The images were aligned using SimpleITK (35) as an Imaris extension (Imaris software version 9.9.0, Bitplane) using a common marker (specifically a nuclear dye). The samples were counterstained with Spectral DAPI from Akoya Biosciences (NEL821001KT) for 4 min or SYTO45 (1/10000 dilution in TBS-T, CatNo10297192, ThermoFischer Scientific) for 35 min, rinsed water with soap and mounted using DAKO mounting medium (Dako/Agilent, Santa Clara, CA, USA, Ref. S302380-2).
Multispectral images (MSI) were acquired using the Vectra Polaris imaging system from Akoya or the Leica Stellaris 8 SP8 confocal system. Images (512x512 and 1024x1024 resolution) were acquired using 0.75× optical zoom and a 20× objective (NA) (unless otherwise specified) for all the images used for quantification. Frame averaging or summing was never used while acquiring the images. At least 80% of each section was imaged, to ensure an accurate representation and minimize selection bias. For images acquired with Vectra Polaris dye unmixing was conducted using inForm image analysis software, version 2.4.8 (Akoya Biosciences, Marlborough, MA 01752, USA) and for those acquired with Leica Stellaris 8 we used Leica LAS-AF Channel Dye Separation module which was included in LAS-X (Leica Application Suite X (LAS-X)-4.6.1.27508 software). All the tissues stained for the same panel were imaged using the same platform to be able to process them all together and quantify their cell densities (normalized cell counts per mm2) and/or frequencies.
For images acquired using the Vectra Polaris the Phenochart 1.0.12 software (Akoya Biosciences, Marlborough, MA 01752, USA), a whole-slide contextual viewer with annotation capability was used for navigation around slides and for identification of Regions of Interest (ROIs). MSI were analyzed using the inForm image analysis software, version 2.4.8 from Akoya. Firstly, the images were unmixed and were segmented using CD20, PD-1, KI67 and DAPI as components for training into specific tissue ROIs (GC, non-GC CD20-enriched area, low CD20 area). Individual cells were segmented using the counterstained-based adaptive cell segmentation algorithm, with the help of nuclear (DAPI and BCL-6) and membrane (CD4) markers. Following tissue and cell segmentation, the phenotyping configuration was used, by assigning around 100 cells to the positive phenotype for each marker, while selecting additional 100 cells characterized as “other” for the negative phenotype, choosing across several images. The quantification was based on PhenoptrReports from Akoya Biosciences, an automated R-script platform, where separated merged cell segmentation data, retaining the same tissue segmentation, were created for each phenotyped marker and were consolidated afterwards. The different combinations of phenotyped populations were defined and the analysis was run creating reports, which contained the number of analyzed fields (slide summary), cell counts, cell percentages, and cell densities.
Quantitative data was generated from images captured with Leica Stellaris using Histo-cytometry analysis (given the low abundance of PD1hiCD57hi GATA3hi cells, images from panel 3 were analyzed using both approaches as a cross validation step), as previously reported (34, 36). In brief, the Surface Creation module of Imaris software (version 9.9.0 Bitplane) was used to generate 3-dimensional segmented surfaces (based on the nuclear signal) of unmixed images. Data generated from Histo-cytometry, such as average voxel intensities for all channels, in addition to the volume and sphericity of the 3-dimensional surfaces, were exported in Microsoft Excel format. The files were converted to comma separated value (.CVS) files, and the data were imported into FlowJo (version 10) to be further analyzed and quantitated. Well-defined areas devoid of background staining were included in the analysis, and the data were quantified either as relative frequencies or as cell counts normalized to the imaged follicular area. The area and other morphological characteristics (circularity, solidity) of individual follicles were calculated using FIJI software (37). Optimal z-stack settings were applied in all collected images. Maximum Intensity Projections (MIPs) are presented throughout the manuscript.
The distance between relevant cell subsets (CD20hi/dimKi67hi, PD1hiCD57hi, PD1hiGATA3hi) was calculated with Python 3.10.9 using the SciPy library (38). X and Y coordinates were used to create the matrix interaction for each cell phenotype, and the median distance was also extracted. Additionally, to calculate the probability of observing different patterns of cellular distribution across ROIs and individuals, we studied the curves generated from the Ripley’s G function and the theoretical Poisson curve using pointpats 2.3.0 (https://doi.org/10.5281/zenodo.7706219). The area between the empirical and theoretical Poisson curve was extracted using the NumPy library (39). ROIs harboring at least 20 positive cells for each cell subset under investigation were analyzed.
The Mann-Whitney test and simple linear regression analysis were used to analyze the imaging data. Analyses and graphs were generated using GraphPad Prism 8.3.0 software. Regarding the ROI measurements (Area, Circularity, Solidity), we applied a Mixed Effect Model using a python script comprising both fixed effects corresponding to various follicular areas and random effects originating from individual donors. A p-value < 0.05 was considered statistically significant.
To investigate the unique characteristics of SLE follicular landscape, we collected LN sections from treatment-naive active SLE patients exhibiting lymph node involvement and from non-autoimmune, cancer- and HIV-free control donors harboring hyperplastic, active follicles (Supplementary Table S1) (Supplementary Figure S1A). Despite the different etiology of follicular activation/maturation, our selected non-autoimmune tissues represent a strict control group, providing a powerful evaluation for the SLE follicular profiling. To start gaining insights on the complex molecular profile of SLE follicles, we performed spatial transcriptomic analysis using the GeoMX Digital Spatial Profiler platform. Secondary mature follicles were defined as CD20hi/dim-dense microanatomical structures populated by CD3hiPD1hi (TFH) cells (Supplementary Figure S1B). Principal component analysis (PCA) of batch-corrected sequencing data revealed that SLE follicles exhibit a transcriptionally distinct profile compared to non-autoimmune reactive controls (Figure 1A, Supplementary Figure S1C). Volcano analysis showed that several inflammation-related genes (STAT1, CXCL9, CXCL11, IRF1 etc.) were upregulated in SLE over non-autoimmune control follicles, while IL4-related (IL4R, FCER2) and cellular oxidation-related (TXNIP) genes were upregulated in control follicles (Figure 1B). Notably, most of the top upregulated Differentially Expressed Genes (DEGs) in SLE follicular areas were interferon stimulated- (ISGs like IRF7, IFI6, IFI44L, ISG20 etc) or plasma cell-related (PRDM1, IRF4, IGHG1 etc) genes, a profile independent of the gender of SLE individuals. (Figure 1C). In line with the DEGs profile, we detected significantly higher expression of type I IFN and immunoglobulin complex pathways in SLE compared to control follicles (Figure 1D). Compared to SLE, control follicles were characterized by significant enrichment of TFH cell differentiation and IL1b-related pathways (Figure 1D).
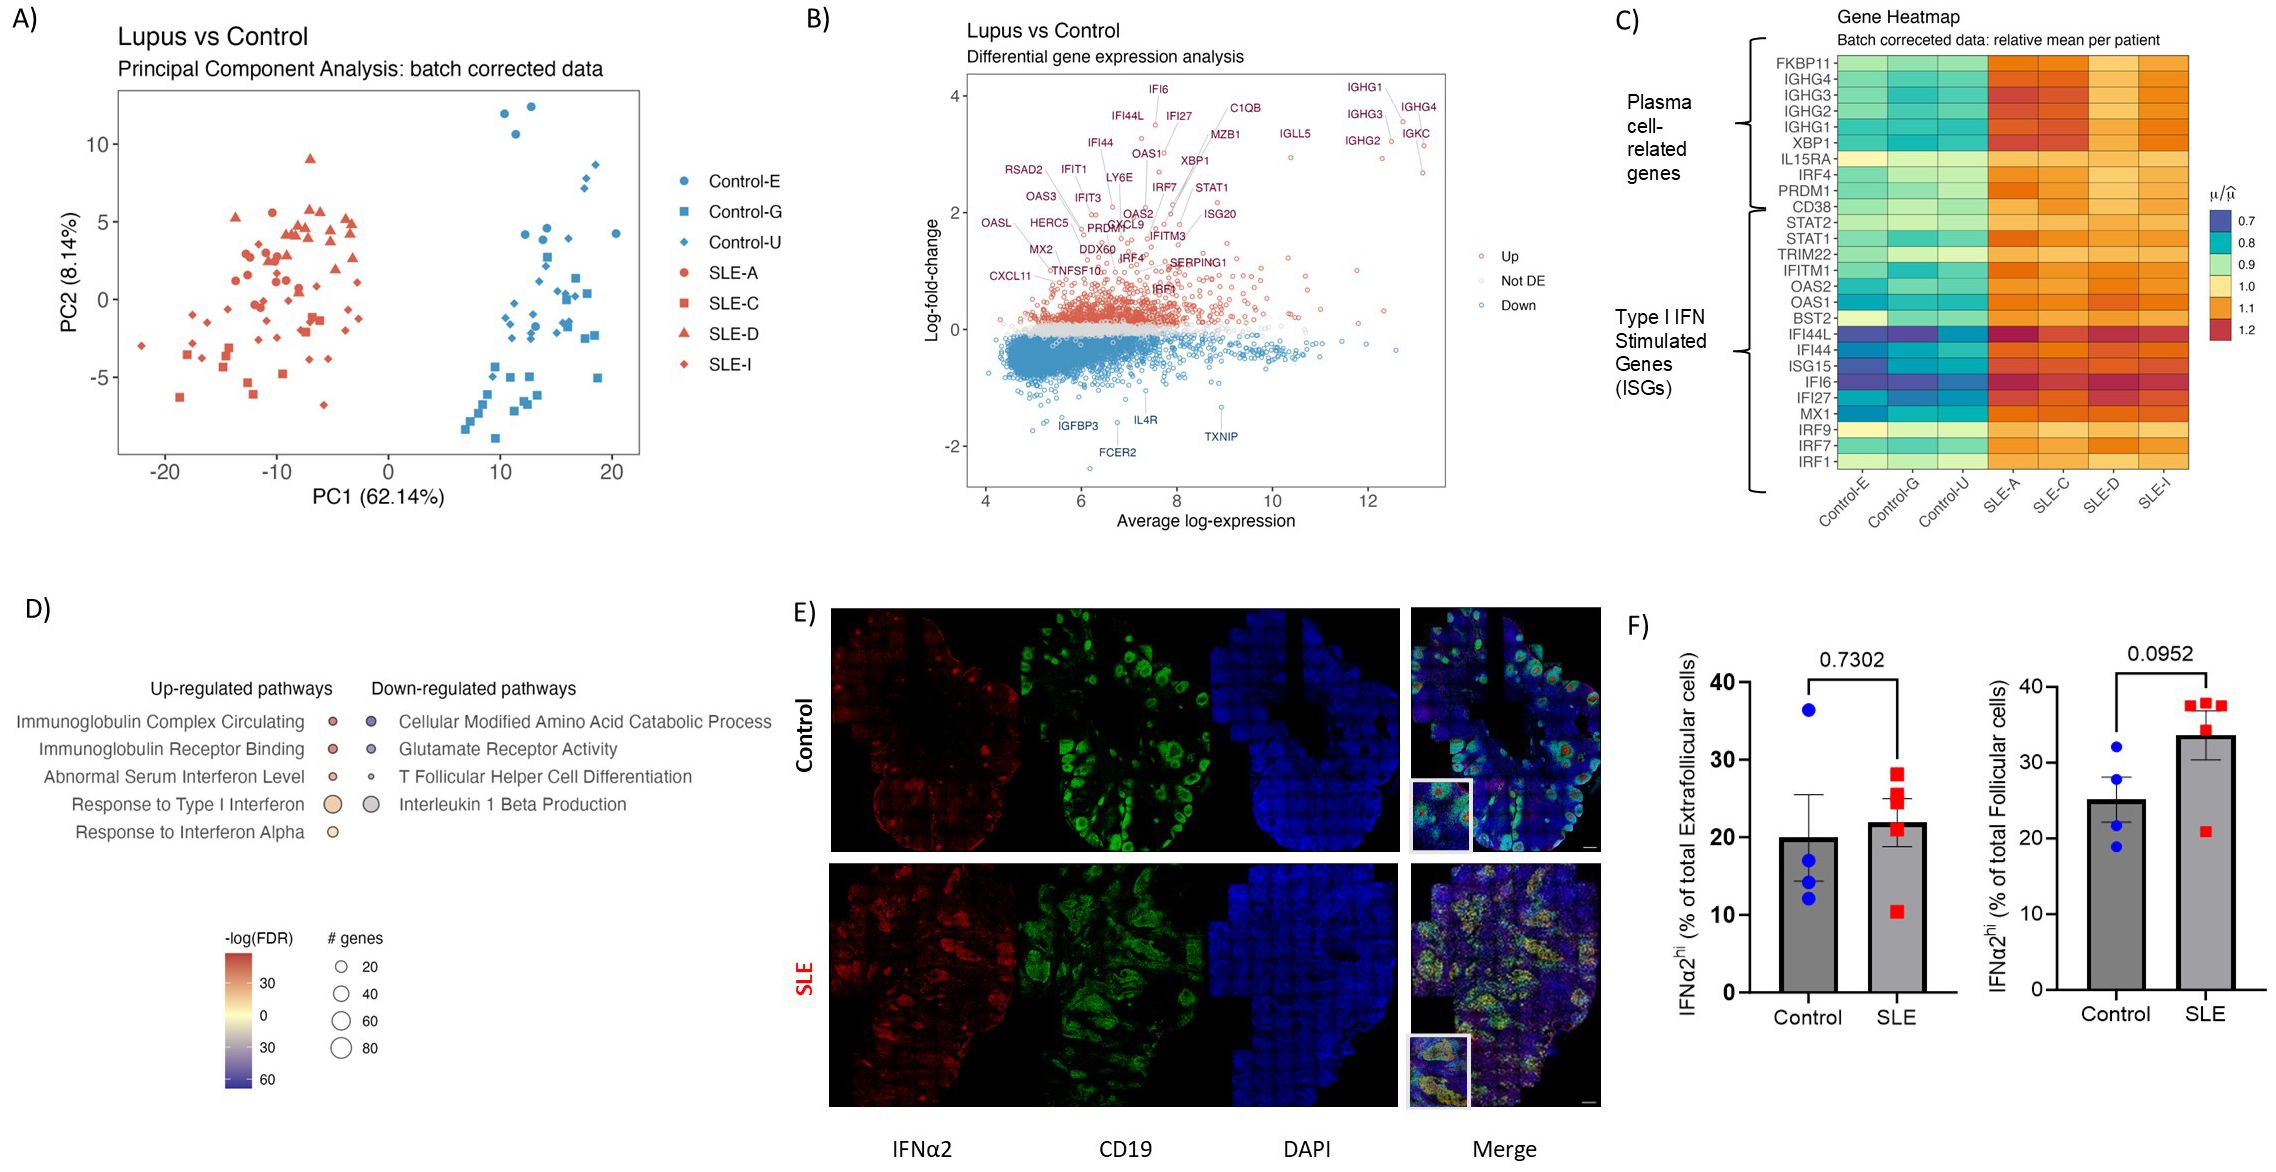
Figure 1. Spatial transcriptomics reveal a potent type I IFN and plasma cell gene signature in SLE follicles. (A) The PCA plot shows the distribution of batch corrected spatial transcriptomic data from 111 Regions of Interest (ROIs, secondary follicles) collected from SLE (N=64, 4 donors) and control LNs (N=47, 3 donors). Each point represents an individual ROI, with the color indicating the different cohort (Red=SLE, Blue=Control). (B) Volcano plot displaying the differentially expressed genes in SLE and control follicular ROIs. The x-axis represents the average log gene expression between SLE and control follicles, while the y-axis represents the log fold-change in gene expression. Selected genes with significant differential expression (FDR < 0.05) are highlighted: those upregulated in SLE are marked in red and those downregulated in SLE or upregulated in control are marked in blue. Non-significant genes are shown in gray. Selected key genes of interest are labeled. (C) Heatmap showing the relative mean expression of type I IFN (lower panel) and plasma cell (upper panel) signature genes. All genes displayed in (C) are significantly up- regulated in SLE compared to control ROIs (P value < 0.05). (D) Gene ontology pathway analysis performed on differentially expressed genes of SLE and control follicular ROIs. The size of each node represents the number of genes involved in the corresponding GO term, while the color indicates the significance level of the enrichment (-logFDR). (E) Representative mIF images of IFNα2 (red), CD19 (green) and DAPI (blue) from SLE and control LNs (scale bar: 500 μm). Zoomed areas are shown in white boxes at the bottom left of the merged image. (F) Bar graphs demonstrating the cell frequencies of extrafollicular (left) and follicular (right) IFNα2hi cells in SLE (N = 5) and control LNs (N = 4). Each dot/square represents one donor. The p values were calculated using the Mann–Whitney test. Data represent mean ± SEM.
To further validate the potent transcriptomic type I IFN signature of SLE follicles a mIF assay, using an antibody against IFN-α2 (panel 4, Supplementary Tables S2, S3), was applied (Figure 1E). To analyze and quantify IFNα2hi cells in follicles (defined as CD19-dense areas), we employed the histo-cytometry approach (40) (Supplementary Figure S2A). Contrary to extrafollicular area, a clear trend (p=0.0952) towards increased levels, both as frequency or normalized counts, of IFN-α2hi cells in SLE compared to control follicles was found (Figure 1F, Supplementary Figure S2B), further supporting our transcriptomic findings. Altogether, our findings revealed a highly inflammatory follicular microenvironment, dominated by a type I IFN signature, that could affect the development of TFH/GC-B cell responses in SLE.
Given the potential expression of IFNAR by several follicular cell types (41), we aimed to investigate the main cellular targets of the observed type I interferon transcriptomic signature in SLE. To this end, we applied a cell deconvolution pipeline using a single-cell dataset from human LNs as a reference. As an internal validation of our pipeline, we found that selected T (e.g. CD3, TRAC) and B (e.g. CD19, AICDA, MS4AI) cell genes were correctly assigned to the corresponding cell types (Supplementary Figure S2C). The approximate calculated relative proportions of T and B cells showed a dominance by B cells (≈50%) with T cells occupying a ≈25% of total deconvoluted cells as expected (Figure 2A). We then sought to determine the contribution of T, B and dendritic cell types on interferon stimulated gene (ISG) expression. First, using the full dataset, consisted of both control and SLE ROIs, we observed a higher contribution of T and dendritic cells, compared to B cells, in the observed ISG expression profile (Figure 2B). By dividing the dataset into control and SLE ROIs, we found that DCs have a higher contribution to the increased expression of ISGs in the SLE group, a finding consistent with previous single-cell RNA sequencing studies in blood suggesting that innate immune cells have a stronger IFN fingerprint than adaptive immune cells in SLE (42) (Figure 2C). Furthermore, for SLE ROIs, a pattern favoring T cell correlation with increased ISG expression compared to B cells was observed for most of the ISGs while B cell correlation was higher only in one case (IRF9) (Figure 2C). Therefore, our deconvolution approach suggests that follicular T cells are presumably more responsive to type I IFN signaling compared to B cells, despite the expression of IFNAR by both cell types.
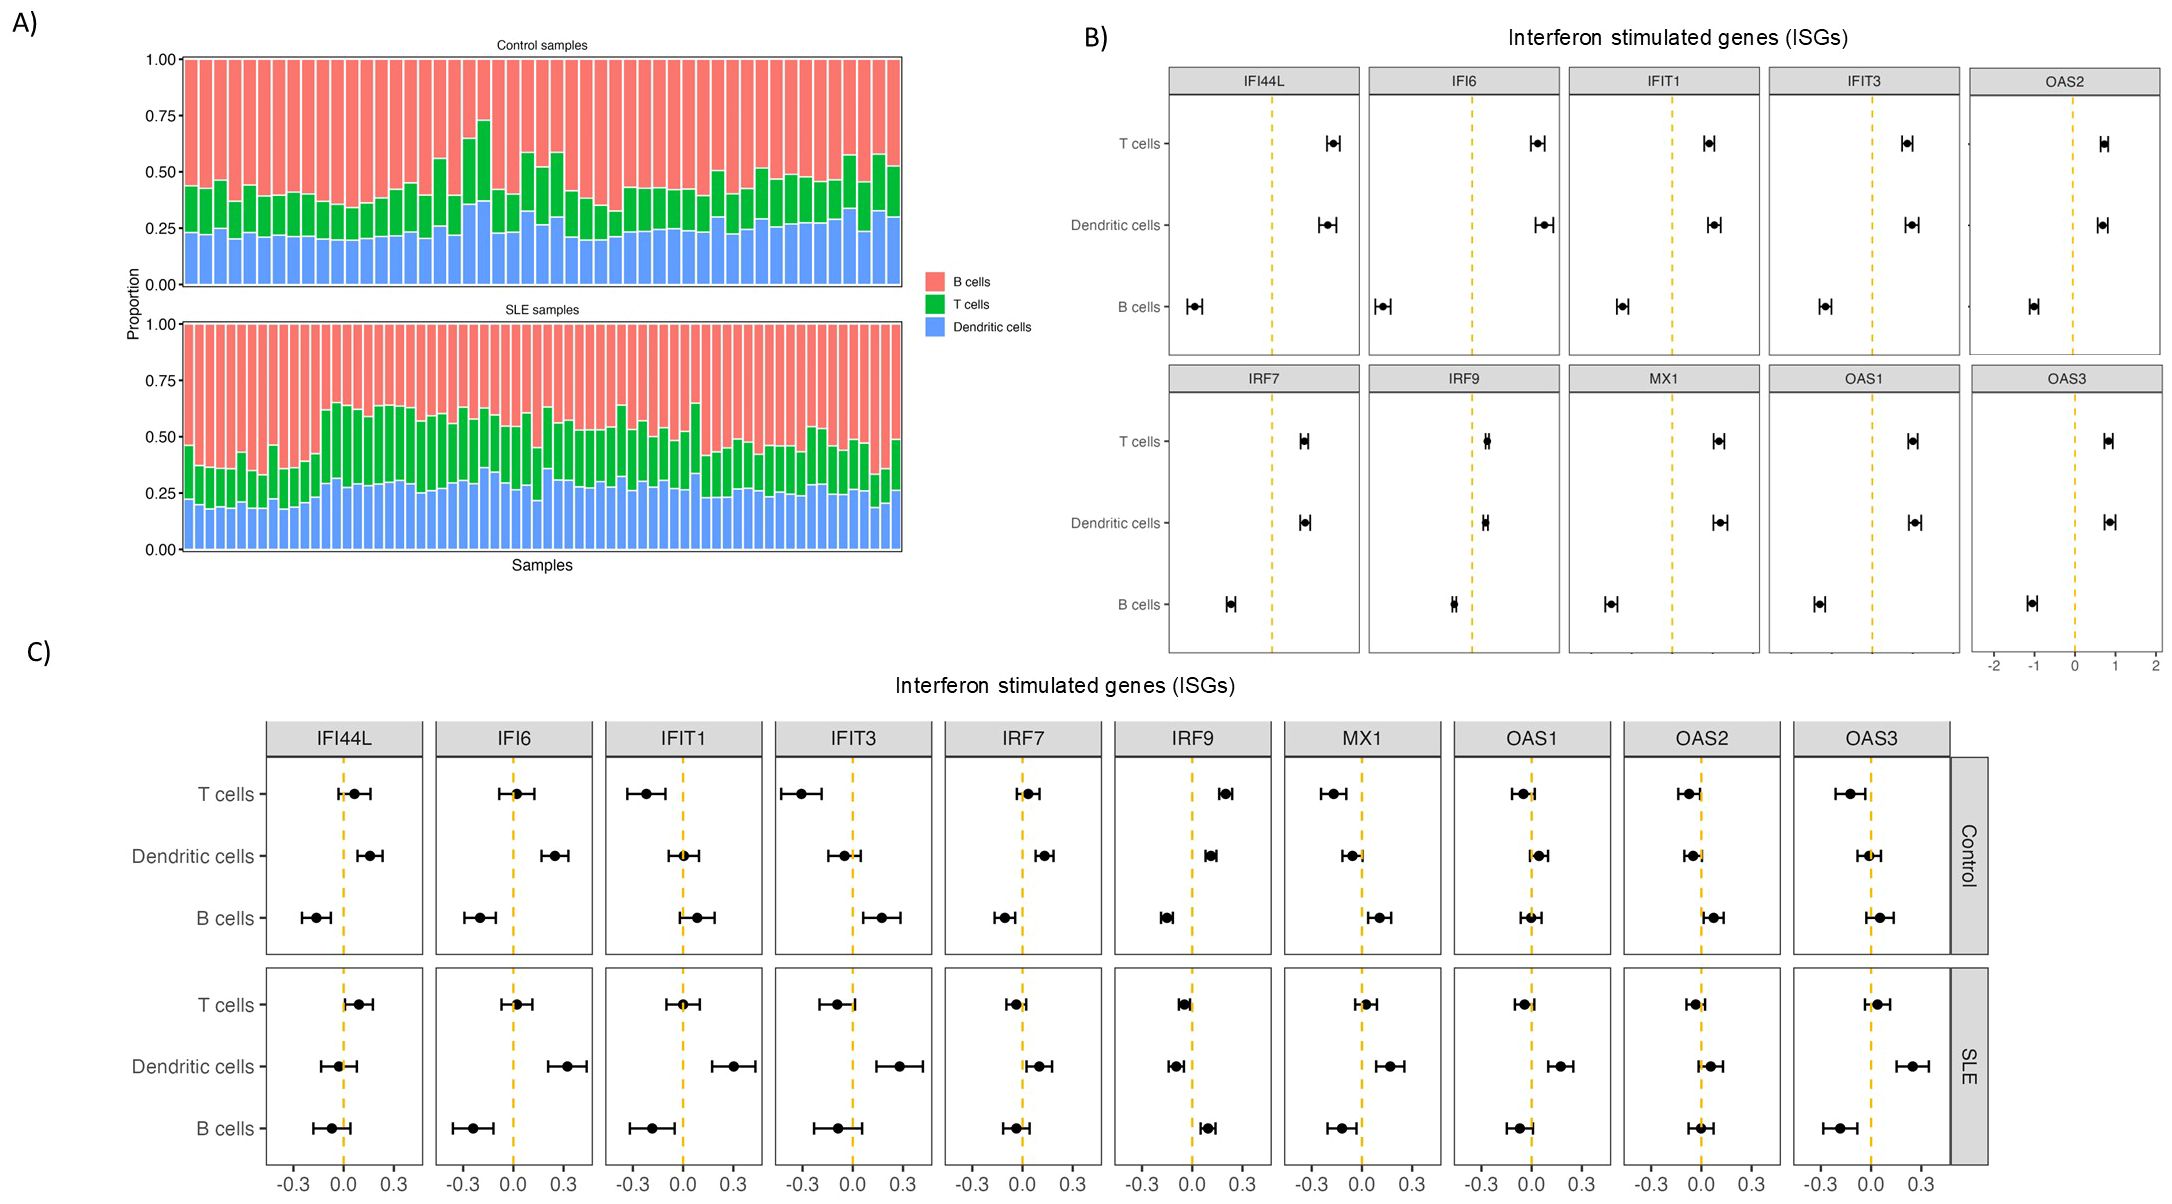
Figure 2. Follicular T cells are more affected by type I IFN signalling than B cells in SLE. (A) Bar charts showing deconvoluted GeoMx data indicating the relative abundance of different analyzed cell subsets in control and SLE ROIs. Each column represents a different ROI. Different cell subsets are labelled with different colors. (B) Graphs representing the relative correlation of deconvoluted cell subsets proportion (T, B, dendritic cells) from all the ROIs with randomly selected Interferon Stimulated genes. (C) Graphs representing the relative correlation of deconvoluted cell subsets proportion (T, B, dendritic cells) from control (upper row) and SLE (lower row) LN ROIs separately with randomly selected Interferon Stimulated genes.
The above-mentioned spatial transcriptomic profile of SLE follicles raises the possibility of dysregulated follicular immune dynamics, in particular T-cell dynamics. To this end we developed imaging panels allowing for the in-situ detection, phenotyping, and quantitative analysis of different T- and B- cell subsets (Supplementary Tables S2, S3). First, assessment of geometrical characteristics of follicular areas (identified based on the density of CD19hi/dim B cells) (Figure 3A) revealed that SLE follicles tend to be larger (p=0,08) and significantly less solid (more irregular boundaries) (p=0.008) compared to controls (Figure 3B) while a similar circularity was found between SLE and control LNS (Supplementary Figure S2D). TFH cells represent the main follicular T cell population (40). Their indispensable role for the activation, maturation of B cells and the generation of high affinity antigen-specific antibodies are well established (42). The use of PD-1 as a TFH cell biomarker (Figure 3A), showed comparable cell densities (cell counts normalized to mm2) of CD4hiPD1hi TFH cells between SLE and control follicles (Figure 3C). TFH cells were further analyzed based on the expression of Ki67 and Bcl6 (Figure 3D). In line with previous reports (18, 43), only a subset of TFH cells exhibited a proliferative capacity (Figure 3E, left panel). No significant differences were observed between control and SLE proliferating TFH cells (Figure 3E, left panel). However, the cell density of TFH cells expressing Bcl6, a master regulator of TFH cells (43) was significantly downregulated(p<0,05) in SLE compared to control LNs (Figure 3E, right panel). Therefore, the significantly altered morphology of SLE follicles is associated with a dysregulated differentiation of TFH cells characterized by the significantly reduced prevalence of Bcl6hi TFH cells.
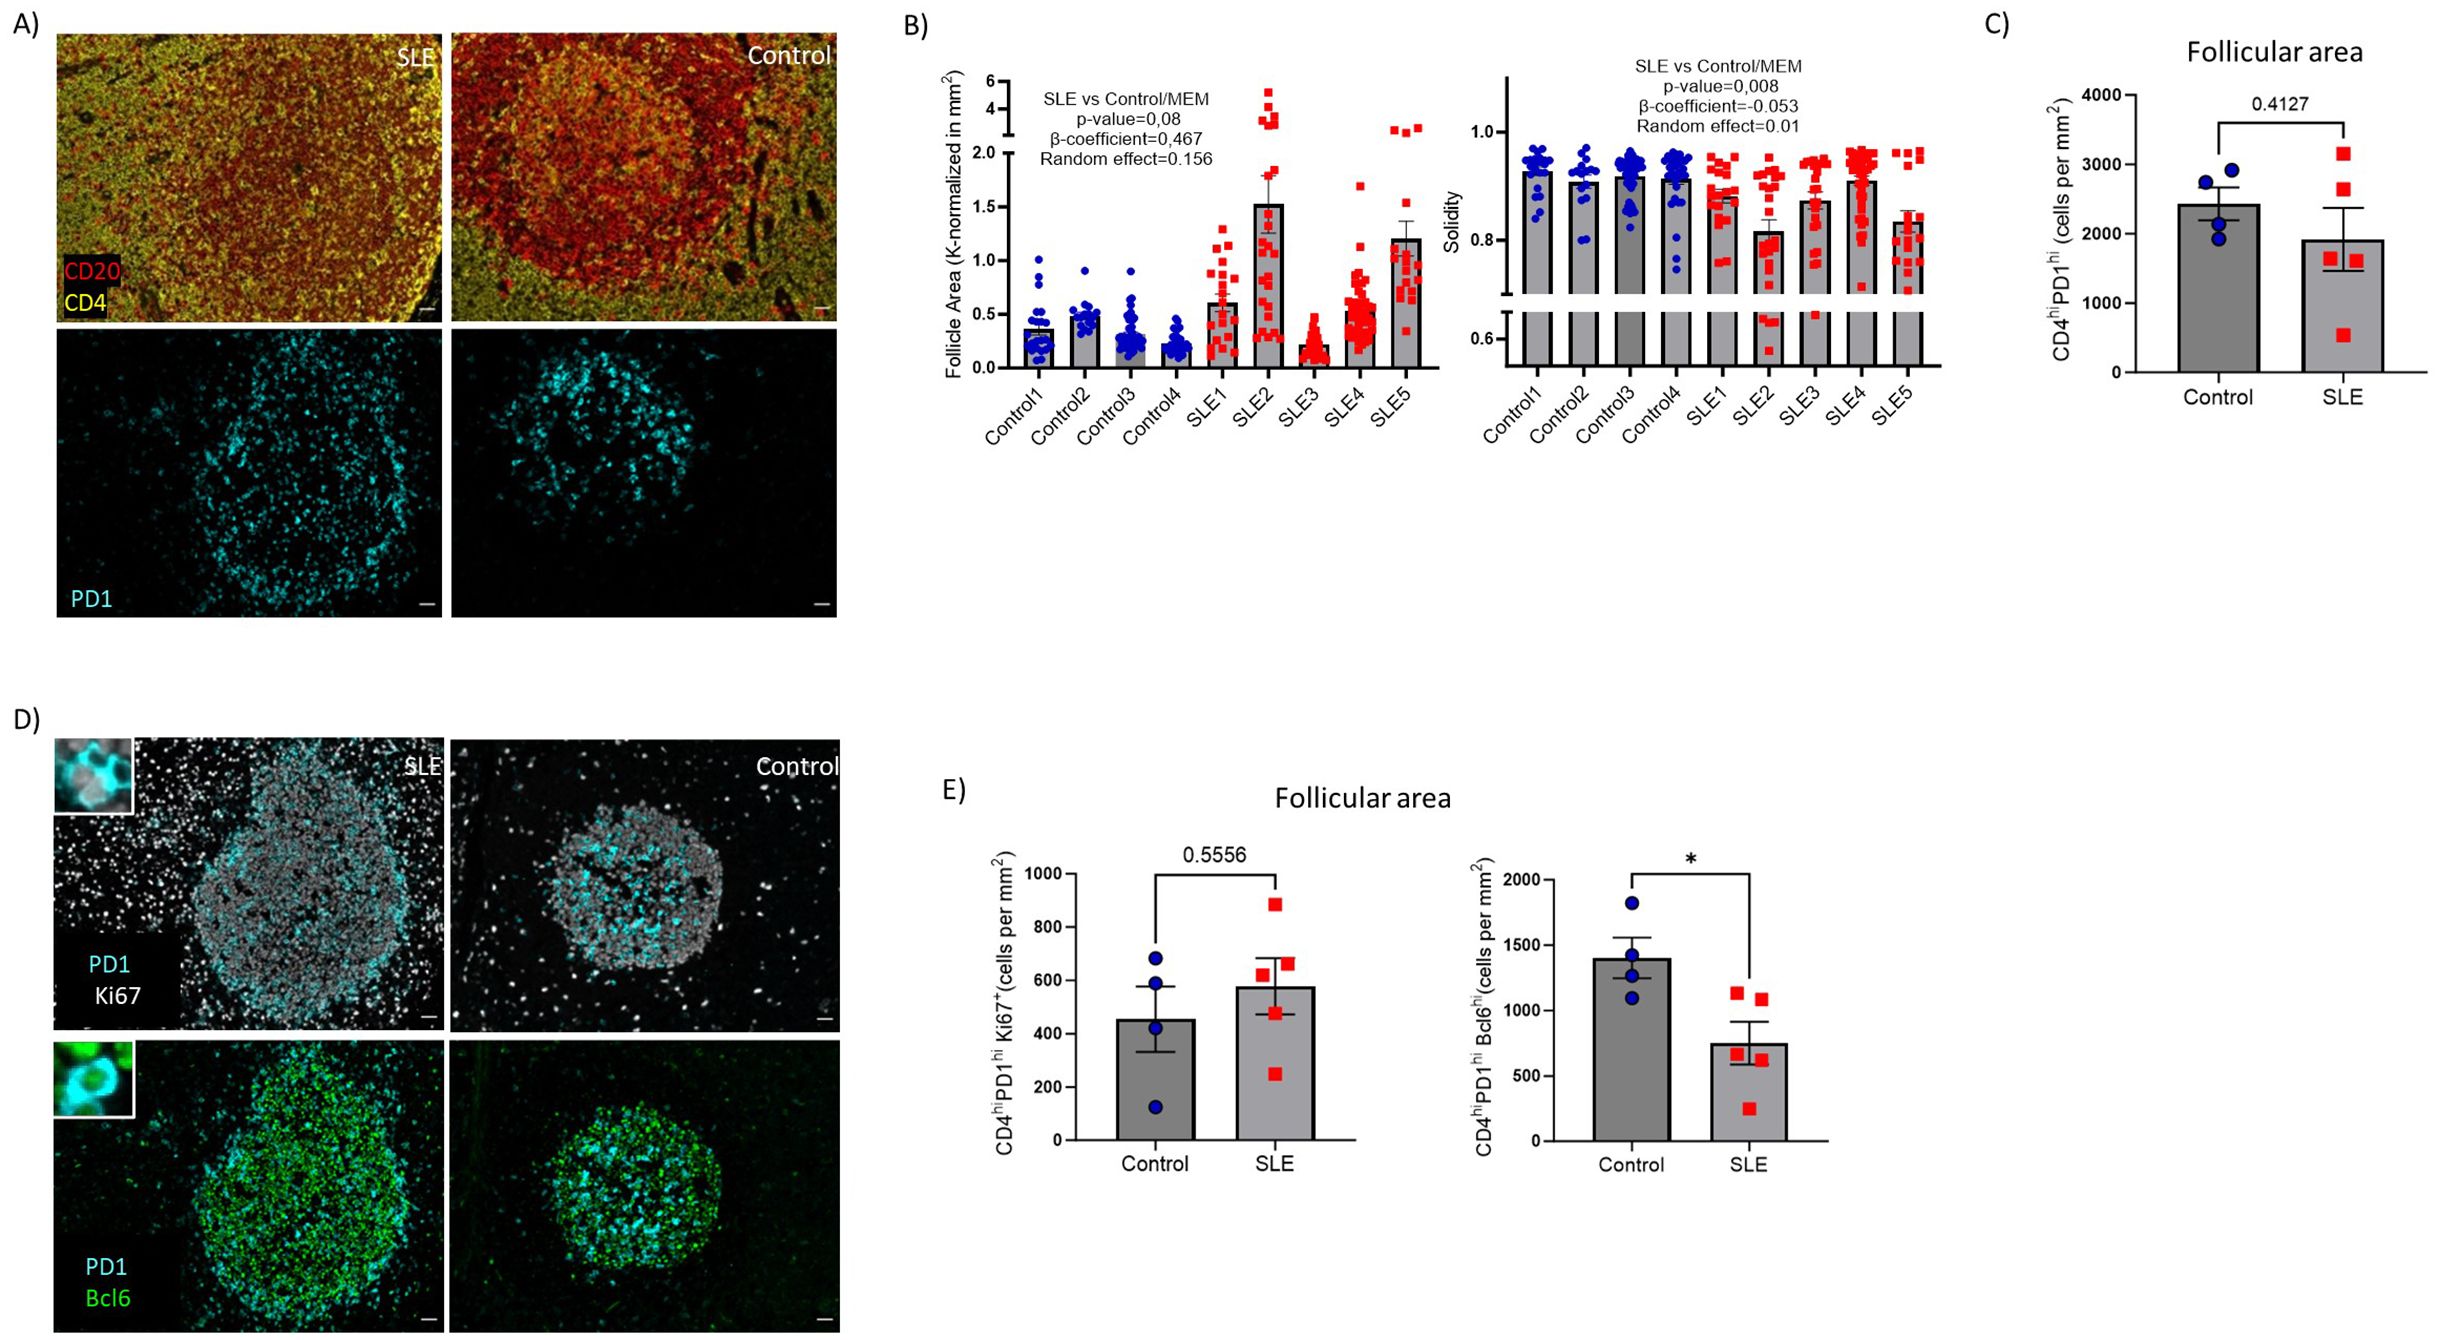
Figure 3. Decreased cell density of Bcl6hi TFH cells in SLE follicles. (A) Representative mIF images of CD20 (red), CD4 (yellow) and PD-1 (cyan) from SLE and control LNs (left panel, scale bar:20mm). (B) Bar graphs demonstrating the quantification of morphological properties (area, Solidity) of follicles (identified as CD19hi/dim areas. Area and solidity of ROIs were calculated using FIJI. Each dot/square represents a different follicle. The p values were calculated using the mixed effects model (MEM). Data represent mean ± SEM (C) Bar graph demonstrating the cell densities of CD4hiPD1hi TFH cells in SLE (N = 5) and control follicular areas (N = 4). Each dot/square represents one donor. The p values were calculated using the Mann–Whitney test. Data represent mean ± SEM. (D) Representative mIF images of Bcl6 (green), Ki67 (grey) and PD-1 (cyan) from SLE and control LNs (left panel, scale bar:20mm). Zoomed areas are shown in white boxes. (E) Bar graphs demonstrating the cell densities of CD4hiPD1hiKi67hi (upper) and CD4hiPD1hiBcl6hi (lower) TFH cells in SLE (N = 5) and control LNs (N = 4). Each dot/square symbol represents one donor. The p values were calculated using the Mann–Whitney test. Data represent mean ± SEM. *P < 0.05.
The TFH cell compartment is characterized by phenotypical and functional heterogeneity. A relatively high expression of GATA-3, a transcription factor associated with IL-4 production, has been described in human follicular areas by TFH cells (19, 44, 45). Moreover, CD57 expression of TFH cells has been associated with a unique position, molecular and functional profile (18, 46, 47). Furthermore, CD57hi TFH cells were found to be potent producers of IL-4 compared to CD57lo TFH cells, at least in vitro (18). Therefore, we investigated the in situ phenotype of TFH cells with respect to CD57 and GATA-3 expression (panel 3, Supplementary Tables S2, S3) (Figures 4A, B, Supplementary Figure S3A) by employing histo-cytometry analysis (Supplementary Figure S3B). In line with the data generated from our panel 1 (Figures 3C, E), we measured similar cell densities for PD1hi, PD1hi Ki67hi cells between SLE and control LNs (Figure 4C). However, a clear trend (p=0.06) for reduced PD1hiCD57hiGATA3hi TFH cell densities was revealed in SLE compared to control follicles (Figure 4C). A similar trend between control and SLE follicles was found when the relative frequencies of CD57hiGATA3hi TFH cells (% of PD1hi cells) were plotted (Figure 4C, right panel).
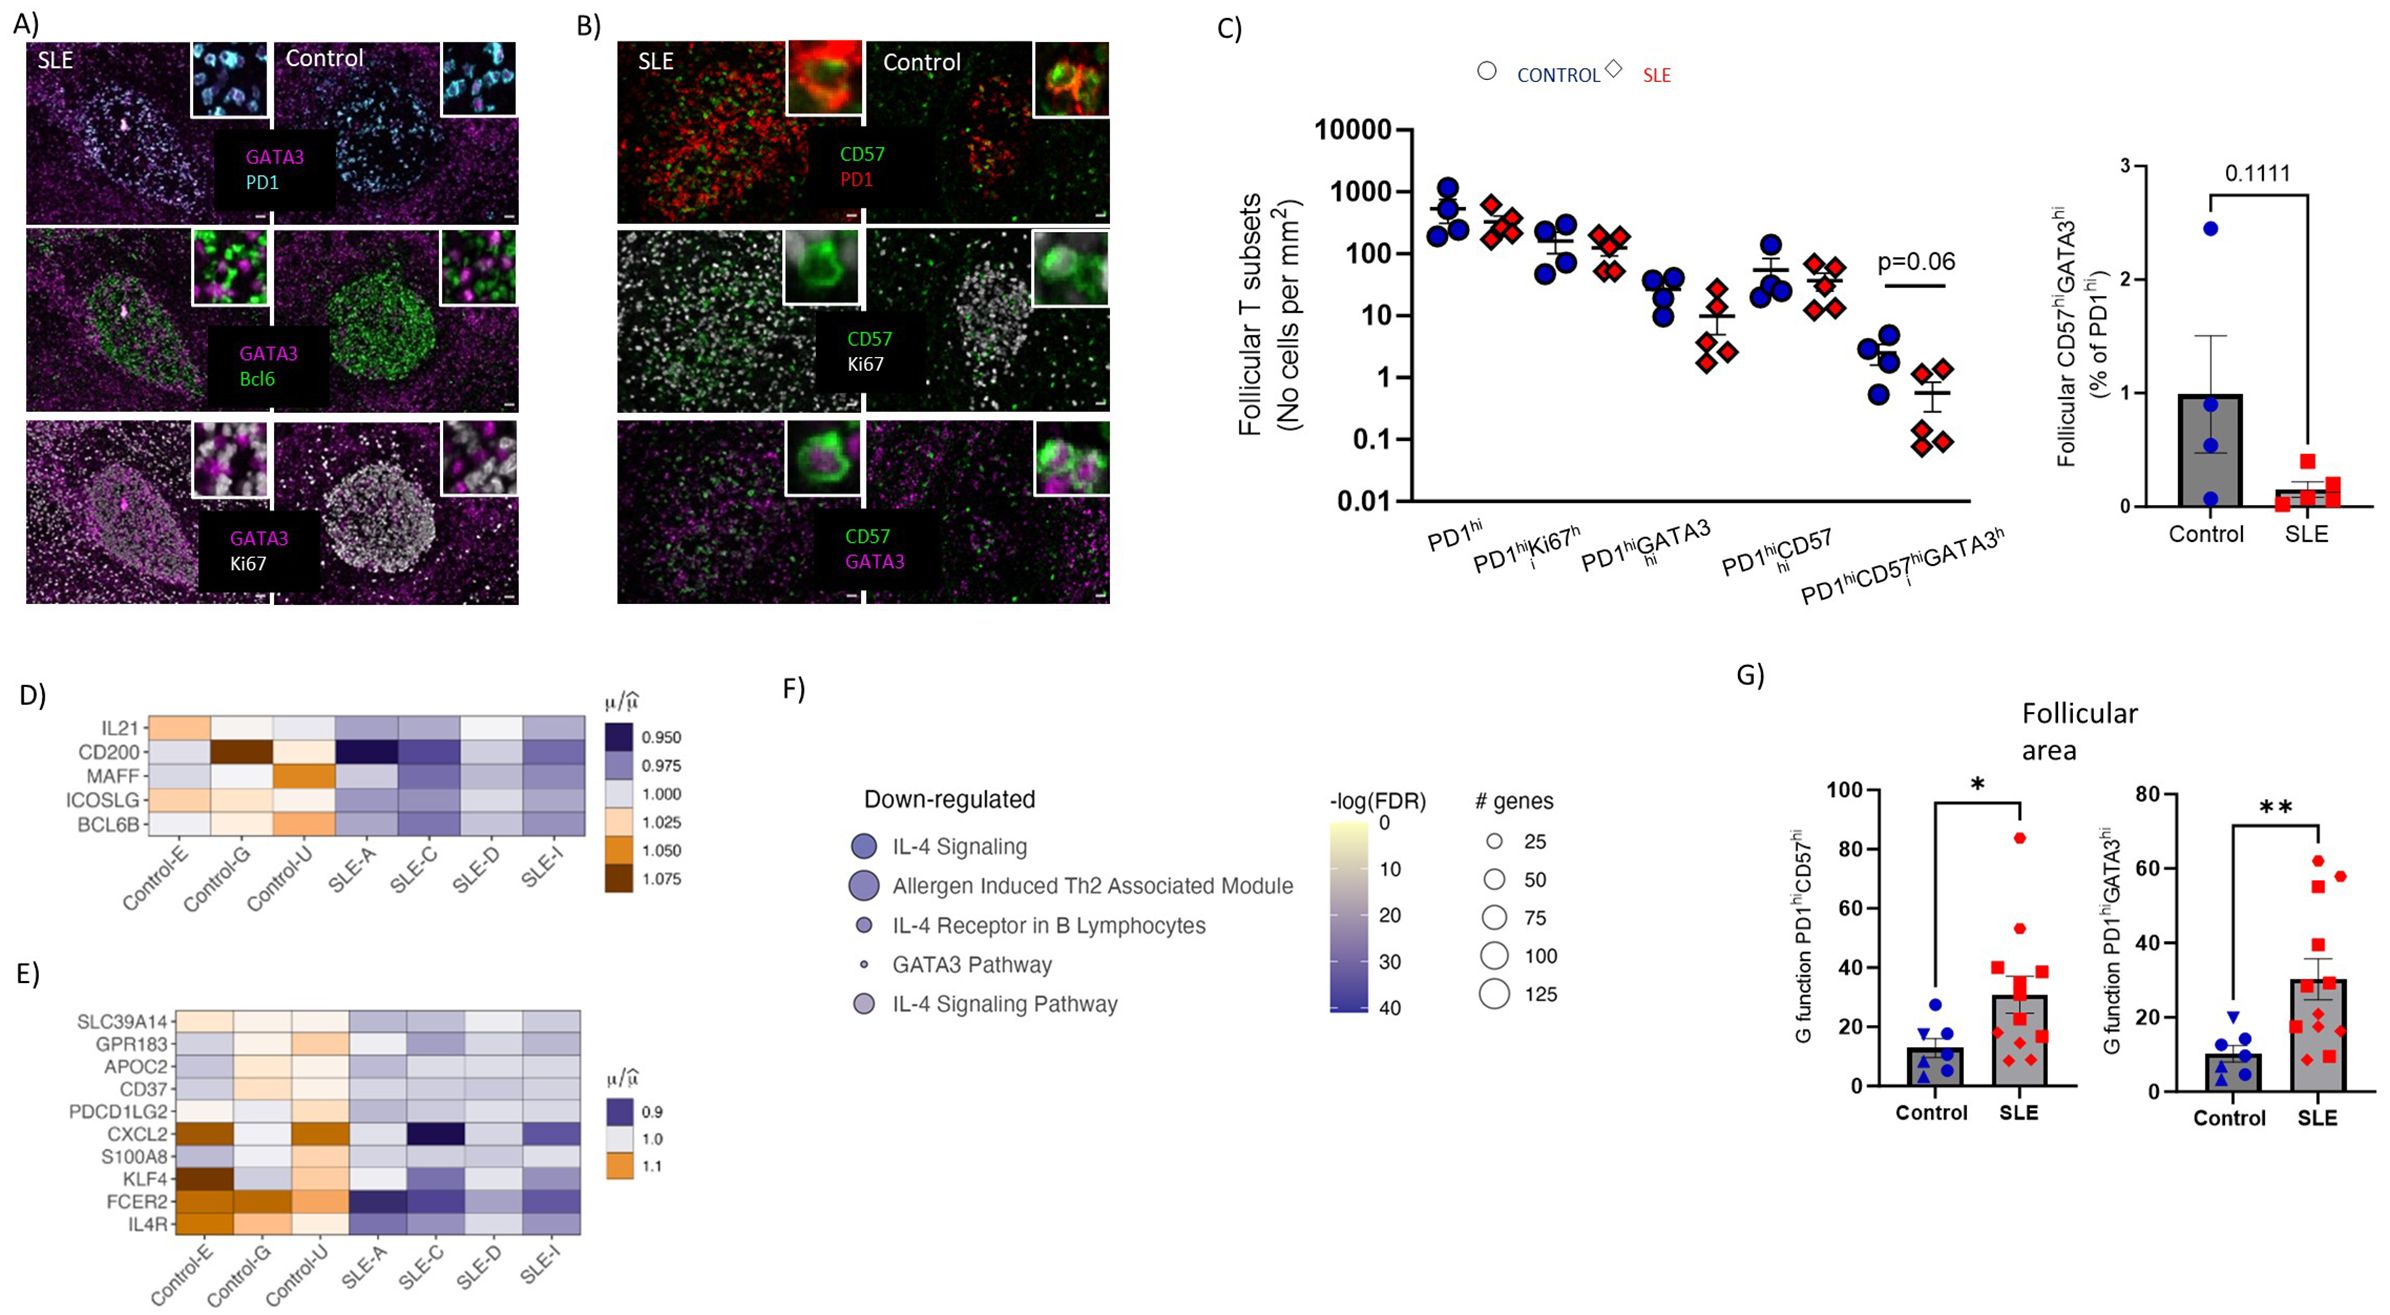
Figure 4. Underrepresentation of potential IL4-TFH cell producers and impaired IL4-gene signature in SLE follicles. (A) Representative mIF images of GATA-3 (magenta), Bcl6 (green), Ki67 (grey) and PD-1 (cyan) from SLE and control LNs (scale bar:20mm). Zoomed areas are shown in white boxes. (B) Representative mIF images of GATA-3 (magenta), CD57 (green), Ki67 (grey) and PD-1 (red) from SLE and control LNs (scale bar:20mm). Zoomed areas are shown in white boxes. (C) Graph (left) demonstrating the follicular cell densities of PD1hi, PD1hiKi67hi, PD1hiGATA3hi, PD1hiCD57hi and PD1hiCD57hiGATA3hi TFH cells in SLE (N = 5) and control LNs (N = 4). Bar graph demonstrating the CD57hiGATA3hi frequencies of total PD1hi cells in SLE (N = 5) and control LNs (N = 4). Each dot/square represents one donor. The p values were calculated using the Mann–Whitney test. Data represent mean ± SEM. (D) Heatmap showing the relative mean expression of genes associated with TFH differentiation. All genes displayed in (D) are significantly downregulated in SLE compared to control ROIs (P value < 0.05). (E) Heatmap showing the relative mean expression of IL4-stimulated genes. All genes displayed in (E) are significantly downregulated in SLE compared to control ROIs (P value < 0.05). (F) Reactome pathway analysis performed on differentially expressed genes of SLE and control follicular ROIs. The size of each node represents the number of genes involved in the corresponding Reactome term, while the color indicates the significance level of the enrichment (-logFDR). (G) Bar graphs showing the (G) function analysis for PD1hiGATA3hi (right) and PD1hiCD57hi (left) cells in individual follicles from control (N=7) and SLE (N=12) LNs. Each symbol represents a follicle. Different shapes represent different donors. The p values were calculated using the Mann–Whitney test. Data represent mean ± SEM. Only follicles harboring more than 20 cell events were analyzed. *P < 0.05; **P < 0.01.
To further investigate the perturbed differentiation of TFH cells observed in SLE follicles, the gene expression of molecules that could mediate TFH cell differentiation (IL21, CD200, MAFF, ICOSLG, Bcl6b) were analyzed using our spatial transcriptomic data. These genes, which can be expressed by more than one cell type, were downregulated in SLE compared to control follicles (Figure 4D). Taking into consideration that IL-4 is expressed mainly, if not exclusively, from T cells we reasoned that the reduced presence of potential IL4-producing TFH cells would have an impact on IL4-related genes of SLE follicles. Indeed, SLE follicular areas exhibited a downregulated IL-4 signaling gene signature compared to controls, further supporting our imaging findings (Figure 4E). Furthermore, pathway analysis revealed that IL-4 related pathways were enriched in control compared to SLE follicles (Figure 4F). In addition to their capacity for secretion of critical cytokines (e.g. IL-21, IL-4), spatial positioning of TFH cells is crucial for their optimal interaction with neighboring GC-B cells. To this end, the distribution profile (judged by the ‘G function’ parameter (48) of TFH cell subsets was calculated. Follicles with at least 20 cells for each of the cell types were investigated, precluding thus the analysis of PD1hiCD57hiGATA3hi TFH cells. However, PD1hiCD57hi and PD1hiGATA3hi TFH cells showed a significantly higher dispersed distribution in SLE compared to control follicles (Figure 4G) that could affect their interaction with B cells within the follicular areas. In conclusion, reduced cell densities of PD1hiCD57hiGATA3hi cells in follicles could lead to impaired IL4-related responses, which may affect the development and the maturation of GC B cells.
Then we focused our investigation on analyzing relevant B cell subsets (panel 1, Supplementary Tables S2, S3) in follicular Regions of Interest (ROIs) identified based on the expression pattern of CD20 and Ki67 (CD20hi/dimKi67lo-follicular enriched in Mantle Zone, hereafter F-non-GC and CD20hi/dimKi67hi/dim-follicular enriched in LZ/DL, hereafter F/GC) (Figure 5A, Supplementary Figure S4A). Contrary to SLE, a consistently higher number of CD20hi/dim B cells in the F/GC compared to F/non-GC follicular area was monitored in control LNs (Figure 5B). Within the F/GC area, however, no significant differences of bulk CD20hi/dim or CD20hi/dimKi67hi B cell density were observed between control and SLE LNs (Figure 5C, upper panel, Supplementary Figure S4B). Notably, a clear trend (p=0.0635) for lower cell density of CD20hi/dimBcl6hi B cells was found in SLE to control F/GCs (Figure 5C, upper panel). Proliferating CD20hi/dim B cells expressing Bcl6 (CD20hi/dimBcl6hiKi67hi, dominating the Dark Zone) exhibited similar cell densities whereas their non-proliferating counterparts (CD20hi/dimBcl6hiKi67lo, mainly found in the Light Zone) were significantly decreased in SLE compared to control F/GCs (Figure 5C, lower panel).
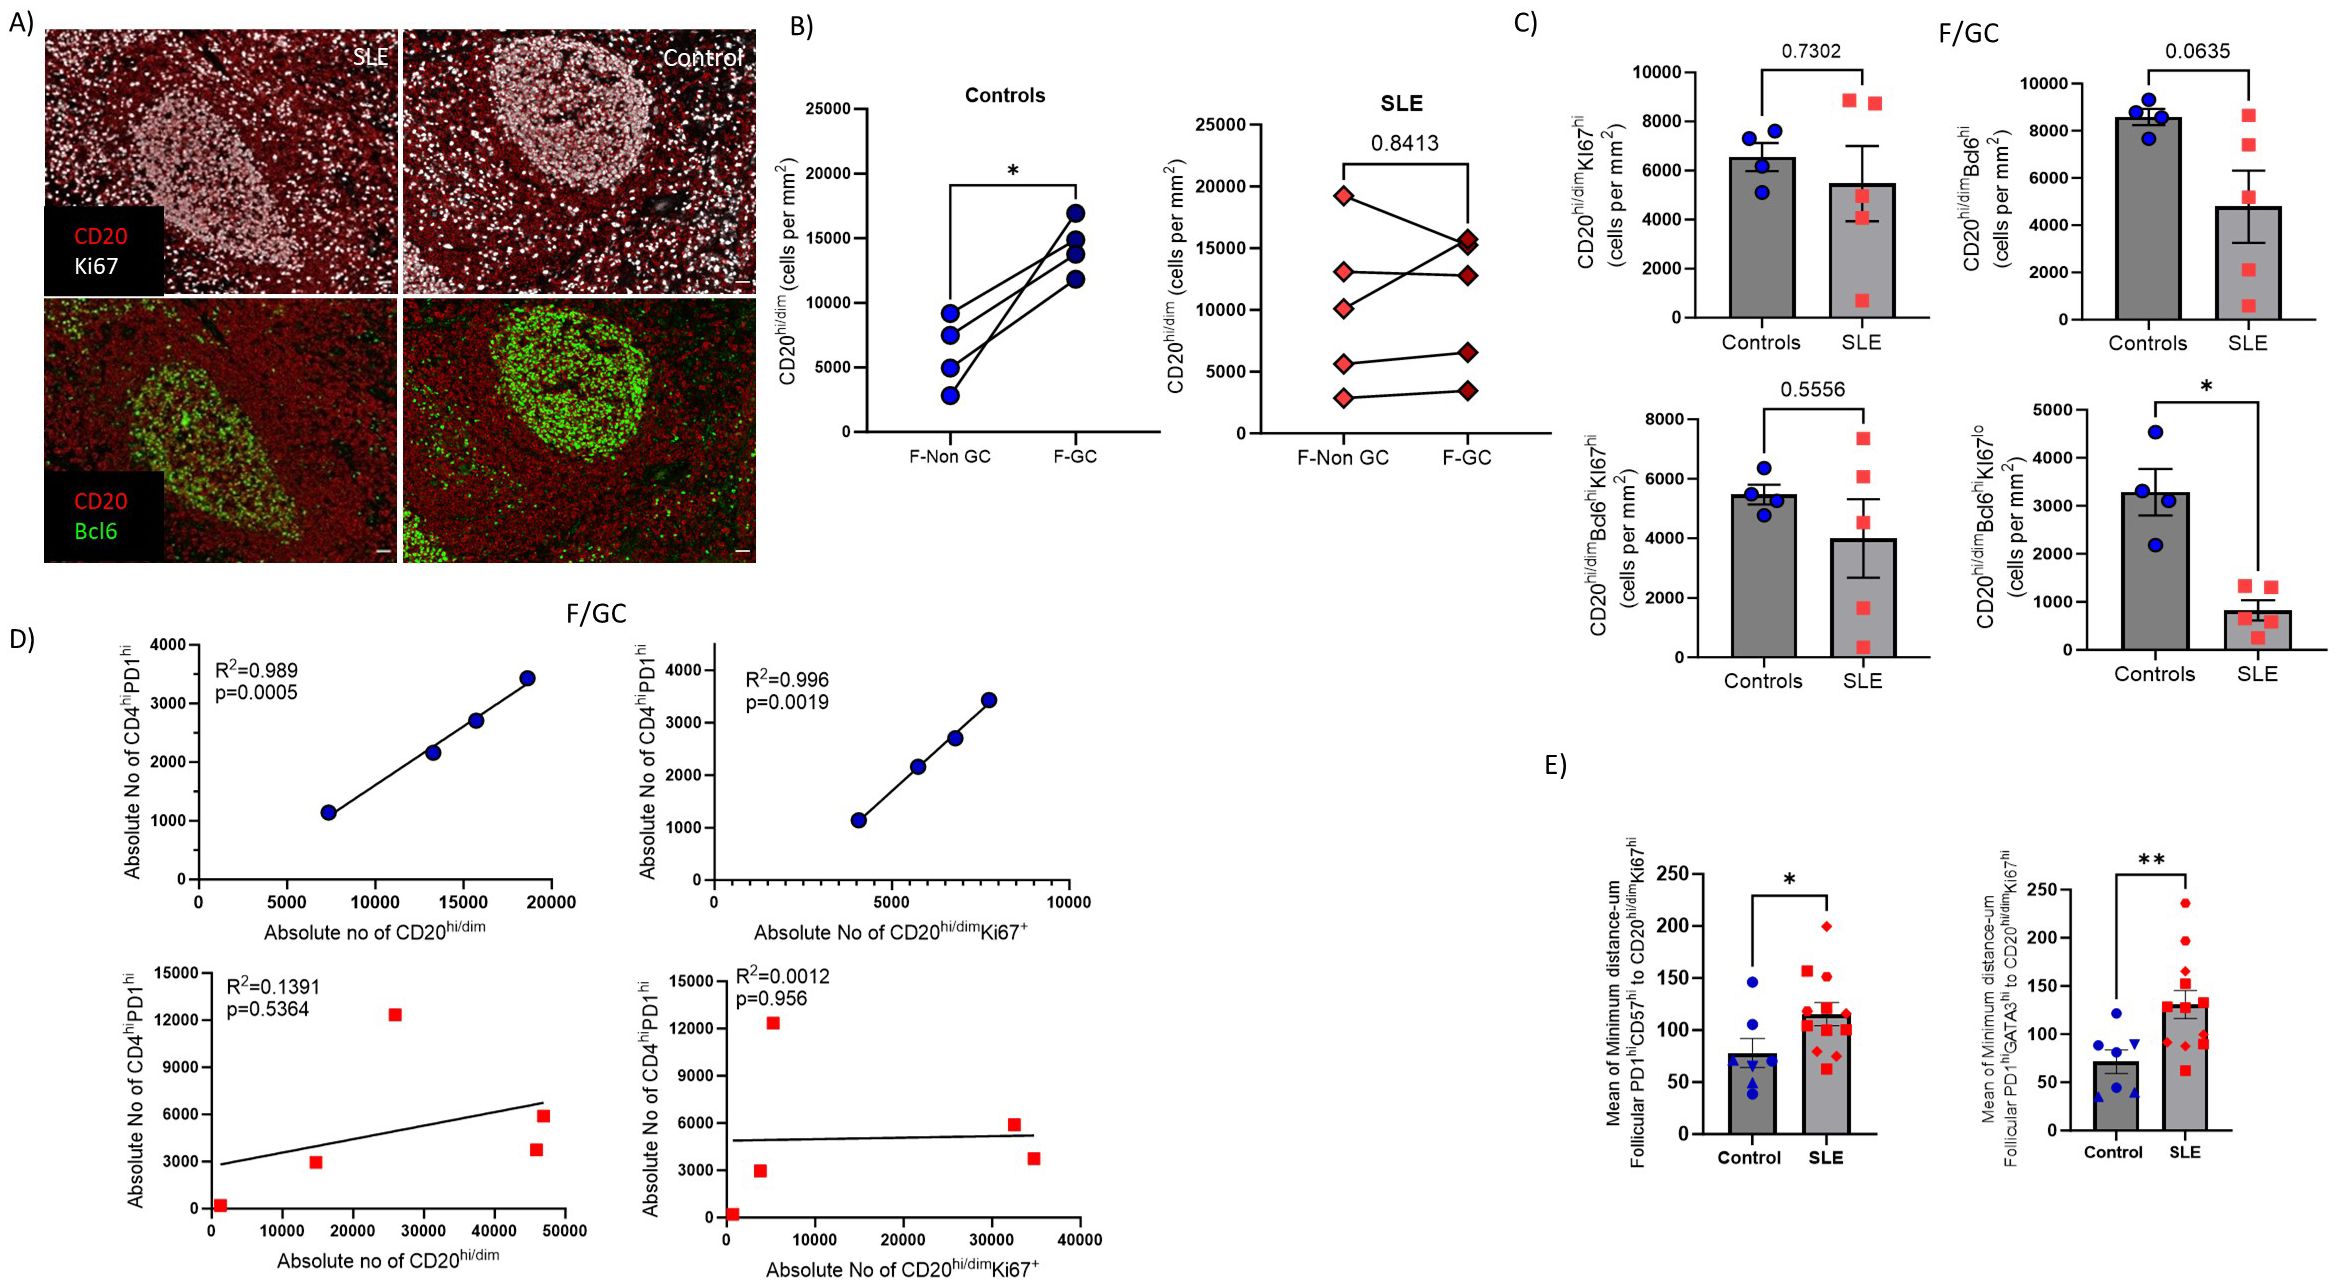
Figure 5. SLE F/GCs are characterized by reduced cell densities of CD20hi/dimBcl6hi B cells and by loss of association with TFH cells. (A) Representative mIF images of CD20 (red), Bcl6 (green) and Ki67 (grey) staining patterns from SLE and control LNs (scale bar:20mm) (B) Dot plots demonstrating CD20hi cell densities between GC and non-GC areas of control (left, N=4) and SLE (right, N=5) follicular areas. The p values were calculated using the Mann–Whitney test. (C) Bar graphs demonstrating the cell densities (cell counts normalized per mm2) of GC- CD20hi/dimKi67hi (upper left), CD20hi/dimBcl6hi, (upper right), CD20hi/dimBcl6hiKi67hi (lower left) and CD20hi/dimBcl6hiKi67lo (lower right) B cells in SLE (N = 5) and control F/GCs (N = 4). Each dot/square represents one donor. The p values were calculated using the Mann–Whitney test. Data represent mean ± SEM. (D) Linear regression analysis between F/GC CD4hiPD1hi with CD20hi/dim (left) and between CD4hiPD1hi and CD20hi/dimKi67hi (right) cell densities in controls (upper) and SLE (lower) follicles. Each symbol represents one donor. (E) Bar graphs showing the mean of minimum distance values (between PD1hiGATA3hi(right) or PD1hiCD57hi (left) and CD20hi/dim Ki67hi in individual follicles from control and SLE LNs. Each symbol represents a follicle. Different shapes represent different donors. The p values were calculated using the Mann–Whitney test. Data represent mean ± SEM. Only follicles harboring more than 20 cell events were analyzed. *P < 0.05; **P < 0.01.
Given the mutual regulation between TFH and GC B cells (49), we asked whether the counts of these two immune cell types are correlated in our tissue cohort. A significant correlation between TFH and GC-B cells was found only in control LNs further supporting our hypothesis of deregulated GC-responses in SLE (Figure 5D). As a surrogate of T/B cell proximity, presumably reflecting the possibility for their interaction too, we measured the minimum Euclidean distances between TFH and CD20hi/dimKi67hi B cells (enriched in dark zone). The minimum number of cells required per F/GC for this analysis excluded PD1hiCD57hiGATA3hi TFH cells from this comparison. However, a significantly greater minimum distance between PD1hiCD57hi or PD1hiGATA3hi TFH and CD20hi/dimKi67hi B cells was found in SLE compared to control F/GCs (Figure 5E) suggesting a lower possibility for TFH-B cell interaction in SLE. Therefore, SLE F/GCs are characterized by a concomitant dysregulated dynamics of both TFH and B cells.
Disturbed B cell differentiation/maturation can lead to the generation of pathogenic B cell subsets like Age-associated B cells (50). ABCs (CD19hi/dimCD11chiTbethi) are crucial mediators of SLE autoreactive humoral responses (51). Our mIF assay (panel 4, Supplementary Tables S2, S3) (Figure 6A, Supplementary Figure S4C) showed increased prevalence (both as frequencies and cell density) of CD11chi/dimTbethi B cells in SLE follicular (CD19-dense areas) and especially extrafollicular areas (p<0,05), compared to control LNs, regardless the gender of SLE individuals (Figure 6B). Furthermore, we found a positive correlation between extrafollicular ABC and extrafollicular or follicular IFNα2hi cell densities in SLE LNs (Figure 6C). Notably, the strongest positive correlation was observed between the follicular IFNα2hi and extrafollicular ABC cell densities (Figure 6C). Therefore, the dominant follicular type I IFN signature and the increased generation of atypical B cell subsets in the extrafollicular area may represent molecular and cellular mechanisms contributing to the described dysregulated development of GC-B cell responses in SLE follicles.
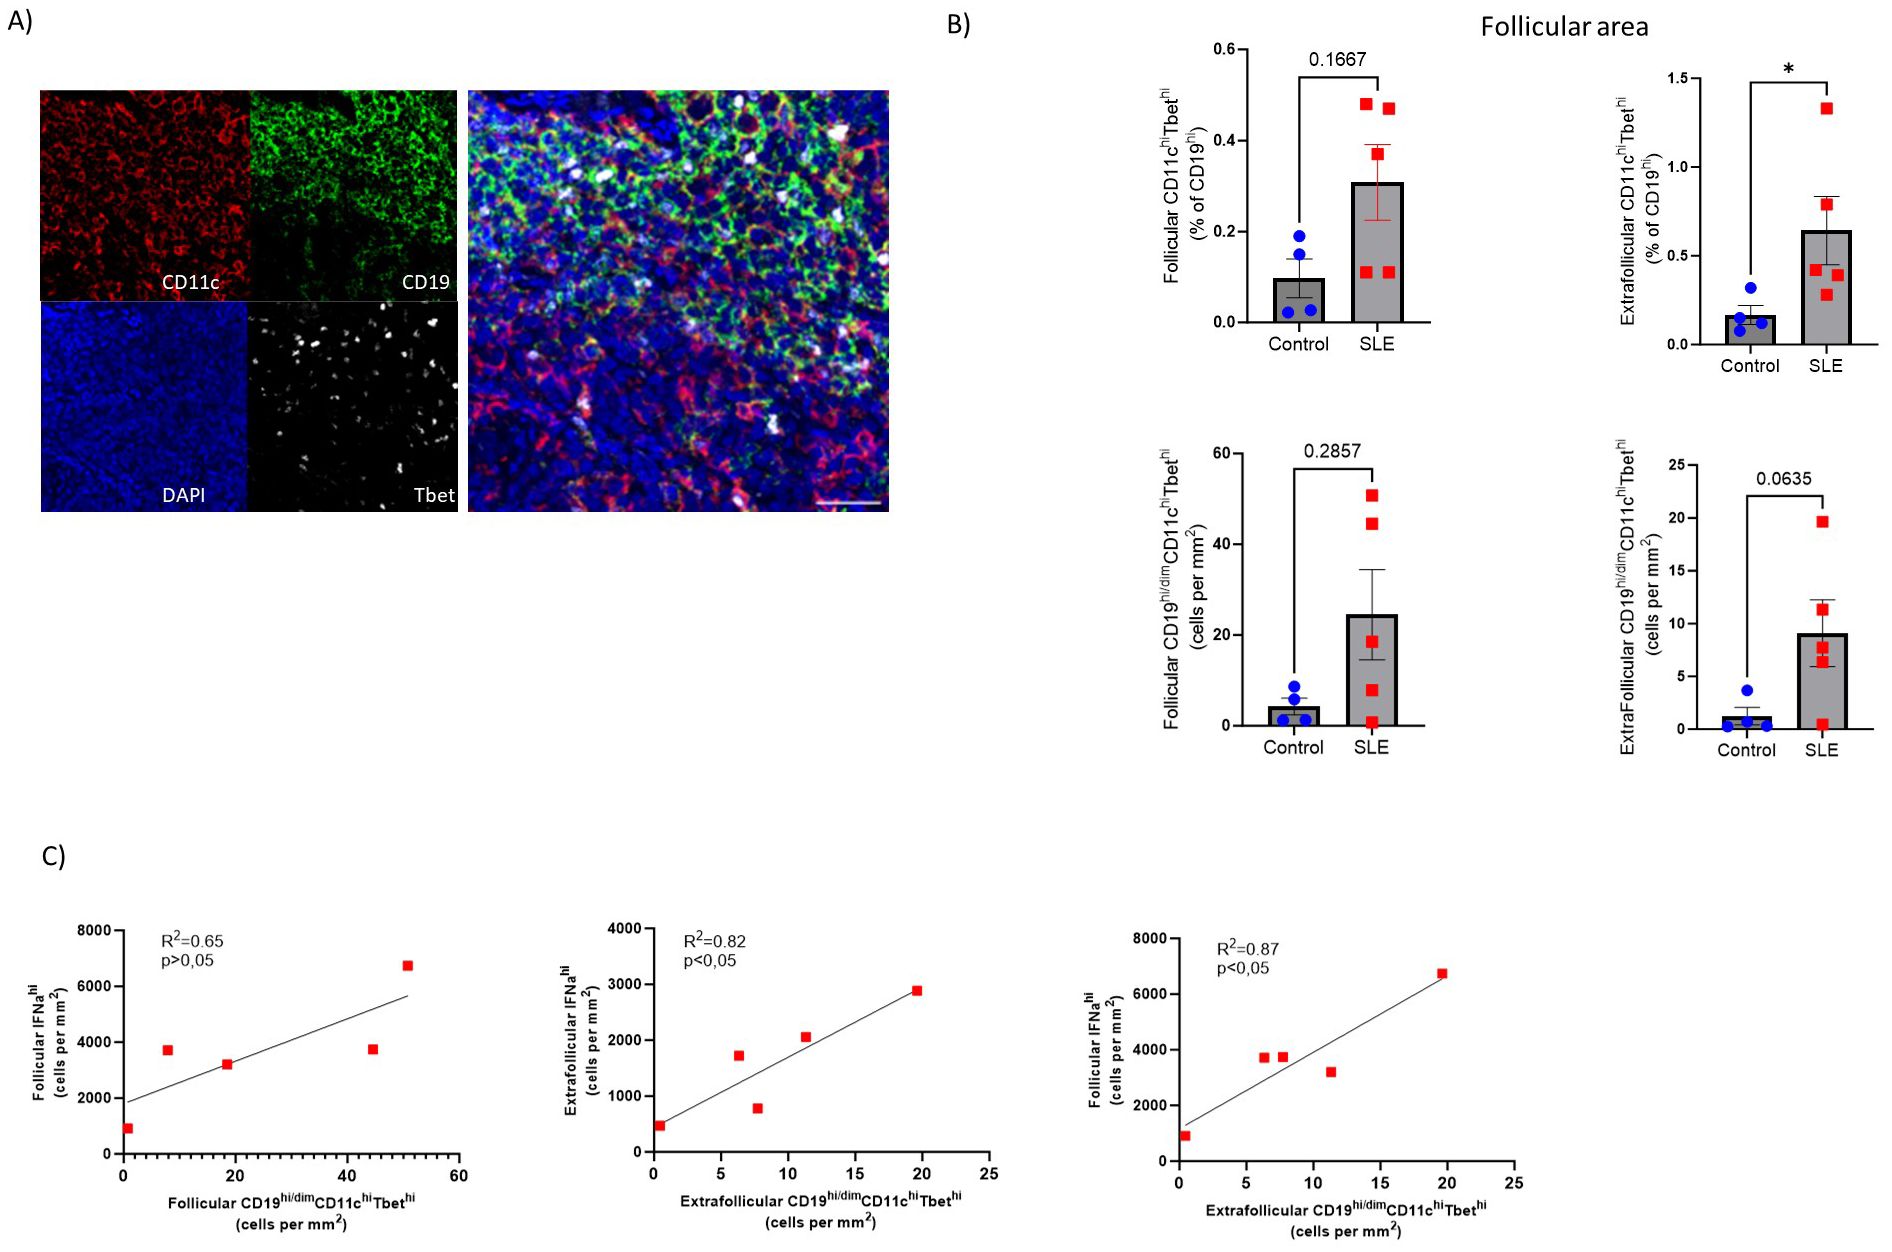
Figure 6. Accumulation of extrafollicular CD19hi/dimCD11chiTbethi B cells in SLE LNs (A) Representative mIF images of CD11c (red), CD19 (green), Tbet (grey) and DAPI (blue) from a SLE LN (40X, scale bar:30μM). (B) Bar graphs demonstrating the frequencies (upper, % CD11chiTbethi of CD19hi/dim cells) and cell densities (lower) of follicular (left) and extrafollicular (right) CD19hi/dimCD11chiTbethi B cells in SLE (N=5) and control LNs (N=4). Each dot/square represents one donor. The p values were calculated using the Mann–Whitney test. Data represent mean ± SEM. (C) Linear regression analysis between follicular IFNα2hi and follicular CD19hi/dimCD11chiTbethi (upper left), extrafollicular IFNα2hi and extrafollicular CD19hi/dimCD11chiTbethi (upper right) and follicular IFNα2hi with extrafollicular CD19hiCD11chiTbethi normalized cell counts (lower middle) of SLE LNs (N = 5). Each dot/square represents one donor. *P < 0.05.
Given the transcriptomic profile dominated by type I IFN in SLE follicles, we sought to analyze the expression of critical soluble mediators as well as innate immunity subsets in our tissue cohort. First, a mIF assay allowing for the analysis of CD20, FDC, IL-21 and CXCL13 (panel 5, Supplementary Tables S2, S3) was applied (Figure 7A). Our gating strategy allowed us to analyze IL2-1hi and CXCL13hi cells in both follicular and extrafollicular areas (Figure 7B). Contrary to FDC associated IL21 (Supplementary Figure S5A, left panel), follicular IL21hiFDClo positive cells were more abundant in SLE (p=0.057) compared to control follicles (Figure 7C, left panel). A similar but less evident profile (p=0.1143) was found for the extrafollicular IL21hi cells (Figure 7C, right panel). No differences were found when the cell densities of CXCL13hi cells were analyzed either in extrafollicular (Figure 7D) or follicular (Figure 7D, Supplementary Figure S5A right panel) areas of SLE and control LNs.
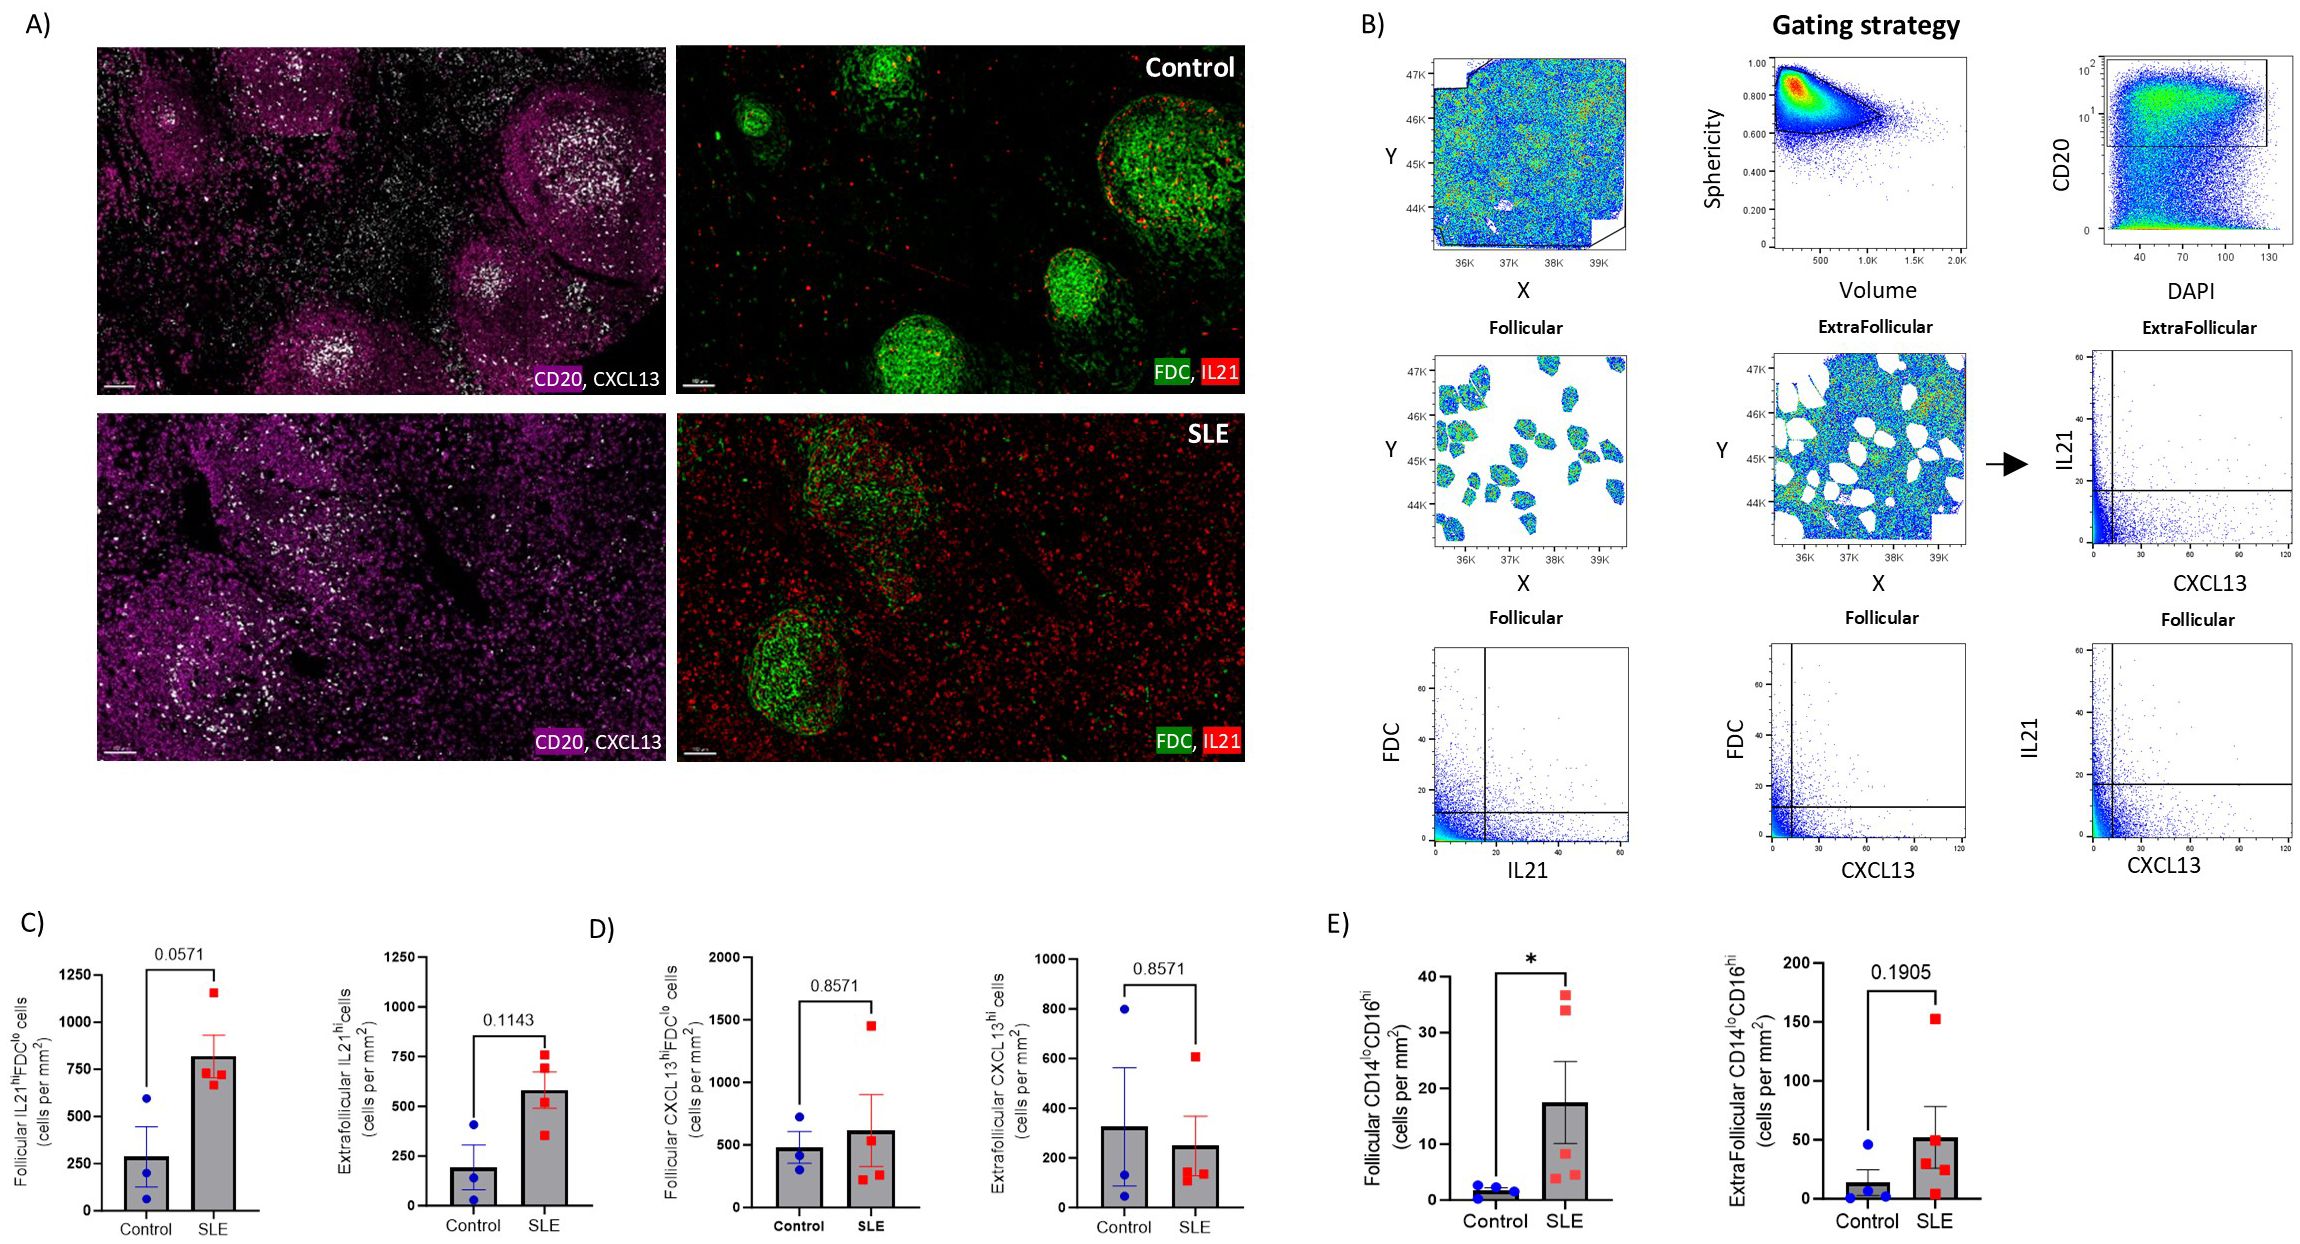
Figure 7. Significant accumulation of IL21hi cells and non-classical monocytes in SLE follicles. (A) Representative mIF images of CD20 (magenta), FDC (green), CXCL-13 (grey) and IL-21 (red) from SLE and control LNs (scale bar:100 μM). (B) Histo-cytometry gating scheme used for the quantification of IL21hi and CXCL13 hi FDC or non-FDC cell subsets. F and EF areas were manually identified based on the density of the CD20 signal gated back to the X, Y dot plot. Representative data from a control LN are plotted. (C) Bar graphs demonstrating the cell densities of follicular IL21hiFDClo (left) and extrafollicular IL21hi (right) cells in SLE (N = 4) and control LNs (N = 3). Each dot/square represents a different donor. The p values were calculated using the Mann–Whitney test. Data represent mean ± SEM. (D) Bar graphs showing the cell densities of follicular CXCL13hiFDClo (left) and extrafollicular CXCL13hi (right) cells in SLE (N = 4) and control LNs (N = 3). Each dot/square dot represents a different donor. The p values were calculated using the Mann–Whitney test. Data represent mean ± SEM. (E) Bar graphs demonstrating the cell densities of follicular (left) and extrafollicular (right) CD14loCD16hi cells in SLE (N = 5) and control LNs (N = 4). Each dot/square represents a different donor. The p values were calculated using the Mann–Whitney test. Data represent mean ± SEM.
Follicular responses could also be directly or indirectly affected by innate immune cells and CD8hi T cells (52–56). Analysis of bulk CD11c (panel 5, Supplementary Tables S2, S3, Supplementary Figure S5B) revealed a trend for higher CD11chi cells in the T cell zone (defined as CD4-dense extrafollicular areas) of control LNs (Supplementary Figure S5C). Analysis of CD14 and CD16 cell subsets (panel 4, Supplementary Table S2, Supplementary Figures S5D, E) showed similar cell densities for CD14hi cells, in follicular and extrafollicular areas, among SLE and control LNs (Supplementary Figure S5F). Notably, non-classical CD14loCD16hi monocytes were increased in SLE follicles (Figure 7E, left panel). In the extrafollicular areas, CD14l°CD16hi monocytes were also elevated in SLE compared to control LNs, however without reaching statistical significance (Figure 7E, right panel).
Next, the cell densities of bulk and effector CD8hi T cells (panel 2, Supplementary Tables S2, S3) were analysed (Supplementary Figure S5G, upper panel). Similar cell densities of bulk and potential CTLs (GrzBhiPrfhi CD8hi T cells) were measured in the extrafollicular areas between SLE and control LNs (Supplementary Figure S5G, lower panel). However, a clear trend (p=0.057) for higher cell density of proliferating Ki67hiCD8hi T cells was found in SLE compared to control LNs (Supplementary Figure S5G, lower panel). Collectively, these results indicate that SLE follicles exhibit alterations in IL-21-fuelled GC-reactivity and increased infiltration of inflammatory non-classical monocytes.
SLE is a complex autoimmune disease characterized by immune dysregulation, chronic inflammation, and multi-organ damage. Sustained type I IFN signaling, and autoantibody production create a vicious cycle that orchestrates SLE pathogenicity. With this in mind, we sought to investigate the immune cell landscape and dynamics of SLE LNs. In this study, we employed multiplex imaging and spatial transcriptomic to investigate for possible in situ cellular and molecular irregularities in follicles that could contribute to abnormal humoral SLE responses. We would like to emphasize that we utilized appropriate LNs (matched for anatomical location), characterized by follicular hyperplasia as a strict control for high GC reactivity. This approach allowed us to assess the cellular composition and the capacity of SLE LNs to be characterized by unique molecular signatures. It should be noted that we were unable to match our cohorts for gender due to the relative rarity of LN tissue samples from both groups. However, we did not observe any gender-related differences in the accumulation of ABCs and/or the type I IFN signature on SLE LNs, as suggested by some previous studies (57–61). We observed altered follicular morphology, characterized by increased area and boundary irregularities, in SLE compared to control LNs. Presumably, the ‘ectopic’ development of follicles found in SLE (62) contributes, at least in part, to this irregular formation.
To the best of our knowledge, this is the first study to provide spatial transcriptomic evidence for a profound type I IFN signature in SLE follicles, a molecular signature previously described in studies using blood as well as non-blood tissues (skin, kidney) and strongly correlated with SLE severity (63–65). In line with the transcriptomic data, our mIF analysis showed increased cell densities of IFNα2hi cells, specifically in the follicles of SLE compared to control reactive LNs. The elevated and sustained IFN-response detected in SLE follicles could modulate adaptive and innate immune cell properties and be a crucial contributor for non-canonical GC and/or EF- responses as previously reported in SLE patients (50, 66) or SLE mouse models (7, 67). The concomitant expression of the follicular type I IFN fingerprint, reflected by the upregulation of type I interferon-related pathways, the downregulation of TFH differentiation pathways and cytokine pathways (IL-1b) which are positive regulators of TFH cell differentiation (68), urges for further investigation regarding the mechanistic link of these pathways. Interestingly, the detected plasma cell-related gene signature, dominating SLE follicles, agrees with previous peripheral blood transcriptomic studies (69). Therefore, the altered follicular morphology, the domination of type I interferon signaling and the downregulation of TFH cell differentiation pathways represent tissue determinants that associate, at least, with a non-canonical development of GC B cells in SLE.
Given that GeoMx spatial transcriptomics platform does not provide single cell resolution, we used a computational deconvolution approach to delineate the contribution of different immune cell subsets to the detected type I IFN fingerprint of SLE follicles. We chose to deconvolute T, B, and dendritic cells to address whether follicular T or B cells are relatively more responsive to type I IFNs using dendritic cells as a positive control (70). As expected (70),, dendritic cells were more responsive to type I IFN than adaptive immune cells. Although it is expected that both follicular T and B cells are susceptible to IFN stimulation, our data suggest that follicular T cells, presumably TFH cells, could be more affected by the immunomodulatory effect of type I IFNs compared to B cells. This is supported by the higher correlation of T cells on the expression of most of the randomly selected ISGs while B cell correlation was only found to be higher in the case of IRF9 the role of which is less prominent compared to other well-established ISGs (71). We must emphasize that other cell subsets are also present in follicles and respond to type I IFNs, but we focused on these specific cell subsets for the scope of this investigation.
Despite the comparable cell densities of bulk PD1hi TFH cells among SLE and control LNs, a significant reduction of PD1hiBcl6hi TFH cells was observed in SLE. TFH cell differentiation is regulated by a complex network of transcription factors and signaling molecules, including members of the STAT family and several different cytokines including type I IFNs (16). However, the role of a particular molecule/pathway may differ with respect to the stage of a disease (e.g. acute vs chronic inflammation). Although type I IFNs can induce early differentiation of TFH cells, i.e. through STAT1-mediated induction of Bcl6 (72, 73), in chronic infection they favor the development of Th1 instead of TFH cell responses (74). Within the follicle, type I IFNs could act, at least in part, by downregulating Bcl6 (75, 76) which has been shown to bind ISGs loci and downregulate their expression in TFH cells (77). Therefore, we hypothesize that the excessive type I IFN signaling could act as an underlying ‘orchestrator’ for the impaired development of Bcl6hi TFH responses in SLE follicles.
It should be noted that peripheral T cells (Tph), which are also characterized by elevated expression of PD1 and other TFH-related markers, have been reported to be of great importance in the pathogenesis of SLE (78–82). Although Tph exert their potent immunogenic properties mainly in inflamed tissues (82), they can also be present in the extrafollicular space of LNs where upon type I IFN stimulation can boost the LN immunoreactivity in a CXCL13-dependent manner as previously reported (81). This pathogenic T cell subset does not express CXCR5, which is required for intrafollicular migration (82) and its direct association with the F/GC Tfh cells that we immunophenotyped in our study is not well established. The multistep differentiation of TFH cells can result in a heterogenous pool of cell subsets with distinct functional and positioning profile and presumably differential interaction and delivery of help to their B cell counterparts (15, 18, 47, 83). To gain insights into TFH cell heterogeneity, we analyzed the expression of GATA-3, a transcription factor that shapes Th2 responses (45) and CD57, a senescence biomarker characteristic of highly differentiated TFH cells (18), along with other TFH cell biomarkers. SLE follicles exhibit decreased levels of highly differentiated GATA3hi (PD1hiCD57hiGATA3hi) TFH cells, further supporting our hypothesis of deregulated TFH differentiation in SLE. The transition from PD1hiCD57lo to PD1hiCD57hi TFH cells is associated with a reduced capacity for IL-21 production (18, 47) concomitant with increased secretion of IL-4, at least in vitro (18). In line with this, we found a diminished IL4-related gene signature in SLE compared to control follicles. Type I IFN signaling, which can reverse human Th2 commitment by suppressing GATA-3 (84), could contribute, at least in part, to the described deregulated differentiation of TFH cells towards a Th2-like phenotype. Additionally, the trend towards increased prevalence of proliferating and cytotoxic CD8+ cells might also boost a Th1-commitment of TFH in an IFNγ-dependent fashion (48).
B cell maturation and differentiation into autoantibody-producing plasma cells can be T cell-dependent or T cell independent in SLE (11). Our findings suggest that B cell trafficking is altered in SLE F/GCs. The profile of CD20hi/dim B cell prevalence between follicular non-GC (presumably MZ) and F/GC areas implies an altered B cell trafficking between follicular areas in SLE. Our transcriptomic analysis showed a relative downregulation of CXCR5 (SLE vs Control: logFC=-0.2265, p-value=0.049) in SLE follicles that could presumably affect the trafficking of B cells (85). Whether the altered B cell trafficking is responsible, at least in part, for the altered SLE follicular morphology is not known and merits further investigation. On the other hand, the overall reduced cell density of CD20hi/dimBcl6hi B cells found in SLE was particularly evident for the LZ B cells (CD20hi/dimBcl6hiKi67lo), a profile also detected in the TFH cell compartment. Our data indicate a generalized impairment in developing Bcl6hi F/GC cell responses. Therefore, SLE follicular B cells could be affected both at differentiation and trafficking level. The mutual regulation that has been proposed between TFH and GC B cells (15, 49) is likely impaired in SLE, because no association was found between TFH and bulky or proliferating B cells, suggesting a ‘disconnection’, at least in part, between the two major GC immune cell types. We assume that the increased levels of peripheral TFH cells reported in SLE (86) could reflect such non-canonical interaction with B cells in the follicles leading to pre-TFH or TFH cells egress from the lymph node.
Notably, we monitored upregulated levels of Age-associated B Cells (CD19hi/dimCD11chiTbethi), a potent mediator of autoreactive humoral responses in SLE (57, 65, 87). More specifically, ABCs are tightly correlated with SLEDAI, renal involvement and autoantibody production (88). Extrafollicular CD20hi/dim B cells are likely to bypass the canonical and tightly regulated GC-maturation triggered by cognate T-cell interactions and that could explain their autoreactive potential fueled by TLR-mediated signaling (89). Sustained type I IFN signaling can promote ABC generation by down-regulating IL4R on naïve B cells (50). Additionally, murine ABCs were reported to exhibit decreased levels of Bcl6 expression (57), in agreement with the reduced cell density of CD20hi/dimBcl6hi monitored in SLE compared to controls F/GCs. Interestingly, the presence of CD11c+Tbet+ B cells in SLE mouse models can induce an abnormal differentiation of TFH cells creating thus a vicious feedback loop (90). In line with this, the reduced in situ IL-4-signaling, which is crucial for the GC B cell maturation (91–93), could fuel in SLE follicles the generation of ABCs by antagonizing the TLR-induced expression of Tbet in activated B cells (94). Moreover, Tph cells, which are localized in extrafollicular areas and inflamed tissues, can possibly further promote ABC differentiation (80). Of note, a similar B-cell subset was up-regulated in lymph nodes from HIV infected individuals and associated with reduced capacity for broad neutralizing antibodies generation (95), further supporting the disruption of the normal GC responses by ABCs.
Analysis of innate immunity cell subsets revealed a higher cell density of ‘non-classical’ CD14loCD16hi monocytes especially in the follicles, that could be an additional source of inflammatory signals (96, 97). Our findings are in line with the increased circulating non-classical monocytes detected in SLE individuals (96). Among the local soluble mediators with major role in TFH and B cells dynamics is the CXCL13 chemokine (98). We did not observe any difference between SLE and control LNs with respect to follicular and extrafollicular CXCL13. Although FDCs are the main source of CXCL13 (99), TFH cells (100, 101), as well as circulating and tissue monocytes/macrophages (102–104) are also capable of secreting this chemoattractant. Our data suggest that this capacity is not significantly altered in SLE. Still, given the relatively reduced CXCR5 mRNA found in SLE follicles by our spatial transcriptomic assay, the impact of an impaired function of the CXCL-13/CXCR-5 axis on TFH/B cell trafficking cannot be excluded. We found a clear trend for higher prevalence of IL21hi cells, not associated with FDCs, in SLE, particularly in the follicular areas, in line with the increased frequency of IL21-producing circulating TFH cells found in SLE (76). Interestingly, these cells can be expanded in a IFNα2-dependent manner (76). Whether trafficking of these cells back to LNs contribute to the increased IL21hi cellular pool found in SLE needs further investigation. Regardless, the increase prevalence of IL21hi cells could act as an additional positive regulator for the increased cell density of ABCs in SLE (105).
Despite the intriguing findings of our study, we should emphasize that the relatively low number of tissues examined limits the statistical power of our results. Future studies using larger cohorts of patients are needed to investigate the role of gender for the data provided in this study. However, obtaining relevant LNs from individuals prior to the initiation of a SLE treatment poses significant challenges since there is no medical indication for LN biopsies. Our data also cannot rule out the existence of a reverse mechanism where the inflammatory microenvironment leads to the generation of ABCs which in turn regulates TFH IL-4 producing capacity in SLE (90). Nevertheless, the data point to a characteristic LN immune cell and transcriptomic landscape that may contribute to the SLE pathogenesis but also plays a role in the impaired i) immunity against viral infections (106) and ii) vaccine efficacy that has reported in SLE patients (25, 107–109).
In conclusion, our results suggest that in situ LN cellular and molecular irregularities characterized by i) sustained type I IFN signaling, ii) potent inflammatory signals (e.g., IL-21 and chemokines like CXCL9-CXCL11) iii) impaired generation of PD1hiCD57hiGATA3hi TFH cells and IL4-signaling and iv) accumulation of extrafollicular, potentially autoreactive, ABCs, could play an important role for the loose of tolerance and the generation of autoantibodies in SLE. In this context, the TFH/IL4-IL4R/ABC axis merits further investigation as it may provide druggable targets to alleviate SLE symptoms.
The raw data supporting the conclusions of this article will be made available by the authors, without undue reservation. Presented data are accessible through https://doi.org/10.5281/zenodo.14615255 and GeoMx seq data, ENA ID PRJEB85597.
The studies involving humans were approved by i) the Canton de Vaud-CER-VD, Switzerland for control LN tissues (#2021-01161), ii) the local research consent authorities for LN analysis and the reuse of clinical data from the five SLE patients at CHUV, and iii) the Research Committee and the Ethics in Research Committee of the National Institute of Respiratory Diseases “Ismael Cosío Villegas,” Mexico City as part of the “C71-18” protocol. The studies were conducted in accordance with the local legislation and institutional requirements. The participants provided their written informed consent to participate in this study.
SG: Conceptualization, Data curation, Formal analysis, Investigation, Visualization, Writing – original draft. KI: Data curation, Formal analysis, Investigation, Visualization, Writing – original draft. BB: Data curation, Formal analysis, Methodology, Software, Visualization, Writing – review & editing. MO: Formal analysis, Investigation, Writing – review & editing. CB: Formal analysis, Visualization, Writing – review & editing. YM: Writing – review & editing. PR: Data curation, Resources, Writing – review & editing. AS: Data curation, Formal analysis, Writing – review & editing. GP: Writing – review & editing. Ld: Resources, Writing – review & editing. DC: Resources, Writing – review & editing. RG: Supervision, Writing – review & editing. CP: Conceptualization, Formal analysis, Funding acquisition, Supervision, Visualization, Writing – original draft, Writing – review & editing.
The author(s) declare financial support was received for the research, authorship, and/or publication of this article. These studies were supported by grants from the Swiss National Science Foundation (SNF, 310030_204226) to CP and by the Institute of Pathology, Department of Laboratory Medicine and Pathology, Lausanne University Hospital and Lausanne University, Lausanne, Switzerland.
The authors would like to thank Dr Natalie Piazzon (operational director of the Tissue Biobank), Damien Maison and Emilie Lingre, Institute of Pathology, CHUV, for their help with the tissue processing/sectioning.
RG has received consulting income from Takeda, Sanofi, and declares ownership in Ozette Technologies and Modulus Therapeutics.
The remaining authors declare that the research was conducted in the absence of any commercial or financial relationships that could be construed as a potential conflict of interest.
The author(s) declare that no Generative AI was used in the creation of this manuscript.
All claims expressed in this article are solely those of the authors and do not necessarily represent those of their affiliated organizations, or those of the publisher, the editors and the reviewers. Any product that may be evaluated in this article, or claim that may be made by its manufacturer, is not guaranteed or endorsed by the publisher.
The Supplementary Material for this article can be found online at: https://www.frontiersin.org/articles/10.3389/fimmu.2025.1530327/full#supplementary-material
1. Frangou E, Georgakis S, Bertsias G. Update on the cellular and molecular aspects of lupus nephritis. Clin Immunol. (2020) 216:108445. doi: 10.1016/j.clim.2020.108445
2. Tsokos GC. The immunology of systemic lupus erythematosus. Nat Immunol. (2024) 25:1332–43. doi: 10.1038/s41590-024-01898-7
3. Sim TM, Ong SJ, Mak A, Tay SH. Type I interferons in systemic lupus erythematosus: A journey from bench to bedside. Int J Mol Sci. (2022) 23:2505. doi: 10.3390/ijms23052505
4. Waterman HR, Dufort MJ, Posso SE, Ni M, Li LZ, Zhu C, et al. Lupus IgA1 autoantibodies synergize with IgG to enhance plasmacytoid dendritic cell responses to RNA-containing immune complexes. Sci Transl Med. (2024) 16:eadl3848. doi: 10.1126/scitranslmed.adl3848
5. Barrat FJ, Meeker T, Gregorio J, Chan JH, Uematsu S, Akira S, et al. Nucleic acids of mammalian origin can act as endogenous ligands for Toll-like receptors and may promote systemic lupus erythematosus. J Exp Med. (2005) 202:1131–9. doi: 10.1084/jem.20050914
6. Jego G, Palucka AK, Blanck JP, Chalouni C, Pascual V, Banchereau J. Plasmacytoid dendritic cells induce plasma cell differentiation through type I interferon and interleukin 6. Immunity. (2003) 19:225–34. doi: 10.1016/s1074-7613(03)00208-5
7. Domeier PP, Chodisetti SB, Schell SL, Kawasawa YI, Fasnacht MJ, Soni C, et al. B-cell-intrinsic type 1 interferon signaling is crucial for loss of tolerance and the development of autoreactive B cells. Cell Rep. (2018) 24:406–18. doi: 10.1016/j.celrep.2018.06.046
8. Ruuth K, Carlsson L, Hallberg B, Lundgren E. Interferon-alpha promotes survival of human primary B-lymphocytes via phosphatidylinositol 3-kinase. Biochem Biophys Res Commun. (2001) 284:583–6. doi: 10.1006/bbrc.2001.5025
9. Bekeredjian-Ding IB, Wagner M, Hornung V, Giese T, Schnurr M, Endres S, et al. Plasmacytoid dendritic cells control TLR7 sensitivity of naive B cells via type I IFN. J Immunol. (2005) 174:4043–50. doi: 10.4049/jimmunol.174.7.4043
10. Dong X, Antao OQ, Song W, Sanchez GM, Zembrzuski K, Koumpouras F, et al. Type I interferon-activated STAT4 regulation of follicular helper T cell-dependent cytokine and immunoglobulin production in lupus. Arthritis Rheumatol. (2021) 73:478–89. doi: 10.1002/art.41532
11. Malkiel S, Barlev AN, Atisha-Fregoso Y, Suurmond J, Diamond B. Plasma cell differentiation pathways in systemic lupus erythematosus. Front Immunol. (2018) 9:427. doi: 10.3389/fimmu.2018.00427
12. Tipton CM, Fucile CF, Darce J, Chida A, Ichikawa T, Gregoretti I, et al. Diversity, cellular origin and autoreactivity of antibody-secreting cell population expansions in acute systemic lupus erythematosus. Nat Immunol. (2015) 16:755–65. doi: 10.1038/ni.3175
13. Jenks SA, Cashman KS, Woodruff MC, Lee FE, Sanz I. Extrafollicular responses in humans and SLE. Immunol Rev. (2019) 288:136–48. doi: 10.1111/imr.12741
14. Victora GD, Nussenzweig MC. Germinal centers. Annu Rev Immunol. (2022) 40:413–42. doi: 10.1146/annurev-immunol-120419-022408
15. Weinstein JS, Herman EI, Lainez B, Licona-Limon P, Esplugues E, Flavell R, et al. TFH cells progressively differentiate to regulate the germinal center response. Nat Immunol. (2016) 17:1197–205. doi: 10.1038/ni.3554
16. Crotty S. T follicular helper cell biology: A decade of discovery and diseases. Immunity. (2019) 50:1132–48. doi: 10.1016/j.immuni.2019.04.011
17. Yu D, Rao S, Tsai LM, Lee SK, He Y, Sutcliffe EL, et al. The transcriptional repressor Bcl-6 directs T follicular helper cell lineage commitment. Immunity. (2009) 31:457–68. doi: 10.1016/j.immuni.2009.07.002
18. Padhan K, Moysi E, Noto A, Chassiakos A, Ghneim K, Perra MM, et al. Acquisition of optimal TFH cell function is defined by specific molecular, positional, and TCR dynamic signatures. Proc Natl Acad Sci U.S.A. (2021), 118. doi: 10.1073/pnas.2016855118
19. Kumar S, Basto AP, Ribeiro F, Almeida SCP, Campos P, Peres C, et al. Specialized Tfh cell subsets driving type-1 and type-2 humoral responses in lymphoid tissue. Cell Discovery. (2024) 10:64. doi: 10.1038/s41421-024-00681-0
20. Bartsch T, Arndt C, Loureiro LR, Kegler A, Puentes-Cala E, Soto JA, et al. A small step, a giant leap: somatic hypermutation of a single amino acid leads to anti-la autoreactivity. Int J Mol Sci. (2021) 22:12046. doi: 10.3390/ijms222112046
21. Shlomchik M, Mascelli M, Shan H, Radic MZ, Pisetsky D, Marshak-Rothstein A, et al. Anti-DNA antibodies from autoimmune mice arise by clonal expansion and somatic mutation. J Exp Med. (1990) 171:265–92. doi: 10.1084/jem.171.1.265
22. Tiller T, Tsuiji M, Yurasov S, Velinzon K, Nussenzweig MC, Wardemann H. Autoreactivity in human IgG+ memory B cells. Immunity. (2007) 26:205–13. doi: 10.1016/j.immuni.2007.01.009
23. Choi JY, Ho JH, Pasoto SG, Bunin V, Kim ST, Carrasco S, et al. Circulating follicular helper-like T cells in systemic lupus erythematosus: association with disease activity. Arthritis Rheumatol. (2015) 67:988–99. doi: 10.1002/art.39020
24. Sage PT, Alvarez D, Godec J, von Andrian UH, Sharpe AH. Circulating T follicular regulatory and helper cells have memory-like properties. J Clin Invest. (2014) 124:5191–204. doi: 10.1172/JCI76861
25. Sarin KY, Zheng H, Chaichian Y, Arunachalam PS, Swaminathan G, Eschholz A, et al. Impaired innate and adaptive immune responses to BNT162b2 SARS-CoV-2 vaccination in systemic lupus erythematosus. JCI Insight. (2024) 9:e176556. doi: 10.1172/jci.insight.176556
26. Yildirim R, Oliveira T, Isenberg DA. Approach to vaccination in systemic lupus erythematosus on biological treatment. Ann Rheum Dis. (2023) 82:1123–9. doi: 10.1136/ard-2023-224071
27. Jacob L, Gagnon-Bartsch JA, Speed TP. Correcting gene expression data when neither the unwanted variation nor the factor of interest are observed. Biostatistics. (2016) 17:16–28. doi: 10.1093/biostatistics/kxv026
28. Ritchie ME, Phipson B, Wu D, Hu Y, Law CW, Shi W, et al. limma powers differential expression analyses for RNA-sequencing and microarray studies. Nucleic Acids Res. (2015) 43:e47. doi: 10.1093/nar/gkv007
29. Law CW, Chen Y, Shi W, Smyth GK. voom: Precision weights unlock linear model analysis tools for RNA-seq read counts. Genome Biol. (2014) 15:R29. doi: 10.1186/gb-2014-15-2-r29
30. Subramanian A, Tamayo P, Mootha VK, Mukherjee S, Ebert BL, Gillette MA, et al. Gene set enrichment analysis: a knowledge-based approach for interpreting genome-wide expression profiles. Proc Natl Acad Sci U.S.A. (2005) 102:15545–50. doi: 10.1073/pnas.0506580102
31. Danaher P, Kim Y, Nelson B, Griswold M, Yang Z, Piazza E, et al. Advances in mixed cell deconvolution enable quantification of cell types in spatial transcriptomic data. Nat Commun. (2022) 13:385. doi: 10.1038/s41467-022-28020-5
32. Lun AT, McCarthy DJ, Marioni JC. A step-by-step workflow for low-level analysis of single-cell RNA-seq data with Bioconductor. F1000Res. (2016) 5:2122. doi: 10.12688/f1000research.9501.2
33. Love MI, Huber W, Anders S. Moderated estimation of fold change and dispersion for RNA-seq data with DESeq2. Genome Biol. (2014) 15:550. doi: 10.1186/s13059-014-0550-8
34. Georgakis S, Orfanakis M, Brenna C, Burgermeister S, Del Rio Estrada PM, Gonzalez-Navarro M, et al. Follicular immune landscaping reveals a distinct profile of FOXP3(hi)CD4(hi) T cells in treated compared to untreated HIV. Vaccines (Basel). (2024) 12:912. doi: 10.3390/vaccines12080912
35. Radtke AJ, Kandov E, Lowekamp B, Speranza E, Chu CJ, Gola A, et al. IBEX: A versatile multiplex optical imaging approach for deep phenotyping and spatial analysis of cells in complex tissues. Proc Natl Acad Sci U.S.A. (2020) 117:33455–65. doi: 10.1073/pnas.2018488117
36. Gerner MY, Kastenmuller W, Ifrim I, Kabat J, Germain RN. Histo-cytometry: a method for highly multiplex quantitative tissue imaging analysis applied to dendritic cell subset microanatomy in lymph nodes. Immunity. (2012) 37:364–76. doi: 10.1016/j.immuni.2012.07.011
37. Schindelin J, Arganda-Carreras I, Frise E, Kaynig V, Longair M, Pietzsch T, et al. Fiji: an open-source platform for biological-image analysis. Nat Methods. (2012) 9:676–82. doi: 10.1038/nmeth.2019
38. Virtanen P, Gommers R, Oliphant TE, Haberland M, Reddy T, Cournapeau D, et al. SciPy 1.0: fundamental algorithms for scientific computing in Python. Nat Methods. (2020) 17:261–72. doi: 10.1038/s41592-019-0686-2
39. Harris CR, Millman KJ, van der Walt SJ, Gommers R, Virtanen P, Cournapeau D, et al. Array programming with numPy. Nature. (2020) 585:357–62. doi: 10.1038/s41586-020-2649-2
40. Moysi E, Del Rio Estrada PM, Torres-Ruiz F, Reyes-Teran G, Koup RA, Petrovas C. In situ characterization of human lymphoid tissue immune cells by multispectral confocal imaging and quantitative image analysis; implications for HIV reservoir characterization. Front Immunol. (2021) 12:683396. doi: 10.3389/fimmu.2021.683396
41. Pogue SL, Preston BT, Stalder J, Bebbington CR, Cardarelli PM. The receptor for type I IFNs is highly expressed on peripheral blood B cells and monocytes and mediates a distinct profile of differentiation and activation of these cells. J Interferon Cytokine Res. (2004) 24:131–9. doi: 10.1089/107999004322813372
42. Victora GD, Schwickert TA, Fooksman DR, Kamphorst AO, Meyer-Hermann M, Dustin ML, et al. Germinal center dynamics revealed by multiphoton microscopy with a photoactivatable fluorescent reporter. Cell. (2010) 143:592–605. doi: 10.1016/j.cell.2010.10.032
43. Feng H, Zhao Z, Zhao X, Bai X, Fu W, Zheng L, et al. A novel memory-like Tfh cell subset is precursor to effector Tfh cells in recall immune responses. J Exp Med. (2024) 221:e20221927. doi: 10.1084/jem.20221927
44. Ioannidou K, Ndiaye DR, Noto A, Fenwick C, Fortis SP, Pantaleo G, et al. In situ characterization of follicular helper CD4 T cells using multiplexed imaging. Front Immunol. (2020) 11:607626. doi: 10.3389/fimmu.2020.607626
45. Olatunde AC, Hale JS, Lamb TJ. Cytokine-skewed Tfh cells: functional consequences for B cell help. Trends Immunol. (2021) 42:536–50. doi: 10.1016/j.it.2021.04.006
46. Yang ZZ, Kim HJ, Wu H, Tang X, Yu Y, Krull J, et al. T-cell phenotype including CD57(+) T follicular helper cells in the tumor microenvironment correlate with a poor outcome in follicular lymphoma. Blood Cancer J. (2023) 13:124. doi: 10.1038/s41408-023-00899-3
47. Alshekaili J, Chand R, Lee CE, Corley S, Kwong K, Papa I, et al. STAT3 regulates cytotoxicity of human CD57+ CD4+ T cells in blood and lymphoid follicles. Sci Rep. (2018) 8:3529. doi: 10.1038/s41598-018-21389-8
48. Parra ER. Methods to determine and analyze the cellular spatial distribution extracted from multiplex immunofluorescence data to understand the tumor microenvironment. Front Mol Biosci. (2021) 8:668340. doi: 10.3389/fmolb.2021.668340
49. Baumjohann D, Preite S, Reboldi A, Ronchi F, Ansel KM, Lanzavecchia A, et al. Persistent antigen and germinal center B cells sustain T follicular helper cell responses and phenotype. Immunity. (2013) 38:596–605. doi: 10.1016/j.immuni.2012.11.020
50. Gao M, Liu S, Chatham WW, Mountz JD, Hsu HC. IL-4-induced quiescence of resting naive B cells is disrupted in systemic lupus erythematosus. J Immunol. (2022) 209:1513–22. doi: 10.4049/jimmunol.2200409
51. Mouat IC, Goldberg E, Horwitz MS. Age-associated B cells in autoimmune diseases. Cell Mol Life Sci. (2022) 79:402. doi: 10.1007/s00018-022-04433-9
52. Melo-Silva CR, Sigal LJ. Innate and adaptive immune responses that control lymph-borne viruses in the draining lymph node. Cell Mol Immunol. (2024) 21:999–1007. doi: 10.1038/s41423-024-01188-0
53. Gonzalez SF, Lukacs-Kornek V, Kuligowski MP, Pitcher LA, Degn SE, Kim YA, et al. Capture of influenza by medullary dendritic cells via SIGN-R1 is essential for humoral immunity in draining lymph nodes. Nat Immunol. (2010) 11:427–34. doi: 10.1038/ni.1856
54. Cucak H, Yrlid U, Reizis B, Kalinke U, Johansson-Lindbom B. Type I interferon signaling in dendritic cells stimulates the development of lymph-node-resident T follicular helper cells. Immunity. (2009) 31:491–501. doi: 10.1016/j.immuni.2009.07.005
55. Leal JM, Huang JY, Kohli K, Stoltzfus C, Lyons-Cohen MR, Olin BE, et al. Innate cell microenvironments in lymph nodes shape the generation of T cell responses during type I inflammation. Sci Immunol. (2021) 6:eabb9435. doi: 10.1126/sciimmunol.abb9435
56. Kalia A, Agrawal M, Gupta N. CD8(+) T cells are crucial for humoral immunity establishment by SA14-14-2 live attenuated Japanese encephalitis vaccine in mice. Eur J Immunol. (2021) 51:368–79. doi: 10.1002/eji.202048745
57. Ricker E, Manni M, Flores-Castro D, Jenkins D, Gupta S, Rivera-Correa J, et al. Altered function and differentiation of age-associated B cells contribute to the female bias in lupus mice. Nat Commun. (2021) 12:4813. doi: 10.1038/s41467-021-25102-8
58. Singh RP, Hahn BH, Bischoff DS. Interferon genes are influenced by 17beta-estradiol in SLE. Front Immunol. (2021) 12:725325. doi: 10.3389/fimmu.2021.725325
59. Webb K, Peckham H, Radziszewska A, Menon M, Oliveri P, Simpson F, et al. Sex and pubertal differences in the type 1 interferon pathway associate with both X chromosome number and serum sex hormone concentration. Front Immunol. (2018) 9:3167. doi: 10.3389/fimmu.2018.03167
60. Niewold TB, Adler JE, Glenn SB, Lehman TJ, Harley JB, Crow MK. Age- and sex-related patterns of serum interferon-alpha activity in lupus families. Arthritis Rheum. (2008) 58:2113–9. doi: 10.1002/art.23619
61. Kennedy WP, Maciuca R, Wolslegel K, Tew W, Abbas AR, Chaivorapol C, et al. Association of the interferon signature metric with serological disease manifestations but not global activity scores in multiple cohorts of patients with SLE. Lupus Sci Med. (2015) 2:e000080. doi: 10.1136/lupus-2014-000080
62. Degn SE, van der Poel CE, Firl DJ, Ayoglu B, Al Qureshah FA, Bajic G, et al. Clonal evolution of autoreactive germinal centers. Cell. (2017) 170:913–926 e919. doi: 10.1016/j.cell.2017.07.026
63. Banchereau J, Pascual V. Type I interferon in systemic lupus erythematosus and other autoimmune diseases. Immunity. (2006) 25:383–92. doi: 10.1016/j.immuni.2006.08.010
64. Der E, Suryawanshi H, Morozov P, Kustagi M, Goilav B, Ranabothu S, et al. Author Correction: Tubular cell and keratinocyte single-cell transcriptomics applied to lupus nephritis reveal type I IFN and fibrosis relevant pathways. Nat Immunol. (2019) 20:1556. doi: 10.1038/s41590-019-0529-4
65. Arazi A, Rao DA, Berthier CC, Davidson A, Liu Y, Hoover PJ, et al. The immune cell landscape in kidneys of patients with lupus nephritis. Nat Immunol. (2019) 20:902–14. doi: 10.1038/s41590-019-0398-x
66. Caielli S, Wan Z, Pascual V. Systemic lupus erythematosus pathogenesis: interferon and beyond. Annu Rev Immunol. (2023) 41:533–60. doi: 10.1146/annurev-immunol-101921-042422
67. Giltiay NV, Chappell CP, Sun X, Kolhatkar N, Teal TH, Wiedeman AE, et al. Overexpression of TLR7 promotes cell-intrinsic expansion and autoantibody production by transitional T1 B cells. J Exp Med. (2013) 210:2773–89. doi: 10.1084/jem.20122798
68. Ritvo PG, Churlaud G, Quiniou V, Florez L, Brimaud F, Fourcade G, et al. T(fr) cells lack IL-2Ralpha but express decoy IL-1R2 and IL-1Ra and suppress the IL-1-dependent activation of T(fh) cells. Sci Immunol. (2017) 2:eaam0368. doi: 10.1126/sciimmunol.aan0368
69. Wahadat MJ, Schonenberg-Meinema D, van-Helden-Meeuwsen CG, van Tilburg SJ, Groot N, Schatorje EJH, et al. Gene signature fingerprints stratify SLE patients in groups with similar biological disease profiles: a multicentre longitudinal study. Rheumatol (Oxford). (2022) 61:4344–54. doi: 10.1093/rheumatology/keac083
70. Perez RK, Gordon MG, Subramaniam M, Kim MC, Hartoularos GC, Targ S, et al. Single-cell RNA-seq reveals cell type-specific molecular and genetic associations to lupus. Science. (2022) 376:eabf1970. doi: 10.1126/science.abf1970
71. Kraus TA, Lau JF, Parisien JP, Horvath CM. A hybrid IRF9-STAT2 protein recapitulates interferon-stimulated gene expression and antiviral response. J Biol Chem. (2003) 278:13033–8. doi: 10.1074/jbc.M212972200
72. Choi YS, Eto D, Yang JA, Lao C, Crotty S. Cutting edge: STAT1 is required for IL-6-mediated Bcl6 induction for early follicular helper cell differentiation. J Immunol. (2013) 190:3049–53. doi: 10.4049/jimmunol.1203032
73. Nakayamada S, Poholek AC, Lu KT, Takahashi H, Kato M, Iwata S, et al. Type I IFN induces binding of STAT1 to Bcl6: divergent roles of STAT family transcription factors in the T follicular helper cell genetic program. J Immunol. (2014) 192:2156–66. doi: 10.4049/jimmunol.1300675
74. De Giovanni M, Cutillo V, Giladi A, Sala E, Maganuco CG, Medaglia C, et al. Spatiotemporal regulation of type I interferon expression determines the antiviral polarization of CD4(+) T cells. Nat Immunol. (2020) 21:321–30. doi: 10.1038/s41590-020-0596-6
75. Salamon D, Adori M, He M, Bonelt P, Severinson E, Kis LL, et al. Type I interferons directly down-regulate BCL-6 in primary and transformed germinal center B cells: differential regulation in B cell lines derived from endemic or sporadic Burkitt’s lymphoma. Cytokine. (2012) 57:360–71. doi: 10.1016/j.cyto.2011.12.001
76. Tanemura S, Seki N, Tsujimoto H, Saito S, Kikuchi J, Sugahara K, et al. Role of interferons (IFNs) in the differentiation of T peripheral helper (Tph) cells. Int Immunol. (2022) 34:533–44. doi: 10.1093/intimm/dxac032
77. Amet T, Son YM, Jiang L, Cheon IS, Huang S, Gupta SK, et al. BCL6 represses antiviral resistance in follicular T helper cells. J Leukoc Biol. (2017) 102:527–36. doi: 10.1189/jlb.4A1216-513RR
78. Lin J, Yu Y, Ma J, Ren C, Chen W. PD-1+CXCR5-CD4+T cells are correlated with the severity of systemic lupus erythematosus. Rheumatol (Oxford). (2019) 58:2188–92. doi: 10.1093/rheumatology/kez228
79. Sasaki T, Bracero S, Keegan J, Chen L, Cao Y, Stevens E, et al. Longitudinal immune cell profiling in patients with early systemic lupus erythematosus. Arthritis Rheumatol. (2022) 74:1808–21. doi: 10.1002/art.42248
80. Bocharnikov AV, Keegan J, Wacleche VS, Cao Y, Fonseka CY, Wang G, et al. PD-1hiCXCR5- T peripheral helper cells promote B cell responses in lupus via MAF and IL-21. JCI Insight. (2019) 4:e130062. doi: 10.1172/jci.insight.130062
81. Law C, Wacleche VS, Cao Y, Pillai A, Sowerby J, Hancock B, et al. Interferon subverts an AHR-JUN axis to promote CXCL13(+) T cells in lupus. Nature. (2024) 631:857–66. doi: 10.1038/s41586-024-07627-2
82. Yoshitomi H, Ueno H. Shared and distinct roles of T peripheral helper and T follicular helper cells in human diseases. Cell Mol Immunol. (2021) 18:523–7. doi: 10.1038/s41423-020-00529-z
83. Kim CH, Rott LS, Clark-Lewis I, Campbell DJ, Wu L, Butcher EC. Subspecialization of CXCR5+ T cells: B helper activity is focused in a germinal center-localized subset of CXCR5+ T cells. J Exp Med. (2001) 193:1373–81. doi: 10.1084/jem.193.12.1373
84. Huber JP, Ramos HJ, Gill MA, Farrar JD. Cutting edge: Type I IFN reverses human Th2 commitment and stability by suppressing GATA3. J Immunol. (2010) 185:813–7. doi: 10.4049/jimmunol.1000469
85. Pereira JP, Kelly LM, Cyster JG. Finding the right niche: B-cell migration in the early phases of T-dependent antibody responses. Int Immunol. (2010) 22:413–9. doi: 10.1093/intimm/dxq047
86. Xu H, Liu J, Cui X, Zuo Y, Zhang Z, Li Y, et al. Increased frequency of circulating follicular helper T cells in lupus patients is associated with autoantibody production in a CD40L-dependent manner. Cell Immunol. (2015) 295:46–51. doi: 10.1016/j.cellimm.2015.01.014
87. Cancro MP. Age-associated B cells. Annu Rev Immunol. (2020) 38:315–40. doi: 10.1146/annurev-immunol-092419-031130
88. Jenks SA, Cashman KS, Zumaquero E, Marigorta UM, Patel AV, Wang X, et al. Distinct effector B cells induced by unregulated toll-like receptor 7 contribute to pathogenic responses in systemic lupus erythematosus. Immunity. (2018) 49:725–739 e726. doi: 10.1016/j.immuni.2018.08.015
89. Fillatreau S, Manfroi B, Dorner T. Toll-like receptor signalling in B cells during systemic lupus erythematosus. Nat Rev Rheumatol. (2021) 17:98–108. doi: 10.1038/s41584-020-00544-4
90. Zhang W, Zhang H, Liu S, Xia F, Kang Z, Zhang Y, et al. Excessive CD11c(+)Tbet(+) B cells promote aberrant T(FH) differentiation and affinity-based germinal center selection in lupus. Proc Natl Acad Sci U.S.A. (2019) 116:18550–60. doi: 10.1073/pnas.1901340116
91. Duan L, Liu D, Chen H, Mintz MA, Chou MY, Kotov DI, et al. Follicular dendritic cells restrict interleukin-4 availability in germinal centers and foster memory B cell generation. Immunity. (2021) 54:2256–2272 e2256. doi: 10.1016/j.immuni.2021.08.028
92. Shehata L, Thouvenel CD, Hondowicz BD, Pew LA, Pritchard GH, Rawlings DJ, et al. Interleukin-4 downregulates transcription factor BCL6 to promote memory B cell selection in germinal centers. Immunity. (2024) 57:843–858 e845. doi: 10.1016/j.immuni.2024.02.018
93. Noto A, Suffiotti M, Joo V, Mancarella A, Procopio FA, Cavet G, et al. The deficiency in Th2-like Tfh cells affects the maturation and quality of HIV-specific B cell response in viremic infection. Front Immunol. (2022) 13:960120. doi: 10.3389/fimmu.2022.960120
94. Naradikian MS, Myles A, Beiting DP, Roberts KJ, Dawson L, Herati RS, et al. Cutting edge: IL-4, IL-21, and IFN-gamma interact to govern T-bet and CD11c expression in TLR-activated B cells. J Immunol. (2016) 197:1023–8. doi: 10.4049/jimmunol.1600522
95. Austin JW, Buckner CM, Kardava L, Wang W, Zhang X, Melson VA, et al. Overexpression of T-bet in HIV infection is associated with accumulation of B cells outside germinal centers and poor affinity maturation. Sci Transl Med. (2019) 1:eaax0904. doi: 10.1126/scitranslmed.aax0904
96. Mukherjee R, Kanti Barman P, Kumar Thatoi P, Tripathy R, Kumar Das B, Ravindran B. Non-Classical monocytes display inflammatory features: Validation in Sepsis and Systemic Lupus Erythematous. Sci Rep. (2015) 5:13886. doi: 10.1038/srep13886
97. Ong SM, Hadadi E, Dang TM, Yeap WH, Tan CT, Ng TP, et al. The pro-inflammatory phenotype of the human non-classical monocyte subset is attributed to senescence. Cell Death Dis. (2018) 9:266. doi: 10.1038/s41419-018-0327-1
98. Choi J, Crotty S, Choi YS. Cytokines in follicular helper T cell biology in physiologic and pathologic conditions. Immune Netw. (2024) 24:e8. doi: 10.4110/in.2024.24.e8
99. Cyster JG, Ansel KM, Reif K, Ekland EH, Hyman PL, Tang HL, et al. Follicular stromal cells and lymphocyte homing to follicles. Immunol Rev. (2000) 176:181–93. doi: 10.1034/j.1600-065x.2000.00618.x
100. Kroenke MA, Eto D, Locci M, Cho M, Davidson T, Haddad EK, et al. Bcl6 and Maf cooperate to instruct human follicular helper CD4 T cell differentiation. J Immunol. (2012) 188:3734–44. doi: 10.4049/jimmunol.1103246
101. Petrovas C, Yamamoto T, Gerner MY, Boswell KL, Wloka K, Smith EC, et al. CD4 T follicular helper cell dynamics during SIV infection. J Clin Invest. (2012) 122:3281–94. doi: 10.1172/JCI63039
102. Cohen KW, Dugast AS, Alter G, McElrath MJ, Stamatatos L. HIV-1 single-stranded RNA induces CXCL13 secretion in human monocytes via TLR7 activation and plasmacytoid dendritic cell-derived type I IFN. J Immunol. (2015) 194:2769–75. doi: 10.4049/jimmunol.1400952
103. Carlsen HS, Baekkevold ES, Morton HC, Haraldsen G, Brandtzaeg P. Monocyte-like and mature macrophages produce CXCL13 (B cell-attracting chemokine 1) in inflammatory lesions with lymphoid neogenesis. Blood. (2004) 104:3021–7. doi: 10.1182/blood-2004-02-0701
104. Vissers JL, Hartgers FC, Lindhout E, Figdor CG, Adema GJ. BLC (CXCL13) is expressed by different dendritic cell subsets in vitro and in vivo. Eur J Immunol. (2001) 31:1544–9. doi: 10.1002/1521-4141(200105)31:5<1544::AID-IMMU1544>3.0.CO;2-I
105. Wang S, Wang J, Kumar V, Karnell JL, Naiman B, Gross PS, et al. IL-21 drives expansion and plasma cell differentiation of autoreactive CD11c(hi)T-bet(+) B cells in SLE. Nat Commun. (2018) 9:1758. doi: 10.1038/s41467-018-03750-7
106. Jung JY, Yoon D, Choi Y, Kim HA, Suh CH. Associated clinical factors for serious infections in patients with systemic lupus erythematosus. Sci Rep. (2019) 9:9704. doi: 10.1038/s41598-019-46039-5
107. Petri M, Joyce D, Haag K, Fava A, Goldman DW, Zhong D, et al. Effect of systemic lupus erythematosus and immunosuppressive agents on COVID-19 vaccination antibody response. Arthritis Care Res (Hoboken). (2023) 75:1878–85. doi: 10.1002/acr.25094
108. Huang Y, Wang H, Wan L, Lu X, Tam WWS. Is systemic lupus erythematosus associated with a declined immunogenicity and poor safety of influenza vaccination?: A systematic review and meta-analysis. Med (Baltimore). (2016) 95:e3637. doi: 10.1097/MD.0000000000003637
Keywords: T follicular helper cells (TFH), type I IFN, age-associated B cells, germinal center response, IL-4, systemic lupus erythematosus (SLE)
Citation: Georgakis S, Ioannidou K, Mora BB, Orfanakis M, Brenna C, Muller YD, Del Rio Estrada PM, Sharma AA, Pantaleo G, de Leval L, Comte D, Gottardo R and Petrovas C (2025) Cellular and molecular determinants mediating the dysregulated germinal center immune dynamics in systemic lupus erythematosus. Front. Immunol. 16:1530327. doi: 10.3389/fimmu.2025.1530327
Received: 18 November 2024; Accepted: 17 January 2025;
Published: 13 February 2025.
Edited by:
Felipe Andrade, Johns Hopkins University, United StatesCopyright © 2025 Georgakis, Ioannidou, Mora, Orfanakis, Brenna, Muller, Del Rio Estrada, Sharma, Pantaleo, de Leval, Comte, Gottardo and Petrovas. This is an open-access article distributed under the terms of the Creative Commons Attribution License (CC BY). The use, distribution or reproduction in other forums is permitted, provided the original author(s) and the copyright owner(s) are credited and that the original publication in this journal is cited, in accordance with accepted academic practice. No use, distribution or reproduction is permitted which does not comply with these terms.
*Correspondence: Constantinos Petrovas, S29uc3RhbnRpbm9zLlBldHJvdmFzQGNodXYuY2g=
†These authors have contributed equally to this work
Disclaimer: All claims expressed in this article are solely those of the authors and do not necessarily represent those of their affiliated organizations, or those of the publisher, the editors and the reviewers. Any product that may be evaluated in this article or claim that may be made by its manufacturer is not guaranteed or endorsed by the publisher.
Research integrity at Frontiers
Learn more about the work of our research integrity team to safeguard the quality of each article we publish.