
94% of researchers rate our articles as excellent or good
Learn more about the work of our research integrity team to safeguard the quality of each article we publish.
Find out more
ORIGINAL RESEARCH article
Front. Immunol. , 25 February 2025
Sec. Alloimmunity and Transplantation
Volume 16 - 2025 | https://doi.org/10.3389/fimmu.2025.1528177
 Ute V. Solloch1*
 Chinma Kaniyath Madhusoodhanan2
 Vinzenz Lange3
 Jürgen Sauter1
 Latha Jagannathan4Patrick Paul2
 Marcelo A. Fernández-Viña5
 Alexander H. Schmidt1,3
Introduction: In hematopoietic stem cell transplantation, optimal results are achieved when donors and patients are matched regarding their human leukocyte antigen (HLA) genes. Population-specific HLA allele and haplotype frequency distributions determine the probabilities to find matched donors in a stem cell donor registry of given size and ethnic composition.
Methods: To evaluate the needs of Indian patients with regard to future donor recruitment, we analyzed a large data set of n=130,518 potential stem cell donors registered with DKMS-BMST, a Bangalore-based donor registry with nationwide donor recruitment activities. We defined 8 subpopulations by native language and state of origin of both parents. The subpopulations comprised four samples belonging to the Dravidian language family (native language: Kannada/state of origin: Karnataka, Tamil/Tamil Nadu, Telugu/Andhra Pradesh and Malayalam/Kerala), and four samples belonging to the Indo-Aryan language group (Bengali/West Bengal, Gujarati/Gujarat, Hindi/Uttar Pradesh, Marathi/Maharashtra). The precise definition of subpopulations and large sample sizes between n=5,808 (Telugu/Andhra Pradesh) and n=14,866 (Malayalam/Kerala) are strengths of our study. Our results regarding HLA allele and haplotype frequencies refine published data.
Results and Discussion: In terms of genetic relatedness, we observed a division of the subpopulations into a Southern and a Northwestern Indian cluster and the Bengali/West Bengal sample which differed significantly from the seven other subpopulations. Patients from Southern Indian populations are the main beneficiaries from the DKMS-BMST registry in the current ethnic composition. A more even nationwide coverage will be achieved in the future with the opening of local recruitment offices in different parts of India.
For many patients with severe hematological disorders such as blood cancer, a hematopoietic stem cell transplantation (HSCT) from an allogeneic donor is the only chance of a cure. In cases where a suited matched related donor is not available, an unrelated donor is searched in worldwide registries. The optimal transplantation outcomes in adult donor unrelated HSCT are achieved in patients with a donor that matches at all alleles of the human leukocyte antigen (HLA) loci HLA-A, -B, -C, and -DRB1 (8/8 match); additional matching of the HLA-DQB1 and -DPB1 loci (10/10 or 12/12 match, respectively) may further improve outcomes (1–5). Recent publications have also examined the extent to which a graft-versus-host disease (GVHD) prophylaxis based on cyclophosphamide (PTCy) may reduce or even balance the impact of one or more mismatches on the outcome of unrelated HSCT (5–8).
Because of their close linkage, the genes of the HLA complex on the short arm of chromosome 6 are inherited as haplotype blocks. HLA genes are highly polymorphic, with both allele variation and haplotype composition being population-specific. As of June 2024, the IPD-IMGT/HLA database contained 38,975 distinct HLA alleles (9). The probability of finding a matched HSCT donor depends on the HLA diversity of the patient’s ancestry population and on the availability of donors from the same or a genetically related population (10–12).
By the end of June 2024, the World Marrow Donor Association (WMDA) included more than 42.3 million potential stem cell donors and cryopreserved cord blood units in their database (13). With approximately 12.5 million donors across seven countries, DKMS is a major donor registry. More than 118,400 DKMS donors have donated hematopoietic stem cells from peripheral blood or bone marrow to patients in around 60 countries. DKMS BMST Foundation India (referred to as “DKMS-BMST”) has registered over 133,700 stem cell donors, with more than 130 having donated hematopoietic stem cells (as of the end of June 2024). Since February 1, 2025, operations of “DKMS BMST Foundation India” transitioned to “DKMS Foundation India”.
India, with a population exceeding 1.43 billion living in 28 states and eight union territories, is characterized by its immense ethnic, linguistic, and cultural diversity (14, 15). The country’s complex demographic landscape results from a long history of migratory movements and cultural exchange, particularly in the northern regions. This historical context has shaped the ethnic and linguistic composition of India (16–18). The majority of Indians speak Dravidian or Indo-Aryan languages. The Dravidian language family is mainly represented in the South Indian peninsula, which is separated from the northern parts of India by the mountains of the Vindhya range and characterized by long oceanic coastlines and was thus geographically and historically more isolated. Indo-Aryan languages, a subgroup of the Indo-Iranian language branch of the Indo-European language family, are predominant in the northern parts of India (15, 17–19). The most prominent Indo-Aryan languages today are Hindi, Bengali and Punjabi, while the Dravidian languages with the highest numbers of speakers today are Telugu, Tamil, Kannada and Malayalam.
Systematic analyses of HLA characteristics in different Indian populations are scarce. Most of the data published or documented in the Allele Frequency Net Database (AFND) are restricted to groups with very small sample sizes, a limited number of HLA loci, low-resolution HLA typing, or are based on geographically broadly defined samples (20). The largest study with published HLA data to date involved 18,220 Indian individuals, divided into 14 populations (n≥200) according to Indian state affiliation (21). Further studies focused on different language groups of South Indian individuals (22–27). In addition, high-resolution HLA-A, -B, -C, -DRB1 and -DQB1 allele and haplotype frequencies of privately banked Indian umbilical cord blood units were documented in the AFND for six geographically broad regions of India (‘North’, ‘East’, ‘South’, ‘West’, ‘Central’ and ‘Northeast’) (20).
To better understand the diversity of the Indian population and the needs of Indian patients regarding future donor recruitment, we characterized HLA allele and haplotype frequencies of donors registered with DKMS-BMST. We analyzed the HLA data of eight subpopulations, delineated by combining information on geographical origin and native language of both parents of the donor. Four of the eight subpopulations belong to the Indo-Aryan language group (Bengali, Gujarati, Hindi, Marathi) and four to the Dravidian (Kannada, Malayalam, Tamil, Telugu) language family. Furthermore, we analyzed the benefit of DKMS-BMST’s presence and ongoing expansion for Indian patients. Compared to existing studies, our analyses are based on larger and more precisely defined samples.
As of June 5, 2024, a total of 137,740 active stem cell donors were listed with DKMS-BMST. 6,722 (4.9%) of the donors were excluded from our analyses due to incomplete typing data, 47 (0.03%) due to missing information on state affiliation of the donor and 453 (0.3%) due to the occurrence of new alleles in the typing data (Supplementary Figure 1). The current study includes n=130,518 registered donors (sample IND-DKMS) with HLA-A, -B, -C, -DRB1, -DQB1 and -DPB1 typing data and optional information on the state affiliation of the donors’ parents (Supplementary Informations 1, 2), as well as the native languages of the parents. This information was obtained by donor self-assessment at registration. 69.0% of the donors were male, 31.0% female. With 67.2%, more than two-thirds were between 18 and 30 years old (Supplementary Figure 2). The three Indian states with the highest number of donors included in the study were Karnataka (n=35,043; 26.8%), Maharashtra (n=16,366; 12.5%), and Kerala (n=13,723; 10.5%). To achieve a good differentiation of the samples in our analysis, we considered geographical origin and language information of both parents. By setting the lower size limit to n=5,000, we obtained 8 population samples, which proceeded into our further analyses: the four Dravidian samples KAN (native language: Kannada, state of origin: Karnataka, n=10,360), TAM (Tamil, Tamil Nadu, n=7,698), TEL (Telugu, Andhra Pradesh, n=5,808), and MAL (Malayalam, Kerala, n=14,866) and the four Indo-Aryan samples BEN (Bengali, West Bengal, n=7,089), GUJ (Gujarati, Gujarat, n=6,221), HIN (Hindi, Uttar Pradesh, n=7,677), and MAR (Marathi, Maharashtra, n=8,169) (Figure 1, Supplementary Figure 1). The complete subsample drawn for the frequency estimation of the 8 population samples thus had a size of n=67,888, which corresponds to 52% of sample IND-DKMS.
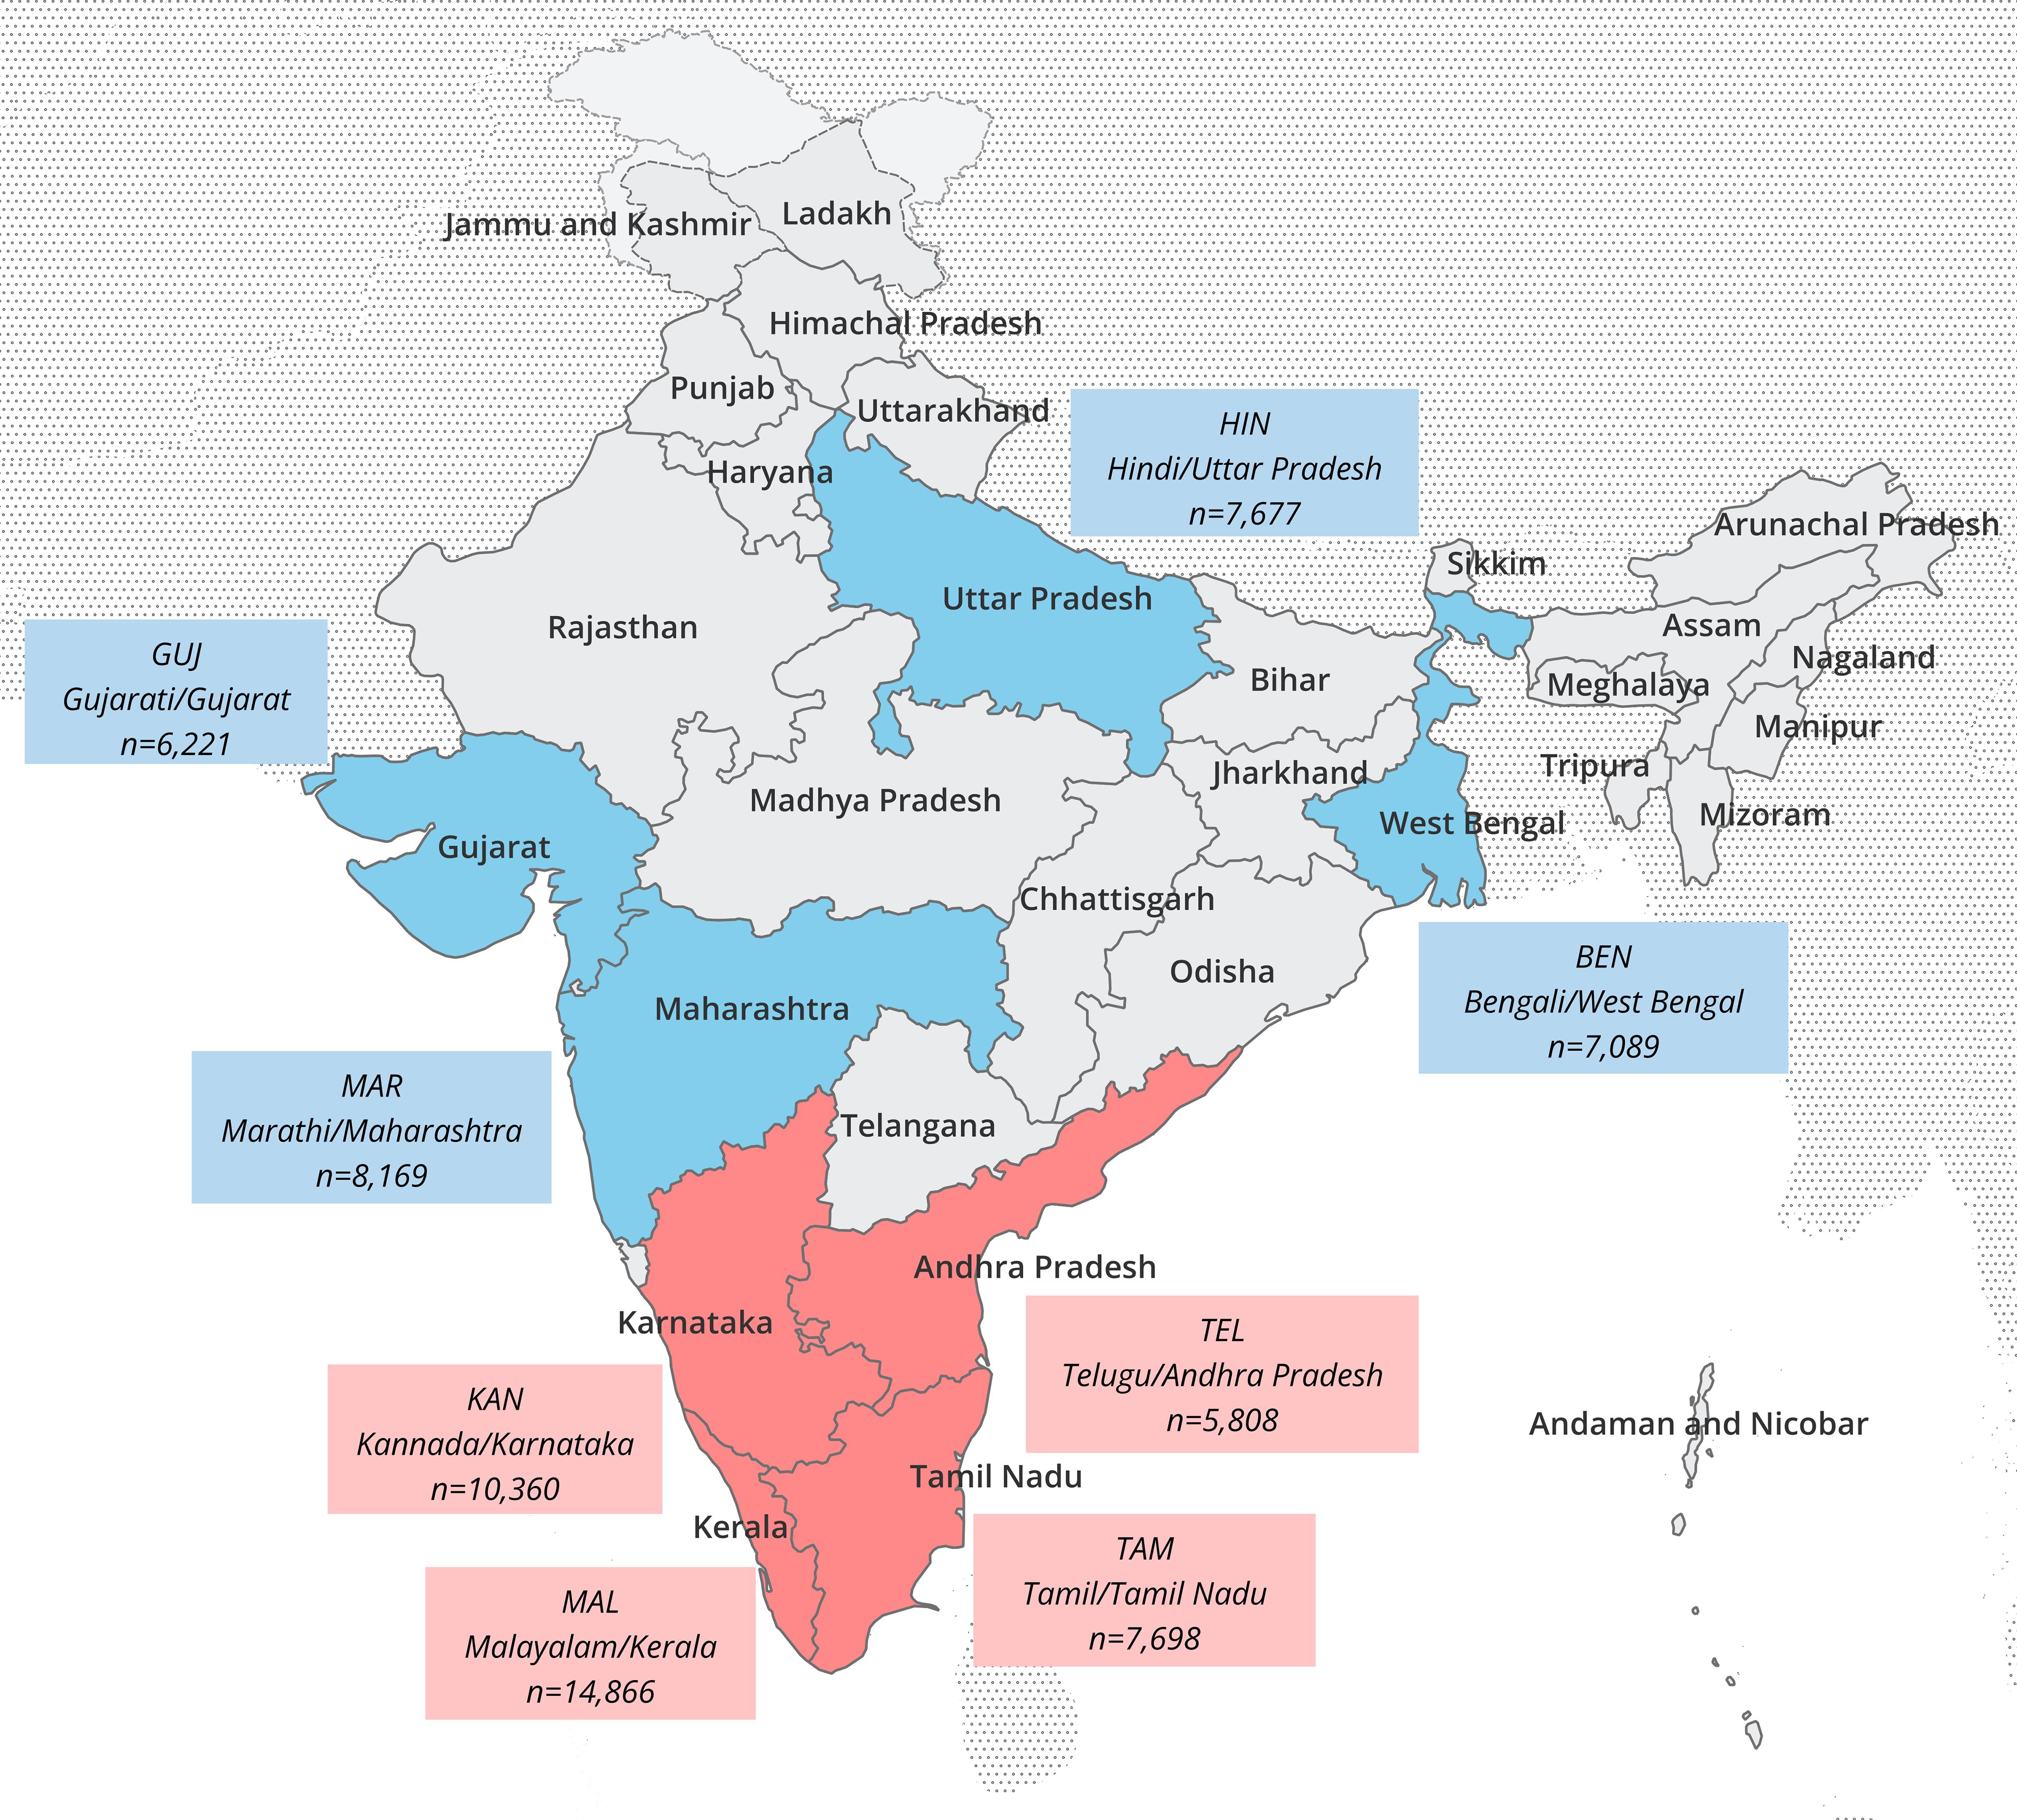
Figure 1. Map of India with subdivisions at state level. The state of origin and native language of both parents of the donors were decisive for the classification of the population samples. Language/state combinations and sizes of the 8 Indian analyzed population samples are indicated in the boxes (red: Dravidian language samples, blue: Indo-Aryan language samples).
For comparative analyses, we chose two reference populations with stem cell donors of Indian origin registered with DKMS UK (UK-IND, n=57,218) or DKMS Germany (DE-IND, n=4,703). Detailed information on the origin of these donors was not available. The donor file of DKMS-BMST (IND-DKMS; n=130,518) served as a further reference for the matching probability (MP) analyses.
All donor samples were genotyped in a standardized amplicon-based next-generation sequencing workflow on Illumina platforms at DKMS Life Science Lab in Dresden, Germany. Primers were designed to target exons 2 and 3 of HLA-A, -B, -C, -DRB1, -DQB1 and -DPB1 (28, 29). DNA samples were obtained via buccal swabs with the informed consent of the donors. The consent allowed the processing of anonymized donor data for research related to donor search or stem cell donation.
The in-house software Hapl-o-Mat (30, 31) was used to calculate five-locus (HLA-A, -B, -C, -DRB1 and -DQB1) and six-locus (plus HLA-DPB1) haplotype frequencies (HF). Hapl-o-Mat was developed to estimate HF from unphased genotypic data based on an expectation-maximization algorithm (32). To transform donor HLA typing data to a homogeneous output resolution, we used a group representation for synonymous mutations as previously described (33). In brief, alleles differing only in synonymous mutations in the relevant exons (HLA class I genes: exon 2 and 3; HLA class II genes: exon 2) were joined under a common allele group name and can be distinguished by the trailing letter ‘g’. Haplotype frequencies smaller than 1/(2n), the frequency corresponding to a haplotype occurring once in a population sample of size n, are of limited information and tend to be artifacts of the estimation process (34, 35). To balance loss of information against the inclusion of artifact haplotypes, haplotypes (sorted most to least frequent) with the lowest frequencies were discarded above the cumulative frequency of 0.995, which means that the HF presented sum up to a cumulative frequency of 99.5%.
Allele frequencies (AF) for all HLA loci were derived from the truncated HF due to typing ambiguities on g-group level in 3,873 of 130,518 individuals (3.0%) and thus also sum up to a cumulative frequency of 99.5%. For computational reasons, 2-locus HF and AF were determined from the full HF set in the linkage disequilibrium calculations.
The linkage disequilibrium (LD) coefficient D’ was calculated for all 2-locus allele pairs based on the full set of estimated 6-locus HLA haplotype frequencies (36, 37). P-values obtained from Fisher’s exact test were subjected to Holm-Bonferroni correction for multiple testing. LD was tested at significance level α=0.05. The LD of an allele pair in a specific population was considered to be relevant if it was significant, the associated D’ value was ≥0.9, and the allele pair had a haplotype frequency of f≥0.01.
Tests for significant deviation from Hardy-Weinberg equilibrium (HWE) expectations were carried out with Arlequin v3.5 (38) utilizing an extension of Fisher’s exact test based on Guo and Thompson (39). HWE testing was applied locus-wise using the genotypes on g-group resolution level. Large sample sizes are known to bear the risk to indicate significant results in HWE tests without actual relevance (40). We evaluated deviations from HWE expectations using the effect size statistic Wn (41) and by comparing observed and expected homozygosity of the population samples. Wn values range from 0 to 1. While values near 1 reflect a strong disequilibrium, values below Wn=0.1 were interpreted as an indicator of sufficient agreement with HWE. HWE analyses were not corrected for multiple testing, since this would bias the results toward HWE and lead to a loss of sensitivity.
Genetic distances (GD) among the eight population and two references samples were assessed as combined Cavalli-Sforza and Edwards chord distances (42). AF were derived from the 6-locus haplotypes taking into account frequencies up to a cumulative frequency of fcum ≤ 0.995 and normalized to 1 for the calculations of GD. Locus-wise chord distances were calculated using the formula , where j is the locus, n is the total number of alleles and fi and gi are the AF of the two populations at locus j. The global GD for each population pair was calculated as Euclidian overall distance , where m denotes the number of loci considered.
Multidimensional scaling (MDS) was performed in R 3.6.3 (43) using the cmdscale function. The goodness-of-fit (GOF) measure, which is based on the eigenvalues of the MDS solution and depends on the number of dimensions used, was applied to evaluate the quality of the distance values’ fit to the graphical representation. GOF values range between 0 and 1; higher values imply a better fit.
To visualize the genetic relationships of the Indian samples to other populations, samples from individuals of Chinese, German and Turkish descent from DKMS Germany, and from individuals of English, Bangladeshi, Pakistani and South East Asian descent from DKMS UK were included in a second GD calculation. These additional reference samples had a size of n=4,000 with the exception of the Chinese (n=3,705), Southeast Asian (n=1,243) and Bangladeshi (n=1,829) samples.
We defined the 10/10 MP as the likelihood that a random patient from a given population will find at least one fully matched donor from a given donor population. MP were calculated on the basis of 5-locus HF (HLA loci A, B, C, DRB1 and DQB1; 10/10 match) as described before (12, 33, 44, 45). To avoid an influence of different sample sizes on the calculated MP, we drew random samples of n=4,000 individuals from the different populations. Only haplotypes with frequencies up to a cumulative frequency of fcum ≤ 0.995 were considered and normalized to fcum=1 prior to calculating the MP (35).
We computed two different scenarios for the 8 Indian population samples and the two references: (I) Patients and donors are from the same population. (II) Patient populations vary, the donor population corresponds to the current composition of the donor file of DKMS-BMST (IND-DKMS) and grows with a constant relative population composition. While the first scenario sheds light on population-specific patient benefits through same-population donor recruitment, the second provides information on the extent to which the different populations would benefit from the growth of the registry under the assumption of a constant population ratio.
Based on scenario (I), we additionally calculated the MP for patients in their own donor pool for the 8 Indian populations allowing a single mismatch (HLA loci A, B, C, DRB1 and DQB1; ≥9/10 match).
First, we compared the number of distinct alleles that were present at least once in the typing data of the unambiguously resolved genotypes in the 8 Indian population samples (Supplementary Informations S9; S3-S8: not unambiguously present alleles highlighted in gray). The loci with the highest and lowest numbers of alleles were HLA-B (between 76 alleles in TEL and 104 in MAL) and HLA-DQB1 (between 22 alleles in BEN and 29 in MAL), respectively.
Accordingly, the cumulative frequencies of the 10 most frequent alleles by population and HLA locus reached the highest values for the HLA-DQB1 locus (between 92.6% in MAL and 96.2% in GUJ; Figure 2, Table 1, Supplementary Information S10) and the lowest for HLA-B (between 66.1% in TAM and 71.1% in KAN). No population consistently showed a particularly high or low allelic diversity. The GUJ sample, for example, had the lowest cumulated frequencies of the 10 most frequent alleles (“Top 10 alleles”) at HLA loci A and DRB1 (A: 80.7%; DRB1: 80.9%) and the highest cumulated frequencies at the DQB1 and DPB1 loci (DQB1: 96.2%; DPB1: 96.1%).
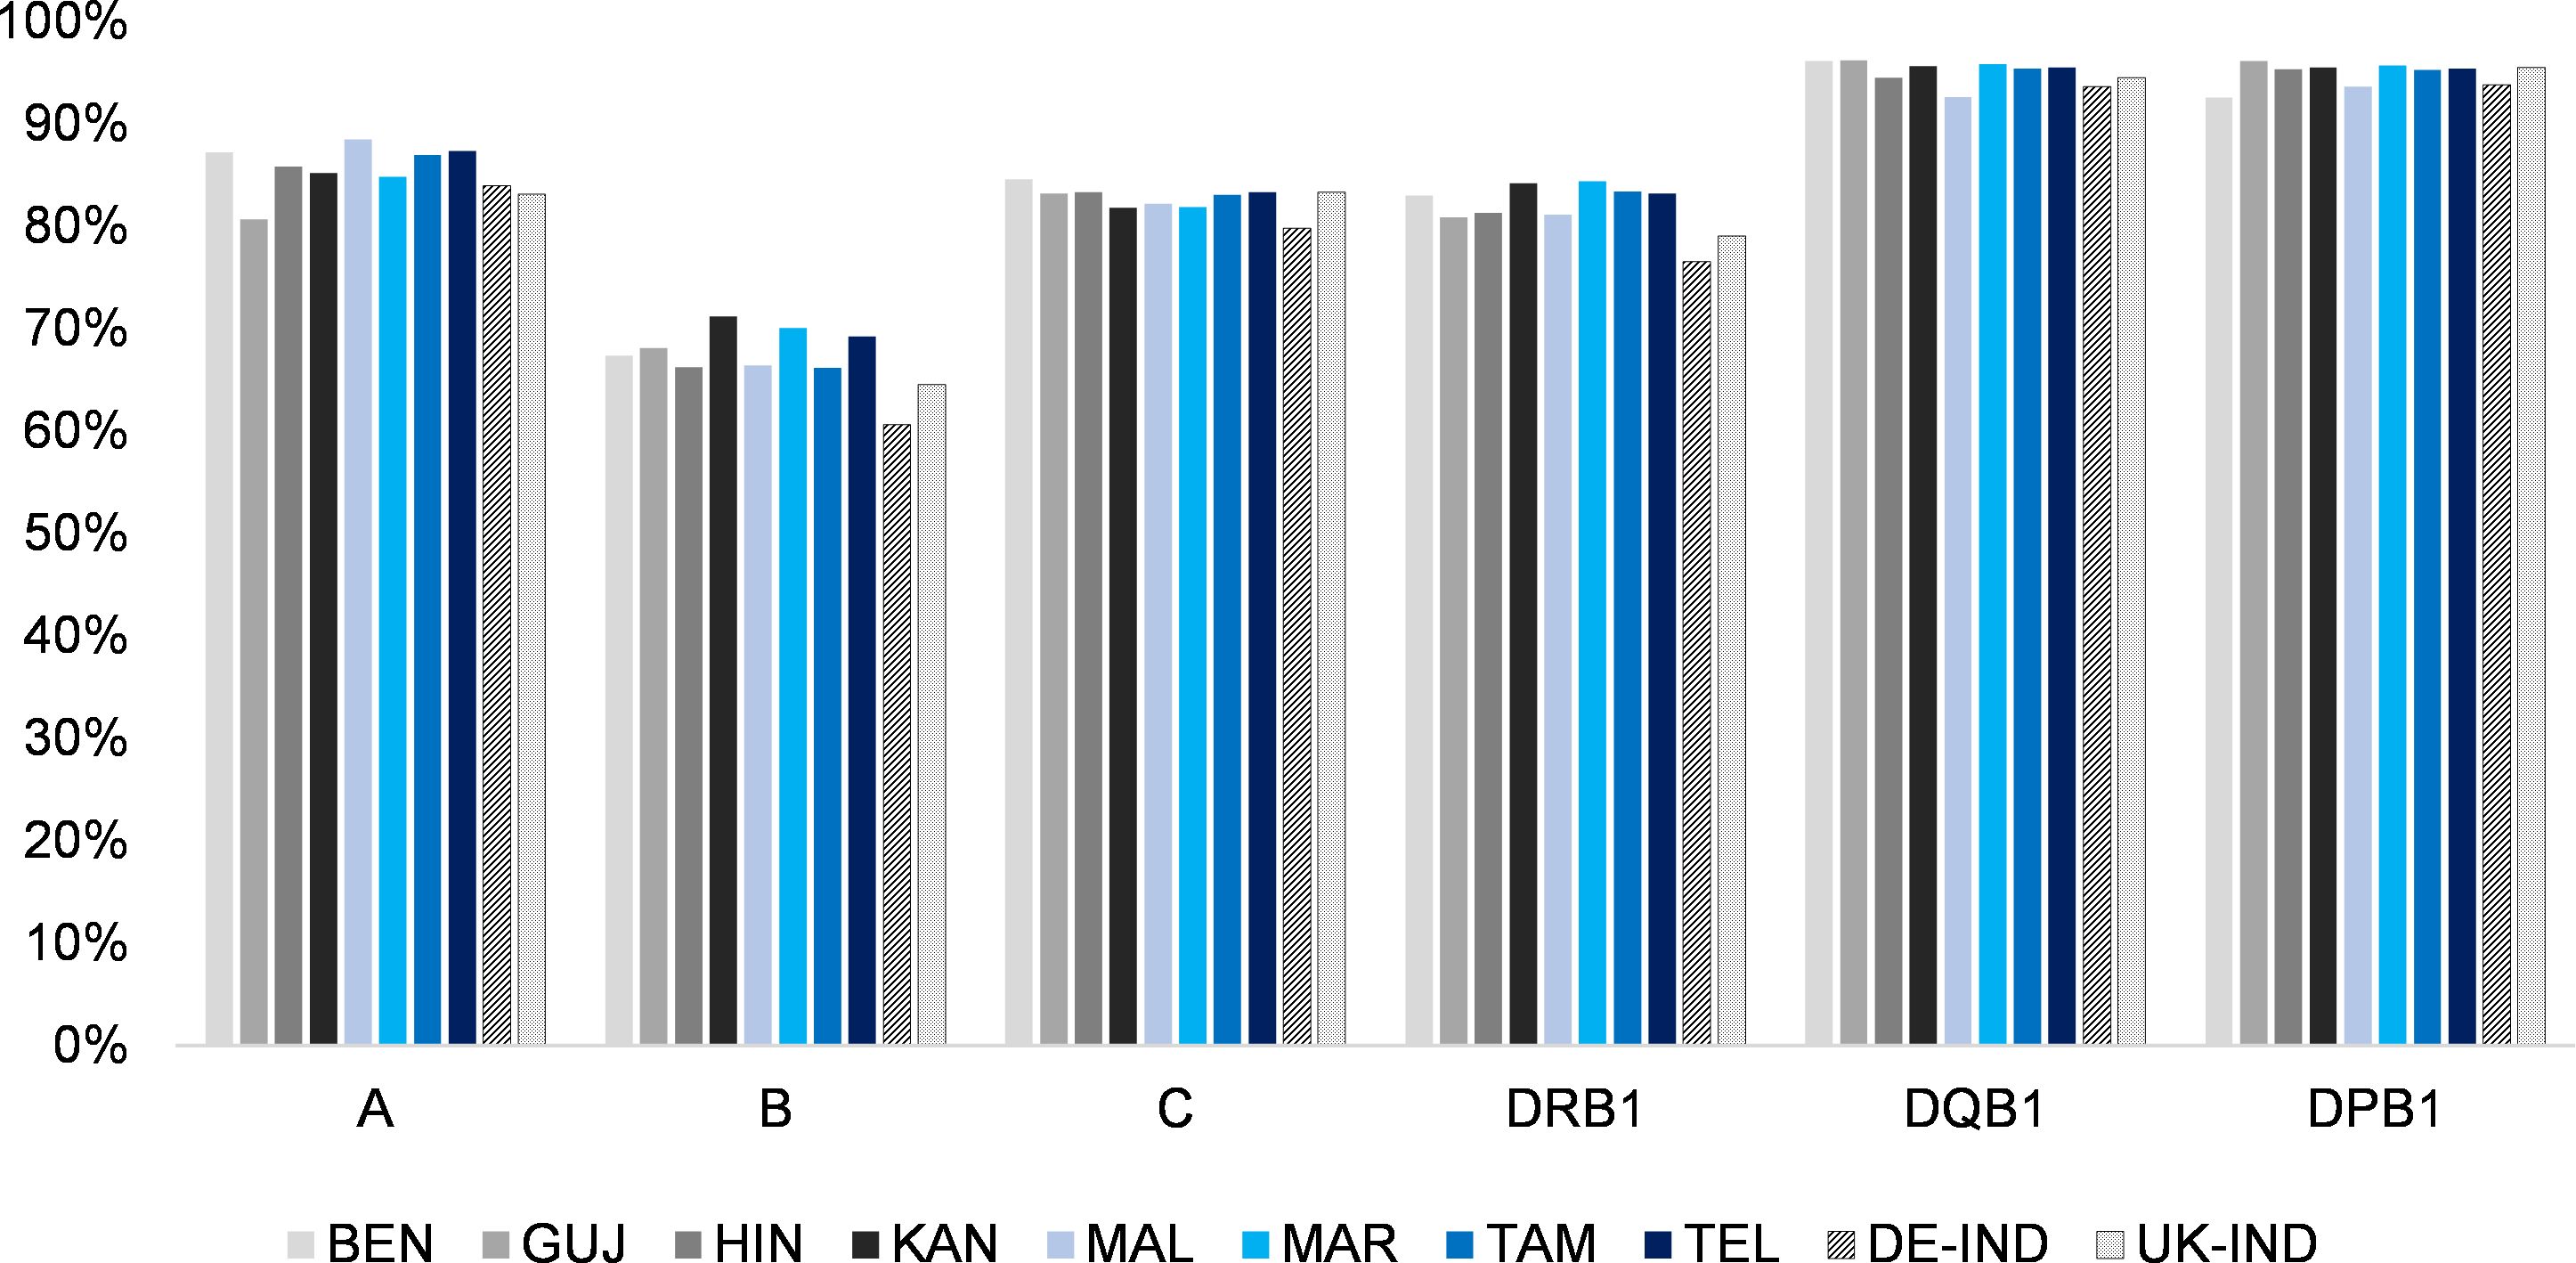
Figure 2. Cumulated frequencies of the respective 10 most frequent alleles of the 8 Indian population samples and the two reference samples for the different HLA loci (HLA-A, -B, -C, DRB1, -DQB1 and -DPB1). Abbreviations for the populations: BEN, Bengali/West Bengal; GUJ, Gujarati/Gujarat; HIN, Hindi/Uttar Pradesh; KAN, Kannada/Karnataka; MAL, Malayalam/Kerala; MAR, Marathi/Maharashtra; TAM, Tamil/Tamil Nadu; TEL, Telugu/Andhra Pradesh; DE-IND, donors of Indian origin registered with DKMS Germany; UK-IND, donors of Indian origin registered with DKMS UK.
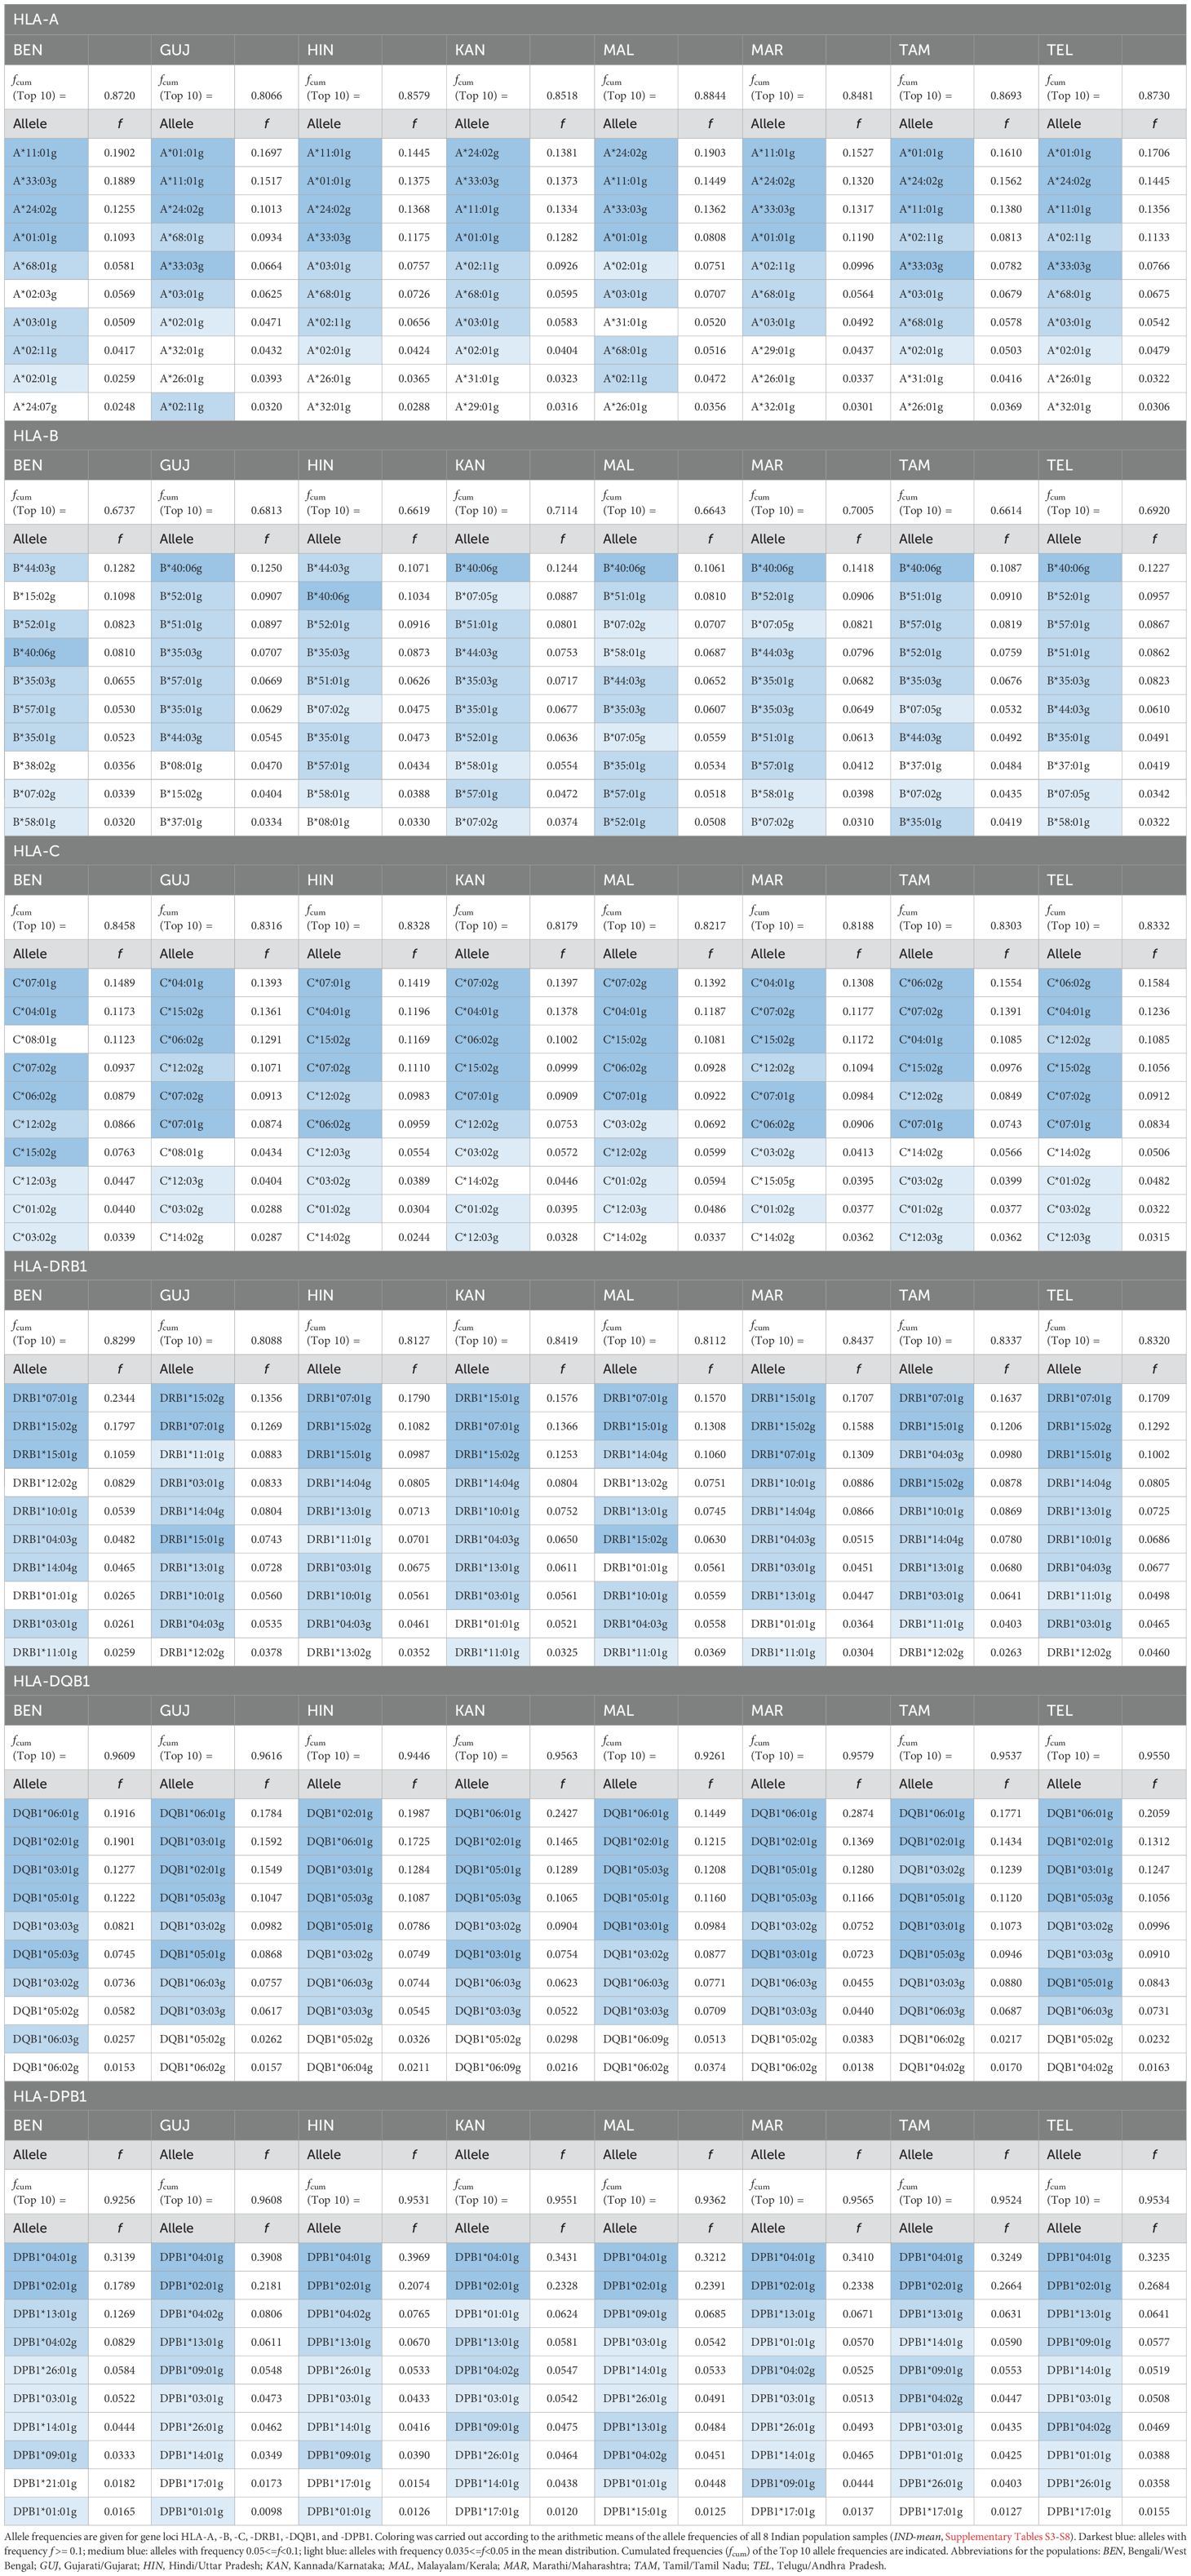
Table 1. Top10 allele frequencies of the 8 donor subsamples of DKMS-BMST.
In a comparison of allele frequency ranks between the samples, the results were generally consistent. Notably, for all loci, the five most frequent alleles (“Top 5 alleles”), based on the arithmetic means of the AF of the 8 Indian population samples (from here on referred to as “IND-mean”; Supplementary Information S3-S8) were present within the Top 10 alleles across all ten population samples, with the exception of HLA-B*51:01g (frequency rank #4 in IND-mean), which reached only rank #11 in the BEN sample. A direct frequency comparison of the union of the respective top 10 allele sets of the 8 Indian subsamples is shown in Supplementary Information S11.
For each locus, we determined the 5 allele-population combinations with the largest absolute AF deviations from the IND-mean sample (Table 2). The largest AF deviation found was that of DQB1*06:01g in the MAR sample (Δf=0.087, fMAR =0.287, fIND-mean=0.200). In the 30 allele-population combinations determined, the BEN sample appeared by far the most often, namely 11 times, followed by MAL with 4 times. Alleles represented more than once were A*33:03g, B*07:05g, C*06:02g, C*07:01g, DRB1*15:02g, DQB1*06:01g, DPB1*02:01 and DPB1*04:01g. A corresponding analysis regarding relative AF deviations from the IND-mean sample (larger AF in the numerator, only AF with an absolute deviation of |Δf|≥0.01 considered in order to avoid random findings; Supplementary Information S12) revealed the largest relative AF deviation for B*15:32g in the BEN sample (fBEN/fIND-mean=6.64, fBEN=0.014, fIND-mean=0.002). Again, the BEN sample appeared most often in the 30 allele-population combinations (12 times), followed by MAL (5 times). Alleles A*02:03g, B*07:05g, C*08:01g, DQB1*06:09g and DPB1*01:01g were included in more than one of the 30 allele-population combinations. Four alleles (B*07:05g, B*15:02g, C*08:01g, DRB1*12:02g) were included in the 30 allele-population combinations in both analyses.
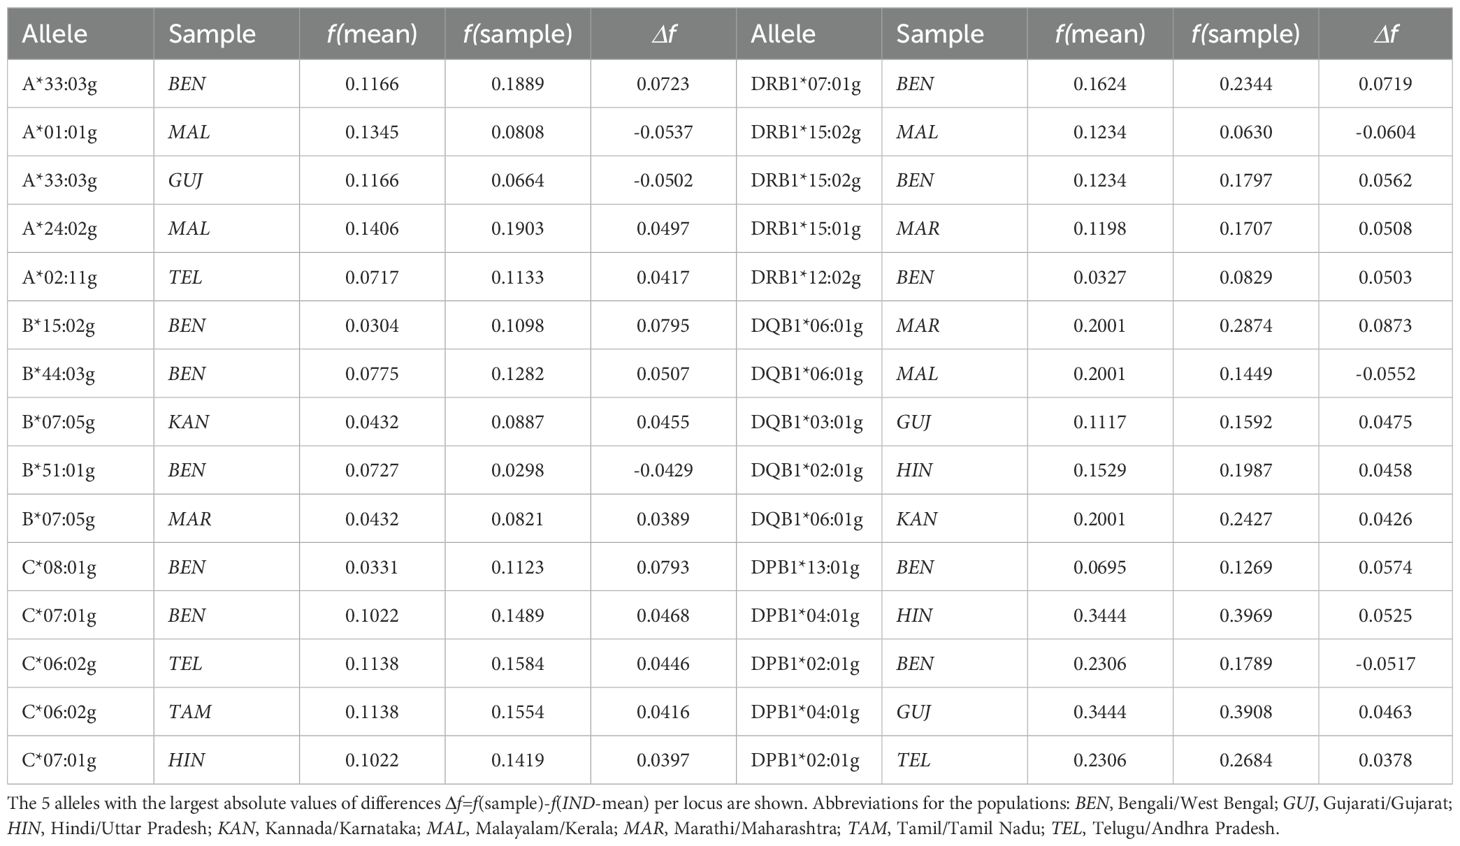
Table 2. Alleles with the largest absolute frequency differences to the arithmetic means of the 8 Indian population samples (IND-mean).
We calculated 5-locus (HLA-A, -B, -C, -DRB1 and -DQB1) and 6-locus (HLA-A, -B, -C, -DRB1, -DQB1 and -DPB1) haplotype frequencies for the 8 Indian population samples and the two reference samples (Table 3; a direct frequency comparison of the union of the respective Top 10 HF sets of the 8 Indian subsamples is shown in Figure 3; complete 5- and 6-locus HF are given in Supplementary Informations S13 and S14).
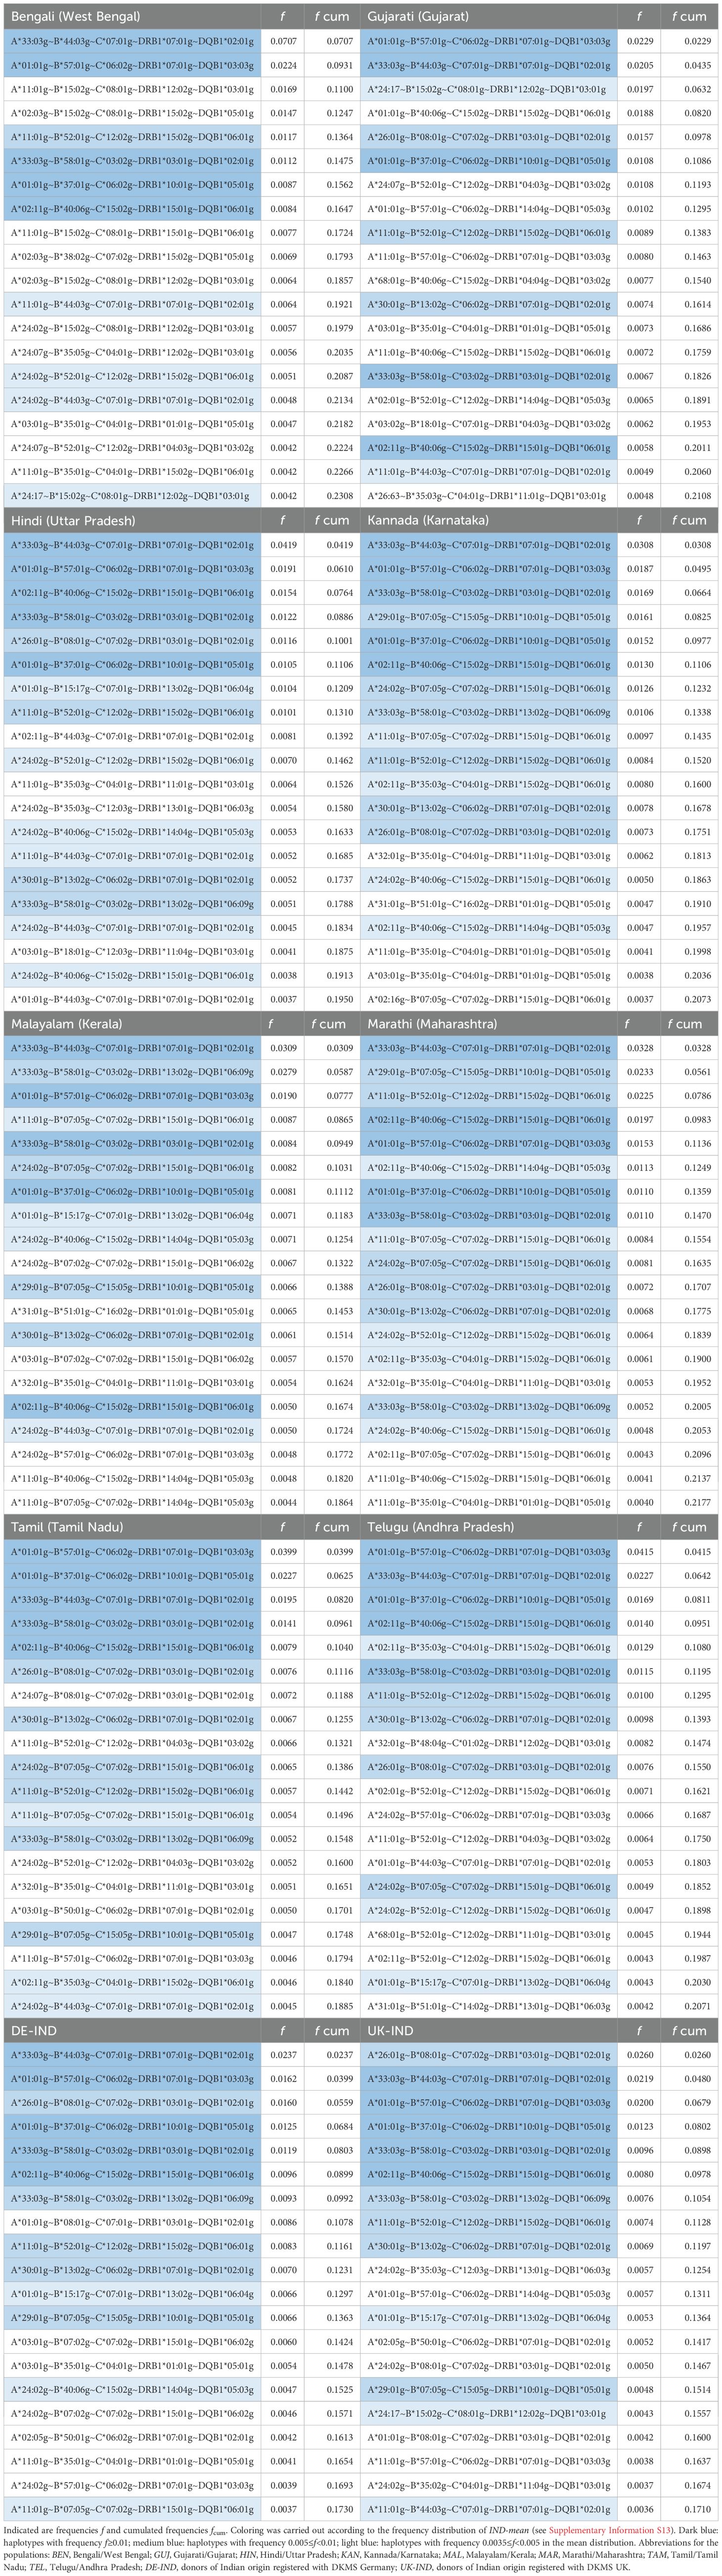
Table 3. Top 20 5-locus haplotypes of the 8 donor subsamples of DKMS-BMST.
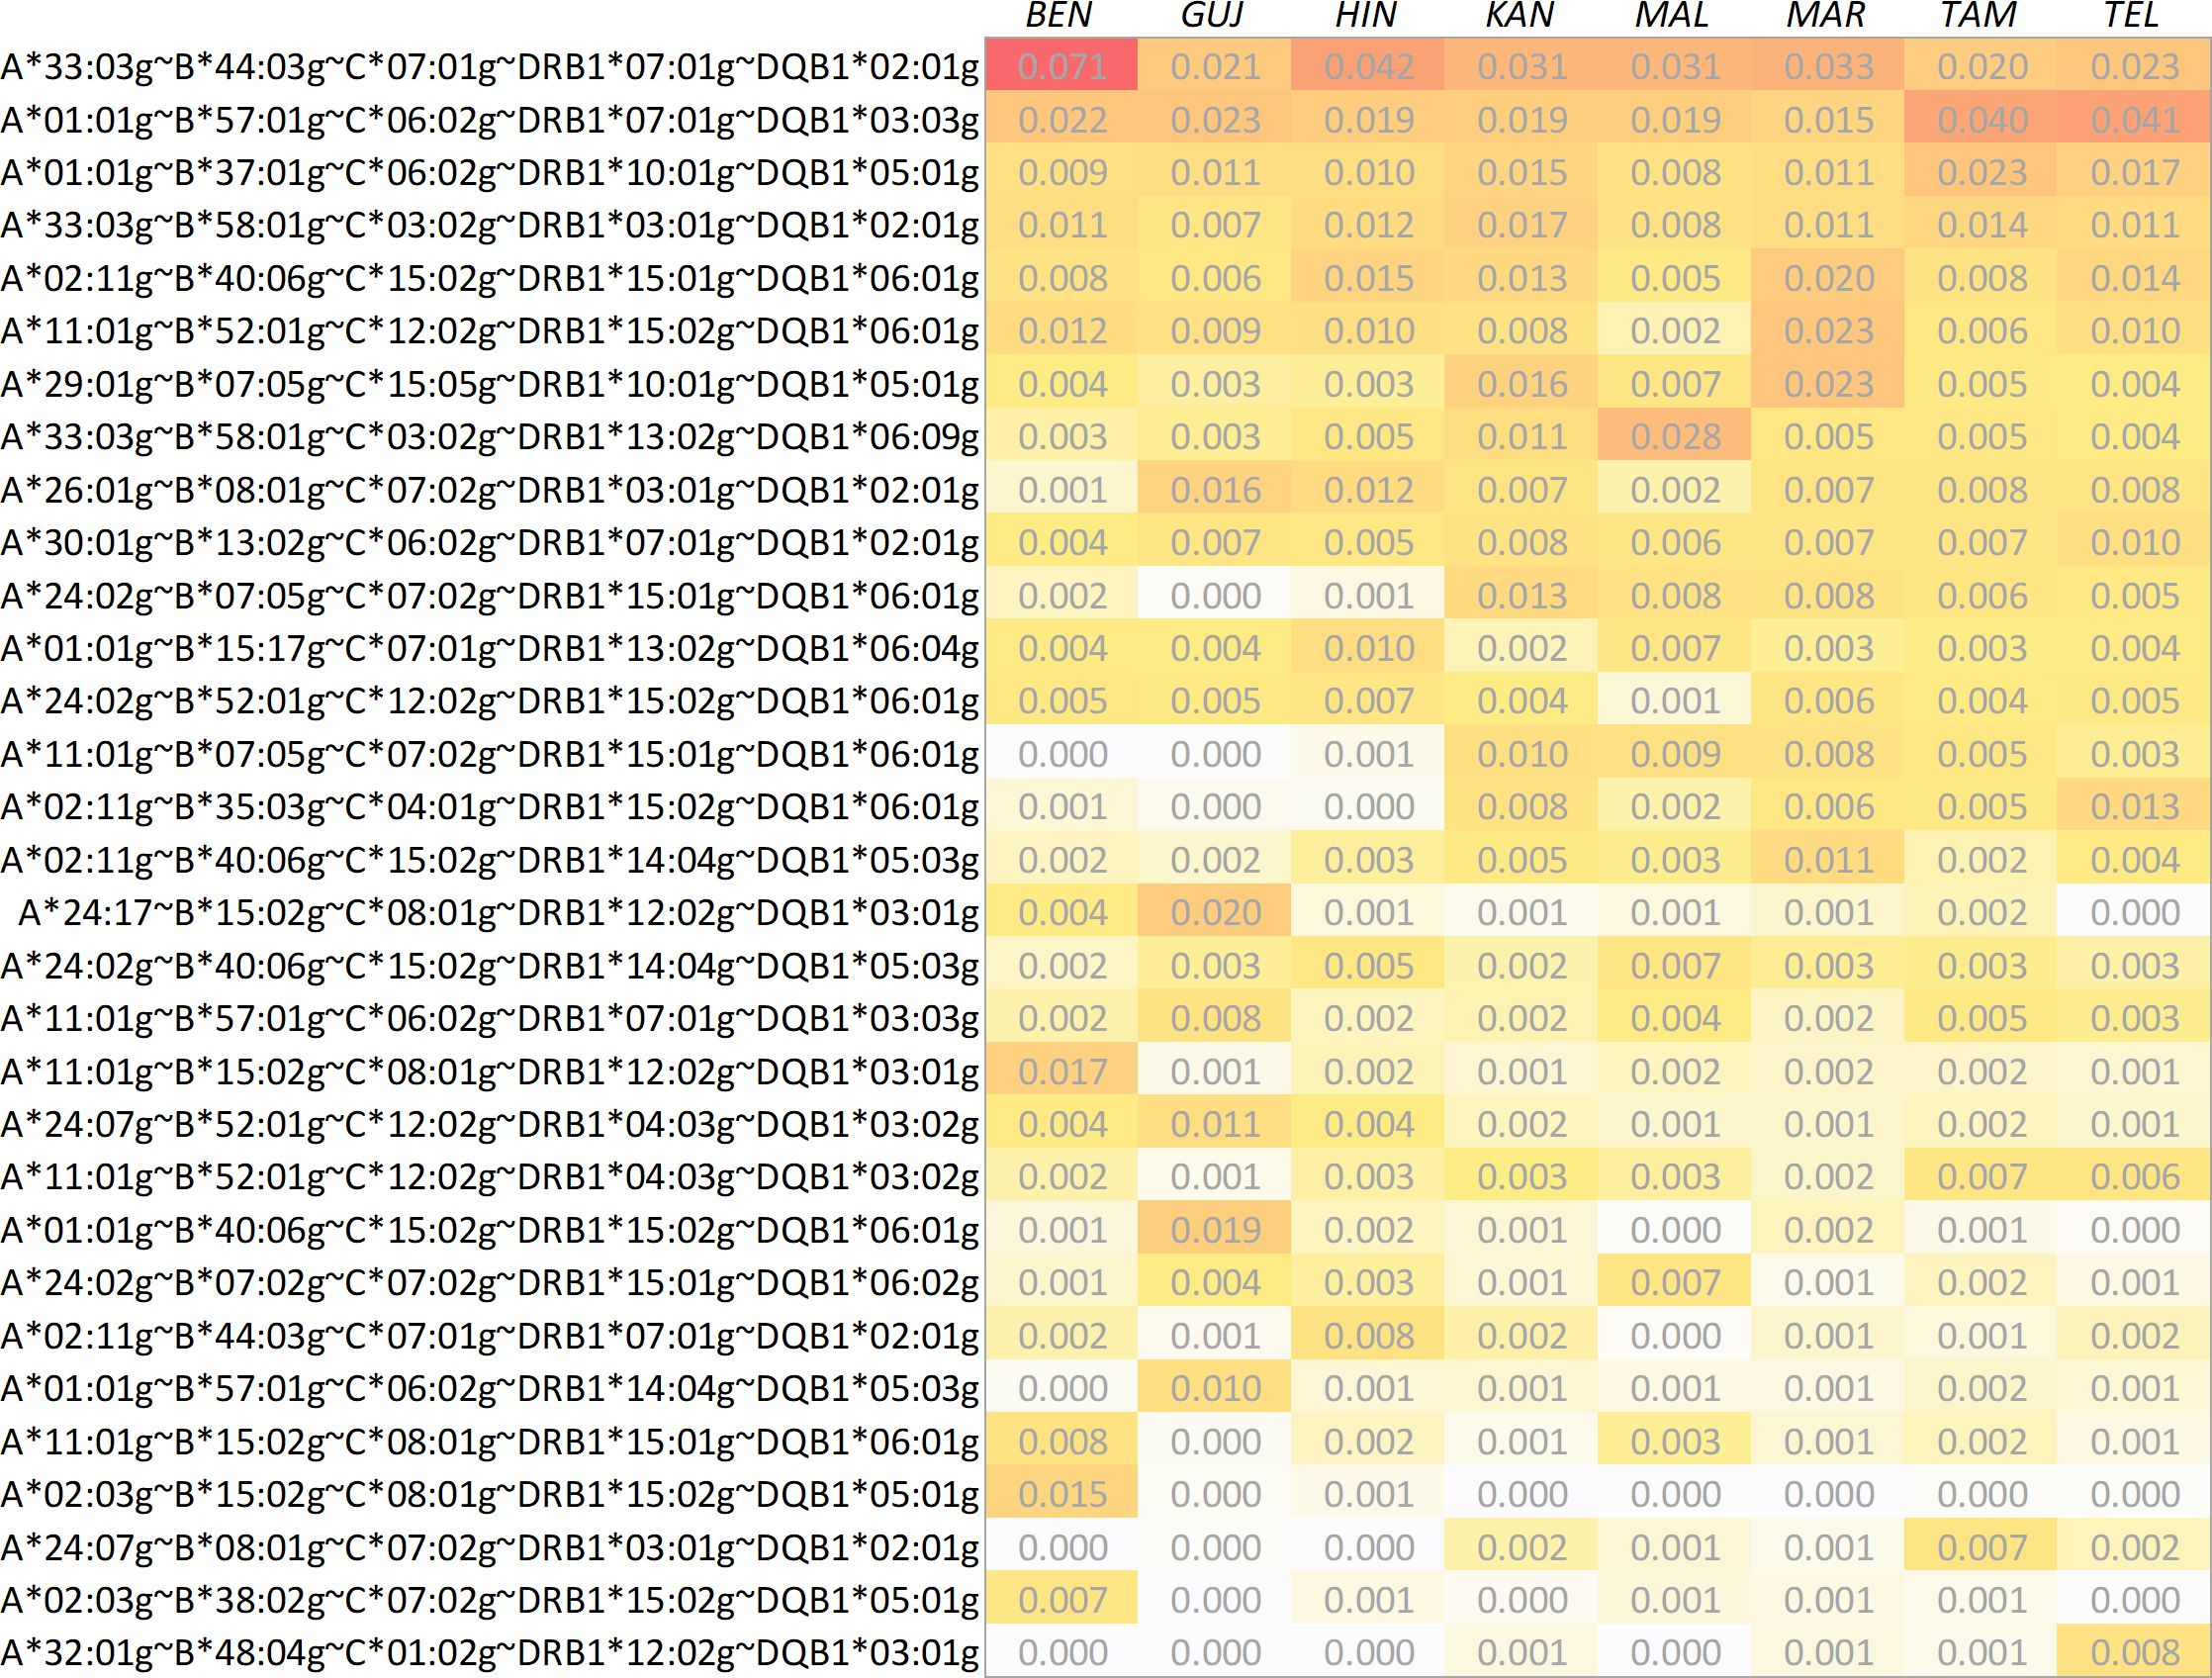
Figure 3. Direct comparison of haplotype frequencies of the 8 Indian population samples. The haplotypes shown correspond to the set union of the respective 10 most frequent haplotypes found in the samples. Haplotypes are ordered by descending arithmetic mean of the eight frequencies. Abbreviations for the populations: BEN, Bengali/West Bengal; GUJ, Gujarati/Gujarat; HIN, Hindi/Uttar Pradesh; KAN, Kannada/Karnataka; MAL, Malayalam/Kerala; MAR, Marathi/Maharashtra; TAM, Tamil/Tamil Nadu; TEL, Telugu/Andhra Pradesh.
The cumulated frequencies of the 20 most frequent 5-locus haplotypes of the 8 Indian population samples ranged between 18.6% (MAL, Table 3) and 23.1% (BEN). For the two reference samples DE-IND and UK-IND the corresponding values were 17.3% and 17.1%, respectively.
There were 5 haplotypes with frequencies f≥1% and 6 with frequencies between 0.5% and 1% in IND-mean (Supplementary Information S13). The 5 haplotypes with a frequency ≥1% were found in the Top 20 haplotypes of all 8 samples. The Top 20 haplotypes of the MAR and KAN samples showed the largest overlap with the Top 20 of IND-mean (16 and 15 identical haplotypes, respectively), the GUJ and BEN samples the lowest (9 identical haplotypes each). Only these two samples included haplotypes in their Top 5 that were not represented in the Top 20 of IND-mean, namely A*11:01g~B*15:02g~C*08:01g~DRB1*12:02g~DQB1*03:01g (#3 in BEN, #23 in IND-mean) and A*02:03g~B*15:02g~C*08:01g~DRB1*15:02g~DQB1*05:01g (#4 in BEN, #52 in IND-mean) for BEN and A*01:01g~B*40:06g~C*15:02g~DRB1*15:02g~DQB1*06:01g (#4 in GUJ, #27 in IND-mean) for GUJ. The Top 20 haplotypes of the two reference samples contained 13 (DE-IND) and 12 (UK-IND) of the Top 20 haplotypes of IND-mean.
In total, 27,366 different 5-locus haplotypes were found in the 8 Indian population samples, only 252 thereof shared by all samples. The lowest cumulated haplotype frequencies of these shared haplotypes were found in the MAL (36.4%) and the BEN (40.6%) samples, the highest with 43.5% each in MAR and TEL (Supplementary Information S15).
We determined the 5 haplotype-population combinations with the largest absolute HF deviations from the IND-mean sample (Table 4). The largest HF deviation was seen for A*33:03g~B*44:03g~C*07:01g~DRB1*07:01g~DQB1*02:01g in the BEN sample (Δf=0.037, fBEN=0.071, fIND-mean=0.034), the by far most frequent haplotype in any of the samples. In the corresponding analysis with relative HF deviations from the IND-mean sample (larger HF in the numerator, only HF with an absolute deviation of |Δf|≥0.0025 considered), the haplotype A*11:01g~B*07:05g~C*07:02g~DRB1*15:01g~DQB1*06:01g (rank #14 in IND-mean, fIND-mean=0.005) occupied the first and the third rank as it only reached very small frequencies in the BEN and GUJ samples (Supplementary Information S16).
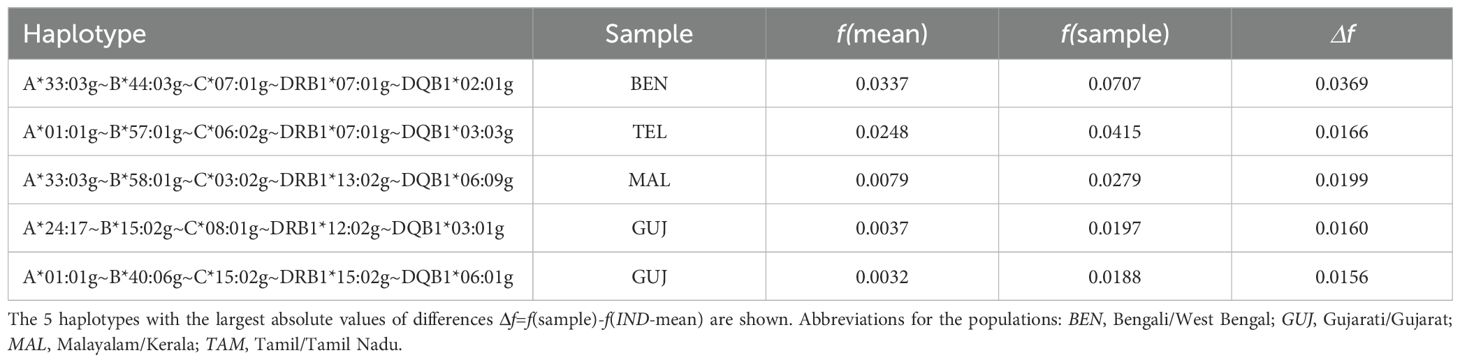
Table 4. Haplotypes with the largest absolute frequency differences to the arithmetic means of the 8 donor subsamples (IND-mean).
Due to their relevance to the field of unrelated HSCT, detailed analyses and characterizations were limited to the 5-locus HF. 6-locus HF included the additional locus HLA-DPB1. Since the cumulative frequencies of the 10 most frequent alleles by population reached the second highest values of all loci (between 92.6% in BEN and 96.1% in GUJ; Figure 2, Table 1, Supplementary Information S10), the addition of HLA-DPB1 led to a moderate increase in haplotypes (Supplementary Information S14). The highest increase in haplotypes by the addition of locus HLA-DPB1 was found for the MAL sample (n5loc = 5,247, n6loc=9,228, +75.9%), the lowest for the HIN sample (n5loc=4,477, n6loc=6,752, +50.8%). The frequencies of the first-rank haplotype per population sample ranged from fMAL=0.013 to fBEN=0.035, and the cumulated frequencies of the 20 most frequent haplotypes per population sample still ranged from 11.0% (MAL) to 15.0% (BEN).
In total, we found 42 allele pairs that showed a relevant LD (defined as a statistically significant LD (p<0.05) with D’≥0.9 and f(ab)≥0.01) in at least one of the 8 Indian population samples (Table 5; complete lists of allele pairs in significant LD and a haplotype frequency that corresponds to at least a fourfold representation in the sample (f≥4/2n, where n is the sample size) for the 8 population samples are given in Supplementary Information S17). Of these 42 pairs, 21 each belonged to the partial haplotype B~C and to the partial haplotype DRB1~DQB1. The number of allele pairs with relevant LD by sample ranged from 22 (KAN; 11 B~C, 11 DRB1~DQB1) to 27 (GUJ; 13 B~C, 14 DRB1~DQB1). Four of the B~C and 8 of the DRB1~DQB1 allele pairs showed a relevant LD in all 8 samples (Table 5).
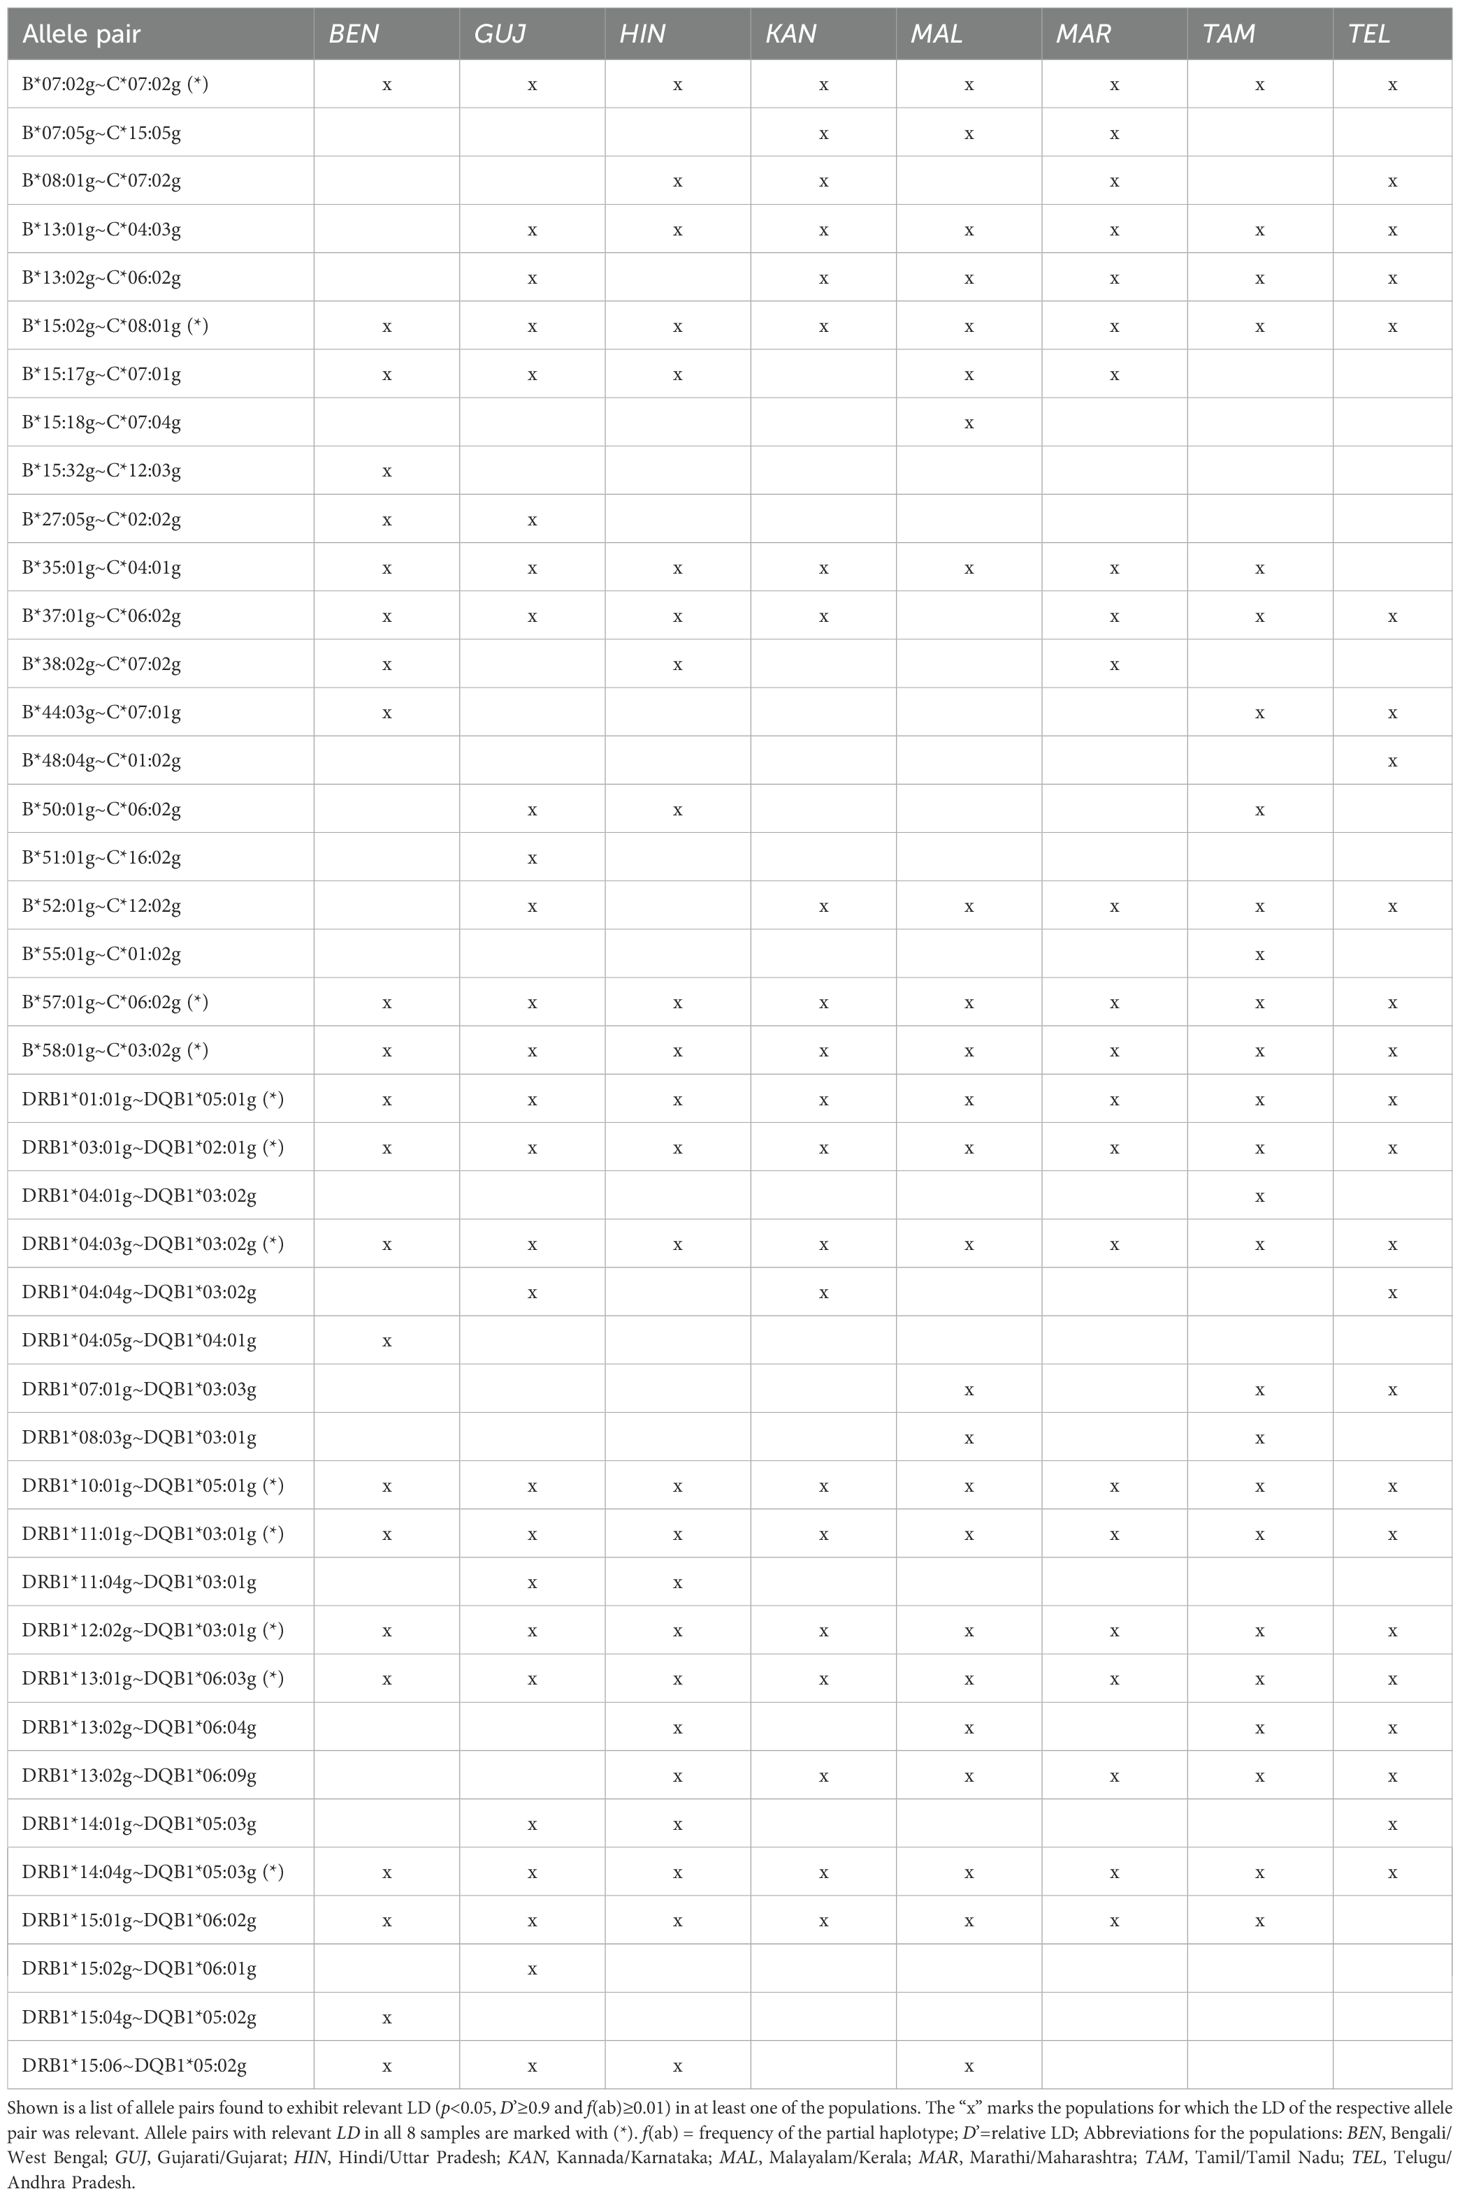
Table 5. Two-locus linkage disequilibria (LD) of the 8 Indian donor samples.
The number of loci with significant deviations from HWE expectations ranged from 1 (HLA-B in the MAR sample) to 6 (GUJ and DE-IND) (Supplementary Information S18). However, small effect size values indicated only moderate deviations from HWE. The highest value observed in all samples was Wn=0.016 for HLA-B in the DE-IND sample. We found that deviations from HWE expectations indicated an excess of homozygosity for all affected loci. Deviations from HWE in this direction have been shown not to affect significantly the HF estimation using the EM algorithm (46). Overall, the results of the HWE tests do not represent a limitation for the analyses conducted in this work.
The multidimensional scaling of the global GD (Figure 4A), which integrated the distance values of all six analyzed HLA loci, indicated a division of the eight Indian population samples into three different clusters. Consistent with observations from previous studies on HLA variation in human populations, the MDS results roughly corresponded to the actual geographic location of the populations (47, 48). A distinct Southern cluster was formed by the four Dravidian population samples KAN, MAL, TAM and TEL and the Indo-Aryan MAR population sample. The two Indo-Aryan samples HIN and GUJ grouped together in a Northern cluster, while the BEN sample was set distant (Eastern) from all others. The reference samples DE-IND and UK-IND were located close to the Northern genetic cluster.
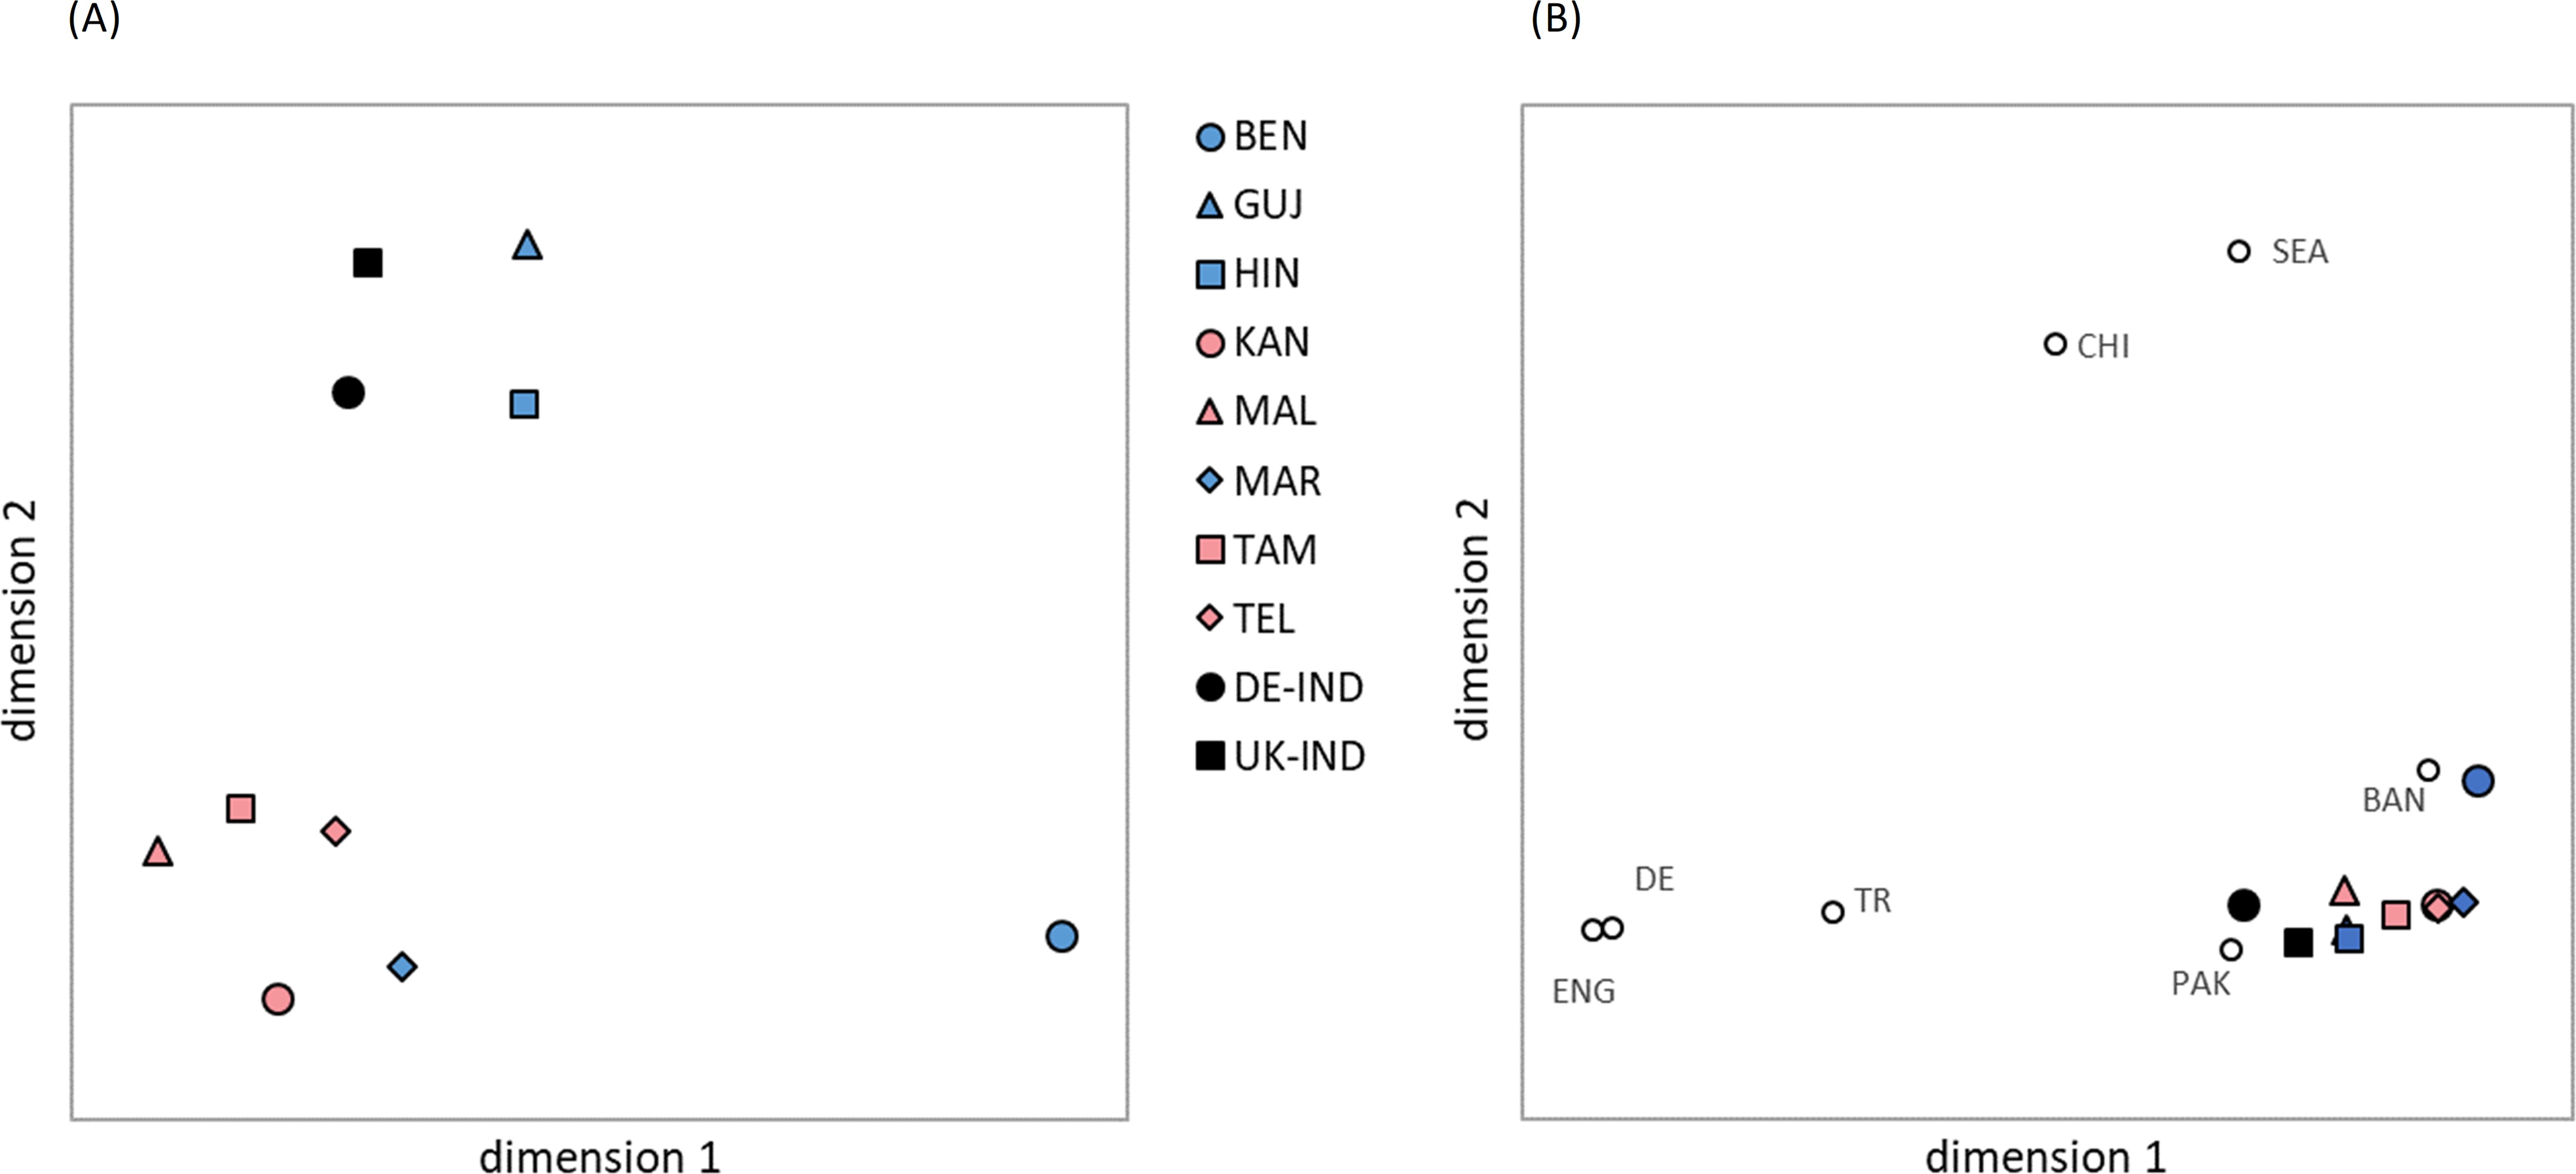
Figure 4. Genetic distances (Euclidian overall distances computed from single-locus Cavalli-Sforza and Edwards chord distances involving loci HLA-A, -B, -C, DRB1, -DQB1 and -DPB1) visualized by multidimensional scaling. (A) The 8 Indian population samples and two reference samples DE-IND and UK-IND. Dimensions 1 and 2 explain 30.9% and 27.8% of the variance, respectively. (B) The 8 Indian population samples and two reference samples DE-IND and UK-IND combined with further reference samples from different ancestries. Dimensions 1 and 2 explain 40.8% and 31.8% of the variance, respectively. Abbreviations for the populations: BEN, Bengali/West Bengal; GUJ, Gujarati/Gujarat; HIN, Hindi/Uttar Pradesh; KAN, Kannada/Karnataka; MAL, Malayalam/Kerala; MAR, Marathi/Maharashtra; TAM, Tamil/Tamil Nadu; TEL, Telugu/Andhra Pradesh; DE-IND, donors of Indian origin registered with DKMS Germany; UK-IND, donors of Indian origin registered with DKMS UK; BAN, donors of Bangladeshi origin in DKMS UK; CHI, donors of Chinese origin in DKMS DE; DE, donors of German origin in DKMS DE; ENG, donors of English origin in DKMS UK; PAK, donors of Pakistani origin in DKMS UK; SEA, donors of Southeast Asian origin in DKMS UK; TR, donors of Turkish origin in DKMS DE.
Despite the moderate GOF value of 0.587 (variance explained by the two dimensions: 30.9% and 27.8%), the GD visualization effectively represents the pattern of genetic distances calculated among the analyzed samples (Supplementary Information S19A). We found the smallest genetic distance between the 8 population samples from India within the Southern cluster of the two-dimensional scaling visualization for KAN and MAR (d=0.178), followed by TAM-TEL (d=0.213) and KAN-TAM (d=0.249). The three greatest distances were all seen for the Bengali sample, namely BEN-MAL (d=0.538), BEN-TAM (d=0.498) and BEN-GUJ (d=0.480). The smallest distance between BEN and the remaining samples was BEN-HIN (d=0.427). HIN and GUJ, the two population samples that formed the Northern cluster were also closely related (d=0.277), but distant to the remaining population samples from India. Overall, the GD reflected the geographic and linguistic relationships of the 8 populations well, with the notable exception of the Marathi sample which was genetically distinctly closer to the neighboring Dravidian KAN population (d=0.178) than to the neighboring Indo-Aryan GUJ sample (d=0.398).
The two reference samples DE-IND and UK-IND were genetically closer related to each other (d=0.193) than to any of the 8 Indian populations (Supplementary Information S19A). Among the latter, UK-IND exhibited the closest genetic relation to the Northern Indian populations HIN (d=0.216) and GUJ (d=0.235). Similarly, DE-IND showed the smallest GD to HIN (d=0.252), followed by larger distance values to GUJ (d=0.318) and the South Indian TAM (d=0.323) and MAL (d=0.326) samples. The largest GD of the two references were determined for BEN (UK-IND: d=0.507, DE-IND: d=0.492).
The main findings on the genetic overall distances among the 8 population samples and the two references were also reflected in the genetic distances of the individual loci, with minor exceptions in the sequence. For example, for locus HLA-DQB1, the distances for TEL-GUJ (d=0.084) and TEL-HIN (d=0.094) were smaller than that for KAN-TAM (d=0.100) (Supplementary Information S19A).
When comparing the Indian population samples with other reference samples of different ancestry, the multidimensional scaling of the global GD (Figure 4B; Supplementary Information S19B) showed a division into a Southeast/East Asian wing containing the Bangladeshi, Southeast Asian and Chinese samples, and a Northwest Eurasian wing containing the Pakistani, Turkish, English and German samples, again roughly in line with geographic location. The Indian population samples were scaled in a tight cluster between the two wings, with the exception of the BEN sample, which revealed a closer relationship with the neighboring Bangladeshi sample than with any of the other Indian samples. From the cluster of Indian population samples, especially the North Indian populations HIN and GUJ as well as the DE-IND and UK-IND references were oriented toward the Northwest Eurasian wing and showed a close genetic relationship to the Pakistani sample. The GOF of the graphic representation in Figure 4B reached 0.803 (variance explained by the two dimensions: 40.8% and 31.8%).
In the first scenario, we calculated 10/10 MP for identical donor and patient populations (Figure 5A, see Supplementary Information S20A for MP values at different registry sizes). The MP curves of the 5 Indian population samples KAN, MAL, MAR, TAM and TEL of the Southern cluster in the GD analysis (Figure 4A) showed a rather similar course. At a registry size of n=100,000, the MP for these 5 populations were between p=0.354 (TAM) and p=0.382 (TEL). The MP values of HIN remained consistently below these curves (p=0.333 at n=100,000). The MP curve of the BEN sample started with higher values than all other curves, but aligned with the 5 similar curves at registry sizes beyond n=100,000 (pBEN=0.397 at n=100,000). For registry sizes of around n=2,300 and higher, the MP curve of GUJ initially ran between the MP curves of BEN and the remaining six Indian subpopulations and above all seven from around n=40,000 donors onwards (pGUJ=0.422 at n=100,000). The two reference population samples, DE-IND and UK-IND, showed lower MP values, as would be expected from samples which represent pools of Indian donors of unspecified origin. While the MP curve of UK-IND ran closer below the curve of the HIN sample with p=0.311 at n=100,000, the MP of the DE-IND sample only reached p=0.265 at that donor file size. In this scenario, MP variation reflects differences between HF distributions of the various samples (Supplementary Information S22). In the case of the BEN sample, for example, the high MP for very small donor file sizes can be attributed to A*33:03g~B*44:03g~C*07:01g~DRB1*07:01g~DQB1*02:01g. This haplotype block is the by far most frequent among the 10 population samples examined with a frequency of 7.4% (estimated from the reduced sample with n=4,000; f=7.1% estimated from the original sample with n=4,114 donors; Table 3).
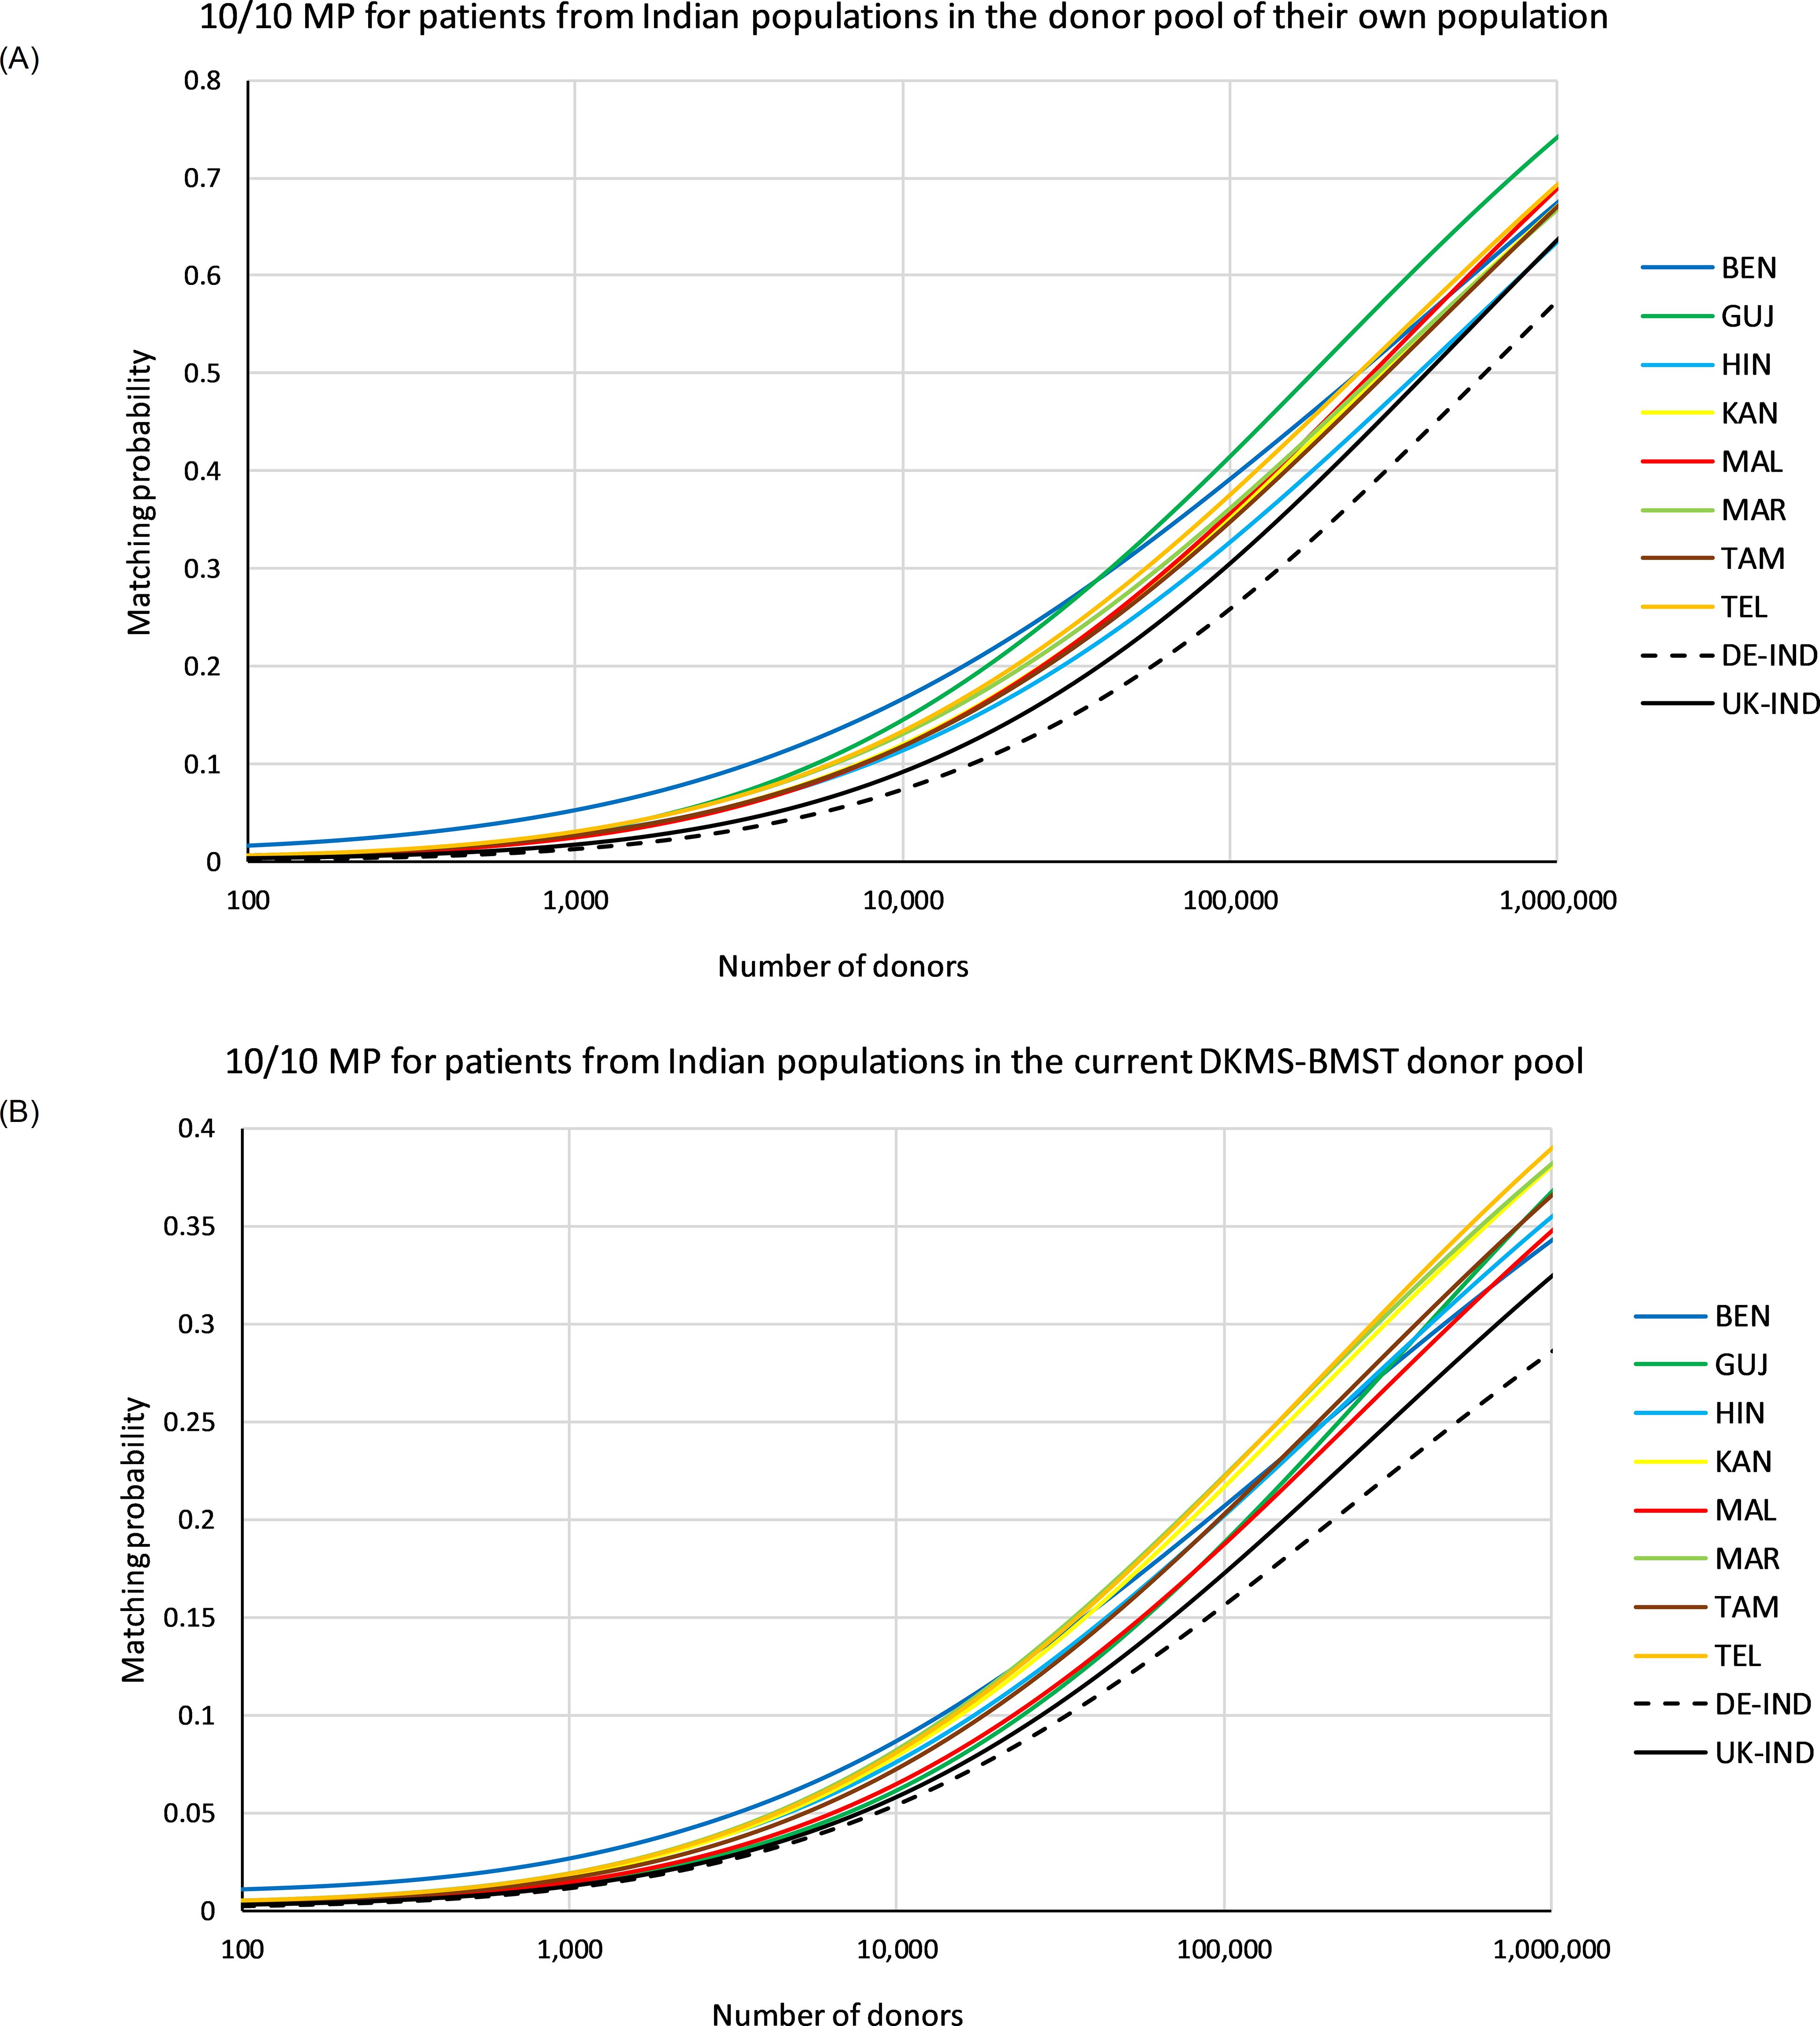
Figure 5. 10/10 matching probabilities (MP). (A) MP for patients of the different populations in their own donor pool. (B) MP for patients of the different populations in a donor population fixed according to the current composition of the DKMS-BMST donor file (sample IND-DKMS). Abbreviations for the populations: BEN, Bengali/West Bengal; GUJ, Gujarati/Gujarat; HIN, Hindi/Uttar Pradesh; KAN, Kannada/Karnataka; MAL, Malayalam/Kerala; MAR, Marathi/Maharashtra; TAM, Tamil/Tamil Nadu; TEL, Telugu/Andhra Pradesh; DE-IND, donors of Indian origin in DKMS Germany; UK-IND, donors of Indian origin in DKMS UK.
In the second scenario, 10/10 MP were computed for varying patient populations and a donor pool fixed to a population composition according to the current DKMS-BMST donor file (Figure 5B, Supplementary Information S20B). Patients from Southern Indian populations had essentially the highest MP at the current DKMS-BMST registry size and above. The Top 3 populations in terms of MP at this scale were MAR, TEL and KAN. At a registry size of n=100,000, the MP for these patient populations ranged from p=0.220 (KAN) to p=0.226 (MAR), and at registry size n=1,000,000 from p=0.383 (KAN) to p=0.392 (TEL). Patients from these Southern Indian populations may benefit from their close genetic relatedness, which increases the chances of finding a matched donor outside their own population. Of this population cluster, only MAL showed a lower MP (ranks #8 for n=100,000 and #7 for n=1,000,000; Figure 5B, Supplementary Information S20B). One might assume that population-specific MP reflect the respective donor shares in the IND-DKMS sample in this scenario. However, Spearman’s ρ revealed a weak negative correlation between donor numbers and MP, e.g. ρ=-0.14 for n=100,000. The two reference population samples had the lowest MP values again in this scenario (pUK-IND=0.176, pDE-IND=0.159; n=100,000).
The permission of one single mismatch (≥9/10 MP) between patient and donor in the scenario with identical patient and donor population increased MP to considerably higher values (Figure 6, see Supplementary Information S21 for MP values at different registry sizes). At a registry size of n=100,000, ≥9/10 MP ranged between p=0.602 (HIN) and p=0.694 (GUJ).
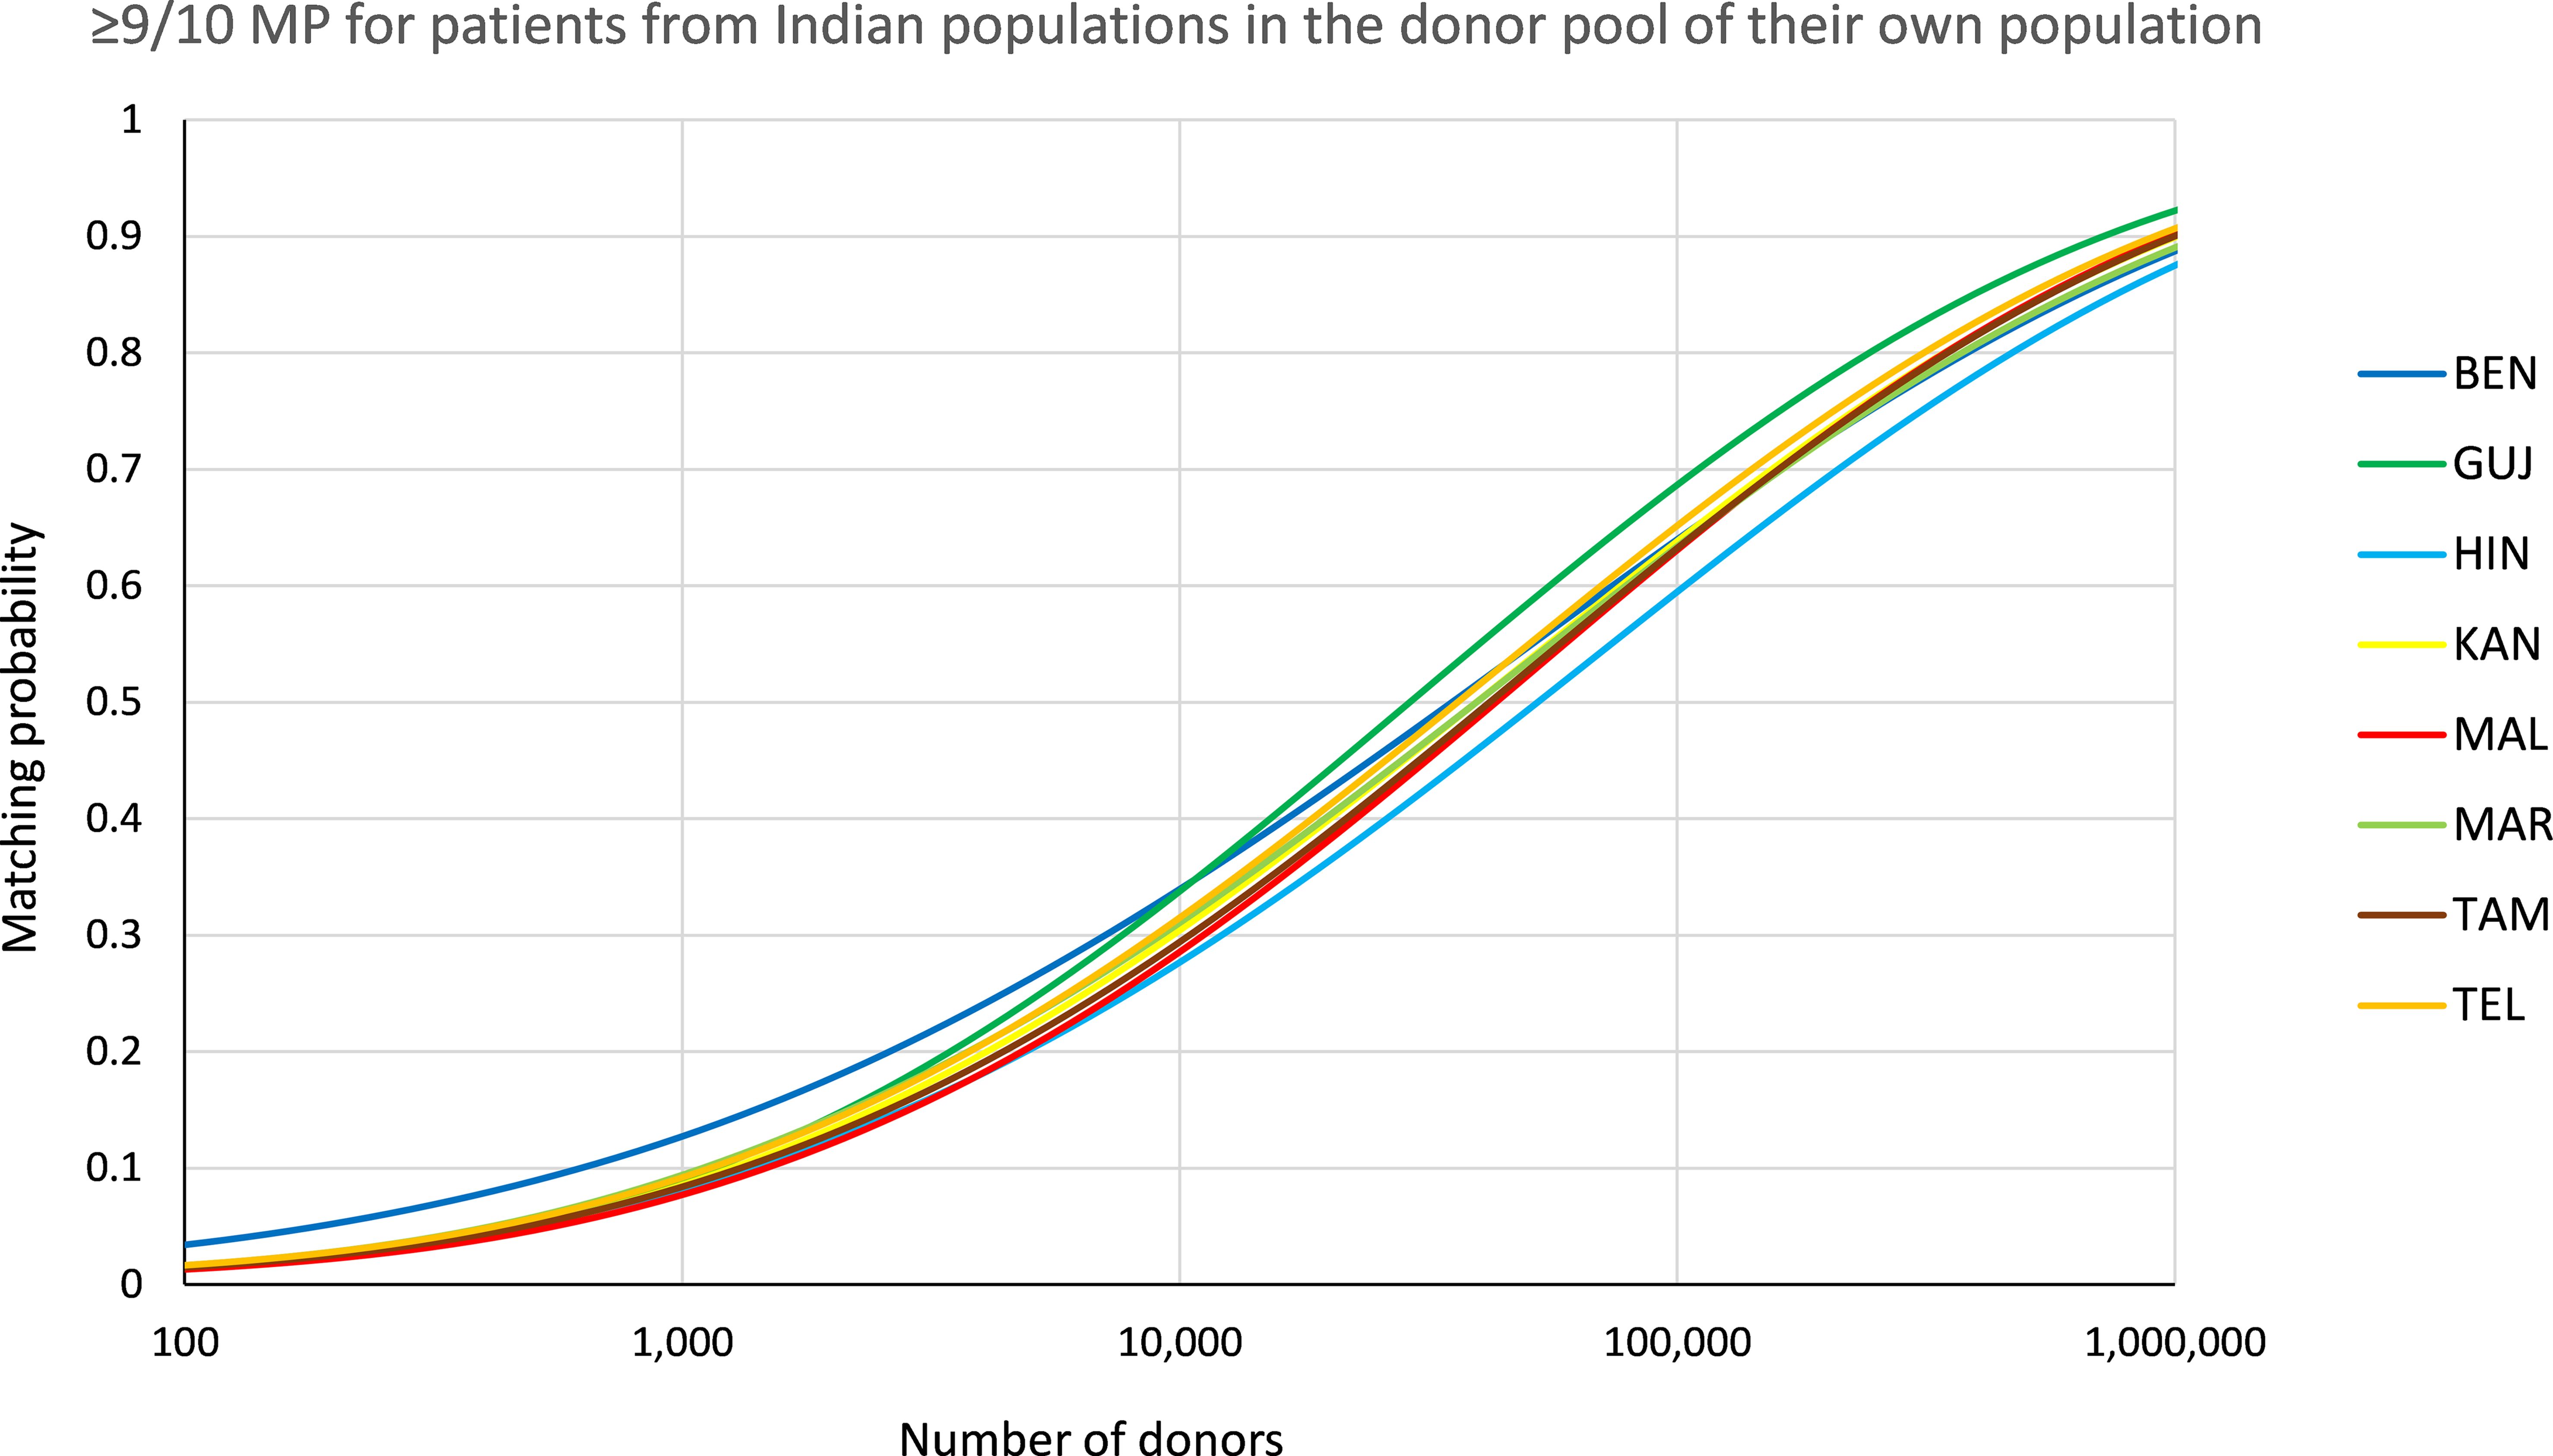
Figure 6. ≥9/10 matching probabilities (MP). MP for patients of the different populations in their own donor pool. Abbreviations for the populations: BEN, Bengali/West Bengal; GUJ, Gujarati/Gujarat; HIN, Hindi/Uttar Pradesh; KAN, Kannada/Karnataka; MAL, Malayalam/Kerala; MAR, Marathi/Maharashtra; TAM, Tamil/Tamil Nadu; TEL, Telugu/Andhra Pradesh.
In this work, we analyzed HLA data of 8 Indian population samples from a dataset of n=130,518 potential hematopoietic stem cell donors registered with DKMS BMST Foundation India (DKMS-BMST), a Bangalore-based donor center with nationwide donor recruitment activities. The populations were delimited according to the state of origin and native language of both parents of the donors. Four of the populations belonged to the Dravidian language family and four to the Indo-Aryan language group. We characterized HLA allele and haplotype frequencies and assessed the benefits of the current and growing registry to Indian patients. The strengths of our study include well-defined, large population samples and comprehensive HLA typing (6 loci at high resolution with an established and quality-proven workflow) (28, 29, 49).
There is only limited published data available on HLA characteristics of Indian subpopulations, especially in high genotyping resolution. The largest study in this regard was conducted on n=18,220 individuals from 14 populations by Maiers et al. (21). The analysis included samples in a broad size range between n=232 and n=5,559, provided by different Indian hematopoietic stem cell donor and cord blood registries and clinical transplant centers. HLA HF served as basis for estimations of patient benefits from regional registry growth. Unlike in our study, the populations were defined by state of origin of the individuals only and not additionally by language. Even if these differences in sample definition should reduce the comparability of our results with those of the study by Maiers et al., there is a remarkable similarity. For the 5 HLA loci A, B, C, DRB1 and DQB1, the Top 10 (Top 5) alleles of the 7 regional populations that were analyzed in both studies overlap by 96.3% (88.6%). Regarding HF, 3 of 7 regional populations share ≥9 of the Top 10 haplotypes. The best correspondence is found in the Karnataka and the Andhra Pradesh samples with all Top 10 haplotypes being identical and in similar order (Spearman’s ρ=0.85, each). Dedhia et al. studied AF and HF of HLA loci A, B and DRB1 of individuals speaking Tamil, Telugu, Tulu, Kannada or Malayalam on first-field resolution level (27). Sample sizes ranged from n=256 (Tulu) to n=463 (Tamil). The comparison of samples for the 4 languages included also in our study (all except Tulu) showed that 98.3% (59/60) of Top 5 allele groups in both studies were consistent. A further study focused on high-resolution HLA-A, -B, -C, -DRB1 and -DQB1 AF and HF in individuals speaking Malayalam, Telugu, Urdu, Kannada or Tamil (26). With exception of the Tamil sample (n=7,016), sample sizes were below n=400. The AF of this study agree well with our data for the languages analyzed in both studies (all except Urdu). The best agreement is achieved in the Tamil sample, where 24/25 of the Top 5 alleles corresponded in both studies. The differences were slightly larger for the other languages, probably due to small sample sizes. Overall, these evaluations show that our HLA frequency data are in good agreement with previously published data.
A comprehensive review of data in the AFND (20) indicated that of the five HLA haplotypes with a mean frequency of f≥1% in the 8 populations from India analyzed in our study, none is unique to Indian populations. A*33:03g~B*44:03g~C*07:01g~DRB1*07:01g~DQB1*02:01g, the most frequent haplotype in the mean distribution and among the Top 3 haplotypes in all 8 populations is also reported from other South Asian and Southeast Asian populations at high frequencies, for example, from South Korea (50), Vietnam (51) and Sri Lanka (52). A closer look at this haplotype block at resolution higher than G groups, however, revealed that in South Asian and especially in Indian population data it usually contains B*44:03:02 and C*07:06, both alleles that are less common in other world populations (20, 23, 24). A geographical distribution across South and Southeast Asian countries is observed for the haplotypes A*01:01g~B*37:01g~C*06:02g~DRB1*10:01g~DQB1*05:01g and A*02:11g~B*40:06g~C*15:02g~DRB1*15:01g~DQB1*06:01g. In addition to South Asia, haplotype A*33:03g~B*58:01g~C*03:02g~DRB1*03:01g~DQB1*02:01g shows a frequent occurrence in East and Southeast Asia, as documented, e.g., for Chinese and Vietnamese populations (51, 53). Haplotype A*01:01g~B*57:01g~C*06:02g~DRB1*07:01g~DQB1*03:03g is not only prevalent in Asian populations, but also globally, with the highest frequency in Tunisia (54). Of the 2-locus haplotypes that showed relevant LD in one or more of the eight Indian population samples (Table 5), only three appear to be specific to Indian populations based on a review of the HLA data published in the AFND. These are B*13:01g~C*04:03g, B*48:04g~C*01:02g and DRB1*15:06~DQB1*05:02g, the latter also present in haplotypes of a population from Sri Lanka (52).
The results for the BEN sample differed substantially from the 7 other population samples from India. For example, the AF of the BEN sample deviated strongly from the mean values of all 8 samples (Table 2, Supplementary Information S12). Several of the alleles that were more prevalent in the BEN sample than in the other samples have their highest frequency in southern Chinese Provinces or countries in Southeast Asia [e.g. B*15:32, A*02:03 and A*33:03 (53, 55–57)], supporting indications of earlier gene flow within these regions (58). Consistently, for each of the 7 other samples, the genetic distance to the BEN sample was greater than to all other samples (Supplementary Information S19A). In multidimensional scaling, this resulted in an isolated position of the BEN sample (Figure 4A), not surprising given its geographical location. In comparison with further reference samples from different ancestries, the BEN population sample had a closer genetic relationship to the geographically neighboring Bangladeshi sample than to all other Indian samples (Supplementary Information S19B) and was more strongly oriented toward the Southeast/East Asian wing of the references in the graphical representation of the GD (Figure 4B). With regard to HF, there were also striking deviations of the BEN sample from the mean values, whereby BEN also stood out here simply because it had by far the most frequent haplotype of all samples (A*33:03g~B*44:03g~C*07:01g~DRB1*07:01g~DQB1*02:01g, fBEN =7.1%). The comparatively low haplotypic diversity of the BEN sample (Supplementary Information S22) is generally advantageous with regard to MP. However, the results in the practice-oriented scenario 2, which simulated the donor search in a growing registry with the current composition of the DKMS-BMST donor database, were rather unfavorable. This also reflects the relatively large genetic distance to the other samples, which means that the Bengali patients benefit less from further donor recruitment according to the current ethnic file composition.
Interestingly, we found the smallest genetic distance of all sample pairs between the Marathi-speaking population from Maharashtra (MAR) and the Kannada-speaking population of Karnataka (KAN), two geographically neighboring populations belonging to different language families. This indicates that the assumption of language boundaries as marker for genetic differences is not universally valid. In the same way that the extent of admixture or displacement of an indigenous population through historical migration or conquest movements can vary, the language of a conquering or immigrant culture can also be gradually adopted by an existing population without significant changes to the gene pool. Linguistically, Marathi does indeed seem to occupy a special position and is debated as a boundary between the Indo-Aryan and Dravidian languages (59, 60).
The two reference populations UK-IND and DE-IND were closer to each other in the GD analysis than to the 8 population samples from India. Furthermore, the GD between the reference samples and the individual population samples from India were quite similar, with the exception of GUJ, which had a clearly lower GD to UK-IND (d=0.24) than to DE-IND (d=0.32; Supplementary Information S19A). Furthermore, the reference populations had the lowest MP values of all samples in both scenarios. This is probably due to the fact that these population samples were not as strictly delimited in their ethnic composition as the Indian samples. In addition, there is a clear indication of admixture with the local populations, especially in the haplotype data of DE-IND: The very common European haplotype block A*01:01~B*08:01~C*07:01~DRB1*03:01~DQB1*02:01 (53, 61) ranks 8th, while it is found at rank #153 in the UK-IND sample and only at rank #8964 in IND-mean. Taken together, these results suggest that the ethnic composition of the Indian-origin population in the UK and Germany is similar, with the exception that there are more individuals of Gujarati origin and fewer intermarriages with the local population in the UK. Of note, the haplotype frequencies of a population sample of Indians living in the UK, published in an earlier study, correlated very well with our UK-IND data for the 9 most frequent haplotypes (62).
Regarding MP, patients from Southern Indian populations will be the main beneficiaries from further growth of the Bangalore-based DKMS-BMST donor file in its current ethnic composition, presumably because the close genetic relatedness of the populations in this region increases the likelihood of a successful donor search outside the patient’s own population. However, the MP will not diverge too strongly as the respective values range only from p=0.345 for BEN to p=0.392 for TEL at donor registry size n=1,000,000 (Supplementary Information S20). Since DKMS-BMST plans for better nationwide coverage with the opening of regional recruitment offices in different parts of India, we do not see a major risk of undesirable large regional differences in the MP in the future.
MP with different sample sizes are only comparable to a limited extent, since a larger sample size leads to smaller MP values (12). The MP values in the study by Maiers et al. (21) were based on HF of a wide range of sample sizes and represent a variation of our second MP scenario (10/10 MP with equal distribution across the regional groups in a growing Indian registry). Still, they are in good agreement with our results, with a mean MP of p=28.1% for a registry size of n=100,000. A previous DKMS study had assessed the MP of various populations (10/10 MP, patients and donors from identical populations, corresponding to our first scenario) registered in the UK using samples of n=20,000 individuals (63). Accounting for the impact of different sample sizes and different levels of populations structuring, the data on Indian MP presented here are consistent with these earlier findings, which demonstrated how the intra-population diversity impacts the chances of finding a matched donor.
The recent promising evidence concerning the use of PTCy in mismatched unrelated HSCT (6–8) could lead to increased acceptance of mismatches in donor selection in the future, which would particularly benefit populations with high genetic diversity and, more generally, populations that are underrepresented in the global volunteer donor registries. Our analyses showed a considerable increase in MP for the Indian population samples when a single mismatch was permitted (e.g. HIN at a registry size of n=100,000: p10/10 = 0.333, p≥9/10 = 0.602; Figure 6, Supplementary Information S21).
In the present study, HLA homozygosity exceeding HWE expectations was observed in all populations. These findings may have resulted from non-random mating, as pairs formed from individuals from the same area could be genetically related due to limited migration and decreased influx of new HLA genotypes into each individual population. In addition, unaccounted substructure may also be the cause for reduced heterozygosity in population samples (Wahlund effect).
The high proportion of male donors in the DKMS-BMST donor file deviates remarkably from those found in other DKMS entities (63) and also from the situation in registries worldwide (64). As they are the most likely to actually donate (65), DKMS prioritizes the recruitment of young men. The focus of DKMS India’s offline donor recruitment is on IT companies and technical colleges, which is proving successful in this regard.
Our study is subject to several limitations that may influence the results. First, the definition of distinct populations of adequate sample sizes in a complex, multi-ethnic country like India is always arbitrary to a certain extent. Second, the ancestry assignment of the donors was based on self-assessment during the recruitment process. This routine can cause inaccuracies, particularly for donors of mixed ethnicity. However, our approach of integrating state of origin and native language of the donors’ parents should provide a sufficient accuracy. Third, since donor recruitment takes place particularly in urban areas and mainly reaches younger individuals with an above-average socioeconomic status, stem cell donors do not represent an unbiased sample of the actual population. Fourth, the decision to exclude haplotypes with the lowest 0.5% of cumulative frequencies in order to limit the impact of artifacts of the estimation process implies the acceptance of a certain loss of information. And last, regarding the MP results, it should always be kept in mind that they are based on a simple model that disregards numerous aspects of real-life donor searches, such as donor age, availability or the potential acceptance of donors with selective mismatches.
In summary, we have analyzed HLA allele and haplotype frequencies of stem cell donors registered with DKMS-BMST for 8 Indian subpopulations. The study is the largest of its kind to date. Our results are consistent with published data, but should be more precise due to the larger sample sizes and the exact definition of populations. The frequency distributions obtained are of great relevance for planning the further stem cell donor registry growth in India.
The aggregated and anonymized data underlying the findings described and used to reach the conclusions of the manuscript are provided in this article and the Supplementary Material. Further inquiries can be directed to the corresponding author. Raw data cannot be made publicly available for data protection reasons.
Ethical approval was not required for the study involving humans in accordance with the local legislation and institutional requirements. Written informed consent to participate in this study was not required from the participants or the participants’ legal guardians/next of kin in accordance with the national legislation and the institutional requirements. DNA extraction from blood samples or buccal mucosal swabs was performed with the informed consent of the donors. The consent allowed the processing of anonymized donor data for research related to donor search or stem cell donation. The publication itself does not contain any identifiable personal data.
US: Writing – original draft, Writing – review & editing, Conceptualization, Data curation, Formal Analysis, Investigation, Methodology. CK: Writing – review & editing, Data curation, Investigation. VL: Data curation, Resources, Writing – review & editing, Investigation. JS: Writing – review & editing, Methodology, Resources. LJ: Writing – review & editing, Resources. PP: Data curation, Resources, Writing – review & editing, Investigation, Supervision. MF-V: Formal Analysis, Methodology, Validation, Writing – review & editing. AS: Writing – original draft, Writing – review & editing, Conceptualization, Investigation, Methodology, Resources, Supervision.
The author(s) declare that no financial support was received for the research, authorship, and/or publication of this article.
We thank the volunteers who register as potential donors to help strangers in need of a stem cell transplant.
The authors declare that the research was conducted in the absence of any commercial or financial relationships that could be construed as a potential conflict of interest.
MF-V declared that they were an editorial board member of Frontiers, at the time of submission. This had no impact on the peer review process and the final decision.
The author(s) declare that no Generative AI was used in the creation of this manuscript.
All claims expressed in this article are solely those of the authors and do not necessarily represent those of their affiliated organizations, or those of the publisher, the editors and the reviewers. Any product that may be evaluated in this article, or claim that may be made by its manufacturer, is not guaranteed or endorsed by the publisher.
The Supplementary Material for this article can be found online at: https://www.frontiersin.org/articles/10.3389/fimmu.2025.1528177/full#supplementary-material
AF, Allele frequency; AFND, Allele Frequency Net Database; GD, Genetic distance; HLA, Human leukocyte antigen; HWE, Hardy-Weinberg Equilibrium; HF, Haplotype frequency; HSCT, Hematopoietic stem cell transplantation; LD, Linkage disequilibrium; MDS, Multidimensional scaling; MP, Matching probability; WMDA, World Marrow Donor Association.
1. Lee SJ, Klein J, Haagenson M, Baxter-Lowe LA, Confer DL, Eapen M, et al. High-resolution donor-recipient HLA matching contributes to the success of unrelated donor marrow transplantation. Blood. (2007) 110:4576–83. doi: 10.1182/blood-2007-06-097386
2. Dehn J, Spellman S, Hurley CK, Shaw BE, Barker JN, Burns LJ, et al. Selection of unrelated donors and cord blood units for hematopoietic cell transplantation: guidelines from NMDP/CIBMTR. Blood. (2019) 134:924–34. doi: 10.1182/blood.2019001212
3. Ayuk F, Balduzzi A. Donor selection for adults and pediatrics. In: Carreras E, Dufour C, Mohty M, Kroger N, editors. The EBMT Handbook: Hematopoietic Stem Cell Transplantation and Cellular Therapies, 7th ed. Cham (CH:Springer, Cham (2019). p. 87–97.
4. Fürst D, Neuchel C, Tsamadou C, Schrezenmeier H, Mytilineos J. HLA matching in unrelated stem cell transplantation up to date. Transfus Med Hemother. (2019) 46:326–36. doi: 10.1159/000502263
5. Arrieta-Bolanos E, Bonneville EF, Crivello P, Robin M, Gedde-Dahl T, Salmenniemi U, et al. Human leukocyte antigen mismatching and survival in contemporary hematopoietic cell transplantation for hematologic Malignancies. J Clin Oncol. (2024) 42(28):3287–99. doi: 10.1200/JCO.24.00582
6. Shaffer BC, Gooptu M, DeFor TE, Maiers M, Bolanos-Meade J, Abboud R, et al. Post-transplant cyclophosphamide-based graft-versus-host disease prophylaxis attenuates disparity in outcomes between use of matched or mismatched unrelated donors. J Clin Oncol. (2024) 42(8):3277–86. doi: 10.1200/JCO.24.00184
7. Shaw BE, Jimenez-Jimenez AM, Burns LJ, Logan BR, Khimani F, Shaffer BC, et al. Three-year outcomes in recipients of mismatched unrelated bone marrow donor transplants using post-transplantation cyclophosphamide: follow-up from a national marrow donor program-sponsored prospective clinical trial. Transplant Cell Ther. (2023) 29:208.e1–e6. doi: 10.1016/j.jtct.2022.12.017
8. Sanz J, Labopin M, Choi G, Kulagin A, Peccatori J, Vydra J, et al. Younger unrelated donors may be preferable over HLA match in the PTCy era: a study from the ALWP of the EBMT. Blood. (2024) 143:2534–43. doi: 10.1182/blood.2023023697
9. Barker DJ, Maccari G, Georgiou X, Cooper MA, Flicek P, Robinson J, et al. The IPD-IMGT/HLA database. Nucleic Acids Res. (2023) 51:D1053–D60. doi: 10.1093/nar/gkac1011
10. Tiercy JM, Claas F. Impact of HLA diversity on donor selection in organ and stem cell transplantation. Hum Hered. (2013) 76:178–86. doi: 10.1159/000358798
11. Pingel J, Solloch UV, Hofmann JA, Lange V, Ehninger G, Schmidt AH. High-resolution HLA haplotype frequencies of stem cell donors in Germany with foreign parentage: how can they be used to improve unrelated donor searches? Hum Immunol. (2013) 74:330–40. doi: 10.1016/j.humimm.2012.10.029
12. Schmidt AH, Sauter J, Pingel J, Ehninger G. Toward an optimal global stem cell donor recruitment strategy. PloS One. (2014) 9:e86605. doi: 10.1371/journal.pone.0086605
13. WMDA, World Marrow Donor Association. Available online at: https://wmda.info/ (Accessed July 22, 2024).
14. United Nations, Department of Economics an Social Affairs. 2022 Revision of World Population Prospects (2022). Available online at: https://population.un.org/wpp/ (Accessed January 16, 2024).
15. Thapar R, Wolpert SA, Dikshit KR, Calkins PB, Allchin FR, Alam M, et al. India (2024). Encyclopedia Britannica. Available online at: https://www.britannica.com/place/India (Accessed 16 July, 2024).
16. Bhasin MK. Genetics of castes and tribes of India: Indian population milieu. Int J Hum Genet. (2006) 6:233–74. doi: 10.1080/09723757.2006.11885969
17. Mehra NK. Defining genetic architecture of the populations in the Indian subcontinent: Impact of human leukocyte antigen diversity studies. Indian J Hum Genet. (2010) 16:105–7. doi: 10.4103/0971-6866.73394
18. Majumder PP. Ethnic populations of India as seen from an evolutionary perspective. J Biosci. (2001) 26:533–45. doi: 10.1007/BF02704750
19. Cardona G. Indo-Iranian languages (2024). Encyclopedia Britannica. Available online at: https://www.britannica.com/topic/Indo-Iranian-languages (Accessed 22 July, 2024).
20. Gonzalez-Galarza FF, McCabe A, Santos E, Jones J, Takeshita L, Ortega-Rivera ND, et al. Allele frequency net database (AFND) 2020 update: gold-standard data classification, open access genotype data and new query tools. Nucleic Acids Res. (2020) 48:D783–D8. doi: 10.1093/nar/gkz1029
21. Maiers M, Halagan M, Joshi S, Ballal HS, Jagannatthan L, Damodar S, et al. HLA match likelihoods for Indian patients seeking unrelated donor transplantation grafts: a population-based study. Lancet Haematology. (2014) 1:e57–63. doi: 10.1016/S2352-3026(14)70021-3
22. Narayan S, Maiers M, Halagan M, Sathishkannan A, Naganathan C, Madbouly A, et al. Human leucocyte antigen (HLA)-A, -B, -C, -DRB1 and -DQB1 haplotype frequencies from 2491 cord blood units from Tamil speaking population from Tamil Nadu, India. Mol Biol Rep. (2018) 45:2821–9. doi: 10.1007/s11033-018-4382-6
23. Seshasubramanian V, Manisekar NK, Sathishkannan AD, Naganathan C, Nandakumar Y, Narayan S. Kannadigas from South India: Putatively unique five-locus haplotypes among the Kannadigas of South India. HLA. (2018) 92:193–5. doi: 10.1111/tan.13324
24. Seshasubramanian V, Manisekar NK, Sathishkannan AD, Naganathan C, Nandakumar Y, Narayan S. Malayalam speaking population from South India: Common five-locus haplotypes in Malayalam speaking population. HLA. (2018) 92:432–4. doi: 10.1111/tan.13389
25. Seshasubramanian V, Manisekar NK, Sathishkannan AD, Naganathan C, Narayan S. Next Generation Sequencing in HLA haplotype distribution among Telugu speaking population from Andhra Pradesh, India. Hum Immunol. (2018) 79:583–4. doi: 10.1016/j.humimm.2018.05.005
26. Seshasubramanian V, SathishKannan AD, Naganathan C, Narayan S, Periathiruvadi S. Molecular analysis of HLA Class I and Class II genes in five different South Indian linguistic groups. HLA. (2021) 97:399–419. doi: 10.1111/tan.14219
27. Dedhia L, Gadekar S, Mehta P, Parekh S. HLA haplotype diversity in the South Indian population and its relevance. Indian J Transplant. (2015) 9:138–43. doi: 10.1016/j.ijt.2015.10.016
28. Lange V, Böhme I, Hofmann J, Lang K, Sauter J, Schöne B, et al. Cost-efficient high-throughput HLA typing by MiSeq amplicon sequencing. BMC Genomics. (2014) 15:63. doi: 10.1186/1471-2164-15-63
29. Schöfl G, Lang K, Quenzel P, Böhme I, Sauter J, Hofmann JA, et al. 2.7 million samples genotyped for HLA by next generation sequencing: lessons learned. BMC Genomics. (2017) 18:161. doi: 10.1186/s12864-017-3575-z
30. Schäfer C, Schmidt AH, Sauter J. Hapl-o-Mat: open-source software for HLA haplotype frequency estimation from ambiguous and heterogeneous data. BMC Bioinf. (2017) 18:284. doi: 10.1186/s12859-017-1692-y
31. Solloch UV, Schmidt AH, Sauter J. Graphical user interface for the haplotype frequency estimation software Hapl-o-Mat. Hum Immunol. (2022) 83:107–12. doi: 10.1016/j.humimm.2021.11.002
32. Excoffier L, Slatkin M. Maximum-likelihood estimation of molecular haplotype frequencies in a diploid population. Mol Biol Evol. (1995) 12:921–7. doi: 10.1093/oxfordjournals.molbev.a040269
33. Schmidt AH, Baier D, Solloch UV, Stahr A, Cereb N, Wassmuth R, et al. Estimation of high-resolution HLA-A, -B, -C, -DRB1 allele and haplotype frequencies based on 8862 German stem cell donors and implications for strategic donor registry planning. Hum Immunol. (2009) 70:895–902. doi: 10.1016/j.humimm.2009.08.006
34. Schmidt AH, Sauter J, Baier DM, Daiss J, Keller A, Klussmeier A, et al. Immunogenetics in stem cell donor registry work: The DKMS example (Part 1). Int J Immunogenet. (2020) 47:13–23. doi: 10.1111/iji.12471
35. Seitz S, Lange V, Norman PJ, Sauter J, Schmidt AH. Should results of HLA haplotype frequency estimations be normalized? Int J Immunogenet. (2021) 48:498–9. doi: 10.1111/iji.12556
36. Lewontin RC. The interaction of selection and linkage. I. General considerations; heterotic models. Genetics. (1964) 49:49–67. doi: 10.1093/genetics/49.1.49
37. Nothnagel M, Fürst R, Rohde K. Entropy as a measure for linkage disequilibrium over multilocus haplotype blocks. Hum Hered. (2002) 54:186–98. doi: 10.1159/000070664
38. Excoffier L, Lischer HE. Arlequin suite ver 3.5: a new series of programs to perform population genetics analyses under Linux and Windows. Mol Ecol Resour. (2010) 10:564–7. doi: 10.1111/j.1755-0998.2010.02847.x
39. Guo SW, Thompson EA. Performing the exact test of Hardy-Weinberg proportion for multiple alleles. Biometrics. (1992) 48:361–72. doi: 10.2307/2532296
40. Sullivan GM, Feinn R. Using effect size-or why the P value is not enough. J Grad Med Educ. (2012) 4:279–82. doi: 10.4300/JGME-D-12-00156.1
41. Klitz W, Stephens JC, Grote M, Carrington M. Discordant patterns of linkage disequilibrium of the peptide-transporter loci within the HLA class II region. Am J Hum Genet. (1995) 57:1436–44.
42. Cavalli-Sforza LL, Edwards AW. Phylogenetic analysis. Models and estimation procedures. Am J Hum Genet. (1967) 19:233–57. doi: 10.2307/2406616
43. R Core Team. R: A language and environment for statistical computing (2022). Vienna, Austria: R Foundation for Statistical Computing. Available online at: https://www.r-project.org/ (Accessed January 9, 2022).
44. Müller CR, Ehninger G, Goldmann SF. Gene and haplotype frequencies for the loci HLA-A, HLA-B, and HLA-DR based on over 13,000 german blood donors. Hum Immunol. (2003) 64:137–51. doi: 10.1016/s0198-8859(02)00706-1
45. Solloch UV, Giani AS, Pattillo Garnham MI, Sauter J, Bernas SN, Lange V, et al. HLA allele and haplotype frequencies of registered stem cell donors in Chile. Front Immunol. (2023) 14:1175135. doi: 10.3389/fimmu.2023.1175135
46. Fallin D, Schork NJ. Accuracy of haplotype frequency estimation for biallelic loci, via the expectation-maximization algorithm for unphased diploid genotype data. Am J Hum Genet. (2000) 67:947–59. doi: 10.1086/303069
47. Arrieta-Bolanos E, Hernandez-Zaragoza DI, Barquera R. An HLA map of the world: A comparison of HLA frequencies in 200 worldwide populations reveals diverse patterns for class I and class II. Front Genet. (2023) 14:866407. doi: 10.3389/fgene.2023.866407
48. Sanchez-Mazas A, Buhler S, Nunes JM. A new HLA map of Europe: Regional genetic variation and its implication for peopling history, disease-association studies and tissue transplantation. Hum Hered. (2013) 76:162–77. doi: 10.1159/000360855
49. Baier DM, Hofmann JA, Fischer H, Rall G, Stolze J, Ruhner K, et al. Very low error rates of NGS-based HLA typing at stem cell donor recruitment question the need for a standard confirmatory typing step before donor work-up. Bone Marrow Transplant. (2019) 54:928–30. doi: 10.1038/s41409-018-0411-2
50. Lee KW, Oh DH, Lee C, Yang SY. Allelic and haplotypic diversity of HLA-A, -B, -C, -DRB1, and -DQB1 genes in the Korean population. Tissue Antigens. (2005) 65:437–47. doi: 10.1111/j.1399-0039.2005.00386.x
51. Hoa BK, Hang NT, Kashiwase K, Ohashi J, Lien LT, Horie T, et al. HLA-A, -B, -C, -DRB1 and -DQB1 alleles and haplotypes in the Kinh population in Vietnam. Tissue Antigens. (2008) 71:127–34. doi: 10.1111/j.1399-0039.2007.00982.x
52. Grifoni A, Weiskopf D, Lindestam Arlehamn CS, Angelo M, Leary S, Sidney J, et al. Sequence-based HLA-A, B, C, DP, DQ, and DR typing of 714 adults from Colombo, Sri Lanka. Hum Immunol. (2018) 79:87–8. doi: 10.1016/j.humimm.2017.12.007
53. Gragert L, Madbouly A, Freeman J, Maiers M. Six-locus high resolution HLA haplotype frequencies derived from mixed-resolution DNA typing for the entire US donor registry. Hum Immunol. (2013) 74:1313–20. doi: 10.1016/j.humimm.2013.06.025
54. Ayed K, Ayed-Jendoubi S, Sfar I, Labonne MP, Gebuhrer L. HLA class-I and HLA class-II phenotypic, gene and haplotypic frequencies in Tunisians by using molecular typing data. Tissue Antigens. (2004) 64:520–32. doi: 10.1111/j.1399-0039.2004.00313.x
55. Shi L, Ogata S, Yu JK, Ohashi J, Yu L, Shi L, et al. Distribution of HLA alleles and haplotypes in Jinuo and Wa populations in Southwest China. Hum Immunol. (2008) 69:58–65. doi: 10.1016/j.humimm.2007.11.007
56. Ogata S, Shi L, Matsushita M, Yu L, Huang XQ, Shi L, et al. Polymorphisms of human leucocyte antigen genes in Maonan people in China. Tissue Antigens. (2007) 69:154–60. doi: 10.1111/j.1399-0039.2006.00698.x
57. Romphruk AV, Romphruk A, Kongmaroeng C, Klumkrathok K, Paupairoj C, Leelayuwat C. HLA class I and II alleles and haplotypes in ethnic Northeast Thais. Tissue Antigens. (2010) 75:701–11. doi: 10.1111/j.1399-0039.2010.01448.x
58. Gazi NN, Tamang R, Singh VK, Ferdous A, Pathak AK, Singh M, et al. Genetic structure of Tibeto-Burman populations of Bangladesh: evaluating the gene flow along the sides of Bay-of-Bengal. PloS One. (2013) 8:e75064. doi: 10.1371/journal.pone.0075064
59. Kolipakam V, Jordan FM, Dunn M, Greenhill SJ, Bouckaert R, Gray RD, et al. A Bayesian phylogenetic study of the Dravidian language family. R Soc Open Sci. (2018) 5:171504. doi: 10.1098/rsos.171504
60. Kulkarni-Joshi S. Linguistic history and language diversity in India: Views and counterviews. J Biosci. (2019) 44(3):62. doi: 10.1007/s12038-019-9879-1
61. Seitz S, Lange V, Norman PJ, Sauter J, Schmidt AH. Estimating HLA haplotype frequencies from homozygous individuals - A Technical Report. Int J Immunogenet. (2021) 48:490–5. doi: 10.1111/iji.12553
62. Leen G, Stein JE, Robinson J, Maldonado Torres H, Marsh SGE. The HLA diversity of the Anthony Nolan register. HLA. (2021) 97:15–29. doi: 10.1111/tan.14127
63. Schmidt AH, Sauter J, Schetelig J, Neujahr E, Pingel J. Providing hematopoietic stem cell products from unrelated donors to the world: DKMS donor centers and DKMS registry. Best Pract Res Clin Haematology. (2024) 37(1):101541. doi: 10.1016/j.beha.2024.101541
64. Fingrut W, Rikhraj K, Allan D. Targeted recruitment of male donors for allogeneic haematopoietic cell transplantation: A review of the evidence. Vox Sang. (2018) 113:307–16. doi: 10.1111/vox.12632
Keywords: HSCT, HLA, haplotype frequency, donor registry, India
Citation: Solloch UV, Kaniyath Madhusoodhanan C, Lange V, Sauter J, Jagannathan L, Paul P, Fernández-Viña MA and Schmidt AH (2025) HLA allele and haplotype frequencies of eight Indian populations based on 130,518 registered stem cell donors. Front. Immunol. 16:1528177. doi: 10.3389/fimmu.2025.1528177
Received: 14 November 2024; Accepted: 05 February 2025;
Published: 25 February 2025.
Edited by:
Martin Maiers, National Marrow Donor Program, United StatesReviewed by:
Esteban Arrieta-Bolaños, Essen University Hospital, GermanyCopyright © 2025 Solloch, Kaniyath Madhusoodhanan, Lange, Sauter, Jagannathan, Paul, Fernández-Viña and Schmidt. This is an open-access article distributed under the terms of the Creative Commons Attribution License (CC BY). The use, distribution or reproduction in other forums is permitted, provided the original author(s) and the copyright owner(s) are credited and that the original publication in this journal is cited, in accordance with accepted academic practice. No use, distribution or reproduction is permitted which does not comply with these terms.
*Correspondence: Ute V. Solloch, c29sbG9jaEBka21zLmRl
Disclaimer: All claims expressed in this article are solely those of the authors and do not necessarily represent those of their affiliated organizations, or those of the publisher, the editors and the reviewers. Any product that may be evaluated in this article or claim that may be made by its manufacturer is not guaranteed or endorsed by the publisher.
Research integrity at Frontiers
Learn more about the work of our research integrity team to safeguard the quality of each article we publish.