
95% of researchers rate our articles as excellent or good
Learn more about the work of our research integrity team to safeguard the quality of each article we publish.
Find out more
ORIGINAL RESEARCH article
Front. Immunol. , 03 February 2025
Sec. Multiple Sclerosis and Neuroimmunology
Volume 16 - 2025 | https://doi.org/10.3389/fimmu.2025.1512189
 Heinz Wiendl1*†
 Frederik Barkhof2,3
 Xavier Montalban4
 Anat Achiron5,6
 Tobias Derfuss7
 Andrew Chan8
 Suzanne Hodgkinson9
 Alexandre Prat10
 Letizia Leocani11,12,13
 Klaus Schmierer14,15
 Finn Sellebjerg16,17
 Patrick Vermersch18Hulin Jin19Anita Chudecka20Andreas Kloetgen19Dongdong Lin21
 Lidia Gardner22
 Nicola De Stefano23
Background and objectives: Cladribine tablets (CladT) represent an effective immune reconstitution therapy, administered in short treatment courses over two consecutive years. To better understand the amplitude of immune changes, we performed a comprehensive analysis during the 2-year study period for the entire MAGNIFY-MS population (N=270). In addition to lymphocyte kinetics, we studied intracellular cytokines serum proteins, and their associations with clinical outcomes. To put these changes into perspective, we analyzed transcriptional changes in T and B cells and associated biological pathways before and after each treatment course with CladT.
Methods: Immunophenotyping and transcriptomics were performed at regular visits with major differences reported between baseline (BL) and after each yearly treatment course. Assessments included: lymphocyte dynamics, RNA sequencing (B and T cells), intracellular cytokines, serum proteins (immunoglobulins [IgG and IgM], and serum neurofilament light chain [sNfL]). Clinical measures included: MRI activity, annualized relapse rate (ARR), 6-month confirmed disability progression (6mCDP), timed 25-foot walk (T25FW), and 9-hole peg test (9HPT).
Results: All B, T and NK cells were reduced at month (M)3 after CladT administration, except regulatory B cells which increased above BL from M3 to M24. Naïve and transitional B cells recovered at M6; all other B and T cell subsets remained below BL levels. Reductions in all NK cell subtypes were observed at M3, CD16lowCD56bright and NKp46 cells reconstituted at M6 and M12 respectively. Changes in genes and pathways associated with innate and adaptive immune response were observed after CladT treatment, along with reductions in pro-inflammatory cytokine-producing B and T cells and increases in anti-inflammatory cytokine-producing T cells. IgG and IgM levels remained above the lower limits of normal in most participants. sNfL levels decreased, remaining reduced by M24. Significant reductions in the annualized combined unique active lesion count occurred from M2 onwards. ARR was 0.11 (95% confidence interval: 0.09,0.15), with 83% participants free of qualifying relapses. Over 90% of participants were free of 6mCDP, around 87% had no confirmed progression on T25FW and 9HPT. No significant correlations were seen between clinical parameters and lymphocyte dynamics to M6. The safety profile was consistent with previous reports.
Discussion: Deep longitudinal immunophenotyping, analysis of transcriptional changes, reduction in cells expressing pro-inflammatory cytokines, along with the marker of neuroaxonal damage provide novel and innovative evidence of CladT rebalancing the immune system towards a more homeostatic and less pathogenic state.
Clinical Trial Registration: https://clinicaltrials.gov/study/, identifier NCT03364036.
Multiple sclerosis (MS) is a chronic immune-mediated disease that affects the central nervous system (CNS). Most approved disease-modifying therapies (DMTs) require continuous administration and act by suppressing the immune system to deliver beneficial effects, whereas cladribine tablets 10 mg (CladT) control the disease by delivering an immune reconstitution effect (1–8).
Understanding patterns of depletion and repopulation, following such immune reconstitution therapy (IRT) in the context of global clinical trials, aids our understanding of CladT’s effect on immunity and MS pathophysiology. Other DMTs, such as anti-CD20s, do have long-lasting effects but this is often associated with chronic depletion of immune cells and continuous immunosuppression (9), whereas IRT offers sustained efficacy with preserved immunocompetence for infections and vaccine response (10). Deep immunophenotyping can provide important insights on CladT’s unique mechanism of MS disease control. In recent years Epstein-Barr virus (EBV, which causes life-long latent infection of memory B [Bmem] cells) has been associated with MS etiology (11, 12). As such, using treatments that provide a lasting effect on Bmem cells may prove particularly efficacious. While it is known that CladT significantly depletes Bmem cells, its effect on other aspects of immunopathophysiology of MS is less clear (13).
The primary objective of the MAGNIFY-MS study (NCT03364036) was to determine the onset of action of CladT on neuroradiological activity in people with highly active relapsing multiple sclerosis (RMS), as was previously reported using 6-month MRI data (14). The secondary objective of MAGNIFY-MS was to characterize the pattern and kinetics of lymphocyte reduction and repopulation during treatment with CladT. We previously published 12-month data from a MAGNIFY-MS sub-study (n=57) following the first CladT treatment course (15). In this report, we describe deep immune-phenotyping after two CladT treatment courses in the entire MAGNIFY-MS population (n=270). In addition to lymphocyte kinetics, we analyzed changes in cytokine producing B and T cells from a blood biomarker sub-study, as well as RNA sequencing of CD3+ and CD19+ cells, and changes in serum neurofilament light chain (sNfL) levels. We also investigated possible associations and correlations between changes in immune cells and traditional clinical outcomes, presented to 2 years post treatment initiation for the first time (including presence of MRI lesions, qualifying relapses, 6-months confirmed disease progression [6mCDP], and progression on timed 25-foot walk [T25FW] and 9-hole peg test [9HPT]).
MAGNIFY-MS was a 2-year, phase IV, open-label, single-arm study in which eligible participants with highly active RMS received CladT (3.5 mg/kg cumulative dose over 2 years). Participants received 2 weeks of active treatment per course (week 1 and 5 of each year), with the start of the first week of treatment in year 1 being considered baseline (BL, Supplementary Figure 1). The primary endpoint of this study, along with design and eligibility criteria have previously been reported (14, 15). Of particular note, participants were excluded if they had a lymphocyte count outside the normal laboratory limits, or if they had previous exposure to alemtuzumab, fingolimod, mitoxantrone, natalizumab, or ocrelizumab. Analyses for the 2-year period are described herein.
Peripheral blood mononuclear cells (PBMCs) were collected at indicated time points. Panels of B, T, and NK cells were analyzed using surface cell markers as described previously (15) at BL, month (M)3, M6, M12, M15, M18 and M24. Absolute cell counts and median percentage change from BL were assessed for cell subtypes and immunoglobulins. For the purposes of immunophenotyping, CD19+ B cells were analyzed as part of the TBNK cell panel, other B cell subtypes were analyzed as part of the full B-cell panel (Covance Central Laboratory Services, Inc. 8211 SciCore Drive, Indianapolis, IN 46214-2985, USA). Bulk RNA sequencing of CD19+ B cells and CD3+ T cells of PBMCs was carried out for 11 participants selected at random from the blood biomarker sub-study at BL, M3, M12, M15, and M24. Additional details are provided in Supplementary Appendix 1.
Serum levels of immunoglobulin (Ig)G and IgM were analyzed by nephelometric assay using reference ranges provided by Covance at BL, M3, M6, M12, and M24 as previously described (15). sNfL levels were analyzed at BL, M3, M6, M12 and M24 using Quanterix NF-light chain assay method on Quanterix Simoa HD-1 Analyzer (Labcorp/Monogram, 345 Oyster Point Blvd, South San Francisco, CA 94080, USA). Obtained sNfL values were analyzed using Wilcoxon signed rank tests comparing data at the respective visit versus BL. sNfL values were normalized using Z-scores to adjust for age and body mass index (BMI) based on a control population, using the method previously described by Benkert et al. (16) Z-score interpretation as per Benkert et al: ≤-1, reduced relative to age- and BMI-matched reference population; ~0, similar relative to age- and BMI-matched reference population, >1, elevated relative to age- and BMI-matched reference population.
For participants of the blood biomarker sub-study, cytokine-producing T and B cells were analyzed at the previously described time points, with blood collected at three additional time points (M1, M2, and M14). For analysis of cytokines, 1×10⁶ of PBMC purified from whole blood was used. We studied stimulated and non-stimulated B and T-lymphocytes for individual intracellular cytokines comparing absolute values and median change from BL of each B and T cell intracellular cytokine by visit with 95% confidence intervals (CI) of the mean per stimulation method. B cell intracellular cytokines were stimulated with CpG and PMA/Iono. T cell intracellular cytokines were stimulated with Anti-CD3/CD28 or Anti-CD3/CD28 and PMA/Iono.
Clinical outcomes were assessed in all enrolled patients. Annualized relapse rate (ARR) of qualifying relapses was estimated from a Poisson regression model, adjusted for age and Expanded Disability Status Scale (EDSS) at BL (≤3, >3). EDSS, T25FW, and 9HPT scores were recorded at BL and M3, M6, M12, M15, M18, and M24. Definitions for 6mCDP, and progression on T25FW or 9HPT are provided in Supplementary Appendix 1. All patients were included in the assessment of EDSS progression. Patients with relapse-associated worsening were not excluded from the analysis. MRI scans were performed at screening, BL, and at M1, M2, M3, M6, M12, M15, M18, and M24 following the initiation of CladT. Initial exploratory correlation analysis included participants with both B-cell and MRI assessments up to M6 (MAGNIFY-MS study primary endpoint). Reported changes in combined unique active (CUA), T1 gadolinium-enhancing (Gd+), and active T2 lesions were correlated with B regulatory (Breg) and Bmem cell counts to investigate associations between fast CladT onset of action and lymphocyte dynamics. For measuring MRI activity, changes in CUA, T1 Gd+, and new or enlarging T2 lesion counts were compared between BL and post-BL visits using a mixed-effects linear model for repeated measures. The correlation between change in immune cell subsets and MRI from BL to M6 was assessed with Cramer’s V method (Supplementary Appendix 1). We also performed correlation analysis using Spearman correlation coefficient between BL and each following timepoint from M3 to M24 to guide interpretation of the results. We compared fold-changes/percent changes of B-lymphocytes with changes of CUA between BL and follow-up. Association of clinical outcomes and changes in lymphocyte ratio dynamics were carried out as exploratory. For this purpose, presence of clinical progression was compared to immune cells ratios. The full list of disability status categories and immune cell subset ratios are presented in Supplementary Figure 2.
Analyses were performed on the full analysis set (FAS), which included all eligible participants (people with highly active relapsing MS aged ≥18 years with an Expanded Disability Status Score ≤5.0) treated with at least one dose of CladT. All analyses were performed without adjustment for multiplicity. The study protocol and statistical analysis plan for MAGNIFY-MS have been published on ClinicalTrials.gov (NCT03364036) (17).
Ethical approval for the MAGNIFY-MS study (NCT03364036) was obtained from independent ethics committees for each trial site, and the study was performed in line with the principles of the Declaration of Helsinki. All participants provided written informed consent before participation in the study. Participants who elected to participate in the blood biomarker sub-study signed additional informed consent form.
Any requests for data by qualified scientific and medical researchers for legitimate research purposes will be subject to Merck's Data Sharing Policy. All requests should be submitted in writing to Merck's data sharing portal https://www.merckgroup.com/en/research/our-approach-to-research-and-development/healthcare/clinical-trials/commitment-responsible-data-sharing.html. When Merck has a co-research, co-development, or co-marketing or co-promotion agreement, or when the product has been out-licensed, the responsibility for disclosure might be dependent on the agreement between parties. Under these circumstances, Merck will endeavor to gain agreement to share data in response to requests.
A total of 270 participants from the main MAGNIFY-MS study were analyzed in the FAS (median age 38.5 years; 66.7% female), including 57 participants enrolled in the blood biomarker sub-study (Table 1). Baseline characteristics for participants in the sub-study were consistent with the overall main study population.
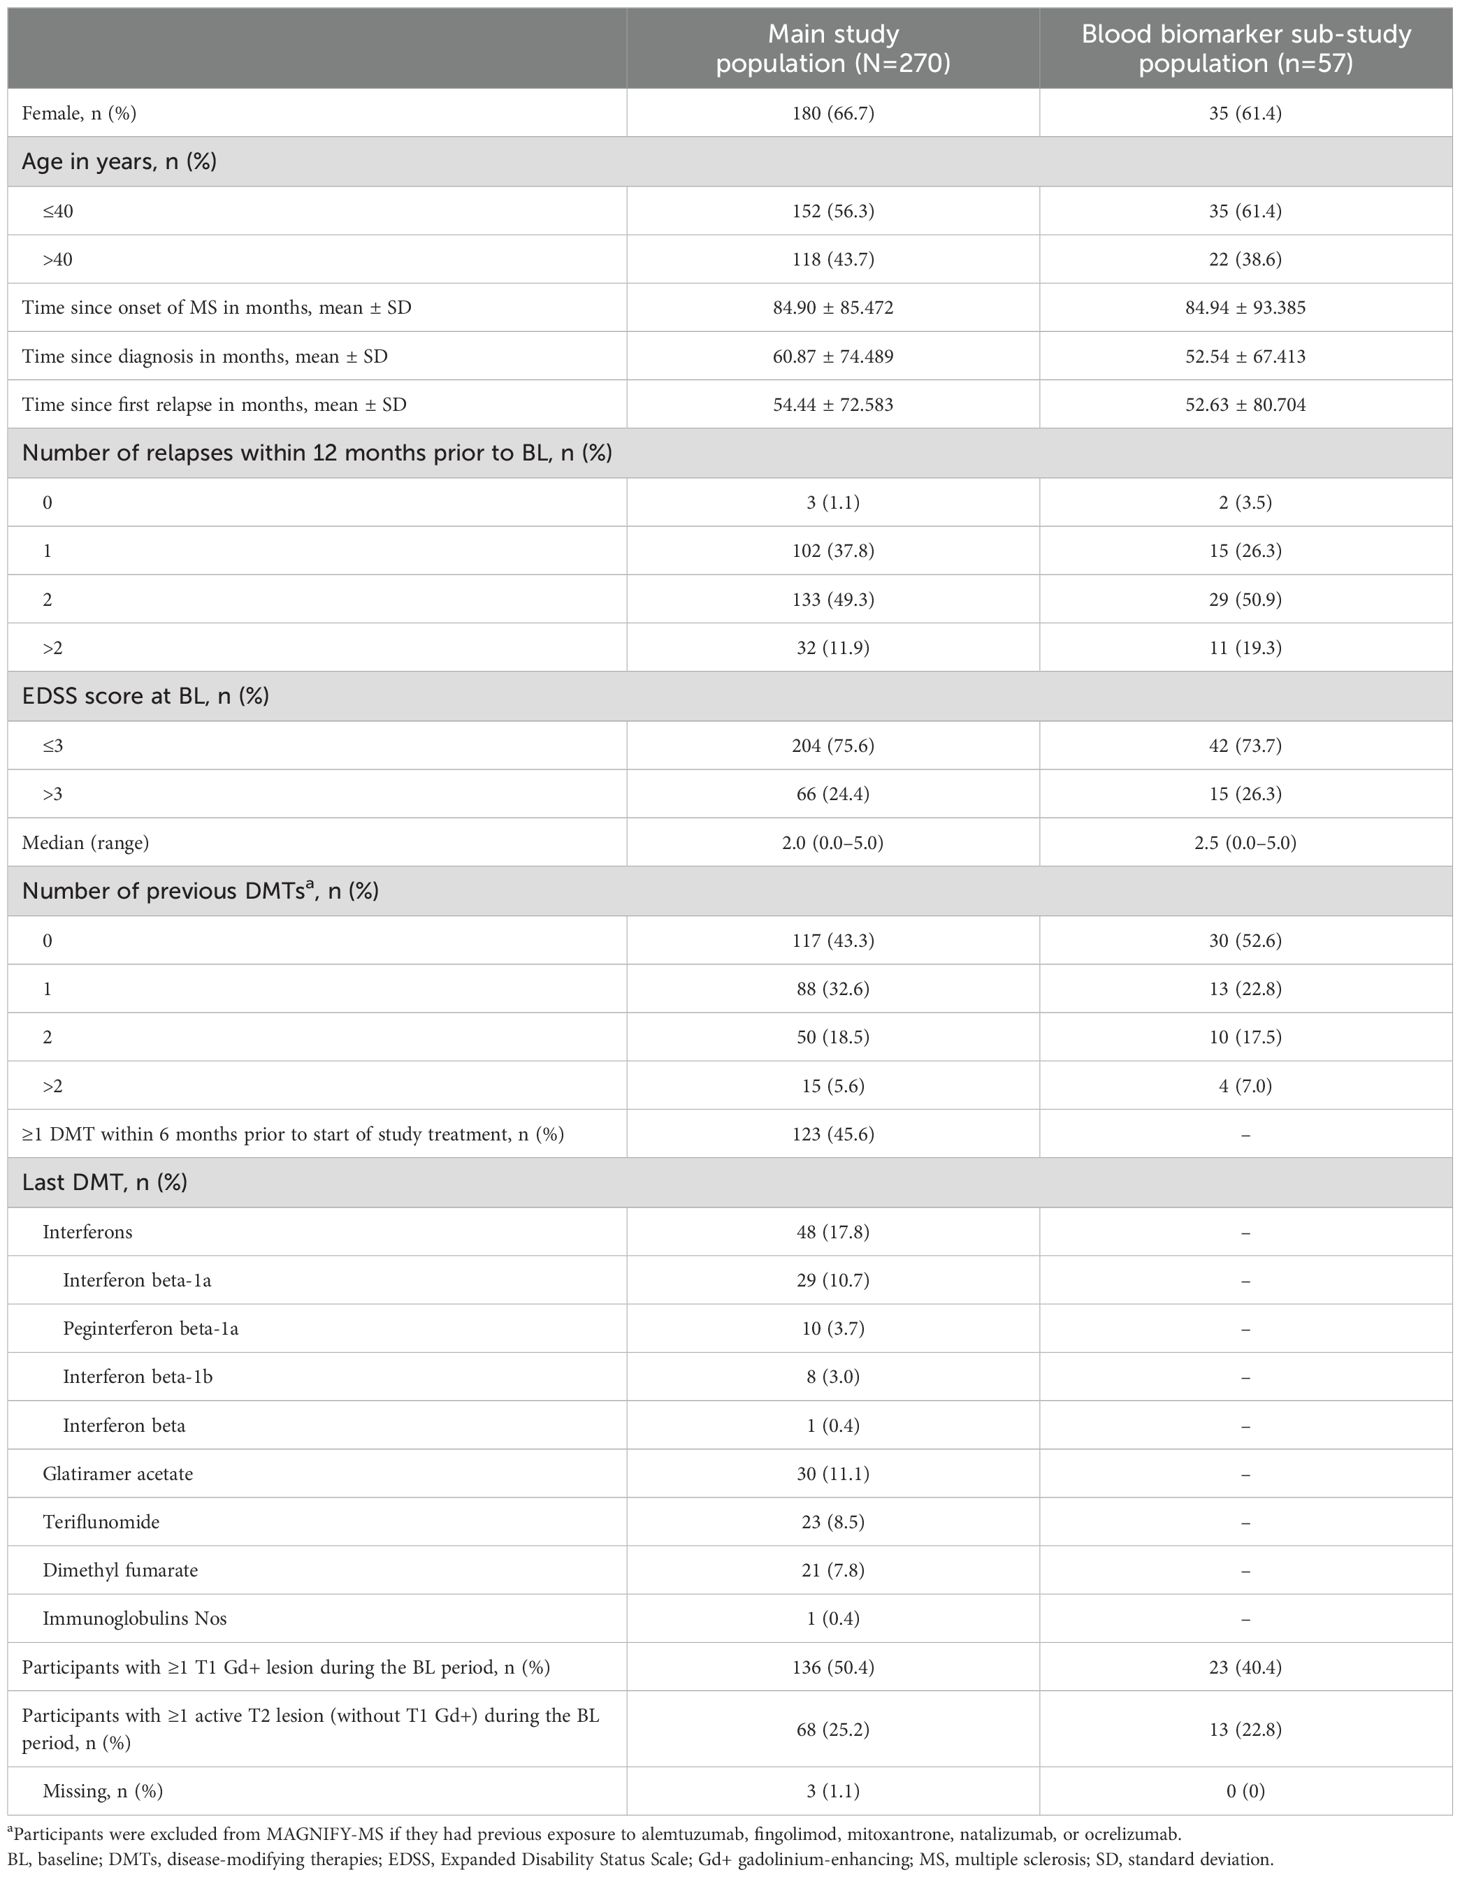
Table 1. Baseline demographics and characteristics.
Quantitative immune cell changes were observed following each yearly treatment course, during study visits outlined in Supplementary Figure 1. All values presented are median percentage changes from BL.
B cell subtypes: In the FAS, changes observed in B cell counts after the first CladT treatment were similar to those previously reported for the sub-study (15) (Figure 1A; Table 2). At the first planned post-BL visit (M3) most B cell subsets reached nadir values: Bnaïve (-76%), CD19+ (-80%), CD20+ (-81%) and activated CD69+ (-74%). Bmem, CD38+ plasmablasts and short-lived plasma cells reached nadir values only after the second treatment course in year 2 (M15). Bmem cell counts drastically reduced to -93% at M3 and to -97% at M15, this reduction was sustained throughout the observation period (M24, -89%).
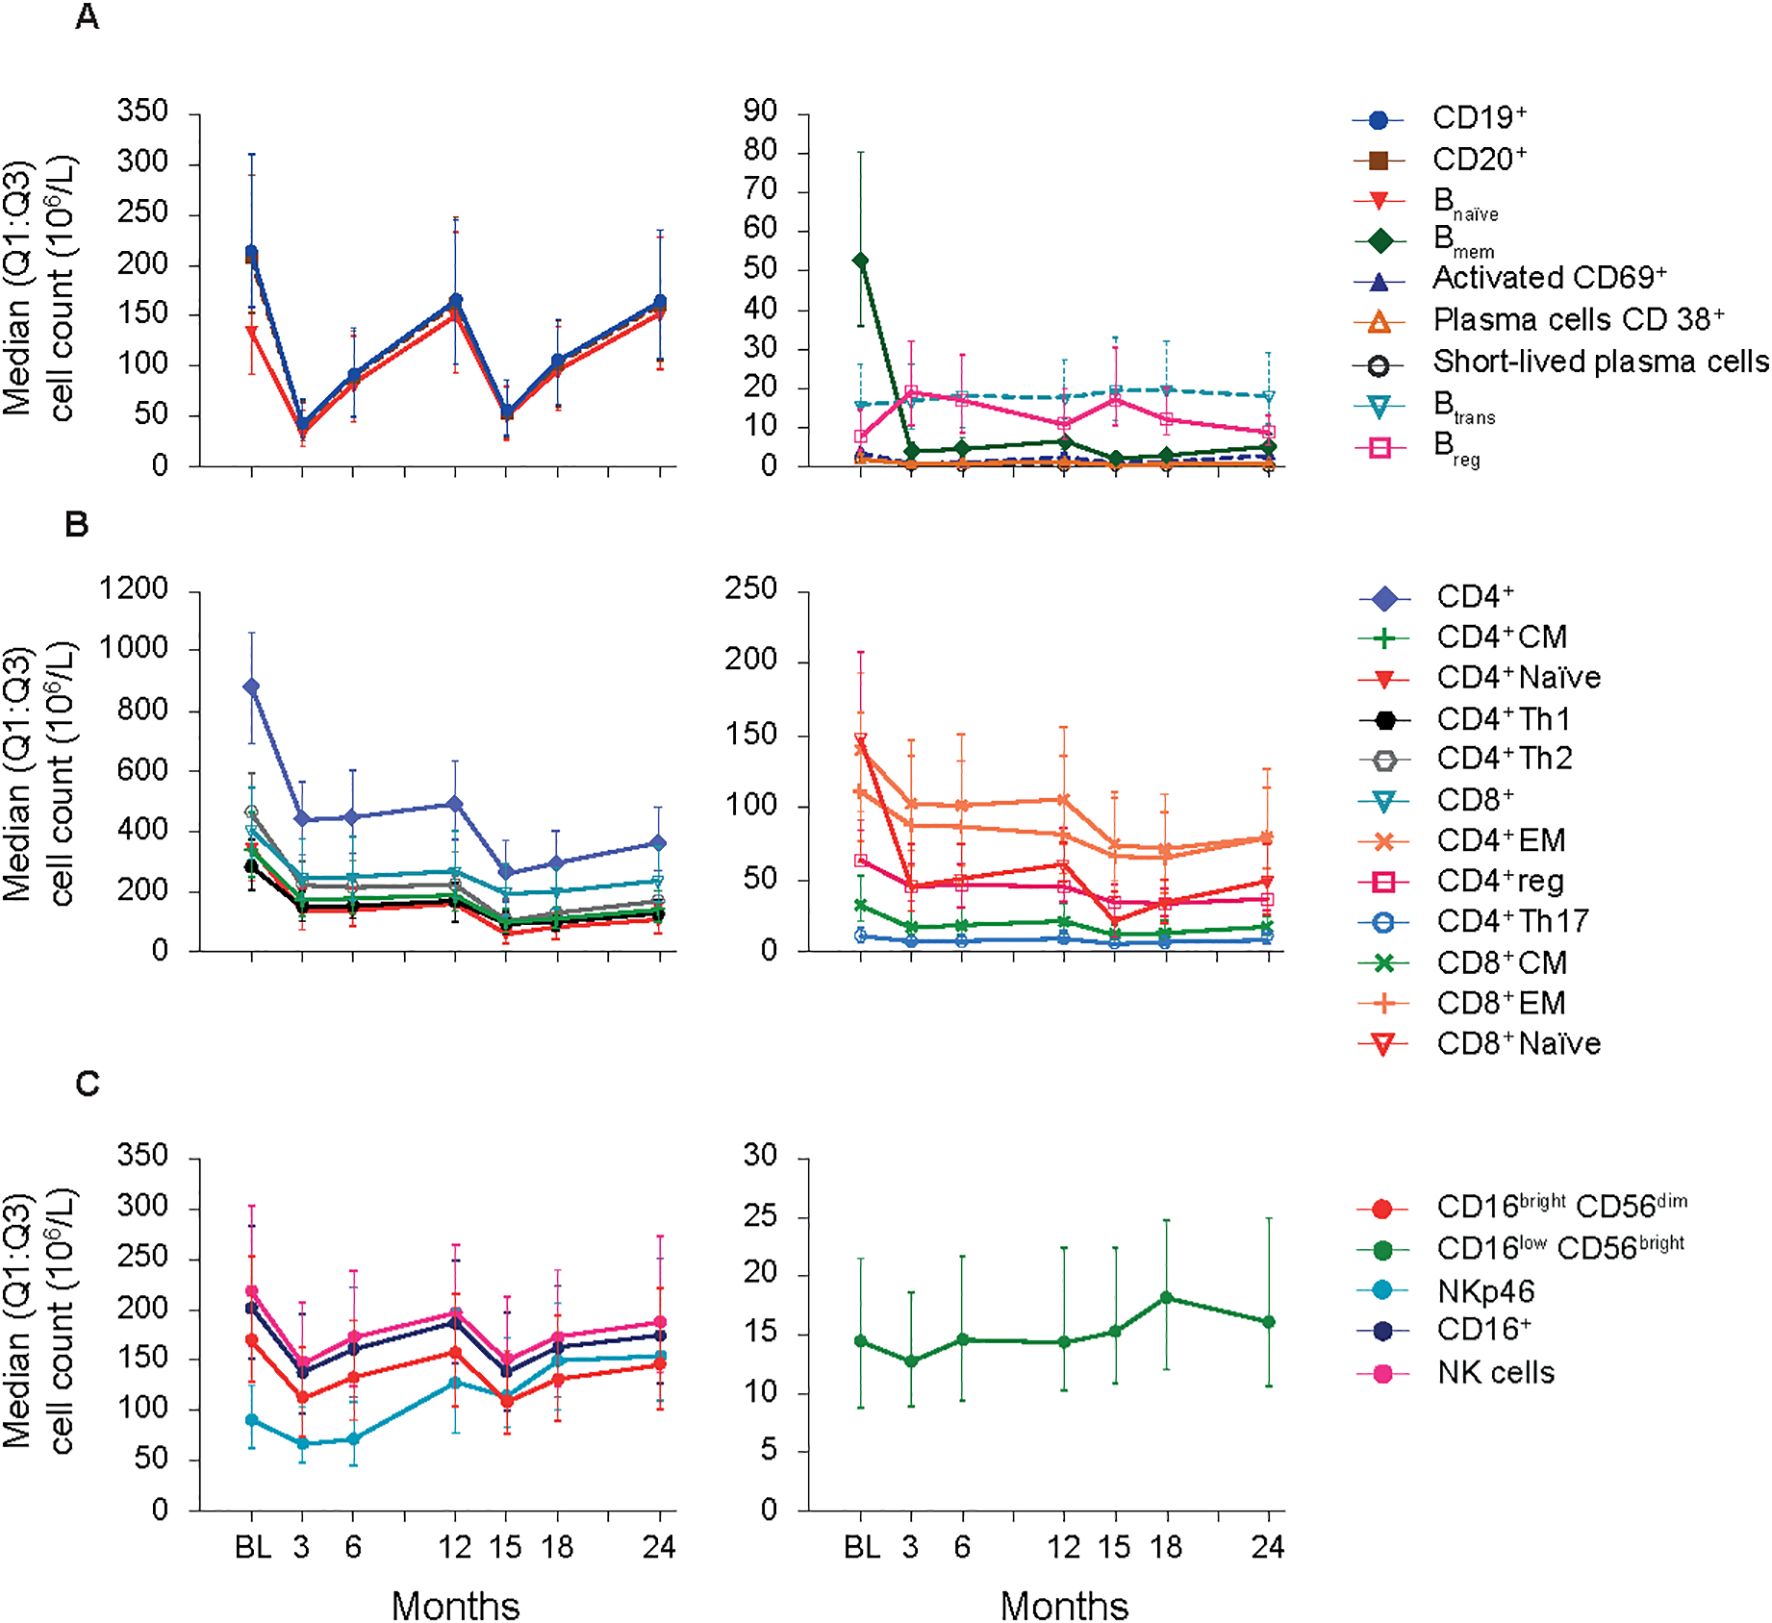
Figure 1. B-cell, T-cell and NK cell subsets (FAS). (A) B-cell panel. (B) T-cell panel. (C) NK-cell panel. BL, baseline; Bmem, B memory; Breg, B regulatory; Btrans, B transitional; CD, cluster of differentiation; CM, central memory; EM, effector memory; FAS, full analysis set; NK, natural killer; Q1:Q3, quartile range; reg, regulatory; Th, T helper cell type.
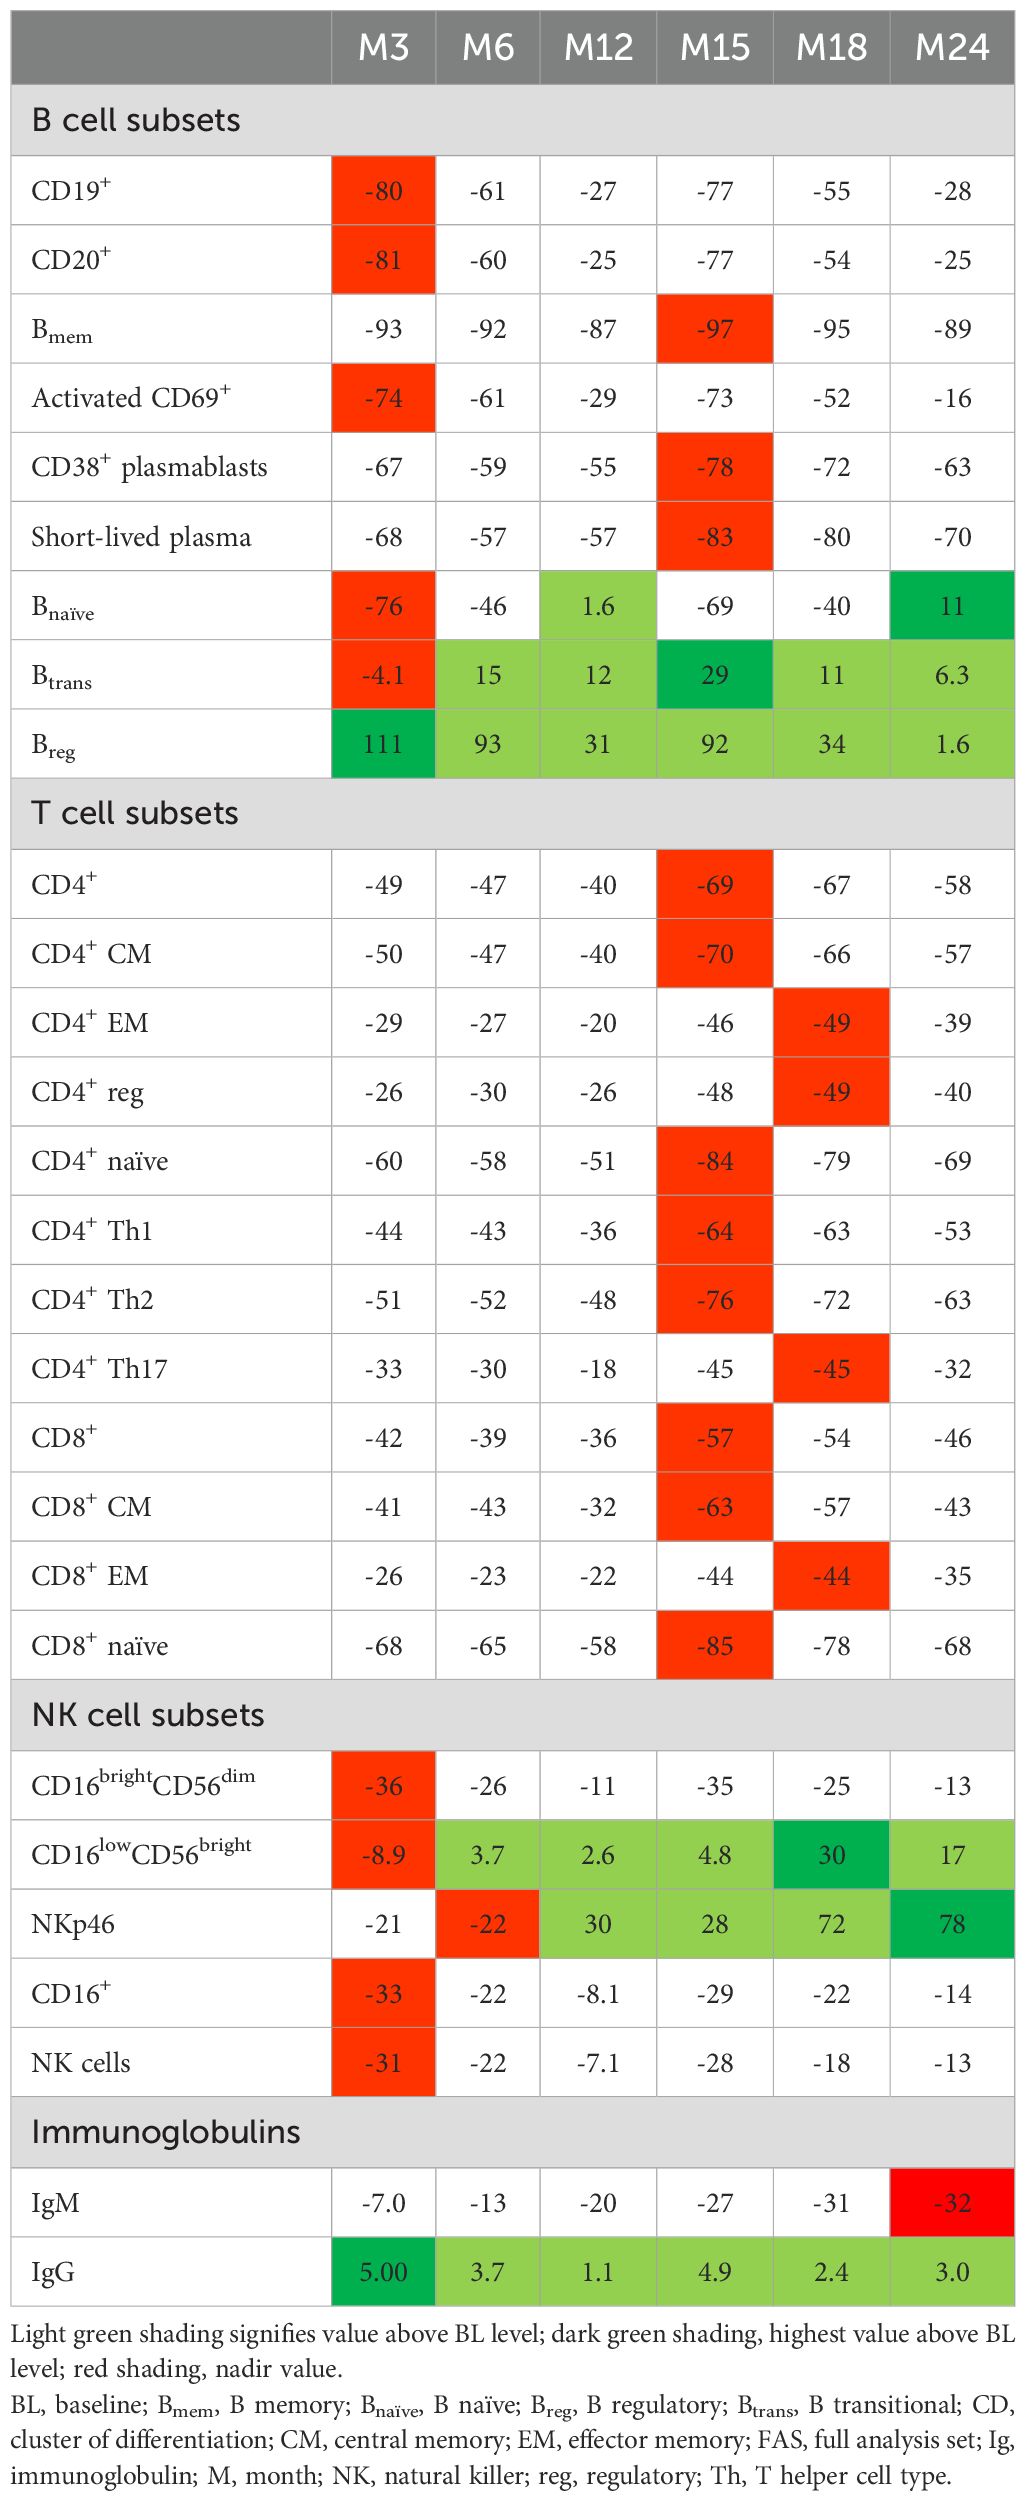
Table 2. Median percentage change from BL for B, T and NK cell subsets and immunoglobulins (FAS).
At M3, we only saw repopulation for Breg cell counts (+111%), which remained elevated at M6 (+93%) and M15 (+92%). At M24, Breg cell counts repopulated to around BL level (+1.6%). Btrans cell counts at M3 were (-4.1%), differing from the previous report. However, these cells recovered to above BL by M6 (+15%) and had the highest increase after the second treatment course (M15, +29%) and remained above BL until M24 (+6.3%). Previous sub-study observations found Bnaive cells reaching nadir at M2 (-90%), recovering to near baseline levels at M12 (-5.0%) (15). Here, for the total study population Bnaïve cell counts recovered after completion of each yearly treatment course (+1.6%, M12; +11%, M24, highest value).
T cell subtypes: Like previously published data (15), a substantial decrease in absolute values for all T cell counts was observed immediately after CladT treatment in the FAS. T cell counts decreased further after the second treatment course with nadir values at M15 for most cell subsets. CD4+ effector memory (EM), CD4+ regulatory (reg), CD4+ T helper (Th)17 and CD8+ EM reached nadir values at M18 (-49%, -49%, -45%, and -49% respectively). No T cell subtypes had recovered to BL levels at M24 (Figure 1B; Table 2). The most substantial change from BL levels was observed for CD4+ naïve (-84%) and CD8+ naïve (-85%) cells at M15. CD4+ Th1 and Th2 cell count reductions were like other T cell subtypes across the post-BL period, with the largest median percentage change at M15 for CD4+ Th1 and Th2 (-64% and -76%).
NK cell subtypes: Most NK cell subsets reached nadir values at M3 (Figure 1C; Table 2); however, these counts generally remained above the lower limits of normal (>100×106/L) (18). The most substantial reductions were observed at M3 for CD16brightCD56dim (-36%), CD16+ (-33%), CD16lowCD56bright (-8.9%), and NK (-31%) cell counts, while NKp46 cell counts were most reduced at M6 (-22%). Repopulation to above BL values was observed for CD16lowCD56bright and NKp46 cells starting at M6 and M12 respectively. At M18, CD16lowCD56bright cells increased to 30% above BL levels, differing from the previous report where CD16lowCD56bright cells remained at -9.0% at M12 (15). NKp46 cells reached BL levels at M12 and continued to increase in number after the second of two-yearly treatment courses (M24, 78%).
Serum proteins: Throughout the 2-year study, serum IgG and IgM levels for most participants remained within the normal ranges of 5.65–17.65 g/L and 0.40–2.30 g/L, respectively (Table 2). For IgG, at BL, M3, M24: >50% – <75% were within the normal range. M6, M12: all participants were within the normal range. M15, M18: >75% of participants were within the normal range. For IgM, at all visits approximately >50% – <75% of participants were within the normal range. Mean sNfL levels at BL were 13.11, and 7.53 and 7.87 ng/L at M12 and M24, respectively. During the study, sNfL levels decreased by 25% at M12 and 23% at M24 (p<0.0001). This reduction was also evident in the normalized Z-scores, at M12 the median sNfL Z-score was 0.1 (a z-score of zero is similar relative to the age- and BMI-matched reference population). sNfL Z-score reduction was sustained at M24 (Figure 2).
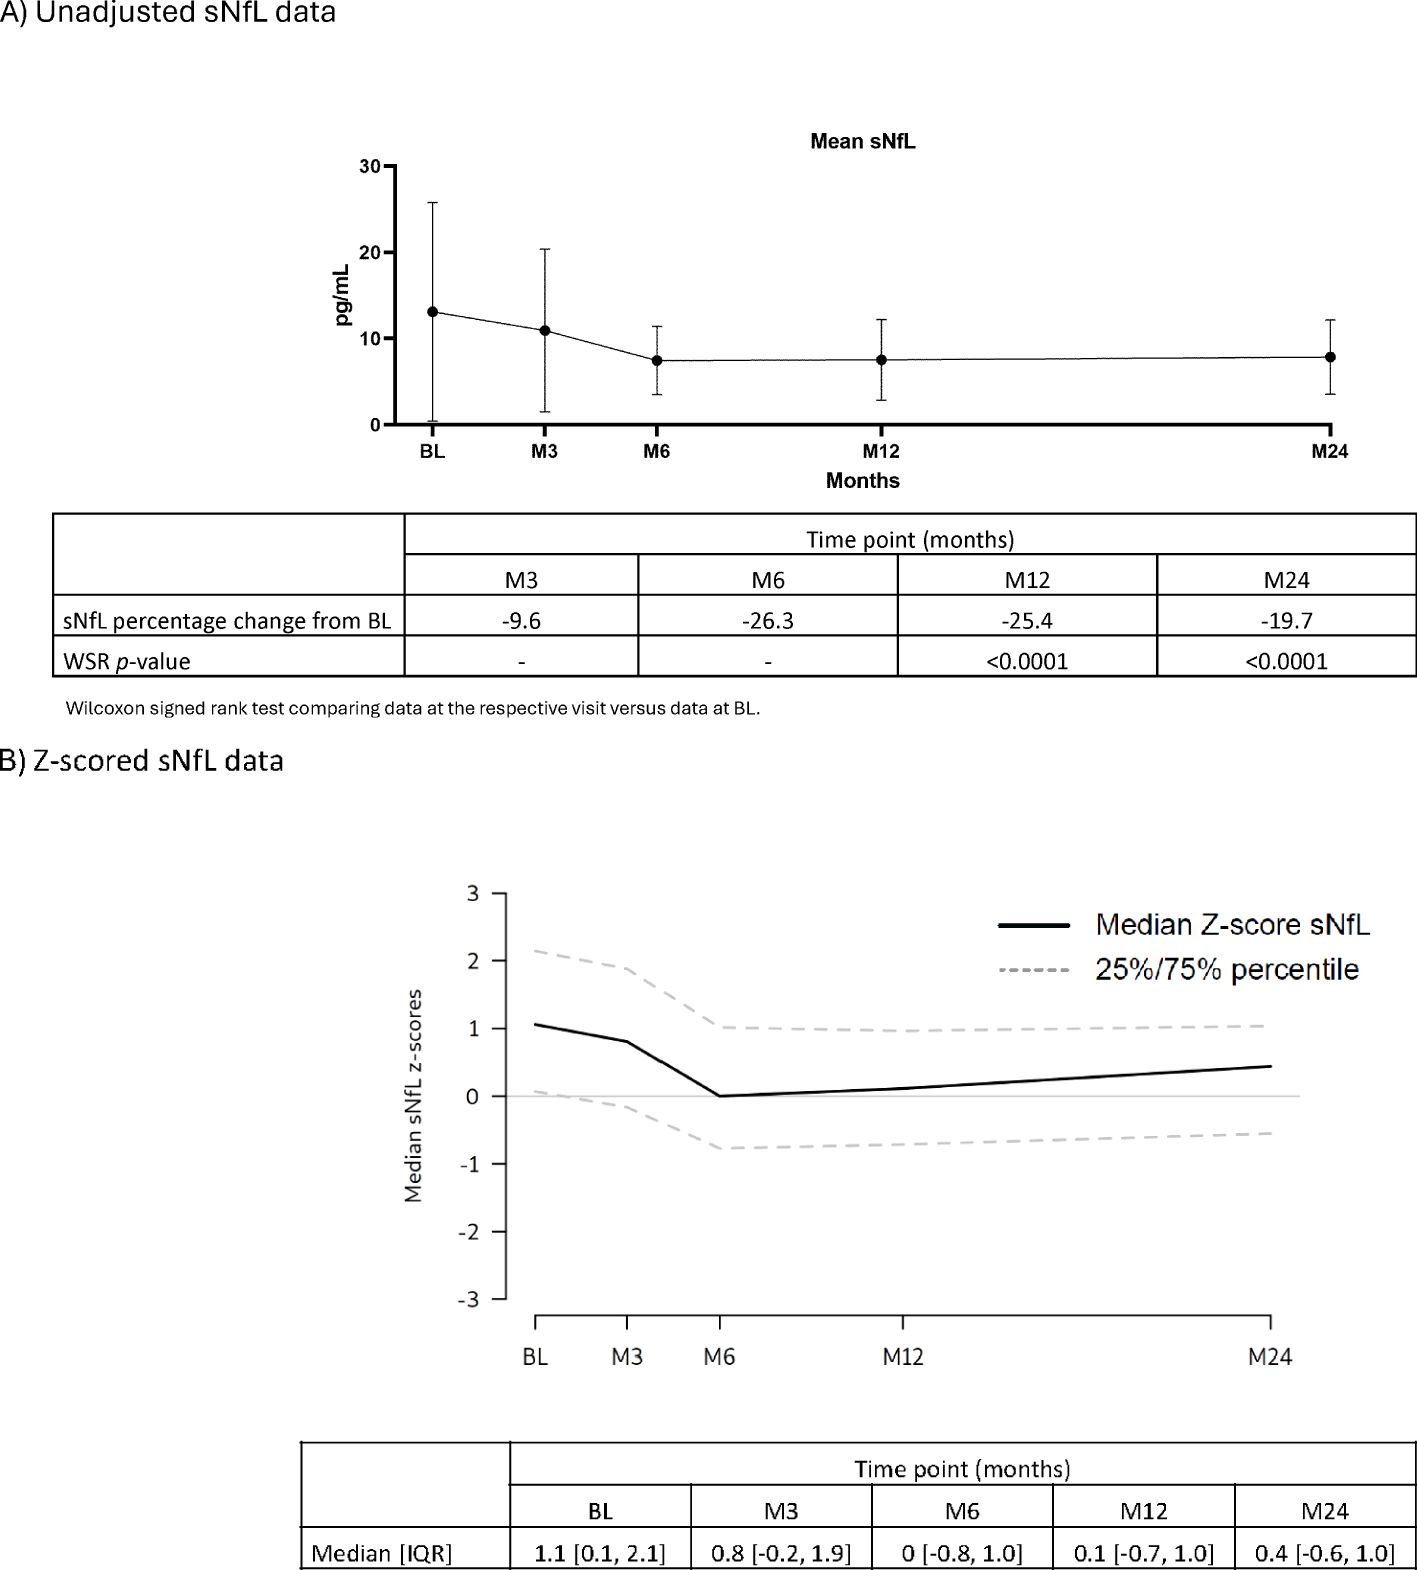
Figure 2. sNfL levels (FAS). (A) Unadjusted sNfL data. (B) Z-scored sNfL data. BL, baseline; FAS, full analysis set; IQR, interquartile range; M, month; sNfL, serum neurofilament light chain; WSR, Wilcoxon signed rank test.
B cells: In the blood biomarker sub-study population, treatment with CladT reduced the level of pro-inflammatory interleukin (IL)-6 producing Bmem cells in PBMCs after the first and second yearly treatment courses. IL-6+ Bmem expression did not reach BL levels at M24 (Figure 3A; Supplementary Table 1). The reductions for IL-6+ B cells and IL-6+ Bmem cells were most pronounced at the end of the first year of treatment with CladT, with the most pronounced decrease at M12 (median percentage change from BL: -16% and -12%, respectively). There was an increase at M6 in anti-inflammatory cytokine-producing B cell counts (IL-10+) following the first course of CladT; however, after the second treatment course, there was a reduction in IL-10+-producing B cells. Overall, a slight decrease in IL-10+ B cell counts was seen after M12, with a nadir at M15 (-1.6%). IL-10+ Bmem cells were similarly reduced compared to BL, with a nadir at M15 (-2.5%).
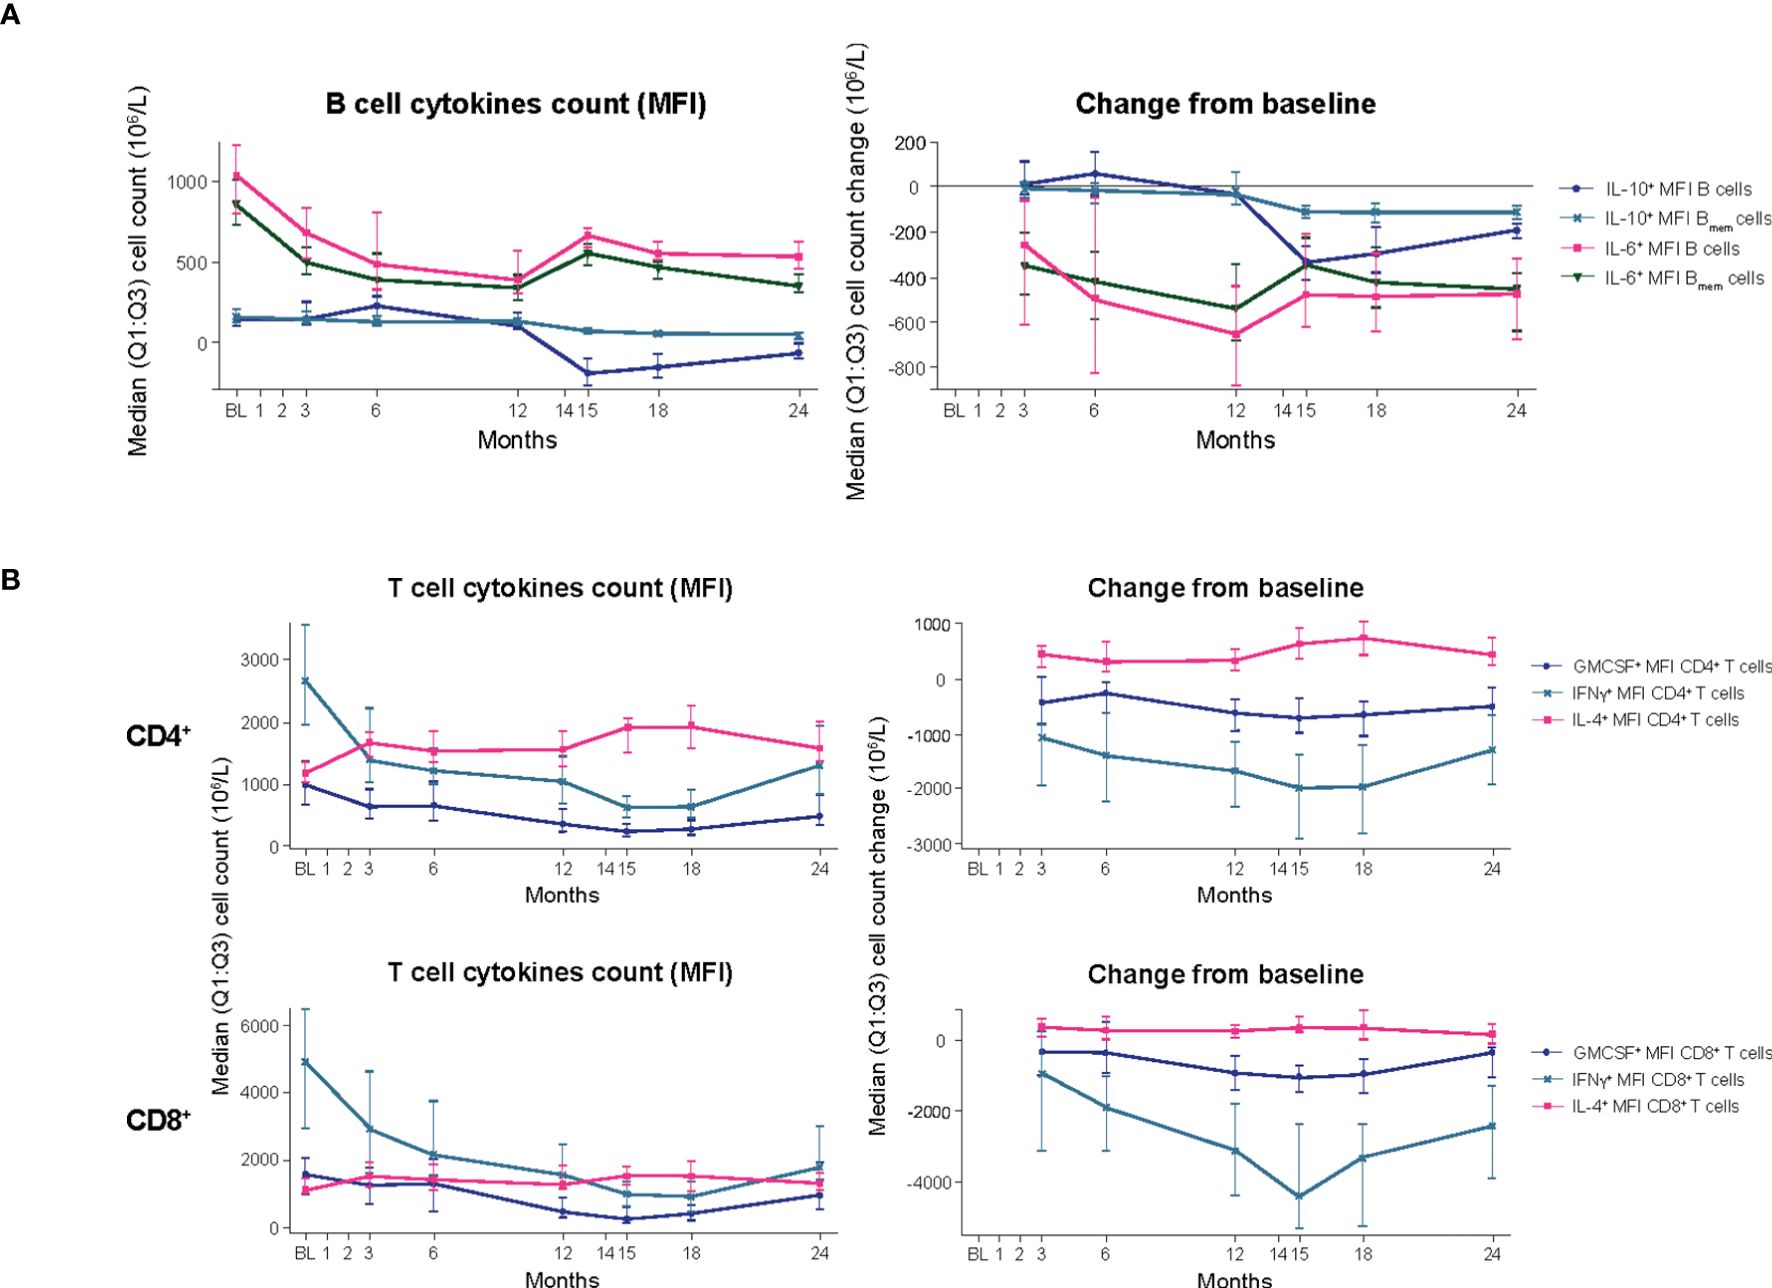
Figure 3. B- and T-cell cytokines (blood biomarker sub-study). (A) B-cell cytokines. (B) T-cell cytokines. BL, baseline; Bmem, B memory; CD, cluster of differentiation; GMCSF, granulocyte-macrophage colony-stimulating factor; IFN, interferon; IL, interleukin; M, month; MFI, mean fluorescence intensity; Q1:Q3, quartile range; TNF, tumor necrosis factor.
T cells: Decreases in cell counts for pro-inflammatory cytokine producing T cells such as granulocyte-macrophage colony-stimulating factor (GMCSF+), interferon (IFN)y+, and tumor necrosis factor alpha (TNFα+) T cells were observed. The reductions in GMCSF+ and IFNy+ producing CD4+ T cell counts were observed from M3 (median percentage change from BL: -3.3% and -3.6%) and continued until M15. For GMCSF+ and IFNy+ producing CD8+ T cells, counts were reduced following the first treatment course, reached a nadir at M15 (-12% and -19%, respectively, Figure 3B, Supplementary Table 1). These cells did not recover to BL values. Increases or no substantial reduction in cell counts were observed for anti-inflammatory cytokine-producing T cells (IL-4+ and IL-10+ T cells, respectively). IL-4+ CD4+ T cell counts increased slightly following the first treatment course (M3, +0.8%) and remained above BL levels to M24 (+1.7%). IL-4+ CD8+ T cell counts were also slightly increased over BL up to M24 (+0.6%).
Differentially expressed genes and the associated pathways were analyzed at each of the reported time points. The most prolific changes were observed after the completion of each yearly CladT treatment course (Figure 4). At the end of the 1st treatment course (BL to M12) both B and T cells showed upregulation in humoral immune response genes and pathways (Figures 4, 5). While B cell expression was upregulated (n=229), most T cell transcripts (n=260) were downregulated at this time point (Supplementary Table 2). B cells showed an increase in CD19, CD74, CD22, and NF-κB inhibitor (NFκBI) genes, while an increase in granzyme A (GZMA), IL-32 and CD27 genes were seen in T cells, and a decrease in nuclear factor (NF)-κB2. Adaptive and innate immune responses were detected in B cell genes. At the time of completion of the second treatment course (comparing M15 to BL), an increase in B cell immunity and humoral response was seen for both B and T cells. Upregulated genes for CD3+ cells included: CDK6, CD27, IL-32, GZM(A, B, H and K), NKG 7, and DNA-binding factor TOX. At this timepoint, transcripts associated with adaptive immune response and regulation of IFNy+ production were upregulated in T cells only. Transcripts upregulated in B cells included SOX4, TNFRSF21, CCl5, and SOD 2. CD19+ cells had downregulated chemokine encoding genes at this time point (CXCR3). At the end of the study (BL to M24), upregulation was detected in two pathways only: oxidative phosphorylation and humoral immune response for B cells, otherwise gene expression was like BL. The full list of genes at M12, M15 and M25 compared with BL is presented in Supplementary Appendix 2.

Figure 4. Pathway dynamics during the study. *BL–M15 is considered to be completion of the 1st treatment course as PBMCs were taken before the 2nd treatment course at M12. †M15–M24 is considered to be completion of the full treatment course, and reflects immune reconstitution. ‡Describes pathway dynamics during the entire study. BL, baseline; FDR, false discovery rate; IFN, interferon; Ig, immunoglobulin; IL, interleukin; MHC, major histocompatibility complex; M, month; NF, nuclear factor; PBMC, peripheral blood mononuclear cells.
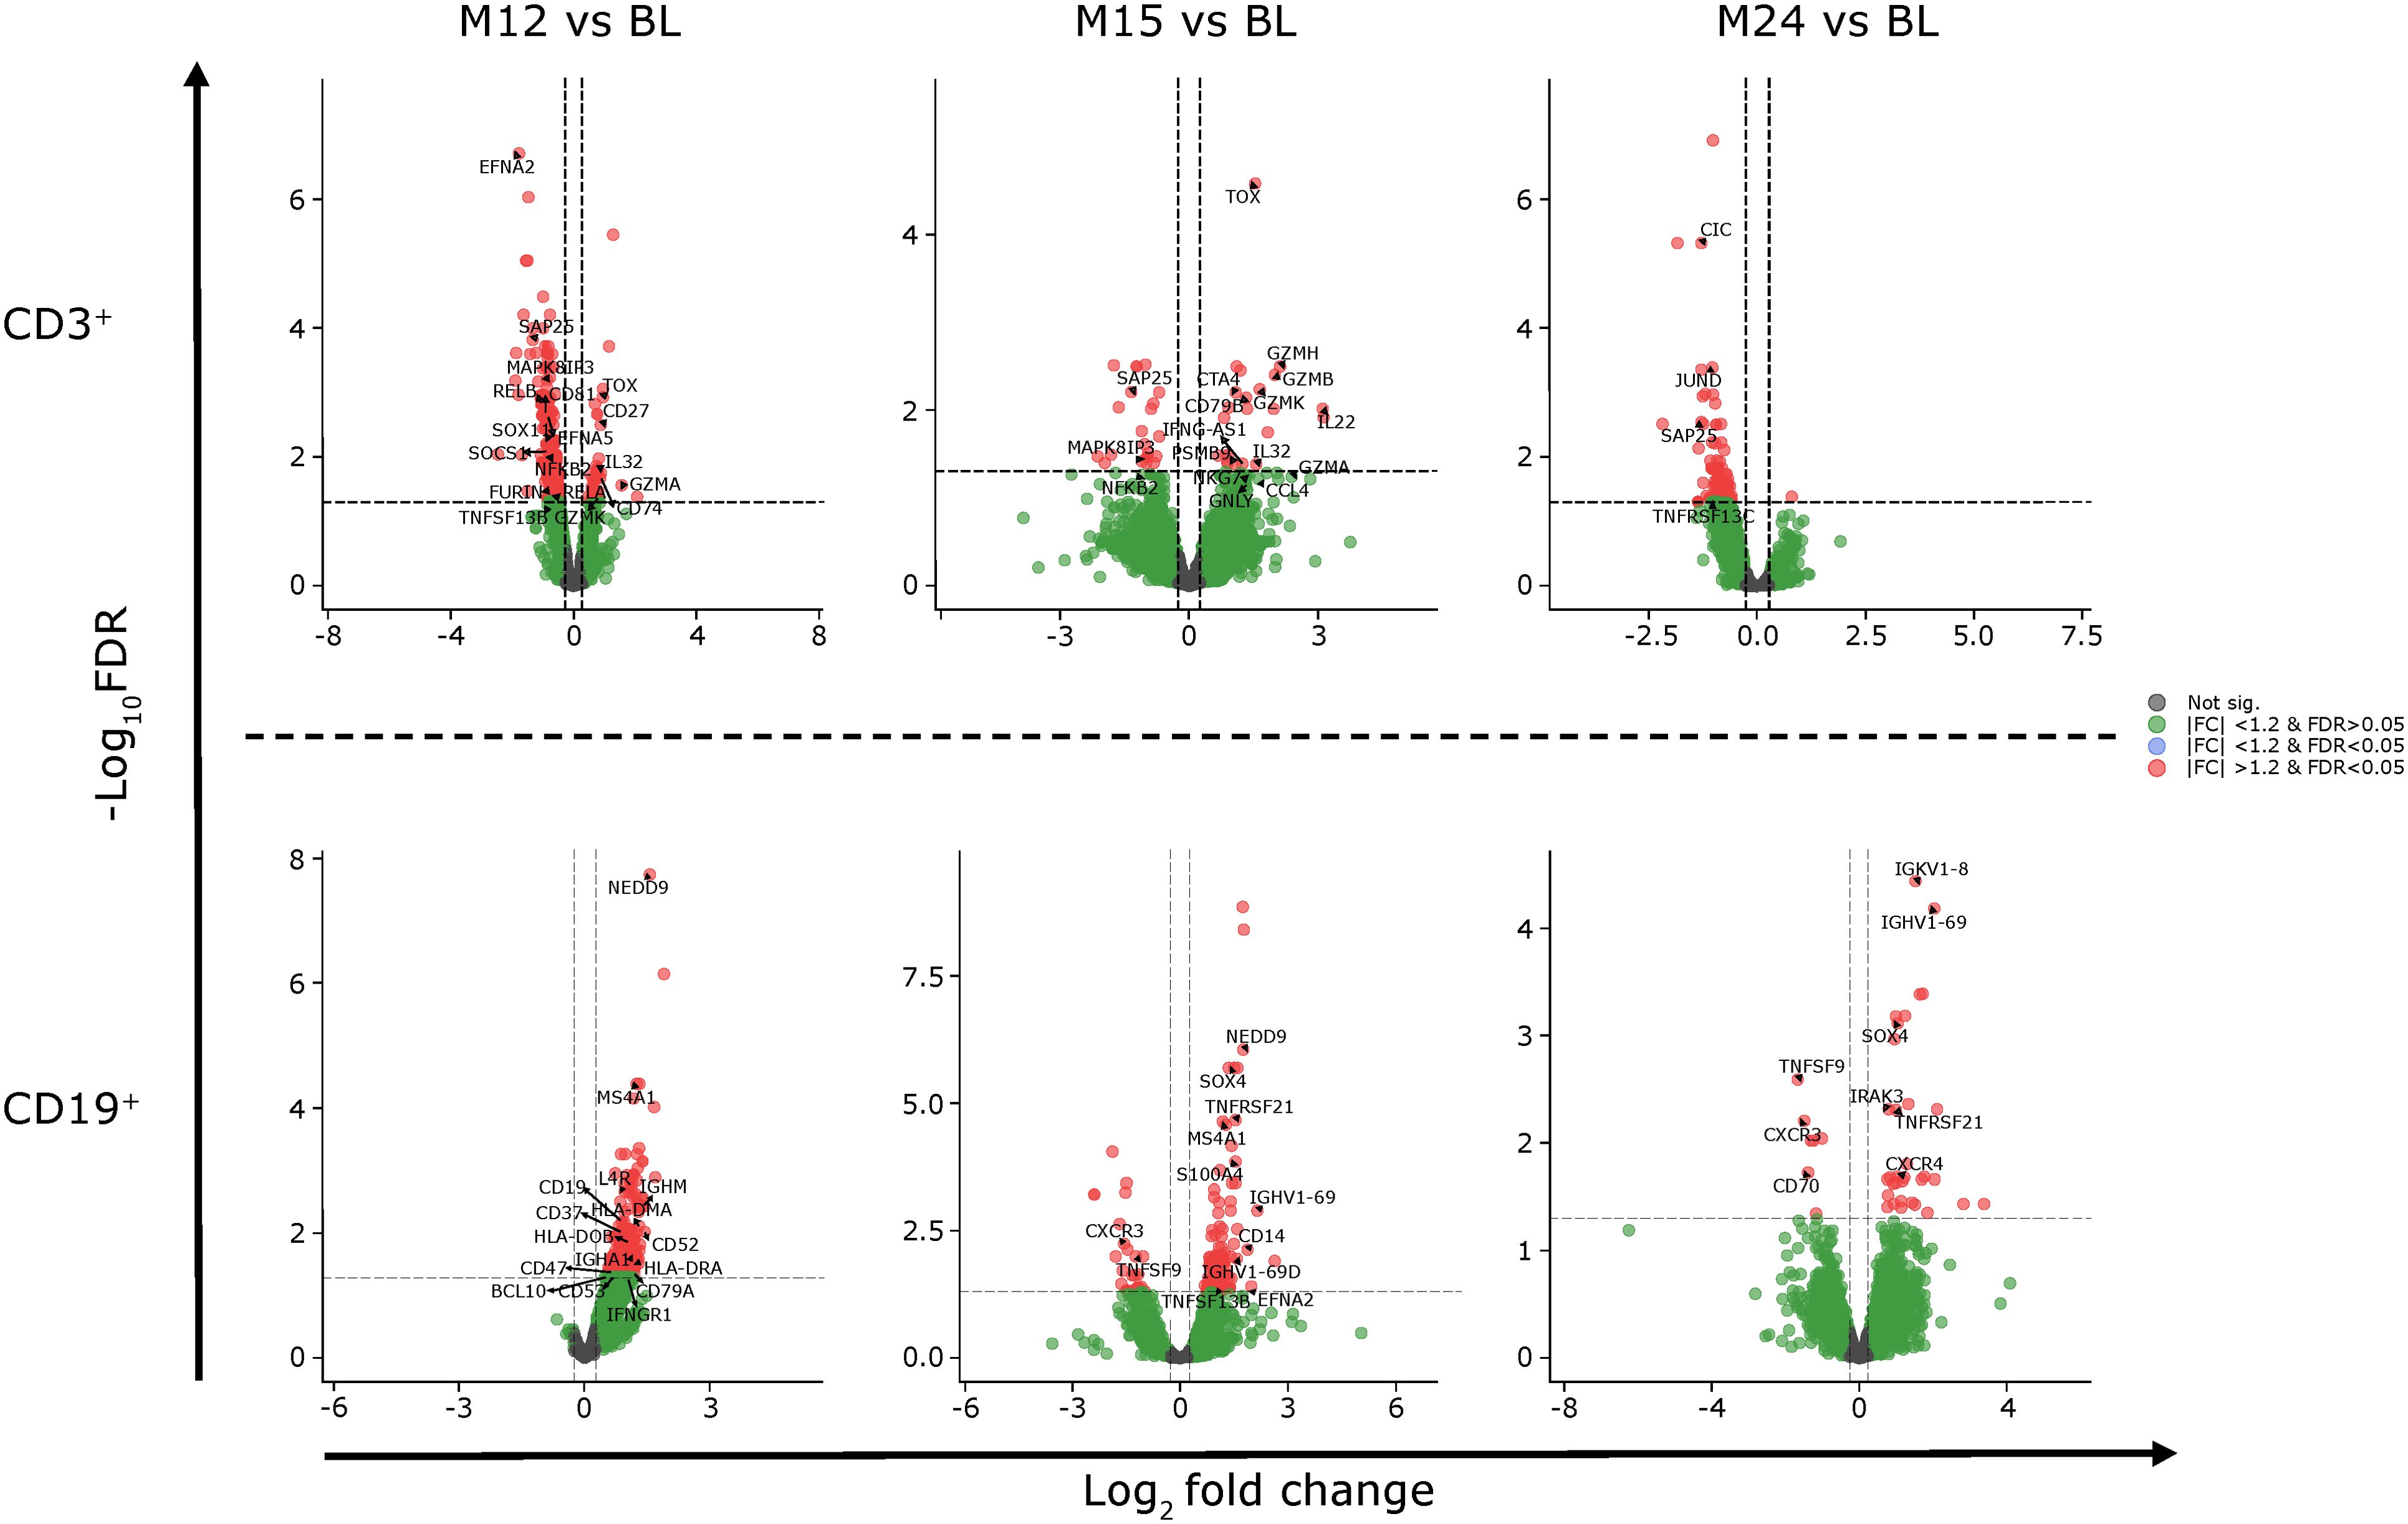
Figure 5. Gene expression of CD3+ and CD19+ cells at M12, M15 and M24 compared to BL. BL, baseline; FC, fold change; FDR, false discovery rate; M, month.
In the FAS, the ARR was 0.11 (95% CI: 0.09, 0.15), with 83% of participants free of qualifying relapses and 91.8% free of 6mCDP during the 24M study period. 92.9% and 96.9% of participants did not have confirmed progression on T25FWT and 9HPT, respectively (Supplementary Table 3). Among participants with MRI data (n=265), significant reductions in the annualized CUA count were seen from M2 (Supplementary Figure 3A). The maximum mean change was reached at M6 and was maintained until M24. In the total population, 61.7% of participants had no T1 Gd+ lesions and 57.7% had no active T2 lesions (without T1 Gd+) at BL. By M24, this proportion increased to 92.8% and 86.9%, respectively (Supplementary Figure 3B). The safety profile observed in this study was generally consistent with that previously reported, with no new safety findings reported during the study. Incidences of study treatment related infections were reported in 55 (20.4%) participants and were either mild or moderate. No severe study treatment related infections were observed (Supplementary Table 4).
In participants with both MRI and B cell data, the correlation was found between Bmem or Breg cell counts and CUA, T1 Gd+ or active T2 lesions at M3 or M6 was not statistically significant (Supplementary Figure 4). Most participants were grouped into the ≥90% category for both correlation analyses. A significant but weak negative correlation was observed between changes in CUA and changes in Breg cells from BL to each M12 and M15 timepoints. No further significant correlations were observed for Bmem or other timepoints for Breg cells (Supplementary Figure 5). No significant correlations were found between disability status categories and selected immune cell subset ratios, including CD16brightCD56dim/NK cells and CD16lowCD56bright/NK cells (Supplementary Figure 2).
Performing deep immunophenotyping on the entire MAGNIFY-MS cohort at each visit allowed for better understanding of time and extent of immune cell dynamics and its potential effect on clinical outcomes. In this study, we contrasted lymphocyte dynamics with MRI and clinical outcomes, and analysis of transcriptomics. Several observations made in the B, T and NK cell pool point to cladribine’s effect on adaptive immunity and a transient effect on innate immunity. In line with previously reported data (2, 8, 15), we observed a sustained reduction of Bmem cells after the first CladT treatment course, and further reduction after the second treatment course (nadir values at M15). Bmem cells remained low until the end of the follow-up period at M24. Other studies have demonstrated that a proportion of circulating Bmem cells likely harbor latent EBV infection, which in turn drives proliferation of Bmem cells (19). We observed a sustained and durable effect of CladT on reduction of these pathogenic cells, which likely results in proportionally reduced numbers of Bmem in the CNS thereby blocking ongoing inflammation. We also observed increases in NK cells (both CD56bright and NKp46), which have been shown to limit circulating EBV-infected B cells (20, 21). However, it remains to be elucidated whether increases in NK cells seen in this study are beneficial for controlling EBV infection in MS. In addition, EBV can induce oncogenesis through multiple pathways, one of which is NF-κB (22).
The NF-κB pathway plays a significant role in the pathogenesis of MS. This pathway is crucial for regulating immune responses, inflammation, and cell survival. In MS patients, the NF-κB pathway is often dysregulated, leading to increased activation and contributing to the inflammatory processes that characterize the disease (23, 24). We detected both up- and down-regulation of the genes involved in this pathway. After the first treatment course, genes NFκB2, RELA and RELB were downregulated in CD3+ cells, while NFκBI zeta (NFκBIZ) was upregulated in CD19+ cells. The decrease of NFκB2 expression also remained after the completion of the second treatment. The regulation of NF-κB is similar to that seen in fingolimod-treated people who responded to therapy, where NFκBI beta (NFκBIB) and NFκB1 genes are upregulated at 12 months of therapy (25). Unlike fingolimod, CladT does not have a constant immune suppression effect. Instead, during CladT treatment rapid depletion of all lymphocytes including pathogenic Bmem cells is observed. This process is followed by repopulation of Bnaïve and Btrans cells, as well as NKp46 cells. Therefore, it is not surprising that up- and down-regulation of specific genes is observed in this important pathway after the first treatment course. Most importantly, we have observed that down-regulation of NFkB2 persisted after the second year of treatment, indicating overall reduction in the inflammatory process. This is also supported by a reduction in pro-inflammatory cytokines.
We detected reconstitution to above BL levels for Breg, Btrans and Bnaïve cells. Previously, Breg and Btrans cell counts were found to reduce relatively rapidly (-45% and -61%, respectively) and recovered to above baseline levels by M3 (+176 and +28, respectively); increases were demonstrated up to 1 year (15). Here, they remain increased from BL until 24M. Breg cells are known to display suppressive functions toward pro-inflammatory and autoreactive immune responses (26). We noted a substantial increase in Breg counts after the first treatment course (M3), which was maintained after the second treatment course, indicating a sustained beneficial treatment effect of CladT. Btrans cell counts were increased starting at M6, with the most substantial increase reported after the second treatment course. Reduced Btrans cell levels have been shown to be associated with a high risk of MRI activity in IFN beta-treated patients (27). In addition, the recovery of Bnaïve cells in the presence of sufficient T cell control may prevent the occurrence of conditions that are needed for secondary autoimmunity (11).
Modification of the adaptive response to infectious agents by high-efficacy treatments for MS has been brought into focus in the recent COVID-19 pandemic, both through increased susceptibility and severity of infections and the potential difficulty of effective vaccination. In our study, IgM and IgG levels remained within reference ranges for most participants. We observed slight reductions in IgM levels, which could be linked to the temporary, but profound reduction in Bnaïve cell counts, or the change in cytokine production from lymphocytes. In addition, we also observed that genes involved in immunoglobulin production were upregulated in both cell types after completion of the full treatment course (M15). We did not observe reductions in IgG levels. This stability in IgG is of importance to patients, and underpins the modest effect of CladT on plasma cells, as reduced levels of IgG have been linked to an increased risk of infection (28). In CladT-treated patients, immunoglobulin stability may also account for the sustained ability to mount a humoral response to vaccination (29), compared to those treated with other cell depleting or sequestering DMTs which result in reduced humoral responses (30).
Reductions in T cell subset counts were sustained up to the full 2-year treatment course of CladT, with lowest values reached after the second-year dosing at M15 for most subsets, and for CD4+ EM, CD4+ reg, and CD8+ EM at M18. Whilst T cell depletion on its own (31) would not be expected to lead to such significant clinical effects as seen with CladT, reduction in T cell subsets combined with the sustained reduction of Bmem cells may explain the durability of CladT treatment effect beyond the dosing period.
Recent observations suggest that the expression of certain cell surface markers by NK cells might be an important indicator of the activation state of the immune system (32). In this study, CD16lowCD56bright and NKp46 repopulated soon to above BL levels at M6 and M12 respectively, indicating a transient effect of CladT on innate immunity. It is known that activated CD56bright NK cells migrate to the intrathecal compartment in MS and regulate autoreactive T cells via cytotoxicity (33). Additionally, CD56bright NK cells have been proposed to improve outcomes in RMS through immunomodulation (34), and could be a biomarker of treatment response (35). Others reported an association between increased CD56bright NK cells and reduced MRI activity in patients (36). In our study, we did not find any statistically significant correlations between the increase in NK cells and MRI or clinical activity when comparing with the entire cohort of participants. However, we did observe an increase in genes that regulate innate immune response in B cells at M12 and M15. The role of NKp46 activation on NK cells in patients undergoing treatment with CladT remains to be determined; however, the finding that increased NKp46 levels have also been observed in patients after hematopoietic stem cell transplantation is an indicator of reconstitution of the immune system towards a more favorable state (35).
Further evidence that there is a change in the inflammatory state of the immune system after CladT treatment was detected by observation of changes in the number of T and B cells expressing anti- or pro-inflammatory cytokines. Reductions in cells positive for pro-inflammatory cytokines were more pronounced than changes in anti-inflammatory cytokines, with a consistently greater reduction in the second year. These changes in anti-inflammatory and pro-inflammatory cytokine-producing cells give further indication that CladT leads to post-reconstitution qualitative changes, which continue to evolve after completion of the full cumulative dose. Gene expression and pathways analysis also support this observation. For example, CD3+ had an upregulation in genes involved in the positive regulation of cytokine production after the full treatment course (M15).
We detected sustained reduction of sNfL to M24, indicating reduced neuroaxonal damage (37) during treatment with CladT. Our results are consistent with previously reported results from real-world observational studies (38, 39). When raw sNfL levels were normalized for age and BMI, it became apparent that they were reduced close to the levels of general population (16) during CladT treatment.
The maximum effect of CladT on MRI activity becomes apparent at 6 months (40) after initiation of treatment, and remained consistently low for the remainder of the 2-year study. These results are similar to those described in the original study (14), but obtained in younger participants judged to be highly active at BL and with a much higher frequency of MRI lesions. The significant reduction in lesion count was maintained up to M24, highlighting the efficacy of CladT in people with highly active RMS. Here, we found no direct correlations between changes in MRI lesion count and Bmem or Breg cell counts to 6 months of CladT treatment, nor did we find correlations between clinical and MRI outcomes and ratios of immune cells. We also did not observe broad patient or population-level associations between changes in lymphocytes and CUA lesions from BL to follow-up timepoints. These results are not entirely surprising given similar findings have been published for other DMTs (41–44), strongly suggesting a non-linear and indirect relationship between CUA and Bmem rather than a true lack of association. A limitation in our correlation analysis was that the time frame investigated was limited from BL until M6. However, as onset of action was the focus of MAGNIFY-MS, our intention was to determine if the immunological changes caused by CladT could correlate with early MRI outcomes. Our results are supported by previously published data from the MAGNIFY-MS study, where additional analyses including M12, M18 and M24 time points yielded similar results (data not shown) (45). Further analyses on different immune subsets and for specific subgroups of patients over a longer period of time might yield different results. There is further limitation in the transcriptomics analysis. While the pathway and genetic analysis helps further our understanding of how CladT works in MS, the results are restricted by only analyzing CD3+ and CD19+ cells. Transcriptomics interpretation is also restricted due to low participant numbers. Samples for RNA sequencing were selected at random from 11 participants, with numbers limited by the available budget. Future investigations of more immune cell subsets will help identify the key effects driving disease activity. The immune reconstitution effect seen in MAGNIFY-MS may continue beyond the observed 2-year treatment period. These analyses are ongoing in the 2-year MAGNIFY-MS Extension study (NCT04783935).
Our findings provide a detailed description of longitudinal peripheral immune effects with subpopulation depletion and repopulation dynamics in a large cohort of RMS patients over the full 2-year CladT treatment course. These results are supported by clinical outcomes and a gene and pathway analysis. Observed patterns of immune cell depletion and reconstitution, support our understanding of CladT action in rebalancing immune system towards a non-pathogenic, immunocompetent state. Particularly the fact that Bmem cells and total plasma cells are most strongly influenced and still reduced compared to BL after 2 years, maintenance of IgG and IgM levels within reference ranges, and increases of two populations of NK cells, distinguish CladT from other high-efficacy disease-modifying therapies and continuous immunosuppression approaches. The substantial decrease in sNfL levels indicates reduction of neuroaxonal damage following treatment with CladT. Our findings also highlight the importance of administering the full treatment course of CladT as some observed changes became more prominent in the second year of treatment, consistent with its mechanism of action as an IRT.
The original contributions presented in the study are included in the article/Supplementary Material. Further inquiries can be directed to the corresponding author.
The studies involving humans were approved by Australia: Research Ethics and Governance Office, Camperdown, NSW (ID: HREC/18/RPAH/106 and SSA/18/LPOOL/297); Research Governance Office, Prahran, VIC (ID: HREC/18/RPAH/106); Bellberry Human Research Ethics Committee, Eastwood, SA (ID: 2018-06-474). Austria: State of Salzburg Ethics Committee, Salzburg (ID: 415-E/2291/3-2018). Canada: Western University Health Sciences Research Ethics Board, London, ON (Project ID: 111575); University of Alberta Health Research Ethics Board, Edmonton, AB (Study ID: Pro00081437); The University of British Columbia Office of Research Ethics, Vancouver, BC (ID: H1801523); McGill University Health Centre, Centre for Applied Ethics, Montreal, QC (ID: MP-37-2019-4668). Czech Republic: Ethics Committee, Faculty Hospital of St. Anna in Brno, Brno (ID: 24L/2018-AM); Ethics Committee for Multi-Centric Clinical Trials of the University Hospital Motol, Motol (ID: EK-80/18); Ethics Committee of the Brno Faculty Hospital, Brno (ID: 25/18); Ethical Commission of the Hradec Kralove Faculty Hospital, Hradec Kralove (ID: 201805 I 43 L). Ethics Committee of Pardubice Region Hospital, Pardubice. Finland: Hospital District of Helsinki and Uusimaa, Helsinki (ID: HUS/875/2018). France: Committee for the Protection of South-Mediterranean People, Sainte Marguerite Hospital, Marseille (ID: 2017-002631-42). Germany: Ethics Committee of Hanover Medical School, Hanover (ID: 7704M); Ethics Committee of University of Bonn Medical School, Bonn Nordrhein-Westfalen (ID: 7704M); Ethics Committee of Dresden University of Technology, Dresden (ID: 7704M); Ethics Committee of the Westphalia-Lippe Medical Association and the Medical School at the University of Münster, Münster (ID: 7704M); Ethics Committee of the Medical Association of Hamburg, Hamburg (ID: 7704M); Ethics Committee of the Hessen Medical Association, Frankfurt (ID: 7704M); Ethics Committee of the Faculty of Medicine of the University of Leipzig, Leipzig (ID: 7704M); Ethics Committee of the Medical School of Duisburg-Essen University, Essen (ID: 7704M). Hungary: Medical Research Council, Ethics Committee for Clinical Pharmacology, Budapest. Israel: Helsinki Committee (IRB), Rambam Health Care Campus, Haifa (ID: 0049-18-RMB); The State of Israel Ministry of Health, The Chaim Sheba Medical Center, Tel Hashomer (ID: 5022-18-SMC); The Barzilai Medical Center Ashkelon, Ashkelon (Application No. 0022-18-BRZ). Italy: Ethics Committee Central Secretariat Tuscany Region Vast South East Area at Hospital Pharmacy, Siena (ID: EC 12794_2018). Poland: Bioethics Committee at the District Medical Board, Lublin (Resolution ID: 283/2018/KB/VII). Spain: Ethics Committee for Research with Drugs of the Hospital Clínico San Carlos, Madrid (ID: 2017-002631-42). Sweden: Regional Ethics Testing Board in Uppsala, Uppsala (Diary No. 2018/171/1). UK: East Midlands - Leicester South Research Ethics Committee, Nottingham (ID: 18/EM/0086). The studies were conducted in accordance with the local legislation and institutional requirements. The participants provided their written informed consent to participate in this study.
HW: Conceptualization, Formal analysis, Writing – review & editing. FB: Conceptualization, Formal analysis, Writing – review & editing. XM: Conceptualization, Formal analysis, Writing – review & editing. AA: Conceptualization, Formal analysis, Writing – review & editing. TD: Conceptualization, Formal analysis, Writing – review & editing. ACha: Conceptualization, Formal analysis, Writing – review & editing. SH: Conceptualization, Formal analysis, Writing – review & editing. AP: Conceptualization, Formal analysis, Writing – review & editing. LL: Conceptualization, Formal analysis, Writing – review & editing. KS: Conceptualization, Formal analysis, Writing – review & editing. FS: Conceptualization, Formal analysis, Writing – review & editing. PV: Conceptualization, Data curation, Formal analysis, Writing – review & editing. HJ: Conceptualization, Data curation, Formal analysis, Writing – review & editing. AChu: Formal analysis, Writing – review & editing. AK: Formal analysis, Writing – review & editing. DL: Formal analysis, Writing – review & editing. LG: Formal analysis, Writing – review & editing. NDS: Conceptualization, Formal analysis, Writing – review & editing.
The author(s) declare financial support was received for the research, authorship, and/or publication of this article. The study was sponsored by Merck (CrossRef Funder ID: 10.13039/100009945).
The authors would like to thank all the study participants, family members and staff from all sites that were involved in the study. The authors also wish to acknowledge Z-score methodology provided by Jens Kuhle and Pascal Benkert and thank them for their assistance. Medical writing assistance was provided by Joe Ward of inScience Communications, Springer Healthcare Ltd, UK, and supported by Merck.
HW is member of scientific advisory boards/steering committees for Bayer, Biogen, Merck, Novartis, Roche, Sanofi, and Teva. He received speaker honoraria and travel support from Bayer, Biogen, CSL Behring, EMD Serono Research & Development Institute, Inc., Billerica, MA, USA, an affiliate of Merck KGaA, Fresenius Medical Care, Merck, Omniamed, Novartis, Sanofi, and Teva. He received compensation as a consultant from Biogen, Merck Novartis, Omniamed, Roche, and Sanofi. He has received research support from Bayer, Biogen, Merck, Novartis, Sanofi, and Teva, as well as the German Ministry for Education and Research BMBF, German Research Foundation DFG, Else Kröner Fresenius Foundation, Fresenius Foundation, Hertie Foundation, Merck, Novartis, NRW Ministry of Education and Research, Interdisciplinary Center for Clinical Studies IZKF Münster, and RE Children’s Foundation. FB is supported by the NIHR Biomedical Research Centre at UCLH and is a steering committee or Data Safety Monitoring Board member for ATRI/ACTC, Biogen, Merck and Prothena. Consultant for Celltrion, Combinostics, IXICO, Janssen, Merck, Rewind Therapeutics, Roche. Research agreements with Biogen, GE Healthcare, Merck Roche. Co-founder and shareholder of Queen Square Analytics Ltd. XM has received compensation for lecture honoraria and travel expenses, participation in scientific meetings, clinical trial steering committee membership, or clinical advisory board participation in recent years from Abbvie, Actelion, Alexion, Bial PD, Biogen, Bristol-Myers Squibb/Celgene, EMD Serono Research & Development Institute, Inc., Billerica, MA, USA, an affiliate of Merck KGaA, Genzyme, Hoffmann-La Roche, Immunic Therapeutics, Janssen Pharmaceuticals, Medday, Medscape, Merck, Mylan, Nervgen, Neuraxpharm, Novartis, Peervoice, Samsung-Biosys, Sandoz, Sanofi-Genzyme, Teva Pharmaceutical, TG Therapeutics, Excemed, ECTRIMS, MSIF, and NMSS or any of their affiliates. AA has received over the last 5 years honoraria or consulting fees for participating in advisory boards related to clinical trial design, trial steering committees, and data and safety monitoring committees from Biogen, Bristol Myers Squibb, Merck Novartis, Roche, and Sanofi; and research support for investigator-initiated trials and MS patients’ benefits activities from Biogen, Bristol Myers Squibb, Merck, Novartis, Roche, and Sanofi. TD serves on scientific advisory boards for Actelion Janssen/J&J, Bayer, Biogen, Celgene BMS, GeNeuro, MedDay, Merck, Mitsubishi Pharma, Novartis, Roche, and Sanofi; has received funding for travel and/or speaker honoraria from Biogen, Merck Novartis, Roche, and Sanofi; and receives research support from Actelion, the European Union, Novartis, Roche, the Swiss MS Society, and the Swiss National Foundation. ACha has received speakers’/board honoraria from Actelion Janssen/J&J, Almirall, Bayer, Biogen, Celgene BMS, Merck, Novartis, Roche, Sanofi, and Teva, all for hospital research funds. He received research support from Biogen, CSL Behring, Sanofi, and UCB, the European Union, and the Swiss National Foundation. He serves as associate editor of the European Journal of Neurology, on the editorial board for Clinical and Translational Neuroscience, and as topic editor for the Journal of International Medical Research. SH serves on advisory boards for Bayer, Biogen, Merck Novartis, Roche, and Sanofi. She has received money for travel and speaker honoraria from Bayer, Biogen, Merck, Novartis, Roche, and Sanofi. AP has received speaking honoraria and travel expenses for participation in scientific meetings, has been a steering committee member of clinical trials or participated in advisory boards of clinical trials in the past years, and/or received operating grants from Alexion, Bayer, Biogen, Celgene Bristol Myers Squibb, EMD Serono Research & Development Institute, Inc., Billerica, MA, USA, an affiliate of Merck KGaA, Novartis, Roche, Sanofi, and Teva. LL has received honoraria for consulting services or speaking activities from Merck Novartis, and Roche; and research support from Merck and Novartis. KS has received research support, through Queen Mary University of London, from Biogen, Merck, Novartis, and Sandoz; speaking honoraria from, and/or served in an advisory role for, Biogen, EMD Serono Research & Development Institute, Inc., Billerica, MA, USA, an affiliate of Merck KGaA, Merck, Neuraxpharm, Novartis, Roche, and Sanofi; and remuneration for teaching activities from AcadeMe and Medscape. FS has served on scientific advisory boards, been on the steering committees of clinical trials, served as a consultant, received support for congress participation, received speaker honoraria, or received research support for his laboratory from Biogen, Celgene BMS, EMD Serono Research & Development Institute, Inc., Billerica, MA, USA, an affiliate of Merck KGaA Merck Novartis, Roche, Sanofi, and Teva. PV has received honoraria or consulting fees from AB Science, Ad Scientiam, Biogen, Celgene BMS, Imcyse, Merck, Novartis, Roche, Sanofi, and Teva; and research support from Novartis, Roche, and Sanofi. HJ and AK are employees of Merck Healthcare KGaA, Darmstadt, Germany. AChu is an employee of Cytel Inc., Geneva Branch, Switzerland, funded by to perform statistical analyses for this study. LG and DL are employees of EMD Serono Research & Development Institute, Inc., Billerica, MA, USA, an affiliate of Merck KGaA. NDS has received honoraria from Biogen, Celgene Bristol Myers Squibb, EMD Serono Research & Development Institute, Inc., Billerica, MA, USA, an affiliate of Merck KGaA. Genzyme, Immunic, Novartis, Roche, and Teva for consulting services, speaking, and travel support. He serves on advisory boards for Biogen, Genzyme, Immunic, Merck, Novartis, and Roche, and has received research grant support from the Italian MS Society.
The author(s) declare that no Generative AI was used in the creation of this manuscript.
All claims expressed in this article are solely those of the authors and do not necessarily represent those of their affiliated organizations, or those of the publisher, the editors and the reviewers. Any product that may be evaluated in this article, or claim that may be made by its manufacturer, is not guaranteed or endorsed by the publisher.
The Supplementary Material for this article can be found online at: https://www.frontiersin.org/articles/10.3389/fimmu.2025.1512189/full#supplementary-material
1. Ceronie B, Jacobs BM, Baker D, Dubuisson N, Mao Z, Ammoscato F, et al. Cladribine treatment of multiple sclerosis is associated with depletion of memory B cells. J Neurol. (2018) 265:1199–209. doi: 10.1007/s00415-018-8830-y
2. Comi G, Cook S, Giovannoni G, Rieckmann P, Soelberg Sørensen P, Vermersch P, et al. Effect of cladribine tablets on lymphocyte reduction and repopulation dynamics in patients with relapsing multiple sclerosis. Mult Scler Relat Disord. (2019) 29:168–74. doi: 10.1016/j.msard.2019.01.038
3. Giovannoni G. Cladribine to treat relapsing forms of multiple sclerosis. Neurotherapeutics: J Am Soc Exp Neurother. (2017) 14:874–87. doi: 10.1007/s13311-017-0573-4
4. Giovannoni G, Comi G, Cook S, Rammohan K, Rieckmann P, Soelberg Sørensen P, et al. A placebo-controlled trial of oral cladribine for relapsing multiple sclerosis. New Engl J Med. (2010) 362:416–26. doi: 10.1056/NEJMoa0902533
5. Giovannoni G, Mathews J. Cladribine tablets for relapsing-remitting multiple sclerosis: A clinician’s review. Neurol Ther. (2022) 11:571–95. doi: 10.1007/s40120-022-00339-7
6. Leist TP, Weissert R. Cladribine: mode of action and implications for treatment of multiple sclerosis. Clin neuropharmacology. (2011) 34:28–35. doi: 10.1097/WNF.0b013e318204cd90
7. Rammohan K, Coyle PK, Sylvester E, Galazka A, Dangond F, Grosso M, et al. The development of cladribine tablets for the treatment of multiple sclerosis: A comprehensive review. Drugs. (2020) 80:1901–28. doi: 10.1007/s40265-020-01422-9
8. Stuve O, Soelberg Soerensen P, Leist T, Giovannoni G, Hyvert Y, Damian D, et al. Effects of cladribine tablets on lymphocyte subsets in patients with multiple sclerosis: an extended analysis of surface markers. Ther Adv Neurol Disord. (2019) 12:1756286419854986. doi: 10.1177/1756286419854986
9. de Sèze J, Maillart E, Gueguen A, Laplaud DA, Michel L, Thouvenot E, et al. Anti-cd20 therapies in multiple sclerosis: from pathology to the clinic. Front Immunol. (2023) 14:1004795. doi: 10.3389/fimmu.2023.1004795
10. Schmierer K, Wiendl H, Oreja-Guevara C, Centonze D, Chudecka A, Roy S, et al. Varicella zoster virus and influenza vaccine antibody titres in patients from magnify-ms who were treated with cladribine tablets for highly active relapsing multiple sclerosis. Mult Scler J. (2022) 28:2151–3. doi: 10.1177/13524585221099413
11. Baker D, Herrod SS, Alvarez-Gonzalez C, Giovannoni G, Schmierer K. Interpreting lymphocyte reconstitution data from the pivotal phase 3 trials of alemtuzumab. JAMA Neurol. (2017) 74:961–9. doi: 10.1001/jamaneurol.2017.0676
12. Baker D, Pryce G, Amor S, Giovannoni G, Schmierer K. Learning from other autoimmunities to understand targeting of B cells to control multiple sclerosis. Brain. (2018) 141:2834–47. doi: 10.1093/brain/awy239
13. Baker D, Marta M, Pryce G, Giovannoni G, Schmierer K. Memory B cells are major targets for effective immunotherapy in relapsing multiple sclerosis. EBioMedicine. (2017) 16:41–50. doi: 10.1016/j.ebiom.2017.01.042
14. De Stefano N, Barkhof F, Montalban X, Achiron A, Derfuss T, Chan A, et al. Early reduction of mri activity during 6 months of treatment with cladribine tablets for highly active relapsing multiple sclerosis. Neurol Neuroimmunol Neuroinflamm. (2022) 9:e1187. doi: 10.1212/nxi.0000000000001187
15. Wiendl H, Schmierer K, Hodgkinson S, Derfuss T, Chan A, Sellebjerg F, et al. Specific patterns of immune cell dynamics may explain the early onset and prolonged efficacy of cladribine tablets. Neurol Neuroimmunol Neuroinflamm. (2023) 10::e200048. doi: 10.1212/nxi.0000000000200048
16. Benkert P, Meier S, Schaedelin S, Manouchehrinia A, Yaldizli Ö, Maceski A, et al. Serum neurofilament light chain for individual prognostication of disease activity in people with multiple sclerosis: A retrospective modelling and validation study. Lancet Neurol. (2022) 21:246–57. doi: 10.1016/s1474-4422(22)00009-6
17. Clinicaltrials.gov. Evaluation of the onset of action in highly active ms (Magnify) (2017). Available online at: https://clinicaltrials.gov/study/NCT03364036 (Accessed 15/04/2024).
18. Ebbo M, Gérard L, Carpentier S, Vély F, Cypowyj S, Farnarier C, et al. Low circulating natural killer cell counts are associated with severe disease in patients with common variable immunodeficiency. EBioMedicine. (2016) 6:222–30. doi: 10.1016/j.ebiom.2016.02.025
19. Burns DM, Tierney R, Shannon-Lowe C, Croudace J, Inman C, Abbotts B, et al. Memory B-cell reconstitution following allogeneic hematopoietic stem cell transplantation is an ebv-associated transformation event. Blood. (2015) 126:2665–75. doi: 10.1182/blood-2015-08-665000
20. Jud A, Kotur M, Berger C, Gysin C, Nadal D, Lünemann A. Tonsillar cd56brightnkg2a+ Nk cells restrict primary epstein-barr virus infection in B cells via ifn-Γ. Oncotarget. (2017) 8:6130–41. doi: 10.18632/oncotarget.14045
21. Png YT, Yang AZY, Lee MY, Chua MJM, Lim CM. The role of nk cells in ebv infection and ebv-associated npc. Viruses. (2021) 13:300. doi: 10.3390/v13020300
22. Luo Y, Liu Y, Wang C, Gan R. Signaling pathways of ebv-induced oncogenesis. Cancer Cell Int. (2021) 21:93. doi: 10.1186/s12935-021-01793-3
23. Leibowitz SM, Yan J. Nf-κb pathways in the pathogenesis of multiple sclerosis and the therapeutic implications. Front Mol Neurosci. (2016) 9:84. doi: 10.3389/fnmol.2016.00084
24. Zhou Y, Cui C, Ma X, Luo W, Zheng SG, Qiu W. Nuclear factor κb (Nf-κb)-mediated inflammation in multiple sclerosis. Front Immunol. (2020) 11:391. doi: 10.3389/fimmu.2020.00391
25. Sánchez-Sanz A, Muñoz-Viana R, Sabín-Muñoz J, Moreno-Torres I, Brea-Álvarez B, Rodríguez-De la Fuente O, et al. Response to fingolimod in multiple sclerosis patients is associated with a differential transcriptomic regulation. Int J Mol Sci. (2024) 25:1372. doi: 10.3390/ijms25031372
26. Vasileiadis GK, Dardiotis E, Mavropoulos A, Tsouris Z, Tsimourtou V, Bogdanos DP, et al. Regulatory B and T lymphocytes in multiple sclerosis: friends or foes? Autoimmun Highlights. (2018) 9:9. doi: 10.1007/s13317-018-0109-x
27. Mimpen M, Damoiseaux J, van Doorn W, Rolf L, Muris A-H, Hupperts R, et al. Proportions of circulating transitional B cells associate with mri activity in interferon beta-treated multiple sclerosis patients. J Neuroimmunol. (2021) 358:577664. doi: 10.1016/j.jneuroim.2021.577664
28. Perriguey M, Maarouf A, Stellmann J-P, Rico A, Boutiere C, Demortiere S, et al. Hypogammaglobulinemia and infections in patients with multiple sclerosis treated with rituximab. Neurol Neuroimmunol Neuroinflamm. (2022) 9:e1115. doi: 10.1212/nxi.0000000000001115
29. Achiron A, Mandel M, Dreyer-Alster S, Harari G, Magalashvili D, Sonis P, et al. Humoral immune response to covid-19 mrna vaccine in patients with multiple sclerosis treated with high-efficacy disease-modifying therapies. Ther Adv Neurol Disord. (2021) 14:17562864211012835. doi: 10.1177/17562864211012835
30. Gold R, Fätkenheuer G, Hartung H-P, Kleinschnitz C, Marks R, Maschke M, et al. Vaccination in multiple sclerosis patients treated with highly effective disease-modifying drugs: an overview with consideration of cladribine tablts. Ther Adv Neurol Disord. (2021) 14:17562864211019598. doi: 10.1177/17562864211019598
31. van Oosten BW, Lai M, Hodgkinson S, Barkhof F, Miller DH, Moseley IF, et al. Treatment of multiple sclerosis with the monoclonal anti-cd4 antibody cm-T412: results of a randomized, double-blind, placebo-controlled, mr-monitored phase ii trial. Neurology. (1997) 49:351–7. doi: 10.1212/wnl.49.2.351
32. Gianchecchi E, Delfino DV, Fierabracci A. Natural killer cells: potential biomarkers and therapeutic target in autoimmune diseases. Front Immunol. (2021) 12:616853. doi: 10.3389/fimmu.2021.616853
33. Bielekova B. Daclizumab therapy for multiple sclerosis. Cold Spring Harbor Perspect Med. (2019) 9:a034470. doi: 10.1101/cshperspect.a034470
34. Jiang W, Chai NR, Maric D, Bielekova B. nexpected role for granzyme K in cd56bright nk cell-mediated immunoregulation of multiple sclerosis. J Immunol (Baltimore Md: 1950). (2011) 187:781–90. doi: 10.4049/jimmunol.1100789
35. Mushtaq MU, Shahzad M, Shah AY, Chaudhary SG, Zafar MU, Anwar I, et al. Impact of natural killer cells on outcomes after allogeneic hematopoietic stem cell transplantation: A systematic review and meta-analysis. Front Immunol. (2022) 13:1005031. doi: 10.3389/fimmu.2022.1005031
36. Caruana P, Lemmert K, Ribbons K, Lea R, Lechner-Scott J. Natural killer cell subpopulations are associated with mri activity in a relapsing-remitting multiple sclerosis patient cohort from Australia. Mult Scler J. (2017) 23:1479–87. doi: 10.1177/1352458516679267
37. Bittner S, Oh J, Havrdová EK, Tintoré M, Zipp F. The potential of serum neurofilament as biomarker for multiple sclerosis. Brain. (2021) 144:2954–63. doi: 10.1093/brain/awab241
38. Paolicelli D, Ruggieri M, Manni A, Gargano CD, Carleo G, Palazzo C, et al. Real-life experience of the effects of cladribine tablts on Lymphocyte subsets and serum neurofilament light chain levels in relapsing multiple sclerosis patients. Brain Sci. (2022) 12:1595. doi: 10.3390/brainsci12121595
39. Seiberl M, Feige J, Hilpold P, Hitzl W, Machegger L, Buchmann A, et al. Serum neurofilament light chain as biomarker for cladribine-treated multiple sclerosis patients in a real-world setting. Int J Mol Sci. (2023) 24:4067. doi: 10.3390/ijms24044067
40. De Stefano N, Achiron A, Barkhof F, Chan A, Derfuss T, Hodgkinson S, et al. Early onset of action and sustained efficacy of mri outcomes during cladribine tablts treatment in highly active relapsing multiple sclerosis: results of the 2-year magnify-ms study (P6-3.018). Neurology. (2023) 100:3042. doi: 10.1212/wnl.0000000000202977
41. Garcia A, Dugast E, Shah S, Morille J, Lebrun-Frenay C, Thouvenot E, et al. Immune profiling reveals the T-cell effect of ocrelizumab in early relapsing-remitting multiple sclerosis. Neurol Neuroimmunol Neuroinflamm. (2023) 10:e200091. doi: 10.1212/nxi.0000000000200091
42. Sehr T, Akgün K, Haase R, Ziemssen T. Fingolimod Leads to Immediate Immunological Changes within 6 H after First Administration. Front Neurol. (2020) 11:391. doi: 10.3389/fneur.2020.00391
43. Ciolac D, Luessi F, Gonzalez-Escamilla G, Koirala N, Riedel C, Fleischer V, et al. Selective brain network and cellular responses upon dimethyl fumarate immunomodulation in multiple sclerosis. Front Immunol. (2019) 10:1779. doi: 10.3389/fimmu.2019.01779
44. Wiendl H, Carraro M, Comi G, Izquierdo G, Kim HJ, Sharrack B, et al. Lymphocyte pharmacodynamics are not associated with autoimmunity or efficacy after alemtuzumab. Neurol Neuroimmunol Neuroinflamm. (2020) 7:e635. doi: 10.1212/nxi.0000000000000635
Keywords: multiple sclerosis, cladribine tablets, biomarkers, transcriptomics, immunophenotyping, immune reconstitution therapy
Citation: Wiendl H, Barkhof F, Montalban X, Achiron A, Derfuss T, Chan A, Hodgkinson S, Prat A, Leocani L, Schmierer K, Sellebjerg F, Vermersch P, Jin H, Chudecka A, Kloetgen A, Lin D, Gardner L and De Stefano N (2025) Blood biomarker dynamics in people with relapsing multiple sclerosis treated with cladribine tablets: results of the 2-year MAGNIFY-MS study. Front. Immunol. 16:1512189. doi: 10.3389/fimmu.2025.1512189
Received: 16 October 2024; Accepted: 08 January 2025;
Published: 03 February 2025.
Edited by:
Klaus Berek, Innsbruck Medical University, AustriaReviewed by:
Franz Felix Konen, Hannover Medical School, GermanyCopyright © 2025 Wiendl, Barkhof, Montalban, Achiron, Derfuss, Chan, Hodgkinson, Prat, Leocani, Schmierer, Sellebjerg, Vermersch, Jin, Chudecka, Kloetgen, Lin, Gardner and De Stefano. This is an open-access article distributed under the terms of the Creative Commons Attribution License (CC BY). The use, distribution or reproduction in other forums is permitted, provided the original author(s) and the copyright owner(s) are credited and that the original publication in this journal is cited, in accordance with accepted academic practice. No use, distribution or reproduction is permitted which does not comply with these terms.
*Correspondence: Heinz Wiendl, aGVpbnoud2llbmRsQHVuaWtsaW5pay1mcmVpYnVyZy5kZQ==
†Present address: Heinz Wiendl, Department of Neurology and Neurophysiology, Freiburg University, Freiburg, Germany
Disclaimer: All claims expressed in this article are solely those of the authors and do not necessarily represent those of their affiliated organizations, or those of the publisher, the editors and the reviewers. Any product that may be evaluated in this article or claim that may be made by its manufacturer is not guaranteed or endorsed by the publisher.
Research integrity at Frontiers
Learn more about the work of our research integrity team to safeguard the quality of each article we publish.