 Mireille Ngokingha Tchouto1,2,3
 Christian H. Bucher1,4
 Ann-Kathrin Mess1,3Simon Haas5,6
 Katharina Schmidt-Bleek1,4
 Georg N. Duda1,4Dieter Beule2,7
 Miha Milek2*
- 1Julius Wolff Institute of Biomechanics and Musculoskeletal Regeneration, Berlin Institute of Health at Charité – Universitätsmedizin Berlin, Berlin, Germany
- 2Core Unit Bioinformatics, Berlin Institute of Health at Charité–Universitätsmedizin Berlin, Berlin, Germany
- 3Berlin-Brandenburg School for Regenerative Therapies, Charité – Universitätsmedizin Berlin, Freie Universität Berlin and Humboldt-Universität zu Berlin, Berlin, Germany
- 4Berlin Institute of Health (BIH) Center for Regenerative Therapies, Berlin Institute of Health at Charité - Universitätsmedizin Berlin, Berlin, Germany
- 5Systems Hematology, Stem Cells & Precision Medicine, Berlin Institute of Health at Charité-Universitätsmedizin Berlin, Berlin, Germany
- 6Berlin Institute for Medical Systems Biology, Max Delbrück Center for Molecular Medicine in the Helmholtz Association, Berlin, Germany
- 7Max Delbrück Center for Molecular Medicine in the Helmholtz Association (MDC), Berlin, Germany
Introduction: Alterations of the adaptive immune system have been shown to impact bone healing and may result in impaired healing in some patients. Apart from T cells, B cells are the key drivers of adaptive immunity. Therefore, their role in age-associated impairments of bone healing might be essential to understand delays during the healing process. B cells are essential for bone formation, and their dysfunction has been associated with aging or autoimmune diseases. But whether age-associated changes in B cell phenotypes are involved in bone regeneration is unknown.
Methods: Here, we aimed to characterize the role of immune aging in B cell phenotypes during the early inflammatory phase of bone healing. By comparing non-immune experienced with young and immune experienced mice we aimed to analyze the effect of gained immune experience on B cells. Our single cell proteo-genomics analysis quantified thousands of transcriptomes of cells that were isolated from post osteotomy hematoma and the proximal and distal bone marrow cavities, and enabled us to evaluate cell proportion, differential gene expression and cell trajectories.
Results: While the B cell proportion in young and non-immune experienced animals did not significantly change from 2 to 5 days post osteotomy in the hematoma, we found a significant decrease of the B cell proportion in the immune experienced mice, which was accompanied by the decreased expression of B cell specific genes, suggesting a specific response in immune experienced animals. Furthermore, we detected the most extensive B cell differentiation block in immune-experienced mice compared to non-immune experienced and young animals, predominantly in the transition from immature to mature B cells.
Discussion: Our results suggest that the pronounced impairment of B cell production found in immune experienced animals plays an important role in the initial phase leading to delayed bone healing. Therefore, novel therapeutic approaches may be able target the B cell differentiation defect to retain B cell functionality even in the immune experienced setting, which is prone to delayed healing.
Introduction
Bone healing following an injury or surgery is a physiological process that in almost all cases leads to full reconstitution and tissue regeneration (1, 2). Almost all individuals will at some point in their life undergo such a cascade of full bone regeneration but in an estimated number of 10-20% of cases, healing is delayed or absent (1, 3). Successful healing requires an orchestrated sequence of cellular and molecular events that initially include a pro- and anti-inflammatory phase (1). After fracture, a hematoma is formed from coagulating blood, bone debris and invading cells from its surrounding tissue (4). Cells that function in the innate and adaptive immune response contribute to the bone healing process. Apart from macrophages, neutrophils and cytotoxic T lymphocytes contribute to the pro-inflammatory phase by releasing cytokines to initiate an inflammatory state (4). In elderly patients, this phase can be prolonged, which may result in delayed or impaired bone healing (5–8).
Previous work has shown that delayed healing is associated with advanced immune experience (9). Furthermore, in elderly patients, cells that characterize an increased adaptive immune response have been shown to impact bone healing (10). Several cellular phenotypes have been identified that alter the healing outcome in the elderly, eventually resulting in delayed healing (11, 12). In aged individuals, the differentiation of hematopoietic stem cells (HSC) towards myeloid cells was found to be promoted and resulted in lower numbers of B and T lymphocytes (13–15). In addition, in humans the proportion of naive T cells decreased during aging (16, 17), whereas the proportion of memory T cells increased (18–20), and was correlated with prolonged healing (2, 9).
However, B cells and their phenotypes – also a key element of adaptive immunity – have surprisingly been less researched, even though they may be highly important during the inflammatory phase of bone healing (21, 22). In addition, B cell dysfunction has been associated with aging or autoimmune diseases of the bone (23–25). Atypical B cells are formed in B cell compartments, and harbor distinct phenotypes such as altered gene expression profiles, proliferation, and variation in B cell receptor repertoires (23). Since dysfunctions of B cells are common in the aging population, alterations of B cell phenotypes might be prominent determinants of impaired, delayed or pro-longed bone healing by affecting the pro-inflammatory phase and/or later stages post fracture.
Investigation of the role of B cells in bone healing in young mice by Könnecke et al. (26) and Zhang et al. (27) revealed that the proportion of B cells decreased during the inflammatory phase but was restored 14 days after fracture. In addition, immunomodulatory properties of B cells have been recently investigated in the context of bone healing in human patients (21, 22). The results of these studies suggest that specific B cell functions are required for favorable bone healing outcome but provide little insight into the effect of altered B cell phenotypes on bone healing in elderly individuals. It remains unclear what effect chronological aging has on the B cell phenotype and how immune-aging affects B cells and their function during bone healing (22).
Here, we investigated the cellular and molecular characteristics of B cells during early bone healing in a mouse osteotomy model (28). We aimed at differentiating the effect of chronological aging from gained immune experience at the early time points during bone healing and therefore compared three female mouse groups which corresponded to differential bone healing outcomes. We observed the strongest alteration of the B cell phenotype in the hematoma of immune experienced mice from 2 to 5 days post osteotomy, particularly in the impairment of immature to mature B cell differentiation, which was accompanied by the decreased expression of several B cell specific genes, and could be a result of increased expression of interferon associated genes in monocytes and decreased expression of interferon receptors in B cells. While non-immune experienced animals showed a smaller B cell differentiation block, the most pronounced impairment was detected in immune experienced animals. Our work therefore suggests that the altered B cell phenotype may contribute to delayed healing in elderly patients.
Materials and methods
Animal experiments
C57BL/6N female mice were purchased from Charles River Laboratories at an age of 6 weeks. Different mouse age at the time of osteotomy and different housing conditions enabled the comparison of 3 types of mice: 12 weeks old, maintained under non-specific pathogen free (SPF) conditions, 26 weeks old under SPF conditions and 26 weeks old under non-SPF conditions. For this purpose, mice were housed under SPF conditions (non-experienced immune status, NE), meaning that individually ventilated cages were placed behind a barrier (change of clothing, masks and gloves), while non-SPF mice (experienced immune status, IE) were housed in cages with grid lid in a room that was freely accessible. All mice were monitored according to FELASA guidelines and were healthy. Non-SPF mice encountered environmental pathogens inducing an immunological memory, changing their naïve T cell pool slowly and individually towards higher percentages of effector memory T cells. This experimental design has been published previously for 3 and 12 months old animals (10). To confirm that the differences between IE and NE animals that we had observed in 3 and 12-months-old mice could also be confirmed in the 6-months-old mice, radiographics of the femurs were taken at 21 days after osteotomy (exemplary images displayed in Figure 1). In the young immune-naïve animals (Figure 1. left; young), complete bridging of the osteotomy gap was seen neatly aligned with the cortical bone and bone marrow cavity already re-opened, indicating callus remodeling. In the chronologically older animals (Figure 1 middle; NE) bridging of callus was only seen on one side while not yet bridged on the cisco cortex with no signs of remodeling of the marrow cavity present. In the age-matched immune experienced group (Figure 1, right; IE) the callus was not filling the osteotomy gap, the cortical bone ends were not bridged, showed thinner ends with signs of bone resorption. This resembled the capping of the marrow channel seen in delayed or non-union cases. The female mouse models used are illustrated by the representative images, each which match well our earlier described female mouse model data for 3 and 12 months old animals (PMID: 36028760). Overall, female mice show a retarded healing compared to their male counterparts and thus represent a more valid animal model system in regard to bone healing in human (PMID: 34434120, 20652815).
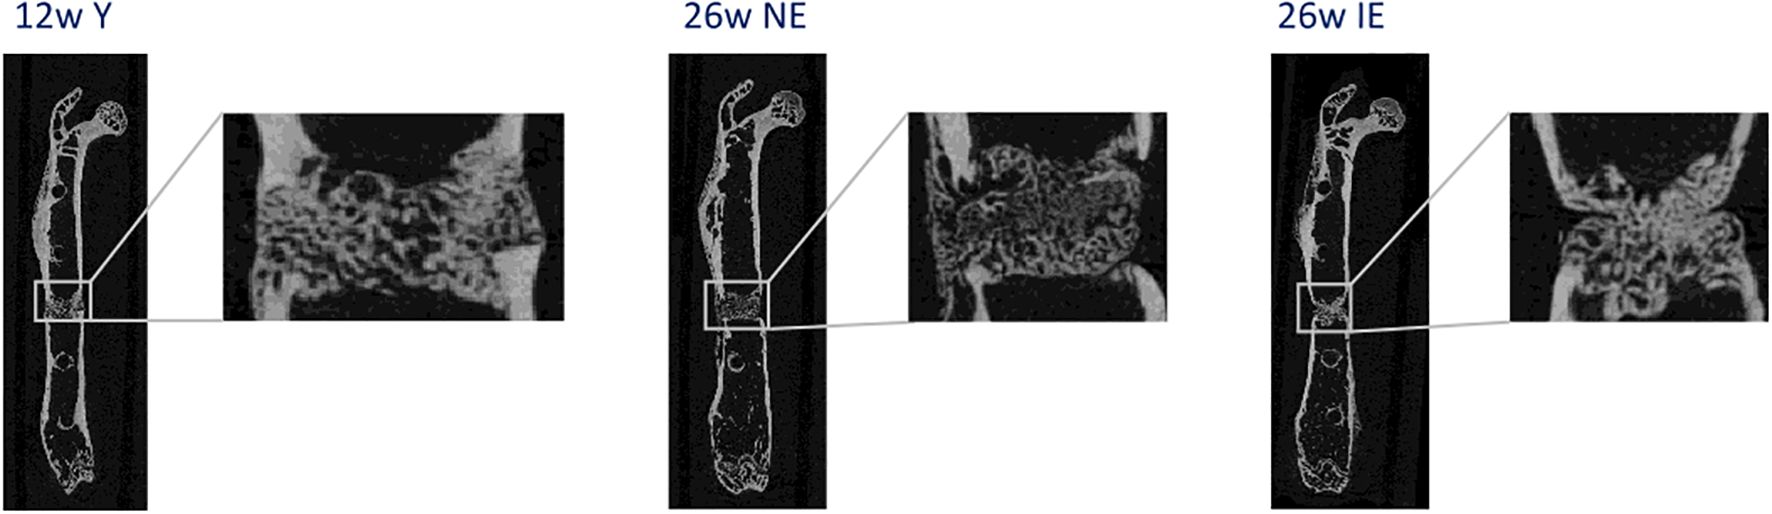
Figure 1. Representative radiographs of the healing process 21 days after osteotomy for young (left), NE (middle) and IE (right) animals stabilized with an external fixation device.
Bone regeneration was studied using the above-mentioned 3 mouse types following osteotomy of the left femur and fixation such that fast and effective healing would be enabled (external fixation by a rigid MouseExFix, RISystem, Davos, Switzerland). Briefly, mice were anesthetized with a mixture of isoflurane and oxygen. After initial shaving of the thigh the fixation was positioned with two proximal and distal pins. Thereafter, a 0.7 mm osteotomy was introduced between the middle pins by using a Gigli wire (RISystem, Davos, Switzerland). The first line analgesia was done with Bubrenorphine pre surgery, antibiotics with clindamycine. Tramadol was added post-surgery to the drinking water for 3 days.
Mouse osteotomy
Animals were intraperitoneally injected with a mixture of medetomidine and ketamine to induce deep anesthesia. Thereafter, animals were euthanized by cervical dislocation. The osteotomized femur was extracted and stored for transportation in ice cold phosphate-buffered saline (PBS). The fracture gap and proximal and distal regions from the osteotomy were separated and single cell suspensions were taken by flushing the bones and filtering the probes through cell culture meshes for each of these regions separately. For sorting, cells were stained with fluorescently labeled antibodies, oligonucleotide labeled hashtag antibodies and oligonucleotide labeled surface protein antibodies (TotalSeq, BioLegend, San Diego, USA) before pooling the sample for three animals each. An enrichment sort for low abundant cells was performed by decreasing highly abundant cells (staining: Ly6G, CD45R/B220, CD11c, Live/Dead, Ter119, CD41) before cell encapsulation according the 10X Genomics protocol. With 2 timepoints post osteotomy (5 and 2 days) and 3 regions for each bone (hematoma, proximal and distal), this experimental setup consisted of 18 experimental groups with 3 mice per group, i.e. 54 mice in total.
Library preparation and high-throughput sequencing
Chromium Next GEM Single Cell 3’ Reagent Kits v3.1 (Dual Index) with Feature Barcode technology for Cell Surface Protein (CG000317 Rev C) was used according to the manufacturer’s protocol to construct the libraries. Libraries were sequenced on the Illumina NovaSeq 6000 sequencer. Demultiplexing was carried out with bcl2fastq (v2.20, Illumina) with default parameters.
Single cell RNA-seq data processing
Cellranger count v7.1.0 (10X Genomics) was used to process the raw sequencing reads, which included alignment to the mouse genome (mm10) and generation of count matrices with mRNA and ADT read counts. The count data was then processed according to standard Seurat (29) (v4.1.1) processing. Demultiplexing was carried out within Seurat using the HTODemux function. This allowed us to remove doublets. In total, 14810 (58.55%) of all droplets were single cells with a median of 2100 expressed mRNAs. Next, principal component analysis (PCA) was carried out by using regression of the difference between the G2M and S cell cycle gene scores. We completed the pre-processing step of the RNA assay by filtering cells based on the number of mRNAs per cell (cells with >6500 mRNAs/genes were removed), the percentages of mitochondrial (cells with <10% were removed) and ribosomal (cells with <25%) genes. This resulted in the recovery of 87.19% (n = 12913) cells. In addition, the protein expression (ADT) data was normalized using Seurat’s centered log ratio method. Moreover, the individual samples were integrated using FindAnchors and IntegrateData functions to minimize potential batch effects. We investigated the effect of different covariates (sample, timepoint, batch, group) on the results of the data integration. We found that data integration, where we compensated for group-based batch effects, gave the most reproducible result in terms of cell cluster composition. We re-ran the PCA on the significantly variable genes, and the top 20 principal components were selected as input for both UMAP embedding and clustering. For clustering, we used the FindClusters function implemented in the Seurat package, specifying the resolution of 1.0.
Cell annotation
Seurat’s FindAllMarkers function was used to identify the differentially expressed genes in each cluster compared with all other clusters. To annotate the clusters, we combined Seurat’s MapQuery function using the Tabula Muris (30) droplet dataset as a reference. In addition, we used manual annotation by applying key marker genes for specific cell types that were based on previously published studies (31, 32). Once the cell types were annotated, we calculated the cell type proportions in each sample.
Differential expression analysis
Due to a low number of cells detected, we summed the gene-wise read count for each sample over all cells and performed differential pseudobulk expression analysis with DESeq2 (33). The proximal, hematoma and distal bone marrow samples from one animal were considered as paired samples. This was considered in the DESeq2 model design by including the mice ID information (i.e. ~mouseID + group). Pairwise comparisons between different groups were extracted from the same results object, such that total variance from all samples in the experiment was considered.
To perform gene set enrichment analysis on the DESeq2 results, we used tmod (34), whereby a gene list sorted by DESeq2 P value was input into tmodCERNOtest function. As a threshold for tmod results, which outputs adjusted P value, as well as effect size (AUC), we considered enriched pathways to have an AUC>=0.65, and an adjusted P value < 0.05. To define genes with increased or decreased expression we used a cutoff of adjusted P value <0.05 and absolute log2-transformed fold change of >0.5. The immune related gene sets for pathway enrichment, were provided by the tmod package and are publicly available (35, 36).
We used tmod’s ggEvidencePlot function to visualize the genes in specific B cell pathways. We then used this list of genes as input to the Seurat AddModuleScore function to estimate the cell-wise score for this gene set and to determine, in which cell types they were mainly expressed. To exclude potential effects of different sized groups for comparison, we randomly downsampled our results to 500 cells for each group. We then visualized the difference between the IE hematoma at 2 days and 5 days with a boxplot and performed a Wilcoxon rank sum test to assess significance at *p < 0.05, **p < 0.01 and ****p< 0.0001.
Pseudotime analysis
For trajectory inference, we used Slingshot (37) and Monocle3 (38). This analysis was carried out only on B cells (pre/pro-B, immature and mature) and the hematopoietic precursor cells (HPCs), which were sub-clustered using the Seurat FindClusters function. Due to the low number of plasma cells detected per sample and because of vast differences in their transcriptional profile in comparison with other B cells, we did not include them in the trajectory analysis. After clustering, we manually re-annotated the new clusters of HPCs and B cells using marker gene expression information. Next, we converted the Seurat object into the SingleCellExperiment (39) (sce) object and provided it as input to Slingshot. For the pseudotime trajectory estimation, we used HPCs as the starting cluster.
Wilcoxon rank sum test was used to compare cell-wise pseudotime values between mice groups with significance at *p < 0.05, **p < 0.01 and ****p< 0.0001. For trajectory inference analysis using Monocle3, we provided the same Seurat object as for Slingshot. The data were then transformed into a monocle main class “cell_data_set” and, using the learn_graph function, we were able to fit a main graph to each partition. The cells were then ordered according to pseudotime by manually selecting the nodes in the graph that indicate the start of the trajectory. Here, we selected the nodes corresponding to the hematopoietic precursor cells as our roots.
Results
Single cell analysis of murine B cells post osteotomy
To better understand the role of B cells in bone healing, we assayed immune cells in the bone marrow (BM) osteotomy microenvironment at the single cell level. Since bone healing outcome is known to be negatively affected by ageing, we used a previously published mouse model (28) to compare 12 and 26 weeks old mice. In addition, to differentiate the effect of chronological ageing from gained immune experience, we compared female animals maintained either in the specific pathogen free (SPF) environment (non-immune experienced, NE), or the non-SPF environment (immune experienced, IE). Due to known differences in the healing progression within different regions of the fracture microenvironment, we studied differences in their immune cell composition by dissecting 3 different anatomical regions from each bone (hematoma, proximal and distal). To gain insight into the early cellular dynamics during the inflammatory phase of bone regeneration, mice were sacrificed 2 and 5 days post osteotomy. An overview of the experimental groups, which were defined by mouse type, compartment, and time points post osteotomy are given in Supplementary Table S1.
To overcome common technical biases, the single cell experiment was carried out using hash-tag multiplexing (Figure 2A). After cell dissociation, enrichment for white blood cells, labeling, cell encapsulation and library preparation were performed, followed by the multi-modal single cell assay, which included transcriptome quantification and surface protein detection (Figure 2A) (40). We achieved high recovery of cells after the demultiplexing procedure, which in addition allowed us to bioinformatically remove doublets (Supplementary Figure S1C). After quality control filtering, standard single cell data processing (see Methods for details) led to the quantification of 12913 single cell transcriptomes. Clearly separated cell clusters (Supplementary Figure S1A) were obtained and showed expression of specific gene expression markers (Supplementary Figure S1B). A combination of manual annotation and projection of query cells onto a murine BM reference (30) (Supplementary Figure S1D) resulted in the identification of 12 cell types (Figure 2B), including expected major immune cell types such as monocytes, neutrophils, T and B cells. Expected mRNAs were expressed in the detected cell types (Figure 2C), such as Cd3g for T cells, Cd79a, Ebf1 and Cd19 for B cells, as well as Cd34, Kit and Flt3 for hematopoietic precursor cells (HPCs).
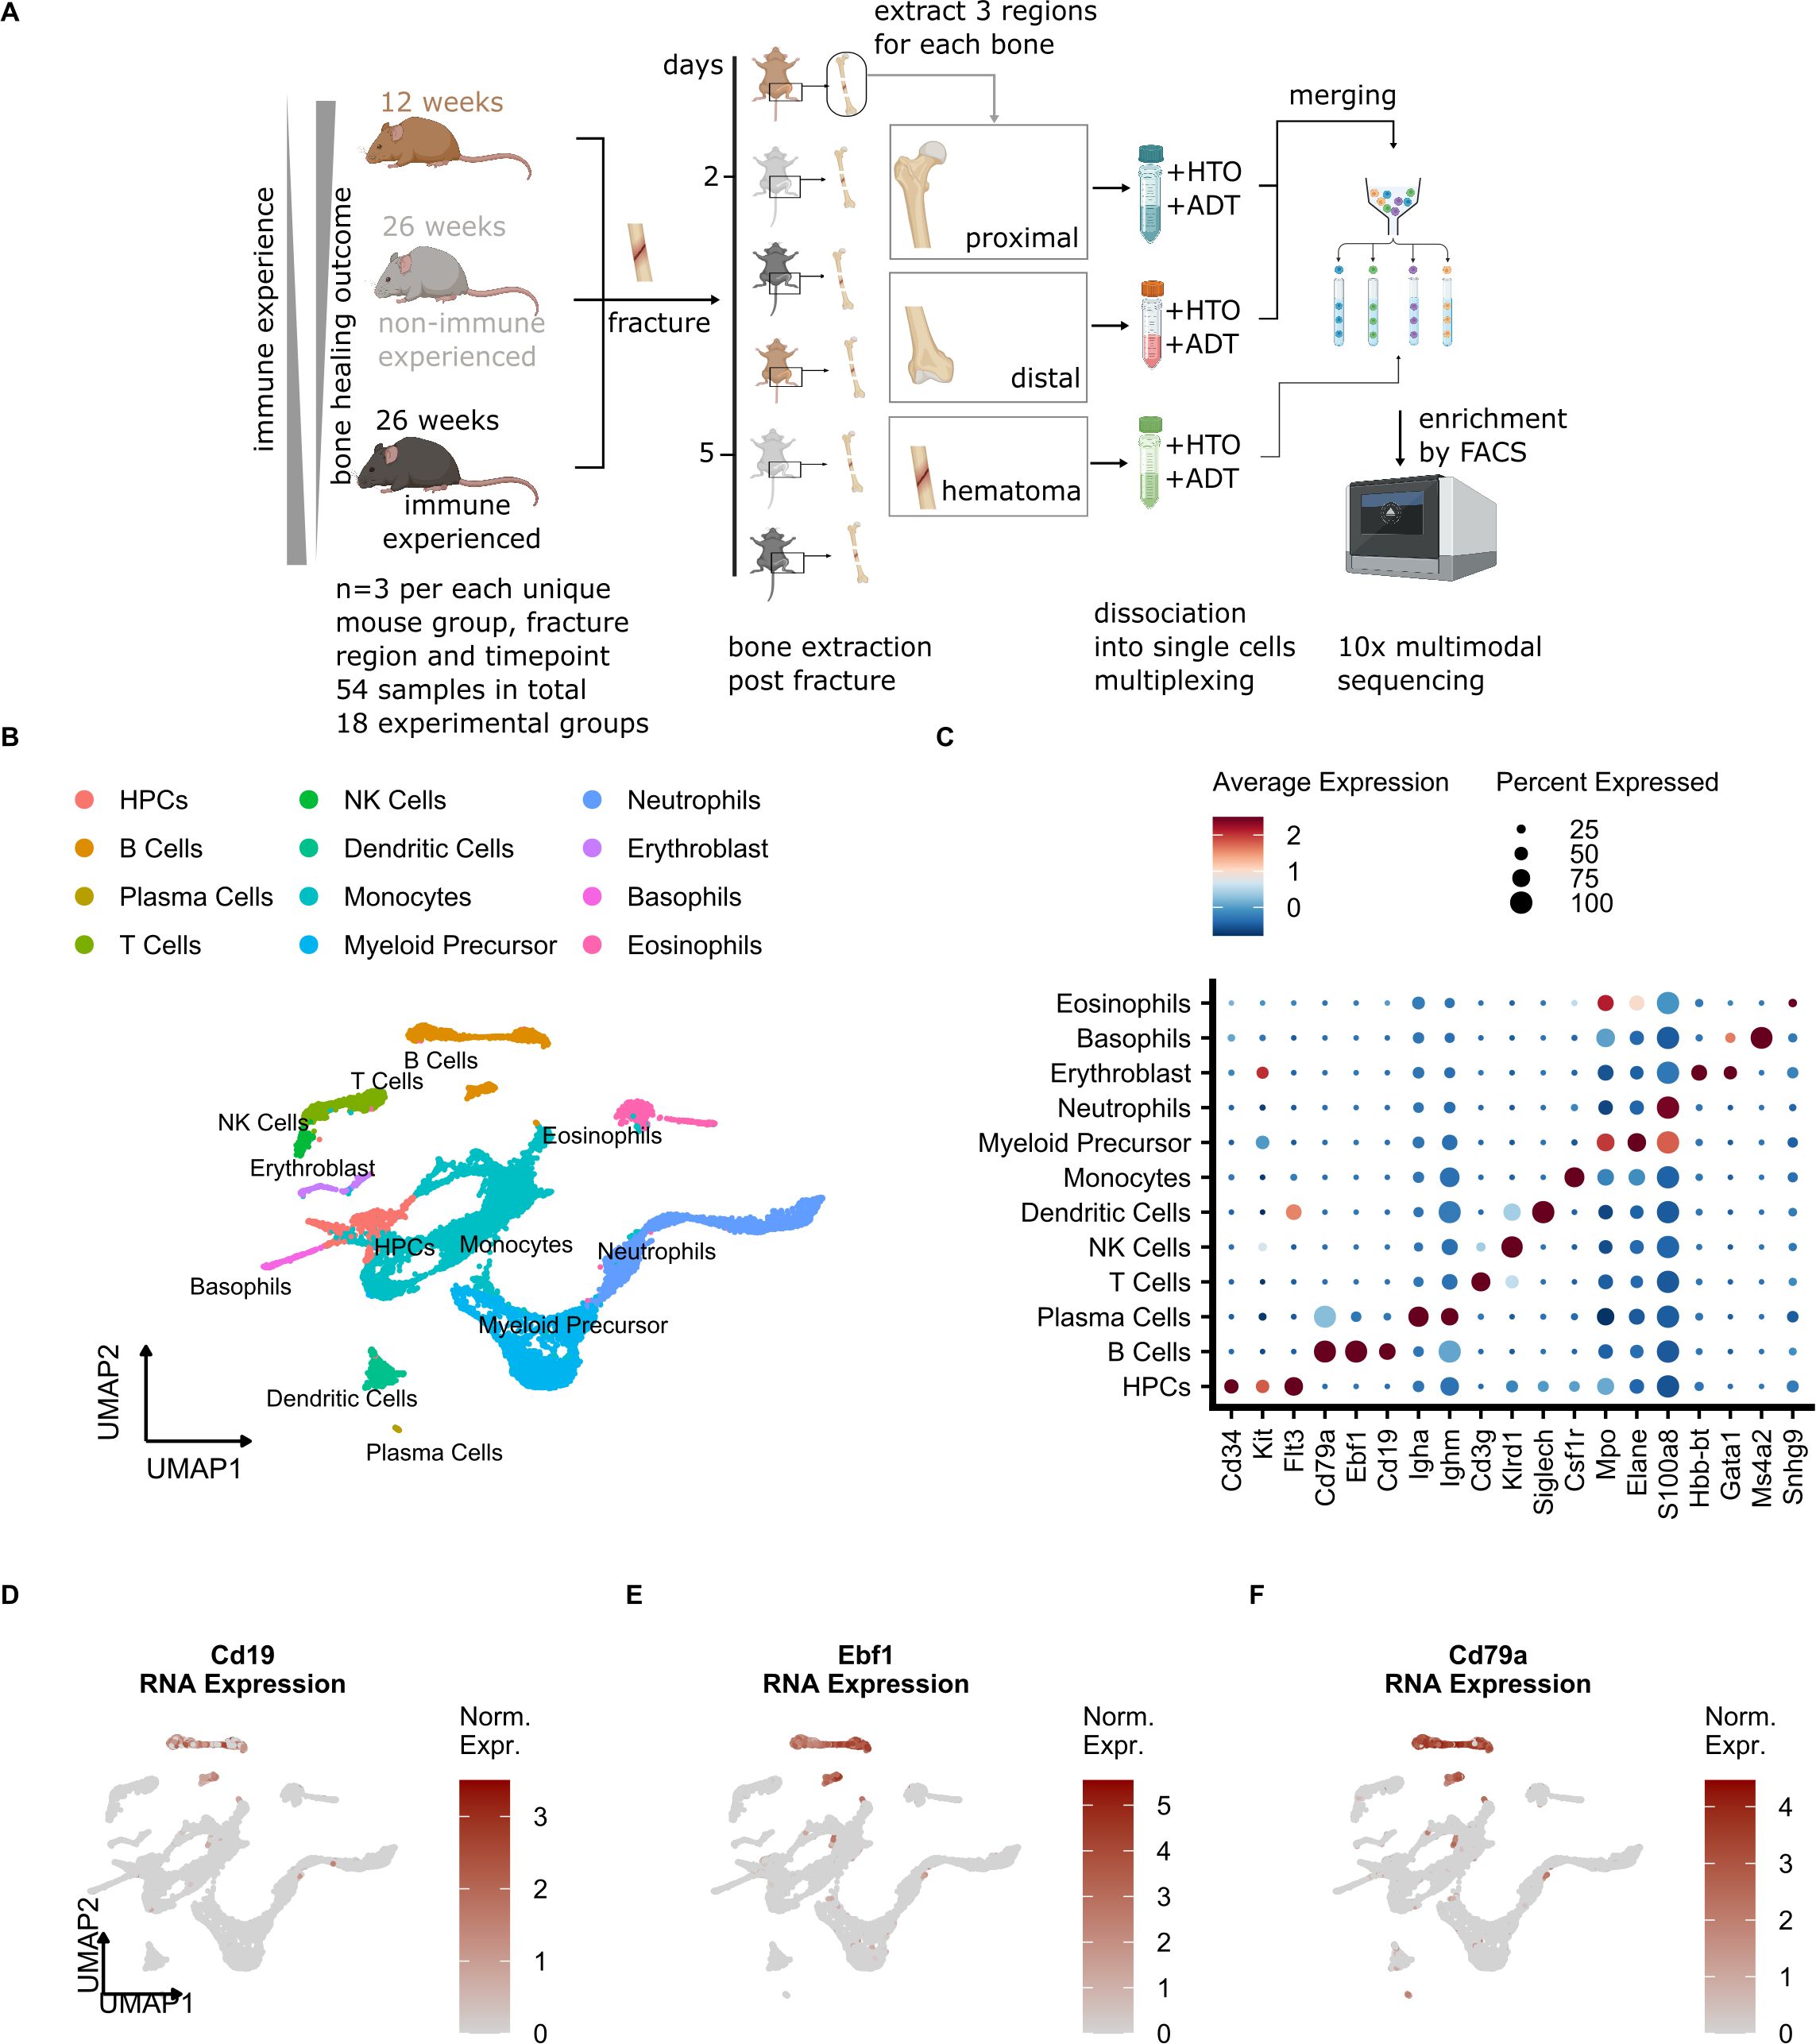
Figure 2. Single cell analysis of the mouse osteotomy microenvironment detects common immune cell types. (A) Schematic of the experimental setup. 12-week (young), 26-week specific-pathogen-free (SPF, non-immune experienced, NE) and 26-week non-SPF (immune experienced,IE) mice undergoing osteotomy (n=3 per group). After 2 and 5 days, the mice were sacrificed and the proximal, hematoma and distal bone marrow were harvested from each bone. After washing of the bone sections, the individual cells were dissociated, and labeling of cells with oligonucleotide-tagged antibodies for cell hashing (HTO) and detection of other cell-surface proteins (ADT, Cd19, Cd4, Cd8a, Cd3, Cd335) was performed. After pooling, cells were sorted by a multi-layer FACS approach, followed by single-cell droplet encapsulation with microbeads, library preparation and next-generation sequencing. (B) UMAP embedding of cell types detected in this study. Annotated cell clusters are shown in different colors. (C) Dot plot of average normalized mRNA expression values and percentage of all cells that express a given cell type marker. (D-F) UMAP embedding of cells detected in this study showing the cell-wise normalized expression of B cell marker genes.
To evaluate total bone marrow composition, we next calculated cell type proportions in NE and IE mice and compared them with other published bone marrow datasets (10, 27, 30, 31). We found that the highest cell proportions in our dataset corresponded to granulocytes and monocytes, followed by B and T cells, which was confirmed by the previously published results (Supplementary Figure S1E). According to the mRNA expression of B cell marker genes (Figures 2D-F, Supplementary Figure S1B), we were able to detect 3 clusters (13, 15 and 27), which according to the marker gene expression (Fcer2a, Cd38, Vpreb1) corresponded to the mature, immature and pre/proB differentiation states, respectively (Supplementary Figure S1B). Our analysis also detected a low number of plasma cells, which are commonly underrepresented in BM scRNA-seq (41) and not located in neighboring clusters with respect to other B cell subtypes (42) because their transcriptional profiles are vastly different. Therefore, we excluded plasma cells from our downstream B cell proportion and trajectory inference analysis (see Methods for details). In summary, the major BM cell types including B cell subtypes were successfully detected in our model system.
B cell proportion decrease in the hematoma of IE but not in NE and young mice
We next evaluated the differences in B cell proportion between the mouse groups. We thus calculated cell proportions as percentage of total cells detected in each sample (Supplementary Table S2). No differences in B cell proportions were observed between different compartments (hematoma vs. proximal vs. distal) 5 days post osteotomy (Supplementary Figures S2A, B). However, when comparing B cell proportions from 2 to 5 days post osteotomy in the same mouse type and within the same compartment, we observed a significant decrease in the proportion of B cells in the hematoma of IE mice (Figure 3A). In addition, a less extensive decrease occurred proximal to the osteotomy (Figure 3B). We did not observe any significant change in the B cells proportion in the area distal to the osteotomy (Figure 3C). The decrease in B cell proportion in the hematoma and proximal bone marrow was only detected in the IE mice but not in the NE or young mice. We also inspected the absolute number of B cells in these groups of mice, which showed consistently lower absolute numbers 5 days post osteotomy in the hematoma but not in the tissue proximal to the osteotomy (Figure 3D). The absolute B cell decrease was also apparent from the low-dimensional visualization of cells in the hematoma of IE animals 5 days post osteotomy (Figures 3E, F).
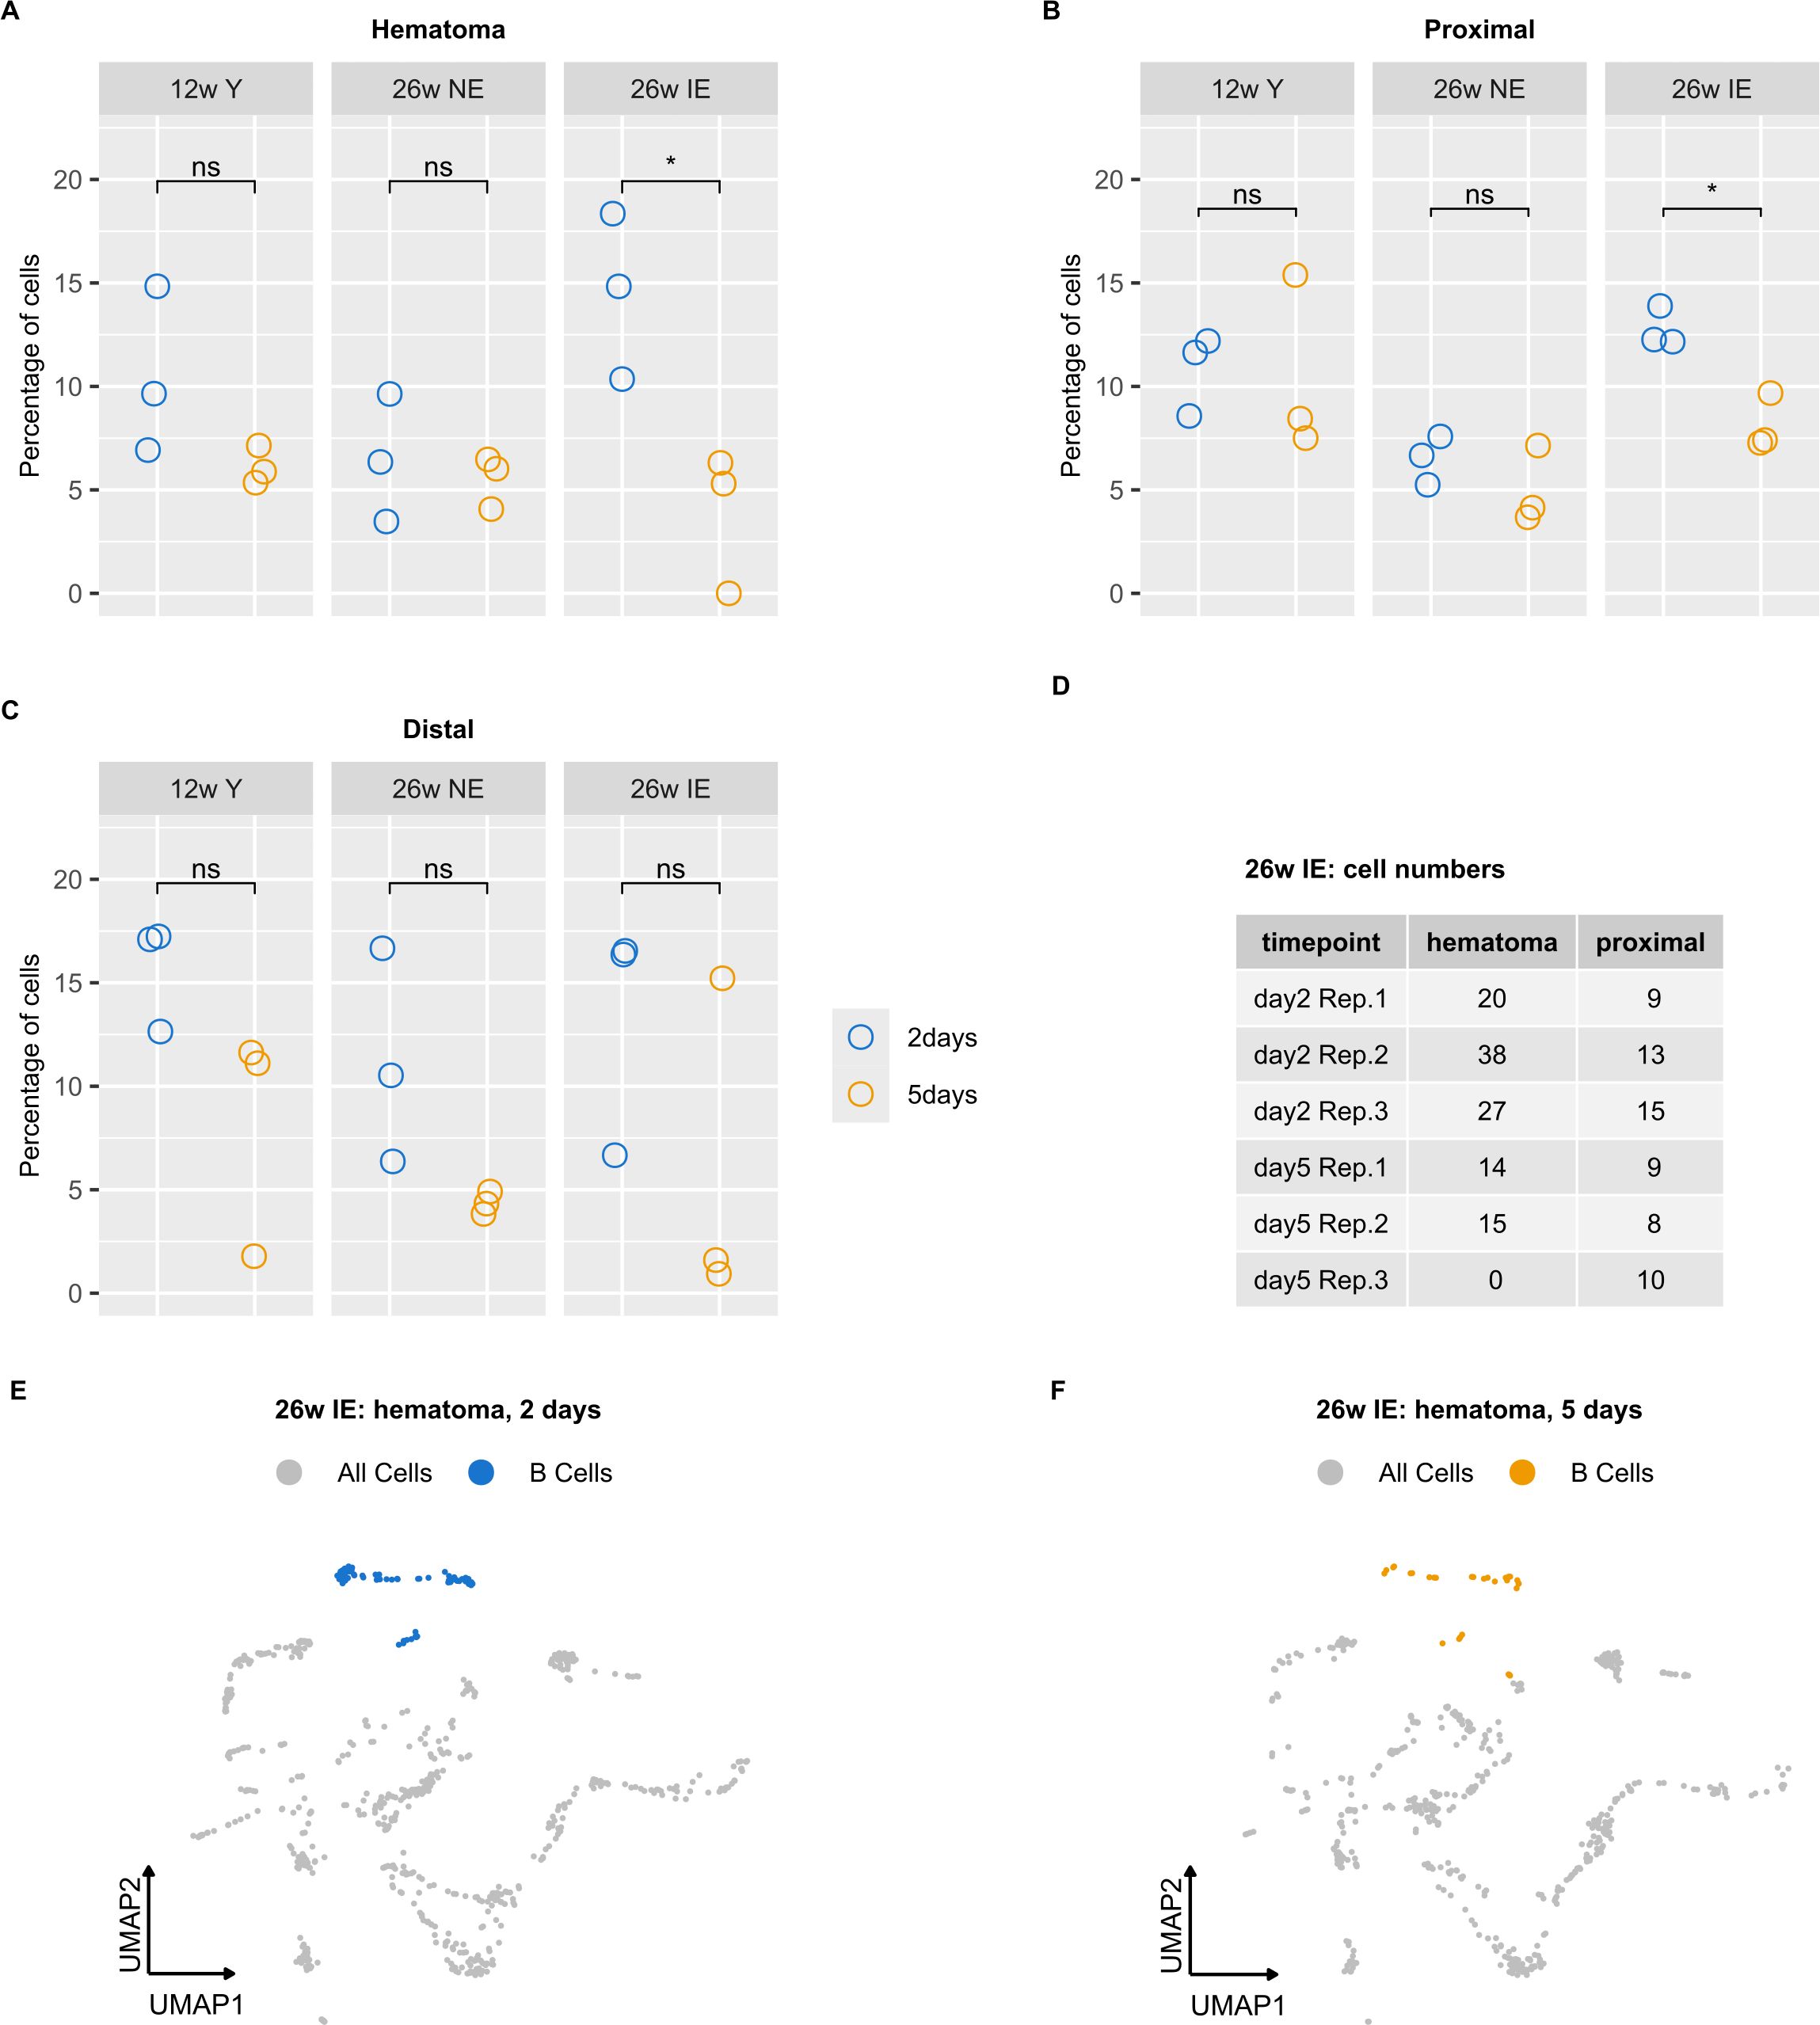
Figure 3. B cell proportion analysis in different mouse groups reveals a decrease in B cells detected in IE animals. (A-C) Percentages of B cells were calculated for each sample, i.e. 2 (blue) or 5 days post osteotomy (orange) with respect to the different bone regions (hematoma, proximal and distal) and the different mouse groups (young, NE, IE). Significance was evaluated using unpaired two-sided Student’s t-test and differences are indicated with an asterisk (*p < 0.05). (D) Absolute B cell number in the hematoma of IE mice for each animal on days 2 and 5. (E, F) UMAP embedding of cells detected in the hematoma of IE mice, with B cells highlighted in blue (day 2) and orange (day 5).
In summary, the specific decrease in B cell proportion detected in the IE animals could result both from the lower absolute number of B cells, or from an increase in cell numbers of other cell types. These results indicated either the impairment of B cell maturation and/or increased B cell death specific for the hematoma and, to a smaller extent in the proximal tissue of IE mice.
Decreased expression of B cell specific genes in the hematoma of IE animals
Next, we aimed to define the underlying molecular characteristics of the decrease in B cell proportion detected in the hematoma of IE mice. Due to the low number of detected cells per sample, we were not able to carry out differential expression analysis on B cells only. Instead, our pseudobulk differential expression analysis (see Methods) in hematoma from 2 days to 5 days post osteotomy revealed altered expression of several key immune-related mRNAs in IE mice (Figure 4A). Compared to the hematoma of young and NE animals (Supplementary Figures S3A, B) the IE animals showed higher absolute fold changes from 2 to 5 days post osteotomy, suggesting most extensive changes in gene expression in IE animals.
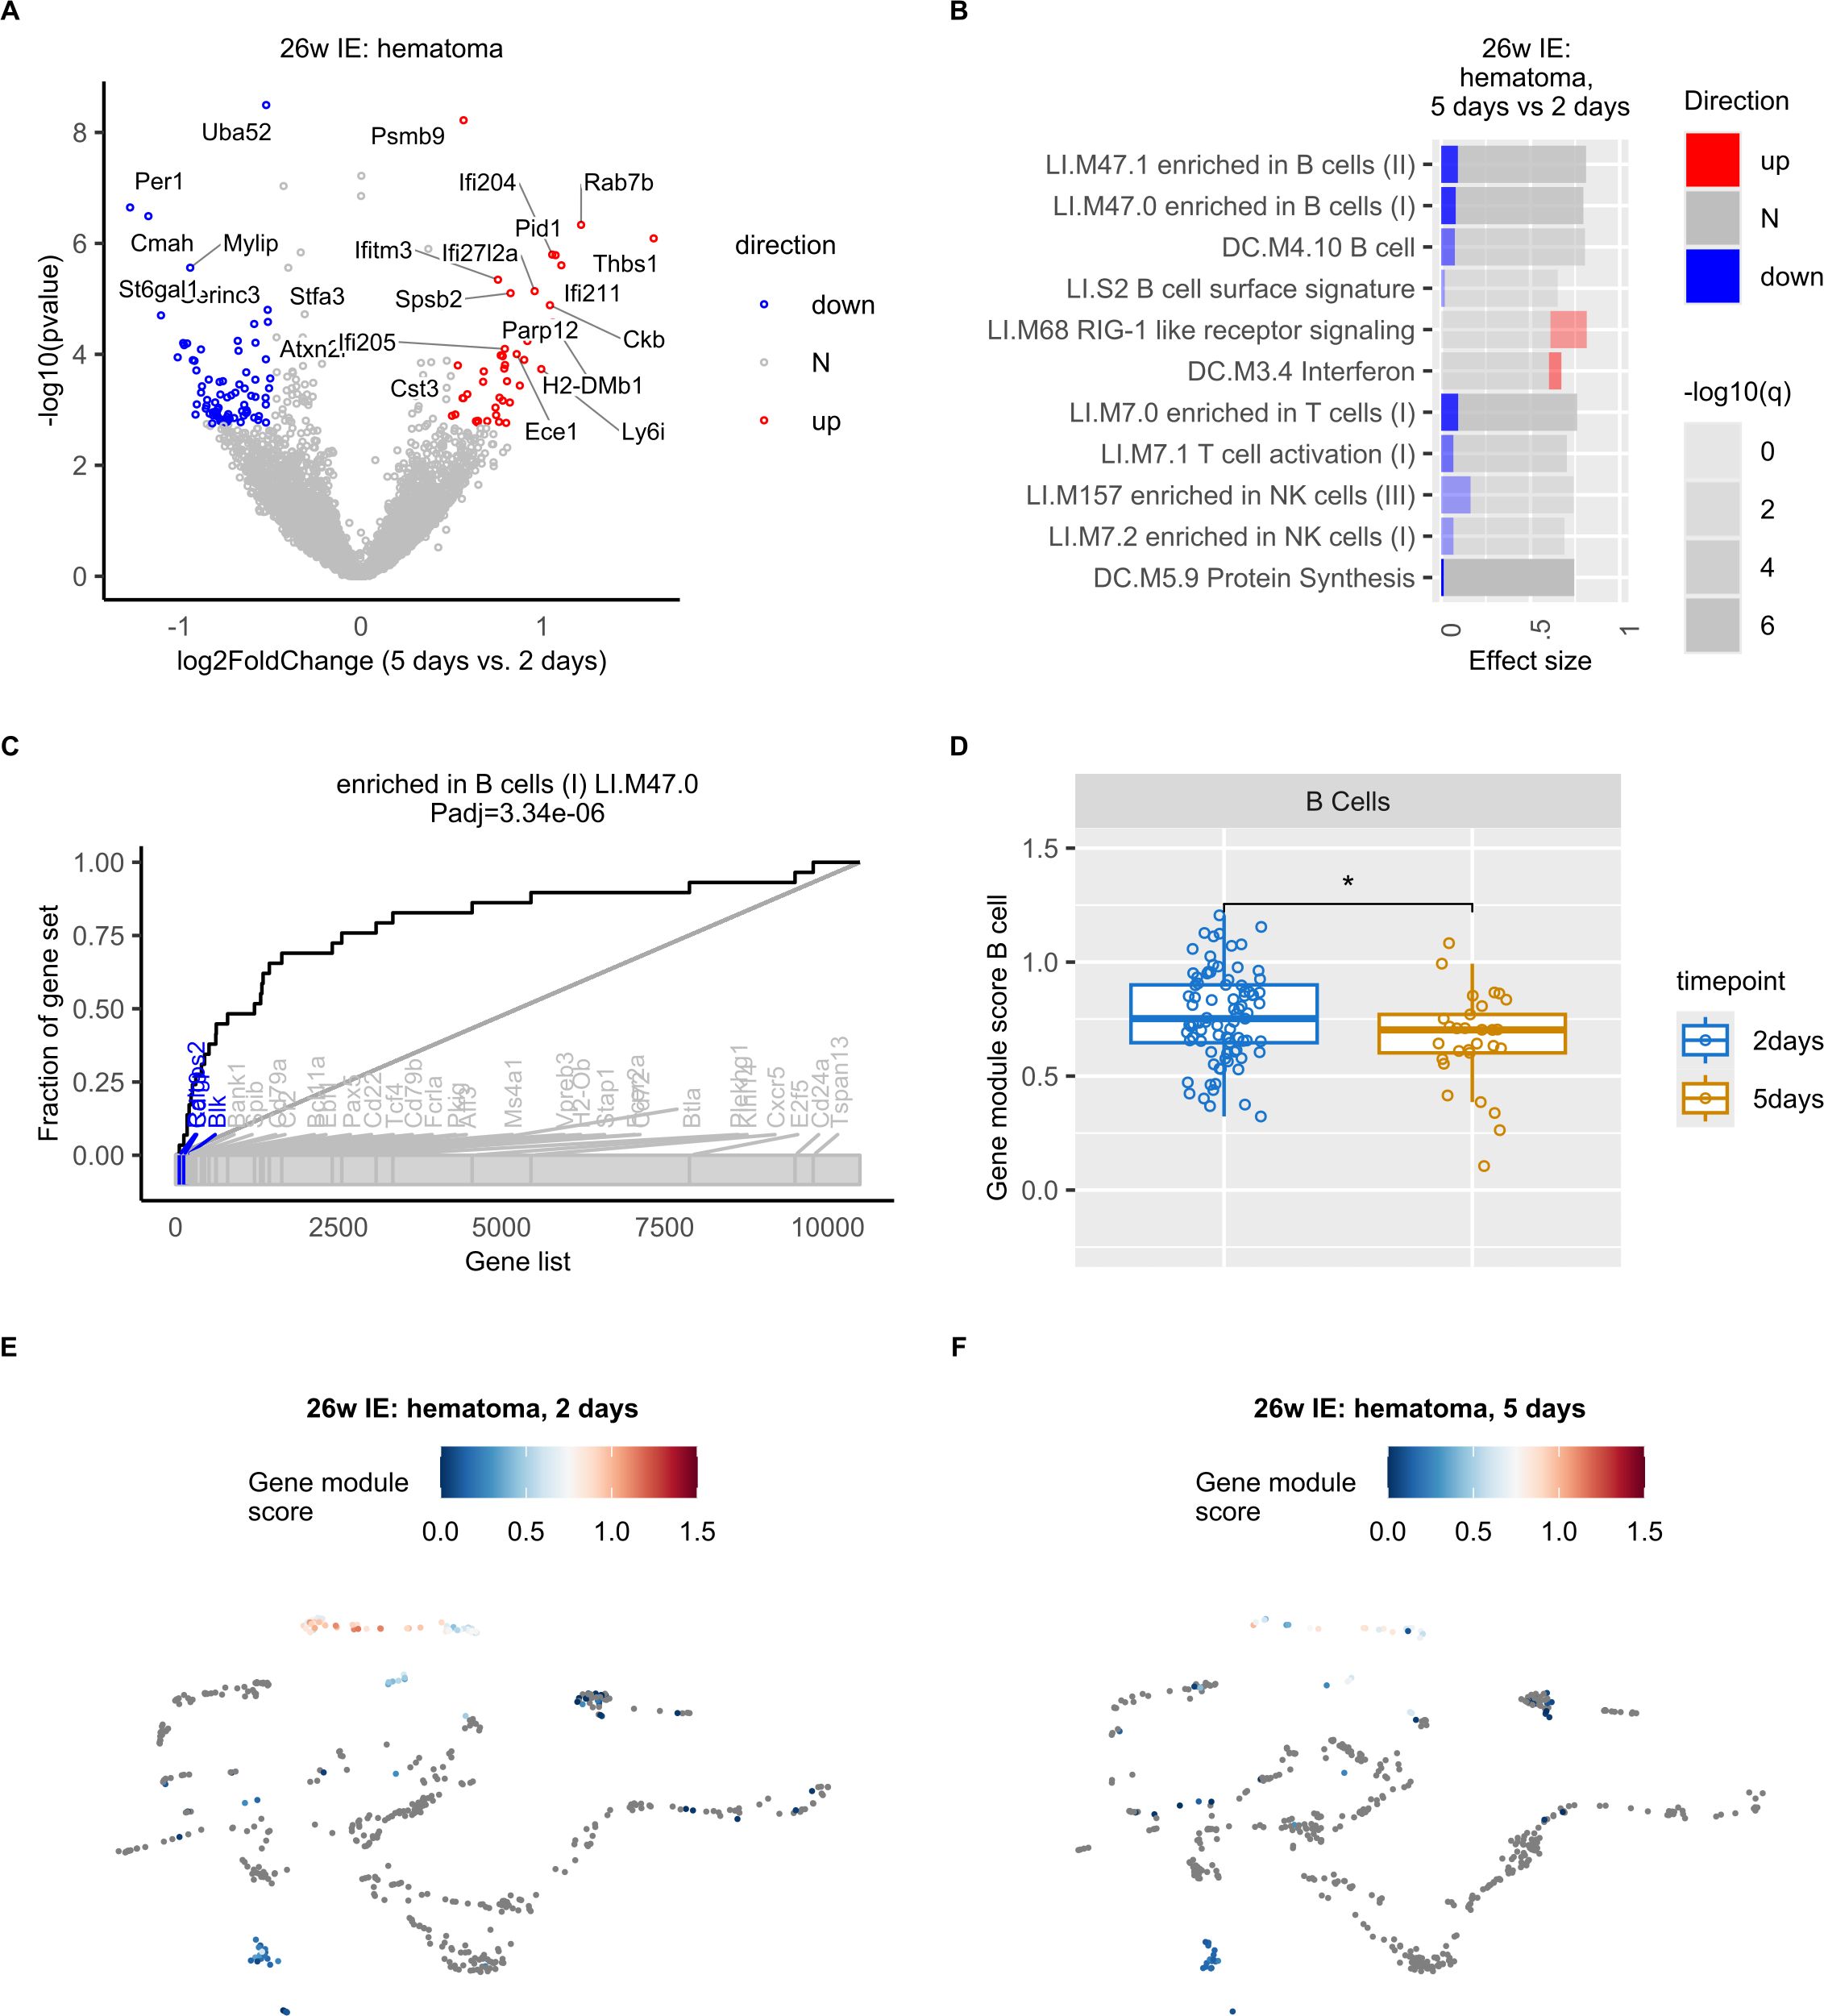
Figure 4. Decreased expression of B cell specific genes in the hematoma of IE mice 5 days post osteotomy. (A) Volcano plot of log2-transformed fold changes (5 days vs. 2 days in the hematoma of IE mice) versus negative log10-transformed p-values (Wald test). Differentially expressed genes (adjusted p-value < 0.1 and absolute log2-transformed fold change > 0.5) are marked in red (up, increased), blue (down, decreased), or grey (N, non-differential). (B) Panel plot of gene set enrichment analysis of differentially expressed genes shown in a). Bars represent relative fractions of mRNAs with decreased (blue) expression, not-differential (N) genes and increased (red) expression within each of the gene sets. (C) Evidence plot depicting area under the curve (AUC) as a measure of effect size for the gene set term “enriched in B cells (LI.M47.0) “. The ranking of genes in the gene set within all considered genes is denoted with the bottom grey ribbon. (D) Box plots of LI.M47.0 gene module scores per cell at 2 and 5 days post osteotomy in the hematoma of IE mice. Wilcoxon rank sum test was used for comparisons. The lower and upper hinges of box plots correspond to the 25th and 75th percentiles, respectively. Center lines of box plots depict the median values. Significant differences are indicated with asterisks (*p< 0.05). (E, F) UMAP embedding showing the gene set (LI.M47.0) scores in IE mice 2 (E) or 5 days post osteotomy (F).
To achieve a better understanding of the function of genes with differential expression 5 days post osteotomy, we performed gene set enrichment analysis. We found a significant enrichment of gene sets such as “enriched in B cells” and “B cell”. Interestingly, the differentially expressed genes in the gene set “enriched in B cells” showed exclusively decreased expression 5 days post osteotomy (Figure 4B). And included well-known B cell specific genes (Figure 4C), such as Ralgps2, Cd19, Cd79a, Ebf1, Pax5, Vpreb3, Cd24 (32), as well as Blk, which was previously found to be differentially expressed in mature B cells (32, 43). We did not identify any significantly enriched gene sets in young and NE animals.
To exclude that the results of our pseudobulk analysis was a consequence of the decreased expression of B cell specific genes in cell types other than B cells, and/or decreased number of B cells in IE mice, rather than a specific change in B cell gene expression program, we next computed cell-wise gene module scores for the “enriched in B cells”gene set identified in our pseudobulk pathway analysis. We observed the highest gene module scores in B cells (Figures 4E, F, Supplementary Figure S3C), confirming that the expression of B cell specific genes was the highest in B cells and not in other cell types. Furthermore, we found a significant decrease in gene module score 5 days post osteotomy (Figure 4D) and concluded that the expression of B cell specific genes was significantly decreased during bone healing of the post osteotomy hematoma in IE mice.
In summary, these results show a specific alteration of the B cell gene expression program in the hematoma of IE animals, where the most extensive decrease in B cell proportion also occurred.
Impairment of hematoma B cell differentiation is most pronounced in IE mice and may be a result of altered gene expression programs in monocytes
To compare the dynamics of B cell maturation during bone healing in different mouse groups, we applied the widely used trajectory inference approach termed Slingshot (37) (see Methods) on the B cell subtypes and HPCs (Figure 5A). After sub-clustering of these cells, which resulted in their clear separation (Figure 5B), we computed cell-wise pseudotime values that reflected the extent of cell differentiation. Expected pseudotime values for the examined cell populations that corresponded to their differentiation status were found, with HPCs showing the lowest values, followed by pre/pro, immature and mature B cells (Figure 5C).
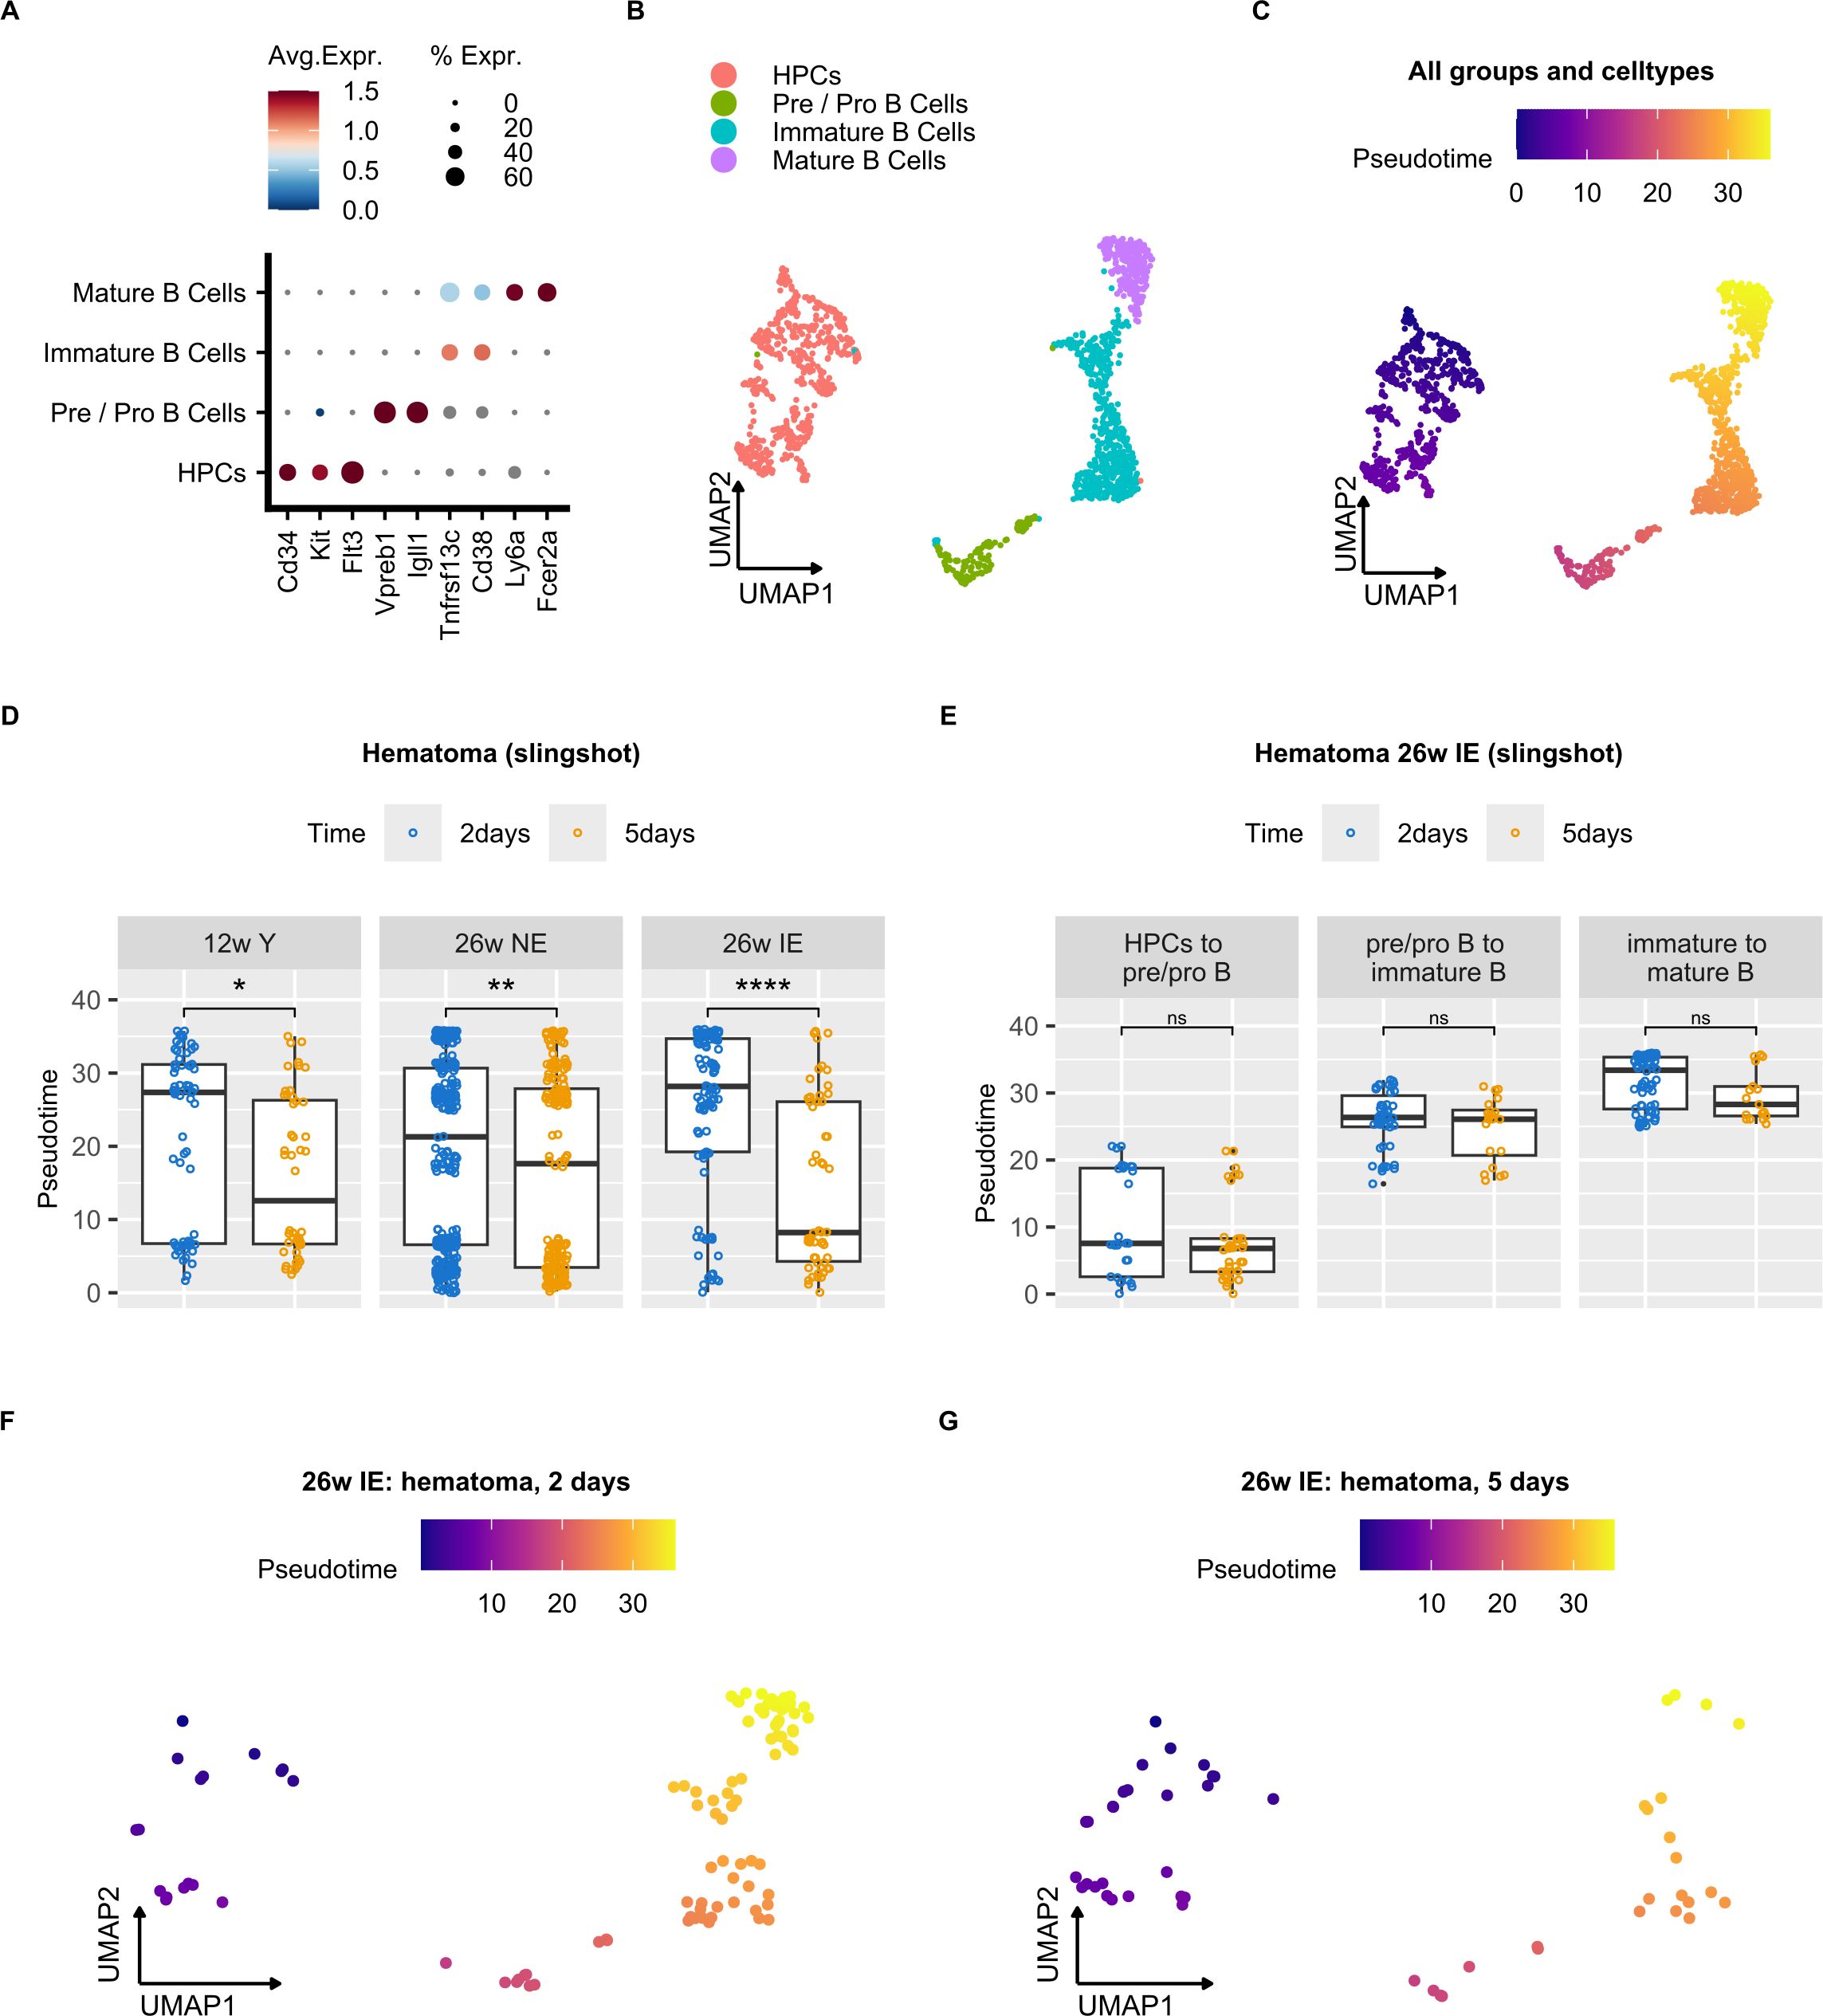
Figure 5. Impairment of B cell differentiation in the osteotomy hematoma of IE mice. (A) Dot plot showing average normalized mRNA expression values for the individual B cell subtypes and hematopoietic precursor cells (HPCs). (B) UMAP embedding of B cells and HPCs from all samples after sub-clustering. Annotated cell clusters are depicted in different colors. (C) UMAP embedding of B cells and HPCs with corresponding cell-wise pseudotime values. (D) Box plots of pseudotime values at 2 and 5 days post osteotomy in the hematoma of the different mouse groups (young, NE, IE) along the pseudotime trajectory. Wilcoxon rank sum test was used for comparisons. The lower and upper hinges of box plots correspond to the 25th and 75th percentiles, respectively. Center lines of box plots depict the median values. Significant differences are indicated with asterisks (*p < 0.05, ****p< 0.0001). (E) Box plots of pseudotime values 2 and 5 days post osteotomy in the hematoma of IE mice for different cell types along the pseudotime trajectory. Wilcoxon rank sum test was used for comparisons. (F, G) UMAP embedding of B cells and HPCs from IE mice 2 (F) or 5 days post osteotomy (G) with indicated cell-wise pseudotime values. ns, non significant; **p<0.01.
To characterize the differential B cell dynamics in the post-osteotomy bone regions, we compared the cell-wise pseudotime values between different mouse groups (Figure 5D, Supplementary Figure S4A, B). We detected a significant decrease in pseudotime 5 days post osteotomy in the hematoma of all mouse groups (Figure 5D), indicating a general B cell differentiation block during the early inflammatory phase of bone healing. Nevertheless, the difference in the median pseudotime from 2 to 5 days post osteotomy was the highest in IE, followed by NE and young animals, suggesting that the impairment of B cell differentiation was most prominent in the IE background. Stratification of B cell subtypes that reflect differentiation states (Figure 5E) revealed a trend, which showed that the immature to mature B cell transition showed the most extensive pseudotime decrease from 2 to 5 days post osteotomy, suggesting that the transition from immature to mature B cells was most affected. In addition, we detected a higher number of de-differentiated cells with shorter pseudotime in IE mice of 5 days (Figure 5G) compared to 2 days post osteotomy (Figure 5F). To confirm these results, we also computed pseudotime values using an alternative trajectory inference method (Monocle 3) (44), recapitulating the Slingshot results (Supplementary Figures S4C-E). In summary, these results suggest that the impairment of hematoma B cell differentiation is most pronounced in IE mice and likely occurs during the transition from immature to mature B cells.
To investigate the possible reasons for the pronounced B cell differentiation impairment in the IE mice, we next focused on the increased expression of interferon (Ifn) associated genes detected in IE mice 5 days post osteotomy (Figure 4B). Gene module scoring revealed that monocytes and neutrophils showed a significant increase (Supplementary Figure S5A) in the expression of Ifn associated genes, including Irf7, Dhx58 and Parp12 detected with pseudobulk differential expression analysis in the hematoma of the IE mice from 2 to 5 days post osteotomy (Figure 6A). We next compared the average expression of Ifn associated genes in monocytes between different mouse groups and confirmed that the strongest increase was in IE animals 5 days post osteotomy, while none of these genes were found to be differentially expressed in NE or young animals (Figure 6B, Supplementary Figures S5B, C).
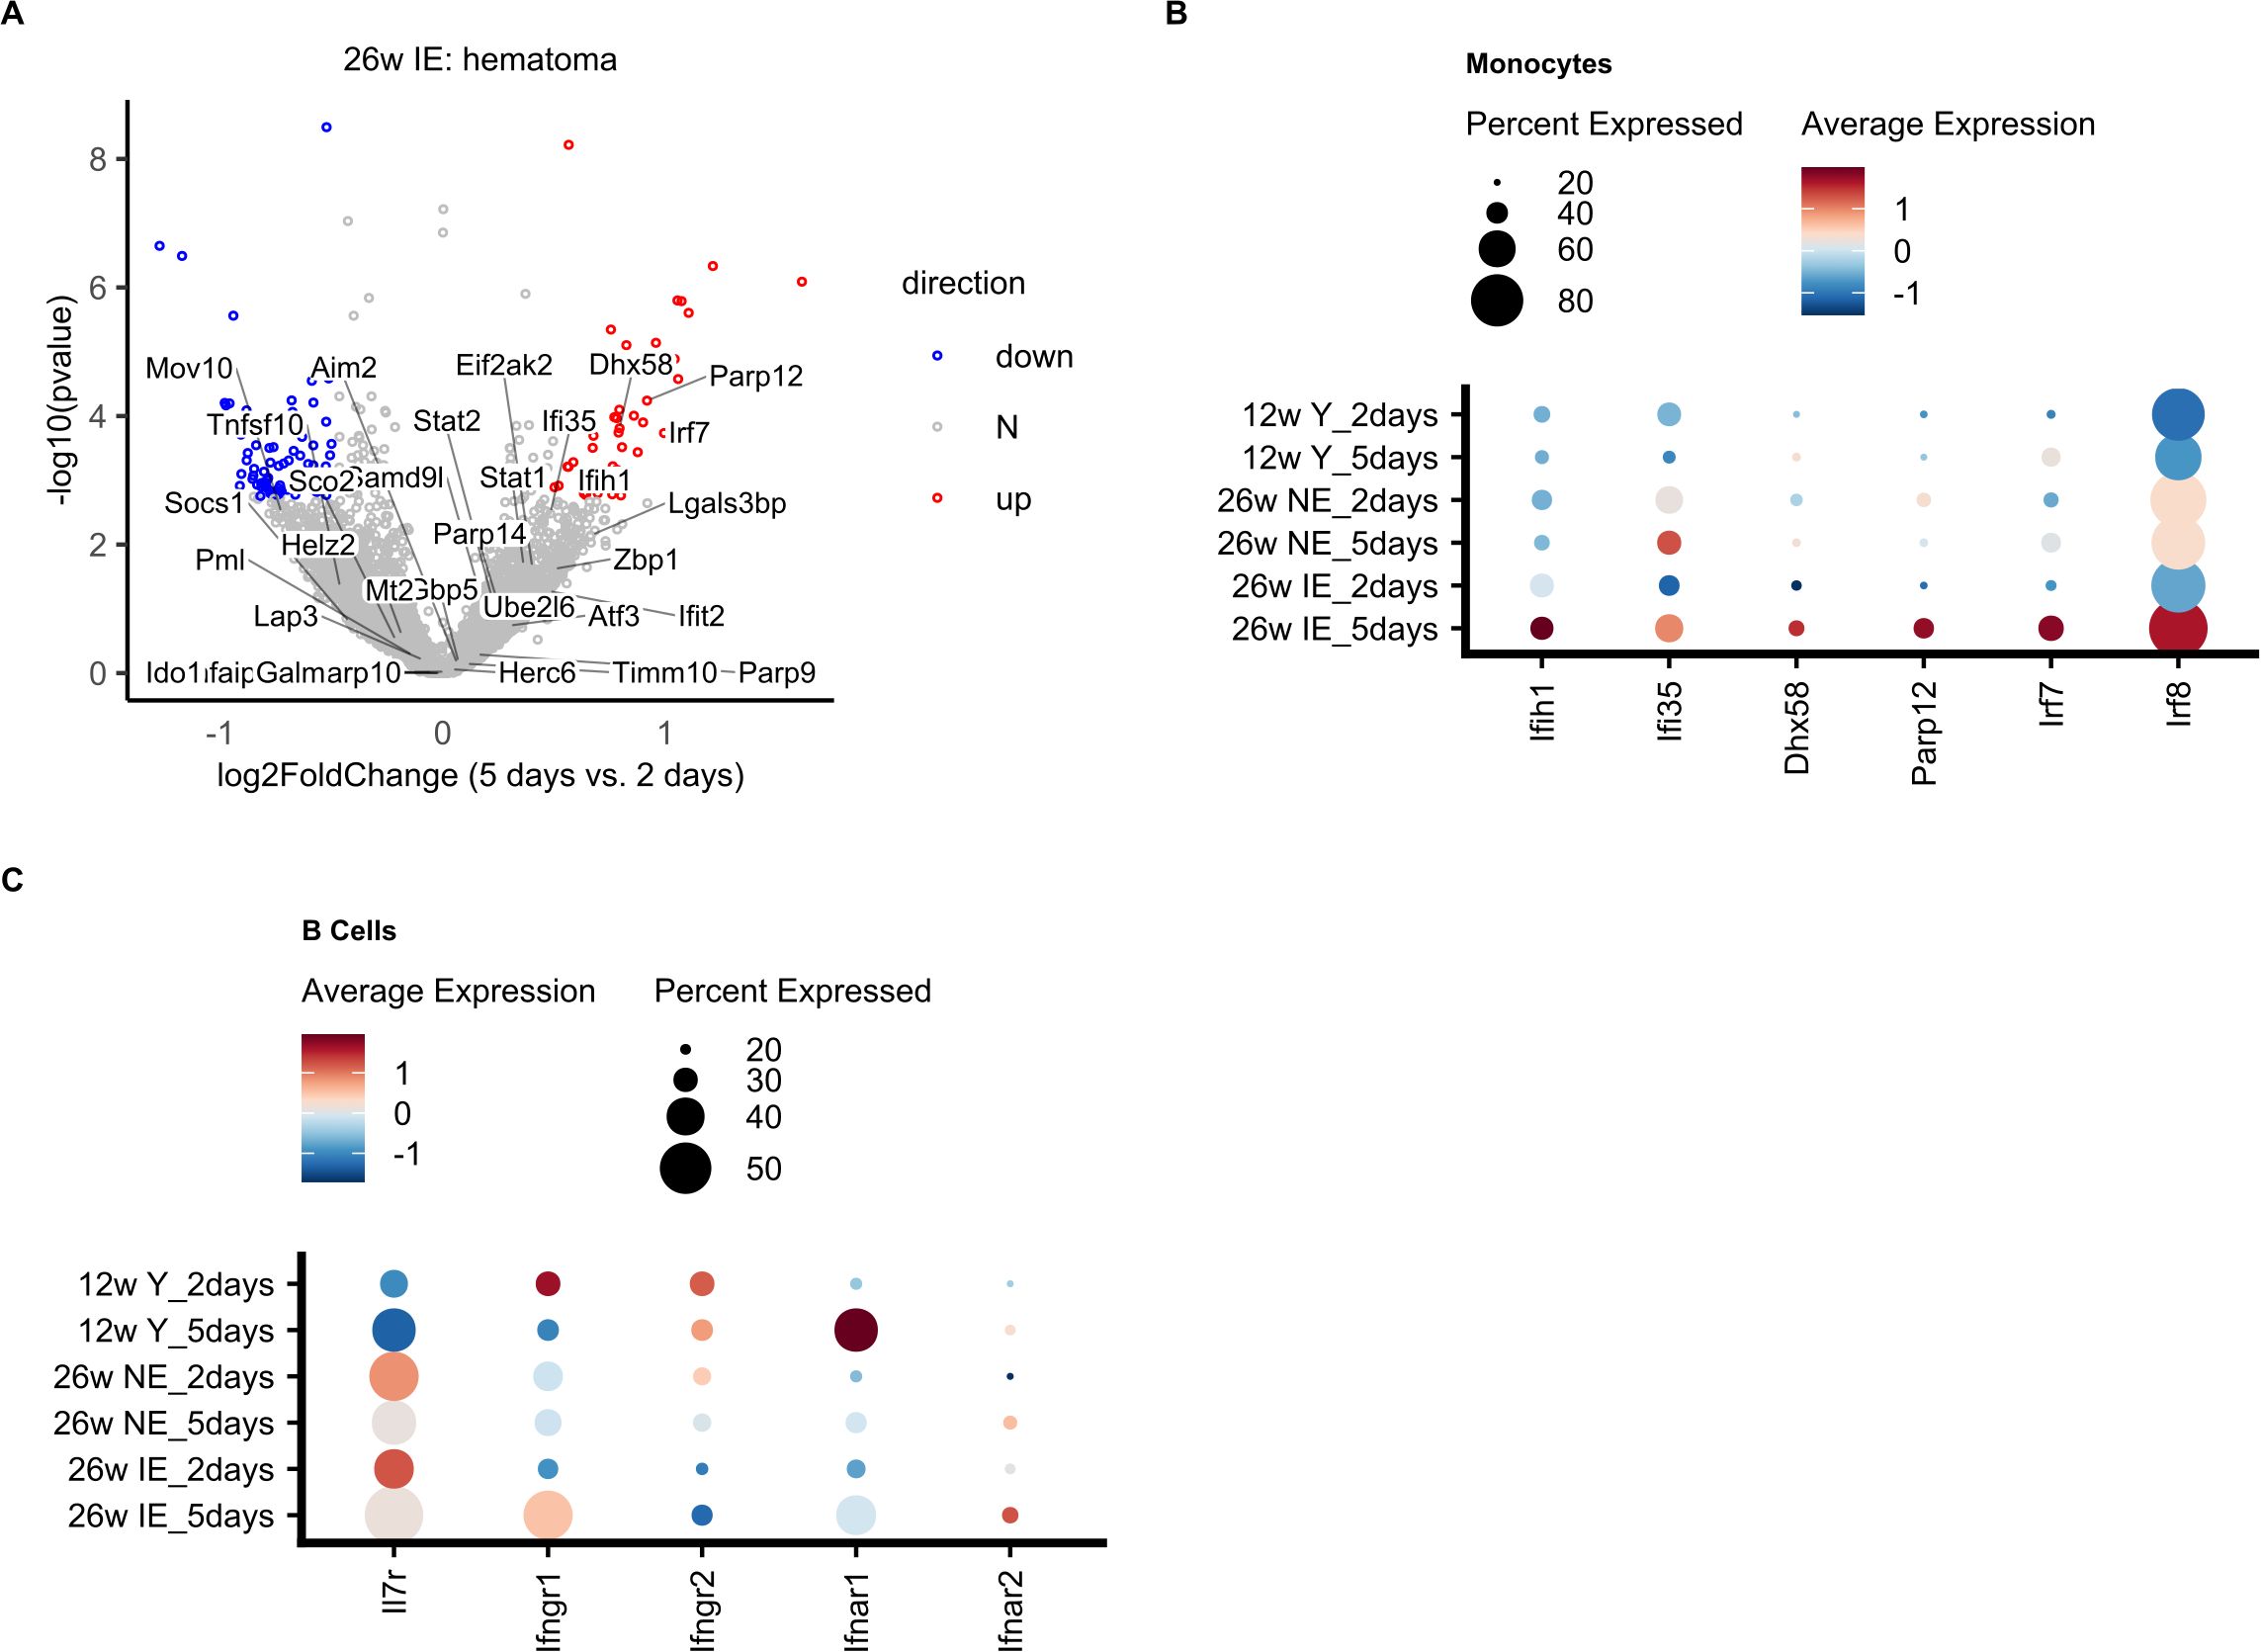
Figure 6. Differential expression of Ifn associated genes in monocytes and their target molecules in B cells. (A) Volcano plot of log2-transformed fold changes (5 days vs. 2 days of IE hematoma) versus negative log10-transformed p-values (Wald test). Genes included in the “Interferon” gene set (DC.M3.4) are indicated along with all differentially expressed genes (adjusted p-value < 0.1 and absolute log2-transformed fold change > 0.5), and colored in red (up, increased), blue (down, decreased), or grey (N, non-differential). (B) Dot plot showing the average normalized mRNA expression values and percentage of cells expressing a given interferon associated gene in monocytes for the different mouse groups on day 2 and day 5. (C) Dot plot showing the normalized mRNA expression levels for interferon receptor (Ifnr) genes in B cells for the different mouse groups on days 2 and 5.
In the bone marrow (BM), B cell development is strongly influenced by interleukin 7 (IL-7) (45–49), since type I interferons produced by macrophages can inhibit IL-7-driven growth of B lineage cells and thus arrest their growth (50, 51). Therefore, the detected increased expression of Ifn associated genes such as Irf7 could indicate a positive induction of interferon levels and their secretion from monocytes, which could in turn stimulate B cells. Comparison of the expression of Ifn and Il7 receptor molecules in B cells revealed a decrease in the expression of Il7r in IE mice 5 days post osteotomy (Figure 6C), suggesting a possible decrease in signaling via Il7r, and consequently impaired B cell differentiation. Conversely, Ifngr1 expression was increased in B cells, which may explain an increase via Ifngr1 signaling, also supporting decreased B cell production. In summary, in IE animals, the impairment of B cell differentiation may be affected by the specific increase in Ifn associated genes in monocytes and the modified expression of their target molecules in B cells.
Discussion
In this study, we investigated the B cell phenotype during the early inflammatory phase of bone healing at the single cell level by using a mouse model that mimics “inflamm-aged/immune-aged” individuals (10, 28). The novelty of our work lies in the delineation of B cell differentiation impairment that occurs in the hematoma during the early inflammatory phase post osteotomy, with the most pronounced block identified in IE rather than NE and young animals (Figure 5). In addition, these results were obtained by the systematic single cell transcriptomic analysis of BM cells isolated from female mice with differential immune experience and the subsequent bioinformatic and statistical analysis. Although we detected a relatively low number of BM resident cells in our study (~12.000), our single cell proteo-genomics based method recovered a higher number of cells than other previously published murine BM scRNA-seq datasets (27, 30, 31) (Supplementary Figure S1E). Nevertheless, due to our experimental setup, our findings are limited to female mice and remain to be confirmed for male animals. We decided on such an experimental setup due to the fact that female mice are known to have slower fracture healing process than male mice (75) and therefore enable a fairer characterization of the healing process, so that the bone healing outcome is not overestimated.
Earlier studies have noted the potential functional importance of B cells during bone formation and healing, since they regulate osteoclast activity (52, 53), and invade the fracture gap during the inflammatory phase and hard callus formation (26). The lack of regulatory B cells (Bregs) has been associated with delayed or non-healing fractures (PMID: 28008635 & 26303993). We were unfortunately not able to analyze Bregs, since Il10 expression, which is the hallmark of Bregs, was not detected. In future work, we plan to enrich for B cells and evaluate potentially interesting subpopulations such as Bregs. Recently, Zhang et al. applied single cell transcriptomics to a murine fracture model and found that B cells vary in number during early healing stages (27). Moreover, Molitoris et al. (54) found that the number of B cells in the callus fractures of young and aged mice gradually decreased from day 0 to day 7 after fracture, with the decrease being more pronounced in the aged mice. These findings are partially consistent with our results, since we found a general decrease of B cell differentiation in osteotomy hematoma of all mouse groups with different levels of immune experience (Figure 5). Importantly, our results also showed that while the B cell differentiation is generally impaired in the early phase of bone healing, this effect was much more pronounced in IE than in NE or young animals (Figure 5).
Although no differences in B cell proportions were observed in either NE or young mice, a significant decrease was found in the hematoma of IE mice 5 days post osteotomy (Figure 3). These results correlate well with the respective decrease in the pseudotime values corresponding to B cell differentiation. However, the pseudotime values in the NE mice at 2 days post injury were higher in the distal than in the hematoma and proximal tissue (Supplementary Figure S4B), suggesting that B cell differentiation 2 days post injury in the NE animals is inhibited in the hematoma and proximal tissue but not inhibited in the distal tissue, which also corresponds to the trend towards higher distal B cell proportion (Supplementary Figure S2A). Nevertheless, the detected difference in the B cell differentiation from 2 to 5 days post osteotomy in the distal tissue of NE and young mice (Supplementary Figure S4B) is not reflected in the decreased B cell proportion (Figure 3C). We speculate that other unknown factors, such as induction of unknown genes that promote differentiation or inhibit cell death, contribute to this discrepancy and could be addressed in further studies.
Hallmarks of aged adaptive immune system include systemic chronic inflammation (13–15, 55) and a decrease in the differentiation of HSCs into T and B cells (56, 57). As a result, fewer adaptive immune cell precursors are present in elderly people (13). Even though previous studies mostly focused on the age-related changes in T cells and their impact on the healing outcome (10, 11), it is widely known that B cell phenotypes are altered in many inflammatory diseases (25) and that B cells impact osteoclastogenesis (58, 59). Therefore, the highest decrease in the B cell proportion during bone healing was expected in IE mice, since those animals in fact modeled the compromised immune system found in some elderly individuals. Nevertheless, our cell proportion quantification (Figure 3, Supplementary Figure S2) only allowed us to compare relative fractions between mice groups, and we were unable to clearly delineate the reason for B cell proportion decrease in IE mice. However, based on the results of our trajectory inference analysis (Figure 5), lower B cell proportion in IE mice is most likely due to decreased absolute number of mature B cells because of the decreased production of mature B cells, rather than increased cell death of specific B cell subsets.
Mature B cells are responsible for the production of a large fraction of bone marrow osteoprotegerin (OPG) (60, 61), which acts as decoy for the transcription factor RANKL, thereby suppressing osteoclastogenesis and bone resorption (62, 63). In addition, mice lacking B cells in the bone marrow showed an OPG-deficient and a frequent osteoporotic bone phenotype (61). Since we found the most extensive pseudotime decrease in the IE mice, we consequently expect lower OPG secretion and extensive bone resorption, the process which unfavorably impacts the bone healing outcome (61, 64–66). Further phenotypic and mechanistic insights into B cell differentiation in the NE and IE condition are required to substantiate these findings.
In this study, we also observed an increased expression of interferon-associated genes in monocytes (Figures 6A, B), suggesting that a number of effectors such as type I and II interferons, as well as Il7 could play an important role in the pronounced impairment of BM B cell differentiation in IE animals. Interferon-associated genes with increased expression included Irf7 (Figures 6A, B), a transcription factor that controls the expression interferons, such as Ifna, Ifnb and Ifng (67, 68). In fact, we detected an increase in the Ifngr1 expression in B cells 5 days post osteotomy (Figure 6C), which may indicate that the inhibitory effect of Ifngr1 signaling via Ifng would be more pronounced in IE rather than NE or young animals, a result which will have to be confirmed in our future work using orthogonal methods.
Since Il7 is required for B cell development in mice (69–72) and is produced by stromal cells during early B cell lymphopoiesis (73, 74), we also analyzed the Il7r expression in B cells. We detected the lowest drop in Il7r expression from day 2 to day 5 in the IE mice (Figure 6C), which may explain the more pronounced impairment of B cell differentiation in these animals, since deficient Il7r signaling may lead to impaired B cell development (45). In addition, macrophages can produce type I interferons and thereby inhibit the effect of Il7 on B cell development (50). However, we cannot exclude that the detected decrease in Il7r is a consequence of decreased B cell number in IE mice 5 days post osteotomy. Since our experimental setup did not allow for the detection of stromal cells, which typically secrete Il7, further experiments have to be done to explore the possibility that they play a role in the B cell maturation impairment during bone regeneration.
In summary, our results point to a newly discovered impairment of B cell differentiation during the inflammatory phase of bone healing in IE mice and suggest that other BM cells could interact with B cells to influence their maturation. Additional work to determine the extent of such cell-cell interactions and the molecules that regulate the observed defect may prove valuable as candidate therapeutic targets for the improvement of the healing outcome in elderly bone fracture patients.
Data availability statement
Single cell RNA-seq data are available at GEO (Gene Expression Omnibus) under accession GSE273792. All analysis scripts and processed data are publicly available from GitHub at http://github.com/bihealth/fracture-healing-and-aging-scseq.
Ethics statement
The animal study was approved by Landesamt für Gesundheit und Soziales Berlin: G0161/17. The study was conducted in accordance with the local legislation and institutional requirements.
Author contributions
MT: Formal Analysis, Investigation, Software, Visualization, Writing – original draft, Writing – review & editing. CB: Conceptualization, Investigation, Methodology, Writing – review & editing. A-KM: Methodology, Writing – review & editing. SH: Conceptualization, Supervision, Writing – review & editing. KS-B: Conceptualization, Funding acquisition, Investigation, Methodology, Project administration, Supervision, Writing – review & editing. GD: Conceptualization, Funding acquisition, Project administration, Resources, Supervision, Writing – review & editing. DB: Conceptualization, Formal Analysis, Funding acquisition, Investigation, Methodology, Project administration, Resources, Software, Supervision, Writing – review & editing. MM: Data curation, Formal Analysis, Investigation, Methodology, Software, Supervision, Visualization, Writing – original draft, Writing – review & editing.
Funding
The author(s) declare that financial support was received for the research, authorship, and/or publication of this article. This study was funded by the German Research Foundation (DFG) through the Collaborative Research Center 1444 and the ERC Advanced Grant “Immuno-Mechanics”.
Acknowledgments
We would like to thank Agnes Ellinghaus as well as the BIH Core Unit pluripotent Stem Cells & Organoids (CUSCO) and the BIH/MDC Genomics Platform for their help and support.
Conflict of interest
The authors declare that the research was conducted in the absence of any commercial or financial relationships that could be construed as a potential conflict of interest.
Generative AI statement
The author(s) declare that no Generative AI was used in the creation of this manuscript.
Publisher’s note
All claims expressed in this article are solely those of the authors and do not necessarily represent those of their affiliated organizations, or those of the publisher, the editors and the reviewers. Any product that may be evaluated in this article, or claim that may be made by its manufacturer, is not guaranteed or endorsed by the publisher.
Supplementary material
The Supplementary Material for this article can be found online at: https://www.frontiersin.org/articles/10.3389/fimmu.2025.1511902/full#supplementary-material
References
1. Duda GN, Geissler S, Checa S, Tsitsilonis S, Petersen A, Schmidt-Bleek K. The decisive early phase of bone regeneration. Nat Rev Rheumatol. (2023) 19:78–95. doi: 10.1038/s41584-022-00887-0
2. Schmidt-Bleek K, Schell H, Schulz N, Hoff P, Perka C, Buttgereit F, et al. Inflammatory phase of bone healing initiates the regenerative healing cascade. Cell Tissue Res. (2012) 347:567–73. doi: 10.1007/s00441-011-1205-7
3. Bahney CS, Zondervan RL, Allison P, Theologis A, Ashley JW, Ahn J, et al. Cellular biology of fracture healing. J Orthop Res. (2019) 37:35–50. doi: 10.1002/jor.24170
4. Loeffler J, Duda GN, Sass FA, Dienelt A. The metabolic microenvironment steers bone tissue regeneration. Trends Endocrinol Metab. (2018) 29:99–110. doi: 10.1016/j.tem.2017.11.008
5. Foulke BA, Kendal AR, Murray DW, Pandit H. Fracture healing in the elderly: A review. Maturitas. (2016) 92:49–55. doi: 10.1016/j.maturitas.2016.07.014
6. Gruber R, Koch H, Doll BA, Tegtmeier F, Einhorn TA, Hollinger JO. Fracture healing in the elderly patient. Exp Gerontol. (2006) 41:1080–93. doi: 10.1016/j.exger.2006.09.008
7. Loffler J, Sass FA, Filter S, Rose A, Ellinghaus A, Duda GN, et al. Compromised bone healing in aged rats is associated with impaired M2 macrophage function. Front Immunol. (2019) 10:2443. doi: 10.3389/fimmu.2019.02443
8. Maruyama M, Rhee C, Utsunomiya T, Zhang N, Ueno M, Yao Z, et al. Modulation of the inflammatory response and bone healing. Front Endocrinol (Lausanne). (2020) 11:386. doi: 10.3389/fendo.2020.00386
9. Reinke S, Geissler S, Taylor WR, Schmidt-Bleek K, Juelke K, Schwachmeyer V, et al. Terminally differentiated CD8(+) T cells negatively affect bone regeneration in humans. Sci Transl Med. (2013) 5:177ra136. doi: 10.1126/scitranslmed.3004754
10. Bucher CH, Berkmann JC, Burkhardt LM, Paschke C, Schlundt C, Lang A, et al. Local immune cell contributions to fracture healing in aged individuals - A novel role for interleukin 22. Exp Mol Med. (2022) 54:1262–76. doi: 10.1038/s12276-022-00834-9
11. Clark D, Nakamura M, Miclau T, Marcucio R. Effects of aging on fracture healing. Curr Osteoporos Rep. (2017) 15:601–8. doi: 10.1007/s11914-017-0413-9
12. Hirata H, Zhang N, Ueno M, Barati D, Kushioka J, Shen H, et al. Ageing attenuates bone healing by mesenchymal stem cells in a microribbon hydrogel with a murine long bone critical-size defect model. Immun Ageing. (2022) 19:14. doi: 10.1186/s12979-022-00272-1
13. Li X, Li C, Zhang W, Wang Y, Qian P, Huang H. Inflammation and aging: signaling pathways and intervention therapies. Signal Transduct Target Ther. (2023) 8:239. doi: 10.1038/s41392-023-01502-8
14. Zharhary D. Age-related changes in the capability of the bone marrow to generate B cells. J Immunol. (1988) 141:1863–9. doi: 10.4049/jimmunol.141.6.1863
15. Rossi DJ, Bryder D, Zahn JM, Ahlenius H, Sonu R, Wagers AJ, et al. Cell intrinsic alterations underlie hematopoietic stem cell aging. Proc Natl Acad Sci U.S.A. (2005) 102:9194–9. doi: 10.1073/pnas.0503280102
16. Salam N, Rane S, Das R, Faulkner M, Gund R, Kandpal U, et al. T cell ageing: effects of age on development, survival & function. Indian J Med Res. (2013) 138:595–608.
17. Thome JJ, Grinshpun B, Kumar BV, Kubota M, Ohmura Y, Lerner H, et al. Longterm maintenance of human naive T cells through in situ homeostasis in lymphoid tissue sites. Sci Immunol. (2016) 1(6):eaah6506. doi: 10.1126/sciimmunol.aah6506
18. Soto-Heredero G, Gomez de Las Heras MM, Escrig-Larena JI, Mittelbrunn M. Extremely differentiated T cell subsets contribute to tissue deterioration during aging. Annu Rev Immunol. (2023) 41:181–205. doi: 10.1146/annurev-immunol-101721-064501
19. Miller RA. The aging immune system: primer and prospectus. Science. (1996) 273:70–4. doi: 10.1126/science.273.5271.70
20. Linton PJ, Dorshkind K. Age-related changes in lymphocyte development and function. Nat Immunol. (2004) 5:133–9. doi: 10.1038/ni1033
21. Sun G, Wang Y, Ti Y, Wang J, Zhao J, Qian H. Regulatory B cell is critical in bone union process through suppressing proinflammatory cytokines and stimulating Foxp3 in Treg cells. Clin Exp Pharmacol Physiol. (2017) 44:455–62. doi: 10.1111/1440-1681.12719
22. Yang S, Ding W, Feng D, Gong H, Zhu D, Chen B, et al. Loss of B cell regulatory function is associated with delayed healing in patients with tibia fracture. APMIS. (2015) 123:975–85. doi: 10.1111/apm.12439
23. Ma S, Wang C, Mao X, Hao Y. B cell dysfunction associated with aging and autoimmune diseases. Front Immunol. (2019) 10:318. doi: 10.3389/fimmu.2019.00318
24. Mouat IC, Goldberg E, Horwitz MS. Age-associated B cells in autoimmune diseases. Cell Mol Life Sci. (2022) 79:402. doi: 10.1007/s00018-022-04433-9
25. Horowitz MC, Fretz JA, Lorenzo JA. How B cells influence bone biology in health and disease. Bone. (2010) 47:472–9. doi: 10.1016/j.bone.2010.06.011
26. Konnecke I, Serra A, El Khassawna T, Schlundt C, Schell H, Hauser A, et al. T and B cells participate in bone repair by infiltrating the fracture callus in a two-wave fashion. Bone. (2014) 64:155–65. doi: 10.1016/j.bone.2014.03.052
27. Zhang H, Wang R, Wang G, Zhang B, Wang C, Li D, et al. Single-cell RNA sequencing reveals B cells are important regulators in fracture healing. Front Endocrinol (Lausanne). (2021) 12:666140. doi: 10.3389/fendo.2021.666140
28. Bucher CH, Schlundt C, Wulsten D, Sass FA, Wendler S, Ellinghaus A, et al. Experience in the adaptive immunity impacts bone homeostasis, remodeling, and healing. Front Immunol. (2019) 10:797. doi: 10.3389/fimmu.2019.00797
29. Satija R, Farrell JA, Gennert D, Schier AF, Regev A. Spatial reconstruction of single-cell gene expression data. Nat Biotechnol. (2015) 33:495–502. doi: 10.1038/nbt.3192
30. The Tabula Muris Consortium, Overall coordination, Logistical coordination, Organ collection and processing, Library preparation and sequencing, Computational data analysis, et al. Single-cell transcriptomics of 20 mouse organs creates a Tabula Muris. Nature. (2018) 562:367–72. doi: 10.1038/s41586-018-0590-4
31. Baccin C, Al-Sabah J, Velten L, Helbling PM, Grunschlager F, Hernandez-Malmierca P, et al. Combined single-cell and spatial transcriptomics reveal the molecular, cellular and spatial bone marrow niche organization. Nat Cell Biol. (2020) 22:38–48. doi: 10.1038/s41556-019-0439-6
32. Morgan D, Tergaonkar V. Unraveling B cell trajectories at single cell resolution. Trends Immunol. (2022) 43:210–29. doi: 10.1016/j.it.2022.01.003
33. Love MI, Huber W, Anders S. Moderated estimation of fold change and dispersion for RNA-seq data with DESeq2. Genome Biol. (2014) 15:550. doi: 10.1186/s13059-014-0550-8
34. Zyla J, Marczyk M, Domaszewska T, Kaufmann SHE, Polanska J, Weiner J. Gene set enrichment for reproducible science: comparison of CERNO and eight other algorithms. Bioinformatics. (2019) 35:5146–54. doi: 10.1093/bioinformatics/btz447
35. Chaussabel D, Quinn C, Shen J, Patel P, Glaser C, Baldwin N, et al. A modular analysis framework for blood genomics studies: application to systemic lupus erythematosus. Immunity. (2008) 29:150–64. doi: 10.1016/j.immuni.2008.05.012
36. Li S, Rouphael N, Duraisingham S, Romero-Steiner S, Presnell S, Davis C, et al. Molecular signatures of antibody responses derived from a systems biology study of five human vaccines. Nat Immunol. (2014) 15:195–204. doi: 10.1038/ni.2789
37. Street K, Risso D, Fletcher RB, Das D, Ngai J, Yosef N, et al. Slingshot: cell lineage and pseudotime inference for single-cell transcriptomics. BMC Genomics. (2018) 19:477. doi: 10.1186/s12864-018-4772-0
38. Cao J, Spielmann M, Qiu X, Huang X, Ibrahim DM, Hill AJ, et al. The single-cell transcriptional landscape of mammalian organogenesis. Nature. (2019) 566:496–502. doi: 10.1038/s41586-019-0969-x
39. Amezquita RA, Lun ATL, Becht E, Carey VJ, Carpp LN, Geistlinger L, et al. Orchestrating single-cell analysis with Bioconductor. Nat Methods. (2020) 17:137–45. doi: 10.1038/s41592-019-0654-x
40. Stoeckius M, Hafemeister C, Stephenson W, Houck-Loomis B, Chattopadhyay PK, Swerdlow H, et al. Simultaneous epitope and transcriptome measurement in single cells. Nat Methods. (2017) 14:865–8. doi: 10.1038/nmeth.4380
41. Liu X, Yao J, Zhao Y, Wang J, Qi H. Author Correction: Heterogeneous plasma cells and long-lived subsets in response to immunization, autoantigen and microbiota. Nat Immunol. (2023) 24:200. doi: 10.1038/s41590-022-01397-7
42. Bandyopadhyay S, Duffy MP, Ahn KJ, Sussman JH, Pang M, Smith D, et al. Mapping the cellular biogeography of human bone marrow niches using single-cell transcriptomics and proteomic imaging. Cell. (2024) 187:3120–3140 e3129. doi: 10.1016/j.cell.2024.04.013
43. Samuelson EM, Laird RM, Maue AC, Rochford R, Hayes SM. Blk haploinsufficiency impairs the development, but enhances the functional responses, of MZ B cells. Immunol Cell Biol. (2012) 90:620–9. doi: 10.1038/icb.2011.76
44. Qiu X, Mao Q, Tang Y, Wang L, Chawla R, Pliner HA, et al. Reversed graph embedding resolves complex single-cell trajectories. Nat Methods. (2017) 14:979–82. doi: 10.1038/nmeth.4402
45. Corfe SA, Paige CJ. The many roles of IL-7 in B cell development; mediator of survival, proliferation and differentiation. Semin Immunol. (2012) 24:198–208. doi: 10.1016/j.smim.2012.02.001
46. Dias S, Silva H Jr., Cumano A, Vieira P. Interleukin-7 is necessary to maintain the B cell potential in common lymphoid progenitors. J Exp Med. (2005) 201:971–9. doi: 10.1084/jem.20042393
47. Namen AE, Lupton S, Hjerrild K, Wignall J, Mochizuki DY, Schmierer A, et al. Stimulation of B-cell progenitors by cloned murine interleukin-7. Nature. (1988) 333:571–3. doi: 10.1038/333571a0
48. Kaiser FMP, Janowska I, Menafra R, de Gier M, Korzhenevich J, Pico-Knijnenburg I, et al. IL-7 receptor signaling drives human B-cell progenitor differentiation and expansion. Blood. (2023) 142:1113–30. doi: 10.1182/blood.2023019721
49. Sudo T, Nishikawa S, Ohno N, Akiyama N, Tamakoshi M, Yoshida H, et al. Expression and function of the interleukin 7 receptor in murine lymphocytes. Proc Natl Acad Sci U.S.A. (1993) 90:9125–9. doi: 10.1073/pnas.90.19.9125
50. Wang J, Lin Q, Langston H, Cooper MD. Resident bone marrow macrophages produce type 1 interferons that can selectively inhibit interleukin-7-driven growth of B lineage cells. Immunity. (1995) 3:475–84. doi: 10.1016/1074-7613(95)90176-0
51. Lin Q, Dong C, Cooper MD. Impairment of T and B cell development by treatment with a type I interferon. J Exp Med. (1998) 187:79–87. doi: 10.1084/jem.187.1.79
52. Manabe N, Kawaguchi H, Chikuda H, Miyaura C, Inada M, Nagai R, et al. Connection between B lymphocyte and osteoclast differentiation pathways. J Immunol. (2001) 167:2625–31. doi: 10.4049/jimmunol.167.5.2625
53. Weitzmann MN, Cenci S, Haug J, Brown C, DiPersio J, Pacifici R. B lymphocytes inhibit human osteoclastogenesis by secretion of TGFbeta. J Cell Biochem. (2000) 78:318–24. doi: 10.1002/(SICI)1097-4644(20000801)78:2<318::AID-JCB13>3.0.CO;2-N
54. Molitoris KH, Balu AR, Huang M, Baht GS. The impact of age and sex on the inflammatory response during bone fracture healing. JBMR Plus. (2024) 8:ziae023. doi: 10.1093/jbmrpl/ziae023
55. Kushioka J, Chow SK, Toya M, Tsubosaka M, Shen H, Gao Q, et al. Bone regeneration in inflammation with aging and cell-based immunomodulatory therapy. Inflammation Regener. (2023) 43:29. doi: 10.1186/s41232-023-00279-1
56. Beerman I, Bhattacharya D, Zandi S, Sigvardsson M, Weissman IL, Bryder D, et al. Functionally distinct hematopoietic stem cells modulate hematopoietic lineage potential during aging by a mechanism of clonal expansion. Proc Natl Acad Sci U.S.A. (2010) 107:5465–70. doi: 10.1073/pnas.1000834107
57. Pang WW, Price EA, Sahoo D, Beerman I, Maloney WJ, Rossi DJ, et al. Human bone marrow hematopoietic stem cells are increased in frequency and myeloid-biased with age. Proc Natl Acad Sci U.S.A. (2011) 108:20012–7. doi: 10.1073/pnas.1116110108
58. Baht GS, Vi L, Alman BA. The role of the immune cells in fracture healing. Curr Osteoporos Rep. (2018) 16:138–45. doi: 10.1007/s11914-018-0423-2
59. Frase D, Lee C, Nachiappan C, Gupta R, Akkouch A. The inflammatory contribution of B-lymphocytes and neutrophils in progression to osteoporosis. Cells. (2023) 12(13):1744. doi: 10.3390/cells12131744
60. Walsh MC, Choi Y. Biology of the RANKL-RANK-OPG system in immunity, bone, and beyond. Front Immunol. (2014) 5:511. doi: 10.3389/fimmu.2014.00511
61. Li Y, Toraldo G, Li A, Yang X, Zhang H, Qian WP, et al. B cells and T cells are critical for the preservation of bone homeostasis and attainment of peak bone mass in vivo. Blood. (2007) 109:3839–48. doi: 10.1182/blood-2006-07-037994
62. Bengtsson AK, Ryan EJ. Immune function of the decoy receptor osteoprotegerin. Crit Rev Immunol. (2002) 22:201–15.
63. Marcadet L, Bouredji Z, Argaw A, Frenette J. The roles of RANK/RANKL/OPG in cardiac, skeletal, and smooth muscles in health and disease. Front Cell Dev Biol. (2022) 10:903657. doi: 10.3389/fcell.2022.903657
64. Raggatt LJ, Partridge NC. Cellular and molecular mechanisms of bone remodeling. J Biol Chem. (2010) 285:25103–8. doi: 10.1074/jbc.R109.041087
65. Llorente I, Garcia-Castaneda N, Valero C, Gonzalez-Alvaro I, Castaneda S. Osteoporosis in rheumatoid arthritis: dangerous liaisons. Front Med (Lausanne). (2020) 7:601618. doi: 10.3389/fmed.2020.601618
66. Veis DJ, O'Brien CA. Osteoclasts, master sculptors of bone. Annu Rev Pathol. (2023) 18:257–81. doi: 10.1146/annurev-pathmechdis-031521-040919
67. Honda K, Yanai H, Negishi H, Asagiri M, Sato M, Mizutani T, et al. IRF-7 is the master regulator of type-I interferon-dependent immune responses. Nature. (2005) 434:772–7. doi: 10.1038/nature03464
68. Farlik M, Rapp B, Marie I, Levy DE, Jamieson AM, Decker T. Contribution of a TANK-binding kinase 1-interferon (IFN) regulatory factor 7 pathway to IFN-gamma-induced gene expression. Mol Cell Biol. (2012) 32:1032–43. doi: 10.1128/MCB.06021-11
69. Grabstein KH, Waldschmidt TJ, Finkelman FD, Hess BW, Alpert AR, Boiani NE, et al. Inhibition of murine B and T lymphopoiesis in vivo by an anti-interleukin 7 monoclonal antibody. J Exp Med. (1993) 178:257–64. doi: 10.1084/jem.178.1.257
70. Peschon JJ, Morrissey PJ, Grabstein KH, Ramsdell FJ, Maraskovsky E, Gliniak BC, et al. Early lymphocyte expansion is severely impaired in interleukin 7 receptor-deficient mice. J Exp Med. (1994) 180:1955–60. doi: 10.1084/jem.180.5.1955
71. von-Freeden-Jeffry U, Vieira P, Lucian LA, McNeil T, Burdach SE, Murray R. Lymphopenia in interleukin (IL)-7 gene-deleted mice identifies IL-7 as a nonredundant cytokine. J Exp Med. (1995) 181:1519–26. doi: 10.1084/jem.181.4.1519
72. Miller JP, Izon D, DeMuth W, Gerstein R, Bhandoola A, Allman D. The earliest step in B lineage differentiation from common lymphoid progenitors is critically dependent upon interleukin 7. J Exp Med. (2002) 196:705–11. doi: 10.1084/jem.20020784
73. Cordeiro Gomes A, Hara T, Lim VY, Herndler-Brandstetter D, Nevius E, Sugiyama T, et al. Hematopoietic stem cell niches produce lineage-instructive signals to control multipotent progenitor differentiation. Immunity. (2016) 45:1219–31. doi: 10.1016/j.immuni.2016.11.004
74. Pillai M, Torok-Storb B, Iwata M. Expression and function of IL-7 receptors in marrow stromal cells. Leuk Lymph. (2004) 45:2403–8. doi: 10.1080/10428190412331283189
Keywords: immune experience, bone healing, osteotomy, B cell, differentiation, adaptive immunity
Citation: Tchouto MN, Bucher CH, Mess A-K, Haas S, Schmidt-Bleek K, Duda GN, Beule D and Milek M (2025) Pronounced impairment of B cell differentiation during bone regeneration in adult immune experienced mice. Front. Immunol. 16:1511902. doi: 10.3389/fimmu.2025.1511902
Received: 16 October 2024; Accepted: 13 February 2025;
Published: 03 March 2025.
Edited by:
Rachel Maurie Gerstein, University of Massachusetts Medical School, United StatesReviewed by:
Kavita Rawat, Washington University in St. Louis, United StatesJackie Fretz, Yale University, United States
Copyright © 2025 Tchouto, Bucher, Mess, Haas, Schmidt-Bleek, Duda, Beule and Milek. This is an open-access article distributed under the terms of the Creative Commons Attribution License (CC BY). The use, distribution or reproduction in other forums is permitted, provided the original author(s) and the copyright owner(s) are credited and that the original publication in this journal is cited, in accordance with accepted academic practice. No use, distribution or reproduction is permitted which does not comply with these terms.
*Correspondence: Miha Milek, bWloYS5taWxla0BiaWgtY2hhcml0ZS5kZQ==