 Hiroyuki Teruya
 Hirofumi Shoda
 Takahiro Itamiya
 Yumi Tsuchida
 Tomohisa Okamura
 Keishi Fujio
- 1Department of Allergy and Rheumatology, Graduate School of Medicine, The University of Tokyo, Tokyo, Japan
- 2Department of Rheumatology, Tokyo Medical University Hospital, Tokyo, Japan
- 3Department of Functional Genomics and Immunological Diseases, Graduate School of Medicine, The University of Tokyo, Tokyo, Japan
Objective: To explore the relationship between physique and immunological disturbances in systemic lupus erythematosus (SLE), we analyzed the clinical, immunological and transcriptomic characteristics of patients with SLE in relation to body mass index (BMI).
Methods: Clinical characteristics were obtained from patient charts, and serum cytokine levels were measured. Phenotypes and transcriptomes of peripheral immune cells from patients with SLE in the ImmuNexUT database were analyzed in relation to BMI.
Results: Thirty-four SLE patients were included in the analysis. Fever and mucocutaneous symptoms were commonly observed in SLE patients with a low BMI. BMI was negatively correlated with the SLE disease activity (SLEDAI)-2K scores. Multiple regression analysis revealed that BMI was an independent explanatory variable for SLEDAI-2K scores, irrespective of anti-dsDNA antibody or complement levels. Although serum interferon (IFN)-alpha and IFN-gamma levels were negatively associated with BMI, causal mediation analysis showed that BMI had a direct effect on SLEDAI-2K scores, independent of IFN-alpha levels. Immunophenotyping indicated that BMI was primarily correlated with T cell subsets. BMI-related gene expression was mainly enriched in the regulatory T cells and B cell subsets. BMI was negatively correlated with several cellular metabolic pathways, including glucose metabolism-related pathways in Th1 and effector memory CD8+ T cells, but not with IFN signaling.
Conclusion: We characterized the clinical, immunological and transcriptomic profiles of SLE patients with varying BMI. As low BMI was identified as an independent parameter for explaining disease activity, cachexia is considered one of the systemic symptoms of active SLE. Additionally, BMI influenced the phenotypic and transcriptomic alterations of acquired immune cells, independent of IFN signaling. These findings provide insights into the pathogenesis of SLE.
1 Introduction
Systemic lupus erythematosus (SLE) is a systemic disorder that effects multiple organs and tissues, including nephritis, cutaneous lesions, serositis, and arthritis (1, 2). Autoimmune dysregulation plays a substantial role in the pathogenesis of SLE, particularly through the actions of immune cells and pro-inflammatory cytokines, which drive both organ-specific and systemic inflammation (1, 2). Among these cytokines, interferons (IFNs) are especially critical in the pathogenesis of SLE (3, 4). The IFN family comprises three types: type 1,2 and 3, each of which contributes to the pathogenesis of SLE. For instance, type 1 IFNs not only induce febrile reactions but also enhance autoimmune responses by activating autoantigen presentation on dendritic cells and promoting the differentiation of autoreactive B cell clones (5). Notably, anifrolumab, an anti-IFN RA monoclonal antibody, blocks type 1 IFN signaling and has shown efficacy in controlling disease activity in SLE (6, 7). Additionally, various immune cells, including B cells, T cells, monocytes, and neutrophils, also contribute to the pathogenesis of SLE (1, 2). In this way, immune dysregulation plays a pivotal role in the pathogenesis of SLE; however, the detailed mechanisms remain unclear.
Recently, the relationship between the physique and the immune system has become a focus of research, particularly in the context of obesity and immune dysregulation (8). For example, adipokines, secreted by adipocytes and muscle cells, can influence the immune system (9). In particular, leptin, secreted from adipocytes, not only regulates appetite, but also activates both innate and acquired immune cells, promoting inflammatory responses (10). In addition, increasing evidence suggests that obesity induces low-grade inflammation and alters immune cell functions (8, 11). For example, a recent study demonstrated that obesity had a promoting effect on Th2 and Th17-related diseases, such as atopic dermatitis (12). In regards of COVID-19 infection, obesity has been identified as a potent risk factor for severe disease (13). Several explanations for the role of obesity in disease have been proposed, and many researchers suggested that the activation of M1 macrophages and the excessive release of pro-inflammatory cytokines, such as IL-6 and TNF-alpha, are elevated in obese patients (14). In the field of autoimmune diseases, obesity is considered one of the major contributors to psoriasis (15). We have also reported Th17 cell activation and elevated IL-1 levels in obese rheumatoid arthritis patients (16). The relationship between physique and type 1 IFNs, which are key mediators of SLE pathogenesis and disease activity, is contradictory. For example, IFN-alpha promotes adipocyte-intrinsic inflammatory potential in the context of insulin resistance (17). On the other hand, some studies have found that type 1 IFN production is reduced in non-obese individuals compared to those with obesity (18). Certain researchers suggested that leptin suppresses type 1 IFN-related responses in obesity (19). Additionally, clinical observations examining the association between physique and disease activity in SLE patients have yielded mixed results (20–22). In the Hopkins Lupus Cohort, more than half of SLE patients exhibited cachexia, which was associated with various lupus manifestations and a higher damage index (20). Conversely, smaller studies have indicated that obesity may increase the risk of disease deterioration and flare-ups (21, 22). Thus, the relationship between physique and SLE remains controversial, and further investigation of physique-related immunological characteristics is required to clarify this connection.
We established a transcriptomic catalog of immune cells in autoimmune diseases, the Immune Cell Gene Expression Atlas from the University of Tokyo (ImmuNexUT) (23). The ImmuNexUT database allows for transcriptome analysis in autoimmune diseases, including SLE (24). This study aimed to analyze the transcriptomic and immunological characteristics of patients with SLE in relation to body mass index (BMI) using the ImmuNexUT database, with the goal of advancing our understanding of SLE pathogenesis and facilitating clinical applications, such as personalized medicine.
2 Materials and methods
2.1 Participants
Patients with new-onset or flare-up SLE, who were hospitalized at the University of Tokyo Hospital between September 2017 and June 2020, were enrolled in this study. All patients fulfilled the Systemic Lupus International Collaborating Clinics (SLICC) 2012 and the American College of Rheumatology (ACR) 2019 classification criteria for SLE (25, 26). Clinical and demographic information, such as BMI, laboratory data and SLE Disease Activity Index 2000 (SLEDAI-2K) scores (27) and their components were extracted from medical records. Written informed consent were obtained from all participants. This study was approved by our local ethics committees (11592, G10095) and was performed in accordance with the latest version of the Declaration of Helsinki.
2.2 ImmuNexUT
Transcriptome data of the participants were obtained from the ImmuNexUT database (23). Data of SLE patients, whose BMI data could be obtained, were utilized for transcriptomic analysis. Detailed information on ImmuNexUT has been previously described (23). RNA sequencing data were analyzed using the R version 4.3.3 (R Foundation for Statistical Computing). Using the MASS package, we calculated the genes related to BMI by regressing the expression levels of each subset of genes with BMI, age, daily dosage of prednisolone (PSL), and library size as explanatory variables. A false discovery rate (FDR) of < 0.01 was regarded as significant. Pathway analysis was performed using the ReactomePA package (28), and cell metabolism pathways were referenced from scMetabolism (29). Gene set variation analysis (GSVA) was performed to calculate the signature scores for these pathways (30).
2.3 Immunophenotyping
Immunophenotyping of peripheral blood cells was performed using a FACS Aria (BD Biosciences). The 24 immune cell subsets analyzed were as follows: naïve CD4+ T cells (naïve CD4), memory CD4+ T cells (Mem CD4), Th1 cells, Th2 cells, Th17 cells, T follicular helper cells (Tfh), fraction I naïve Tregs (Fr. I nTregs), fraction II effector Tregs (Fr. II eTregs), fraction III non-regulatory T cells (Fr. III T), naïve CD8+ T cells (naïve CD8), central memory CD8+ T cells (CM CD8), effector memory CD8+ T cells (EM CD8), NK cells, naïve B cells (naïve B), unswitched memory B cells (USM B), switched memory B cells (SM B), double negative B cells (DN B), plasmablasts (plasmablast), classical monocytes (CL Mono), intermediate monocytes (Int Mono), non-classical monocytes (NC Mono), myeloid dendritic cells (mDC), and plasmacytoid dendritic cells (pDC). The proportion of each subset was calculated. Detailed definitions of these subsets are provided in our previous article (31).
2.4 Measurement of serum cytokines and adipokines
Serum cytokines and functional proteins were measured using multiplex ELISA, Luminex assays (R&D Systems). Serum leptin and ghrelin levels were measured using ELISA (R&D systems).
2.5 Statistics
R (ver.4-3-3) was used for all statistical analyses. Differences between two groups of non-normally distributed continuous data were tested for significance with nonparametric Mann-Whitney U test or Fisher’s exact test. The BMI cutoff value was set at 20 in accordance with the previous study (32). Correlations were evaluated by nonparametric Spearman’s rank correlation coefficients. The contribution to the disease activities was analyzed by multiple regression analysis. Causal mediation analysis was explored by Package “Mediation” (33) and p-values were calculated via 1000-time bootstrapping. P values < 0.05 were considered significant.
3 Results
3.1 Characteristics of patients with SLE
Thirty-four patients with SLE were enrolled in the study, and their demographic and clinical information are summarized in Supplementary Table 1. Eighty-two percent of the patients were female with a mean age was 48.6 ± 14.6 years old. The mean SLEDAI-2K score was 11.8 ± 7.6. Fifty-two percent of the patients were taking glucocorticoid, with a mean daily doses of 6.3 ± 11.9. The mean BMI was 21.6 ± 2.9.
3.2 Association between disease activity and BMI in patients with SLE
First, the association between BMI and clinical parameters was analyzed in patients with SLE (Table 1). Fever and mucocutaneous symptoms were negatively correlated with BMI, and these symptoms were significantly more frequent in SLE patients with a lower BMI (Figure 1A). Importantly, SLEDAI-2K scores were significantly correlated with BMI (Figure 1B). Several previous studies and clinical experiences support the idea that serum anti-dsDNA antibody titers and complement levels are weighted and reliable indicators of disease activities in SLE (27, 34). Therefore, we examined the additional effect of BMI on these serum indicators to predict the SLEDAI-2K scores using multiple regression analysis (Table 2). When we performed multiple regression analysis on serum anti-dsDNA antibody titer and complement (CH50) levels (model 1), the coefficient of determination was 0.37 (p = 0.00037). Importantly, when we added BMI to these parameters (model 2), there was still a significant difference in BMI, and the coefficient of determination was 0.43 (p = 0.00018). We tested the significance of BMI by comparing two models using an analysis of variance. The inclusion of BMI in the model significantly improved the prediction of the SLEDAI-2K scores (p = 0.03987). Thus, it was demonstrated that low BMI was independently associated with disease activity in patients with active SLE, especially in those with fever and mucocutaneous symptoms.
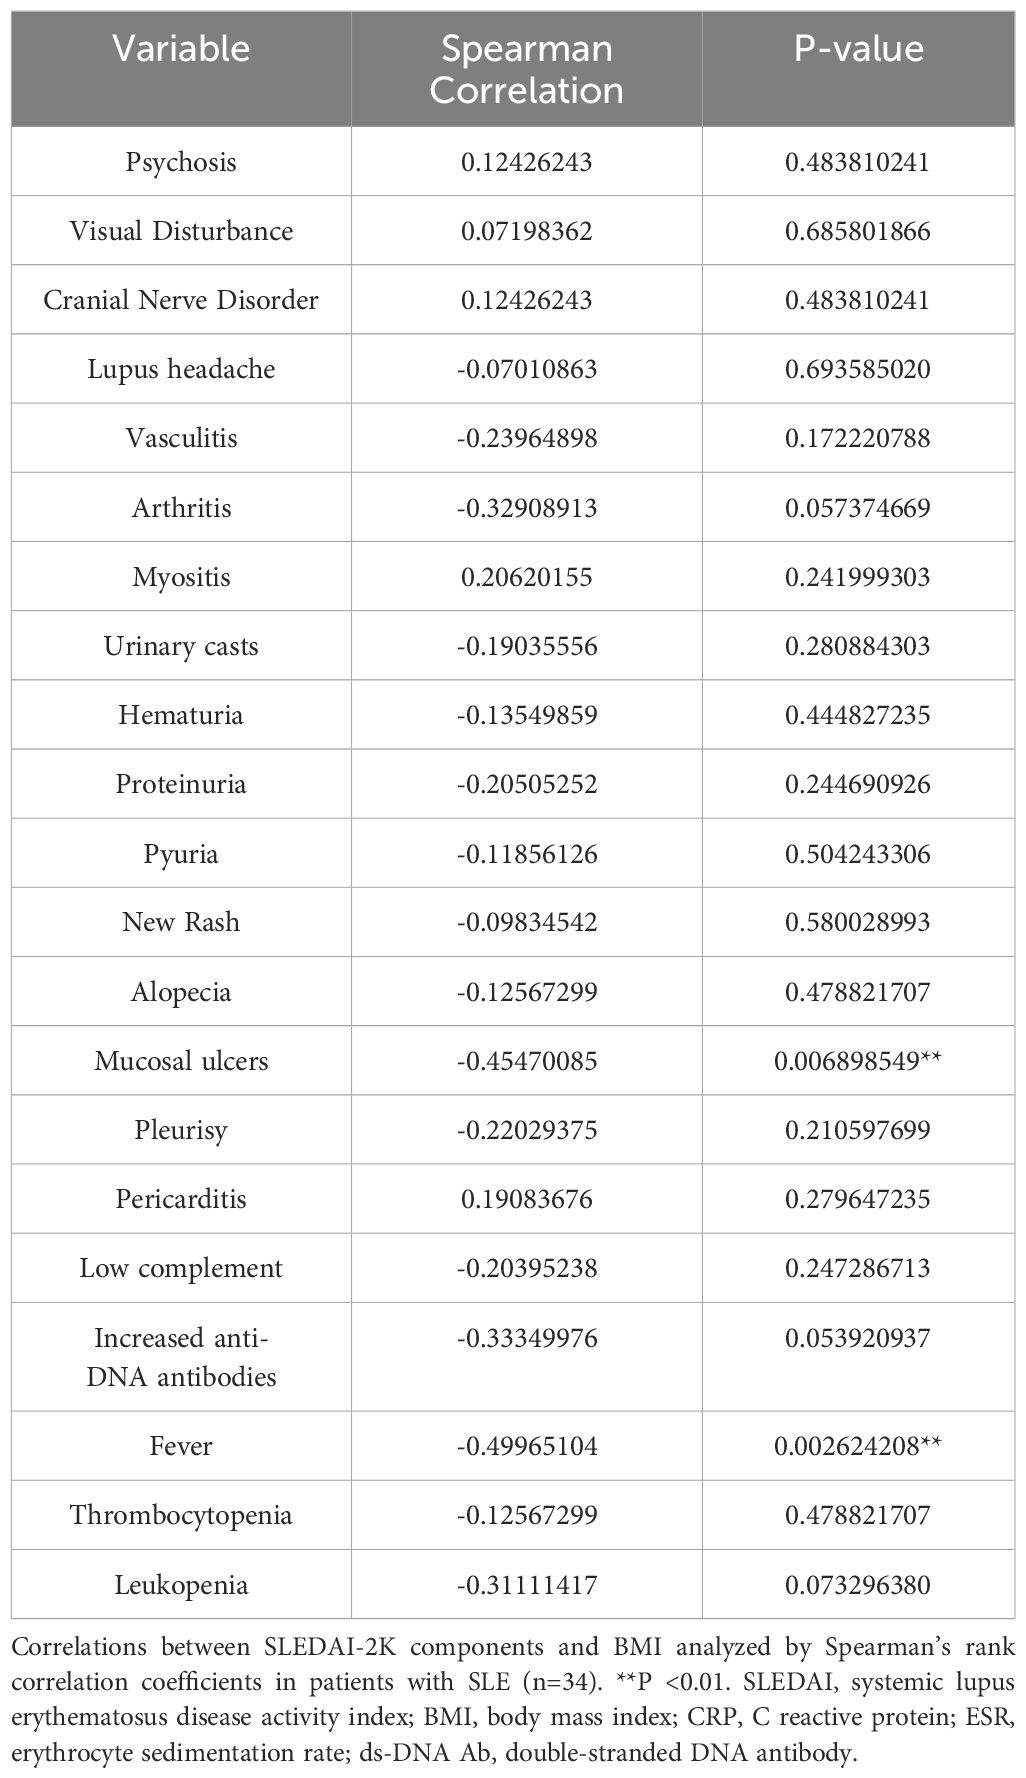
Table 1. The correlation between BMI and SLEDAI2K items.
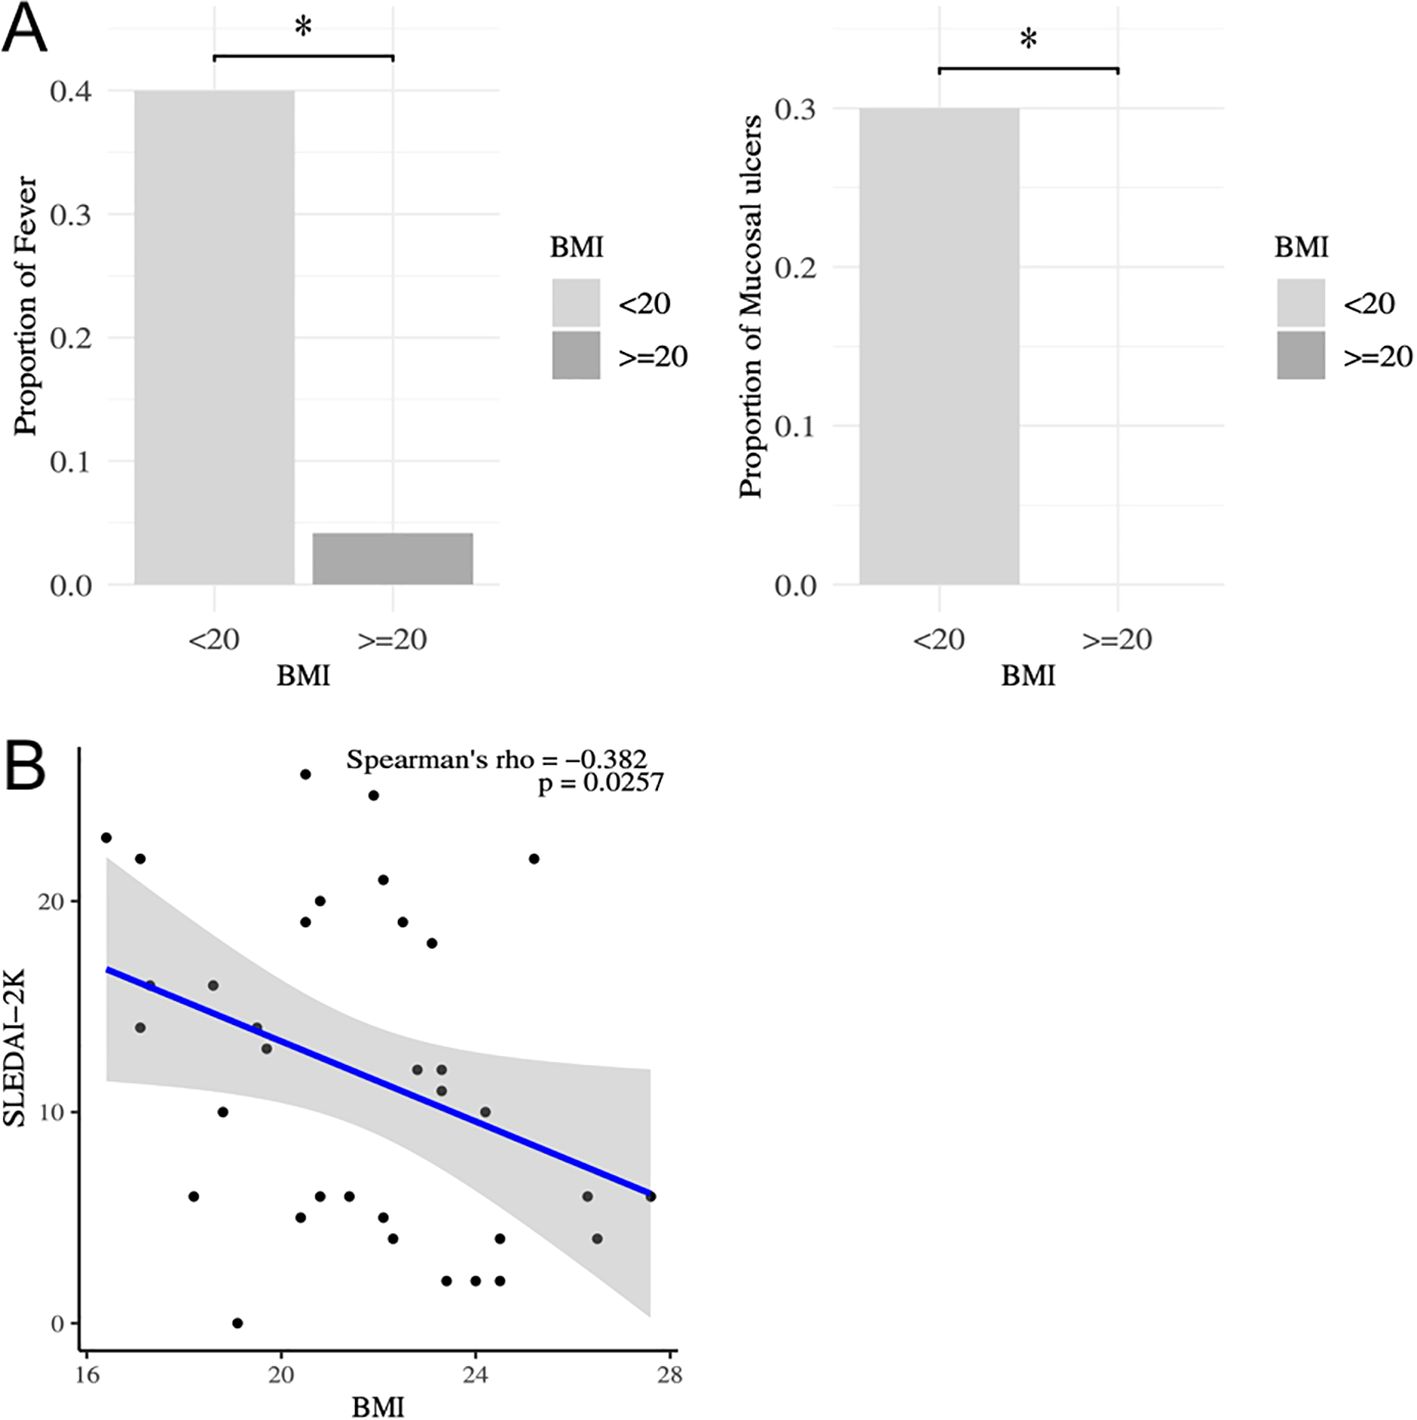
Figure 1. Correlation between SLEDAI-2K and BMI in patients with SLE. (A) Comparison of the frequencies of SLE symptoms between those with low BMI (BMI<20) and others by Fisher’ exact test. *P < 0.05. (B) Correlation between SLEDAI-2K and BMI analyzed by Spearman’s rank correlation coefficients in patients with SLE (n=34). Comparison of SLEDAI-2K between those with low BMI (BMI<20) and others by Mann-Whitney U-test. *P < 0.05. SLEDAI, systemic lupus erythematosus disease activity index; BMI, body mass index.
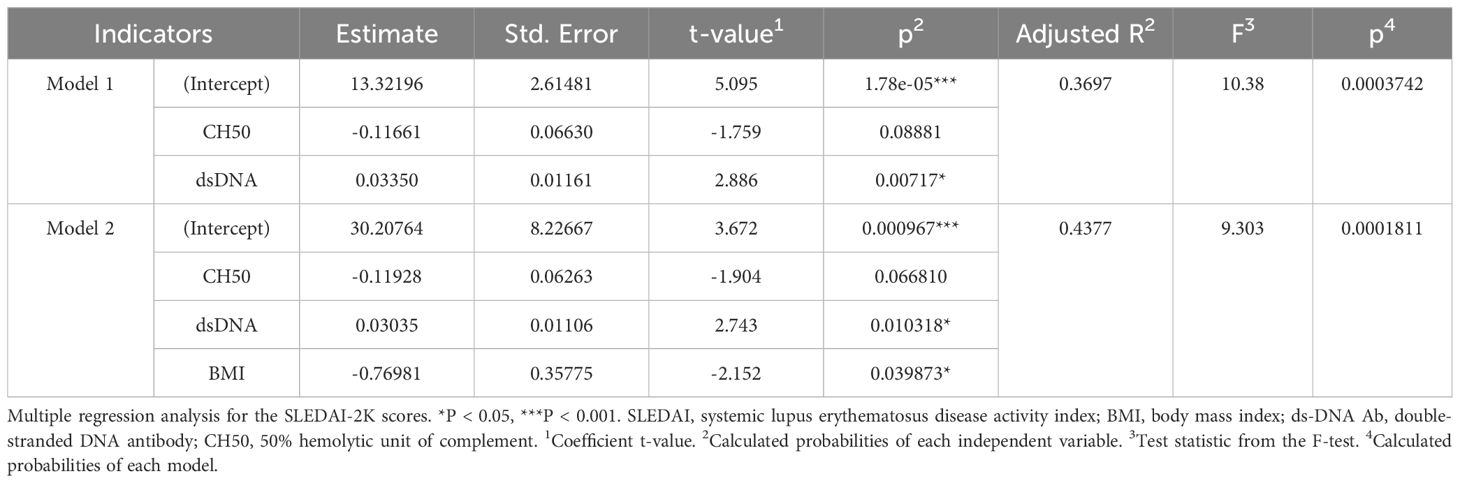
Table 2. The multiple regression analysis.
3.3 Association between serum cytokines and BMI in patients with SLE
Next, to elucidate the association between serum cytokines and BMI in patients with SLE, serum cytokines and adipokines, including leptin and ghrelin, were measured (Table 3). Serum IFN-alpha, IFN-gamma, and IL-12/23p40 levels were negatively correlated with BMI, whereas serum leptin and triggering receptor expressed on myeloid cells (TREM)-1 levels were positively correlated with BMI (Table 3). Serum IFN-alpha and IFN-gamma levels were significantly elevated in SLE patients with a BMI<20 compared to those with a BMI>20 (Figures 2A, B). Serum TREM-1 and leptin levels were significantly higher in SLE patients with a BMI>20 compared to those with a BMI<20 (Figures 2C, D). Taken together, BMI was associated with several serum cytokine levels in patients with SLE, especially higher serum IFN-alpha and IFN-gamma levels were observed in those with low body weight. Additionally, the association between serum cytokine levels and SLEDAI-2K scores was analyzed in patients with SLE (Supplementary Table 2). SLEDAI-2K scores significantly correlated with serum chemokines (CCL2, CX3CL1, and CXCL10), G-CSF, and IFN-alpha levels. Notably, these chemokines are induced in response to IFN stimulation (35). In the multiple regression analysis with SLEDAI-2K as the dependent variable and BMI and IFN-alpha as covariates, while the results did not reach statistical significance, BMI exhibited a tendency toward a greater absolute t-value compared to IFN-alpha (Supplementary Table 3). Importantly, causal mediation analysis revealed that BMI had a direct effect on SLEDAI-2K scores (beta -0.8866 (95%CI, -1.539, -0.002, p = 0.048), whereas no significant indirect effect was observed via IFN-alpha (beta -0.0635, 95%CI, -0.5213, 0.05, p = 0.150) (Figure 2E). This result suggested that other unknown BMI-related factors besides the IFN system may influence SLE disease activity.
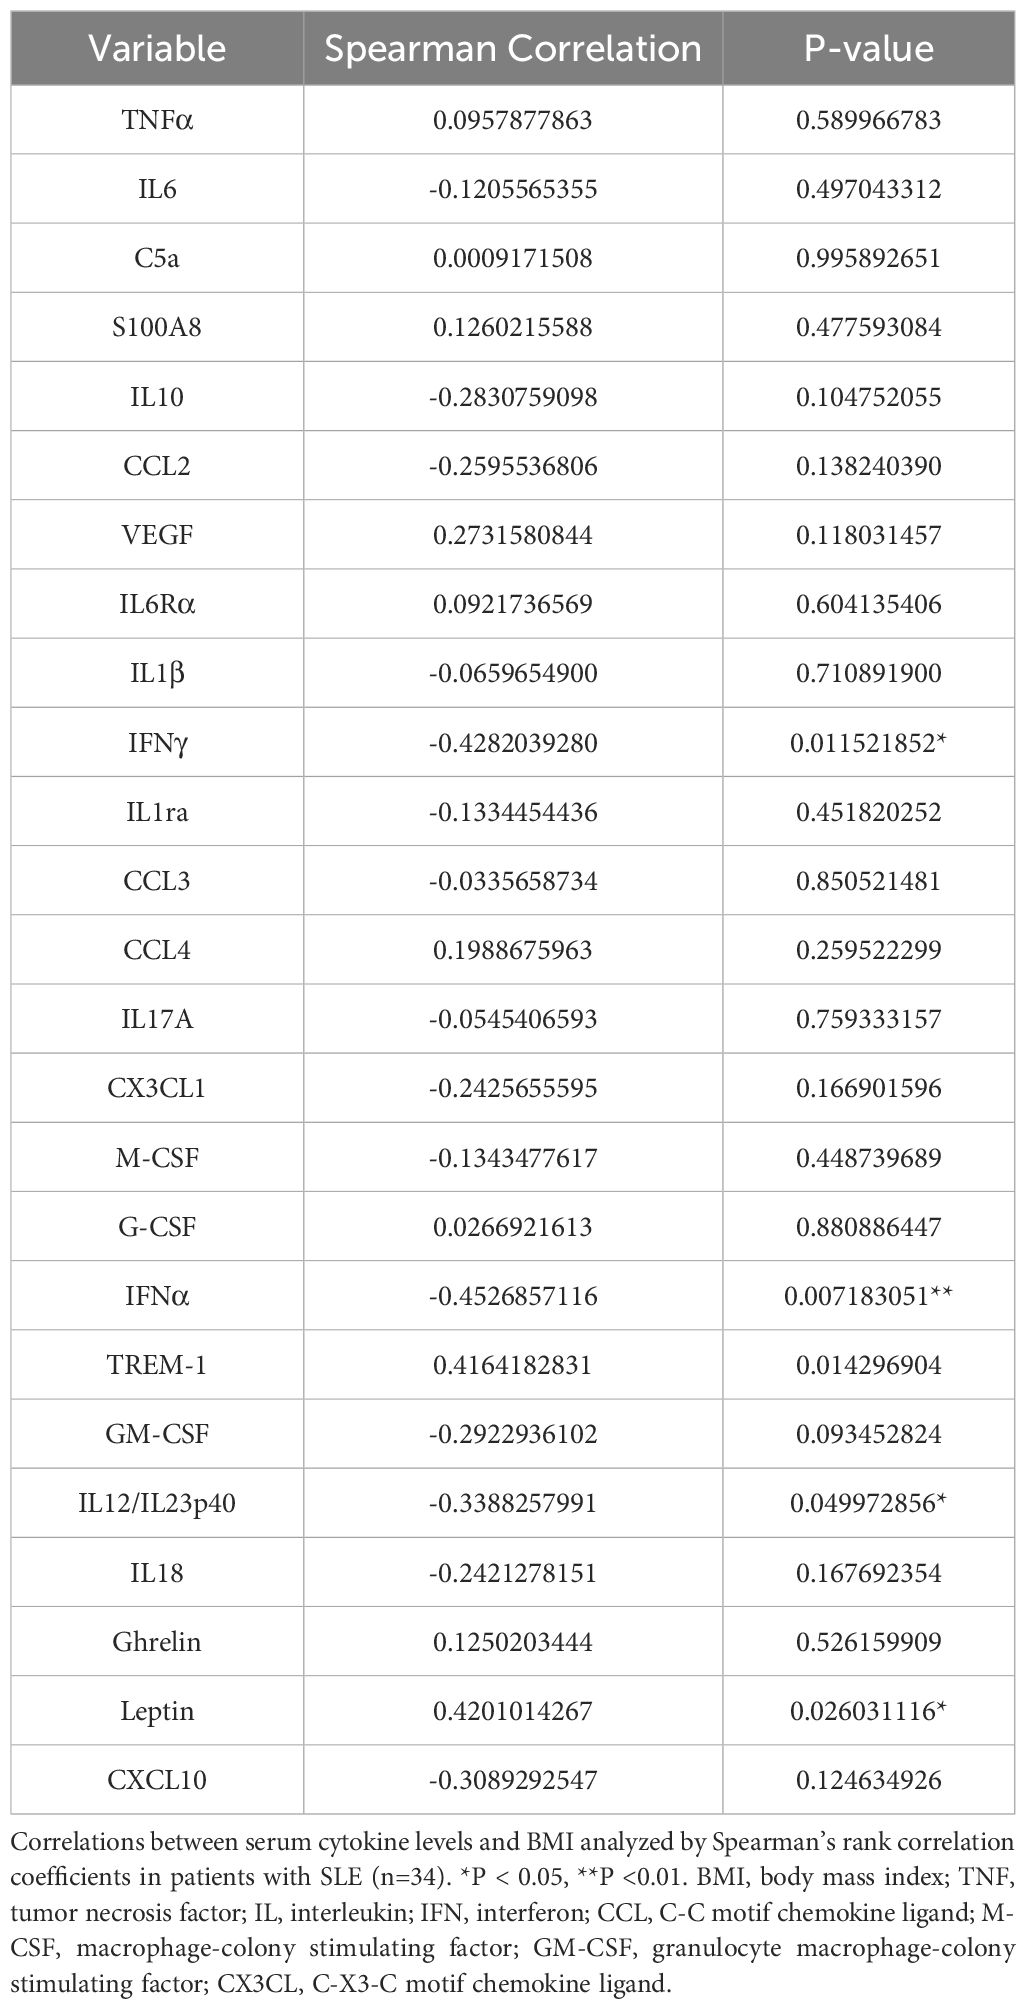
Table 3. The correlation between BMI and serum cytokines.
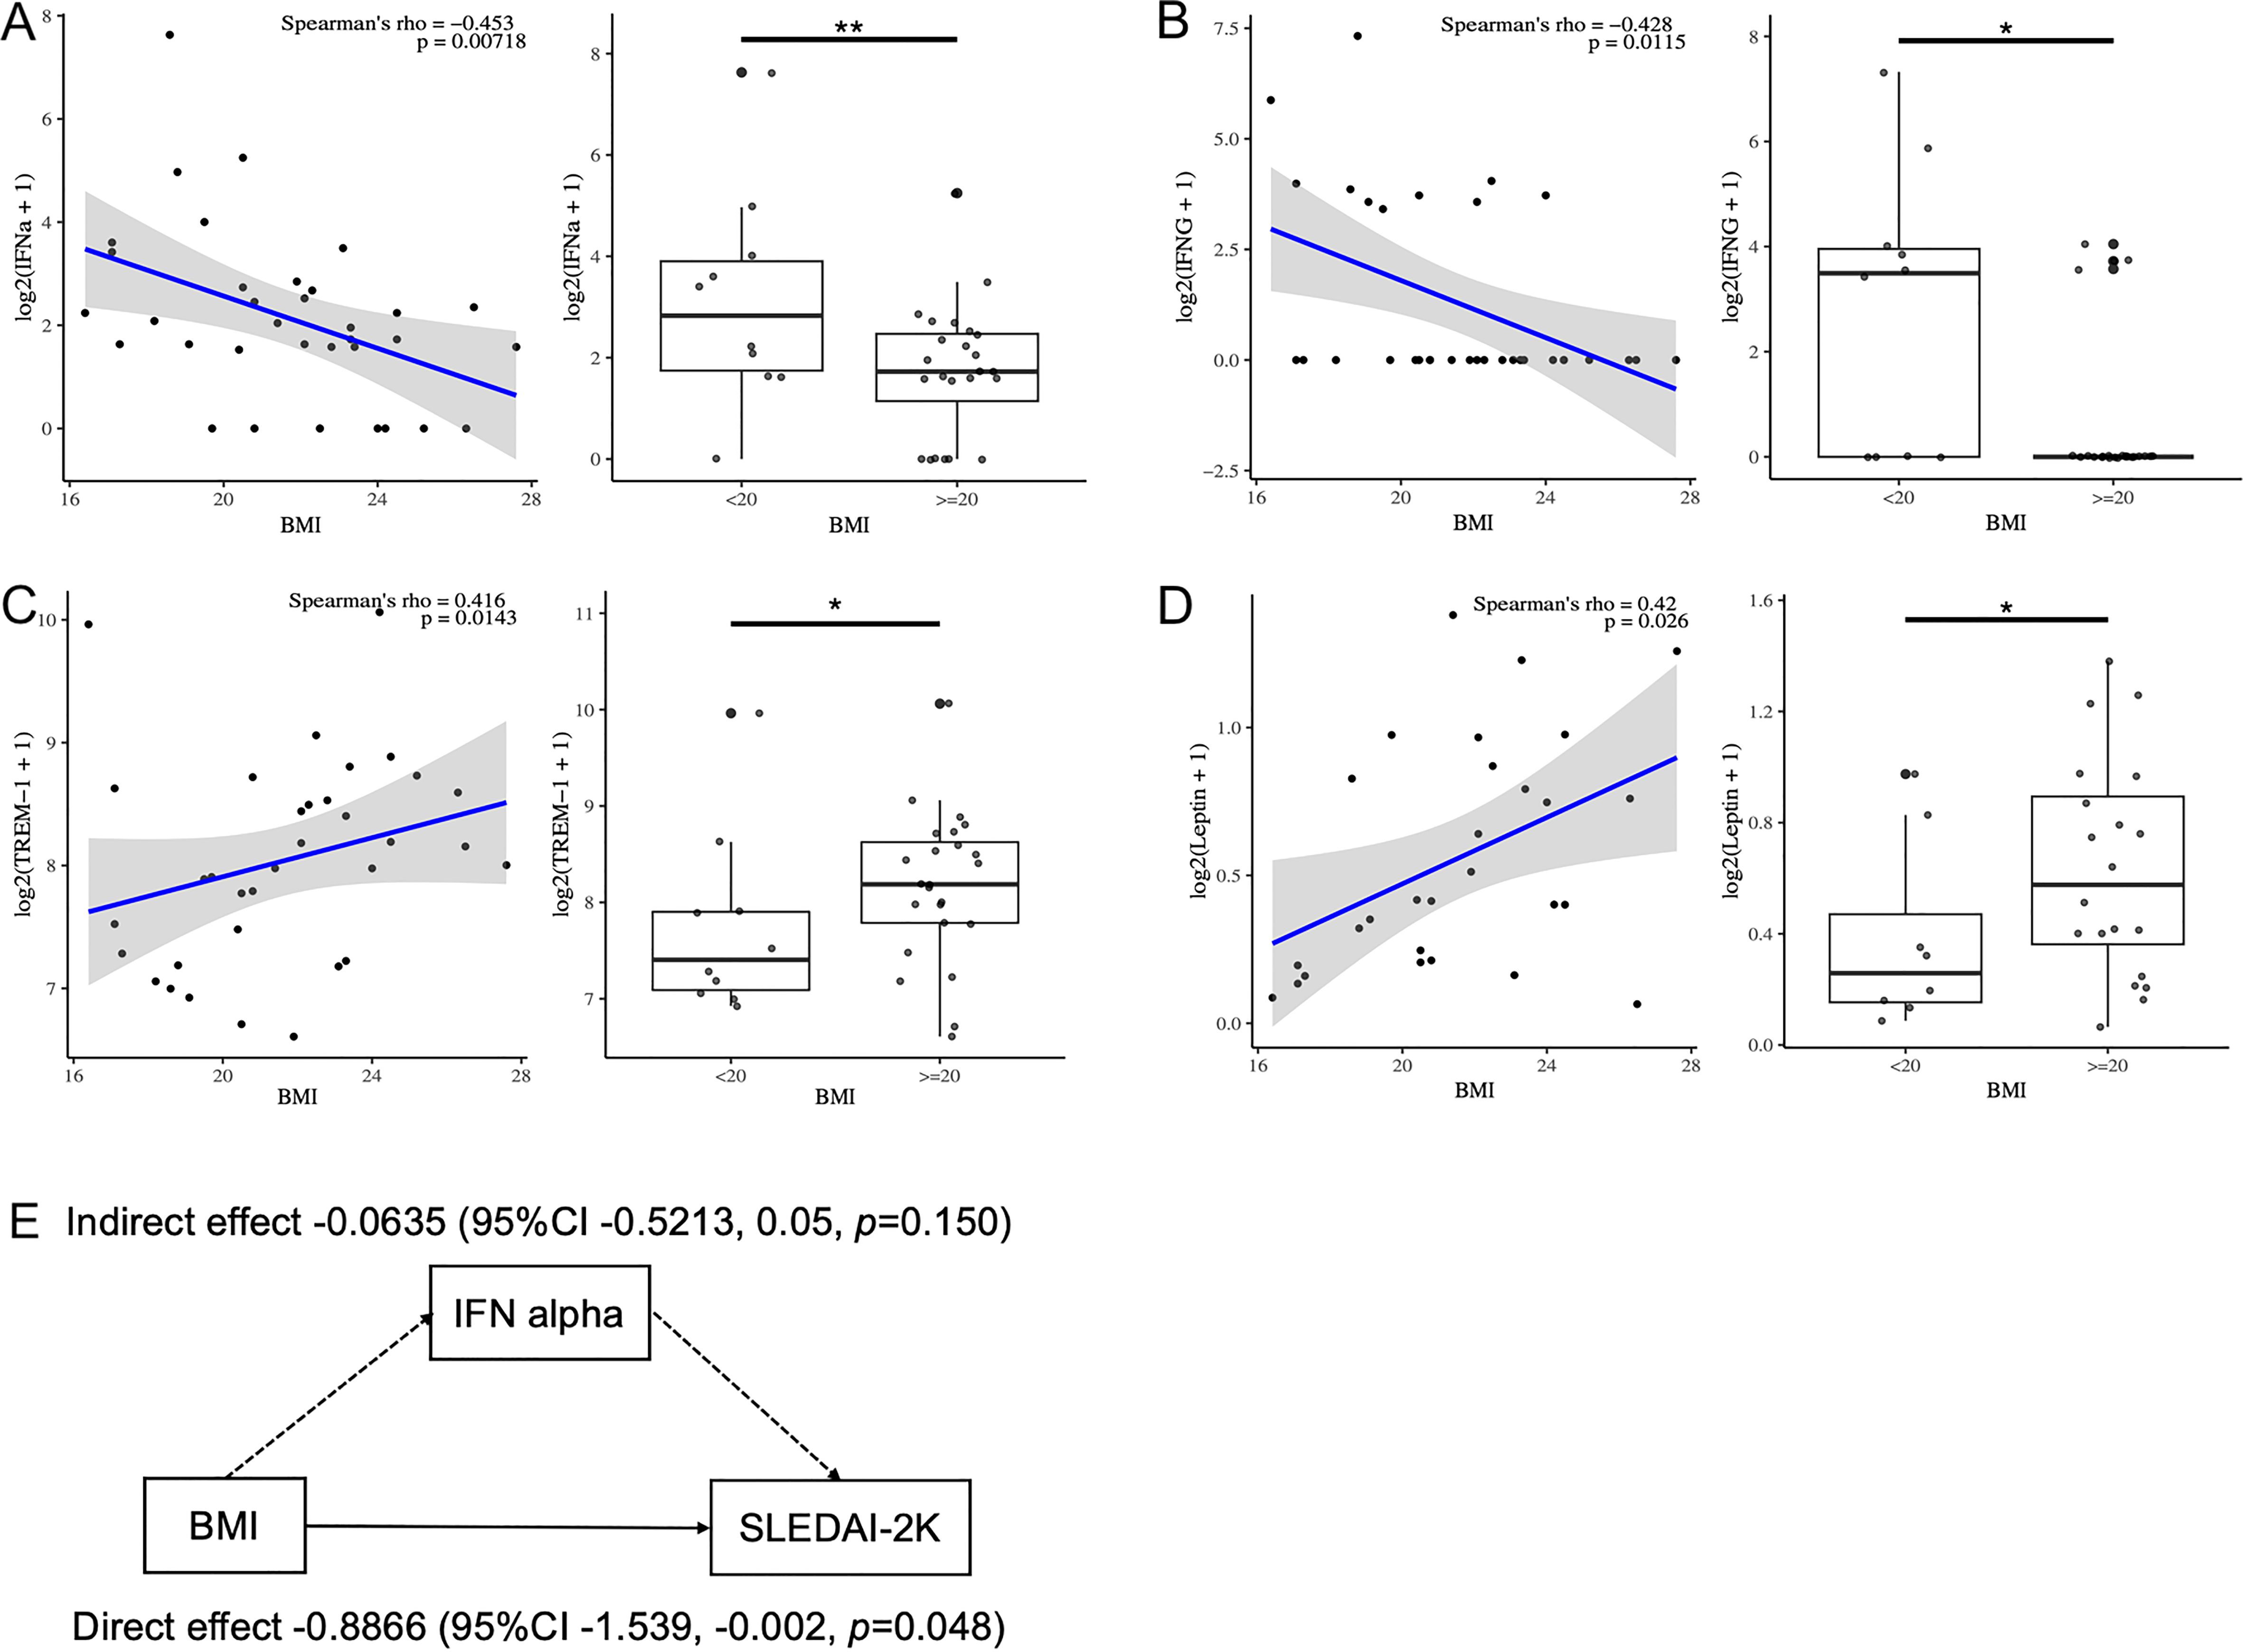
Figure 2. Correlation between serum cytokine levels and BMI in patients with SLE. (A–D) Correlation between serum IFN- a, IFN-g, leptin and TREM-1 levels and BMI analyzed by Spearman’s rank correlation coefficients in patients with SLE (n=34). Comparison of serum cytokine levels between those with low BMI (BMI<20) and others by Mann-Whitney U-test. (E) Diagram showing the results of causal mediation analysis. *P < 0.05, **P <0.01. BMI, body mass index; IFN, interferon; TREM, triggering receptor expressed on myeloid cells.
3.4 BMI-related phenotypic and transcriptomic alterations in patients with SLE
Next, we analyzed the association between the immunophenotyping of peripheral blood cells and BMI in patients with SLE (Figure 3A). BMI positively correlated with the frequencies of memory CD4+ T, Th17, effector memory (EM) CD8+ T, and NK cells. Whereas, BMI was negatively correlated with the frequencies of naïve CD4+ T, Th1, Fr. I nTreg, and naïve CD8+ T cells. Thus, BMI primarily influenced the altered frequencies of T cell subsets. Finally, we investigated BMI-related gene expression in the peripheral immune cells of patients with SLE on the ImmuNexUT database using the MASS package. Genes related to BMI were identified by regressing the gene expression levels of each subset against BMI, age, daily PSL dosage, and library size as explanatory variables. The numbers of these genes in each subset are shown in Figure 3B. BMI-related genes were enriched in cell subsets associated with the acquired immune system, including DNB, SM B, Fr. I nTreg, and Fr. II eTreg cells (Figure 3B). Pathway analysis of these BMI-related genes revealed subset-specific pathways, predominantly cellular metabolism-related pathways (Figure 3C, Supplementary Figure 1). For example, pathways involving BMI-negatively related genes included glucose metabolism-related pathways in Th1 and EMCD8 cells. In both subsets, Fr. I nTreg and Fr. II eTreg cells (Supplementary Figure 1), BMI was negatively correlated with phosphatidylinositol (PI)-related pathways. Importantly, these BMI-related pathways were primarily observed in cell subsets associated with the acquired immune system (Figure 3C, Supplementary Figure 1). Notably, the IFN signaling pathway was not associated with BMI in any cell subset, which aligned with the results of the mediation analysis (Figure 2E). Taken together, the ImmuNexUT database revealed that BMI-related phenotypic and transcriptomic alterations were predominantly observed in cell subsets related to the acquired immune system, especially in T cells, independently of IFN signaling.
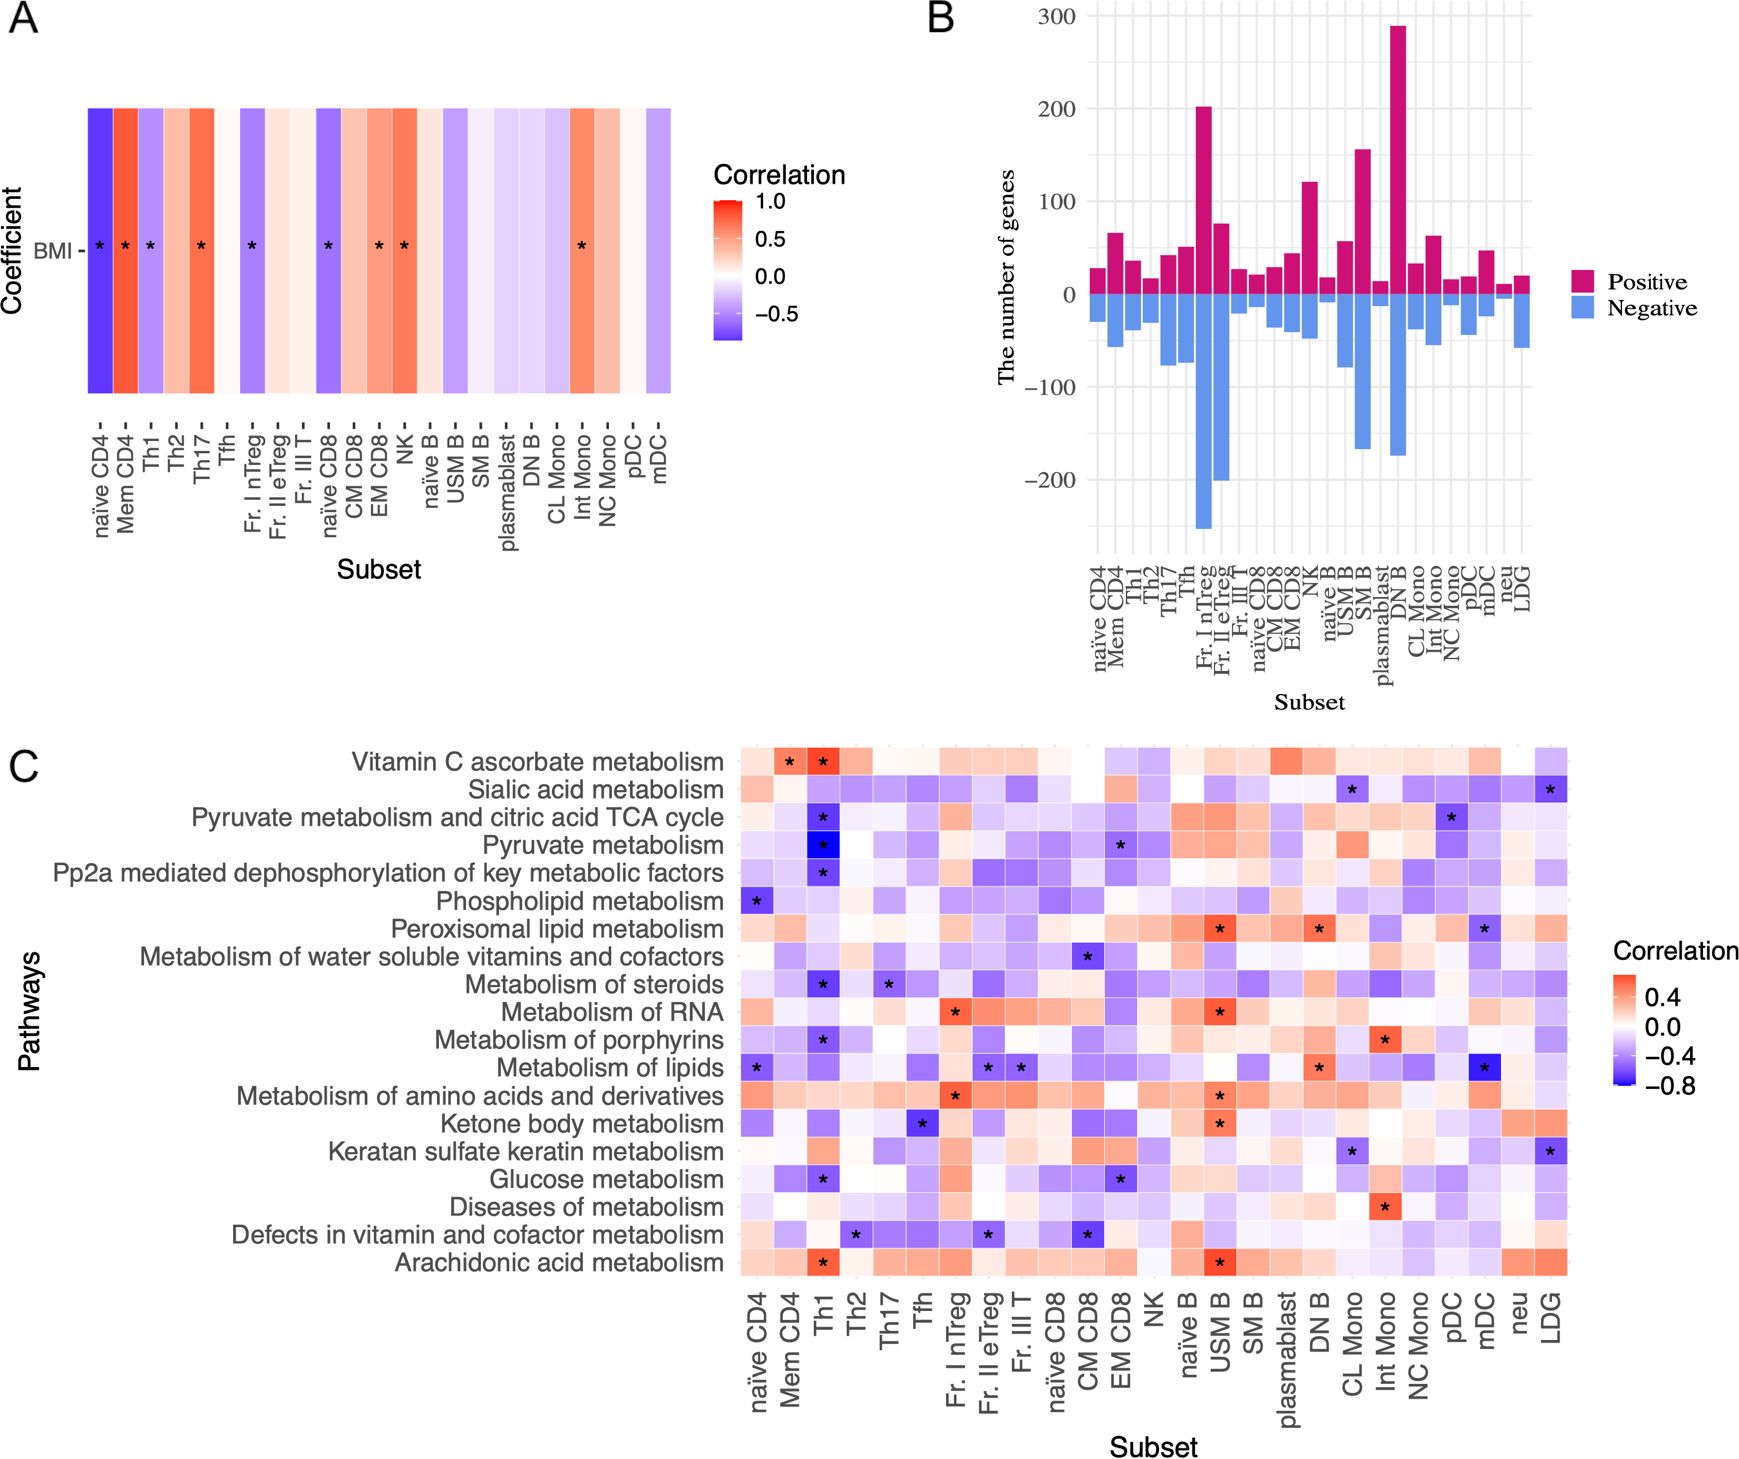
Figure 3. BMI-related immunological phenotypes and transcriptome analysis in patients with SLE. (A) Association between the frequencies of peripheral immune cell subsets and BMI analyzed by Spearman’s rank correlation coefficients. (B) The numbers of BMI-related gene expressions in each subset. Genes related to BMI were identified by regressing the expression levels of each subset gene against BMI, age, daily dosage of PSL, and library size as explanatory variables by the MASS package. A false discovery rate (FDR) of < 0.01 was regarded as significant. (C) Correlation between BMI and cell metabolism pathway and interferon signature scores analyzed by GSVA. Spearman’s rank correlation coefficients. Data with correlation coefficient >0.6 and p <0.05 are indicated. *P < 0.05. Abbreviations of cell subsets are listed in the Method section and the previous study (23, 31). BMI, body mass index; GSVA, gene-set variation analysis.
4 Discussion
There have been numerous reports on the association between autoimmune diseases and patient physique; however, the significance of BMI in SLE remains unclear. One report from the Southern California Lupus Registry (SCOLR) (n=157) indicated a significant association between obesity and SLEDAI on multivariate analysis (odds ratio = 2.335, p=0.026) (21). Additionally, a recent study summarized the impact of obesity on disease activity in SLE (36). In contrast, another report from the Hopkins lupus cohort (n=2452) demonstrated higher SLEDAI scores in patients with cachexia (20). The researchers indicated that more than half of patients with SLE exhibited cachexia, and intermittent cachexia was associated with higher damage index scores. They suggested that cachexia is an under-recognized syndrome of SLE. We speculated that this discrepancy could be due to differences in the patient backgrounds of the cohorts. For example, glucocorticoid intake has effects on body weight gain and the frequency of current glucocorticoid users may have influenced the results. In the SCOLR, obese patients showed higher frequencies and doses of glucocorticoid than non-obese patients (46.0% vs 27.6%, p=0.029) (21). Although this hypothesis requires further evaluation in different cohorts, our study supported the association between a low BMI and diseases activity in SLE. Additionally, the SLE patients with a low BMI showed elevated serum IFN-alpha levels. It is well documented that IFN-alpha induces body weight loss and cachexia. For example, therapeutic administration of IFN-alpha for viral hepatitis frequently leads to body weight loss and appetite reduction (37). We speculated that excess secretion of IFN-alpha due to disease exacerbation could trigger cachexia as one of the systemic syndromes of lupus. Importantly, we demonstrated that low BMI was one of the independent explanatory variables for SLEDAI-2K, suggesting that cachexia is an important symptom of active SLE. Furthermore, constitutional and mucocutaneous symptoms, which are closely related to IFN (38, 39), were more frequently observed in SLE patients with a low BMI in our study. Recently, the anti-IFN RA antibody has emerged as a treatment option for SLE, and many studies have focused on identifying patients who would benefit the most from anti-IFN therapy. Our study suggested that SLE patients with a low BMI could be good candidates for anti-IFN therapy as a form of personalized medicine.
We firstly analyzed the BMI-related phenotypic and transcriptomic alterations in patients with active SLE. These alterations were primarily observed in cells related to the acquired immune system, such as T cells and B cells. Especially, the frequencies and glucose metabolism-related pathways in Th1 and EMCD8+ T cells were negatively associated with BMI. BMI had a direct effect on SLEDAI-2K scores, therefore, we speculated that other mechanisms of BMI-related immune alterations exist, independent of IFN signaling. Our previous study demonstrated that Th1 and EMCD8 T cells exhibited significantly greater gene expression variance in the patients with high disease activity and mucocutaneous lesions (24). These observations suggest that cachexia-induced metabolic alterations in Th1 and EMCD8+ T cells could play a role in the pathogenesis of SLE patients with a low BMI. Furthermore, previous studies have highlighted the immune-metabolic crosstalk, especially in cancer and infection. During cachexia, several types of immune cells, including M2 macrophages and CD8+ T cells, are activated (40). Baazim H, et al. showed that CD8+ T cell activation and expansion trigger the body weight loss through muscle atrophy. Notably, CD8+ T cell deficiency protects against cachexia in a viral infection model (41). These findings were consistent with our results. Regarding Treg cells, our data suggested that PI-related pathways were negatively associated with BMI. The activation of PI/Akt signaling inhibits Foxo transcription and impairs the development and function of Treg cells (42), therefore, Treg cells in patients with low BMI may be compromised. Treg cells not only regulate autoimmune responses in SLE (43), but also play a protective role against muscle catabolism (40). Thus, BMI-related phenotypic and transcriptomic alterations in cells related to the acquired immune response could contribute to cachexia as well as the pathogenesis of active SLE, independent of IFN signaling. Further studies are required to confirm these findings.
This study had some limitations. First, the number of patients with SLE was relatively small, which may have influenced the results. However, this study was the first to analyze the transcriptomic characteristics of patients with SLE in terms of body weight, and we believed that the transcriptome data from various immune cells provided valuable insights. Second, all the analyzed patients were of Asian descent, and the mean BMI was relatively low. Further studies are required to evaluate the effects of BMI on the pathogenesis of SLE in other populations. Third, the detailed mechanisms by which the physique induces phenotypic and transcriptomic alterations remain unclear. We suspected that the alterations in cell metabolism may be related, and our pathway analysis yielded consistent results. A fourth limitation of this study is the lack of consideration for cumulative steroid intake. Some of the recruited patients had received treatment at other hospitals at the onset of the disease, making it impossible to obtain accurate information on the cumulative steroid intake for all participants. Although this is beyond the scope of this study, further studies are required to address this issue.
In conclusion, we described the transcriptomic, immunological, and clinical characteristics associated with BMI in patients with SLE. Our analysis highlighted several distinct immunological features of active SLE patients with a low BMI. We found that serum levels of IFN-alpha were significantly elevated in SLE patients with a lower BMI, suggesting that low BMI, or cachexia, could be an explanatory factor for disease activity. Additionally, we revealed phenotypic and transcriptomic alterations, particularly in the cell subsets of the acquired immune system. These alterations in immune cells could contribute to both disease exacerbation and cachexia in SLE patients with a low BMI. Our findings emphasize the close association between physique, the acquired immune system, and autoimmune diseases, providing promising insights for personalized medicine in SLE.
Data availability statement
The datasets presented in this study can be found in online repositories. The names of the repository/repositories and accession number(s) can be found below: http://humandbs.biosciencedbc.jp/en, E-GEAD-397.
Ethics statement
The studies involving humans were approved by the Ethics Committees of the University of Tokyo. The studies were conducted in accordance with the local legislation and institutional requirements. The participants provided their written informed consent to participate in this study.
Author contributions
HT: Conceptualization, Data curation, Formal analysis, Investigation, Methodology, Visualization, Writing – original draft, Writing – review & editing. HS: Writing – original draft, Writing – review & editing. TI: Writing – review & editing. YT: Writing – review & editing. TO: Writing – review & editing. KF: Writing – review & editing.
Funding
The author(s) declare financial support was received for the research, authorship, and/or publication of this article. This research was supported by funding from the Ministry of Health, Labour and Welfare, Ministry of Education, Culture, Sports, Science and Technology KAKENHI Grant-in-Aid for Scientific Research (C) (23K07906) from the Japan Society for the Promotion of Science. Transcriptome analysis was performed in collaboration with Chugai Pharmaceutical Co., Ltd.
Acknowledgments
We thank all the study participants and all the members of the recruitment sites for the collection of clinical data. The supercomputing resource SHIROKANE was provided by the Human Genome Center at The University of Tokyo.
Conflict of interest
TI and TO belonged to the Social Cooperation Program of the Department of Functional Genomics and Immunological Diseases, supported by Chugai Pharmaceutical. KF has received speaking fees, honoraria, and research grants from Chugai Pharmaceutical.
The remaining authors declare that the research was conducted in the absence of any commercial or financial relationships that could be construed as a potential conflict of interest.
Generative AI statement
The author(s) declare that no Generative AI was used in the creation of this manuscript.
Publisher’s note
All claims expressed in this article are solely those of the authors and do not necessarily represent those of their affiliated organizations, or those of the publisher, the editors and the reviewers. Any product that may be evaluated in this article, or claim that may be made by its manufacturer, is not guaranteed or endorsed by the publisher.
Supplementary material
The Supplementary Material for this article can be found online at: https://www.frontiersin.org/articles/10.3389/fimmu.2025.1503559/full#supplementary-material
Supplementary Table 1 | Clinical information. Clinical information of patients with SLE. Data are presented as the number (percentage) of patients, unless otherwise indicated. SD, standard deviation.
Supplementary Table 2 | Correlation between serum cytokine levels and SLEDAI-2K. The Correlation between serum cytokine levels and the SLEDAI-2K components analyzed by Spearman’s rank correlation coefficients in patients with SLE (n=34). *P < 0.05, **P <0.01, ***P <0.001. SLEDAI, systemic lupus erythematosus disease activity index; BMI, body mass index; CRP, C reactive protein; ESR, erythrocyte sedimentation rate; ds-DNA Ab, double-stranded DNA antibody.
Supplementary Figure 1 | The BMI-related pathways in patients with SLE. Correlation between BMI, and cell metabolism pathways and interferon signature scores analyzed by GSVA. Spearman’s rank correlation coefficients. *P < 0.05.
References
1. Tsokos GC. Systemic lupus erythematosus. N Engl J Med. (2011) 365:2110–21. doi: 10.1056/nejmra1100359
2. Kaul A, Gordon C, Crow MK, Touma Z, Urowitz MB, Van Vollenhoven R, et al. Systemic lupus erythematosus. Nat Rev Dis Primers. (2016) 2. doi: 10.1038/nrdp.2016.39
3. Tanaka Y, Kusuda M, Yamaguchi Y. Interferons and systemic lupus erythematosus: pathogenesis, clinical features, and treatments in interferon-driven disease. Mod Rheumatol. (2023) 33:857–67. doi: 10.1093/mr/roac140
4. Crow MK. Pathogenesis of systemic lupus erythematosus: risks, mechanisms and therapeutic targets. Ann Rheum Dis. (2023) 82:999–1014. doi: 10.1136/ard-2022-223741
5. Rönnblom L, Leonard D. Interferon pathway in Sle: one key to unlocking the mystery of the disease. Lupus Sci Med. (2019) 6. doi: 10.1136/lupus-2018-000270
6. Morand EF, Furie R, Tanaka Y, Bruce IN, Askanase AD, Richez C, et al. Trial of anifrolumab in active systemic lupus erythematosus. N Engl J Med. (2020) 382:211–21. doi: 10.1056/nejmoa1912196
7. Baker T, Sharifian H, Newcombe PJ, Gavin PG, Lazarus MN, Ramaswamy M, et al. Type I interferon blockade with anifrolumab in patients with systemic lupus erythematosus modulates key immunopathological pathways in a gene expression and proteomic analysis of two phase 3 trials. Ann Rheum Dis. (2024) 83:1018–27. doi: 10.1136/ard-2023-225445
8. Shaikh SR, Beck MA, Alwarawrah Y, MacIver NJ. Emerging mechanisms of obesity-associated immune dysfunction. Nat Rev Endocrinol. (2024) 20:136–48. doi: 10.1038/s41574-023-00932-2
9. Ouchi N, Parker JL, Lugus JJ, Walsh K. Adipokines in inflammation and metabolic disease. Nat Rev Immunol. (2011) 11:85–97. doi: 10.1038/nri2921
10. Francisco V, Pino J, Campos-Cabaleiro V, Ruiz-Fernández C, Mera A, Gonzalez-Gay MA, et al. Obesity, fat mass and immune system: role for leptin. Front Physiol. (2018) 9:640. doi: 10.3389/fphys.2018.00640
11. Saltiel AR, Olefsky JM. Inflammatory mechanisms linking obesity and metabolic disease. J Clin Invest. (2017) 127:1–4. doi: 10.1172/JCI92035
12. Bapat SP, Whitty C, Mowery CT, Liang Y, Yoo A, Jiang Z, et al. Obesity alters pathology and treatment response in inflammatory disease. Nature. (2022) 604:337–42. doi: 10.1038/s41586-022-04536-0
13. Belanger MJ, Hill MA, Angelidi AM, Dalamaga M, Sowers JR, Mantzoros CS. Covid-19 and disparities in nutrition and obesity. N Engl J Med. (2020) 383:e69. doi: 10.1056/NEJMp2021264
14. Maurya R, Sebastian P, Namdeo M, Devender M, Gertler A. Covid-19 severity in obesity: leptin and inflammatory cytokine interplay in the link between high morbidity and mortality. Front Immunol. (2021) 12:649359. doi: 10.3389/fimmu.2021.649359
15. Griffiths CEM, Armstrong AW, Gudjonsson JE, Barker JNWN. Psoriasis. Lancet. (2021) 397:1301–15. doi: 10.1016/S0140-6736(20)32549-6
16. Shoda H, Nagafuchi Y, Tsuchida Y, Sakurai K, Sumitomo S, Fujio K, et al. Increased serum concentrations of Il-1 Beta, Il-21 and Th17 cells in overweight patients with rheumatoid arthritis. Arthritis Res Ther. (2017) 19:111. doi: 10.1186/s13075-017-1308-y
17. Chan CC, Damen MSMA, Moreno-Fernandez ME, Stankiewicz TE, Cappelletti M, Alarcon PC, et al. Type I interferon sensing unlocks dormant adipocyte inflammatory potential. Nat Commun. (2020) 11:2745. doi: 10.1038/s41467-020-16571-4
18. Teran-Cabanillas E, Montalvo-Corral M, Caire-Juvera G, Moya-Camarena SY, Hernández J. Decreased interferon-α and interferon-β Production in obesity and expression of suppressor of cytokine signaling. Nutrition. (2013) 29:207–12. doi: 10.1016/j.nut.2012.04.019
19. Terán-Cabanillas E, Hernández J. Role of leptin and socs3 in inhibiting the type I interferon response during obesity. Inflammation. (2017) 40:58–67. doi: 10.1007/s10753-016-0452-x
20. Stojan G, Li J, Wittmaack A, Petri M. Cachexia in systemic lupus erythematosus: risk factors and relation to disease activity and damage. Arthritis Care Res (Hoboken). (2021) 73:1577–82. doi: 10.1002/acr.24395
21. Teh P, Zakhary B, Sandhu VK. The impact of obesity on sle disease activity: findings from the southern California lupus registry (Scolr). Clin Rheumatol. (2019) 38:597–600. doi: 10.1007/s10067-018-4336-3
22. Oh Chan K, Min-Chan P. Patients with systemic lupus erythematosus who are underweight have distinct disease characteristics. Lupus. (2024) 33:68–74. doi: 10.1177/09612033231220726
23. Ota M, Nagafuchi Y, Hatano H, Ishigaki K, Terao C, Takeshima Y, et al. Dynamic landscape of immune cell-specific gene regulation in immune-mediated diseases. Cell. (2021) 184:3006–21.e17. doi: 10.1016/j.cell.2021.03.056
24. Nakano M, Ota M, Takeshima Y, Iwasaki Y, Hatano H, Nagafuchi Y, et al. Distinct transcriptome architectures underlying lupus establishment and exacerbation. Cell. (2022) 185(18):3375–89.e21. doi: 10.1016/J.CELL.2022.07.021
25. Petri M, Orbai AM, Alarcõn GS, Gordon C, Merrill JT, Fortin PR, et al. Derivation and validation of the systemic lupus international collaborating clinics classification criteria for systemic lupus erythematosus. Arthritis Rheum. (2012) 64:2677–86. doi: 10.1002/art.34473
26. Aringer M, Costenbader K, Daikh D, Brinks R, Mosca M, Ramsey-Goldman R, et al. 2019 European league against rheumatism/American college of rheumatology classification criteria for systemic lupus erythematosus. Arthritis Rheumatol. (2019) 71:1400–12. doi: 10.1002/art.40930
27. Gladman DD, Ibañez D, Urowitz MB. Systemic lupus erythematosus disease activity index 2000. J Rheumatol. (2002) 29:288–91.
28. Yu G, He Q-Y. Reactomepa: an R/bioconductor package for reactome pathway analysis and visualization. Mol Biosyst. (2016) 12:477–9. doi: 10.1039/c5mb00663e
29. Wu Y, Yang S, Ma J, Chen Z, Song G, Rao D, et al. Spatiotemporal immune landscape of colorectal cancer liver metastasis at single-cell level. Cancer Discovery. (2022) 12:134–53. doi: 10.1158/2159-8290.CD-21-0316
30. Hänzelmann S, Castelo R, Guinney J. Gsva: gene set variation analysis for microarray and Rna-Seq data. BMC Bioinf. (2013) 14:7. doi: 10.1186/1471-2105-14-7
31. Izuka S, Komai T, Itamiya T, Ota M, Nagafuchi Y, Shoda H, et al. Machine learning-driven immunophenotypic stratification of mixed connective tissue disease corroborating the clinical heterogeneity. Rheumatol (Oxford). (2024) 13:keae158. doi: 10.1093/rheumatology/keae158
32. Berrington de Gonzalez A, Hartge P, Cerhan JR, Flint AJ, Hannan L, MacInnis RJ, et al. Body-mass index and mortality among 1.46 million white adults. N Engl J Med. (2010) 363:2211–9. doi: 10.1056/NEJMoa1000367
33. Tingley D, Yamamoto T, Hirose K, Keele L, Imai K. Mediation: rpackage for causal mediation analysis. J Stat Softw. (2014) 59:1–38. doi: 10.18637/jss.v059.i05
34. Jesus D, Matos A, Henriques C, Zen M, Larosa M, Iaccarino L, et al. Derivation and validation of the Sle disease activity score (Sle-das): A new sle continuous measure with high sensitivity for changes in disease activity. Ann Rheum Dis. (2018) 78(3):365–71. doi: 10.1136/annrheumdis-2018-214502
35. Bauer JW, Petri M, Batliwalla FM, Koeuth T, Wilson J, Slattery C, et al. Interferon-regulated chemokines as biomarkers of systemic lupus erythematosus disease activity: A validation study. Arthritis Rheum. (2009) 60:3098–107. doi: 10.1002/art.24803
36. Medeiros M, Souza K, Galdino OA, Cobucci RN, de Rezende AA. Impact of overweight and obesity on disease activity and remission in systemic lupus erythematosus: A systematic review and meta-analysis protocol. PLoS One. (2023) 18:e0287753. doi: 10.1371/journal.pone.0287753
37. Seyam MS, Freshwater DA, O’Donnell K, Mutimer DJ. Weight loss during pegylated interferon and ribavirin treatment of chronic hepatitis C. J Viral Hepat. (2005) 12:531–5. doi: 10.1111/j.1365-2893.2005.00637.x
38. Li QZ, Zhou J, Lian Y, Zhang B, Branch VK, Carr-Johnson F, et al. Interferon signature gene expression is correlated with autoantibody profiles in patients with incomplete lupus syndromes. Clin Exp Immunol. (2010) 159:281–91. doi: 10.1111/j.1365-2249.2009.04057.x
39. Smith MA, Chiang C-C, Zerrouki K, Rahman S, White WI, Streicher K, et al. Using the circulating proteome to assess type I interferon activity in systemic lupus erythematosus. Sci Rep. (2020) 10:4462. doi: 10.1038/s41598-020-60563-9
40. Baazim H, Antonio-Herrera L, Bergthaler A. The interplay of immunology and cachexia in infection and cancer. Nat Rev Immunol. (2022) 22:309–21. doi: 10.1038/s41577-021-00624-w
41. Baazim H, Schweiger M, Moschinger M, Xu H, Scherer T, Popa A, et al. Cd8+ T cells induce cachexia during chronic viral infection. Nat Immunol. (2019) 20:701–10. doi: 10.1038/s41590-019-0397-y
42. Sauer S, Bruno L, Hertweck A, Finlay D, Leleu M, Spivakov M, et al. T cell receptor signaling controls Foxp3 expression via Pi3k, Akt, and Mtor. Proc Natl Acad Sci U S A. (2008) 105:7797–802. doi: 10.1073/pnas.0800928105
Keywords: SLE, type I interferon, obese, cachexia, acquired immunity, transcriptome, immunophenotyping
Citation: Teruya H, Shoda H, Itamiya T, Tsuchida Y, Okamura T and Fujio K (2025) Body weight in systemic lupus erythematosus is associated with disease activity and the adaptive immune system, independent of type I IFN. Front. Immunol. 16:1503559. doi: 10.3389/fimmu.2025.1503559
Received: 30 September 2024; Accepted: 23 January 2025;
Published: 18 February 2025.
Edited by:
Alenka Gagro, Children’s Hospital Zagreb, CroatiaReviewed by:
Ryusuke Yoshimi, Yokohama City University, JapanZeljka Kardum, General Hospital Zadar, Croatia
Copyright © 2025 Teruya, Shoda, Itamiya, Tsuchida, Okamura and Fujio. This is an open-access article distributed under the terms of the Creative Commons Attribution License (CC BY). The use, distribution or reproduction in other forums is permitted, provided the original author(s) and the copyright owner(s) are credited and that the original publication in this journal is cited, in accordance with accepted academic practice. No use, distribution or reproduction is permitted which does not comply with these terms.
*Correspondence: Hirofumi Shoda, c2hvZGEuaGlyb2Z1bWkuNXlAdG9reW8tbWVkLmFjLmpw; Keishi Fujio, RlVKSU9LLUlOVEBoLnUtdG9reW8uYWMuanA=