 De-hong Wu
 Hong-chun Qiu
 Jing Xu2
 Jun Qian
- 1Deparrtment of Central Lab, Affiliated People’s Hospital of Jiangsu University, Zhenjiang, Jiangsu, China
- 2Deparrtment of Hematology, KunShan Third People’s Hospital, Kunshan, Jiangsu, China
Background: The function of GCNT2 has been documented to act as an oncogenic driver or tumor suppressor in different types of tumor, but the role of GCNT2 and the epigenetic regulation mechanism in AML, however, has not yet been clarified. This study aimed to assay the expression and methylation profile of GCNT2 in AML, and further elucidate the clinical significance.
Methods: Multiple datasets from the Gene Expression Omnibus (GEO) and The Cancer Genome Atlas projects (TCGA) were used to explore the expression and methylation profile of GCNT2 in normal hematopoiesis and AML. A pan-cancer analysis was performed to define the survival implications of GCNT2 across multiple cancers including AML. The relationships between GCNT2 expression/methylation and clinicopathologic features were investigated using a TCGA-AML dataset. Correlation analysis was performed to explore the relationship between transcriptional expression and DNA methylation. Differentially expressed genes (DEGs) on the KEGG pathway and GO terms were visualized using DAVID. Gene Set Enrichment Analysis (GESA) was carried out to assess the underlying mechanism. The relationship between methylation and immune cell infiltration was also examined.
Results: GCNT2 expression was highest in hematopoietic stem cells (HSC) but gradually decreased during the hematopoiesis differentiation, the monocytes, however, remained a high level of GCNT2 as an exception. In AML, GCNT2 was down-regulated as compared to normal hematopoiesis but was much higher in contrast to normal peripheral blood samples. Data from a pan-cancer analysis revealed that high-expressed GCNT2 contributed to a worse OS for AML. DNA methylation of GCNT2 showed a distinctive co-methylation pattern in AML and significantly negatively correlated with transcriptional expression. Methylation in the transcriptional start site of isoform A plays a critical role in the epigenetic regulation of GCNT2 expression. The silence of GCNT2 in AML was attributed to DNA methylation. Hypomethylation of isoform A significantly predicted poor survival in AML, linking to several cytogenetic and molecular abnormalities, such as t (8:21), inv (16), t (15;17), and genes mutations of DNMT3A, CEBPA, RUNX1, and WT1. Enrichment analysis disclosed that hypomethylation of isoform A was involved in the immune system, and it was further revealed that hypomethylation of isoform A was tightly associated with immune cell infiltration and could be served as a promising indicator for immunotherapy.
Conclusions: Our comprehensive research demonstrated that GCNT2 acted as an oncogene in AML, and was epigenetically regulated by DNA methylation in isoform A. Hypomethylation of isoform A could be served as a promising indicator to identify the high-risk AML patients who might be responsive to immunotherapy.
Introduction
Acute myeloid leukemia (AML) is a group of hematopoietic malignancies characterized by uncontrolled myeloid progenitor cells proliferating and accumulating in the bone marrow and circulation, leading to impairment of normal hemopoiesis and bone marrow microenvironment with the concomitance of cytopenia and immunodeficiency (1, 2). Intensive therapy, such as the “3 + 7” regimen induction, high-dose cytarabine, or allogeneic stem cell transplantation consolidation, remains the mainstay of treatment for the fit patient, resulting in a long-term cure rate of 30-40% (3, 4). Still, a large proportion of patients who are elderly or not eligible for intensive therapy, will succumb due to disease relapse or progression. It is believed that both genetic and epigenetic alterations profoundly participate in disease initiation, clonal evolution, drug resistance, disease progression, and recurrence (5, 6). Major efforts have been made to dissect the molecular abnormalities in AML diagnostic classification, prognostic prediction, targeted therapies, drug response, as well as the MRD monitor (7–11). In the past few years, AML treatment was essentially improved because of the advances in the understanding of the molecular or genetic mechanisms of the disease. The introductions of hypomethylating agents (HMAs), new targeted substances as well as immunotherapies substantially broadened the treatment options for AML. Particularly, the emerging approaches of immunotherapies such as antibody-based immune checkpoint blockade, bispecific antibodies, vaccines as well as cell therapies profoundly change the strategy of AML treatment, contributing to an enhancement of the therapeutic efficacy and an endurance of disease control. But due to the tremendous heterogeneity in genetics, cytogenetics, and epigenetics, only a small subset of patients with specific molecular alterations benefited from these treatments. More intensive research aimed at AML pathogenesis and progression is required, and it is unmet to explore more reliable biomarkers for risk stratification and treatment decision, and to develop more molecular targets for this disease.
Recently, ongoing research has focused on glycobiology in cancer. Fundamental changes of glycosylation have been observed in diverse cancers (12), and aberrant glycan modifications were shown to be associated with tumor cell growth, cellular communication, metastasis, invasion, as well as tumor immunomodulation, contributing to tumor initiation and development (13–16). Moreover, intensive studies have demonstrated aberrant glycosylation as a reliable biomarker and a promising target for tumor treatment (12, 17, 18). GCNT2 refers to Glucosaminyl (N-Acetyl) Transferase 2, a gene locates in chromosome 6p24 and encodes an I-branching enzyme, which was initially reported to involve in the formation of blood group I antigen. The lost function of GCNT2 due to the gene mutation was associated with adult i blood group phenotype as well as congenital cataracts (19–21). Later, emerging evidence revealed that the deregulation of GCNT2 was implicated in various cancers (22–28). Upregulation of GCNT2 was associated with poor prognosis in breast cancer, prostate cancer, and esophageal carcinoma, with the functions of promoting proliferation, migration, and invasion, acting as an oncogene (23, 24, 26), on the other hand, evidence from other studies supposed the tumor suppressive function of GCNT2 in melanoma (25), endometrial carcinoma (29), and adult T-cell lymphoma/leukemia (28). Extensive research on melanoma has illustrated the opposite role of GCNT2 in the pathogenesis of the disease, with loss of GCNT2/I-antigen contributing to metastasis and progress (25). The unique expression of GCNT2 in melanoma has been explored for the prediction of survival and the therapeutic target (30). In addition to genetic alteration, epigenetic regulation, DNA methylation in particular, also contributes to GCNT2 expression (31, 32), data from existing observations have supported a key role of aberrant methylation of GCNT2 in several solid tumors, in which, hypomethylation of GCNT2 was associated with tumor development, invasion, and distant metastasis (32–34), interestingly, hypomethylation of GCNT2, both in tumor tissues and even in the corresponding normal tissues, holds a promising capability in predicting lymph node metastasis and clinical outcome in colorectal cancer (CRC) (32). However, limited information is about the exact role of GCNT2 and its methylation status in AML. In this study, we comprehensively analyzed the transcriptional expression of GCNT2 and the DNA methylation profile in AML using multiple databases, including Gene Expression Omnibus (GEO), The Cancer Genome Atlas (TCGA) database, and web online resources in an effort to elucidate their clinical implications in AML.
Materials and methods
Assessment of GCNT2 expression in normal hematopoiesis and AML cells
GCNT2 expression profile in human normal hematopoiesis was analyzed using the gene-expression dataset (GSE42519) from GEO and a merged dataset HemaExplorer which consists of four datasets (GSE17054, GSE19599, GSE11864, and E-MEXP-1242) from BloodSpot (http://servers.binf.ku.dk/bloodspot/). For AML, we used three datasets (GSE13159, GSE24006, GSE30029), all of which contain AML samples and normal hematopoietic cell samples from bone marrow or umbilical cord blood, to compare the expression of GCNT2 between AML and normal hematopoietic cell. Moreover, we downloaded normalized and combined RNAseq data of gene expression across pan-cancer (PANCAN, N=19131,G=60499) from the UCSC (http://xenabrowser.net), and extracted the data of GCNT2 expression in AML samples (n=173) from TCGA database, and normal peripheral blood samples (n=337) from Genotype-Tissue Expression (GTEx) database.
Prognostic analysis of GCNT2 in AML
A high quality of survival data matched with each sample was acquired from the Pan-cancer Atlas paper (35), and follow-up data from the Therapeutically Applicable Research to Generate Effective Treatments (TARGET) database was supplemented. Tumors with less than 10 samples were removed, thereafter, a total of 44 tumor types that had matched GCNT2 expression and overall survival data were subjected to Cox proportional hazards regression model. For AML, two independent AML cohorts [TCGA-LAML(n=202) and TARGET-AML(n=149)] with the follow-up data were aggregated to draw the survival curve by Kaplan‐Meier (KM) analysis.
Assessment of GCNT2 mutation in AML
The cBioPortal (http://cbioportal.org) is a web resource for cancer genomic analysis, and the multiple genomic data types from a mass of cancer studies were integrated by cBioPortal. We selected four studies that contained a bulk of AML samples to query the genomic alteration frequency of GCNT2 in AML, these four studies are Pediatric Acute Myeloid Leukemia (TARGET, 2018; n=1025), Acute Myeloid Leukemia or myelodysplastic syndromes (WashU, 2016; n=136), Acute Myeloid Leukemia (OHSU, Nature 2018; n=672) and Acute Myeloid Leukemia (TCGA, Firehose Legacy; n=200).
Analysis of GCNT2 methylation in AML and normal hematopoiesis
For AML, we used three methylation datasets (GSE58477, GSE63409, and TCGA-LAML), in which, DNA methylation data (terms as beta value) was measured by Illumina Infinium HumanMethylation450 platform, and there were 34 CpG sites mapping onto the GCNT2 gene. In GSE58477 and GSE63409, methylation profiles of AML samples and normal hematopoietic cells were available. Another study (GSE49618) has evaluated the methylation profile of normal healthy cells (monocytes, promyelocytes, polymorphonuclear cells, B cells, T cells, CD34+CD38- HSPCs). In our study, we extracted methylation data of GCNT2 from the three independent studies.
In the TCGA-LAML cohort, RNAseq (IlluminaGA TCGA Hub, n=179)), DNA methylation (Methylation450k TCGA Hub, n=194), somatic mutation (wustl gene-level mutation call TCGA Hub, n=197), as well as corresponding clinical phenotypes (Phenotypes TCGA Hub, n=200), were downloaded from the UCSC, and the Tumor mutational burden (TMB), defined as the quantity of non-synonymous mutation in the genome, was downloaded via the cBioPortal.
The methylation-expression correlation curves were plotted by the SMART (http://www.bioinfo-zs.com/smartapp/), in which, the mRNA expression and DNA methylation data were derived from the TCGA project. We could also visualize the distribution of the 34-CpG and the GCNT2 transcripts on the genomic structure by the SMART.
Pathway and function enrichment analysis
To define the potential functions and underlying mechanism, the KEGG (Kyoto Encyclopedia of Genes and Genome) pathway enrichment and Gene ontology (GO) analyses were conducted via an online web tool DAVID (https://david.ncifcrf.gov/). The Gene Set Enrichment Analysis (GSEA) was applied to interpret the biological meanings associated with the difference of DNA methylation cohorts based on TCGA-AML RNAseq date. The Hallmark gene set, and the Reactome gene set derived from Molecular Signatures Database (http://www.gsea-msigdb.org/gsea/downloads.jsp) were included in the enrichment analysis. The gene set with the P value < 0.05 and FDR < 0.2 was deemed to be significantly enriched.
Assessment of the immune microenvironment of AML
On basis of the gene expression profiles from a bulk of samples, various algorithms have been developed for accurate measurement of the tumor microenvironment.
In our study, the assessment of the tumor microenvironment was based on TCGA-AML RNAseq data. First, we employed the Estimation of Stromal and Immune cells in malignant tumors using the Expression data (ESTIMATE) (36) method to calculate the ImmuneScore, StromalScore, ESTIMATEScore of each AML sample, then, the exact immune cells abundance was assessed by five different algorithms, including CIBERCORT (37), EPIC (38), MCP-counter (39), quanTIseq (40), and xCell (41).
Statistical analysis
The data was processed and statistically analyzed by using multiple platforms including Microsoft Excel 2019, IBM SPSS 22.0.0, GraphPad Prism 9.0, R-project 4.04, and an online service tool Sangerbox (http://www.sangerbox.com/tool). Data visualization was mainly carried out by Microsoft Excel 2019, GraphPad Prism 9.0, and Sangerbox. Differences in continuous variables between binary or multiple groups were analyzed using the Mann-Whitney U test or Kruskal-Wallis test, and categorical variables were compared by the chi-square test. The correlation coefficient was calculated whereby Person or Spearman analysis. For survival analysis, a univariate Cox proportional hazard regression model was conducted to evaluate the parameters that individually contribute to survival. The differences in OS between two stratified AML cohorts were analyzed by the Kaplan-Meier curve with the log-rank test. The Binary logistic regression analysis was used to analyze the independent factors that contribute to DNA methylation. A two-tailed P-value less than 0.05 was deemed statistical significance.
Results
Expression profile of GCNT2 in human normal hematopoiesis and AML
The GSE42519 dataset involved the collection of bone marrow mononuclear cells from healthy donors, which were subsequently sorted into different stages of normal hematopoiesis using fluorescence-activated cell sorting (FACS). The expression pattern of GCNT2 across the different stages of hematopoiesis was shown in (Figure 1A). We found that the GCNT2 expression was highest in hematopoietic stem cells (HSC) and gradually decreased during the hematopoiesis differentiation; except for monocytes which retained a relatively high level of GCNT2, (P < 0.0001). A similar result was observed in a merged dataset (HemaExplorer), where, HSC and early hematopoietic progenitor cells (early HPC) exhibited a high expression of GCNT2, and the other committed progenitors and the more mature hematopoietic cell lineages showed a reduced expression of GCNT2; still, expression of GCNT2 increased in the CD14+ monocytes (P < 0.0001), (Figure 1B). The dynamic change of GCNT2 during the hematopoiesis differentiation suggests a potential role of GCNT2 in HSC and monocytes, implying that GCNT2 might be associated with stem cell-like feature and loss differentiated phenotype.
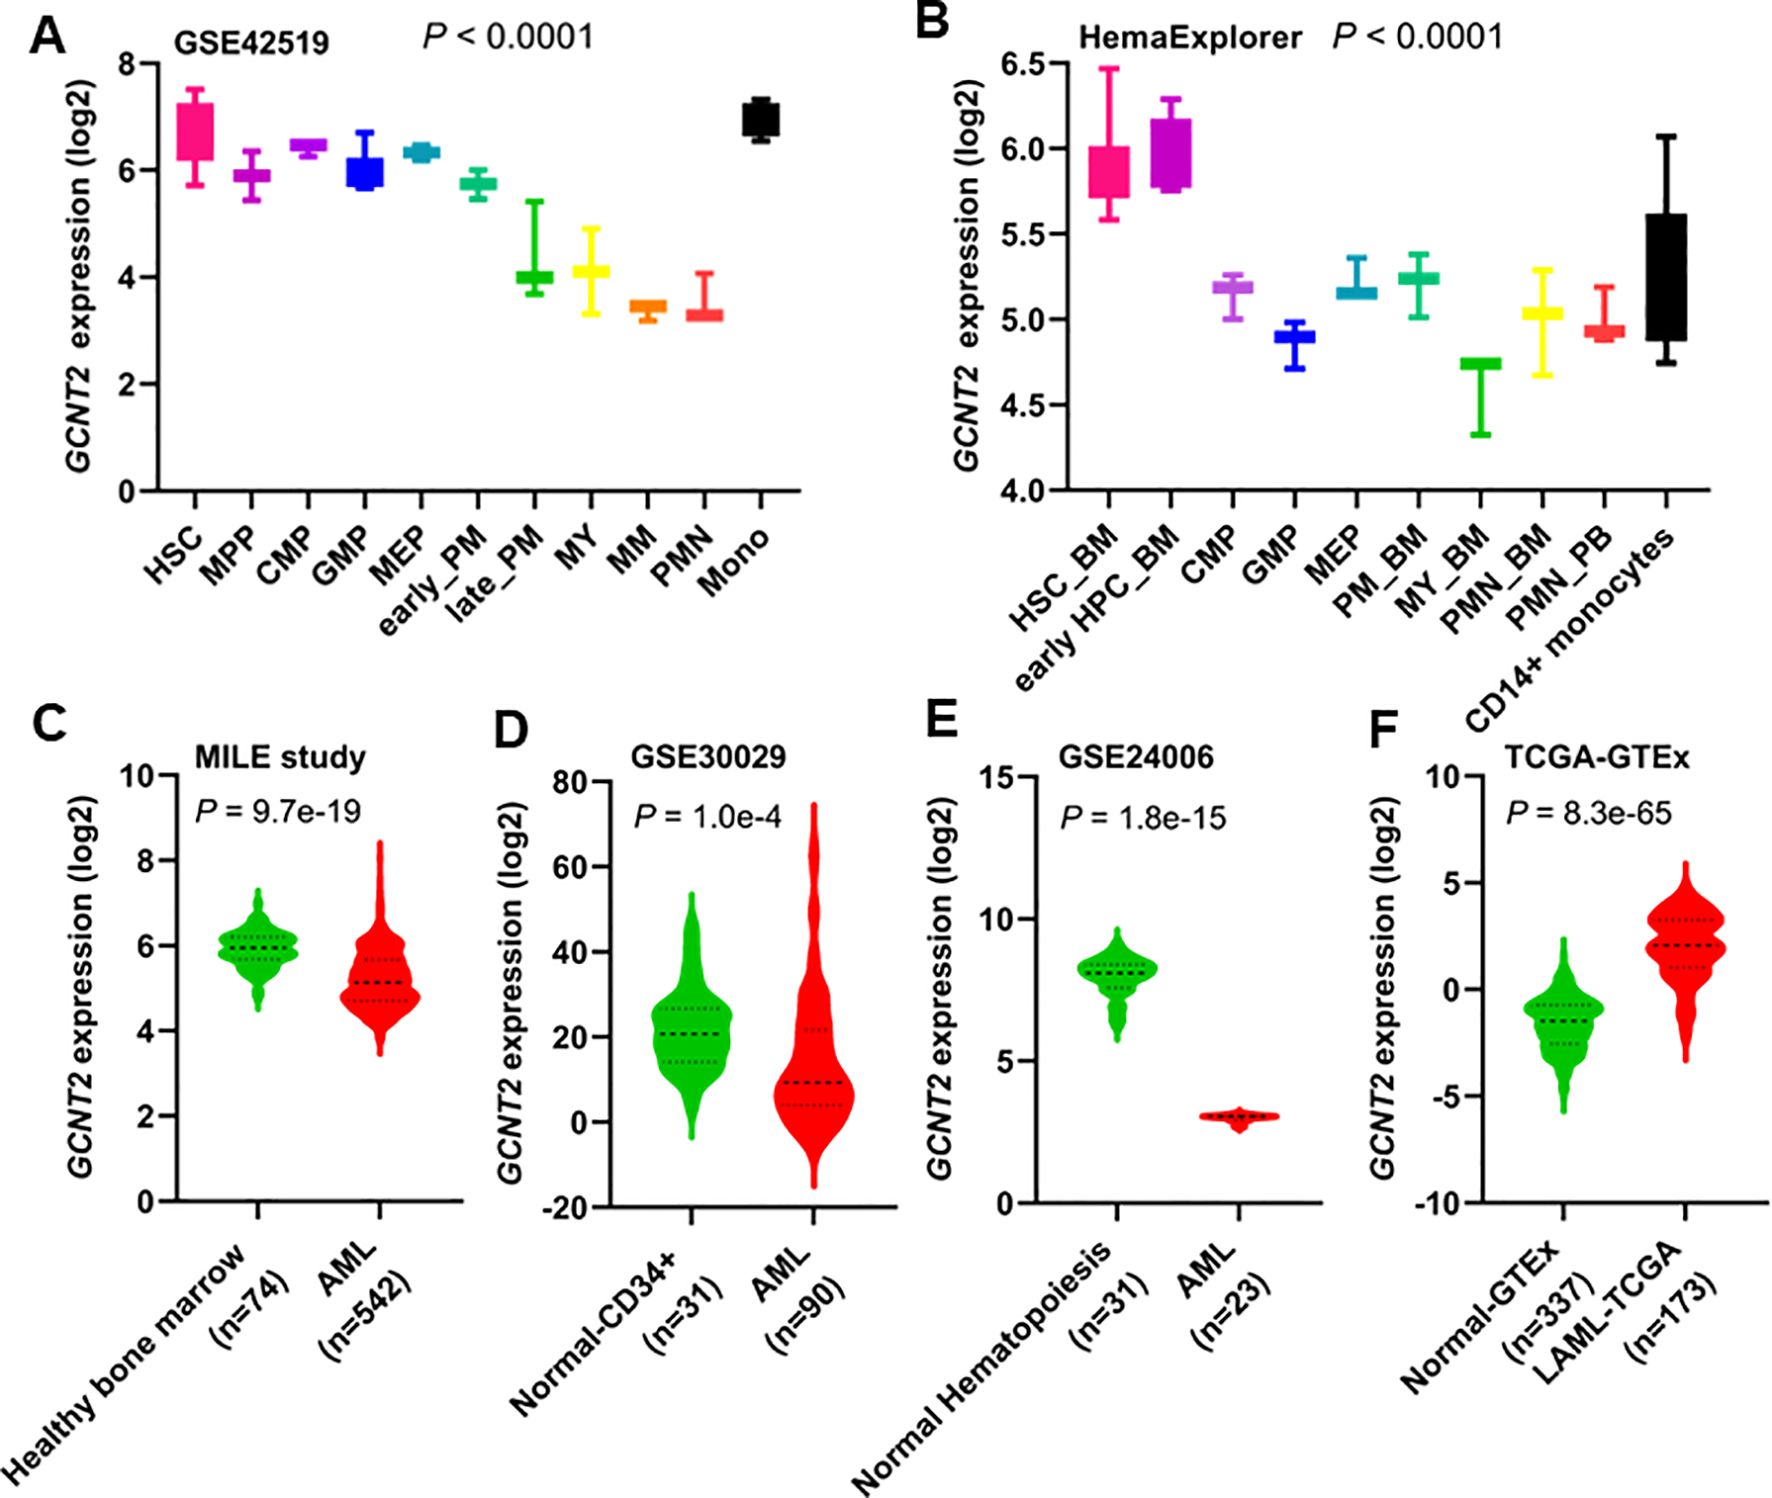
Figure 1. Expression of GCNT2 in human normal hematopoiesis and AML. (A) The change of GCNT2 during the hematopoiesis differentiation in GSE42519 data set (P < 0.0001, Kruskal-wallis test). (B) The change of GCNT2 during the hematopoiesis differentiation in a merged data set HemaExplorer (P < 0.0001, Kruskal-wallis test). (C–E) Significantly reduced GCNT2 was found in AML as compared to normal hematopoiesis from 3 independent studies (C) MILE study, (D) GSE30029, (E) GSE24006), (F) Remarkably increased GCNT2 in AML (TCGA cohort) as compared to normal mature blood cells (normal-GTEx cohort). HSC, hematopoietic stem cell; MPP, multipotent progenitor; CMP, common myeloid progenitor; GMP, granulocyte−monocyte progenitor; MEP, megakaryocyte−erythrocyte progenitor; PM, promyelocyte; MY, myelocyte; MM, metamyelocytes; BC, band cell; PMN, polymorphonuclear cells; HPC, hematopoietic progenitor cells; BM, bone marrow; PB, peripheral blood.
In AML, significantly reduced GCNT2 was found in the three independent datasets (GSE13159, 542 AML vs. 74 normal, P = 9.7e-19; GSE30029, 90 AML vs. 31 normal, P = 1.0e-4; GSE24006, 23 AML vs. 31 normal, P = 1.8e-15), (Figures 1C–E). This unexpected result led us to hypothesize that GCNT2 might still retain its function in immature hematopoietic cells. To further test this hypothesis, we compared GCNT2 expression between AML cells and normally differentiated and mature peripheral blood cells. For this analysis, we utilized the TCGA-LAML cohort (n=173) and normal peripheral blood data from the GTEx project (n=337). Consistent with our hypothesis, we found that GCNT2 expression was significantly higher in AML cells compared to differentiated and mature peripheral blood cells (P = 8.3e-65), (Figure 1F). These observations indicated that expression of GCNT2 was repressed in AML as compared to normal premature hematopoietic cells, but remained substantially higher than mature blood cells.
Expression of GCNT2 positively correlates with stemness scores
Our initial analysis of GCNT2 expression revealed that it is highly expressed in early-stage hematopoietic cells, peaking in hematopoietic stem and progenitor cells. This observation suggests that the GCNT2 gene may play a role in maintaining cellular stemness. To further substantiate this finding, we conducted a correlation analysis between GCNT2 expression in the TCGA database and currently established stemness scores, DNA methylation-based Stemness Scores (DNAss) from a previous study (42), which has revealed that the higher stemness index, the more degrees of stemness. We correlated GCNT2 expression with the four stemness indices (DNAss, EREG-METHss, DMPss, and ENHs), and notably, we found that the expression of GCNT2 positively correlated with the four stemness indices (Figure 2). This result suggested that GCNT2 played an important role in maintaining the stem cell-like property and oncogenic dedifferentiation in AML.
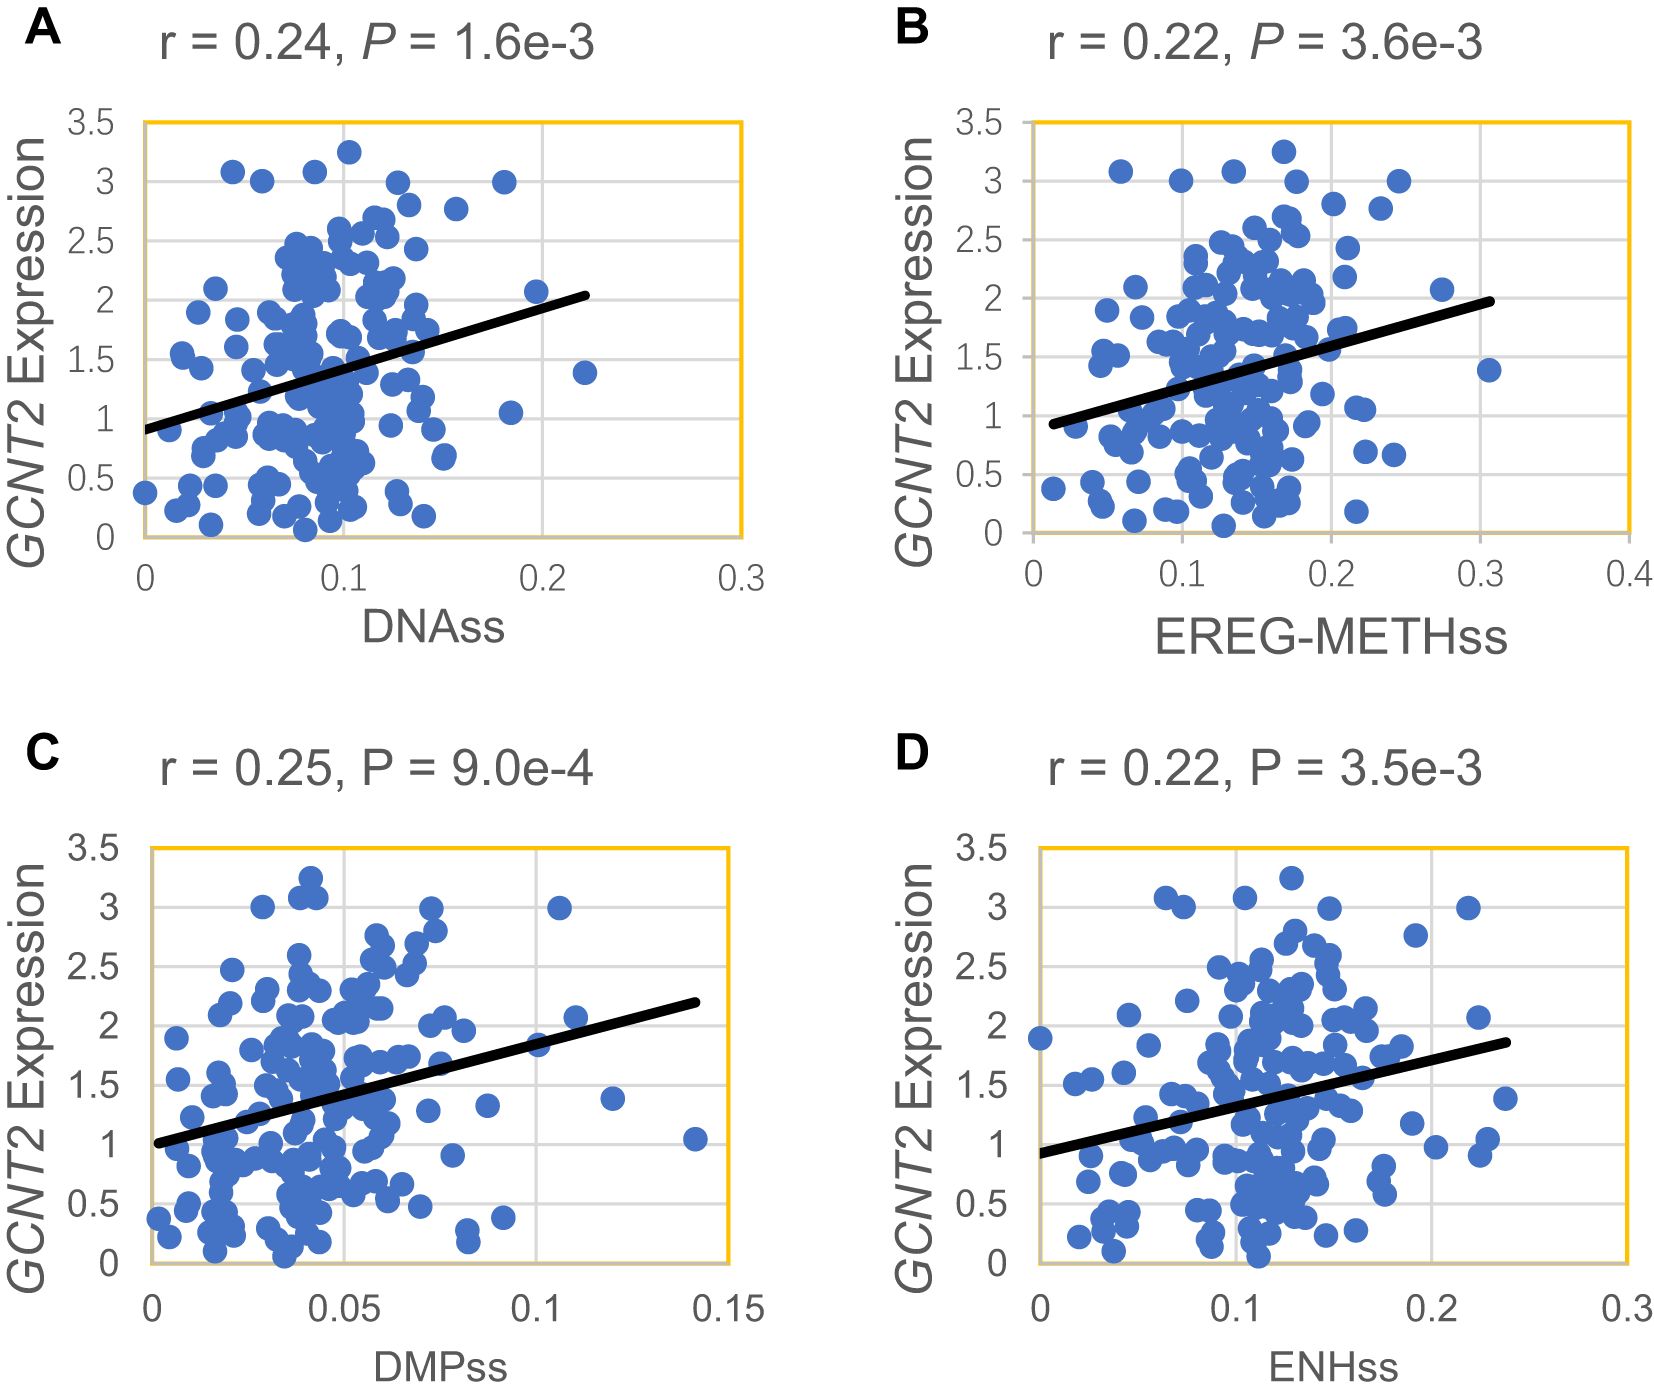
Figure 2. GCNT2 expression positively correlated with 4 stemness indices. (A) DNAss DNA methylation-based (Stem cell signature probes (219 probes), that combines the 3 signatures). (B) EREG-METHss, Epigenetically regulated DNA methylation-based (87 probes). (C) DMPss Differentially methylated probes-based (62 probes). (D) ENHss Enhancer Elements/DNAmethylation-based (82 probes).
Up-regulation of GCNT2 predicts poor survival in AML
To explore the prognostic potential of GCNT2 in AML, we first assessed the impact of GCNT2 on overall survival (OS) from a pan-cancer study (35), notably, GCNT2 was identified to carry prognostic significance in 8 cancers by Cox proportional hazards regression model (P < 0.05), those with Hazard Ratio (HR) >1 were TCGA-LAML (Acute Myeloid Leukemia), TARGET-ALL (Acute Lymphoblastic Leukemia), TCGA-UCS (Uterine Carcinosarcoma), TCGA- PAAD (Pancreatic adenocarcinoma), whereas, the HR<1 were observed in TCGA-KIPAN [Pan-kidney cohort (KICH+KIRC+KIRP)], TCGA-CESC (Cervical squamous cell carcinoma and endocervical adenocarcinoma), TARGET-NB (Neuroblastoma), TCGA-KIRC (Kidney renal clear cell carcinoma), Figure 3A. In the TARGET-LAML cohort, high-expressed GCNT2 also conferred a worse outcome (HR = 1.16), although it had no statistical significance (P = 0.25), (Figure 3A). Then the two independent AML cohorts (TCGA-LAML and TARGET-LAML) containing a total of 351 samples were combined and subjected to Kaplan‐Meier analysis, it was revealed that patients with high GCNT2 expression presented remarkably worse OS than those with low GCNT2 expression (P = 1.3e-3, HR = 1.58), (Figure 3B).
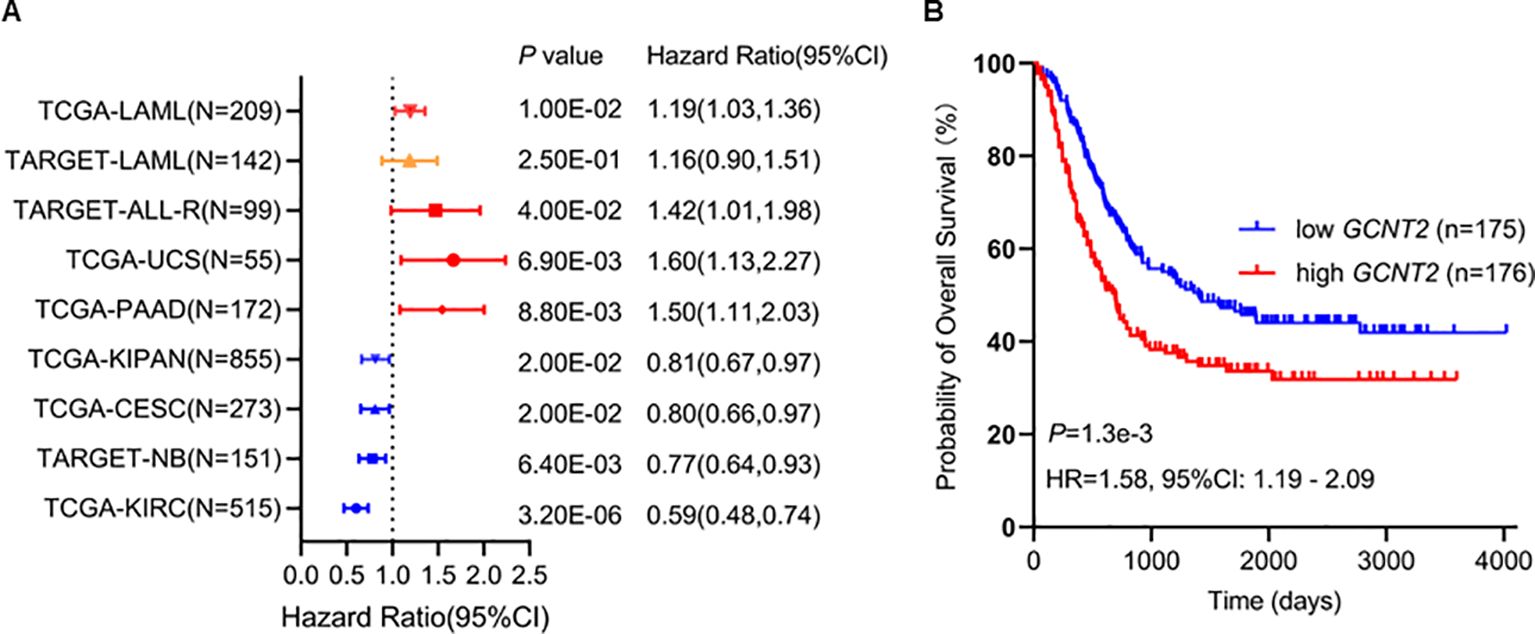
Figure 3. (A) GCNT2 was identified to carry prognostic significance in 8 cancers by Cox proportional hazards regression model (P < 0.05), in TARGET-LAML cohort, the hazard ratio was 1.16, and the P value was 0.25. (B) Kaplan‐Meier (KM) analysis using the merged cohort (TCGA-LAML and TARGET-LAML) showed negative association of GCNT2 with OS.
In the TCGA-LAML cohort, the RNA sequencing data of 179 patients with detailed clinical information was downloaded from UCSC (IlluminaGA TCGA Hub). Two groups (GCNT2high and GCNT2LOW) were stratified at the cutoff value of the median expression level, and the clinic characteristics of AML in between GCNT2high and GCNT2LOW groups were listed in Table 1. Statistical analysis revealed that GCNT2high group was characterized by lower hemoglobin concentration (P = 0.04), and a tendency of older age (P = 0.06). In FAB classification, the distributions of AML-FAB subtypes in GCNT2high and GCNT2LOW groups were obviously different (P = 0.000), where, FAB-M1-3 were more frequent in GCNT2low group, and FAB-M4-5 were more concentrated in GCNT2high group; as for cytogenetic abnormalities, patients with high GCNT2 expression were significantly associated with complex karyotype (P = 0.0286), by contrast, low GCNT2 expressed patients were more likely to carry some favorable abnormalities, such as t (15;17) (P = 0.0074) and t (8;21) (P = 0.0695); besides, the intermediate- and poor-cytogenetic risk groups contained a higher ratio of highly expressed GCNT2, as compared to the favorable-cytogenetic risk group (P = 0.0425). Concerning genetic abnormalities, a total of 176 patients with matched gene mutation information were available in the TCGA data set, and the top 10 mutation genes were displayed in Table 1. Notably, gene mutations of RUNX1 and NRAS were more frequent in GCNT2high group (both of the p-values were 0.02), and the CEBPA gene mutation, regarded as a favorable biomarker in AML, tended to be more frequent in GCNT2LOW group (P = 0.09), however, the ratio of the patient with FLT3 mutation more enriched in GCNT2LOW group, as unexpected.
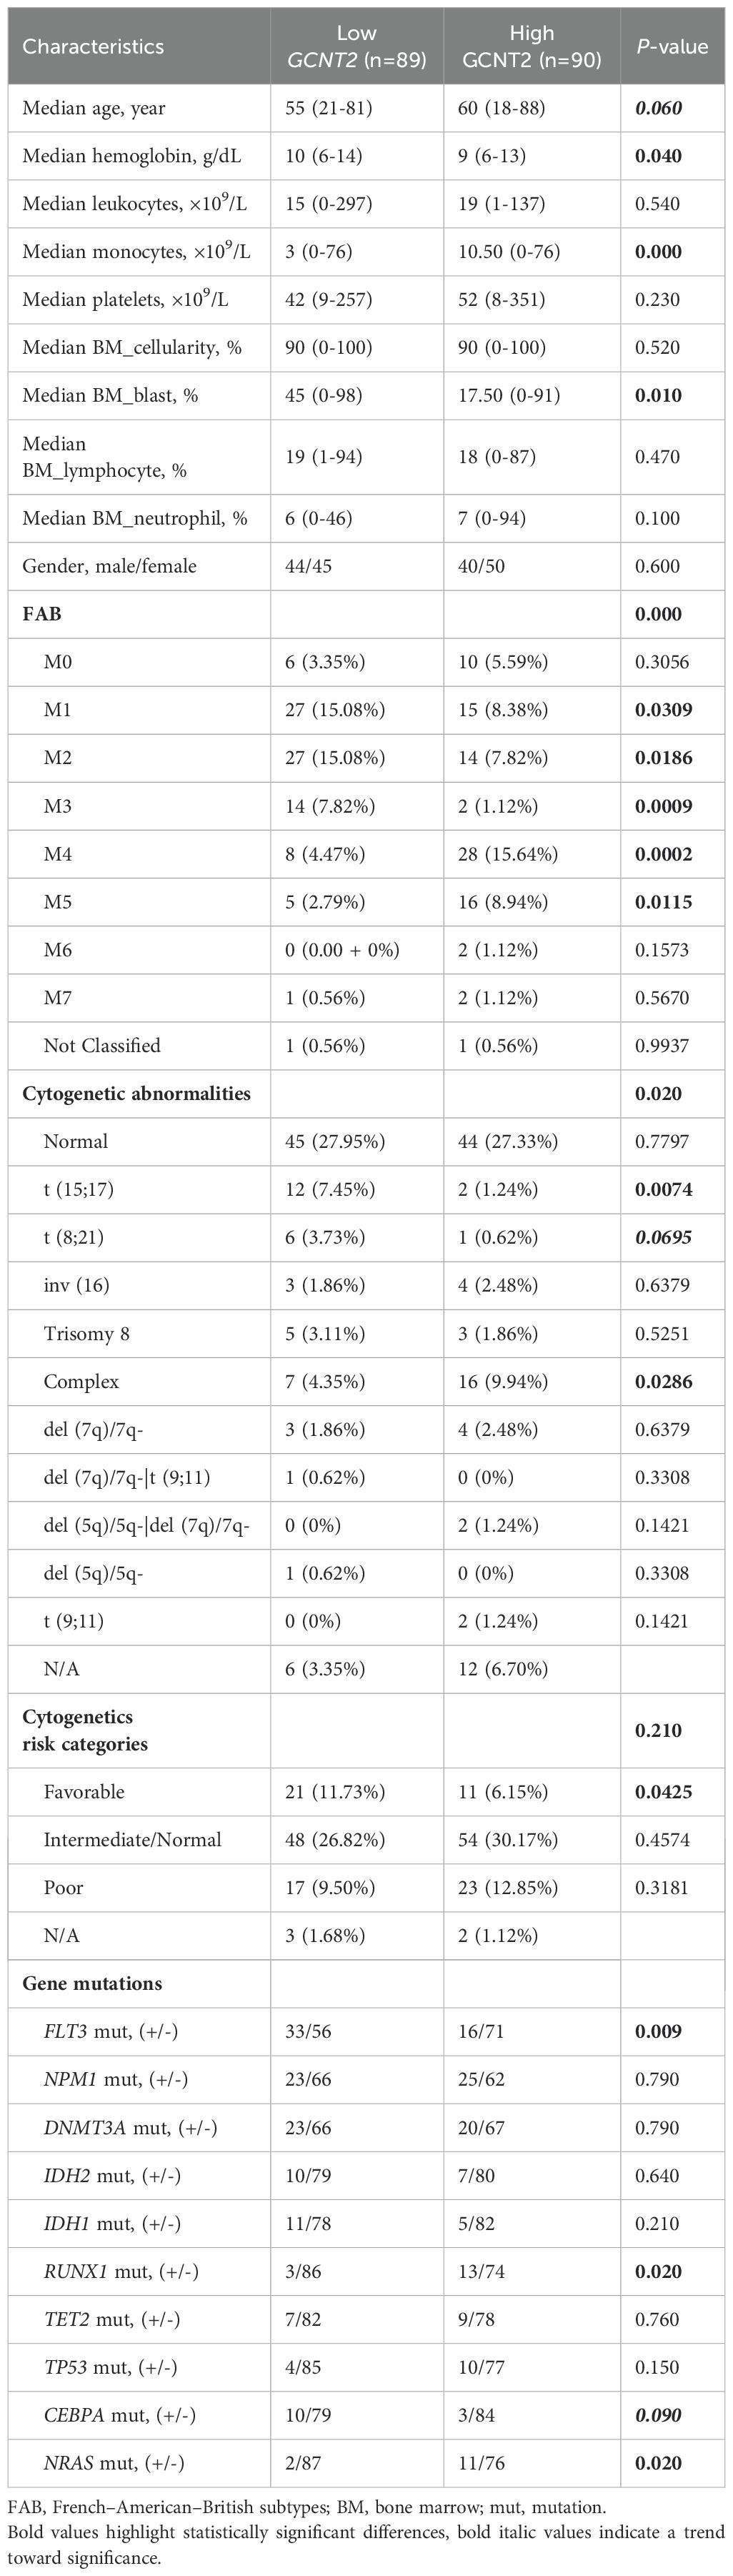
Table 1. Clinicopathological feathers of AML patients with respect to the GCNT2 expression.
These results suggested an adverse prognosticator of GCNT2 in AML, and the high frequency of over-expressed GCNT2 in FAB-M4-5 was coincident with the result demonstrated above that monocyte had the unique expression profile of GCNT2.
Genetic mutation of GCNT2 in AML
Since the loss function of GCNT2 mutation was reported to critically link to many diseases, we quired the cBioPortal (http://cbioportal.org) to understand whether it was a player in AML. Four independent studies covering a total of 2033 AML samples were selected in cBioPortal, among which, genetic alteration of GCNT2 was detected in 1 out of 1083 profiled samples (ratio: 0.1%) (Figure 4), therefore, we are able to conclude that regulation of GCNT2 in AML may occur beyond GCNT2 mutation.
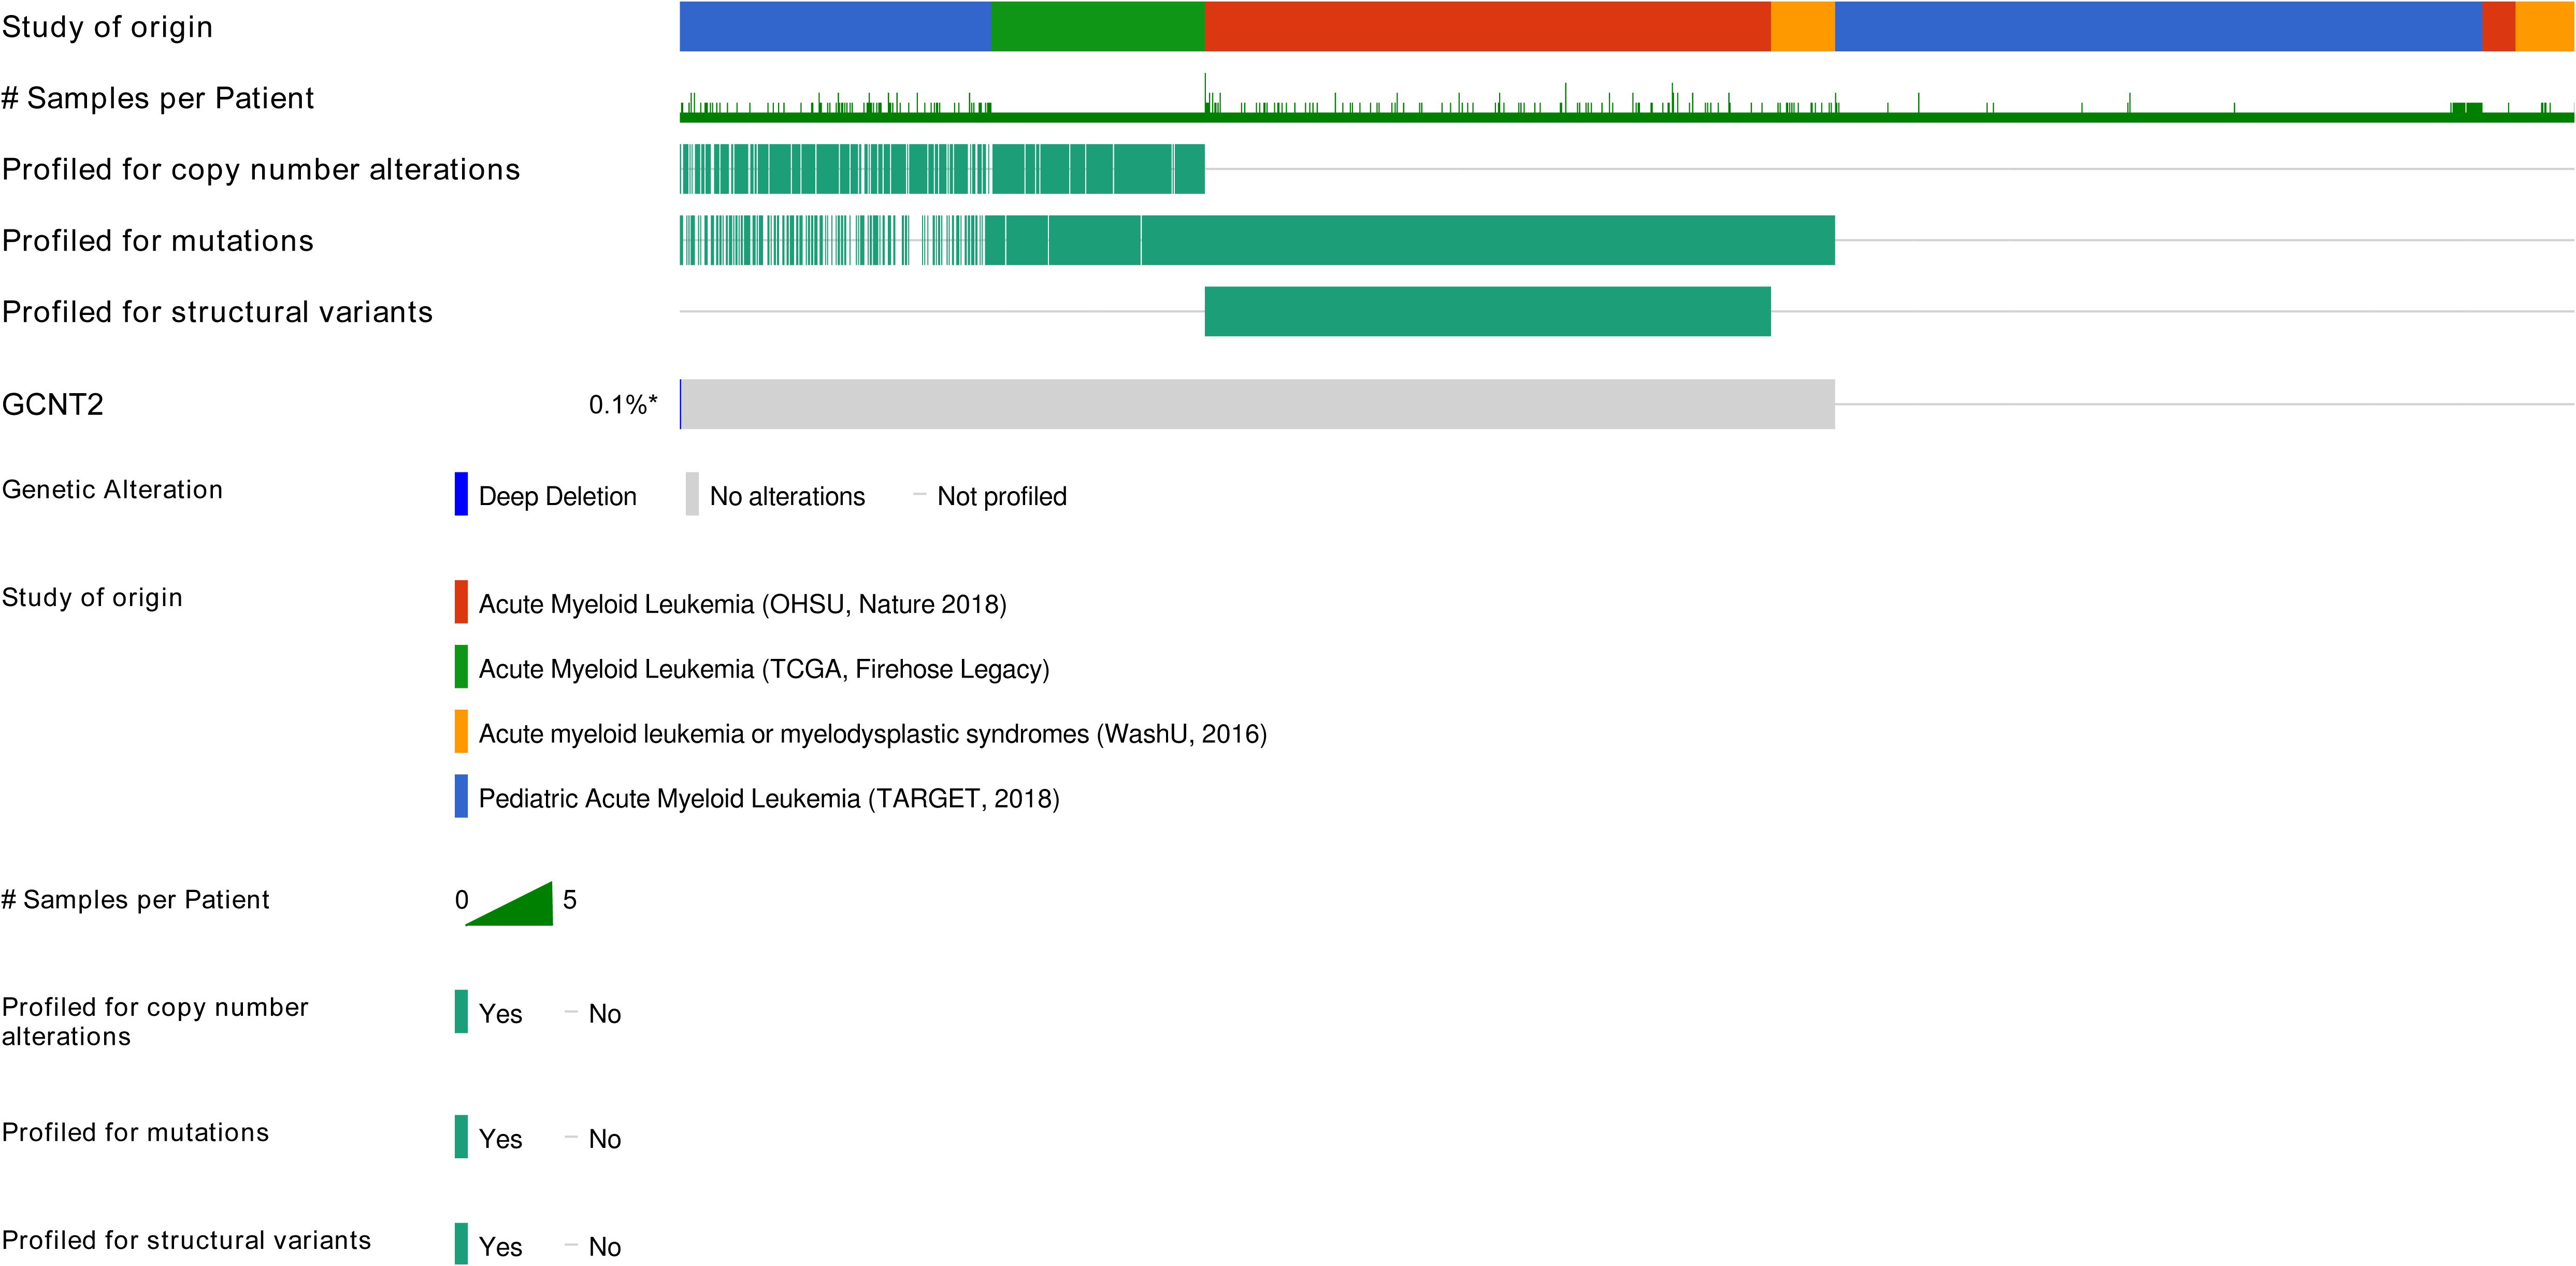
Figure 4. Genetic alteration of GCNT2 was detected in 1 out of 1083 profiled samples (ratio: 0.1%) by querying 2033 AML samples in 4 studies via cBioPortal (http://cbioportal.org).
Methylation profile of GCNT2 in AML
Referring to the human genome version GRCh38/hg38, the GCNT2 gene is located on chr6:10,492,223-10,629,368, spanning∼13.7 kb of genomic DNA. Previous studies have documented that there were 3 isoforms (isoforms A, B, and C), which were produced by alternative splicing, performing the main functions of GCNT2 (20, 43, 44). They share the same exons 2 and 3, but with different exons 1 and promoter regions (43). To analyze the methylation status of GCNG2 in AML, the β value of the 34 CpG sites mapping onto the GCNT2 gene were extracted from the three independent methylation studies (GSE58477, GSE63409, and TCGA-LAML). The annotation of the 34 probe IDs and their distances to transcriptional start sites (TSS) of the three isoforms were listed in Table 2. The correlation matrix from the TCGA-LAML cohort (n=194) disclosed that many adjacent CpG sites in different locations of the genomic DNA shared the parallel methylation status (co-methylation) toward each other. More importantly, most of the co-methylated CpG sites are near the transcription start sites (TSS) of the three isoforms. As shown in Figure 5A, the four sites (cg22378252, cg19657351, cg26781466, cg11636127) near the isoform A (TSS-A, -131∼132 distant to TSS) showed the highest co-methylation pattern, with the correlation coefficients (Pearson r) ranged 0.87-0.95; the second is the other four sites (cg12242450, cg13347910, cg12695465, cg07264048) near the isoform B (TSS-B, -86∼432, distant to TSS), with the correlation coefficients (Pearson r) ranged 0.83-0.93; the three CpG sites (cg14322298, cg04628438, cg23719713) near the isoform C (TSS-C, -188∼296, distant to TSS) showed a moderate co-methylation status (Pearson r: 0.36-0.64). This distinctive methylation manner was coincident with the other two independent AML cohorts (GSE58477, n=62; GSE63409, n=44), (Figures 5B, C). On the other hand, GCNT2 methylation in the human normal hematopoietic cells from the three methylation studies (GSE58477, GSE63409, and GSE49618) showed inconsistent profiles (Figures 5D–F). In the comparison between AML and the normal control across the two independent datasets, GSE63409 and GSE58477, we examined the methylation levels of 34 CpG sites. Intriguingly, we observed a remarkable consistency in the distribution of abnormal methylation in AML as compared to normal cells across both datasets. Specifically, in certain distinct regions, notably the TSS-A region, both datasets demonstrated abnormal methylation at TSS-A (Figures 5G–J). Collectively, the CpG sites near the TSS of the 3 isoforms methylated with a synergistic process in AML, contribute to the unique epigenetic feature of AML.
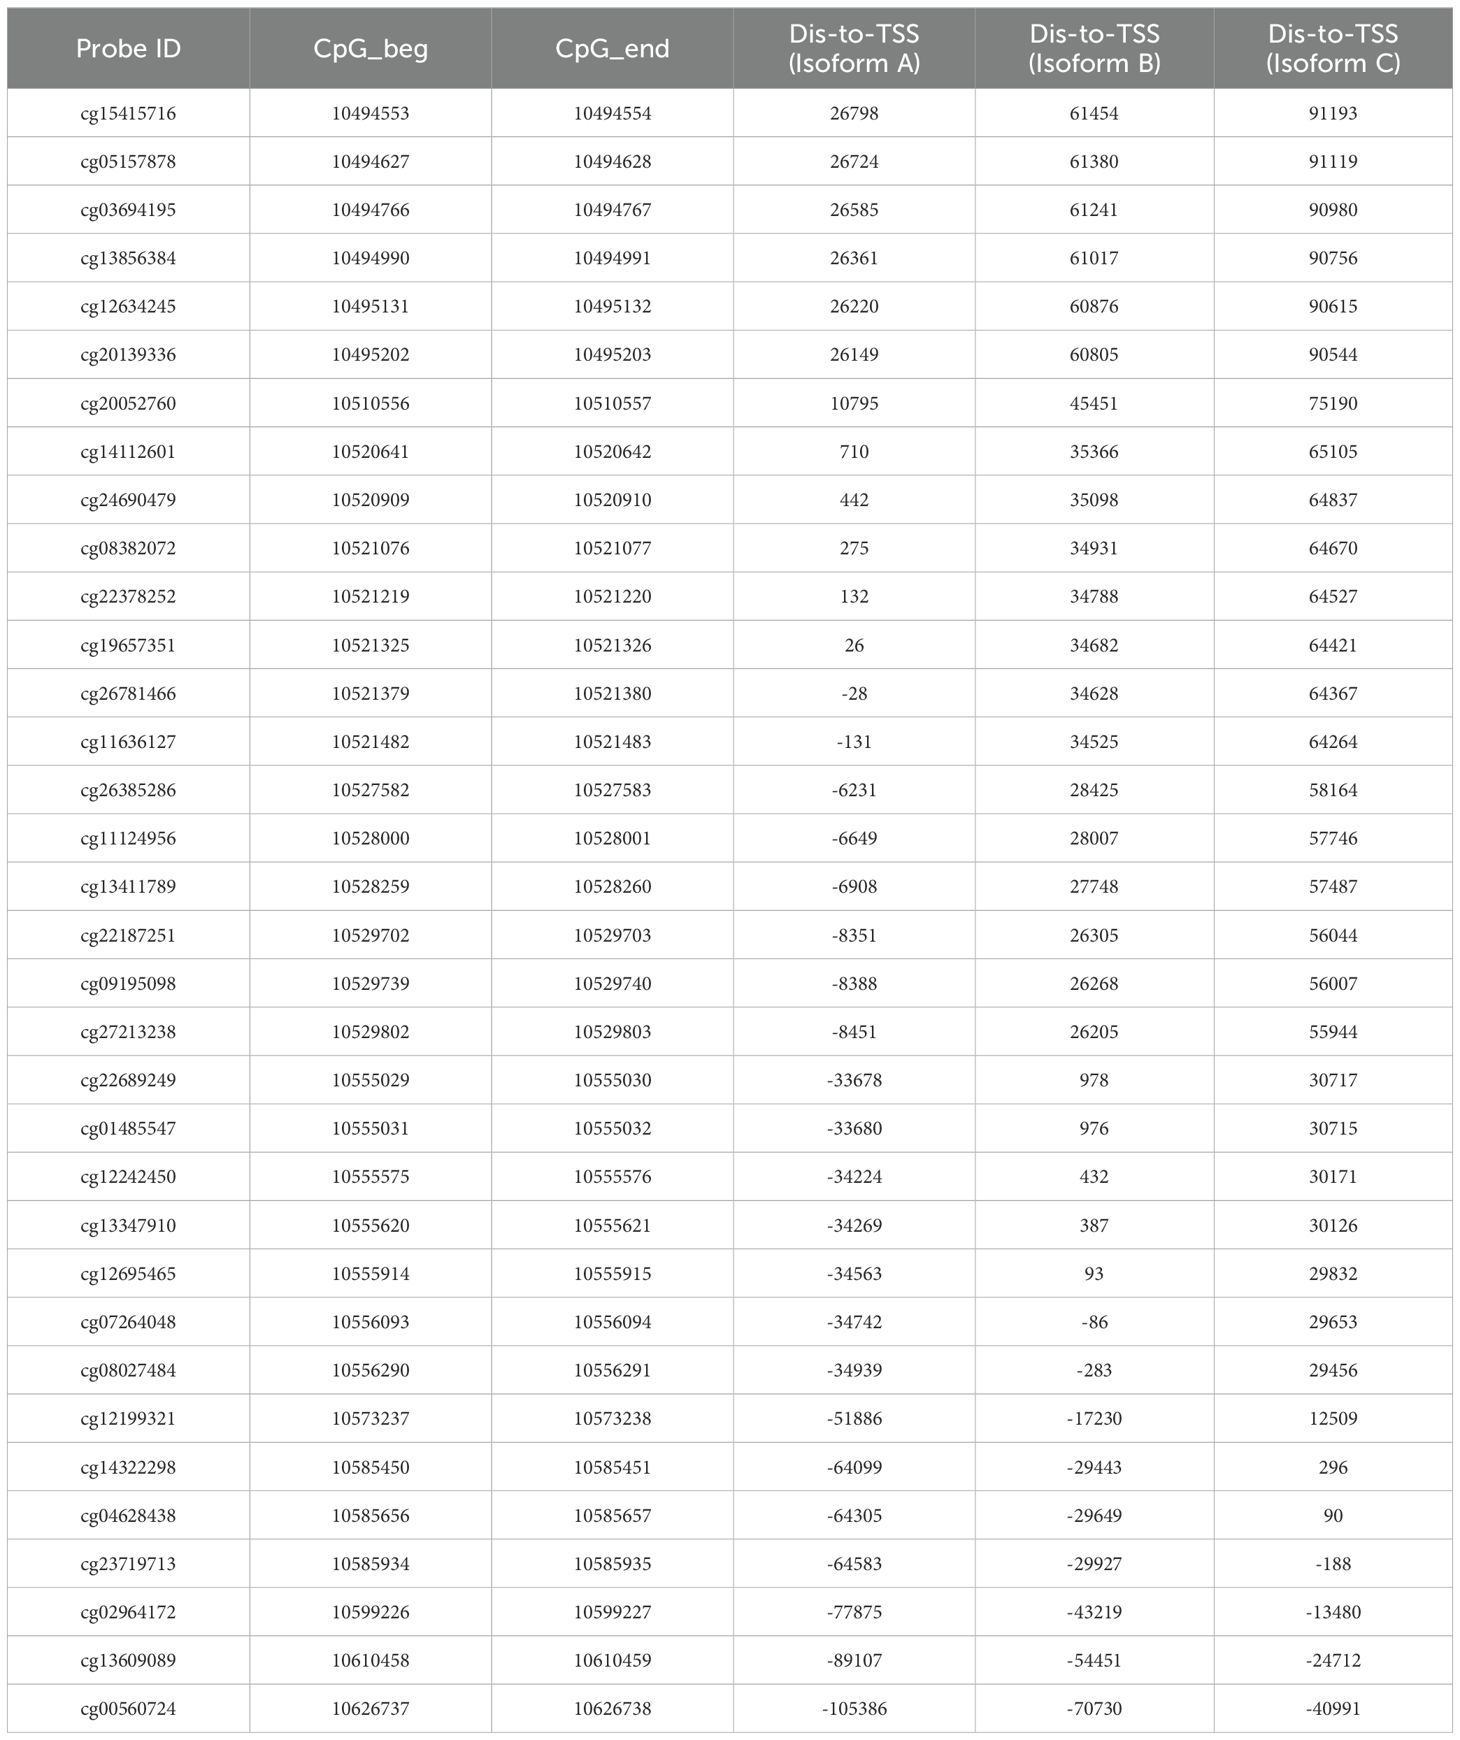
Table 2. The annotation of the 34-CpG and their distances to transcriptional start sites (TSS) of the three isoforms of GCNT2.
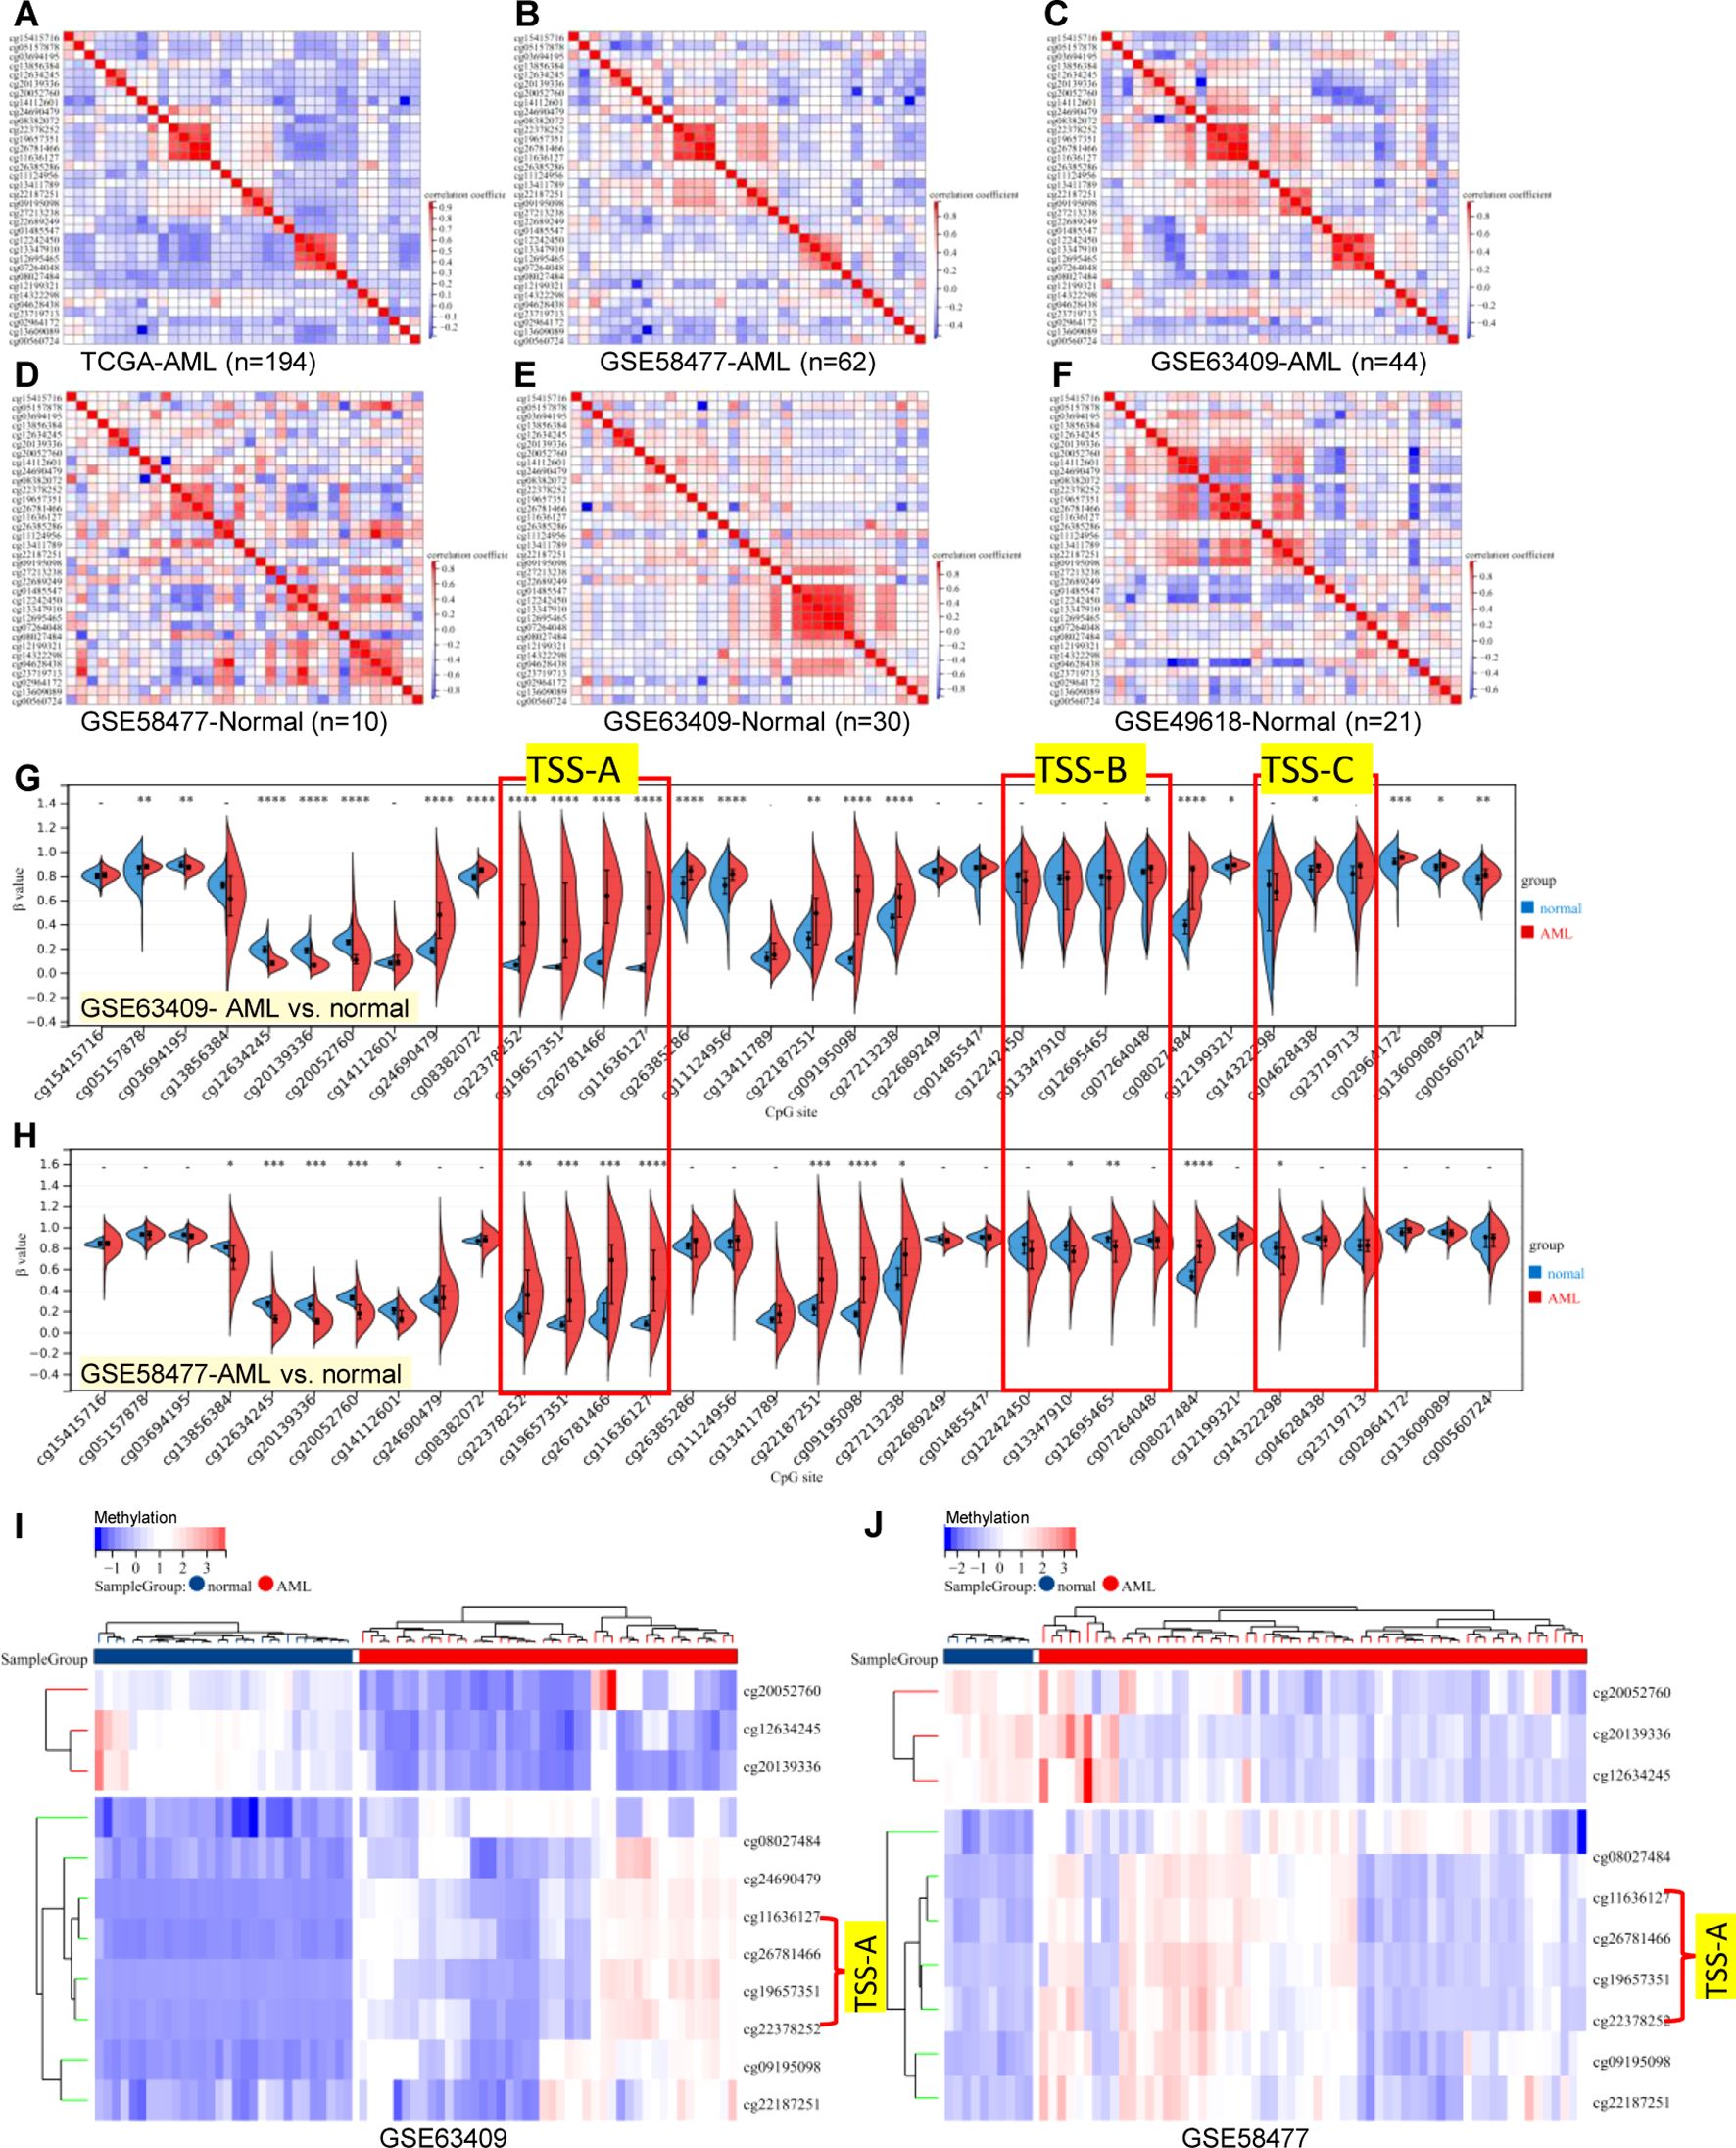
Figure 5. Correlation matrix of 34-CpG in AML and human normal hematopoietic cell. (A–C) three independent AML cohorts exhibited an accordant co-methylation manner [(A) TCGA-LAML, (B) GSE58477, (C) GSE63409], whereas, the methylation manners of normal hematopoietic cell in three independent studies were inconsistent [(D) GSE58477, (E) GSE63409, (F) GSE49618]. The global methylation profile of GCNT2 by comparation analysis in between AML with normal controls, the distribution of abnormal methylation in AML was largely consistent in both datasets, both datasets exhibited abnormal methylation at TSS-A [(G) GSE63409, (H) GSE58477], The heatmap displays a consistent pattern of abnormally methylated loci across the samples [(I) GSE63409, (J) GSE58477]. *P < 0.05, **P < 0.01, ***P < 0.001, ****P < 0.0001.
Transcriptional expression of GCNT2 significantly correlated with DNA methylation
To investigate the epigenetic modulation of GCNT2 in AML, we correlated the GCNT2 RNA-seq date with each of the 34 CpG sites methylations using the SMART, of note, 16 out of the 34 CpG sites showed significant negative correlation coefficients, still, the aggregation of the averaged methylation of the 34 CpG sites also demonstrated a remarkable negative correlation with GCNT2 expression (r = -042, P = 1.8 e-08), (Figure 6A). The ranked coefficients of the 34 CpG sites were demonstrated in Figure 6B, and those with P value <0.05 were delineated in the heatmap. Interestingly enough, the top 5 CpG sites with a coefficient < -0.4 were comprised of the 4-CpG in TSS-A: cg22378252, cg19657351, cg26781466, cg11636127, the residue of cg24690479 with a coefficient of -0.491 is also close to the TSS of isoform A (442 distant to TSS, Table 2). The genomic structure of the three isoforms (A, B, C) was plotted by the SMART, and the approximate locations of TSS-A, TSS-B, and TSS-C were indicated in Figure 6C. Then, the methylation of TSS-A, TSS-B, and TSS-C was defined as the average of the co-methylated CpG sites near each of the TSS. Meanwhile, we also obtained the RNA-seq data of the three isoforms from the SMART for the correlation analysis. To our surprise, we found a significant inverse correlation between methylation of TSS-A with not only transcriptional expression of isoform A (Pearson r = -0.33, P = 1.2e-5, Figure 6D), but also with isoform B (Pearson r = -0.46, P = 3.1e-10, Figure 6E), isoform C (Pearson r = - 0.44, P = 2.6e-9, Figure 6F) and GCNT2 in gene level (Pearson r = -0.48, P = 2.9e-11, Figure 6G), however, neither of TSS-B nor TSS-C methylation showed significant correlation with mRNA expression of each of the three isoforms and GCNT2 (P > 0.05), (Figure 6H). Furthermore, expression of isoform B, isoform C and GCNT2 in gene level presented strong positive correlation toward each other with the correlation coefficients (Pearson r) ranged 0.86-0.95, indicating a high level of co-expression, whereas mRNA expression of isoform A showed moderate correlations with isoform B (Pearson r = 0.37), isoform C (Pearson r = 0.40) and GCNT2 (Pearson r = 0.38), (Figure 6H). This result revealed that DNA methylation around the TSS of isoform A (TSS-A) significantly negatively correlated with all three transcripts (isoform A, B, C) and GCNT2 in gene level, and expression of isoform B and C predominantly represent the gene expression of GCNT2.
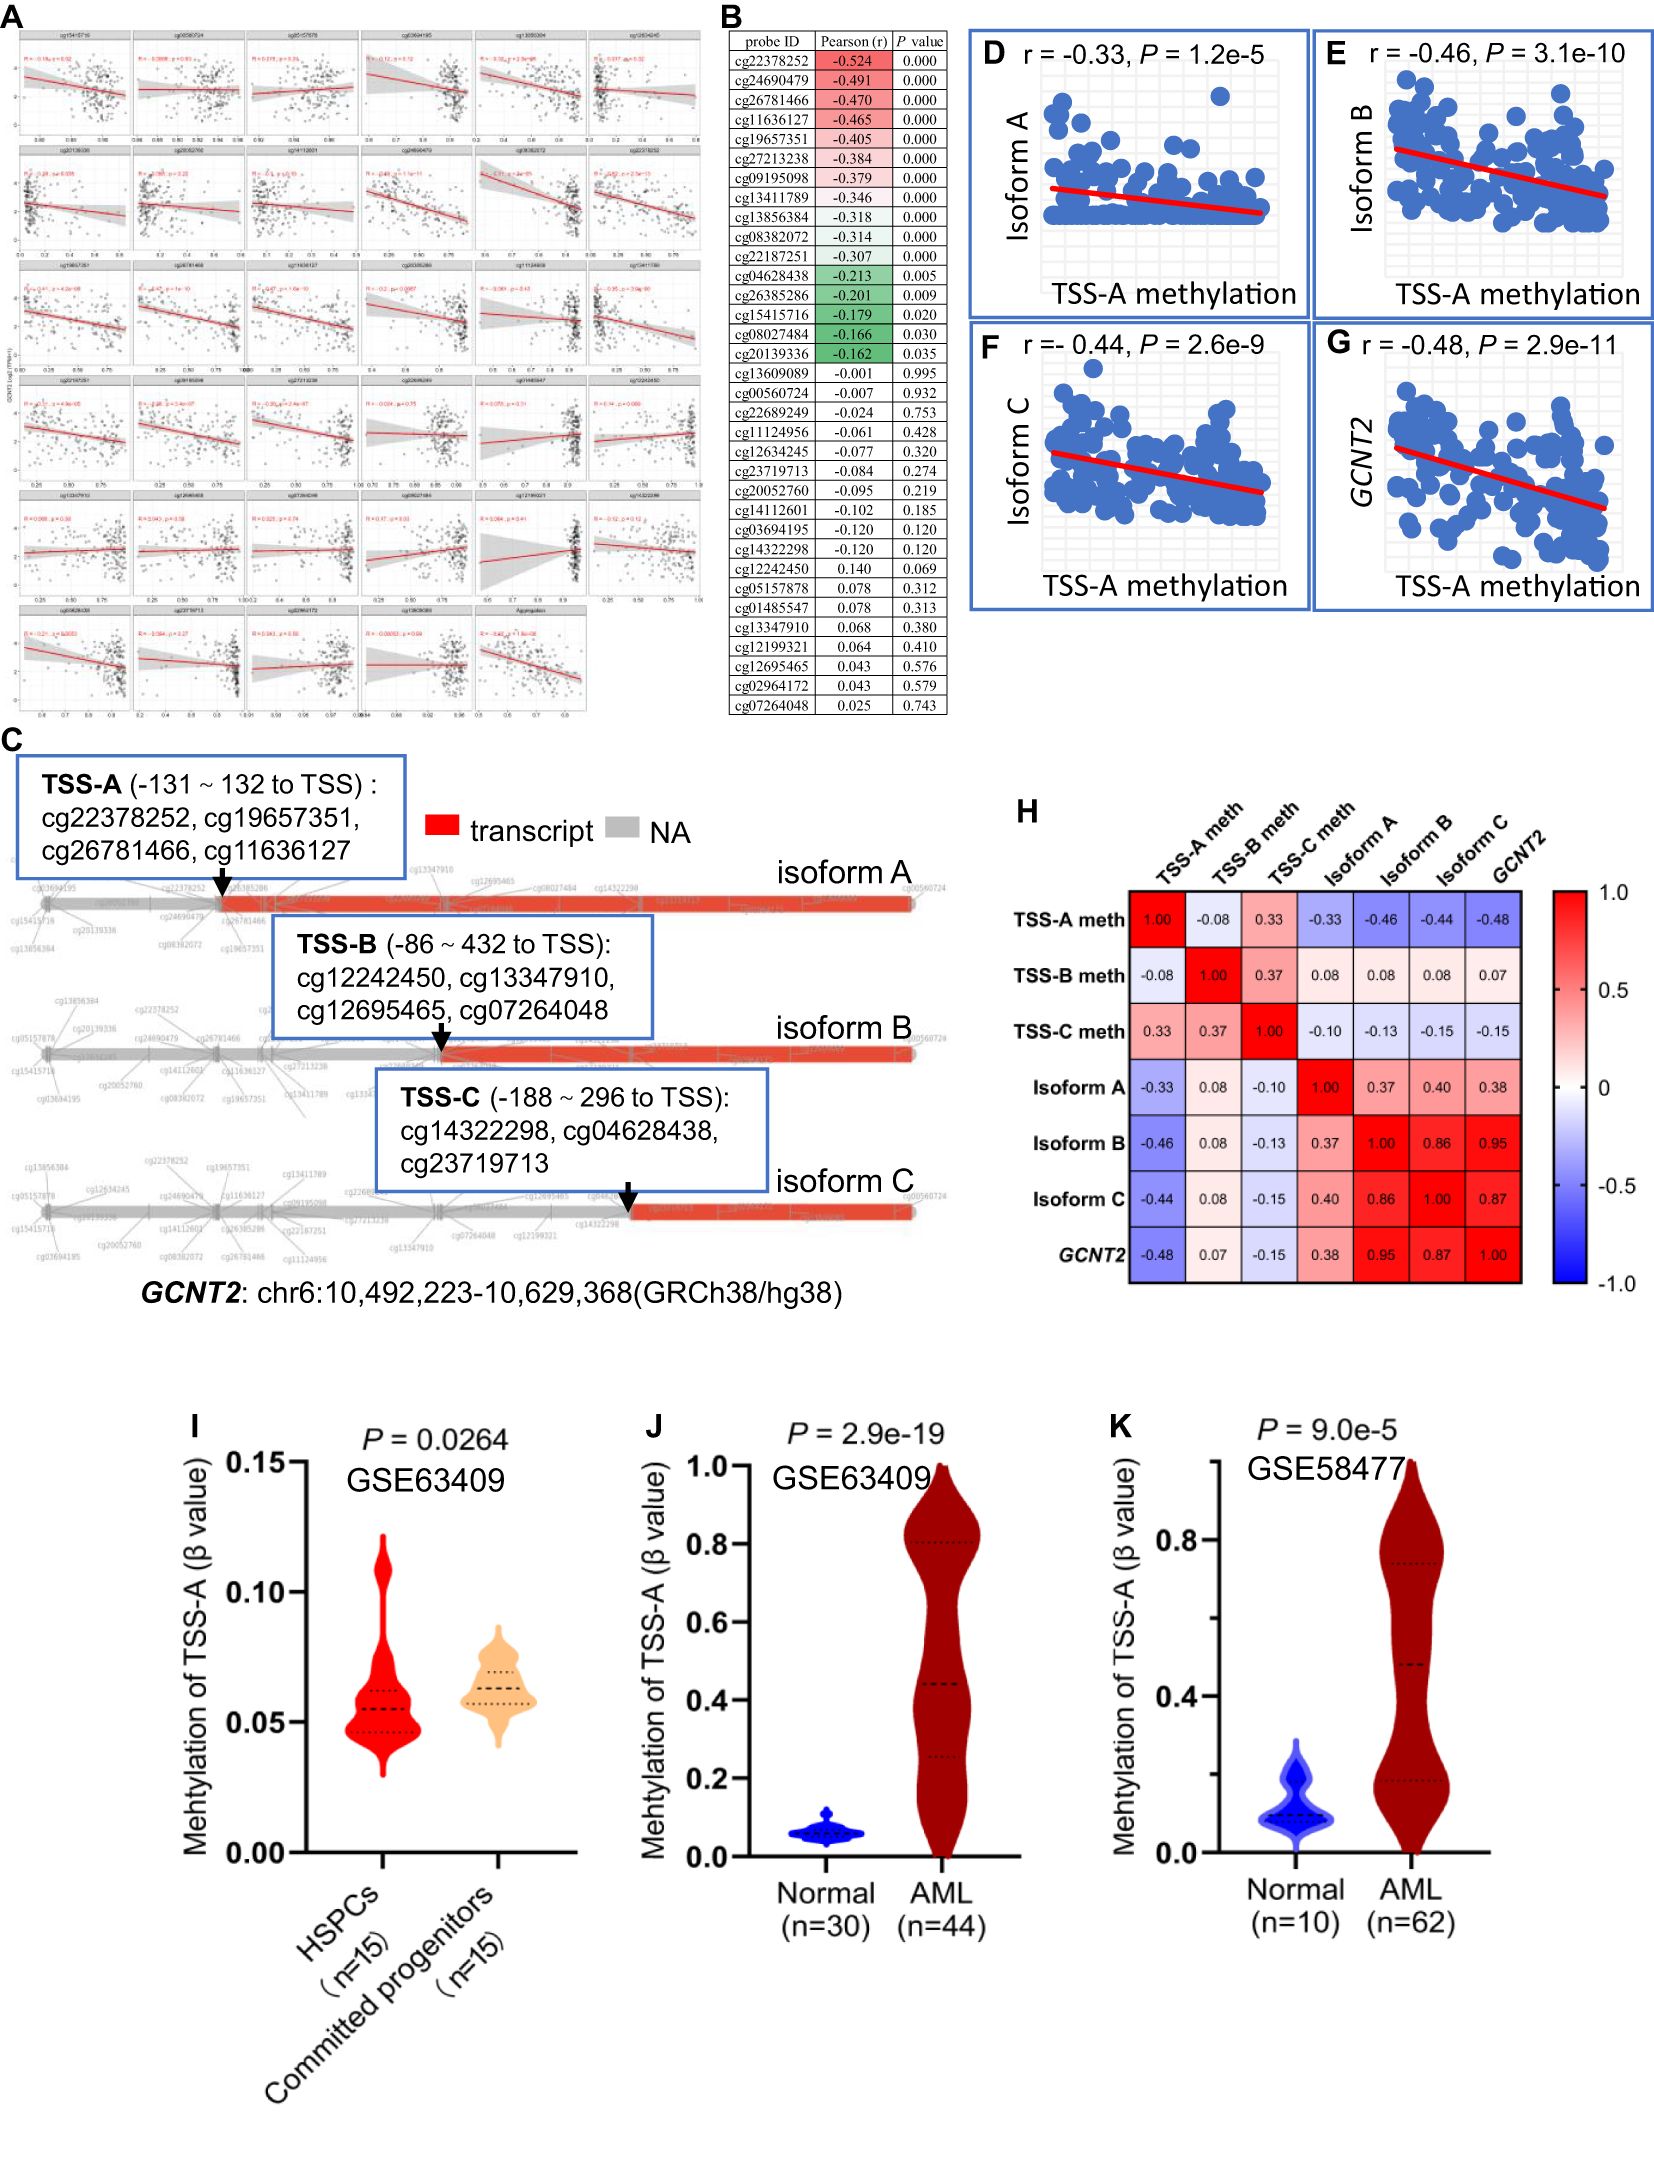
Figure 6. (A) Correlation analysis of GCNT2 expression with each of the 34 CpG sites methylation via the SMART. (B) The ranked coefficients of the 34 CpG sites with GCNT2 expression, the heatmap displayed the ranked CpG sites with P value < 0.05. (C) The genomic structure of the three isoforms (A–C) of GCNT2 were plotted by the SMART, the methylation of TSS-A, TSS-B, and TSS-C was defined as the average of the co-methylated CpG sites near each of the TSS. (D–G) Correlation analysis of TSS-A methylation with transcriptional expression of the three isoforms (A–C), and GCNT2 in gene level. (H) The correlation heatmap indicated that the DNA methylation around the TSS of isoform A (TSS-A) significantly negatively correlated with all the three transcripts [isoform (A–C)], and GCNT2 in gene level, expression of isoform B, isoform C and GCNT2 in gene level exhibited a high level of co-expression. (I) Change of TSS-A methylation in HSPCs and committed progenitors in GSE63409 study. (J, K) Aberrant methylated TSS-A was indicated in AML from 2 studies [(J) GSE63409, (K) GSE58477].
The aforementioned results showed repression of GCNT2 in more mature hematopoiesis (compared with HSPC) and AML (compared with normal hematopoiesis), (Figure 1). To define whether the methylation of isoform A (TSS-A) is responsible for the effect, the differential methylation analysis was performed on basis of the two datasets: GSE63409, GSE58477. In GSE63409, a total of 30 normal hematopoiesis samples including 15 HSPCs (HSC, MPP, L-MPP) and 15 committed progenitors (CMP, GMP, MEP) were collected for the comparison analysis, and the result demonstrated TSS-A was hypomethylated in HSPCs (P = 0.00264), (Figure 6I); on the other hand, aberrant methylation of TSS-A was revealed in AML as compared to normal in two independent studies: GSE63409 (normal=30 vs. AML=44, P = 2.9e-19, Figure 6J), GSE58477 (normal=10 vs. AML=62, P = 9.0e-5, Figure 6K). These results suggested that methylation of TSS-A was responsible for the silence of GCNT2 in mature hematopoiesis and AML.
Hypomethylation of isoform a significantly predicts poor survival in AML
Hypomethylation of GCNT2 leading to upregulation, that associated with tumor initiation, development, and metastasis, has been demonstrated in several malignancies (32–34). In CRC, the CpG island in the promoter of variant 2 (isoform B) is the key epigenetic regulator of GCNT2, and aberrant hypomethylation at this region contributed to a dismal outcome (32). To explore the value of methylation of GCNT2 in contribution to prognosis in AML, the univariate Cox regression analysis was initially performed to assay each of the 34-CpG in contribution to overall survival from TCGA-AML cohort (n=194). Notably, a total of 8 CpG sites were identified to hold the prognostic potential (Figure 7A). More importantly, the top four CpG sites (cg19657351, cg26781466, cg11636127) which contributed to the positive prognosis (HR < 1) were all the members of TSS-A, implying that hypomethylation of TSS-A was associated with poor survival; the next two sites ((cg19657351, cg08027484) near the TSS-B indicated a negative prognosis; and the last two sites (cg27213238, cg09195098), also contributing to the positive prognosis (HR<1), belongs to TSS-C, Figure 7A. In Kaplan-Meier analysis with Log-rank test, high-methylated TSS-A conferred a significantly longer survival (HR = 0.5748, P = 0.0041, Figure 7B), however, neither TSS-B methylation (P = 0.2407, Figure 7C) nor TSS-C methylation (P = 0.0746, Figure 7D) showed any the prognostic impacts on overall survival. Then using the MaxStat method, an optimal cut-off value of 0.688175 was computed to divide patients into TSS-A hypomethylation (n=117) and TSS-A hypermethylation (n=77) groups, the comparison of the survival by K-M method between the two groups produced the HR of 1.949 (95%CI: 1.326 - 2.866, P = 0.0012, Log-rank test, Figure 7E). The methylation region specific to GCNT2, designated as TSS-A, which holds significance in relation to the prognosis of AML, is depicted in Figure 7F. The distributions of clinical characteristics between the two groups based on TCGA-AML cohort were displayed in Table 3. Statistical analysis disclosed that hypomethylated TSS-A was characterized by significantly elder age (P = 0.0002, higher platelet counts (P = 0.0001), lower level of BM cellularity (P = 0.02) and blast (P = 0.0017) but more infiltration of lymphocytes (P = 0.02); meanwhile, remarkable differences could be observed in the distribution of FAB classification between the two groups (P = 0.0065), hypermethylated TSS-A significantly correlated with FAB-M3 subtype (P = 0.007), whereas, hypomethylated TSS-A was significantly associated with FAB-M5 subtype (P = 0.0363); the cytogenetic abnormalities also exhibited a notably distinctive distribution (P = 0.000), in which, more frequency of complex karyotype was assembled in hypomethylation group (P = 0.003), however, the abnormalities of t (15;17) (P = 0.0301) and t (8;21) (P = 0.0014) were more frequent in hypermethylation group; furthermore, in cytogenetic risk stratification, hypermethylation of TSS-A was associated with favorable risk group (P = 0.0319) whereas hypomethylation of TSS-A correlated with poor risk group (P = 0.0059); in respect to genomic alterations, hypomethylated TSS-A was related to high TMB (P = 0.02), and for the top 10 mutated genes, patients with TSS-A hypomethylation were intimately associated with mutations of DNMT3A (P = 0.0008), TP53 (P = 0.0018), RUNX1 (P = 0.04), WT1 (P = 0.05), by contrast, CEBPA gene mutation was determined to have more ratio in hypermethylation group (P = 0.0017). Then the Age, DNMT3Amu, CEBPAmu, RUNX1mu, WT1mu, inv (16), t (8;21), and t (15;17) were subjected to the Binary logistic regression analysis, we found that DNMT3Amu, CEBPAmu, RUNX1mu, WT1mu, inv (16), t (15;17) were independently associated with TSS-A methylation (P < 0.05, Table 4).
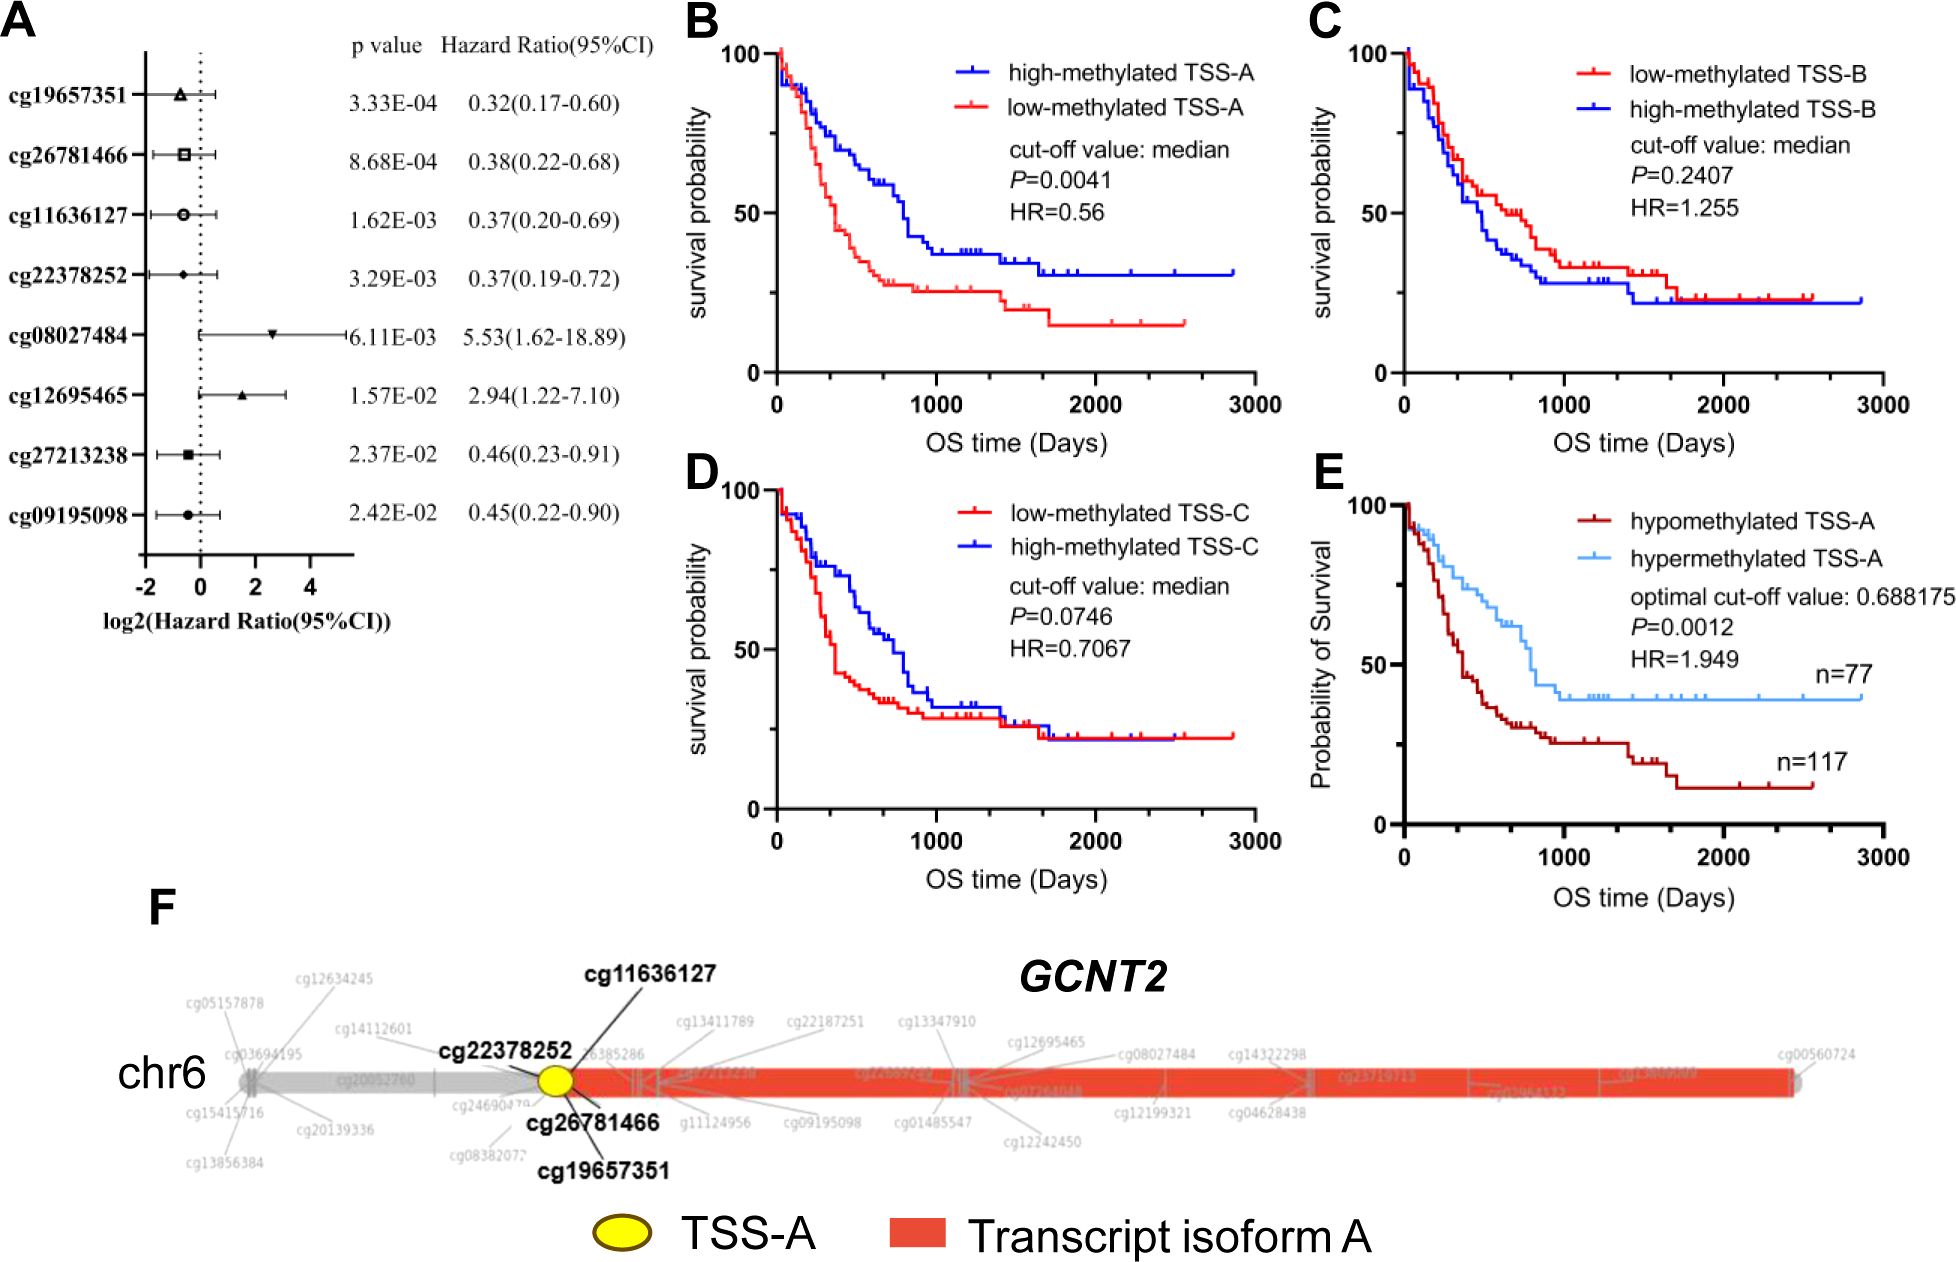
Figure 7. (A) Eight CpG sites having the prognostic potential were identified by the univariate Cox regression model. (B–D) Prognostic analysis of the three isoforms (A–C) methylation by the Kaplan-Meier Log-rank test. (E) Significantly different survival between TSS-A hypomethylation (n=117) and TSS-A hypermethylation (n=77) groups, which was divided using an optimal cut-off value of 0.688175. (F) The TSS-A region of the GCNT2, particularly focusing on four CpG sites (cg22378252, cg19657351, cg26781466, and cg11636127), is of high relevance to AML prognosis.
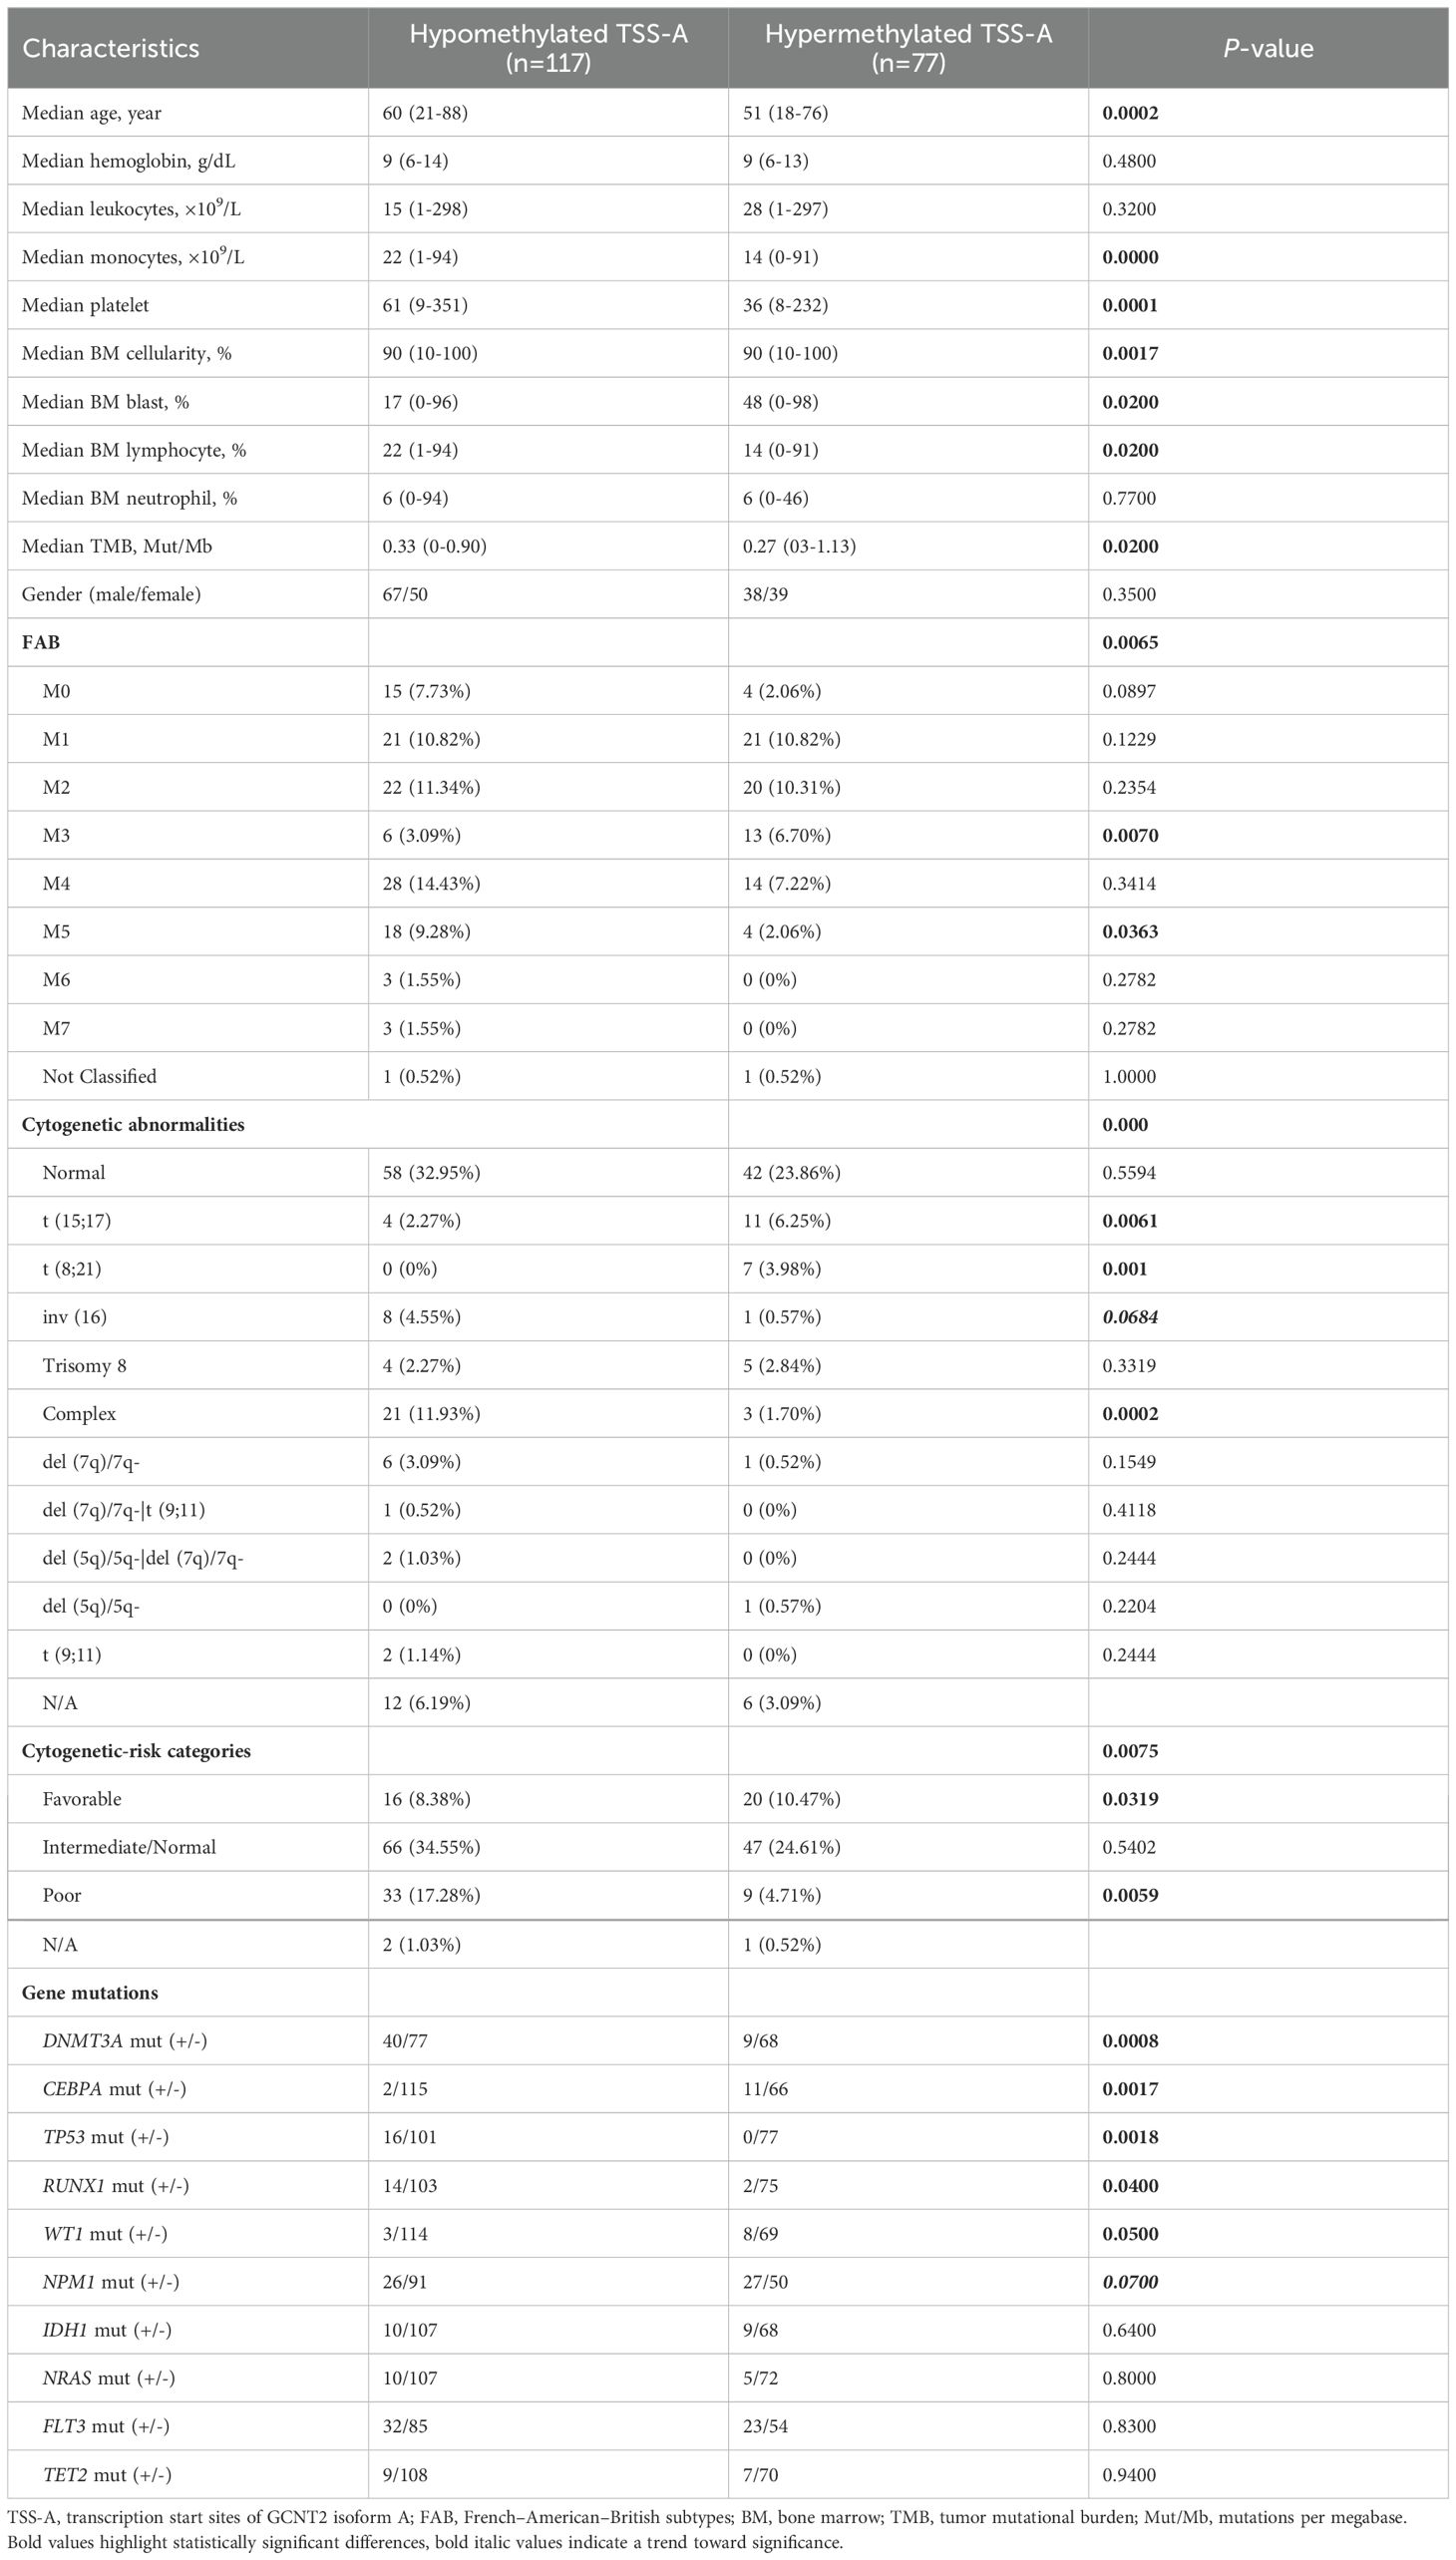
Table 3. Clinicopathological feathers of AML patients with respect to TSS-A methylation.
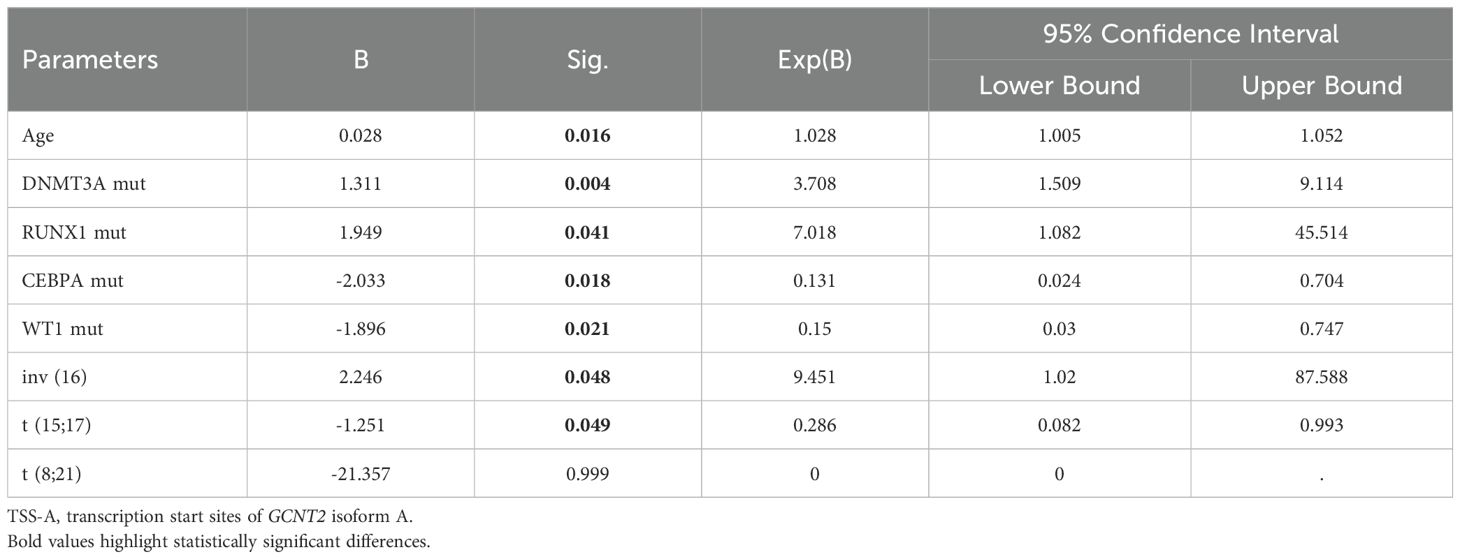
Table 4. Binary logistic regression analysis of parameters associated with TSS-A hypomethylation.
DEGs and Enrichment analyses
In comparison between the TSS-A hypomethylation vs. hypermethylation groups using the limma test with the criteria of | FC | >1.5 and FDR < 0.05, we identified 553 differentially expressed genes (DEGs), including 464 up-regulated DEGs and 98 down-regulated DEGs (Figure 8A). Then KEGG pathway and GO function enrichment analyses of these DEGs were performed based on the DAVID (version 6.8), and a total of 33 KEGG pathways and 119 GO terms (including 59 BP items, 42 CC items, and 18 MF items) was obtained using a criterion of FDR < 0.05, (Supplementary Table S1). We drew the bubble chart to visualize the top 15 enriched KEGG pathways. As exhibited in Figure 8B, Hematopoietic cell lineage was the most enriched pathway, we could also discover many enriched pathways that related to immune response, such as Phagosome, Graft-versus-host disease, Antigen processing and presentation, Th1 and Th2 cell differentiation, Th17 cell differentiation, etc.
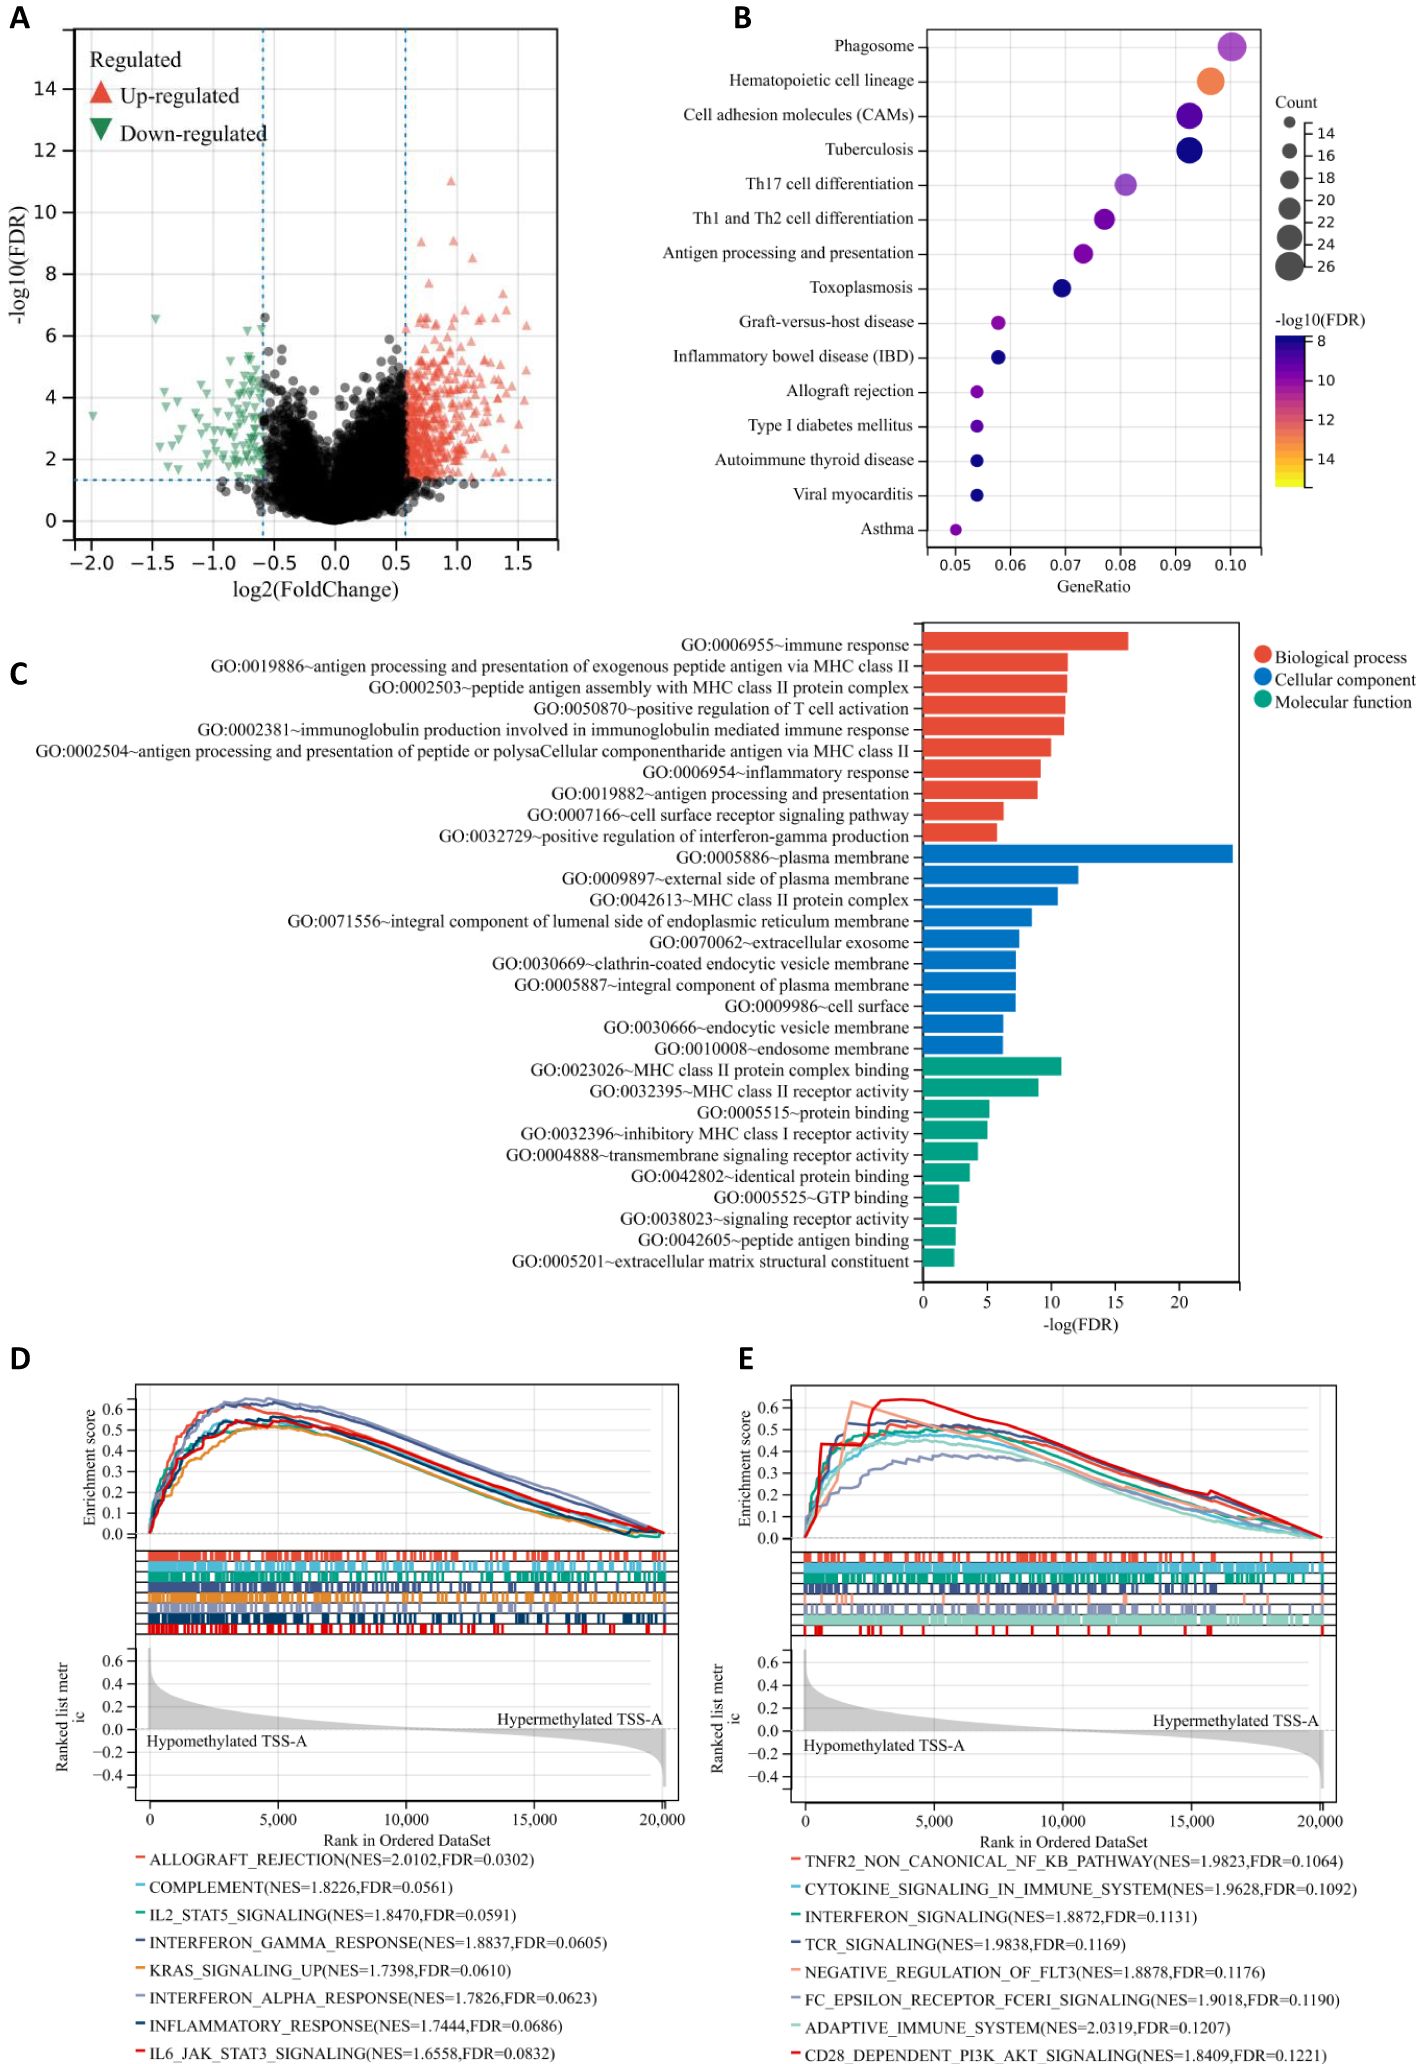
Figure 8. (A) Volcano plot of different gene-expression profiles between TSS-A hypomethylation and hypermethylation groups. (B) Bubble chart demonstrating the top 15 enriched KEGG pathways. (C) The bar graph demonstrating the top 10 enriched GO items (Biological process, Cellular component and Molecular function). (D, E) The GSEA results indicating the significantly enriched gene sets associated with TSS-A hypomethylation, (D) Analyzing with hallmark gene sets, (E) Analyzing with C2: Reactome gene sets.
Moreover, the top 10 enriched terms (BP, CC, MF) were visualized in Figure 8C, Immune response (FDR = 8.52E-17), antigen processing and presentation of exogenous peptide antigen via MHC class II(FDR = 4.65E-12), peptide antigen assembly with MHC class II protein complex (FDR = 5.10E-12), positive regulation of T cell activation (FDR = 6.85E-12), immunoglobulin production involved in immunoglobulin mediated immune response (FDR = 8.60E-12), antigen processing and presentation of peptide or polysaccharide antigen via MHC class II (FDR = 9.08E-11), inflammatory response (FDR = 5.87E-10), antigen processing and presentation (FDR = 1.04E-09), cell surface receptor signaling pathway (FDR = 4.63E-07), positive regulation of interferon-gamma production (FDR = 1.51E-06) constituted the top 10 BP terms; for the CC, the DEGs mainly enriched in plasma membrane (FDR = 5.97E-25), external side of plasma membrane (FDR = 6.72E-13), MHC class II protein complex (FDR = 2.74E-11), integral component of lumenal side of endoplasmic reticulum membrane (FDR = 2.92E-09), extracellular exosome (FDR = 2.80E-08), clathrin-coated endocytic vesicle membrane (FDR = 5.10E-08), integral component of plasma membrane (FDR = 5.10E-08), cell surface (FDR = 5.33E-08), endocytic vesicle membrane FDR = 4.91E-07), endosome membrane (FDR = 5.27E-07); the top-ranked of MF terms included MHC class II protein complex binding (FDR = 1.456E-11), MHC class II receptor activity (FDR = 8.986E-10), protein binding (FDR = 6.00E-06), inhibitory MHC class I receptor activity (FDR = 8.72E-06), transmembrane signaling receptor activity (FDR = 4.67E-05), identical protein binding (FDR = 0.0002), GTP binding (FDR = 0.0014), signaling receptor activity (FDR = 0.0022), peptide antigen binding (FDR = 0.0027), extracellular matrix structural constituent (FDR = 0.0034). All these findings suggested that samples with hypomethylation of TSS-A were critically related to immune system, and that was also confirmed by the gene set enrichment analysis (GSEA), in which, for hallmark gene sets, hypomethylation of TSS-A was positively associated with gene sets prominently including Allograft rejection, Components, IL2/SATA5 signaling, IFN-gamma response, KRAS signaling, IFN-alpha response, Inflammatory response, and IL-6/JAK/STAT3 signaling (Figure 8D); for C2: Reactome gene sets, hypomethylated TSS-A enriched in a number of gene sets related to the innate, adaptive immune systems, and the cytokine signaling in immune system, such as TNFR2 non-canonical NF-kB pathway, Cytokine signaling, Interferon signaling, TCR signaling, Negative regulation of FLT3, Fc epsilon receptor (FCERI) signaling, Adaptive Immune System, and CD28 dependent PI3K/Akt signaling (Figure 8E). All these findings above suggested the pivotal role of the DNA methylation of GCNT2 in immune regulation pathway in AML, and hypomethylation of TSS-A was involved in various processes of immune response, including antigen processing, presentation, recognition, and peptide antigen binding, cytokines/chemokines production, T cell activation, IFN-γ and INF-α signaling, etc.
Immune infiltration profile of patients with TSS-A hypomethylation
Since the important findings of hypomethylation of TSS-A in the immune system for AML from the enrichment analyses, it prompted us to explore the relationship between immune infiltration and TSS-A methylation. Multiple algorithms were implemented to evaluate the immune infiltration status of AML using TCGA RNA-seq data. First, using the ESTIMATE method (36), the ImmuneScore, StromalScore, ESTIMATEScore of each sample were calculated, and correlation analysis indicated that methylation of TSS-A was inversely correlated with ImmuneScore (cor = -0.33, P = 7.7e-6), StromalScore (cor = -0.2, P = 6.9e-3) and ESTIMATEScore (cor = -0.29, P = 7.4e-5), (Figure 9A). This result showed an intimate relationship between TSS-A methylation and immune infiltration, but the exact immune cells infiltration was not defined. Therefore, we next calculated the various immune cells infiltration of AML by employing 5 different algorithms, including CIBERCORT (37), EPIC (38), MCP-counter (39), quanTIseq (40), and xCell (41). By comparing the two AML cohorts (AML with TSS-A hypomethylation vs. AML with TSS-A hypermethylation) with t-tests, a distinctive immune infiltration was identified in TSS-A hypomethylated AML (Figure 9B): 1) much more types of immune cells were identified to enrich in TSS-A hypomethylated AML. In line with the ESTIMATE method, the higher ImmuneScore and MicroenvironmentScore were also indicated in xCell; 2) AML with TSS-A hypomethylation was significantly infiltrated with several anti-cancer immune cells, such as CD4+ T cells, CD8+ T cells, and dendritic cells, consistently in 2-4 different algorithms. The B cells, which administrate the humoral immunity, also showed higher infiltration in hypomethylated AML, which was validated in 4 different algorithms; 3) We could also observe hypomethylated AML presented more fraction of pro-cancer immune cells, macrophage M2 cells, and Tregs in quanTIseq and xCell, respectively; 4) the innate immunity participators (eosinophils, mast cells), by contrast, enriched in TSS-A hypermethylation, and the NK cells showed the opposite enrichments by MCPcounter and quanTIseq algorithms, respectively; 5) in accordance with the finding from the GEO and TCGA data above, information from xCell revealed that hypomethylation of TSS-A was associated with upregulation of HSC and monocytes, whereas hypermethylation of TSS-A was associated with the increment of CMP. These findings suggested that TSS-A hypomethylation was closely related to immune cells infiltration, both with activated immune cells (i.e. CD4+ T cells, CD8+ T cells, etc.) and immunosuppressive cells (i.e. Treg, macrophage M2 cells).
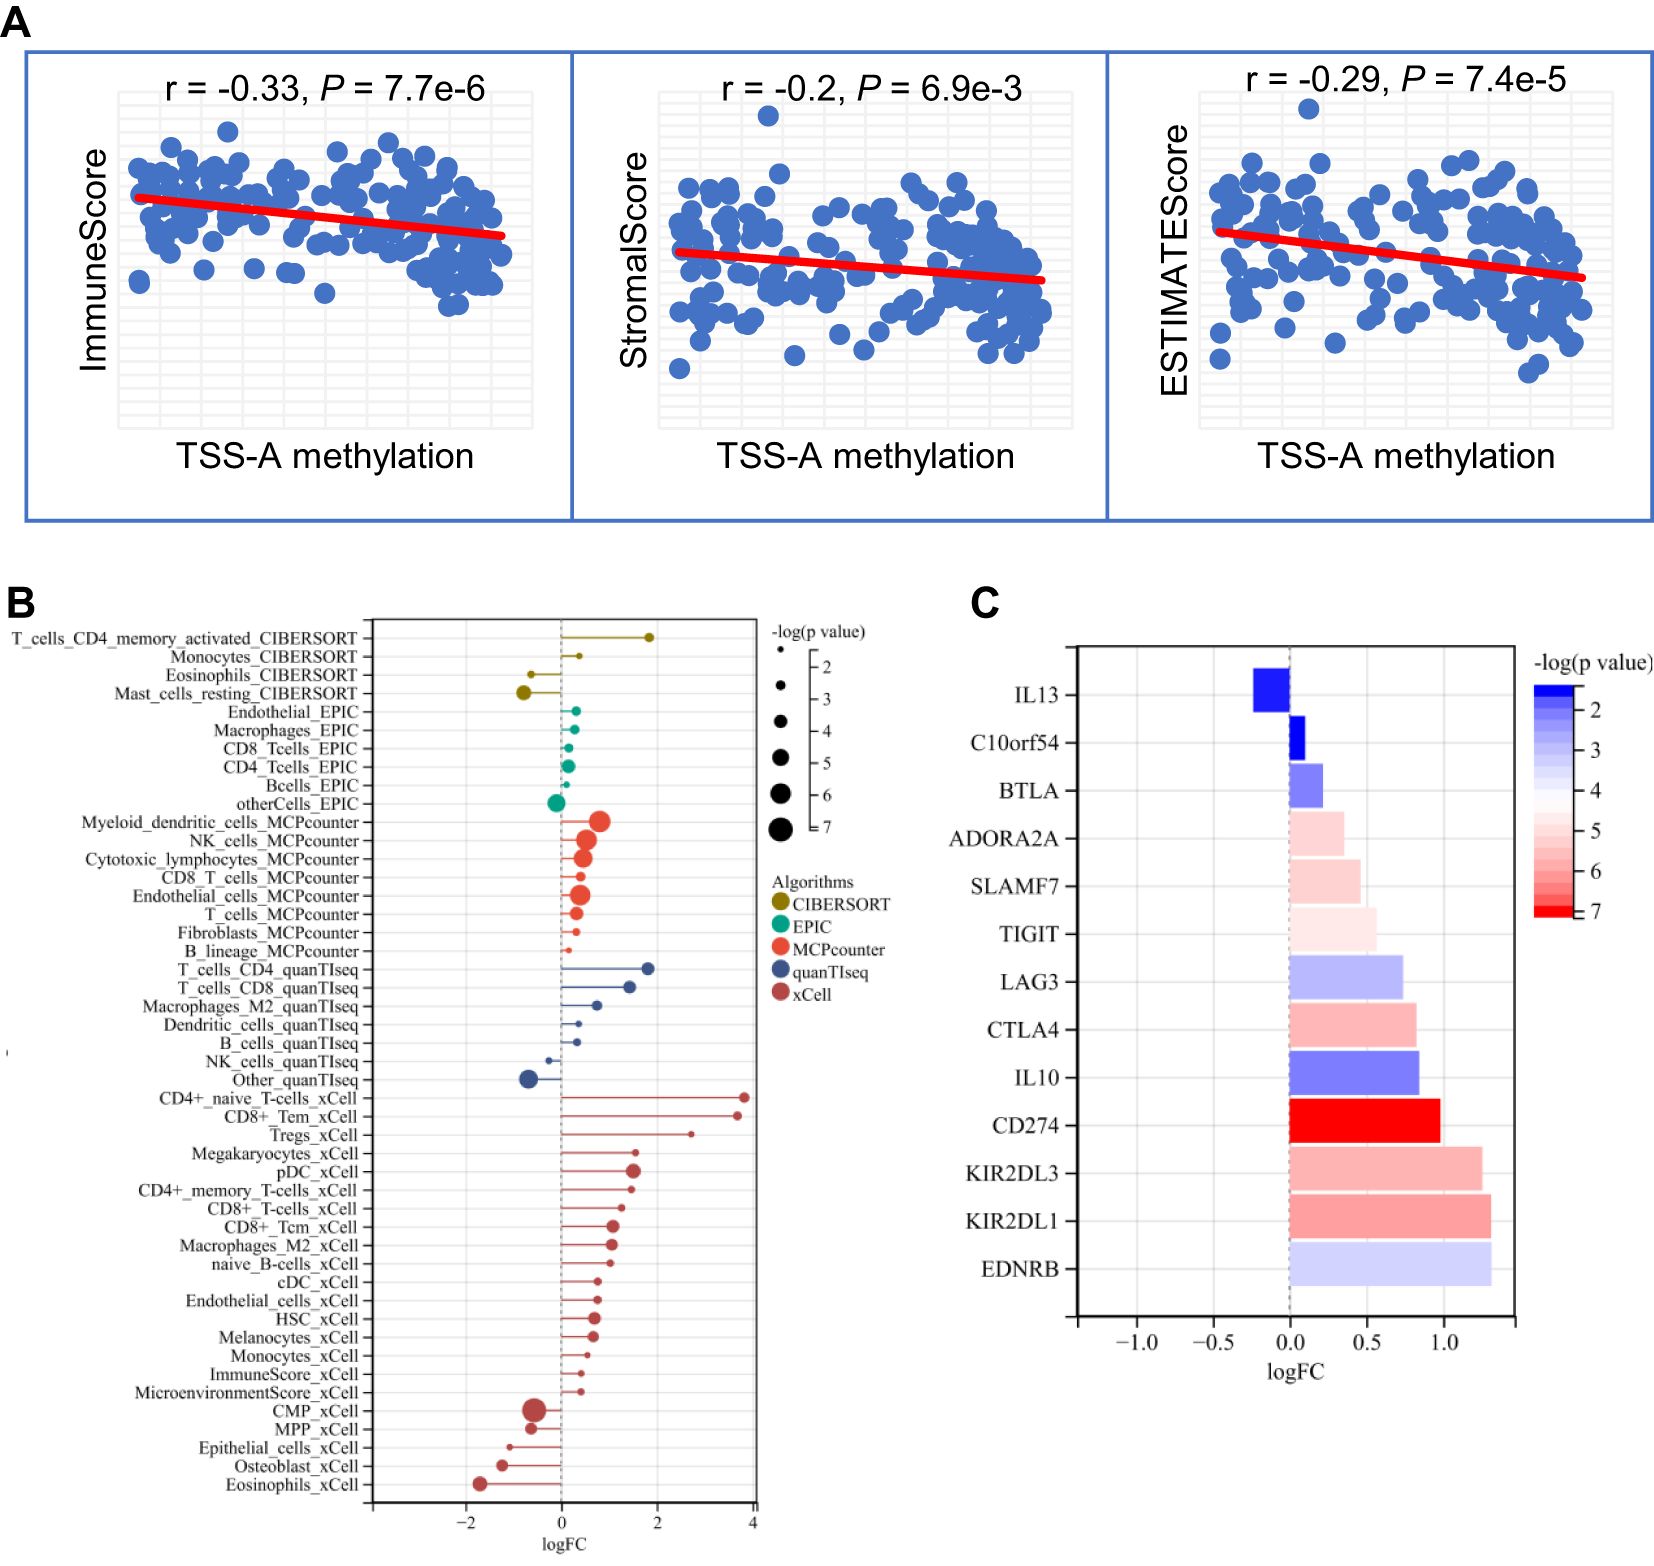
Figure 9. (A) TSS-A methylation inversely correlated with ImmuneScore, StromalScore, ESTIMATEScore computed by the ESTIMATE method. (B) Significant changes of various immune cells infiltrations by comparison of TSS-A hypomethylated vs. hypermethylated cohorts. The abundances of the immune cell were calculated using 5 different algorithms (CIBERCORT, EPIC, MCP-counter, quanTIseq, and xCell). (C) Significant changes of immune checkpoint molecules by comparing the TSS-A hypomethylated with hypermethylated cohorts, using the Mann-Whitney U test.
Hypomethylation of TSS-A is associated with the upregulation of immune checkpoint inhibitors
It was believed that tumors could evade immunosurveillance via the expression of immune checkpoint molecules, antibody-based therapies that target the immune checkpoint molecules have archived great success in anti-tumor treatment (45). To explore the relationship between TSS-A hypomethylation and expression of the ICIs, a total of 24 inhibitory immune checkpoint genes, which were derived from former literature (46), were brought into our comparison analysis (TSS-A hypomethylation group vs. TSS-A hypermethylation group, using Mann-Whitney U test), notably, we found 13 out of the 24 ICIs differentially expressed (P < 0.05, Figure 9C), to our surprise, among the 13 differentially expressed ICIs, 12 ICIs were significantly upregulated. As displayed in Figure 9C, the top 5 significantly upregulated gene was CD274 (PD-L1, P = 6.59E-08), followed by KIR2DL1 (P = 6.93E-07), KIR2DL3 (P = 1.44E-06), CTLA4 (P = 1.65E-06) and SLAMF7 (P = 4.97E-06). This result revealed that AML with TSS-A hypomethylation might be impeded by the immune checkpoint inhibitors.
Discussion
Recently, the posttranslational modulation of glycans on tumor cells has captured the attention of researchers. Aberrant glycosylation was considered as a novel hallmark of cancer, linking to multiple tumor-associated pathways such as proliferation (25), migration (23), immune evasion 13], and distant metastasis (13, 14). An emerging glycosyltransferase GCNT2, which catalyzes I-branched N-glycans, was documented to be associated with various cancers, acting as an oncogene or a tumor suppressor in different cancer types. A recent study has demonstrated a protective effect of GCNT2/I-branched glycans in melanomas, with experiments in vitro and in vivo demonstrating that GCNT2/I-branched glycans promoted melanoma growth and survival through IGF-1 and ECM-mediated signaling pathways (25). In fact, the oncogenic function of GCNT2 was reported in the most investigated cancers, including breast cancer, prostate cancer, and esophageal carcinoma (23, 24, 26). An intensive study on breast cancer has addressed the underlying mechanism of the TGF-β signaling pathway and epithelial-mesenchymal transition (EMT) induced by GCNT2 (26). On the other hand, aberrant methylation of GCNT2 was reported to be responsible for the silence of GCNT2 in CRC, and hypomethylation of GCNT2 isoform B was closely associated with disease progress and metastasis (32).
In the present study, we focused on GCNT2 and its epigenetic regulation in AML. In human normal hematopoiesis cells, we observed that expression of GCNT2 gradually decreased during the HSCs differentiation to terminal effector cells, with exception of monocytes, suggesting that GCNT2 might carry the potential in maintaining the multipotency, dedifferentiation, and self-renewal of HSC while its down-regulation induced HSCs differentiating toward to their progeny; the retaining GCNT2 in monocytes might harbor some special function worthy of further investigation. In the context of AML pathogenesis, the high expression of GCNT2 in hematopoietic stem and progenitor cells implies a potential role in the self-renewal and proliferative capacity of leukemic stem cells (LSCs). To further substantiate this finding, we correlated GCNT2 expression with currently established stemness scores in the TCGA database. Our analysis revealed a positive correlation between GCNT2 expression and stemness scores, thus providing additional evidence to support the role of GCNT2 in maintaining cellular stemness. It is well-established that LSCs are a major obstacle in the successful treatment of AML, as they are resistant to conventional therapies and capable of reinitiating the leukemic process. Therefore, the identification of GCNT2 as a potential regulator of stemness in hematopoietic cells raises the possibility that it could be a therapeutic target for disrupting the self-renewal and survival mechanisms of LSCs.
In AML, expression of GCNT2 was remarkably decreased in comparison to normal bone marrow, yet remained much higher compared to mature blood cells. The survival analysis on basis of two AML cohorts disclosed that upregulation of GCNT2 conferred an adverse outcome in AML; data from the TCGA cohort indicated that high-expressed GCNT2 correlated with multiple adverse phenotypes, such as lower HB, older age, complex karyotype, RUNX1 and NRAS mutations, and patients with GCNT2low tended to have more incidence of CEBPA mutation regarding as a favorable biomarker; besides, patients with FAB-M4,5 were more frequent with high GCNT2 expression in accordance with the observation above that expression of GCNT2 was reserved in the monocytes. These results suggested the oncogenic driver of GCNT2 in AML, and the down-regulation of GCNT2 in AML could be explained by the fact that the silence of GCNT2 was a protective effect, whereas the reactivation of GCNT2 indeed contributed to a worse outcome.
It has been reported that genetic mutation of GCNT2, leading to loss of GCNT2 expression, was responsible for the disease of adult i phenotype and congenital cataracts (19–21). In AML however, data from cBioPortal indicated that the incidence of GCNT2 mutation was only 0.1%. On the other hand, studies either on normal erythroid hematopoiesis (31) or on many solid tumors have shown a critical regulatory mechanism of GCNT2 on an epigenetic level, regarding DNA methylation. In the tumor, aberrant GCNT2 methylation was closely associated with tumor development by controlling GCNT2 expression (32–34). Indeed, our findings from the GEO database confirmed that DNA methylation was conclusively responsible for the silence of GCNT2 both in HSC differentiation and AML. This result gained a new insight that the putative stem cell-like function of GCNT2, acting as an adverse factor in AML, was suppressed by DNA methylation, and its reactivation by hypomethylation conferred the worse phenotype. A similar situation has been observed in CRC, where reduced GCNT2 was found in primary tumor tissues compared to corresponding normal mucosa, however, DNA hypomethylation inducing GCNT2 expression enhanced progression and led to poor survival (32).
Correlation analysis on the TCGA AML cohort has shown a substantially negative correlation of DNA methylation with GCNT2 transcriptional expression. Interestingly, we found that 11 CpG sites, that distributed in the three different regions (TSS-A, TSS-B, TSS-C), exhibited a co-methylation pattern, and the loci with paralleled methylation of CpG sites are neighboring and principally located in three distinct regions around the TSS of the three isoforms (A, B, and C). The way of co-methylation process influenced by structural factor has been evidenced and observed by emerging studies (47, 48). This distinct co-methylation pattern found in the TCGA-AML cohort was consistent with the other two independent AML cohorts (GSE58477, GSE63409), totally differing from that in the normal cohort, and shedding the light on the unique methylation profile of AML.
It has been documented that the determinant of transcriptional expression on the epigenetic level was the DNA methylation of the first exon (49). With regard to GCNT2, there are three different 1st exons belonging to isoforms (A, B, C). Nakamura K, et al. (32) have shown that methylation of variant 2 (isoform B) was critical for GCNT2 expression, and demethylation of variant 2 by 5 Aza-dC treatment could induce expression of all the three variants (or isoform A, B, and C) in CRC cell lines (32); hypomethylation of GCNT2 variant 2 was deemed to be the aggressive phenotype, significantly predicting dismal prognosis (32). Herein, we have demonstrated that the transcripts of isoform B and C predominantly represented the expression of GCNT2 (r = 0.95 and r = 0.87, respectively) in AML, however, it was methylation of isoform A, rather than isoform B, substantially correlated with the transcriptional level of isoform A, B, and C (r = -0.46, P = 3.1e-10 and r = -0.44, P = 2.6e-9, respectively), as well as the GCNT2 in gene level (r = -0.48, P = 2.9e-11). Therefore, the co-methylation CpG sites around the TSS of isoform A was the definitive factor driving the transcriptional expression of GCNT2. These findings suggest that, while there may be some overlap in their regulation, isoform A may also be subject to distinct regulatory influences that differentiate it from the other isoforms, and further study is needed to address the detailed mechanisms underlying these observations. Understanding the precise molecular pathways and interactions that lead to the altered methylation patterns of GCNT2 variants in AML could provide crucial insights into the progression and prognosis of this disease. Such research may involve in-depth epigenetic analysis, including the investigation of histone modifications and chromatin structure, as well as the identification of potential regulatory factors and signaling pathways involved in modulating GCNT2 methylation. Additionally, functional studies to assess the impact of these methylation changes on GCNT2 expression and function are essential to fully elucidate the biological significance of these findings. Likewise in prognosis concerning, we have dissected that hypomethylation of isoform A significantly predicted a poor outcome in AML. This was quite different from CRC, in which hypomethylation of isoform B was the poor prognosticator (32). In clinical implication, hypomethylation of isoform A was associated with the higher level of platelet and bone marrow lymphocyte and TMB, but the lower level of bone marrow blast and cellularity and more tendency of inv (16) and del (7q)/7q-, both P = 0.086; by contrast, hypermethylation of isoform A was related to more frequency of t (8:21) (P = 0.0014) and t (15;17) (P = 0.0301). In AML, the two unique subtypes: FAB-M2 with t (8:21) generating RUNX1-RUNX1T1 fusion gene, and APL or M3 with t (15;17), generating PML-RARA fusion gene, were demonstrated to interact with DNMT3A, leading to aberrant DNA methylation that contributed to leukemogenesis (50–52). Therefore, we suggested that both of the two fusion genes targeted GCNT2 by affecting DNMT3A, resulting in GCNT2 hyper-methylation. It’s also worth mentioning that 8 out of 9 patients bearing inv (16) belonged to the hypomethylated cohort (P = 0.08). AML with inv (16) is a distinctive subtype with a morphology of increasing myelomonocytes and immature basophilic granules, as was classified into FAB-M4eo (53). The CBFB-MYH11 fusion generated by inv (16) was documented to inhibit DNMT3A by disrupting recruiting RUNX1 to bind target genes, thus contributing to hypomethylation (54). In agreement with this finding, our concerned AML cohort with inv (16) conferred hypomethylation of GCNT2 and consequently led to upregulation of GCNT2, which was also supposed to be the molecular hallmark of monocytes in normal hematopoiesis as mentioned above.
Moreover, a hand of hotspot somatic mutations in AML were identified to notably correlate with methylation of GCNT2 isoform A (DMNT3A, CEBPA, RUNX1, WT1, TP53). Among these, DNMT3A, CEBPA, RUNX1, and WT1 have been well recognized to interplay and involve in DNA methylation that resulted in AML initiation and development (54–57). DNMT3A is an important gene encoding a DNA methyltransferase, which is responsible for DNA methylation in mammalian development (58). In AML, DNMT3A mutation was identified to be one of the most frequent somatic mutations, significantly conferring a worse survival (59). Function experiment has verified the mutation of DNMT3A in disrupting the ability of the methyltransferase (60). In line, DNMT3A mutation-associated GCNT2 demethylation was observed in our study, let alone mutation leading to dysfunction of DNMT3A, we also supposed that mutation-related suppression of DNMT3A may be another reason. As a matter of fact, based on the TCGA-LAML, a notable demethylation of TSS-A (P = 3.0e-5) and downregulation of DNMT3A (P = 1.2e-3) was observed in DNMT3A-mut group (Supplementary Figure S1A), furthermore, expression of DNMT3A was positively correlated with TSS-A methylation (r = 0.25, P = 9.4e-4, Supplementary Figure S1B), and significantly negatively correlated with GCNT2 expression (r= -0.32, P = 1.1e-5, Supplementary Figure S1C). In AML, CEBPA mutation is related to cytogenetically normal AML (CN-AML), mutation in CEBPA alone predicts a positive prognosis. A recent study had evidenced that CEBPA could inhibit DNMT3A activity, mutation in CEBPA resulted in the loss of the inhibitory capacity thereby leading to aberrant gene methylation (57). On the other hand, studies also revealed that the transcript factor of CEBPA could guide TET2 demethylase to the binding site, causing DNA demethylation, and mutation in CEBPA hence causing DNA hypermethylation (56). RUNX1 is another transcript factor gene that interacts with both methyltransferase (DNMT3A) (54) and demethylase (TET) (61) bringing about methylation or demethylation. Although RUNX1 mutation was reported to promote hypermethylation in AML (56), however, we observed that RUNX1 mutation was associated with GCNT2 hypomethylation, assuming that guiding DNMT3A to the binding site by RUNX1 and leading to GCNT2 methylation was blocked by the mutation in RUNX1. Another piece of evidence is that the RUNX1-RUNX1T1 fusion protein stemming from t (8;21) retained the binding site of RUNX1 which promoted methylation of target genes in AML (50, 62). Likewise, as a transcript factor, WT1 recruits TET2 to epigenetically activate target genes by demethylation (63), and mutant WT1 was evidenced to produce DNA hypermethylation in the AML cell line, typically targeting polycomb repressor complex 2 (PRC2) (55). This phenomenon was also pronounced for GCNT2 methylation in AML, where patients with WT1 mutation were enriched in hypermethylation of GCNT2 isoform A. In our Binary logistic regression model, age, inv (16), t (15;17), genes mutations of DNMT3A, CEBPA, RUNX1, and WT1 were deemed to independently correlate with methylation of GCNT2 isoform A, suggesting that the diverse phenotypic features of AML, which were attributed by distinctive cytogenetic or molecular abnormalities, came in the way of regulating GCNT2 methylation. Our research highlights the central role of GCNT2 methylation in the pathogenesis of AML.
Besides, we have demonstrated that AML with hypomethylated isoform A (TSS-A) presented a lower level of bone marrow blast and cellularity, but more infiltration of bone marrow lymphocytes, and carried higher TMB. So, we supposed that CpG methylation near the TSS of isoform A played an important role in the immune microenvironment of AML. In order to define the potential functions and underlying mechanisms that correlated with TSS-A methylation, we performed GO, KEGG enrichment analyses, and GSEA. Indeed, we found that TSS-A hypomethylation was closely involved in various processes of the immune system, activating multiple immune regulation pathways, such as IL2/SATA5 signaling, IFN-gamma and -alpha response, KRAS signaling, CD28 dependent PI3K/AKT signaling, T cell activation, Cytokine signaling, etc. Furthermore, the immune infiltration analyses on basis of RNA sequencing data have also revealed that AML with hypomethylation of TSS-A linked to higher immune cells infiltration, predominately with adaptive immune cells (e.g. CD4+ T cells, CD8+ T cells, and dendritic cells, etc.). Meanwhile, TSS-A hypomethylated AML was also observed to be associated with more abundance of Treg and macrophage M2 cells, which were deemed to mediate immune tolerance and evasion, acting as suppressors of anti-tumor immunity (64, 65). This immune infiltration pattern was in accord with the T-cell-inflamed signature, which was defined on the basis 18-gene expression profile (66). In T-cell-inflamed tumor microenvironment, the function of effector T cells was inhibited by many factors, such as Tregs or immune checkpoint molecules (e.g. PD-L1, IDO, etc.). As a matter of fact, we have found that multiple inhibitory immune checkpoint molecules were increased in TSS-A hypomethylated cohort, including CD274 (PD-L1), and CTLA4. Ongoing studies have explored the monoclonal antibody (mAb)-based immune checkpoint blockade (ICB) treatment for AML by targeting CTLA4 or PD1/PD-L1 pathway (67). However, identifying the patients who will respond to the immunotherapy remains a challenge. Cancer with high TMB will produce more neo-antigens, resulting in greater chances to trigger T-cell immune response, and TMB has been developed as a biomarker for predicting immunotherapy response (68). The current studies have confirmed that patients with T-cell-inflamed phenotype, high TMB, and expression of PD-L1 were more likely to benefit from immunotherapy (66, 69). Here, our study uncovered that TSS-A hypomethylated AML was characterized by higher TMB, more infiltration of immune cells, and upregulation of immune checkpoint genes, thus, we are able to suggest hypomethylation of TSS-A could be served as a useful biomarker to identify AML patients who will respond to immunotherapy.
Overall, we have illustrated the pro-stemness role of GCNT2 which was associated with adverse outcomes in AML and methylation of GCNT2 exhibits a distinctive manner that the CpG sites around the TSS of the three isoforms were co-methylated. In AML, the silence of GCNT2 was attributed to DNA methylation of isoform A (TSS-A). Hypomethylation of TSS-A significantly predicted poor survival, linking to multiple cytogenetic and molecular abnormalities, which were well documented to be implicated in the regulation of DNA methylation. Furthermore, methylation of TSS-A intimately correlates with the immune system, and AML with hypomethylated TSS-A presents a higher immune cell infiltration, having the T-cell inflamed phenotype, and is more likely to benefit from immunotherapy. However, this study had several limitations. Firstly, as a retrospective study based on public databases, our findings on GCNT2 expression and methylation as potential biomarkers for AML prognosis and clinical guidance requires further validation with more extensive sample sizes and prospective studies. Secondly, additional experimental and clinical studies is needed to ascertain whether targeting these mechanisms can enhance therapeutic outcomes. Lastly, the data pertaining to immune infiltration profiles linked with TSS-A hypomethylation status warrants further exploration to determine their practical utility in personalized treatment strategies. More thorough studies are required to tackle these concerns in the future. Our study has shed new insight into the relationships of genetic, epigenetic alterations, and glycosylation modification involved in AML.
Data availability statement
The datasets presented in this study can be found in online repositories. The names of the repository/repositories and accession number(s) can be found in the article/Supplementary Material.
Author contributions
D-HW: Formal analysis, Investigation, Methodology, Writing – original draft, Writing – review & editing. H-CQ: Investigation, Methodology, Writing – original draft. JX: Data curation, Formal analysis, Methodology, Software, Writing – review & editing. JL: Funding acquisition, Project administration, Supervision, Validation, Writing – review & editing. JQ: Funding acquisition, Investigation, Methodology, Project administration, Resources, Supervision, Validation, Visualization, Writing – review & editing.
Funding
The author(s) declare financial support was received for the research, authorship, and/or publication of this article. This study was supported by the Zhenjiang Clinical Research Center of Hematology (SS2018009), Suzhou Science and Technology Development Plan (SYSD2019030).
Conflict of interest
The authors declare that the research was conducted in the absence of any commercial or financial relationships that could be construed as a potential conflict of interest.
Publisher’s note
All claims expressed in this article are solely those of the authors and do not necessarily represent those of their affiliated organizations, or those of the publisher, the editors and the reviewers. Any product that may be evaluated in this article, or claim that may be made by its manufacturer, is not guaranteed or endorsed by the publisher.
Supplementary material
The Supplementary Material for this article can be found online at: https://www.frontiersin.org/articles/10.3389/fimmu.2025.1490330/full#supplementary-material
References
1. Dohner H, Weisdorf DJ, Bloomfield CD. Acute myeloid leukemia. N Engl J Med. (2015) 373:1136–52. doi: 10.1056/NEJMra1406184
2. Kokkaliaris KD, Scadden DT. Cell interactions in the bone marrow microenvironment affecting myeloid Malignancies - ScienceDirect. Blood Adv. (2020) 4(15):3795–803. doi: 10.1182/bloodadvances.2020002127
3. Short NJ, Rytting ME, Cortes JE. Acute myeloid leukaemia. Lancet (Lond Engl.) (2018) 392:593–606. doi: 10.1016/S0140-6736(18)31041-9
4. Kadia TM, Ravandi F, Cortes J, Kantarjian H. Toward individualized therapy in acute myeloid leukemia: A contemporary review. JAMA Oncol. (2015) 1(6):820–8. doi: 10.1001/jamaoncol.2015.0617
5. Chevallier P, Labopin M, Turlure P, Prebet T, Pigneux A, Hunault M, et al. A new Leukemia Prognostic Scoring System for refractory/relapsed adult acute myelogeneous leukaemia patients: a GOELAMS study. Leukemia. (2011) 25:939–44. doi: 10.1038/leu.2011.25
6. Prada-Arismendy J, Arroyave JC, Rothlisberger S. Molecular biomarkers in acute myeloid leukemia. Blood Rev. (2017) 31:63–76. doi: 10.1016/j.blre.2016.08.005
7. Döhner H, Estey E, Grimwade D, Amadori S, Appelbaum FR, Büchner T, et al. Diagnosis and management of AML in adults: 2017 ELN recommendations from an international expert panel. Blood. (2017) 129(4):424–47. doi: 10.1182/blood-2016-08-733196
8. Tyner JW, Tognon CE, Bottomly D, Wilmot B, Kurtz SE, Savage SL, et al. Functional genomic landscape of acute myeloid leukaemia. Nature. (2018) 562:526–31. doi: 10.1038/s41586-018-0623-z
9. Kantarjian H, Kadia T, DiNardo C, Daver N, Borthakur G, Jabbour E, et al. Acute myeloid leukemia: current progress and future directions. Blood Cancer J. (2021) 11:41. doi: 10.1038/s41408-021-00425-3
10. Short NJ, Konopleva M, Kadia TM, Borthakur G, Ravandi F, Dinardo CD, et al. Advances in the treatment of acute myeloid leukemia: new drugs and new challenges. Cancer discovery (2020) 10(4):506–25. doi: 10.1158/2159-8290.CD-19-1011
11. Papaemmanuil E, Gerstung M, Bullinger L, Gaidzik VI, Paschka P, Roberts ND, et al. Genomic classification and prognosis in acute myeloid leukemia. N Eng J Med. (2016) 374:2209–21. doi: 10.1056/NEJMoa1516192
12. Pinho SS, Reis CA. Glycosylation in cancer: mechanisms and clinical implications. Nat Rev Cancer. (2015) 15:540–55. doi: 10.1038/nrc3982
13. Laubli H, Borsig L. Altered cell adhesion and glycosylation promote cancer immune suppression and metastasis. Front Immunol. (2019) 10:2120. doi: 10.3389/fimmu.2019.02120
14. Häuselmann I, Borsig L. Altered tumor-cell glycosylation promotes metastasis. Front Oncol. (2014) 4:28. doi: 10.3389/fonc.2014.00028
15. Kariya Y, Oyama M, Hashimoto Y, Gu J, Kariya Y. beta4-integrin/PI3K signaling promotes tumor progression through the galectin-3-N-glycan complex. Mol Cancer Res. (2018) 16:1024–34. doi: 10.1158/1541-7786.MCR-17-0365
16. Thomas D, Sagar S, Caffrey T, Grandgenett PM, Radhakrishnan P. Truncated O-glycans promote epithelial-to-mesenchymal transition and stemness properties of pancreatic cancer cells. J Cell Mol Med. (2019) 23:6885–96. doi: 10.1111/jcmm.v23.10
17. Thomas D, Rathinavel AK, Radhakrishnan P. Altered glycosylation in cancer: A promising target for biomarkers and therapeutics. Biochim Biophys Acta Rev Cancer. (2021) 1875(1):188464. doi: 10.1016/j.bbcan.2020.188464
18. Mereiter S, Balmaa M, Campos D, Gomes J, Reis CA. Glycosylation in the era of cancer-targeted therapy: where are we heading? Cancer Cell. (2019) 36(1):6–16. doi: 10.1016/j.ccell.2019.06.006
19. Yu LC, Twu YC, Chang CY, Lin M. Molecular basis of the adult i phenotype and the gene responsible for the expression of the human blood group I antigen. Blood. (2001) 98:3840–5. doi: 10.1182/blood.V98.13.3840
20. Yu LC, Twu YC, Chou ML, Reid ME, Gray AR, Moulds JM, et al. The molecular genetics of the human I locus and molecular background explain the partial association of the adult i phenotype with congenital cataracts. Blood. (2003) 101:2081–8. doi: 10.1182/blood-2002-09-2693
21. Pras E, Raz J, Yahalom V, Frydman M, Garzozi HJ, Pras E, et al. A nonsense mutation in the glucosaminyl (N-acetyl) transferase 2 gene (GCNT2): association with autosomal recessive congenital cataracts. Invest Ophthalmol Vis Sci. (2004) 45:1940–5. doi: 10.1167/iovs.03-1117
22. Chao CC, Wu PH, Huang HC, Chung HY, Chou YC, Cai BH, et al. Downregulation of miR-199a/b-5p is associated with GCNT2 induction upon epithelial-mesenchymal transition in colon cancer. FEBS Lett. (2017) 591:1902–17. doi: 10.1002/feb2.2017.591.issue-13
23. Mikami J, Tobisawa Y, Yoneyama T, Hatakeyama S, Mori K, Hashimoto Y, et al. I-branching N-acetylglucosaminyltransferase regulates prostate cancer invasiveness by enhancing alpha5beta1 integrin signaling. Cancer Sci. (2016) 107:359–68. doi: 10.1111/cas.2016.107.issue-3
24. Peng F, He Q, Cheng C, Pan J. GCNT2 induces epithelial-mesenchymal transition and promotes migration and invasion in esophageal squamous cell carcinoma cells. Cell Biochem Funct. (2019) 37:42–51. doi: 10.1002/cbf.v37.1
25. Sweeney JG, Liang J, Antonopoulos A, Giovannone N, Kang S, Mondala TS, et al. Loss of GCNT2/I-branched glycans enhances melanoma growth and survival. Nat Commun. (2018) 9:3368. doi: 10.1038/s41467-018-05795-0
26. Zhang H, Meng F, Wu S, Kreike B, Sethi S, Chen W, et al. Engagement of I-branching {beta}-1, 6-N-acetylglucosaminyltransferase 2 in breast cancer metastasis and TGF-{beta} signaling. Cancer Res. (2011) 71:4846–56. doi: 10.1158/0008-5472.CAN-11-0414
27. Sexton RE, Hallak MNA, Uddin MH, Diab M, Azmi AS. Gastric cancer heterogeneity and clinical outcomes. Technol Cancer Res Treat. (2020) 19:1533033820935477. doi: 10.1177/1533033820935477
28. Dong Z, Zhu X, Li Y, Gan L, Chen H, Zhang W, et al. Oncogenomic analysis identifies novel biomarkers for tumor stage mycosis fungoides. Med (Baltimore). (2018) 97:e10871. doi: 10.1097/MD.0000000000010871
29. Liu Z, Hong Z, Ma H, Yu D, Qu P. Key factors mediated by PI3K signaling pathway and related genes in endometrial carcinoma. J Bioenerg Biomembr. (2020) 52:465–73. doi: 10.1007/s10863-020-09854-4
30. Perez M, Chakraborty A, Lau LS, Mohammed NBB, Dimitroff CJ. Melanoma-associated glycosyltransferase GCNT2 as an emerging biomarker and therapeutic target. Br J Dermatol. (2021) 185:294–301. doi: 10.1111/bjd.v185.2
31. Lessard S, Beaudoin M, Benkirane K, Lettre G. Comparison of DNA methylation profiles in human fetal and adult red blood cell progenitors. Genome Med. (2015) 7:1. doi: 10.1186/s13073-014-0122-2
32. Nakamura K, Yamashita K, Sawaki H, Waraya M, Katoh H, Nakayama N, et al. Aberrant methylation of GCNT2 is tightly related to lymph node metastasis of primary CRC. Anticancer Res. (2015) 35:1411–21.
33. Murakami M, Yoshimoto T, Nakabayashi K, Tsuchiya K, Minami I, Bouchi R, et al. Integration of transcriptome and methylome analysis of aldosterone-producing adenomas. Eur J Endocrinol. (2015) 173:185–95. doi: 10.1530/EJE-15-0148
34. Yang AY, Lee JH, Shu L, Zhang C, Su ZY, Lu Y, et al. Genome-wide analysis of DNA methylation in UVB- and DMBA/TPA-induced mouse skin cancer models. Life Sci. (2014) 113:45–54. doi: 10.1016/j.lfs.2014.07.031
35. Liu J, Lichtenberg T, Hoadley KA, Poisson LM, Lazar AJ, Cherniack AD, et al. An integrated TCGA pan-cancer clinical data resource to drive high-quality survival outcome analytics. Cell. (2018) 173:400–416 e411. doi: 10.1016/j.cell.2018.02.052
36. Yoshihara K, Shahmoradgoli M, Martinez E, Vegesna R, Kim H, Torres-Garcia W, et al. Inferring tumour purity and stromal and immune cell admixture from expression data. Nat Commun. (2013) 4:2612. doi: 10.1038/ncomms3612
37. Newman AM, Liu CL, Green MR, Gentles AJ, Feng W, Xu Y, et al. Robust enumeration of cell subsets from tissue expression profiles. Nat Methods. (2015) 12:453–7. doi: 10.1038/nmeth.3337
38. Racle J, de Jonge K, Baumgaertner P, Speiser DE, Gfeller D. Simultaneous enumeration of cancer and immune cell types from bulk tumor gene expression data. Elife. (2017) 6:e26476. doi: 10.7554/eLife.26476
39. Becht E, Giraldo NA, Lacroix L, Buttard B, Elarouci N, Petitprez F, et al. Estimating the population abundance of tissue-infiltrating immune and stromal cell populations using gene expression. Genome Biol. (2016) 17:218. doi: 10.1186/s13059-016-1070-5
40. Finotello F, Mayer C, Plattner C, Laschober G, Rieder D, Hackl H, et al. Molecular and pharmacological modulators of the tumor immune contexture revealed by deconvolution of RNA-seq data. Genome Med. (2019) 11:34. doi: 10.1186/s13073-019-0638-6
41. Aran D, Hu Z, Butte AJ. xCell: digitally portraying the tissue cellular heterogeneity landscape. Genome Biol. (2017) 18:220. doi: 10.1186/s13059-017-1349-1
42. Malta TM, Sokolov A, Gentles AJ, Burzykowski T, Poisson L, Weinstein JN, et al. Machine learning identifies stemness features associated with oncogenic dedifferentiation. Cell. (2018) 173:338–354 e315. doi: 10.1016/j.cell.2018.03.034
43. Inaba N, Hiruma T, Togayachi A, Iwasaki H, Wang XH, Furukawa Y, et al. A novel I-branching beta-1,6-N-acetylglucosaminyltransferase involved in human blood group I antigen expression. Blood. (2003) 101:2870–6. doi: 10.1182/blood-2002-09-2838
44. Yu LC, Lin M. Molecular genetics of the blood group I system and the regulation of I antigen expression during erythropoiesis and granulopoiesis. Curr Opin Hematol. (2011) 18:421–6. doi: 10.1097/MOH.0b013e32834baae9
45. Morad G, Helmink BA, Sharma P, Wargo JA. Hallmarks of response, resistance, and toxicity to immune checkpoint blockade. Cell. (2021) 184:5309–37. doi: 10.1016/j.cell.2021.09.020
46. Thorsson V, Gibbs DL, Brown SD, Wolf D, Bortone DS, Ou Yang TH, et al. The immune landscape of cancer. Immunity. (2018) 48:812–830 e814. doi: 10.1016/j.immuni.2018.03.023
47. Affinito O, Palumbo D, Fierro A, Cuomo M, De Riso G, Monticelli A, et al. Nucleotide distance influences co-methylation between nearby CpG sites. Genomics. (2020) 112:144–50. doi: 10.1016/j.ygeno.2019.05.007
48. Li D, Zhang L, Fu J, Huang H, Sun S, Zhang D, et al. SCTR hypermethylation is a diagnostic biomarker in colorectal cancer. Cancer Sci. (2020) 111:4558–66. doi: 10.1111/cas.v111.12
49. Brenet F, Moh M, Funk P, Feierstein E, Viale AJ, Socci ND, et al. DNA methylation of the first exon is tightly linked to transcriptional silencing. PloS One. (2011) 6:e14524. doi: 10.1371/journal.pone.0014524
50. Yang E, Guan W, Gong D, Li J, Han C, Zhang J, et al. Epigenetic silencing of UBXN8 contributes to leukemogenesis in t(8;21) acute myeloid leukemia. Exp Mol Med. (2021) 53:1902–10. doi: 10.1038/s12276-021-00695-8
51. Zeisig BB, Kulasekararaj AG, Mufti GJ, So CW. SnapShot: Acute myeloid leukemia. Cancer Cell. (2012) 22:698–698 e691. doi: 10.1016/j.ccr.2012.10.017
52. Cole CB, Verdoni AM, Ketkar S, Leight ER, Russler-Germain DA, Lamprecht TL, et al. PML-RARA requires DNA methyltransferase 3A to initiate acute promyelocytic leukemia. J Clin Invest. (2016) 126:85–98. doi: 10.1172/JCI82897
53. Bennett JM, Catovsky D, Daniel MT, Flandrin G, Galton DA, Gralnick HR, et al. Proposals for the classification of the acute leukaemias. French-American-British (FAB) co-operative group. Br J Haematol. (1976) 33:451–8. doi: 10.1111/j.1365-2141.1976.tb03563.x
54. Liu P, Liu JP, Sun SJ, Gao Y, Ai Y, Chen X, et al. CBFB-MYH11 fusion sequesters RUNX1 in cytoplasm to prevent DNMT3A recruitment to target genes in AML. Front Cell Dev Biol. (2021) 9:675424. doi: 10.3389/fcell.2021.675424
55. Sinha S, Thomas D, Yu L, Gentles AJ, Jung N, Corces-Zimmerman MR, et al. Mutant WT1 is associated with DNA hypermethylation of PRC2 targets in AML and responds to EZH2 inhibition. Blood. (2015) 125:316–26. doi: 10.1182/blood-2014-03-566018
56. Romanova EI, Zubritskiy AV, Lioznova AV, Ogunleye AJ, Golotin VA, Guts AA, et al. RUNX1/CEBPA mutation in acute myeloid leukemia promotes hypermethylation and indicates for demethylation therapy. Int J Mol Sci. (2022) 23(19):11413. doi: 10.3390/ijms231911413
57. Chen X, Zhou W, Song RH, Liu S, Wang S, Chen Y, et al. Tumor suppressor CEBPA interacts with and inhibits DNMT3A activity. Sci Adv. (2022) 8:eabl5220. doi: 10.1126/sciadv.abl5220
58. Heyn P, Logan CV, Fluteau A, Challis RC, Auchynnikava T, Martin CA, et al. Gain-of-function DNMT3A mutations cause microcephalic dwarfism and hypermethylation of Polycomb-regulated regions. Nat Genet. (2019) 51:96–105. doi: 10.1038/s41588-018-0274-x
59. Ley TJ, Ding L, Walter MJ, McLellan MD, Lamprecht T, Larson DE, et al. DNMT3A mutations in acute myeloid leukemia. N Engl J Med. (2010) 363:2424–33. doi: 10.1056/NEJMoa1005143
60. Smith AM, LaValle TA, Shinawi M, Ramakrishnan SM, Abel HJ, Hill CA, et al. Functional and epigenetic phenotypes of humans and mice with DNMT3A Overgrowth Syndrome. Nat Commun. (2021) 12:4549. doi: 10.1038/s41467-021-24800-7
61. Suzuki T, Shimizu Y, Furuhata E, Maeda S, Kishima M, Nishimura H, et al. RUNX1 regulates site specificity of DNA demethylation by recruitment of DNA demethylation machineries in hematopoietic cells. Blood Adv. (2017) 1:1699–711. doi: 10.1182/bloodadvances.2017005710
62. Li Y, Ning Q, Shi J, Chen Y, Jiang M, Gao L, et al. A novel epigenetic AML1-ETO/THAP10/miR-383 mini-circuitry contributes to t(8;21) leukaemogenesis. EMBO Mol Med. (2017) 9:933–49. doi: 10.15252/emmm.201607180
63. Wang Y, Xiao M, Chen X, Chen L, Xu Y, Lv L, et al. WT1 recruits TET2 to regulate its target gene expression and suppress leukemia cell proliferation. Mol Cell. (2015) 57:662–73. doi: 10.1016/j.molcel.2014.12.023
64. Whiteside TL. FOXP3+ Treg as a therapeutic target for promoting anti-tumor immunity. Expert Opin Ther Targets. (2018) 22:353–63. doi: 10.1080/14728222.2018.1451514
65. Pollard JW. Tumour-educated macrophages promote tumour progression and metastasis. Nat Rev Cancer. (2004) 4:71–8. doi: 10.1038/nrc1256
66. Ayers M, Lunceford J, Nebozhyn M, Murphy E, Loboda A, Kaufman DR, et al. IFN-gamma-related mRNA profile predicts clinical response to PD-1 blockade. J Clin Invest. (2017) 127:2930–40. doi: 10.1172/JCI91190
67. Vago L, Gojo I. Immune escape and immunotherapy of acute myeloid leukemia. J Clin Invest. (2020) 130:1552–64. doi: 10.1172/JCI129204
68. Chan TA, Yarchoan M, Jaffee E, Swanton C, Quezada SA, Stenzinger A, et al. Development of tumor mutation burden as an immunotherapy biomarker: utility for the oncology clinic. Ann Oncol. (2019) 30:44–56. doi: 10.1093/annonc/mdy495
69. Ott PA, Bang YJ, Piha-Paul SA, Razak ARA, Bennouna J, Soria JC, et al. T-cell-inflamed gene-expression profile, programmed death ligand 1 expression, and tumor mutational burden predict efficacy in patients treated with pembrolizumab across 20 cancers: KEYNOTE-028. J Clin Oncol. (2019) 37:318–27. doi: 10.1200/JCO.2018.78.2276
Keywords: GCNT2, DNA methylation, acute myeloid leukemia, stemness scores, survival, immunotherapy
Citation: Wu D-h, Qiu H-c, Xu J, Lin J and Qian J (2025) Hypomethylation of GCNT2 isoform A correlates with transcriptional expression and is associated with poor survival in acute myeloid leukemia. Front. Immunol. 16:1490330. doi: 10.3389/fimmu.2025.1490330
Received: 03 September 2024; Accepted: 27 January 2025;
Published: 17 February 2025.
Edited by:
Laia Querol Cano, Radboud University Medical Centre, NetherlandsReviewed by:
Cristian Sandoval, University of La Frontera, ChileYuting Dai, Shanghai Institute of Hematology, China
Copyright © 2025 Wu, Qiu, Xu, Lin and Qian. This is an open-access article distributed under the terms of the Creative Commons Attribution License (CC BY). The use, distribution or reproduction in other forums is permitted, provided the original author(s) and the copyright owner(s) are credited and that the original publication in this journal is cited, in accordance with accepted academic practice. No use, distribution or reproduction is permitted which does not comply with these terms.
*Correspondence: Jun Qian, cWlhbmp1bjAwMDdAaG90bWFpbC5jb20=