 Gulfiya Kadyrzhanova
 Shukla Sarkar
 Rajkumar Singh Kalra
 Hiroki Ishikawa
94% of researchers rate our articles as excellent or good
Learn more about the work of our research integrity team to safeguard the quality of each article we publish.
Find out more
ORIGINAL RESEARCH article
Front. Immunol. , 24 January 2025
Sec. Cancer Immunity and Immunotherapy
Volume 16 - 2025 | https://doi.org/10.3389/fimmu.2025.1484303
This article is part of the Research Topic Mechanisms and Therapeutic Opportunities of T Cell Impairment in Cancer Immunity and Immunotherapy View all 9 articles
Age-associated defects in T cell-mediated immunity can increase the risk of cancers, but how aging influences adoptive T-cell therapy (ACT) for cancers remains unclear. Here, using a mouse model of melanoma, we demonstrate that aging diminishes anti-tumor activity of engineered CD8 T cells expressing a tumor-specific T cell receptor (CD8 TCR-T cells) in ACT for solid tumors. Aged CD8 TCR-T cells cannot control tumor growth in either young or aged mice. Aged CD8 TCR-T cells are unable to accumulate efficiently in tumors and have higher tendency to become terminally exhausted T cells with lower expression of endothelial PAS domain-containing protein 1 (Epas1) compared to young cells. Crispr-mediated ablation of Epas1 promotes terminal exhaustion of young CD8 T cells in tumors, diminishing their anti-tumor activity in young mice. Conversely, retroviral expression of Epas1 enhances anti-tumor activity of aged CD8 TCR-T cells. These findings suggest that aging-induced reduction of Epas1 expression impairs anti-tumor activity of CD8 T cells in ACT against solid tumors, which can be therapeutically improved by expression of exogenous Epas1.
Age-related decline in T cell functions appears to increase risks of various infectious diseases and cancers in elderly people (1). Aging decreases naïve T cell abundance, while increasing numbers of dysfunctional T cell subsets, such as virtual memory T cells and senescent-like T cells (2). Additionally, aging diminishes diversity in the T cell receptor (TCR) repertoire in the circulating T cell population, leading to loss of specificity to specific pathogens and cancers (3–8). Furthermore, aging suppresses TCR signaling (9, 10) and metabolic reprogramming (11, 12) in T cell activation. Although there are conflicting reports and it remains controversial (12–14), several animal studies reported negative impacts of aging on anti-tumor CD8 T cell responses and immune checkpoint blockade responses (15–19).
Adoptive cell therapy (ACT) using engineered CD8 T cells is a promising approach to treat cancers. With this approach, autologous or allogenic CD8 T cells transduced with tumor antigen-specific TCRs (CD8 TCR-T cells) or chimeric antigen receptors (CAR-T cells) are cultured in vitro and then adoptively transferred into patients (20). CAR-T cells directly recognize cell surface antigens (21), whereas CD8 TCR-T cells recognize peptides presented by major histocompatibility complex (MHC) class I (22). Adoptive transfer of these engineered CD8 T cells provides a crucial solution to the lack of specificity for tumor antigens in the endogenous TCR repertoire of patients. Additionally, in vitro activation and clonal expansion of these engineered CD8 T cells can be optimized to yield a large number of cells for ACT. High efficacy of ACT with engineered CD8 T cells has been confirmed across numerous tumor models in both pre-clinical and clinical studies (23–28), but impact of aging on efficacy of such therapy is unknown.
In this study, we investigated effects of aging on anti-tumor efficacy of ACT with tumor-antigen-specific CD8 TCR-T cells in a mouse model of melanoma. We found that ACT with young CD8 TCR-T cells effectively reduces tumor growth in young mice, whereas ACT with aged CD8 TCR-T cells fails to control tumor growth in both young and aged mice. Furthermore, we show that Epas1 expression is significantly reduced in aged CD8 T cells, and loss of Epas1 impairs anti-tumor responses of young CD8 T cells in ACT. Moreover, retroviral expression of Epas1 improves anti-tumor responses of aged CD8 T cells in ACT. These results suggest that aging-induced downregulation of Epas1 negatively impacts ACT with engineered CD8 T cells.
Young (8-16 weeks old) and aged (68-96 weeks old) C57BL/6 mice were obtained from Jackson Laboratory. OT-I mice (CD45.1+CD45.2+) were obtained by breeding of OT-I mice (CD45.1−CD45.2+) (Jackson, 003831) and B6SJL mice (CD45.1+CD45.2−) (Jackson, 002014). All mice were maintained under specific pathogen-free conditions. Female mice were used in all experiments. All animal experiments were approved by the Animal Care and Use Committee at Okinawa Institute of Science and Technology Graduate University.
CD8 T cells were isolated from spleens of mice, by homogenizing them with a 70-μm cell strainer to release splenocytes, and the cell suspension was washed with MACS buffer. Erythrocytes were lysed by incubating the cell suspension in ammonium-chloride-potassium (ACK) buffer for 5 min. Then cells were resuspended in MACS buffer and centrifuged at 1,500 rpm for 5 min. CD8 T cells were negatively selected using a MojoSort Mouse CD8 T Cell Isolation Kit (Biolegend, 480035). CD8 T cells were then resuspended in complete RPMI-1640 media containing 2 mM L-glutamine, 1% HEPES (Life technologies; 15630080), 1 mM sodium pyruvate (Thermo Fisher, 11360070), 10 mM MEM non-essential amino acids (Thermo Fisher, 11140050), 0.05 mM 2-mercaptoethanol (Gibco, 21985-023), 10% fetal bovine serum (FBS) (Nichirei Bioscience, 173012) and 1% penicillin and streptomycin. CD8 T cells were activated for 24 h with an anti-CD3e antibody (5 μg/mL, Biolegend, 100340)-coated plate with soluble Ultra-LEAF purified anti-mouse CD28 antibody (2.5 μg/mL, Biolegend, 102116) and IL-2 (10 ng/mL, Biolegend, 575406). In some experiments, CD8 T cells were activated with Dynabeads Mouse T-activator CD3/CD28 beads (Gibco, 11456D).
pMIGR1-OT-I was generated by cloning a DNA cassette encoding TCRα-V2 and TCRβ-V5.2 linked to an intervening self-cleaving T2A peptide, obtained from TCR OT-I-2A.pMIGII plasmids (a gift from Dario Vignali (29) [Addgene, 52111]), into the pMIGR1 retroviral vector plasmid (Addgene, 27490). pMSCV-Epas1-Thy1.1 was generated by cloning Epas1 cDNA (Thermo Fisher, MMM1013-202767912) into pMSCV-IRES-Thy1.1 (Addgene, 17442).
Platinum-E (Plat-E) cells were seeded in 100-mm culture dishes. Once they reach 50-70% confluency, they were transfected with 10 μg pMIGR1-OT-I or pMSCV-Epas1-Thy1.1 and 4.5 μg pCL-Eco retrovirus packaging vector (Addgene, 12371) using polyethylenimine (PEI: Polysciences, lnc, 24765). Briefly, plasmid DNA was mixed with PEI at a ratio of DNA: PEI=1:5 in 2.5 mL of Opti-MEM (Invitrogen, 31985-062), vortexed, and incubated for 30 min at room temperature (RT). This transfection mixture was added to walls of culture dishes without disturbing attached Plat-E cells. After 16-18 h, media were replaced with fresh media. GFP signals were checked after 48 h using fluorescent microscopy, to assess transfection efficiency. Virus supernatant was collected 72 h after transfection, and viral particles were concentrated by ultracentrifugation for 2-2.5 h at 24,000 g at 4°C with a Beckman Coulter Optima XPN-100 ultracentrifuge. The viral pellet was resuspended in complete RPMI media and used for retroviral transduction.
To generate OT-I TCR-T cells, CD8 T cells were transduced with MIGR1-OT-I retroviral vector. Retroviral transduction was performed as described previously (30). Non–treated cell-culture 24- or 48-well plates were coated with 0.5 mL of recombinant RetroNectin (20 μg/mL, Takara Bio) overnight at 37°C, washed in PBS, and blocked with 0.5 mL of 2% bovine serum albumin (BSA) in PBS. Retroviral suspension was added to the plate, which was spun at 2,000 g for 2 h at 32°C in pre-warmed Beckman Coulter Allegra X-12R centrifuge for RetroNectin-retrovirus binding. Then, the supernatant was aspirated. For retrovirus transduction, on day -1, CD8 T cells were activated with anti-CD3 antibody, anti-CD28 antibody and IL-2 for 24 h. On day 0, cells were resuspended in culture media supplemented with IL-2 (5 ng/mL), transferred to wells of a plate coated with RetroNectin-retrovirus (1 x 10⁶ cells/well in 24-well plates or 0.5 x 10⁶ cells/well in 48-well plates), and incubated until day 2. From day 3 to day 8, cells were cultured with media containing 10 ng/mL of both IL-7 (Biolegend, 577802) and IL-15 (Biolegend, 566301), but not IL-2, and media were refreshed every other day. OT-I TCR-T cells expanded until day 8 were used for adoptive transfer experiments. For transduction of CD8 T cells with MIGR1-OT-I and MSCV-Epas1-Thy1.1, cells activated with anti-CD3 antibody, anti-CD28 antibody and IL-2 for 2.5 days were first infected with MSCV-Epas1-Thy1.1. 1 day later, cells were subsequently infected with MIGR1-OT-I.
To prepare a pair of two Epas1-specific gRNA, each crRNA targeting Epas1 (5’-GGCGACAATGACAGCTGACA-3’ or 5’-AGAAATCCCGTGATGCCGCG-3’) were mixed with TracRNA and incubated for 5 min at 95°C in a PCR thermocycler then cooled to RT. Negative control crRNA #1 (Integrated DNA Technologies) was used as a negative control. gRNA was mixed with Cas9 and incubated for 10 min at RT. CD8 T cells were isolated and incubated overnight in a complete RPMI-1640 medium supplemented with IL-7. Cells were collected, washed, and resuspended in P4 primary cell nucleofector solution. Naïve cell suspension was added to solution containing a pair of gRNA-Cas9 specific to Epas1 and loaded into the cuvette wells. Nucleofection was done using Lonza 4D Nucleofector Core Unit using DS189 program. Cells were then collected and recovered in CM supplemented with IL-7 in the incubator overnight.
Cell numbers and viability were analyzed using a Muse Count & Viability Kit (Luminex, MCH100102) according to manufacturer instructions.
For analysis of cell surface molecules, cells were stained with fluorochrome-conjugated antibodies in PBS containing 2% FBS for 20 min on ice. For analysis of intracellular molecules, cells were subjected to antibody staining using a Foxp3 staining buffer set (eBioscience, 005253-00), according to manufacturer instructions. For analysis of intracellular cytokines, cells were cultured with phorbol 12-myristate 13-acetate (Sigma, P8139, 50 ng/mL), ionomycin (Sigma, I9657, 500 ng/mL), and brefeldin A (Biolegend, 420601, 5 μg/mL) for 6 h. Prior to antibody staining, cells were incubated with anti-Fc receptor-blocking antibody (anti-CD16/CD32; Biolegend, 101320) and NIR-Zombie (Biolegend, 423106). Anti-CD8a (53-6.7, Biolegend), anti-CD44 (IM7, Biolegend), anti-CD62L (MEL-14, Biolegend), anti-PD1 (RMP1-30, Biolegend), anti-Tim3 (RMT3-23, Biolegend), anti-CD45.1 (A20, Biolegend), anti-CD45.2 (104, Biolegend), anti-Tox (TXRX10, e-bioscience), anti-GzmB (GB11, Biolegend), anti-IFN-γ (XMG1.2, Biolegend), anti-Perforin (S16009A, Biolegend), anti-TNFα (MP6-XT22, Biolegend), and anti-Thy1.1 (OX-7, Biolegend) were used. Samples were analyzed using a BD FACS Aria III, and data analysis was performed using FlowJo software.
B16-OVA cells in complete RPMI-1640 media were seeded into 96 well-plates (1 x 10⁴ cells in 100 μL media/well). Sixteen hours later, media were replaced with 200 μL of complete RPMI-1640 media containing T cells expressing OT-I TCR (3 x 10⁴ cells in 200 μL media/well). This makes a 1:3 target-to-effector ratio. Cells were cultured for 72 h in the absence of any cytokines. To evaluate cytotoxicity of T cells, after 72 h of co-culture, viability of B16-OVA target cells was assessed by staining cells with Annexin V (Biolegend, 640919) and ZombieNIR (Biolegend, 144 423106), followed by flow cytometry analysis. B16-OVA cells were distinguished from T cells by the absence of CD8 expression. In experiments evaluating division of T cells, prior to co-culture, T cells were stained with CytoTellRed (AAT Bioquest, 22255) or carboxyfluorescein succinimidyl ester (CFSE: Biolegend, 23801) for 20 min at 37°C. After co-culture, cells were collected, washed, and dye dilution was analyzed using flow cytometry.
Mouse B16-OVA MO4 melanoma cell line (Sigma-Aldrich, SCC420) was cultured in the RPMI-1640 (Thermo Fisher, 11875093) growth medium supplemented with 10% FBS, MEM non-essential amino acids, 10 mM HEPES, 2-mercaptoethanol, 1mg/ml geneticin (Gibco, 10131035), penicillin and streptomycin (Sigma, P4333-100ML). A monolayer culture of B16-OVA cells was harvested with trypsin, washed twice with PBS, and resuspended in PBS. 2 x 10⁵ cells (in 100 μL PBS) were subcutaneously injected into the right flank of mice. Before injection, fur was removed from the injection site for measurement of tumor size. Mice were monitored, and tumor length (L: greatest longitudinal measurement) and width (W: greatest transverse measurement) were measured using digital caliper every other day. Tumor volume calculation: V=(L x W2)/2. During the analysis (until day 20 post-tumor injection), no mice died and did not have tumors beyond 20 mm in diameter, the humane endpoint for the analysis.
Adoptive transfer of OT-I TCR-T cells or OT-I T cells was performed by intravenously injecting cells into mice on day 8 after tumor transplantation. The tumor size on the day of adoptive transfer was below 2.5-5.0 mm in both length and width. OT-I TCR-T cells were prepared as described above and were subjected to flow cytometry analysis of GFP to assess retroviral transduction efficiency immediately before adoptive transfer. Subsequently, OT-I TCR-T cells including 106 GFP+ cells were injected to each of C57BL/6 recipient mice. For adoptive transfer of Epas1-Crispr-treated OT-I T cells, OT-I T cells (CD45.1+CD45.2+) were nucleofected with Epas1-Crispr as described above, and then activated with anti-CD3 and anti-CD28 antibodies and IL-2 for 24 h. Cells were then cultured in the presence of IL-7 and IL-15 (10 ng/ml each) for 6 days. Subsequently, 106 of these OT-I T cells were adoptively transferred into each of congenic recipient mice (CD45.1−CD45.2+).
Lymphocytes isolated from tumors were stained with anti-CD8a antibody and ZombieNIR. Adoptively transferred cells (CD8+ZombieNIR-GFP+) were FACS-sorted. Single-cell suspensions were incubated with anti-mouse CD16/32 (TruStain fcX) antibody for 10 min at 4°C. TotalSeq-C0301 (Biolegend, 155861) and TotalSeq-C0302 (Biolegend, 155863) hashtag antibodies were used to stain aged and young cell suspensions, respectively, for 30 min at 4°C. Cell suspensions were washed three times, filtered through a cell strainer, and pooled. Samples were loaded into a 10X Genomics Chromium Next GEM. Library preparation was performed using Chromium next GEM single-cell 5’ reagent kits v2 (dual index) according to manufacturer instructions. Sequencing was performed on a NovaSeq 6000 SP (Illumina) with a target of 65,000 reads per sample.
CellRanger single-cell software (10x Genomics, v6.1.2) was used for barcode processing, demultiplexing, and transcript counting to obtain a unique molecular identified (UMI) count matrix. Alignment was done on a mm10 reference genome. scRNA-seq data was analyzed using the R package, Seurat (by Satija Lab). Standard pre-processing was used to filter low-quality cells with feature counts fewer than 200 and more than 9500, excluding those with mitochondrial counts of over 5%. Data were normalized using the LogNormalize function. Next, FindVariableFeatures and ScaleData functions were employed before downstream analysis. Further principal component analysis (PCA) and RunTSNE with t-distributed stochastic neighborhood embedding (t-SNE) dimensional reduction were used, and cells were clustered. 831 young cells and 1,494 aged cells were detected for t-SNE visualization of Cd8a-expressing cell populations. FindMarkers was also used to identify differentially expressed genes in aged and young samples. Gene set enrichment analysis (GSEA) was performed based on genes ranked by fold changes in expression between aged and young OT-I TCR-T cells.
CD8 T cells treated with Epas1-Crispr or control-Crispr were FACS-sorted from tumor tissues. Total RNA was obtained from samples using an RNAdvance Cell V2 kit (Beckman Coulter). RNA concentration was measured on a Qubit Flex Fluorometer using an RNA HS assay kit (Thermo Fisher). A library was prepared using a QuantSeq3’ mRNA-Seq Library Prep Kit FWD for Illumina (Lexogen) with 4 ng of RNA per sample. Libraries were quantified using a Qubit 1x dsDNA HS assay kit on a Qubit Flex Fluorometer. Quality checking of libraries was performed using a High Sensitivity D5000 ScreenTape with a Tapestation 2200 (Agilent). Libraries were then pooled and subjected to sequencing on a NovaSeq 6000 (Illumina) with 1x100-bp reads.
Proteins were extracted using RIPA buffer (Wako, 182-02451) with a protease inhibitor cocktail (Roche, 04693116001). Lysates were denatured with 5X loading buffer (250 mM Tris-HCl pH 6.8, 5% β-mercaptoethanol, 30% glycerol, 10% SDS, and 0.1% bromophenol blue) and resolved on SDS polyacrylamide gel electrophoresis. Proteins on the gel were transferred on PVDF (Trans-Blot Turbo™ Mini PVDF, Bio-Rad, 1704156) membrane. The PVDF membrane was washed with 1X PBS-T solution and immersed in sufficient volume of Ponceau S Staining Solution (Sigma Aldrich, P7170) for 10 minutes. Subsequently Ponceau Solution was decanted, and membrane was washed with distilled water until the background became clear. Membrane was taken on the white plate and images were captured. For antibody staining, membranes were blocked with 5% bovine albumin (Wako) in tris-buffered saline with 0.1% Tween-20. Anti-Epas1 antibody (NOVUS Bio, NB100-122SS) was incubated on membranes at 4°C overnight, followed by HRP-tagged secondary antibody incubation at room temperature for 2 h. Chemiluminescent signals were developed with Clarity ECL substrate (Bio-Rad, 170-5060) and detected using an iBright™ CL1500 Imaging System (Thermo).
Raw fastqc files were checked for the quality of sequencing data using FastQC (v0.11.9), followed by alignment with bowtie2 to mouse reference genome GRCm38. Alignment files were processed using Samtools (v1.12). The number of reads that overlapped genes in Gencode reference was determined using featureCounts in Subread (v.2.0.1). The count output was read in RStudio. Differentially expressed genes were identified using the Walt test in the DEseq2 package between cells with Epas1-Crispr and control-Crispr.
All statistical analysis were calculated using GraphPad Prism 10. P values <0.05 were considered as statistically significant. Repeated measures two-way ANOVA with Fisher’s LSD test, unpaired two-tailed t-tests and one-way ANOVA with Tukey’s multiple comparison test were used. Data are represented as means ± standard deviations (SD) or ± standard errors of the mean (SEM).
We sought to investigate the effect of aging on ACT for solid tumors, using CD8 T cells transduced with an MHC class I-restricted TCR specific for chicken ovalbumin (OVA) antigen (OT-I TCR-T cells). To generate OT-I TCR-T cells, we isolated CD8 T cells from spleens of young (8-12 weeks) or aged (68-96 weeks) C57BL/6 mice and then activated these cells with TCR stimulation and infected them with a retroviral vector bi-cistronically expressing GFP reporter with OT-I TCRα and TCRβ chains linked with an intervening self-cleaving T2A peptide. Subsequently, we expanded these cells in the presence of cytokines IL-7 and IL-15 according to a protocol optimized for the expansion of CAR-T cells in a previous study (30). Aged T cells exhibited steady growth with high cell viability, similar to young T cells (Figures 1A, B, Supplementary Figure S1A). Flow cytometry analysis showed that transduction efficiency of OT-I TCR was approximately 20% in aged T cells and 40% in young T cells, confirmed by GFP reporter expression (Figure 1C).
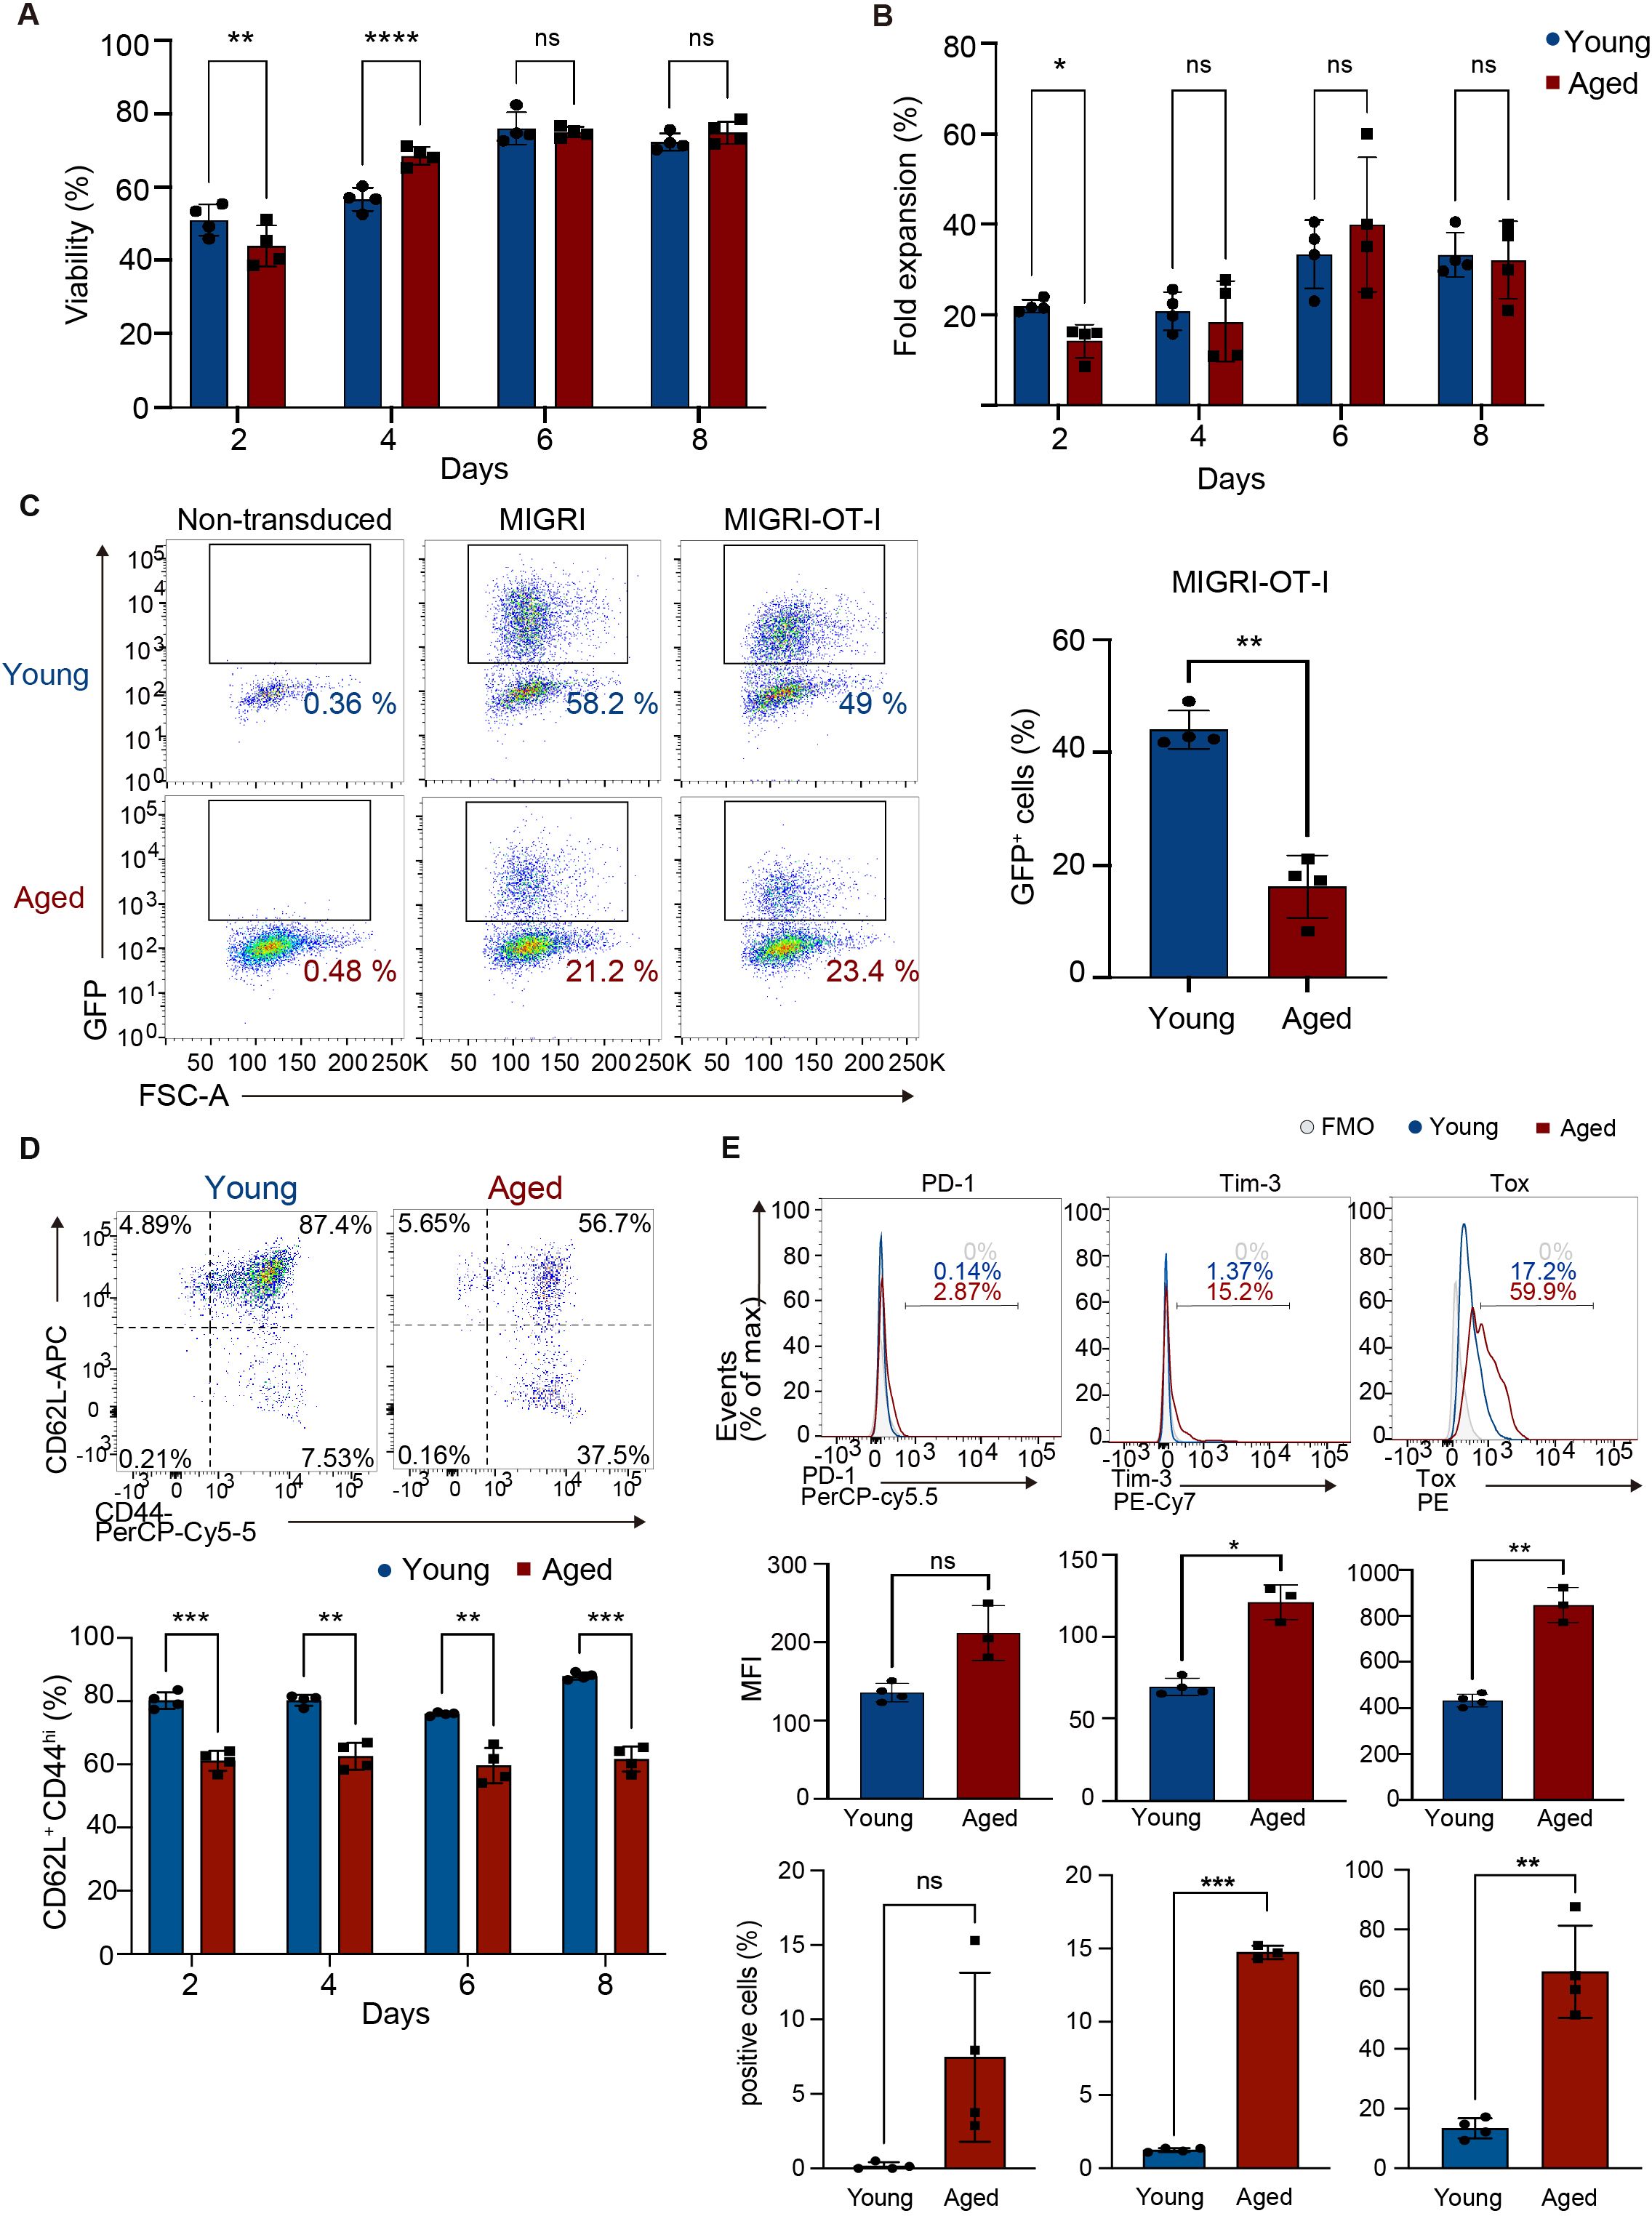
Figure 1. Generation of CD8 TCR-T cells from young and aged CD8 T cells. CD8 T cells isolated from young and aged mice were activated with anti-CD3, anti-CD28 antibodies, and IL-2 and transduced with a retroviral vector expressing OT-I TCR (MIGR1-OT-I) on day 0 and were expanded in media supplemented with IL-7 and IL-15. (A, B) Cell viability (A) and the fold increase in cell numbers (B) were assessed using a Muse cell analyzer. (C-E) Flow cytometry analysis of GFP expression on day 8 (C), abundance of cells expressing CD44 and CD62L in GFP+ cells between day 2 and day 8 (D), and expression of PD-1, Tim3, and Tox in GFP+ cells on day 8 (E). The gating strategy for GFP+ cells is shown in Supplementary Figure S1B. Representative flow cytometry plots and histograms are shown. Graphs show percentages of cells expressing GFP (C), CD62L+ CD44hi cells (D), and mean fluorescence intensity (MFI) and percentages of cells positive for each protein (E). In C, CD8 T cells transduced with a control vector (MIGR1) and those that were non-transduced were also analyzed for comparison. FMO: fluorescence minus one. FMO for analysis of CD62L and CD44 expression is shown in Supplementary Figure S1C. (A-C, E) n = 4 per group, biological replicates. (D) n = 4 (young cells) and n = 3 (aged cells), biological replicates. (A-E) Error bars represent standard deviations (SD). Statistical analysis was performed using RM two-way ANOVA with an uncorrected Fisher’s LSD test (A, B, D) or unpaired t-test (C, E). ns, not significant, *p <0.05, **p < 0.01, ***p<0.001, ****p<0.0001. Data are representative of 4 (A-D) or 3 (E) independent experiments.
CAR-T cells with a central memory cell phenotype characterized by expression of CD62L and CD44 (CD62L+ CD44hi) exhibit high anti-tumor activity (31). Flow cytometry analysis showed that aged OT-I TCR-T cells had lower frequency of cells with the CD62L+ CD44hi phenotype and higher frequency of cells with the CD62L- CD44hi effector phenotype than young OT-I TCR-T cells (Figure 1D, Supplementary Figures S1B–D). Analysis of exhaustion-related molecules revealed no induction of PD-1 and only minimum induction of Tim3 and Tox in aged TCR-T cells (Figure 1E).
Next, to evaluate their anti-tumor responses in vitro, young and aged OT-I TCR-T cells expanded were co-cultured with B16 melanoma-expressing OVA antigen (B16-OVA cells). Analysis of dead cells stained with Zombie dye and Annexin V revealed that aged OT-I TCR-T cells killed target B16-OVA cells as efficiently as young OT-I TCR-T cells (Figure 2A). Perforin, IFN-γ, and TNF-α were expressed at similar levels in young and aged OT-I TCR-T cells co-cultured with B16-OVA cells, while granzyme B expression was significantly higher in aged OT-I TCR-T cells (Figure 2B). Moreover, young and aged OT-I TCR-T cells showed comparable levels of proliferation upon co-culture with B16-OVA cells, as shown in a dye dilution assay (Figure 2C). These results indicate that TCR-T cells engineered from aged CD8 T cells are expandable, do not show prominent exhaustion phenotypes, and are able to exert cytotoxic functions on target tumor cells in vitro as young cells. However, they exhibit decreased ability to develop a central memory phenotype.
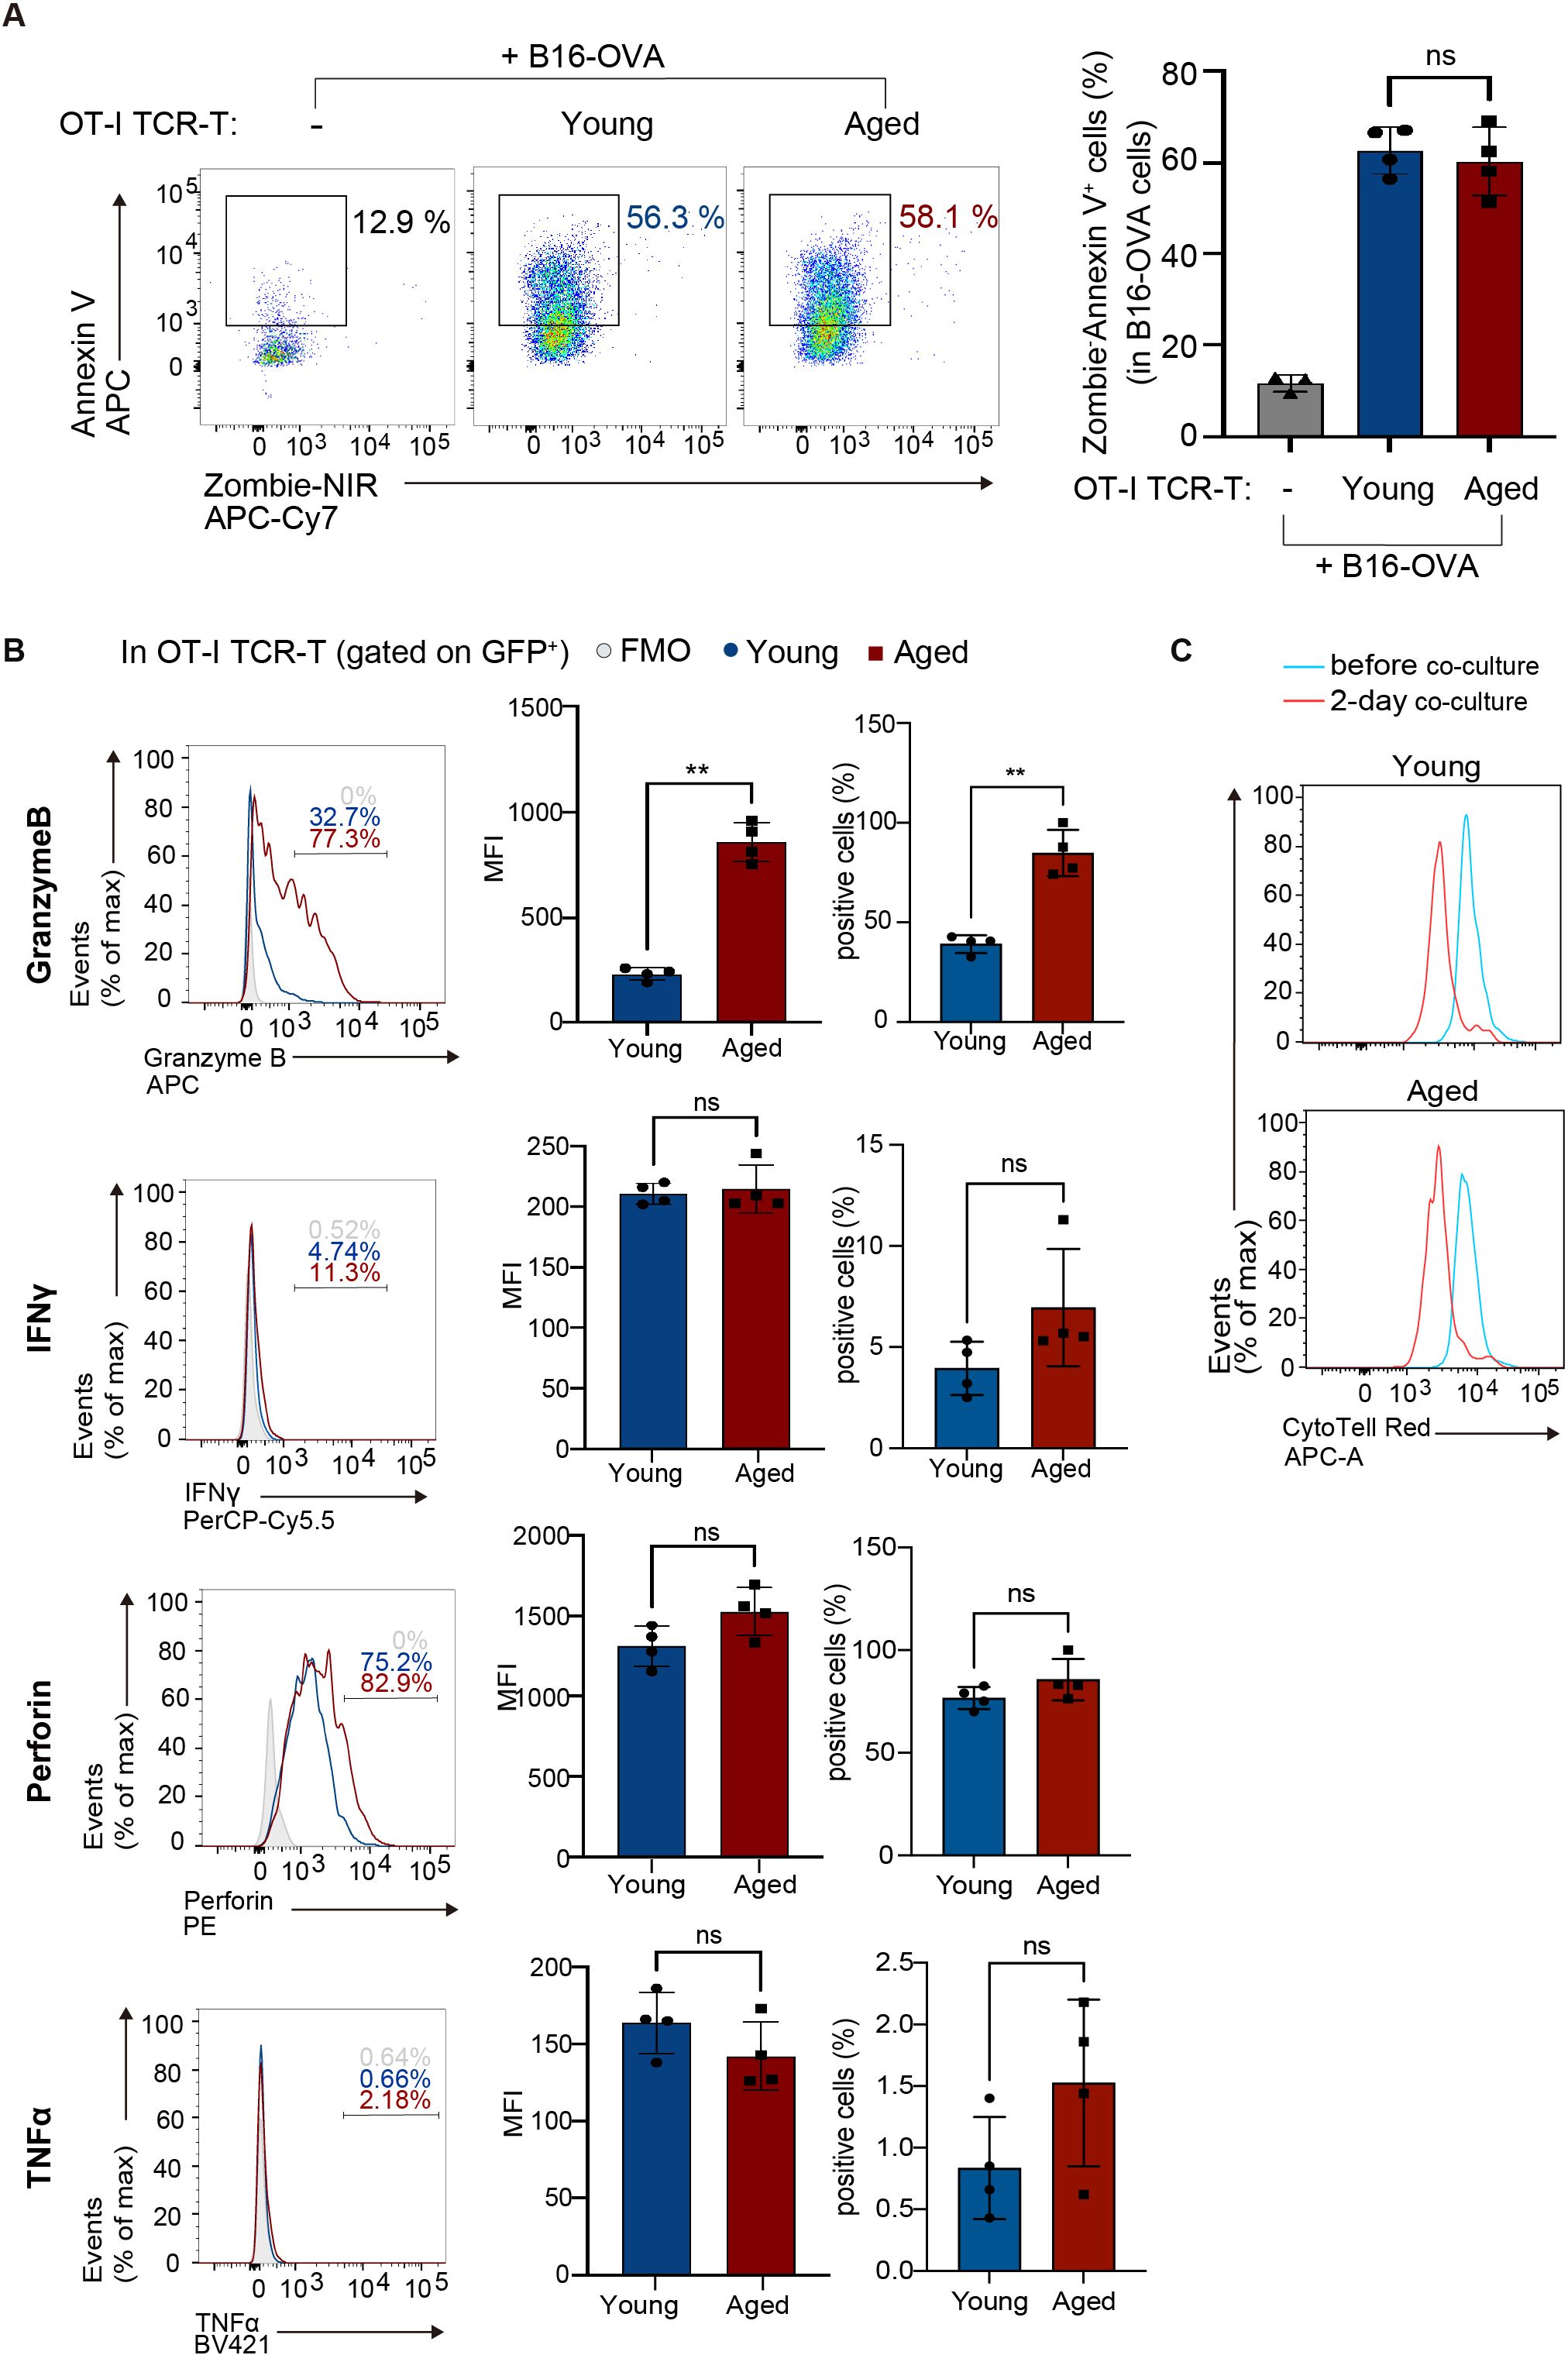
Figure 2. Aged CD8 TCR-T cells have normal cytolytic functions in vitro. OT-I TCR-T cells were generated by transducing MIGR1-OT-I into young or aged CD8 T cells as in Figure 1. Following an 8-day culture, transduction efficiency (percentages of GFP-expressing cells) was assessed using flow cytometry. Subsequently, OT-I TCR-T cells were co-cultured with B16-OVA target cells at a ratio of GFP+ T cells to targets of 1 to 3. (A) Flow cytometry analysis of Annexin V and Zombie NIR staining in B16-OVA cells (gated on CD8-: the gating strategy is shown in Supplementary Figure S2A) co-cultured with OT-I TCR-T cells for 3 days. B16-OVA cells cultured alone for 3 days were also analyzed for comparison. (B) Flow cytometry analysis of expression of granzyme B, perforin, IFN-γ, and TNF-α in OT-I TCR-T cells (gated on CD8+ GFP+: the gating strategy is shown in Supplementary Figure S2B) co-cultured with B16-OVA for 1 day. Graphs show MFI and percentages of cells positive for each protein. (A, B) n = 4 per group, biological replicates. Error bars represent the SD. Statistical analysis was performed using one-way ANOVA with Tukey’s multiple comparisons test (A) or unpaired t-tests (B). ns, not significant, **p < 0.01. (C) Flow cytometry analysis of CTV dilution. OT-I TCR-T cells were stained with CTV, and CTV dilution was analyzed before co-culture and after 2 days of co-culture. (A-C) Data are representative of 3 (A) or 2 (B, C) independent experiments.
Next, we evaluated the effect of aging on anti-tumor activity of OT-I TCR-T cells in vivo. We subcutaneously injected B16-OVA tumor cells into young or aged C57BL/6 mice. On day 8, when tumor volume reached about 50 mm3, young and aged OT-I TCR-T cells were adoptively transferred into young and aged mice, respectively (Figure 3A). This revealed that adoptive transfer of young OT-I TCR-T cells significantly inhibited tumor growth in young mice, whereas aged OT-I TCR-T cells did not affect tumor growth in aged mice (Figure 3A), suggesting that aging reduces anti-tumor activity of CD8 TCR-T cells in vivo.
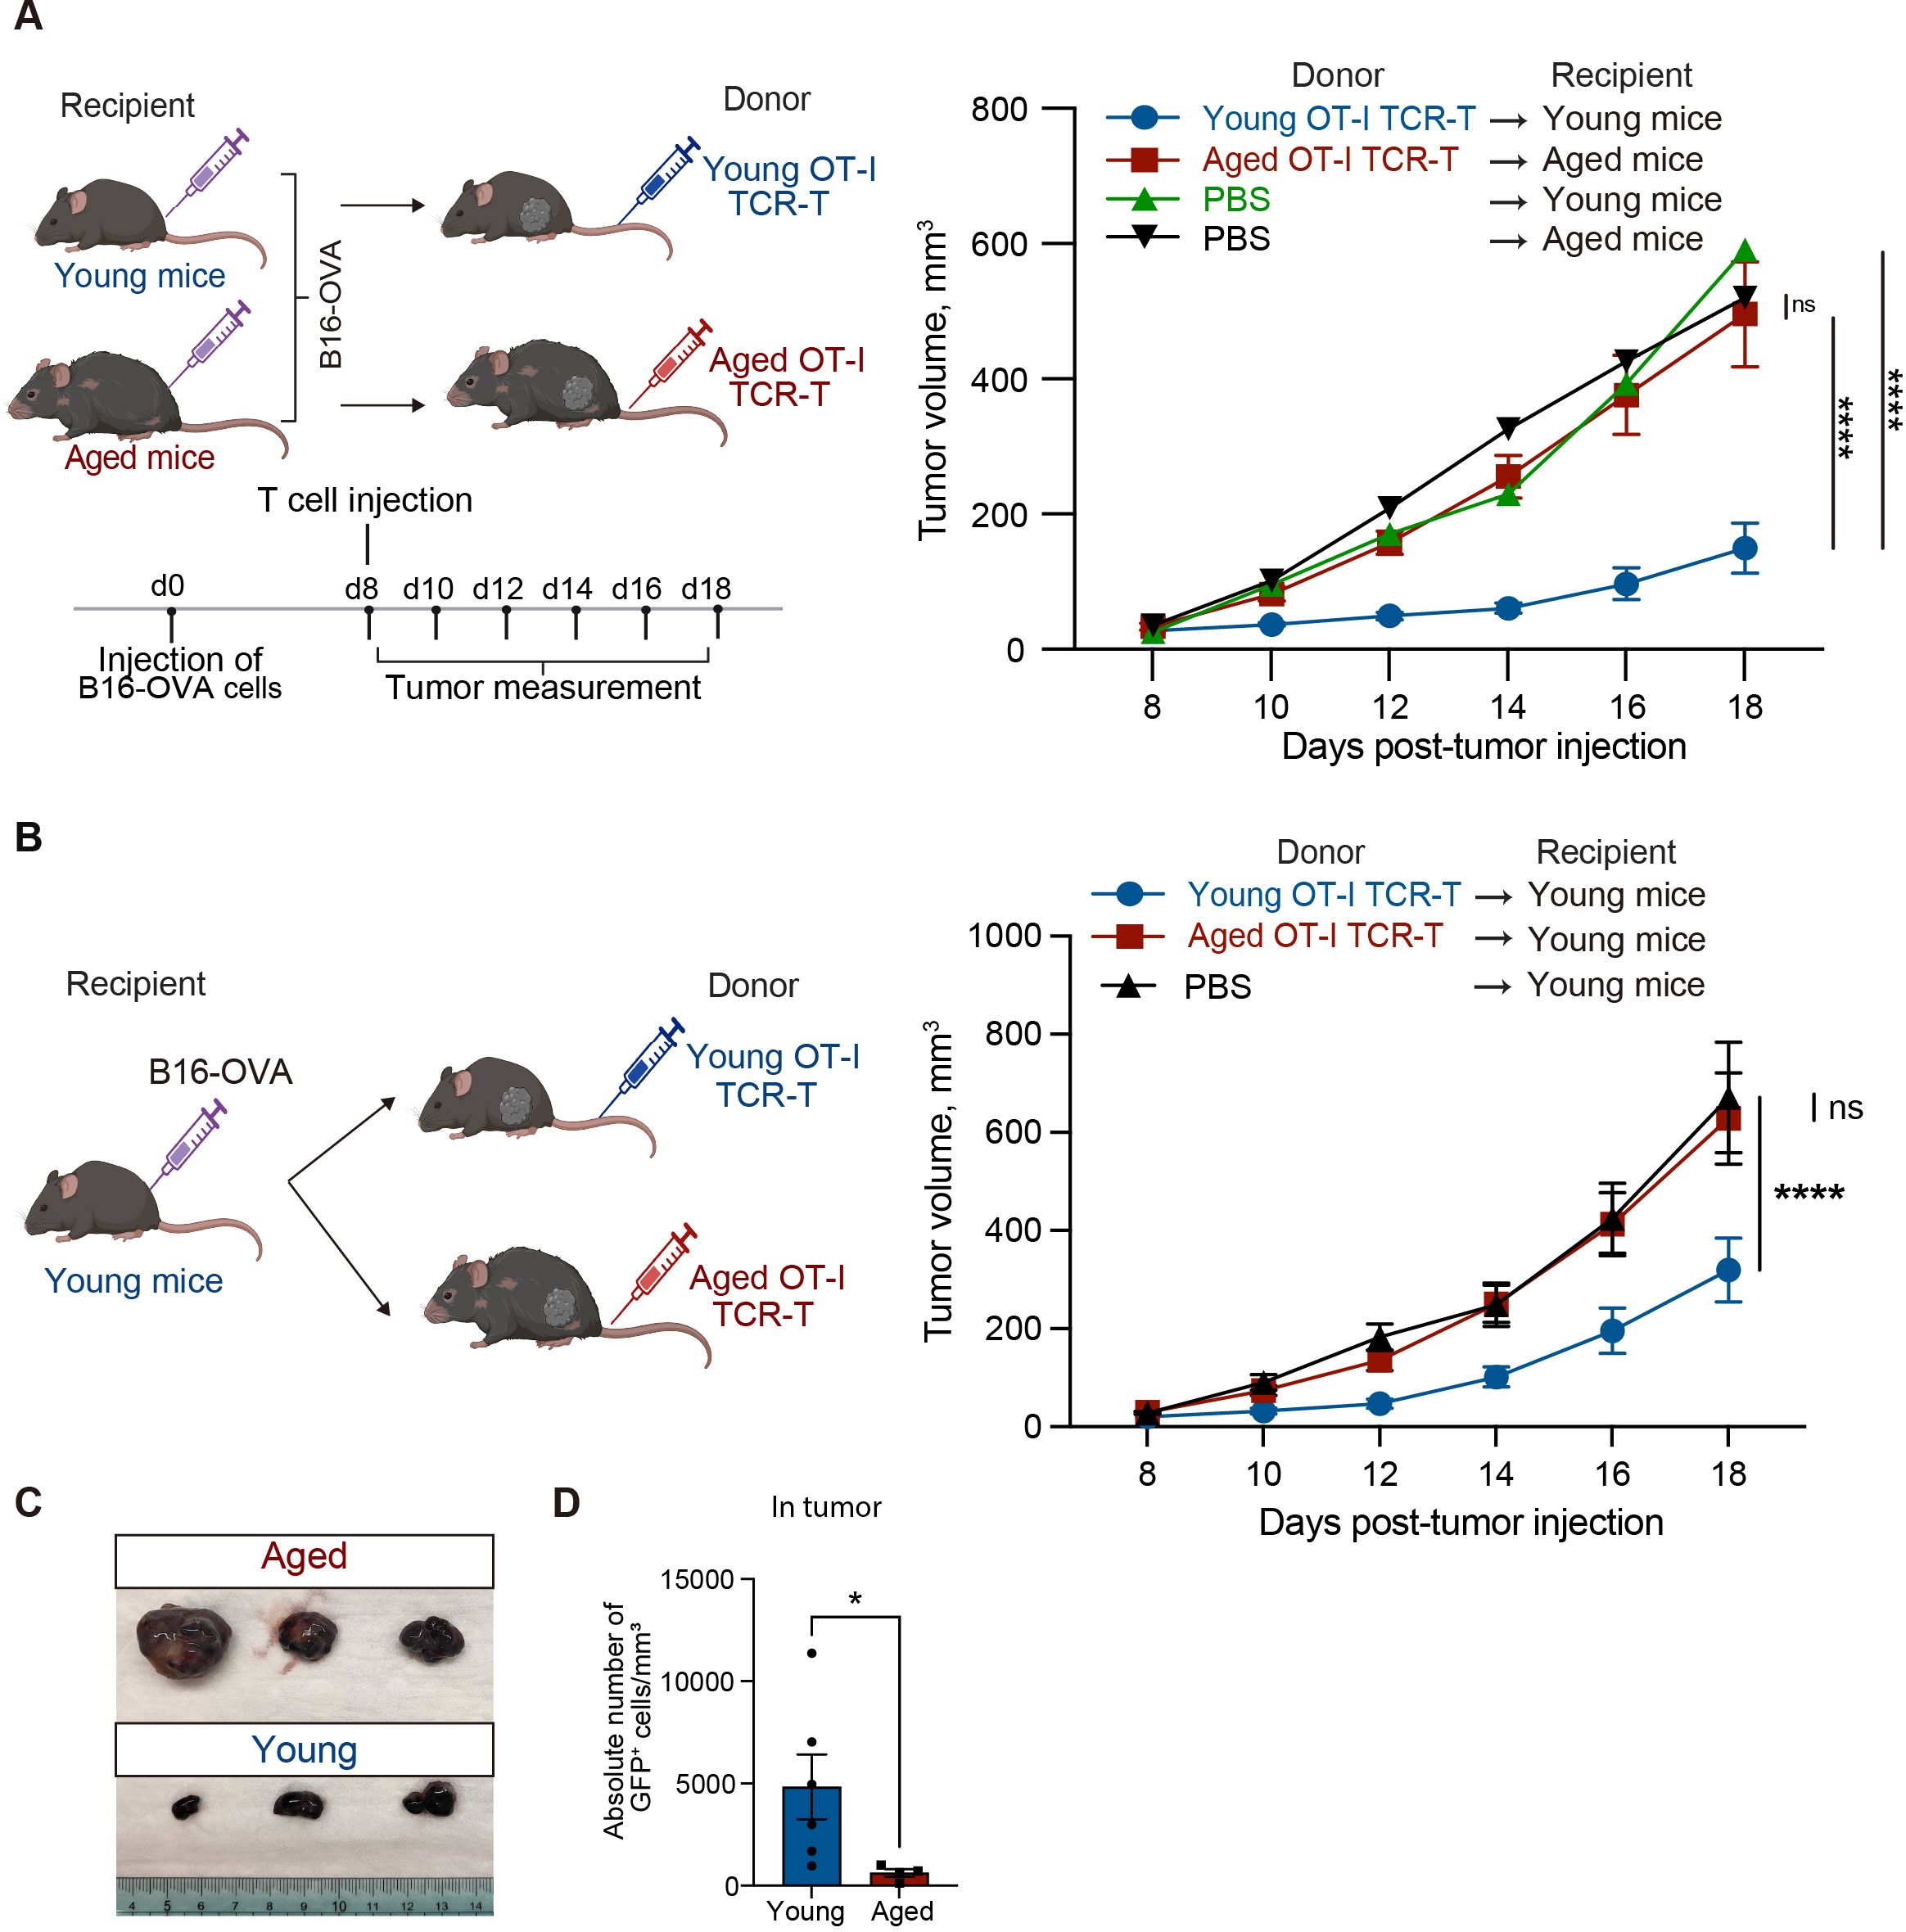
Figure 3. Aged CD8 TCR-T cells fail to control tumor growth in both young and aged mice. (A, B) Young and aged C57BL/6 mice were subcutaneously injected with 2 x 10⁵ B16-OVA cells on day 0. Eight days later, young and aged OT-I TCR-T cells were adoptively transferred into young and aged tumor-bearing mice, respectively (A) or into young tumor-bearing mice (B). Adoptive transfer was performed by intravenously injecting cells including 106 GFP+ cells after GFP expression was assessed by flow cytometry. Mice injected with PBS instead of adoptive cell transfer were also analyzed for comparison. Left schematic diagrams show the experimental design (created with BioRender.com). Right graphs show results of tumor volume measurements. (A) n = 10 (aged tumor-bearing mice), n = 8 (young tumor-bearing mice), and n = 3 (PBS). (B) n = 13 (mice transferred with aged cells), n = 17 (mice transferred with young cells), n = 12 (PBS). Results are shown as mean tumor volume ± SEM. Statistical analysis was performed using two-way RM ANOVA with uncorrected Fisher’s LSD test. ns, not significant, ****p<0.0001. Data are pooled from 2 (A) or 4 (B) independent experiments. (C) Photos of tumors isolated from mice analyzed as in (B) on day 20. n = 3 per condition. (D) Absolute numbers of adoptively transferred CD8+GFP+ T cells in tumors were analyzed by flow cytometry. n = 6 (young cells), n = 4 (aged cells). Statistical analysis was performed using unpaired t-tests. *p < 0.05. Data are representative of 2 independent experiments.
The diminished anti-tumor efficacy of adoptive transfer of CD8 TCR-T cells in aged mice might be attributed to age-related intrinsic changes in T cells. To address this possibility, we next compared anti-tumor activity of young and aged OT-I TCR-T cells in the same in vivo setting, using young tumor-bearing mice as recipients for adoptive transfer (Figure 3B). We chose this experimental setting because it has been suggested that certain phenotypes in aged T cells persist in a young tissue microenvironment, whereas young T cells acquire age-related phenotypes in an aged tissue microenvironment (32). We found that adoptive transfer of aged OT-I TCR-T cells did not inhibit tumor growth in young mice, unlike the effect observed with young OT-I TCR-T cells (Figures 3B, C). Moreover, the frequency of aged OT-I TCR-T cells in tumor tissues was significantly lower than that of young cells (Figure 3D). These results suggest that aging of CD8 T cells alone is sufficient to reduce their ability to control tumors in CD8 TCR-T therapy.
To understand the mechanism underlying the cell-intrinsic defect in anti-tumor response of aged CD8 TCR-T cells, we next compared gene expression profiles of young and aged OT-I TCR-T cells in tumor tissues using scRNA-seq analysis. On day 12 after the adoptive transfer of young or aged OT-I TCR-T cells into young recipient mice with B16-OVA tumors, we collected tumor-infiltrating lymphocytes and sorted OT-I TCR-T cells (CD3+, CD8+, ZombieNIR- and GFP+). We performed scRNA-seq analysis using pooled OT-I-TCR-T cells collected from these mice. t-distributed stochastic neighborhood embedding (t-SNE) analysis of cells expressing Cd8 revealed that aged and young OT-I TCR-T cells were categorized into six clusters (clusters 0-5) (Figure 4A). Of note, aged OT-I TCR-T cells exhibited higher frequencies in clusters 1-5 and a lower frequency in cluster 0, compared to young OT-I TCR-T cells (Figure 4A).
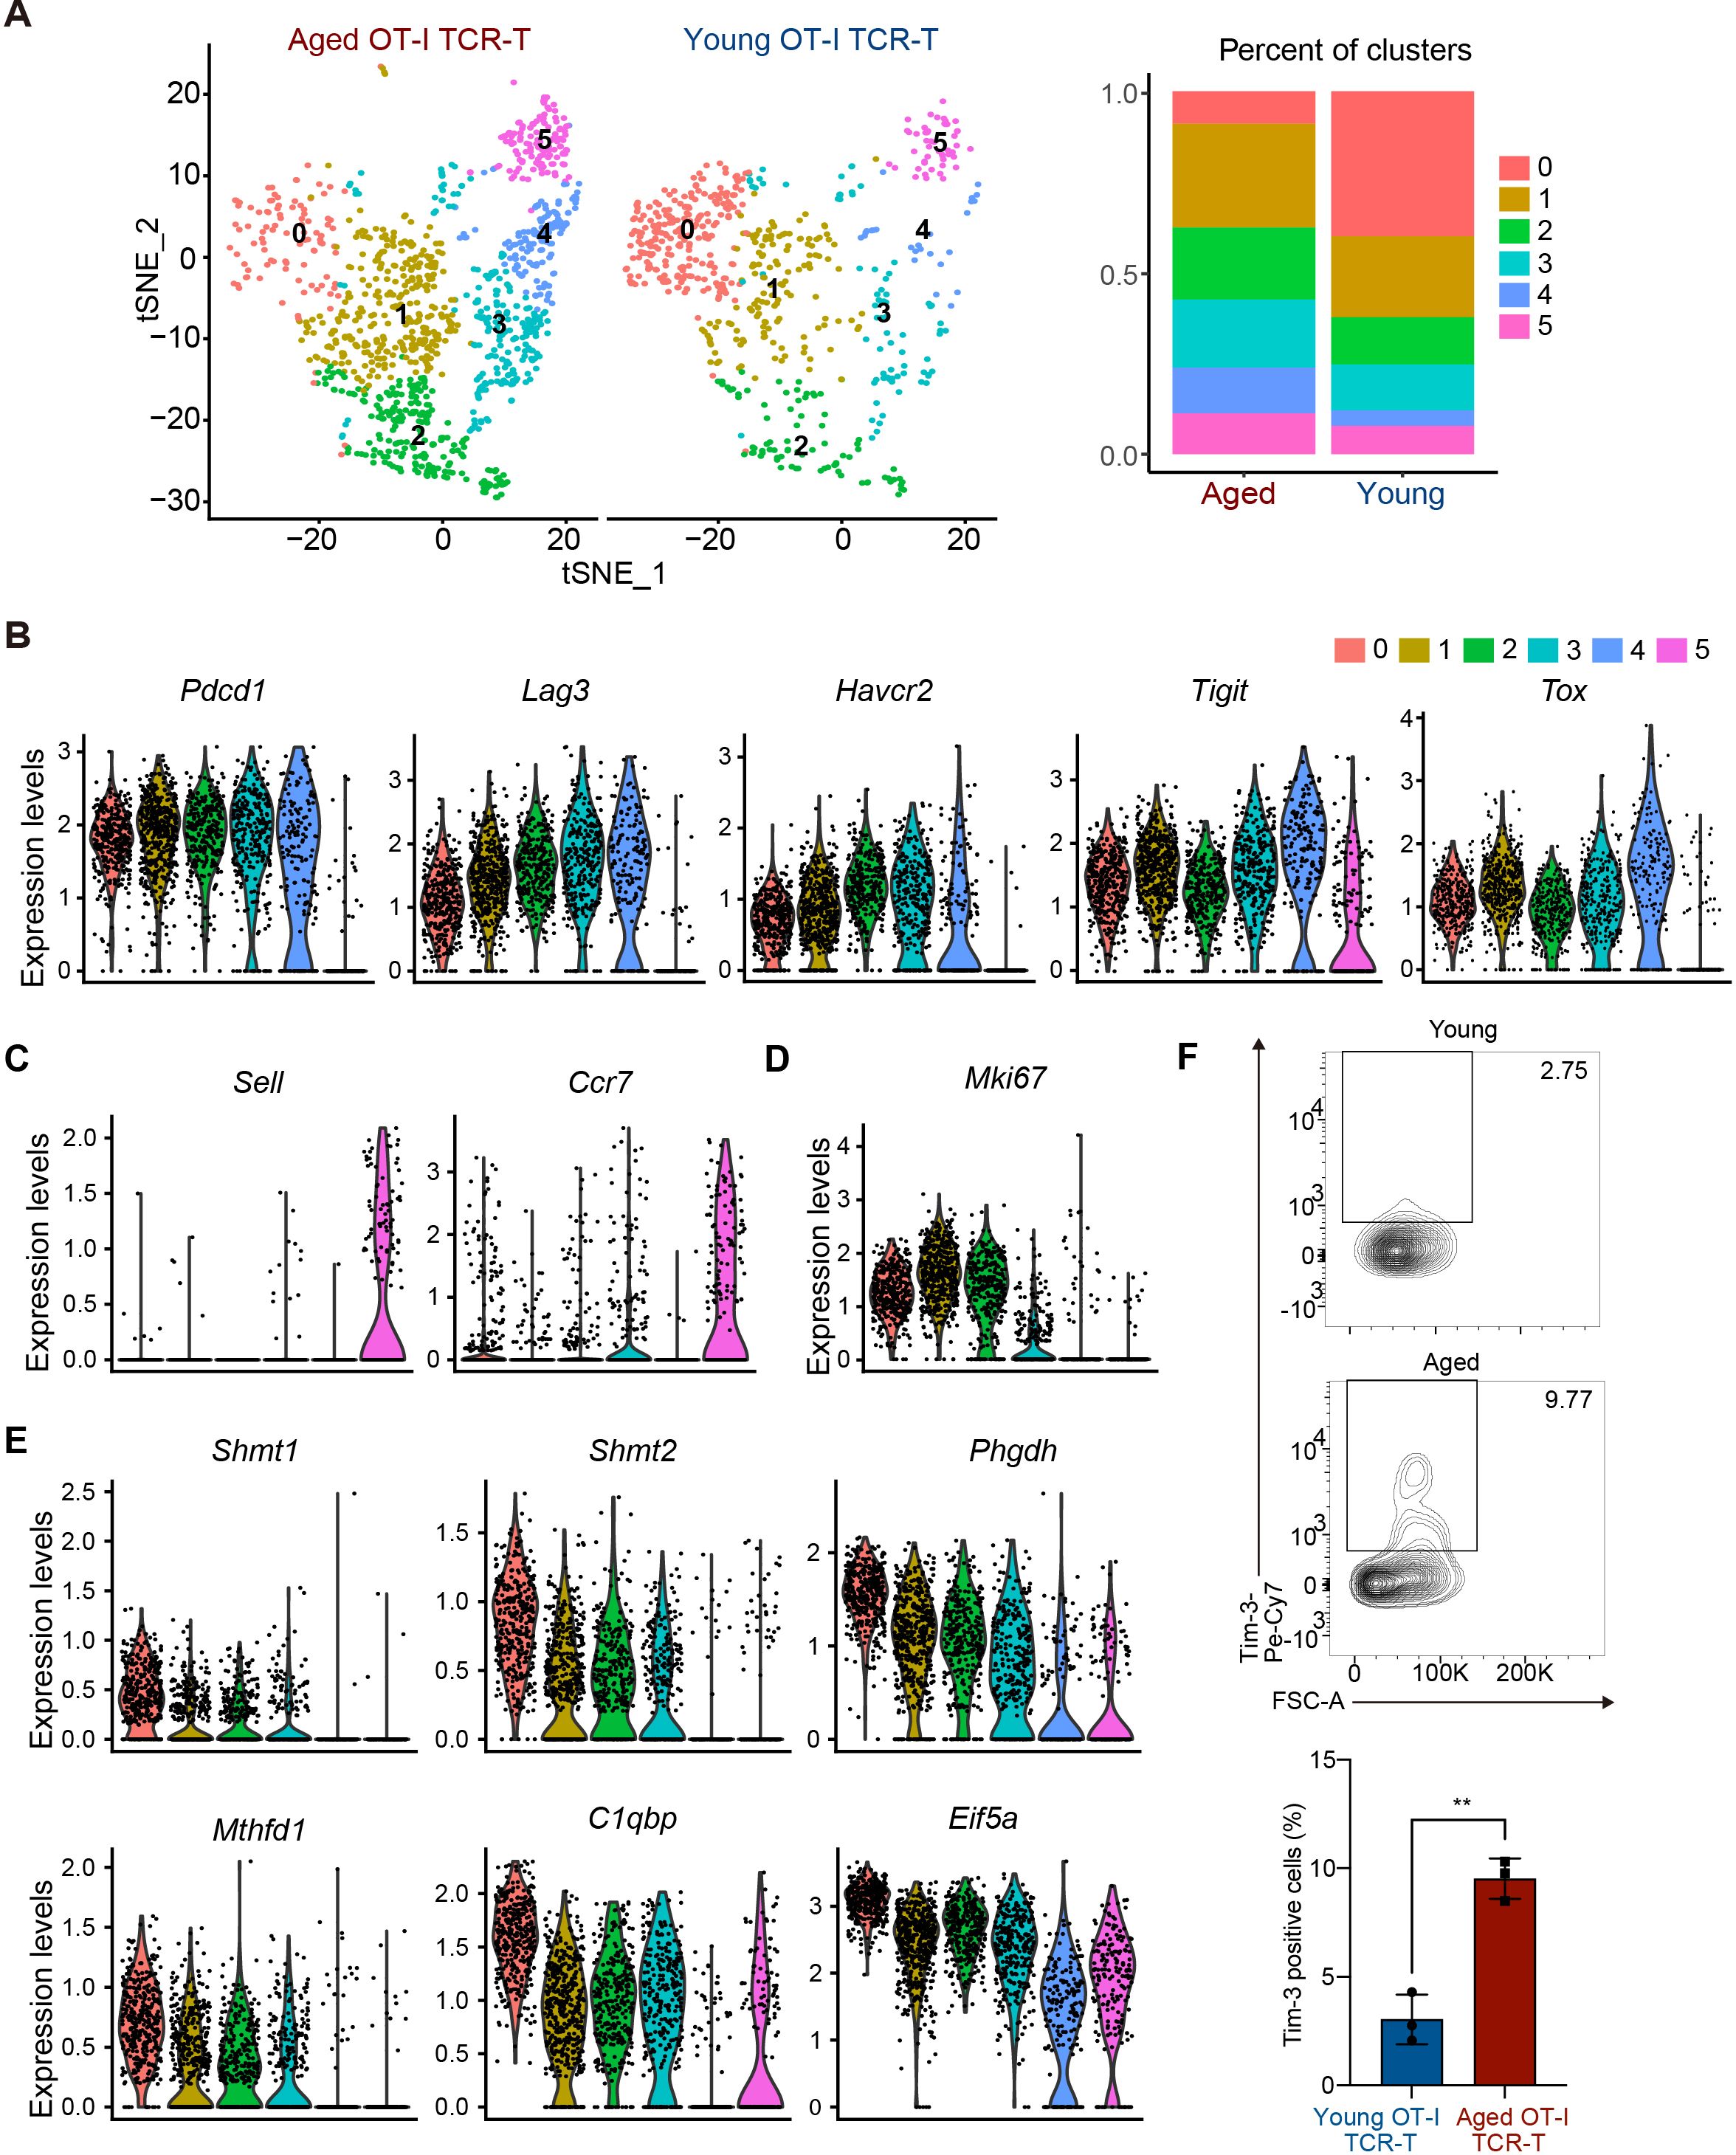
Figure 4. Aged CD8 TCR-T cells are prone to become Tex-like cells in tumors. (A-F) On day 0, young C57BL/6 mice were each subcutaneously injected with 2 x 10⁵ B16-OVA cells. On day 8, mice were each subjected to adaptive transfer with young or aged OT-I TCR-T cells, including 106 GFP+ cells. On day 20, CD8+GFP+ OT-I TCR-T cells were FACS-sorted from tumors (n = 4, young cell transfer; n = 3, aged cell transfer), pooled in each group, and were subjected to scRNA-seq analysis. (A) t-SNE visualization showing young and aged OT-I TCR-T cells were grouped into clusters 0 to 5. Cells expressing Cd8a were used for analysis. The left panel shows t-SNE plots. The right panel presents a stacked bar graph showing percentages of cells in each t-SNE cluster. (B-E) Violin plots show expression of exhaustion-related genes (Tox, Pdcd1, Lag3, Havcr2, and Tigit) (B), central memory-related genes (Sell and Ccr7) (C), a proliferation marker gene, Mki67 (D), and genes highly expressed specifically in cluster 0 (Shmt1, Shmt2, Phgdh, Mthfd1, C1qbp, and Eif5a) (E). (F) On day 20, Tim3 expression inf CD8+GFP+ OT-I TCR-T cells (gating strategy is shown in Supplementary Figure S3B) in tumors was analyzed using flow cytometry. n = 5 (mice transferred with young cells) and n = 3 (mice transferred with aged cells). The graph shows percentages of cells positive for Tim3 expression. Error bars represent SD. Statistical analysis was performed using unpaired t-tests. **p <0.01. Data are representative of 2 independent experiments.
PD-1-expressing exhausted T cells in tumor microenvironment exhibit distinct phenotypes, including Tim3- progenitor exhausted (Tpex) and Tim3+ terminally exhausted T (Tex) phenotypes (33). In differentiation of Tpex cells into Tex cells, cells lose cell proliferation capacity and increase expression of multiple inhibitory receptors, such as Tim3, Lag3, and Tigit (34). In our scRNA-seq data, exhaustion-related genes Pdcd1 and Tox were highly expressed in cells among clusters 0 to 4, but not in cluster 5 (Figure 4B). Cells in cluster 5 expressed homing receptor genes (Sell and Ccr7) (Figure 4C) but exhibited little to no expression of effector molecule genes (Gzmb, Ifng, and Prf1) (Supplementary Figure S3A), suggesting that they do not directly participate in anti-tumor responses. Cells in cluster 0 expressed lower levels of Havcr2 (encoding Tim3), Lag3, and Tigit than many cells in clusters 1-4 (Figure 4B), while expressing the cell proliferation marker gene Mki67 (Figure 4D), suggesting that they are Tpex-like cells. Along with high expression of multiple inhibitory receptors, cells in clusters 1 and 2 expressed Mki67, whereas cells in clusters 3 and 4 did not (Figure 4D), suggesting that cells in cluster 1 and 2 are cells differentiating to Tex, while cells in clusters 3 and 4 are Tex-like cells.
We also found that cells in cluster 0 exhibited increased expression of genes related to one-carbon metabolism, such as Shmt1, Shmt2, Phgdh, Psat1, and Mthfd1 (35), and genes related to mitochondrial oxidative phosphorylation and cell cycle regulation, such as C1qbp and Eif5a, respectively (36, 37) (Figure 4E). Flow cytometry analysis confirmed that Tim3 expression levels in aged TCR-T cells in tumors were higher than in young TCR-T cells (Figure 4F, Supplementary Figure S3B). Taken together, these results suggest that aged CD8 TCR-T cells may lose the capacity to maintain Tpex population and are more prone to differentiate to Tex cells compared to young CD8 TCR-T cells in anti-tumor responses.
We next performed gene set enrichment analysis (GSEA) of genes ranked by fold changes in expression between aged and young OT-I TCR-T cells in our scRNA-seq data. This showed that aged OT-I TCR-T cells exhibit upregulation of gene sets characteristic of TNF-α signaling, interferon gamma response, inflammatory response, and IL6-JAK-STAT3 signaling (Figure 5A). Enhanced responses to inflammatory cytokines in aged TCR-T cells may reflect enhanced production of inflammatory cytokines by other cell types in response to uncontrolled tumor growth. GSEA also revealed significant downregulation in hallmark gene sets of Myc targets in aged OT-I TCR-T cells compared to young cells (Figure 5A). Consistent with this, we identified endothelial PAS domain protein 1 (Epas1, also known as hypoxia inducing factor 2a [Hif2a]), which promotes c-Myc functions by inducing c-Myc-Max complex (38), as the transcription factor gene most significantly downregulated in aged T cells in clusters 0-4 (Figure 5B). Furthermore, immunoblot analysis showed that TCR stimulation-induced Epas1 protein expression in aged CD8 T cells activated in vitro was lower than in young CD8 T cells (Figure 5C). These results suggest that an impaired Epas1-dependent pathway is a major age-related defect in tumor-specific CD8 T responses.
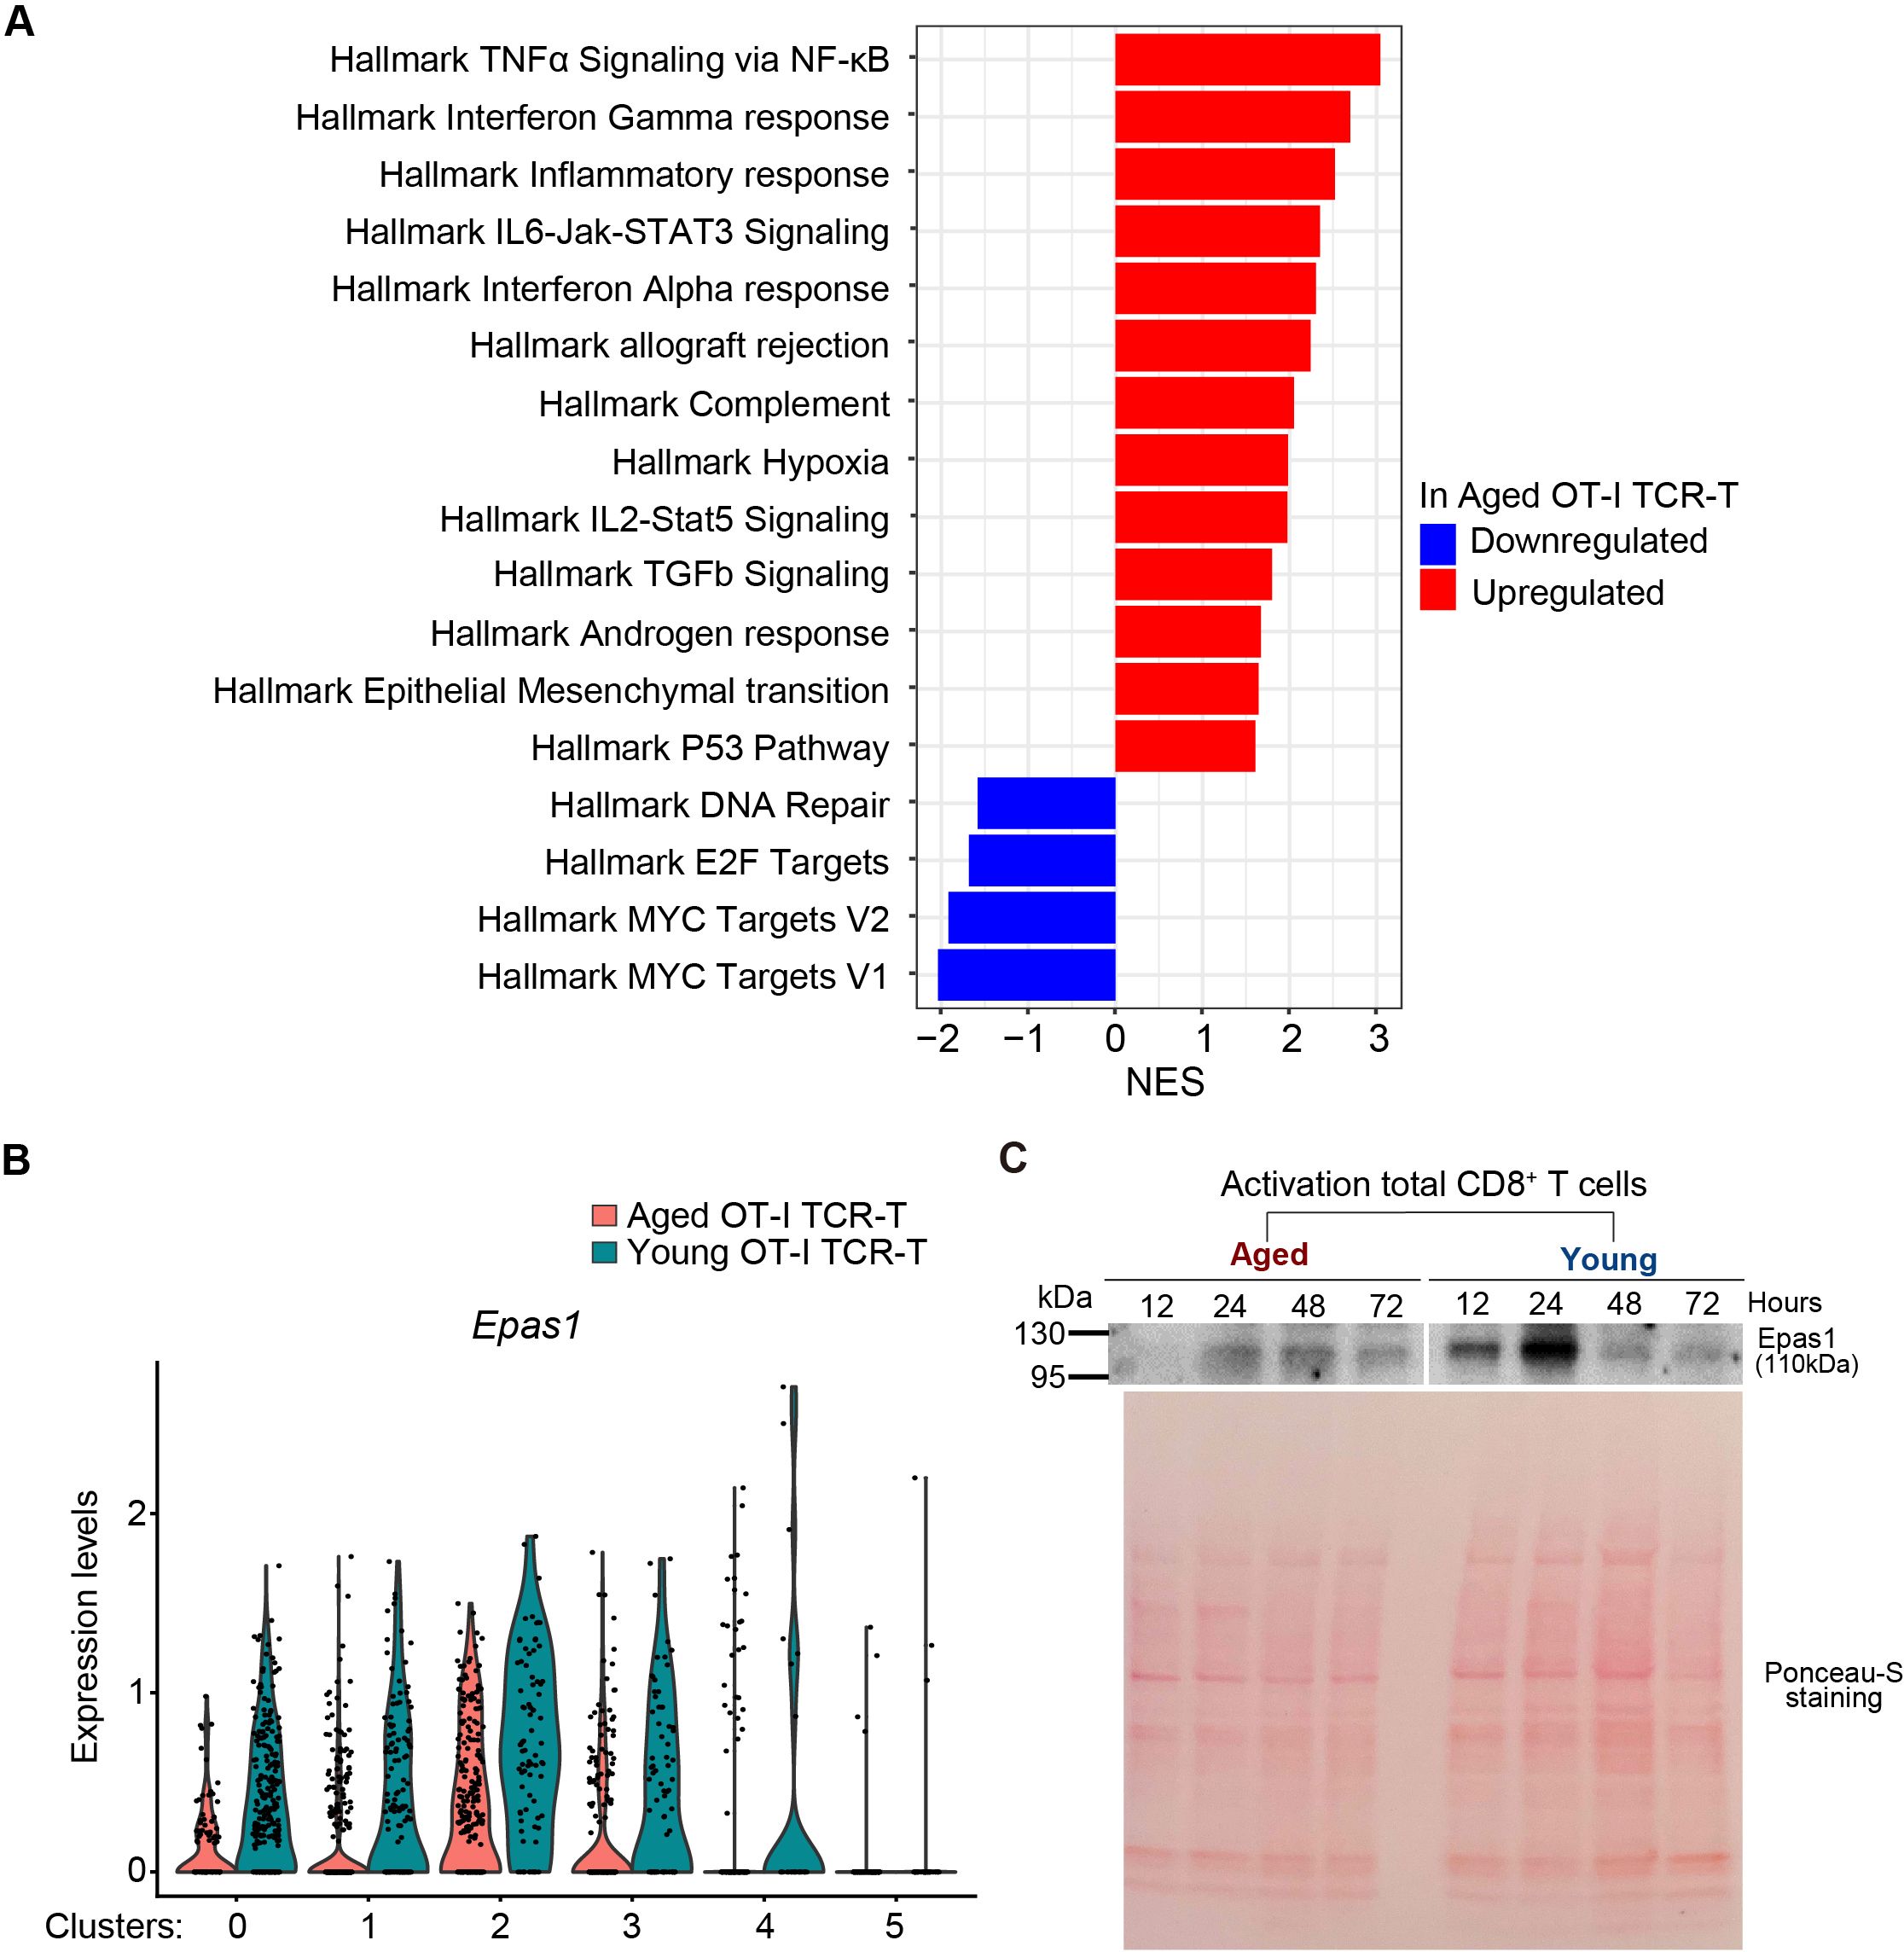
Figure 5. Epas1 expression is reduced in intra-tumoral aged CD8 TCR-T cells. (A) GSEA was performed using scRNA-seq data obtained in Figure 4. Red and blue bars represent upregulated and downregulated gene sets in aged OT-I TCR-T cells compared to young OT-I TCR-T cells. (B) Analysis of DEGs (adjusted p values <0.05) in scRNA-seq data obtained in Figure 4 revealed significantly lower Epas1 expression in aged cells in clusters 0 to 4. The violin plot shows Epas1 expression in young and aged OT-I TCR-T cells. (C) CD8 T cells isolated from spleens of young and aged C57BL/6 mice were activated with anti-CD3 and anti-CD28 antibodies and IL-2. Cells were subjected to immunoblot analysis using an antibody against Epas1 at indicated time points. As a loading control, the blot was stained with Ponceau-S. Data are representative of 2 independent experiments.
We next sought to explore the possibility that reduction of Epas1 expression is involved in impaired anti-tumor responses of aged CD8 TCR-T cells. A previous study reported that overexpression of Epas1 promotes anti-tumor CD8 T cell responses (39), but the role of endogenous Epas1 in CD8 T cells remains unknown. To address this, we first investigated the effect of Epas1 deficiency on CD8 T cell activation and cytotoxicity on target tumor cells in vitro. We electroporated total CD8 T cells isolated from young OT-I transgenic mice (OT-I T cells) with Crispr/Cas9 protein and guide RNA (gRNA) targeting Epas1 (Epas1-Crispr). Treatment with Epas1-Crispr significantly reduced expression of Epas1 mRNA (Supplementary Figure S4A). Subsequently, we activated Epas1-Crispr-treated cells with TCR stimulation and expanded them in growth media supplemented with IL-7 and IL-15. We observed comparable growth and viability between cells treated with Epas1-Crispr or control-Crispr (Crispr/Cas9 protein and negative control gRNA) (Figures 6A, B, Supplementary Figure S4B). Epas1-Crispr treatment also did not affect the abundance of CD62L+ CD44hi central memory cells (Figure 6C, Supplementary Figures S4C–E). Moreover, upon co-culturing with B16-OVA cells, OT-I T cells with Epas1-Crispr treatment exhibited normal, cytotoxicity on target cells (Figure 6D, Supplementary Figure S4F), expression of perforin, GzmB, IFN-γ, and TFN-α (Figure 6E, Supplementary Figure S4G), and proliferation (Figure 6F). These results indicate that Epas1 is not essential for CD8 T cell activation, proliferation, and anti-tumor cytotoxic activity in vitro.
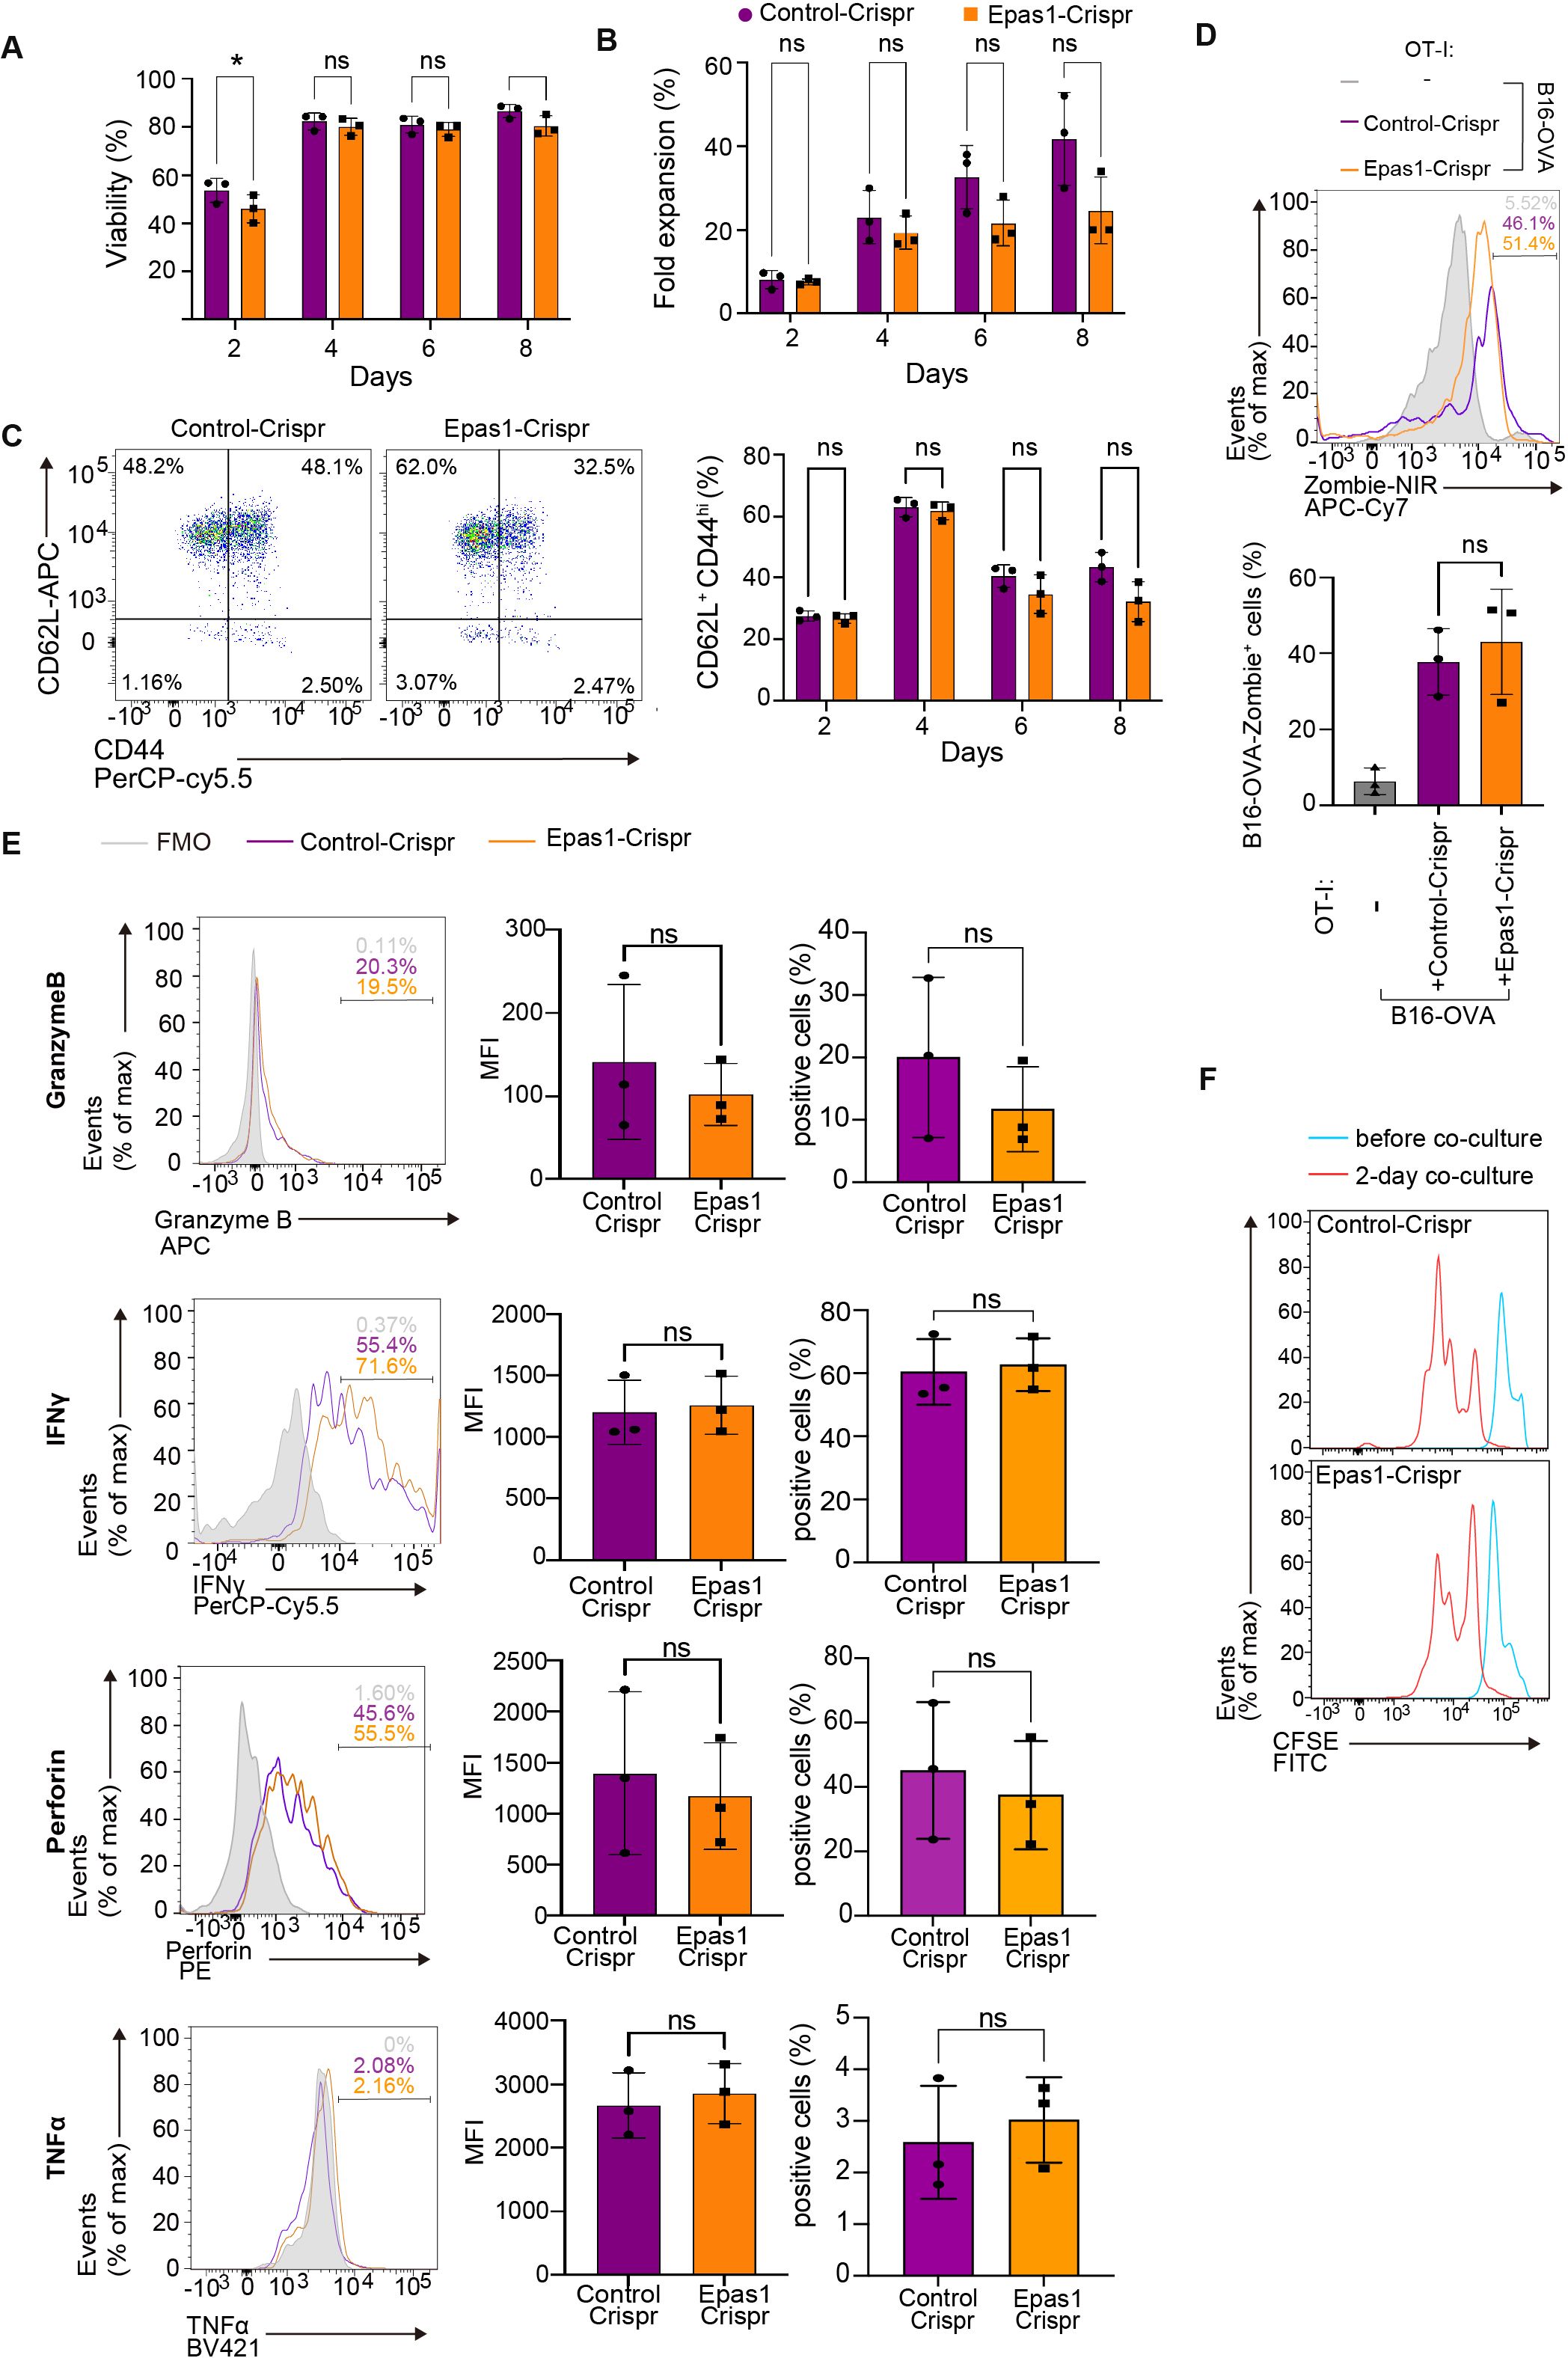
Figure 6. Epas1 is dispensable for activation and cytolytic functions of CD8 T cells in vitro. CD8 T cells were isolated from spleens of young OT-I mice (OT-I T cells) and were nucleofected with Crispr ribonucleoproteins targeting Epas1 (Epas1-Crispr) or control ribonucleoproteins (control-Crispr) on day 0, before being cultured overnight. On day 1, cells were activated with anti-CD3 and anti-CD28 antibodies and IL-2 for 24 h. From day 2 to day 8, cells were cultured without TCR stimulation in the presence of IL-7 and IL-15. (A, B) Cell viability (A) and fold increase in cell numbers (B) were assessed using a Muse cell analyzer every other day between day 2 and day 8. (C) Flow cytometry analysis of expression of CD62L and CD44 in OT-I T cells (gating strategy is shown in Supplementary Figure S4C) was conducted every other day between day 2 and day 8. Graph shows the percentage of cells with a CD62L+CD44hi (central memory: CM) phenotype. (D-F) On day 8, OT-I T cells were co-cultured with B16-OVA cells at a ratio of 1 to 3. (D) Flow cytometry analysis of Zombie NIR staining in B16-OVA cells (gated on CD8−: gating strategy is shown in Supplementary Figure S4F) co-cultured with OT-I T cells for 3 days. B16-OVA cells cultured alone for 3 days were also analyzed for comparison. (E) Flow cytometry analysis of expression of granzyme B, perforin, IFN-γ, and TNF-α in OT-I T cells (gated on CD8+: gating strategy is shown in Supplementary Figure S4G) co-cultured with B16-OVA for 24 h. (F) Flow cytometry analysis of CFSE dilution. OT-I T cells were stained with CFSE, and CFSE dilution was analyzed before and after 2 and 3 days of co-culture. Graphs show mean fluorescence intensity (MFI) and percentages of cells positive for each protein. (A-F) n = 3 per group. Error bars represent SD. Statistical analysis was performed with RM two-way ANOVA with Fisher’s LSD test (A-C) or unpaired t-tests (E). ns, not significant, *p <0.05. Data are representative of 2 independent experiments.
We next examined the impact of Epas1 deficiency on in vivo anti-tumor activity of CD8 T cells. We activated and expanded OT-I T cells electroporated with Epas1-Crispr or control-Crispr and adoptively transferred them to congenic C67BL/6 mice bearing B16-OVA tumors (Figure 7A). Suppression of tumor growth was less significant in mice transferred with OT-I T cells treated with Epas1-Crispr compared to controls (Figures 7A, B). Flow cytometry analysis revealed that the frequency of Epas1-Crispr-treated OT-I T cells in tumor-infiltrating lymphocytes was significantly lower than in controls (Figures 7C, D, Supplementary Figure S5A). Additionally, Epas1-Crispr treatment significantly increased expression of Tim3 in tumor-infiltrating OT-I T cells (Figure 7E). These results suggest that Epas1 promotes anti-tumor activity of CD8 T cells in vivo.
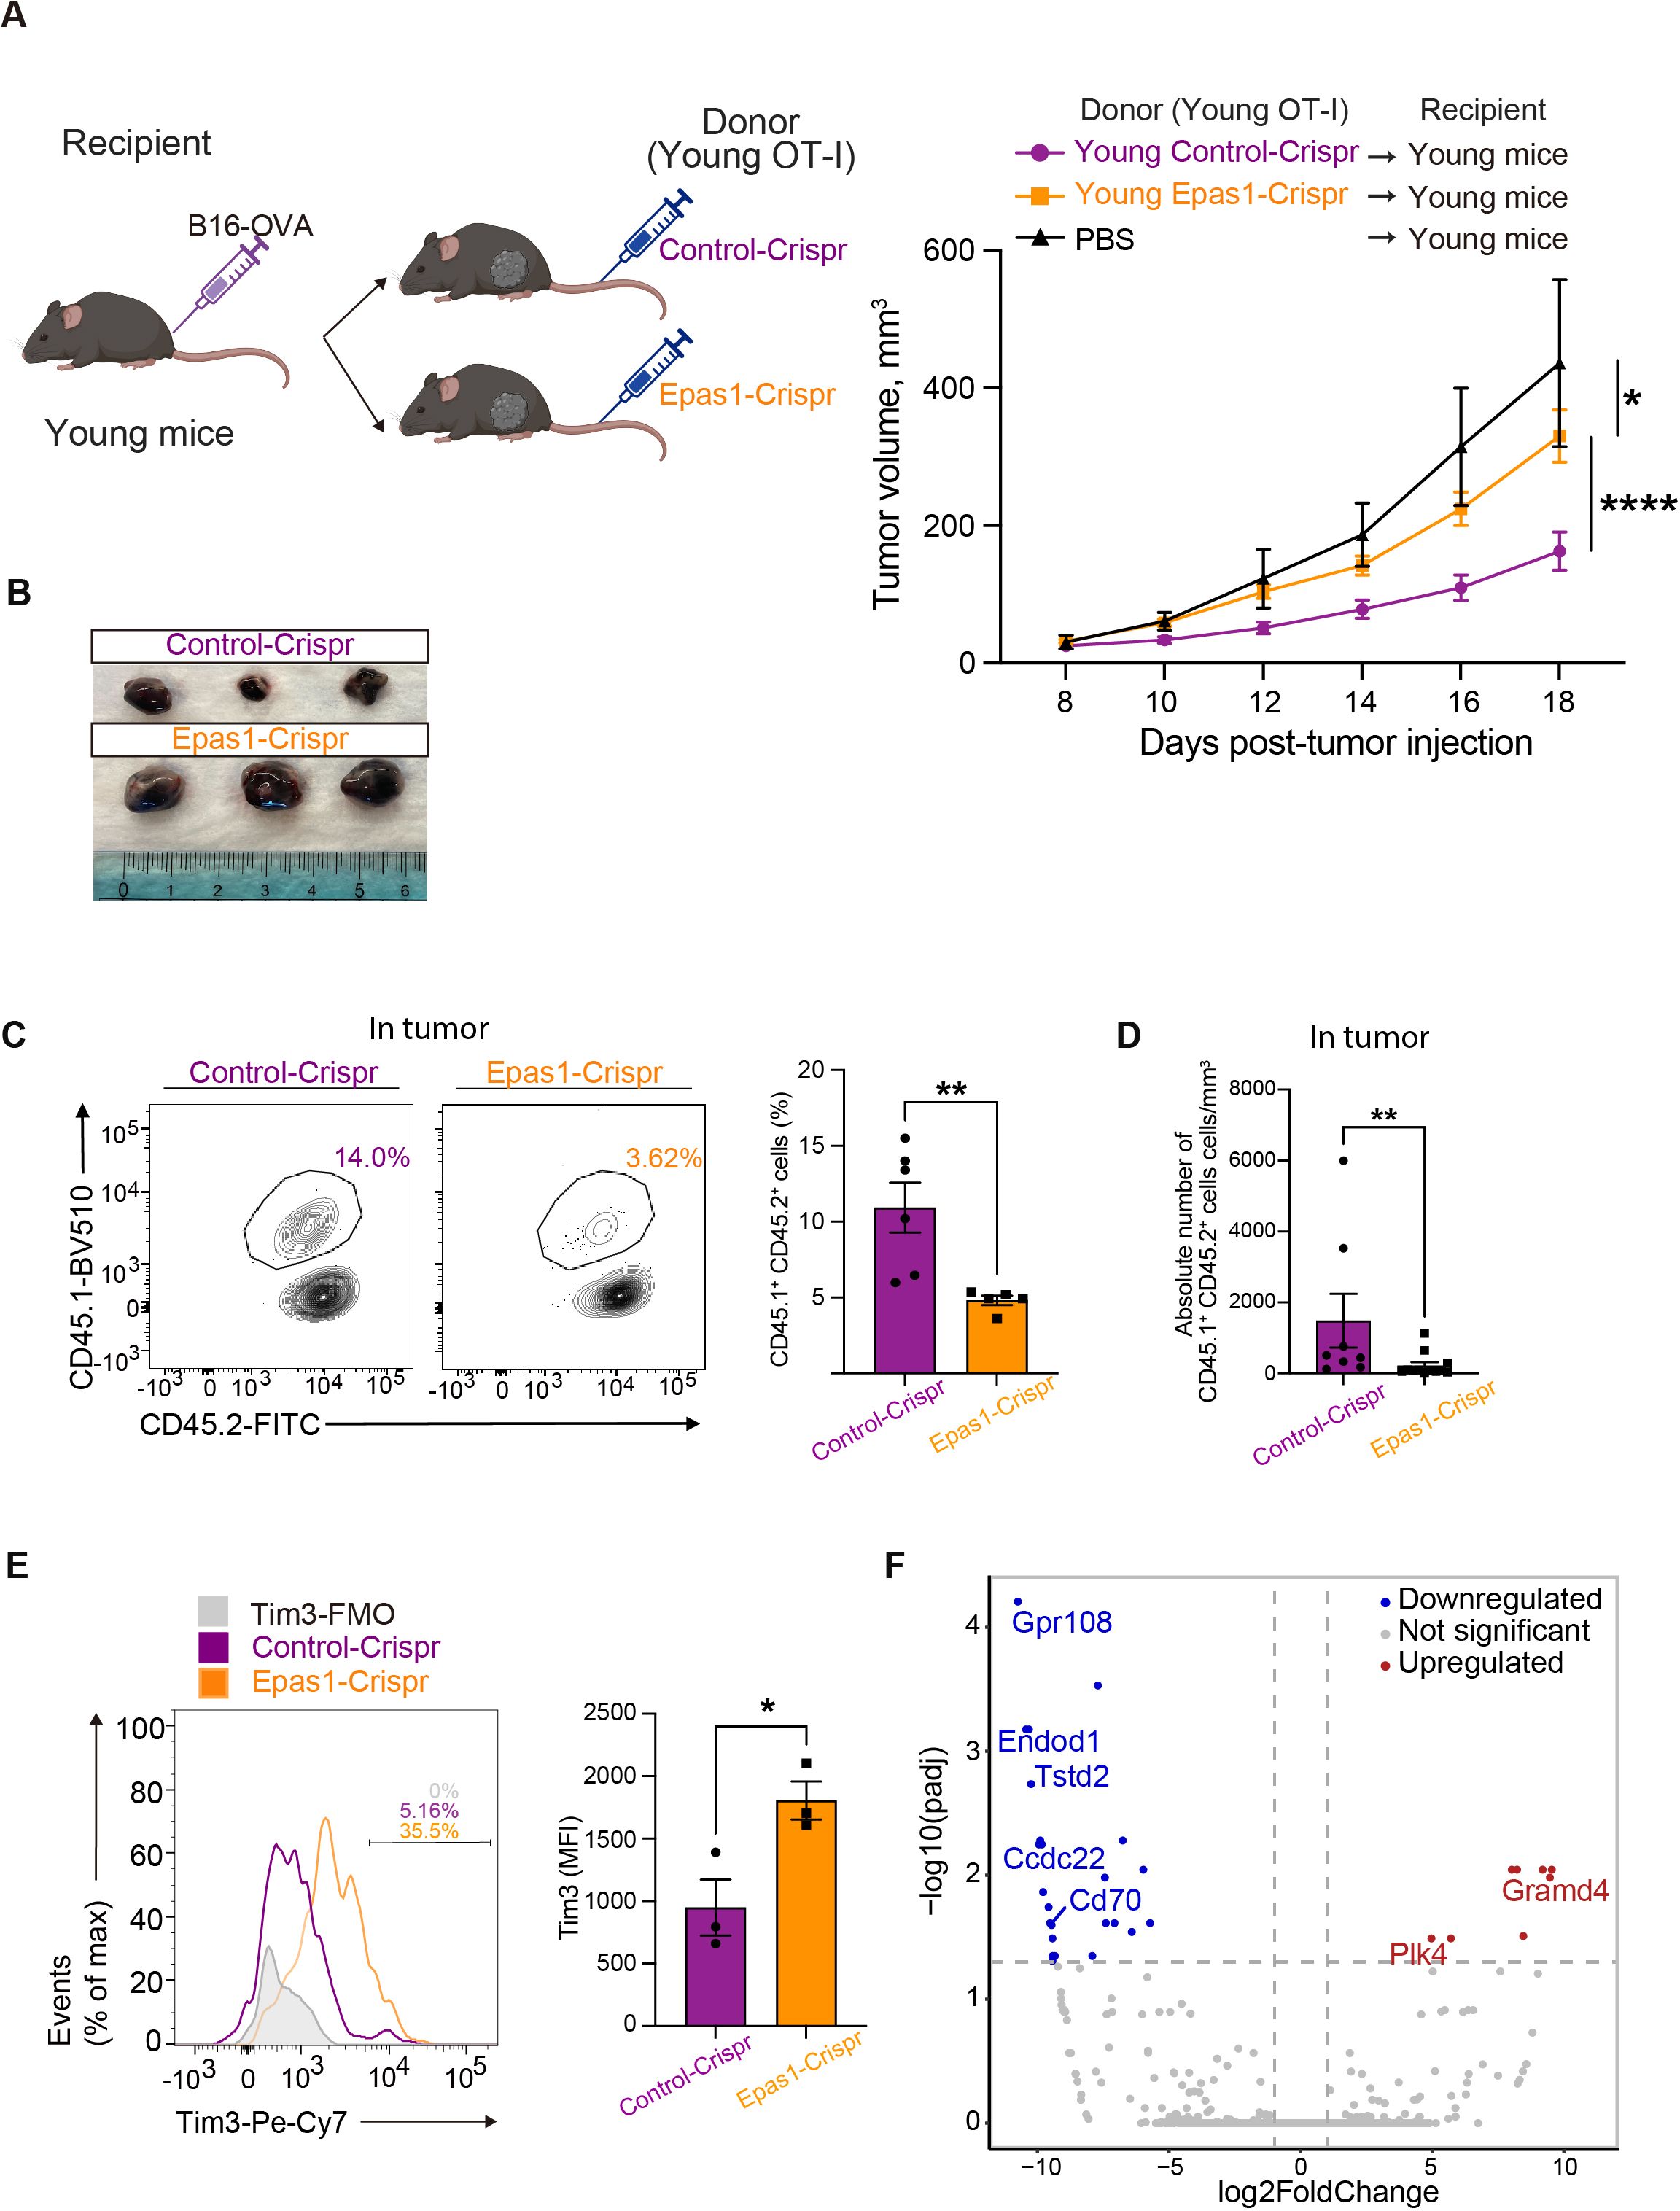
Figure 7. Epas1 is essential for the anti-tumor CD8 T cell response. Young OT-I T cells (CD45.1+CD45.2+) were nucleofected with Crispr ribonucleoproteins targeting Epas1 (Epas1-Crispr) or control ribonucleoproteins (control-Crispr), and then activated with anti-CD3 and anti-CD28 antibodies and IL-2 for 24 h. Cells were cultured in the presence of IL-7 and IL-15 for 6 days. Subsequently, 106 of these OT-I T cells were adoptively transferred into young congenic recipient mice (CD45.1−CD45.2+) that had been subcutaneously injected with 2 x 10⁵ of B16-OVA cells 8 days earlier (day 0). Mice injected with PBS instead of adoptive cell transfer were also analyzed for comparison. (A) Left, schematic diagrams show the experimental design (created with BioRender.com). Right, graphs show results of tumor volume measurements. Mice that received OT-I T cells with Epas1-Crispr (n = 23) or control-Crispr (n = 22) were analyzed. Data are pooled from four independent experiments. Results are shown as mean tumor volume ± SEM. Statistical analysis was performed using RM two-way ANOVA with uncorrected Fisher’s LSD test. *p <0.05, ****p < 0.0001. (B) Photos of tumors isolated from mice analyzed on day 20. n = 3 per group. (C-E) Cells isolated from tumor on day 20 were subjected to flow cytometry analysis. (C, D) The abundance of tumor-infiltrating OT-I T cells (CD8+CD45.1+CD45.2+) were analyzed. (C) Graph shows percentages of OT-I T cells. n = 6 (control-Crispr), n = 7 (Epas1-Crispr). (D) Graph shows absolute numbers of OT-I T cells per tumor volume (mm3). n = 7 per group. (E) Tim3 expression was analyzed. Graph shows MFI for Tim3 expression. n = 3 per group. Error bars indicate SD. Statistical analysis was performed using unpaired t-tests. *p <0.05, **p < 0.01. (C-E) Data are representative of 2 independent experiments. (F) On day 20 after tumor injection, OT-I T cells (CD8+CD45.1+CD45.2+) were FACS-sorted from tumors and subjected to bulk RNA-seq analysis. The volcano plot shows DEGs between OT-I T cells with Epas1-Crispr and control-Crispr (log2 fold change > 0.5 or < -0.5 and adjusted p < 0.05). Red and blue colored dots represent upregulated and downregulated genes in cells with Epas1-Crispr, respectively. n = 3 per group.
To understand how Epas1 promotes the anti-tumor response of CD8 T cells, we performed bulk RNA-seq analysis of tumor-infiltrating OT-I T cells treated with Epas1-Crispr. On day 12 after the adoptive transfer of OT-I T cells with Epas1-Crispr or control-Crispr into young recipient mice with B16-OVA tumors, we collected tumor-infiltrating lymphocytes and sorted OT-I T cells. Bulk RNA-seq analysis of these cells identified 32 differentially expressed genes (DEGs) between Epas1-Crispr and control-Crispr samples with a log2 fold change >|0.5| and adjusted p-value < 0.05 (Figure 7F). Genes downregulated by Epas1-Crispr included G protein coupled-receptor 108 (Gpr108) and coiled-coil domain containing 22 (Ccdc22), which are associated with the NF-κB pathway (40, 41); thiosulfate sulfurtransferase-like-domain-containing 2 (Tstd2), which promotes T cell infiltration of tumors (42); and Cd70, which facilitates T cell proliferation (43). In contrast, genes upregulated by Epas1-Crispr included polo-like kinase 4 (Plk4), which inhibits immune cell infiltration of tumors (44); and GRAM domain containing 4 (GRAMD4), which promotes apoptosis (45). Thus, Epas1 appears to control expression of several genes involved in infiltration of tumors, proliferation, and survival of CD8 T cells in anti-tumor responses.
Finally, we tested whether expression of exogenous Epas1 enhances anti-tumor activity of aged CD8 TCR-T cells as reported in young CD8 T cells (39). We infected aged CD8 T cells with a retroviral vector expressing Epas1 and Thy1.1 marker, followed by another retroviral vector expressing OT-I TCR and GFP. Flow cytometry analysis confirmed the transduction efficiency of Epas1-expressing vector indicated by expression of Thy1.1 marker was about 15% of GFP+ cells transduced with OT-I TCR (Figure 8A). We adoptively transferred these cells into young mice bearing B16-OVA tumors. Notably, adoptive transfer of aged OT-I TCR-T cells with Epas1 transduction significantly inhibited tumor growth compared to that of control cells (Figure 8B). Additionally, mice transferred with aged TCR-T cells that were transduced with Epas1-expressing vectors showed weight changes comparable to those of the control group (Supplementary Figure S6). Taken together, these results suggest that decreased expression of Epas1 impairs anti-tumor activity of CD8 TCR-T cells in ACT, which can be improved by expression of exogenous Epas1.
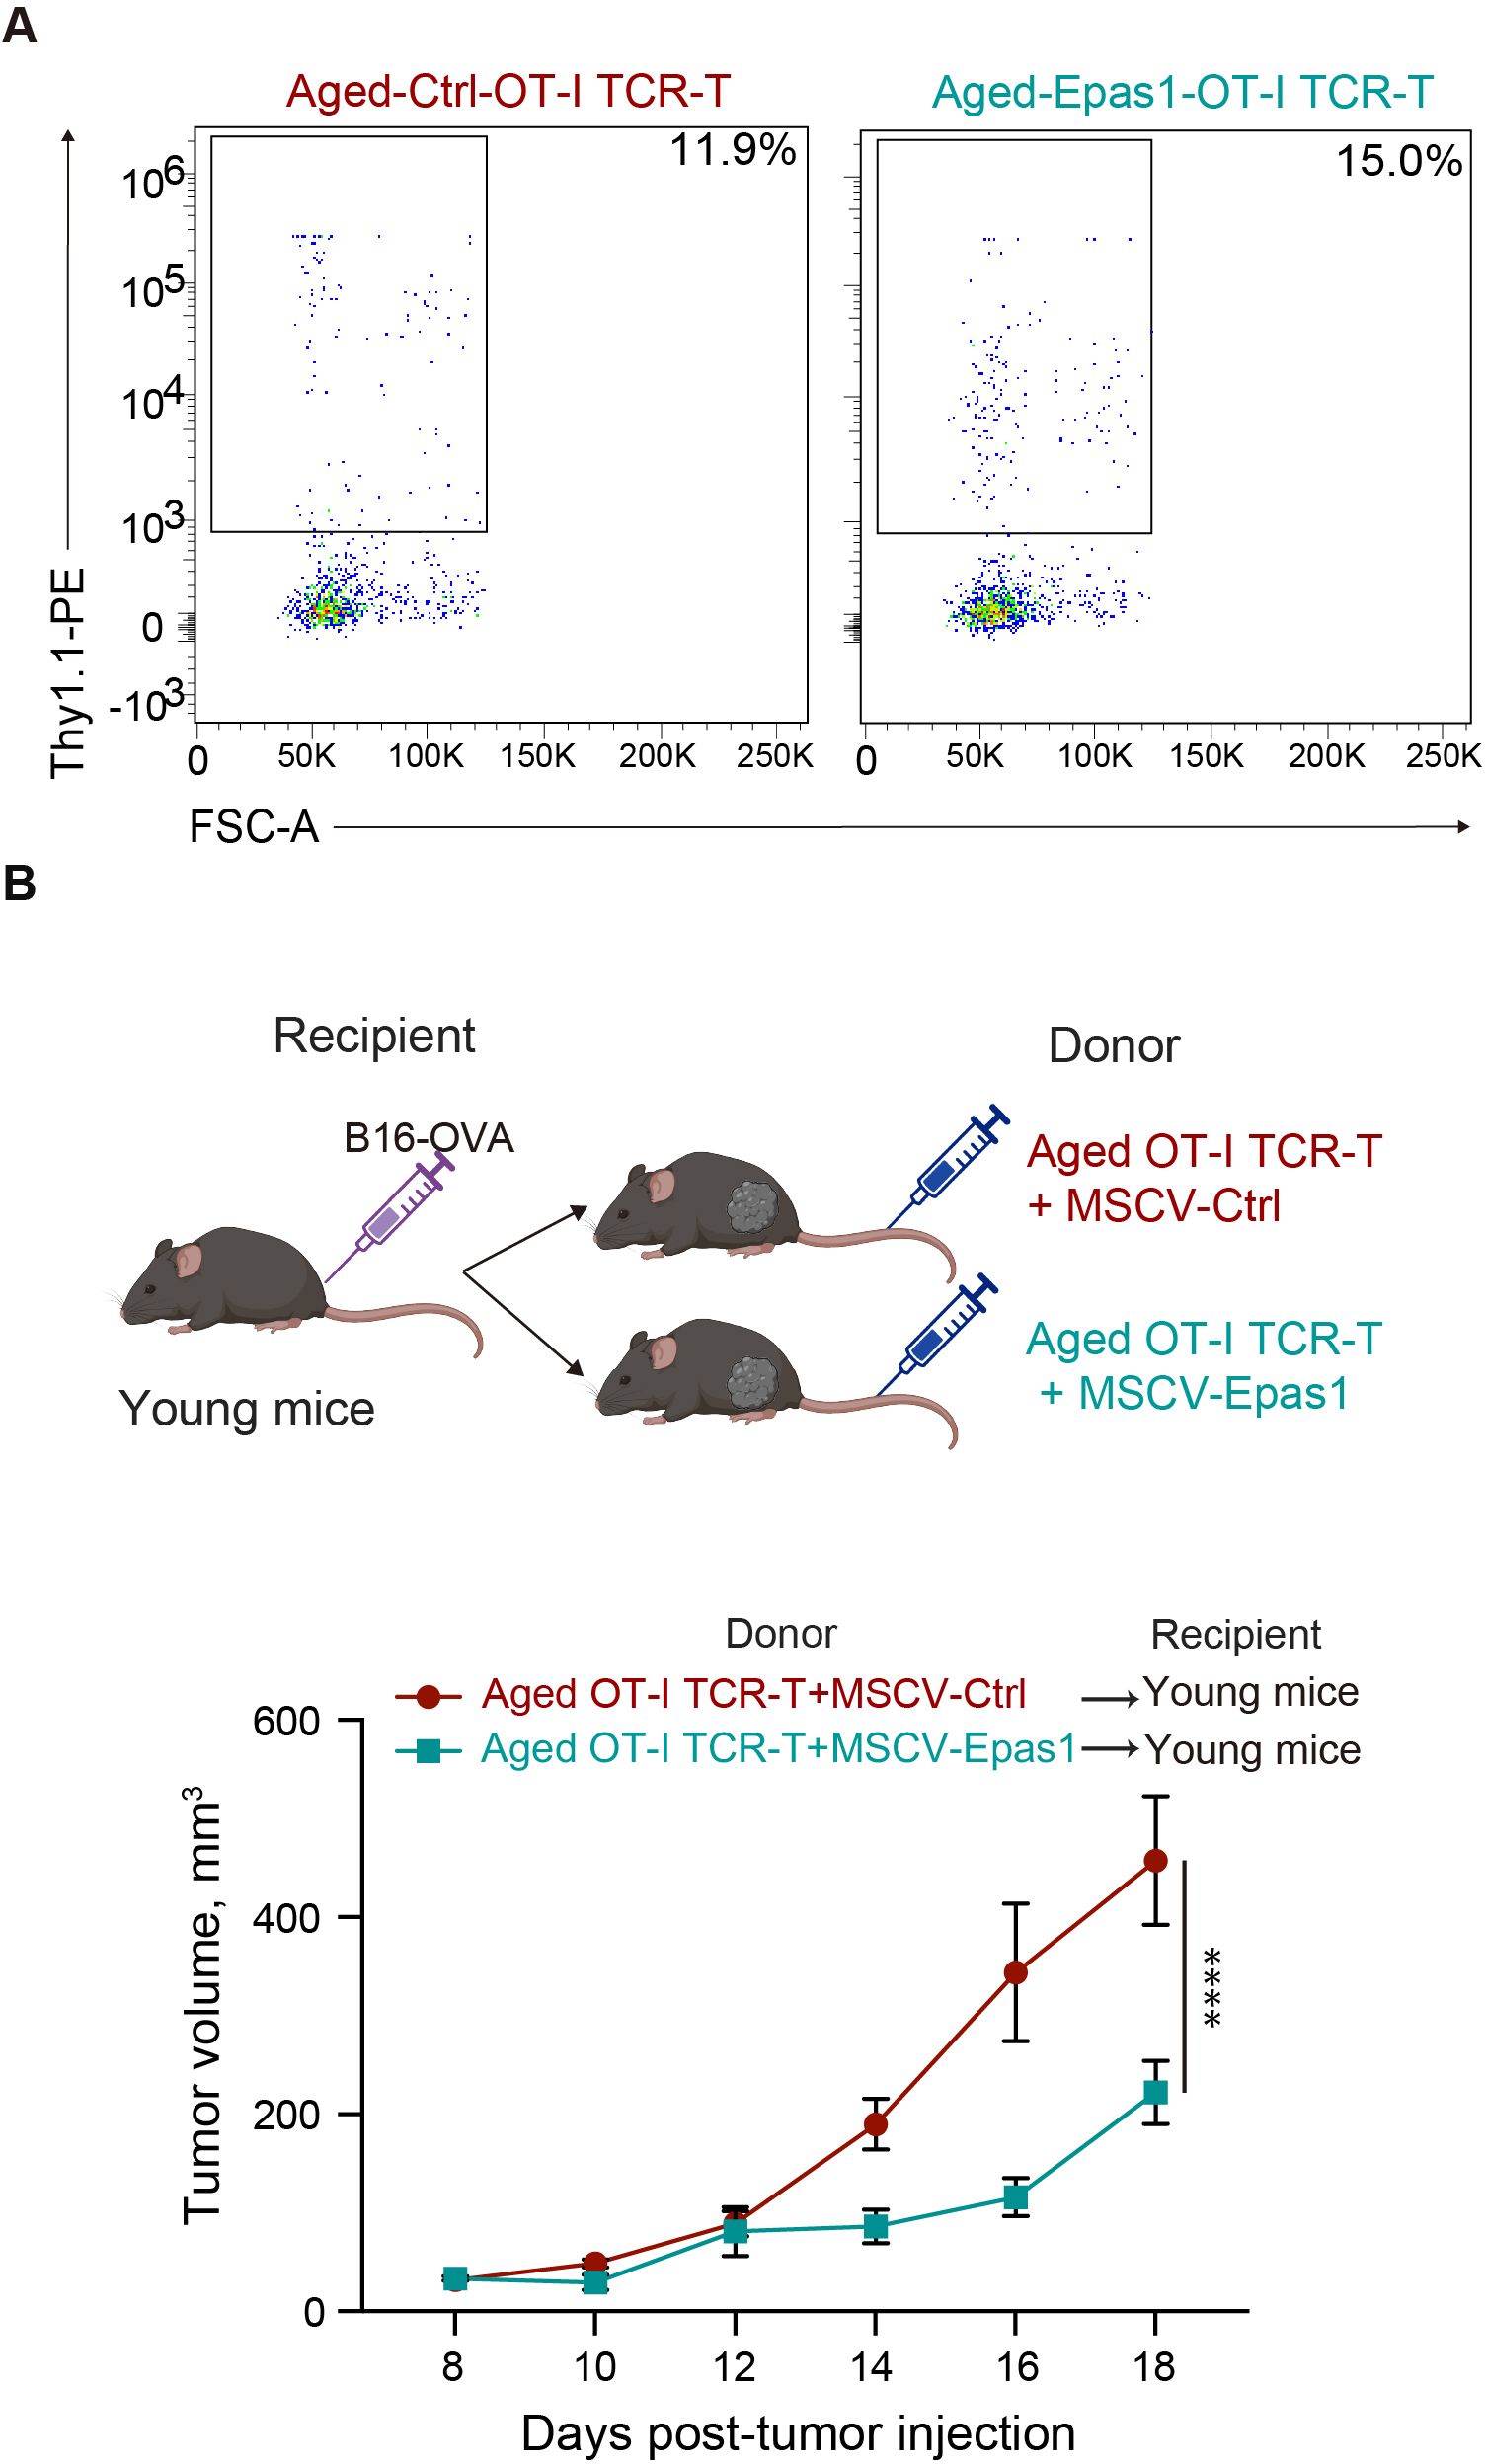
Figure 8. Retroviral expression of Epas1 enhances anti-tumor activity of CD8 TCR-T cells (A, B) CD8 T cells isolated from aged mice were transduced with a retroviral vector expressing Epas1 and Thy1.1 marker (MSCV-Epas1-Thy1.1) or control vector (empty MSCV-Thy1.1), followed by MIGR1-OT-I, generating aged OT-I TCR-T + MSCV-Epas1 cells and aged OT-I TCR-T + MSCV-control cells, respectively. Cells were cultured in the presence of IL-7 and IL-15 for 6 days. (A) Flow cytometry analysis of the frequency of cells transduced with MSCV-Epas1-Thy1.1 (Thy1.1+) in cells transduced with MIGR1-OT-I (GFP+). Representative plots are shown. (B) Cells including 106 GFP+ cells were adoptively transferred into young mice that had been subcutaneously injected with 2 x 10⁵ of B16-OVA cells 8 days earlier (day 0). Left schematic diagrams show the experimental design (created with BioRender.com). Right graph shows results of tumor volume measurements. n=3 per group. Results are shown as mean tumor volume ± SEM. Statistical analysis was performed using two-way RM ANOVA with uncorrected Fisher’s LSD test. ****p<0.0001. (A, B) Data are representative of 2 independent experiments.
This study demonstrated that aging significantly impairs anti-tumor responses of antigen-specific CD8 T cells in ACT using a mouse model of melanoma. We found that aged CD8 T cells retrovirally transduced with TCRs specific to tumor antigens can proliferate and maintain anti-tumor cytolytic capacity in vitro, but that their anti-tumor activity in vivo is diminished. Age-related CD8 T-cell-intrinsic changes are sufficient to impair their anti-tumor responses after adoptive transfer into young recipient mice. Moreover, we identified Epas1 as a representative gene downregulated in aged TCR-T cells. Importantly, Epas1 deficiency restricts the capacity of young CD8 T cells to accumulate as Tpex-like cells in tumors, so as to control tumor growth. In contrast, retroviral expression of Epas1 promotes anti-tumor activity of aged CD8 T cells in ACT. These results imply that decreased expression of Epas1 is associated with diminished anti-tumor activity of aged CD8 TCR-T cells.
We found that both aging and Epas1 deficiency impair accumulation of TCR-T cells in tumors, which likely causes the decreased anti-tumor activity of these cells. Our scRNA-seq data for intra-tumoral TCR-T cells revealed the age-related decrease in the frequency of Mki67-expressing Tpex-like cells (cluster 0), which can persist in tumors and sustain effective anti-tumor CD8 T cell responses more effectively than Tex cells (46, 47). Meanwhile, we observed a slight increase in the proportions of Tex-like cells (clusters 3 and 4), cells differentiating to Tex (clusters 1 and 2), and cells lacking effector molecule expression (cluster5). Furthermore, we observed that intra-tumoral Epas1-deficient TCR-T cells exhibit increased expression of Tim3, which suggesting a phenotypic shift from Tpex-like cells to Tex cells, along with reduced expression of regulators of cell proliferation, such as Myc. These results imply that impaired intra-tumoral accumulation of aged TCR-T cells may be due to their defects in Epas1-mediated induction or maintenance of Tpex-like cells with high proliferative capacity.
Our results also suggest that defective anti-tumor activity of aged TCR-T cells may not be solely on decreased Epas1 expression. For example, our in vitro analysis revealed that aging, but not Epas1 deficiency, impairs CD8 TCR-T cell capability to exhibit a central memory phenotype, which is associated with high anti-tumor activity (31). Additionally, we observed that aging, but not Epas1 deficiency, significantly increases GzmB expression in TCR-T cells, without affecting their cytotoxic activity in vitro. Since GzmB primarily exerts cytotoxic functions in a perforin-dependent manner (48), age-related increase in GzmB expression alone is not likely sufficient to enhance cytotoxic activity of aged CD8 TCR-T cells.
Hif transcription factors, Epas1 and Hif1α, appear to have shared and distinct functions in CD8 T cell responses. Hif1α, but not Epas1, is necessary for in vitro CD8 T cell responses, including TCR-induced metabolic reprogramming to glycolysis and the hypoxia-induced increase in expression of effector molecules, such as IFN-γ and GzmB (49). Moreover, Hif1α is indispensable for anti-tumor responses of both endogenous CD8 T cells and adoptively transferred tumor-specific CD8 T cells (50). In contrast, Epas1 is required for anti-tumor responses of adoptively transferred tumor-specific CD8 T cells, as we demonstrated, but not for anti-tumor responses of endogenous CD8 T cells (50). Our observation of altered frequencies of Tim3-expressing cells in intra-tumoral Epas1-deficient CD8 T cells suggests that Epas1 is involved in control of the balance between Tpex and Tex cells. In contrast, it remains unknown whether loss of Hif1α causes similar effects in intra-tumoral CD8 T cells. Epas1 might also promote infiltration of tumor-specific T cells into tumors, like Hif1a (50), since Epas1 controls expression of genes involved in tumor infiltration of immune cells, such as Plk4 and Tstd2.
How Epas1 mRNA expression is decreased by aging remains unknown. Age-related decrease in Epas1 expression was also observed in gingival tissues of monkeys (51) and in the lungs of sheep (52), but the underlying mechanism was not studied. Although hypoxia-mediated protein stabilization is the major mechanism to regulate expression of Epas1 and Hif1α (53), transcriptional regulatory mechanisms also help to control their expression (54). Since aging decreases mRNA expression of Epas1, but not Hif1a, aging should lead to defects in transcriptional regulatory mechanisms specific to Epas1. As TCR signaling promotes expression of both Epas1 and Hif1 (50, 55), the age-related decrease in TCR signaling (56) is not likely the main cause of this specific reduction of Epas1 expression. Epas1 transcription is promoted by distinct pathways mediated by IL-4 (57), mTORC2 (58), and E2F transcription factor (59), and it is inhibited by an epigenetic mechanism mediated by histone deacetylase (HDAC) (60) and DNA methyltransferase 3 alpha (DNMT3a) (61). In our GSEA of scRNA-seq data, genes related to the E2F pathway were significantly downregulated in aged CD8 T cells. Thus, it is possible that age-related downregulation of E2F is responsible for decreased expression of Epas1 in aged CD8 T cells.
Using an ACT model against melanoma in female mice, this study revealed the impact of aging and modulation of Epas1 expression on anti-tumor responses of CD8 T cells. Despite considerable variations in tumor growth kinetics observed in the same group of samples, likely due to technical variations in the preparation of TCR-T cells, we detected statistically significant differences indicating the effects of aging and knockout or overexpression of Epas1 in CD8 T cells on the tumor growth. However, since we used only female mice for the in vivo experiments, future studies need to determine the relevance of our findings in other experimental settings. It is important to assess whether age-related changes and Epas1 functions in CD8 T cells in adoptive cell therapy are conserved across both sexes and in diverse organisms, including humans. Furthermore, verifying Epas1 decrease in CD8 T cells in cancer patients is helpful to explore the therapeutic potential of Epas1 overexpression in ACT with aged CD8 T cells. It is also interesting to investigate the effects of aging and Epas1 deficiency on anti-tumor responses of CD4 T cells.
In summary, our findings highlight negative impacts of aging on ACT for solid tumors using tumor-specific CD8 T cells. Aged CD8 T cells have reduced expression of Epas1, which promotes anti-tumor CD8 T cell responses by enhancing intra-tumoral accumulation of Tpex cells. Thus, Epas1 may be a biomarker to predict the age-related decline in anti-tumor efficacy of ACT using tumor-specific CD8 T cells. It may also serve as a potential therapeutic target to improve such therapy in elderly patients.
The datasets presented in this study can be found in online repositories. The names of the repository/repositories and accession number(s) can be found below: https://www.ddbj.nig.ac.jp/, PRJDB18653.
The animal study was approved by Animal Care and Use Committee at Okinawa Institute of Science and Technology Graduate University. The study was conducted in accordance with the local legislation and institutional requirements.
GK: Conceptualization, Data curation, Formal analysis, Investigation, Methodology, Software, Validation, Visualization, Writing – original draft, Writing – review & editing. MT: Data curation, Formal analysis, Investigation, Validation, Visualization, Writing – review & editing. SS: Data curation, Formal analysis, Investigation, Methodology, Writing – review & editing. RK: Investigation, Writing – review & editing. HI: Funding acquisition, Project administration, Resources, Supervision, Writing – original draft, Writing – review & editing.
The author(s) declare financial support was received for the research, authorship, and/or publication of this article. This study was supported by JSPS for a Grant-in-Aid for Scientific Research (B) (Grant No. 23H02635 to HI). We thank OIST Graduate University for its generous funding of the Immune Signal Unit.
We are grateful to members of the OIST Sequencing Center for their support for sequencing experiments. We would like to thank Dr Stephen D. Winn for his assistance in running the single-cell and bulk RNA-sequencing analyses on OIST computational resources. We also thank Steven D. Aird for editing the manuscript.
The authors declare that the research was conducted in the absence of any commercial or financial relationships that could be construed as a potential conflict of interest.
All claims expressed in this article are solely those of the authors and do not necessarily represent those of their affiliated organizations, or those of the publisher, the editors and the reviewers. Any product that may be evaluated in this article, or claim that may be made by its manufacturer, is not guaranteed or endorsed by the publisher.
The Supplementary Material for this article can be found online at: https://www.frontiersin.org/articles/10.3389/fimmu.2025.1484303/full#supplementary-material
1. Lopez-Otin C, Blasco MA, Partridge L, Serrano M, Kroemer G. The hallmarks of aging. Cell. (2013) 153:1194–217. doi: 10.1016/j.cell.2013.05.039
2. Han S, Georgiev P, Ringel AE, Sharpe AH, Haigis MC. Age-associated remodeling of T cell immunity and metabolism. Cell Metab. (2023) 35:36–55. doi: 10.1016/j.cmet.2022.11.005
3. Naylor K, Li G, Vallejo AN, Lee WW, Koetz K, Bryl E, et al. The influence of age on T cell generation and tcr diversity. J Immunol. (2005) 174:7446–52. doi: 10.4049/jimmunol.174.11.7446
4. Goronzy JJ, Lee WW, Weyand CM. Aging and T-cell diversity. Exp Gerontol. (2007) 42:400–6. doi: 10.1016/j.exger.2006.11.016
5. Sun X, Nguyen T, Achour A, Ko A, Cifello J, Ling C, et al. Longitudinal analysis reveals age-related changes in the T cell receptor repertoire of human T cell subsets. J Clin Invest. (2022) 132:e158122. doi: 10.1172/JCI158122
6. Yager EJ, Ahmed M, Lanzer K, Randall TD, Woodland DL, Blackman MA. Age-associated decline in T cell repertoire diversity leads to holes in the repertoire and impaired immunity to influenza virus. J Exp Med. (2008) 205:711–23. doi: 10.1084/jem.20071140
7. Gardner ID. The effect of aging on susceptibility to infection. Rev Infect Dis. (1980) 2:801–10. doi: 10.1093/clinids/2.5.801
8. Mika J, Yoshida K, Kusunoki Y, Candeias SM, Polanska J. Sex- and age-specific aspects of human peripheral T-cell dynamics. Front Immunol. (2023) 14:1224304. doi: 10.3389/fimmu.2023.1224304
9. Whisler RL, Newhouse YG, Bagenstose SE. Age-related reductions in the activation of mitogen-activated protein kinases P44mapk/erk1 and P42mapk/erk2 in human T cells stimulated via ligation of the T cell receptor complex. Cell Immunol. (1996) 168:201–10. doi: 10.1006/cimm.1996.0067
10. Weng NP, Akbar AN, Goronzy J. Cd28(-) T cells: their role in the age-associated decline of immune function. Trends Immunol. (2009) 30:306–12. doi: 10.1016/j.it.2009.03.013
11. Ron-Harel N, Notarangelo G, Ghergurovich JM, Paulo JA, Sage PT, Santos D, et al. Defective respiration and one-carbon metabolism contribute to impaired naive T cell activation in aged mice. Proc Natl Acad Sci U.S.A. (2018) 115:13347–52. doi: 10.1073/pnas.1804149115
12. Quinn KM, Palchaudhuri R, Palmer CS, La Gruta NL. The clock is ticking: the impact of ageing on T cell metabolism. Clin Transl Immunol. (2019) 8:e01091. doi: 10.1002/cti2.1091
13. Sekido K, Tomihara K, TaChinami H, Heshiki W, Sakurai K, Moniruzzaman R, et al. Alterations in composition of immune cells and impairment of anti-tumor immune response in aged oral cancer-bearing mice. Oral Oncol. (2019) 99:104462. doi: 10.1016/j.oraloncology.2019.104462
14. Norian LA, Allen PM. No intrinsic deficiencies in cd8+ T cell-mediated antitumor immunity with aging. J Immunol. (2004) 173:835–44. doi: 10.4049/jimmunol.173.2.835
15. Nakajima Y, Chamoto K, Oura T, Honjo T. Critical role of the cd44(Low)Cd62l(Low) cd8(+) T cell subset in restoring antitumor immunity in aged mice. Proc Natl Acad Sci U.S.A. (2021) 118:e2103730118. doi: 10.1073/pnas.2103730118
16. Grizzle WE, Xu X, Zhang S, Stockard CR, Liu C, Yu S, et al. Age-related increase of tumor susceptibility is associated with myeloid-derived suppressor cell mediated suppression of T cell cytotoxicity in recombinant inbred bxd12 mice. Mech Ageing Dev. (2007) 128:672–80. doi: 10.1016/j.mad.2007.10.003
17. Padron A, Hurez V, Gupta HB, Clark CA, Pandeswara SL, Yuan B, et al. Age effects of distinct immune checkpoint blockade treatments in a mouse melanoma model. Exp Gerontol. (2018) 105:146–54. doi: 10.1016/j.exger.2017.12.025
18. Garcia MG, Deng Y, Murray C, Reyes RM, Padron A, Bai H, et al. Immune checkpoint expression and relationships to anti-pd-L1 immune checkpoint blockade cancer immunotherapy efficacy in aged versus young mice. Aging Cancer. (2022) 3:68–83. doi: 10.1002/aac2.12045
19. Sitnikova SI, Walker JA, Prickett LB, Morrow M, Valge-Archer VE, Robinson MJ, et al. Age-induced changes in anti-tumor immunity alter the tumor immune infiltrate and impact response to immuno-oncology treatments. Front Immunol. (2023) 14:1258291. doi: 10.3389/fimmu.2023.1258291
20. Hiltensperger M, Krackhardt AM. Current and future concepts for the generation and application of genetically engineered car-T and tcr-T cells. Front Immunol. (2023) 14:1121030. doi: 10.3389/fimmu.2023.1121030
21. Keane JT, Posey AD Jr. Chimeric antigen receptors expand the repertoire of antigenic macromolecules for cellular immunity. Cells. (2021) 10:3356. doi: 10.3390/cells10123356
22. Watanabe K, Nishikawa H. Engineering strategies for broad application of tcr-T- and car-T-cell therapies. Int Immunol. (2021) 33:551–62. doi: 10.1093/intimm/dxab052
23. Duncan BB, Dunbar CE, Ishii K. Applying a clinical lens to animal models of car-T cell therapies. Mol Ther Methods Clin Dev. (2022) 27:17–31. doi: 10.1016/j.omtm.2022.08.008
24. Zhao X, Shao S, Hu L. The recent advancement of tcr-T cell therapies for cancer treatment. Acta Biochim Biophys Sin (Shanghai). (2024) 56:663–74. doi: 10.3724/abbs.2024034
25. Wang JY, Wang L. Car-T cell therapy: where are we now, and where are we heading? Blood Sci. (2023) 5:237–48. doi: 10.1097/BS9.0000000000000173
26. Neelapu SS, Locke FL, Bartlett NL, Lekakis LJ, Miklos DB, Jacobson CA, et al. Axicabtagene ciloleucel car T-cell therapy in refractory large B-cell lymphoma. N Engl J Med. (2017) 377:2531–44. doi: 10.1056/NEJMoa1707447
27. Cappell KM, Kochenderfer JN. Long-term outcomes following car T cell therapy: what we know so far. Nat Rev Clin Oncol. (2023) 20:359–71. doi: 10.1038/s41571-023-00754-1
28. D'Angelo SP, Araujo DM, Abdul Razak AR, Agulnik M, Attia S, Blay JY, et al. Afamitresgene autoleucel for advanced synovial sarcoma and myxoid round cell liposarcoma (Spearhead-1): an international, open-label, phase 2 trial. Lancet. (2024) 403:1460–71. doi: 10.1016/S0140-6736(24)00319-2
29. Holst J, Szymczak-Workman AL, Vignali KM, Burton AR, Workman CJ, Vignali DA. Generation of T-cell receptor retrogenic mice. Nat Protoc. (2006) 1:406–17. doi: 10.1038/nprot.2006.61
30. Lanitis E, Rota G, Kosti P, Ronet C, Spill A, Seijo B, et al. Optimized gene engineering of murine car-T cells reveals the beneficial effects of il-15 coexpression. J Exp Med. (2021) 218:e20192203. doi: 10.1084/jem.20192203
31. Klebanoff CA, Gattinoni L, Torabi-Parizi P, Kerstann K, Cardones AR, Finkelstein SE, et al. Central memory self/tumor-reactive cd8+ T cells confer superior antitumor immunity compared with effector memory T cells. Proc Natl Acad Sci U.S.A. (2005) 102:9571–6. doi: 10.1073/pnas.0503726102
32. Quinn KM, Fox A, Harland KL, Russ BE, Li J, Nguyen THO, et al. Age-related decline in primary cd8(+) T cell responses is associated with the development of senescence in virtual memory cd8(+) T cells. Cell Rep. (2018) 23:3512–24. doi: 10.1016/j.celrep.2018.05.057
33. Guan Q, Han M, Guo Q, Yan F, Wang M, Ning Q, et al. Strategies to reinvigorate exhausted cd8(+) T cells in tumor microenvironment. Front Immunol. (2023) 14:1204363. doi: 10.3389/fimmu.2023.1204363
34. Tian W, Qin G, Jia M, Li W, Cai W, Wang H, et al. Hierarchical transcriptional network governing heterogeneous T cell exhaustion and its implications for immune checkpoint blockade. Front Immunol. (2023) 14:1198551. doi: 10.3389/fimmu.2023.1198551
35. Li AM, Ye J. Reprogramming of serine, glycine and one-carbon metabolism in cancer. Biochim Biophys Acta Mol Basis Dis. (2020) 1866:165841. doi: 10.1016/j.bbadis.2020.165841
36. Zhai X, Liu K, Fang H, Zhang Q, Gao X, Liu F, et al. Mitochondrial C1qbp promotes differentiation of effector cd8(+) T cells via metabolic-epigenetic reprogramming. Sci Adv. (2021) 7:eabk0490. doi: 10.1126/sciadv.abk0490
37. Tan TCJ, Kelly V, Zou X, Wright D, Ly T, Zamoyska R. Translation factor eif5a is essential for ifngamma production and cell cycle regulation in primary cd8(+) T lymphocytes. Nat Commun. (2022) 13:7796. doi: 10.1038/s41467-022-35252-y
38. Huang LE. Carrot and stick: hif-alpha engages C-myc in hypoxic adaptation. Cell Death Differ. (2008) 15:672–7. doi: 10.1038/sj.cdd.4402302
39. Velica P, Cunha PP, Vojnovic N, Foskolou IP, Bargiela D, Gojkovic M, et al. Modified hypoxia-inducible factor expression in cd8(+) T cells increases antitumor efficacy. Cancer Immunol Res. (2021) 9:401–14. doi: 10.1158/2326-6066.CIR-20-0561
40. Lyu S, Zhang X, Tu Z, Zhou H, Ke X, Qu Y. Gpr108 is required for gambogic acid inhibiting nf-kappab signaling in cancer. Pharmacol Res. (2022) 182:106279. doi: 10.1016/j.phrs.2022.106279
41. Starokadomskyy P, Gluck N, Li H, Chen B, Wallis M, Maine GN, et al. Ccdc22 deficiency in humans blunts activation of proinflammatory nf-kappab signaling. J Clin Invest. (2013) 123:2244–56. doi: 10.1172/JCI66466
42. Tang G, Sun K, Ding G, Wu J. Low expression of tstd2 serves as a biomarker for poor prognosis in kidney renal clear cell carcinoma. Int J Gen Med. (2023) 16:1437–53. doi: 10.2147/IJGM.S408854
43. Huang J, Kerstann KW, Ahmadzadeh M, Li YF, El-Gamil M, Rosenberg SA, et al. Modulation by il-2 of cd70 and cd27 expression on cd8+ T cells: importance for the therapeutic effectiveness of cell transfer immunotherapy. J Immunol. (2006) 176:7726–35. doi: 10.4049/jimmunol.176.12.7726
44. Zhang X, Li Z, Wei C, Luo L, Li S, Zhou J, et al. Plk4 initiates crosstalk between cell cycle, cell proliferation and macrophages infiltration in gliomas. Front Oncol. (2022) 12:1055371. doi: 10.3389/fonc.2022.1055371
45. John K, Alla V, Meier C, Putzer BM. Gramd4 mimics P53 and mediates the apoptotic function of P73 at mitochondria. Cell Death Differ. (2011) 18:874–86. doi: 10.1038/cdd.2010.153
46. Fang Z, Ding X, Huang H, Jiang H, Jiang J, Zheng X. Revolutionizing tumor immunotherapy: unleashing the power of progenitor exhausted T cells. Cancer Biol Med. (2024) 21:499–512. doi: 10.20892/j.issn.2095-3941.2024.0105
47. Rahim MK, Okholm TLH, Jones KB, McCarthy EE, Liu CC, Yee JL, et al. Dynamic cd8(+) T cell responses to cancer immunotherapy in human regional lymph nodes are disrupted in metastatic lymph nodes. Cell. (2023) 186:1127–43 e18. doi: 10.1016/j.cell.2023.02.021
48. Shi L, Kraut RP, Aebersold R, Greenberg AH. A natural killer cell granule protein that induces DNA fragmentation and apoptosis. J Exp Med. (1992) 175(2):553–66. doi: 10.1084/jem.175.2.553
49. Finlay DK, Rosenzweig E, Sinclair LV, Feijoo-Carnero C, Hukelmann JL, Rolf J, et al. Pdk1 regulation of mtor and hypoxia-inducible factor 1 integrate metabolism and migration of cd8+ T cells. J Exp Med. (2012) 209:2441–53. doi: 10.1084/jem.20112607
50. Palazon A, Tyrakis PA, Macias D, Velica P, Rundqvist H, Fitzpatrick S, et al. An hif-1alpha/vegf-a axis in cytotoxic T cells regulates tumor progression. Cancer Cell. (2017) 32:669–83 e5. doi: 10.1016/j.ccell.2017.10.003
51. Ebersole JL, Novak MJ, Orraca L, Martinez-Gonzalez J, Kirakodu S, Chen KC, et al. Hypoxia-inducible transcription factors, hif1a and hif2a, increase in aging mucosal tissues. Immunology. (2018) 154:452–64. doi: 10.1111/imm.12894
52. He Y, Munday JS, Perrott M, Wang G, Liu X. Association of age with the expression of hypoxia-inducible factors hif-1alpha, hif-2alpha, hif-3alpha and vegf in lung and heart of tibetan sheep. Anim (Basel). (2019) 9:673. doi: 10.3390/ani9090673
53. Kietzmann T, Mennerich D, Dimova EY. Hypoxia-inducible factors (Hifs) and phosphorylation: impact on stability, localization, and transactivity. Front Cell Dev Biol. (2016) 4:11. doi: 10.3389/fcell.2016.00011
54. Albadari N, Deng S, Li W. The transcriptional factors hif-1 and hif-2 and their novel inhibitors in cancer therapy. Expert Opin Drug Discovery. (2019) 14:667–82. doi: 10.1080/17460441.2019.1613370
55. Phan AT, Goldrath AW. Hypoxia-inducible factors regulate T cell metabolism and function. Mol Immunol. (2015) 68:527–35. doi: 10.1016/j.molimm.2015.08.004
56. Zhang H, Jadhav RR, Cao W, Goronzy IN, Zhao TV, Jin J, et al. Aging-associated helios deficiency in naive cd4(+) T cells alters chromatin remodeling and promotes effector cell responses. Nat Immunol. (2023) 24:96–109. doi: 10.1038/s41590-022-01369-x
57. Takeda N, O'Dea EL, Doedens A, Kim JW, Weidemann A, Stockmann C, et al. Differential activation and antagonistic function of hif-alpha isoforms in macrophages are essential for no homeostasis. Genes Dev. (2010) 24:491–501. doi: 10.1101/gad.1881410
58. Mohlin S, Hamidian A, von Stedingk K, Bridges E, Wigerup C, Bexell D, et al. Pi3k-mtorc2 but not pi3k-mtorc1 regulates transcription of hif2a/epas1 and vascularization in neuroblastoma. Cancer Res. (2015) 75:4617–28. doi: 10.1158/0008-5472.CAN-15-0708
59. Moniz S, Bandarra D, Biddlestone J, Campbell KJ, Komander D, Bremm A, et al. Cezanne regulates E2f1-dependent hif2alpha expression. J Cell Sci. (2015) 128:3082–93. doi: 10.1242/jcs.168864
60. Nakazawa MS, Eisinger-Mathason TS, Sadri N, Ochocki JD, Gade TP, Amin RK, et al. Epigenetic re-expression of hif-2alpha suppresses soft tissue sarcoma growth. Nat Commun. (2016) 7:10539. doi: 10.1038/ncomms10539
Keywords: aging, adoptive T-cell therapy, cancer, CD8 T cells, Epas1
Citation: Kadyrzhanova G, Tamai M, Sarkar S, Kalra RS and Ishikawa H (2025) Aging impairs CD8 T cell responses in adoptive T-cell therapy against solid tumors. Front. Immunol. 16:1484303. doi: 10.3389/fimmu.2025.1484303
Received: 21 August 2024; Accepted: 02 January 2025;
Published: 24 January 2025.
Edited by:
Guillaume Beyrend, Université de Lille, FranceReviewed by:
Kristin G. Anderson, University of Virginia, United StatesCopyright © 2025 Kadyrzhanova, Tamai, Sarkar, Kalra and Ishikawa. This is an open-access article distributed under the terms of the Creative Commons Attribution License (CC BY). The use, distribution or reproduction in other forums is permitted, provided the original author(s) and the copyright owner(s) are credited and that the original publication in this journal is cited, in accordance with accepted academic practice. No use, distribution or reproduction is permitted which does not comply with these terms.
*Correspondence: Hiroki Ishikawa, aGlyb2tpLmlzaGlrYXdhQG9pc3QuanA=
Disclaimer: All claims expressed in this article are solely those of the authors and do not necessarily represent those of their affiliated organizations, or those of the publisher, the editors and the reviewers. Any product that may be evaluated in this article or claim that may be made by its manufacturer is not guaranteed or endorsed by the publisher.
Research integrity at Frontiers
Learn more about the work of our research integrity team to safeguard the quality of each article we publish.