 Hiyori Sakaguchi
 Masaru Matsuda
 Norimasa Iwanami
- Center for Bioscience Research and Education, Utsunomiya University, Utsunomiya, Japan
The cellular and molecular mechanisms underlying lymphocyte development are diverse among teleost species. Although recent scRNA-seq analyses of zebrafish hematopoietic cells have advanced our understanding of teleost hematopoiesis, comparative studies using another genetic model, medaka, which is evolutionarily distant among teleosts, is useful for understanding commonality and species-specificity in teleosts. In order to gain insight into how different molecular and cellular mechanisms of lymphocyte development in medaka and zebrafish, we established a recombination activating gene 1 (rag1) mutant medaka, which exhibited defects in V(D)J rearrangement of lymphocyte antigen receptor genes, accordingly lacking mature B and T cells. scRNA-seq analysis of wild type and rag1 mutant lymphocytes in the thymus and kidney characterized the developing stages of T and B cells, and found that most developed cd4+cd8– and cd4–cd8+ single-positive (SP) T-cell populations are absent in the thymus, and identified lymphoid progenitor cells already committed to the T lineage in kidney, implying unique features of medaka lymphocyte development.
1 Introduction
Lymphocytes are equipped with highly diverse and specific antigen receptors and play central roles in the adaptive immune systems, which have evolved in vertebrates. In order to secure responses against all kinds of antigens, but at the same time to avoid attacking to self-tissues, lymphocyte development is exquisitely and hierarchically regulated (1, 2). The cellular and molecular mechanisms of mammalian lymphocyte development have been studied in depth, with relevance to such as immune disease patients and model mice (3, 4). V(D)J rearrangement of immunoglobulins and T-cell receptors (TCRs), in which the Recombination-activating gene (RAG) 1 and RAG2 cooperatively play important roles, is indispensable for the development of B cells and T cells, respectively (5–7). Regarding T-cell development in the thymus, the developmental stages of thymocytes are divided by cell surface expression of TCR coreceptors CD4 and CD8 (8), from immature CD4–CD8– double-negative (DN), followed by CD4+CD8+ double-positive (DP), to the most mature CD4+CD8– or CD4–CD8+ single-positive (SP) stages.
Compared to mammals, the mechanisms of the fish immune system, including lymphocyte development, have been much less studied. Teleosts constitute approximately half of the vertebrate species. Recent studies on teleost immune systems using various fish species including zebrafish, which has been established as a model fish for genetics, developmental biology and physiology, have revealed that the principle of adaptive immunity is conserved between teleosts and mammals (9, 10). However, for as many as approximately 425 million years since the divergence of ray-finned fishes including teleosts, and lobe-finned fish including the ancestors of mammals, each group has evolved their adaptive immune systems, resulting in differences in immune cell types and their molecular composition (11).
In addition, recent whole-genome sequencing of teleost species has identified that, even among teleosts, diverse immune systems have been generated. For instance, Atlantic cod lacks major histocompatibility complex (MHC) class II and the entire CD4+ T-cell component of adaptive immunity (12, 13). Moreover, a comparative genomics study of deep-sea anglerfish species identified a relationship between the degree of sex parasitism and loss of adaptive immune systems; species with permanent physical attachment even lack functional rag genes, resulting in the complete loss of adaptive immune systems (14).
Among such diverse teleost species, zebrafish have been widely used for genetics and bioimaging and have contributed to the understanding of hematopoiesis, lymphopoiesis, and immune functions (10, 15, 16). Zebrafish mutants of orthologs of genes known to be involved in mammalian lymphopoiesis, such as rag1, protein kinase, DNA-activated, catalytic subunit (prkdc), interleukin 2 receptor, gamma chain (il2rg), exhibit immunodeficiency, indicating the commonality of roles of these genes among vertebrates (17–19).
Although the lack of panels of cell surface antibodies hinders the cellular analysis of lymphocytes, lymphocyte-specific promoter-driven fluorescence transgenic zebrafish have been progressing in understanding the cellular and molecular mechanisms of lymphocyte development and immune functions (20–23). In addition, recent single-cell RNA sequencing (scRNA-seq) analyses of hematopoietic cells from lymphoid organs including the kidney, spleen, and thymus have identified cellular components, their marker genes, and their developing trajectories (24–27). Furthermore, recent single-cell RNA sequencing (scRNA-seq) analyses have identified dynamic changes in cellular components and expression patterns of wild-type and rag1 mutant gut cells after immune activation (28), as well as in spleen and intestine cells after viral infection (29, 30).
However, as mentioned above, teleosts are evolutionarily diverse; therefore, one model fish cannot represent lymphocyte development in general teleosts. Medaka is a small freshwater fish species that evolutionally diverged from the ancestor of zebrafish as long as 110–160 million years ago, but share similar body size, lifespan, and habitat (31). Medaka has been established as a model organism for studies on genetics, developmental biology, and evolutionary biology (31). The existence of abundant closely related species of medaka that live in a wide range of temperatures and salinities enhances the value of medaka as a model for comparative immunology (32). Recent studies have found that medaka shares fundamental genes involved in hematopoiesis and lymphocyte development with zebrafish and mammals (33–36), indicating its potential as a model for studying the evolution of immune systems. Accordingly, identification of molecular and cellular mechanisms of medaka lymphocyte development and understanding how different mechanisms medaka and zebrafish possess must facilitate comprehension of the evolution of teleost immune systems.
Here, to uncover the molecular and cellular mechanisms of medaka lymphocyte development, we established an immunodeficient rag1 mutant medaka. The rag1 mutant exhibited defects in the V(D)J rearrangement of immunoglobulin and t-cell receptor genes, and accordingly lacked mature B and T cells. scRNA-seq analysis of wild-type and rag1 mutant lymphocytes in the kidney and thymus identified rag1-independent and -dependent developing lymphocytes. We characterized the developmental stages of B and T cells, and found that there was neither a cd4+cd8– nor cd4–cd8+ single-positive (SP) population in the thymus and identified lymphoid progenitor cells expressing novel family genes encoding immunoglobulin domain-containing cell surface proteins already committed to the T lineage in the kidney. These mechanisms are unique features of medaka lymphocyte development and are not shared by zebrafish.
2 Materials and methods
2.1 Fish lines
The medaka (Oryzias latipes) lines were obtained from the National Bioresource Project (NBRP) Medaka and maintained at Utsunomiya University: standard line OK-cab (strain ID: MT830) and cab-Tg (rag1:egfp), a transgenic medaka expressing egfp under the control of an immature lymphocyte-specific rag1 promoter (strain ID: TG848) (34). Fish were maintained in temperature-controlled tanks (26°C) with a water circulation system under a 14 h light/10 h dark cycle. This study was conducted in accordance with the ethical guidelines of the Utsunomiya University Animal Experimentation Committee and the experimental protocols were approved by the committee (approval no. A23-0011). The developmental stages of medaka were designated as previously described (37).
2.2 Genome editing
The Alt-R CRISPR-Cas9 crRNA targeting exon 4 of rag1 (ENSORLG00000011969.3), Alt-R CRISPR-Cas9 tracrRNA, and Cas9 protein were purchased from Integrated DNA Technologies (IDT; Singapore). The sgRNA sequences are listed in Supplementary Table S1. RNA–protein complexes were prepared according to the manufacturer’s instructions. Glass capillaries with 1.0 mm outer diameter were pulled (temperature 62°C, force: two light and two heavy weights provided by the manufacturer) using a micropipette puller PC-10 (Narishige Instruments, Tokyo, Japan). The capillary was filled with crRNA (0.75 mM), tracrRNA (1.5 mM), and 0.25 mg/mL Cas9 protein. Then, 1–2 nL of the mixture was injected into 1-cell Cab embryos using FemtoJet 4i (Eppendorf, Hamburg, Germany). G0 fish were crossed with wild-type (WT) Cab fish to establish the rag1 mutant strains. rag1del8 was chosen for the phenotypic analysis. The primers used for genotyping are listed in Supplementary Table S1. The mutant line was deposited in NBRP medaka as rag1 (del8); MT1583.
2.3 Transgenesis
The 4.7kb of the medaka lck promoter, upstream of the ATG initiation codon situated in exon 2, was amplified from the genomic DNA of the Hd-rR strain. egfp and SV40 polyA were amplified from pEGFP-1 plasmid (Takara Clontech). Primer sequences are listed in Supplementary Table S1. Amplicons of the lck promoter and egfp+SV40 polyA were cloned into the linearized pUC19 plasmid using In-Fusion HD (Takara Clontech). Accordingly, the lck:egfp construct, including the medaka lck promoter, egfp, and SV40 polyA, was generated. 25 ng/µL lck:egfp construct was injected into fertilized eggs of the cab strain for transgenesis using FemtoJet 4i (Eppendorf, Hamburg, Germany). Embryos around the day of hatching were observed under a fluorescence microscope and those exhibiting EGFP signals in the pharyngeal region as was previously reported (38) were further used to establish lck:egfp transgenic lines. Two stable transgenic lines were generated, one of which was used for further analysis. The transgenic line was deposited in NBRP Medaka as cab-Tg (lck-egfp); TG1582.
2.4 Imaging of medaka specimens
Larvae and adult medaka were anesthetized with 0.1% (v/v) 2-phenoxyethanol and immobilized in 3% methylcellulose. Images were captured using a DFC450c digital camera (Leica, Houston, TX, USA) under an M205FA fluorescence stereo microscope (Leica, Houston, TX, USA) and acquired using Leica Application Suite X (LASX) v1.1.0 (Leica, Houston, TX, USA). The area and fluorescence intensity of the images were measured using the ImageJ software (National Institutes of Health, MD).
2.5 Histological analysis
Whole bodies of the adults were fixed in 4% Paraformaldehyde/PBS overnight at 4°C. Paraffin sectioning was performed as previously described (39). Transverse sections (5 µm thick) were stained with hematoxylin and eosin. Images were captured using a DP73 digital camera (Olympus, Tokyo, Japan) under a BX60 microscope (Olympus, Tokyo, Japan).
2.6 Reverse transcription-PCR
RNA was extracted using a NucleoSpin RNA kit (Macherey-Nagel, Düren, Germany) with on-column DNase treatment. RNA was reverse-transcribed using a QuantiTect Reverse Transcription Kit (Qiagen). To detect immunoglobulin mu (igm) and t-cell receptor beta chain (tcrb) cDNA after VDJ rearrangement, nested PCR was performed using primer sets targeting the variable (V) and constant (C) regions. Two V regions that were highly expressed in wild-type kidney were chosen for RT-PCR analysis (data not shown). Amplification was performed in a thermal cycler using the following program: 1 min at 95°C; cycles of 10 s at 95°C, 30 s at 59°C, 30 s at 72°C; and 5 min at 72°C. The cycle numbers were as follows: actb (actin beta), 25 cycles; igm (igVH-Cm) and tcrb (tcrVb-Cb2), 30 cycles plus nested 30 cycles. The primers used for the RT-PCR are listed in Supplementary Table S1.
Quantitative PCR (qPCR) was performed using the THUNDERBIRD SYBR qPCR Mix (Toyobo, Osaka, Japan) and LightCycler 96 (Roche, Basel, Switzerland). Primers used for qPCR are listed in Supplementary Table S1.
2.7 Flow cytometry
Whole kidney marrow (WKM) cells and thymocytes were prepared as previously described (36). Cells were obtained by pipetting the organs into 1 mL ice-cold 1% fetal bovine serum (FBS) in 0.9× PBS, washed with 1% FBS in 0.9× PBS by centrifugation, and then filtered using a 40µm-stainless mesh. Analytical flow cytometry (FCM) was performed on a FACSLyric flow cytometer (BD Biosciences). Populations of lymphocytes, myelomonocytes, and precursors in WKM cells in light scatter profiles were defined using previous information in zebrafish and medaka (40, 41). Data analysis was performed using the Flowjo10.6.2 (BD Biosciences).
FACS Aria III (BD Biosciences) was used for cell sorting. The cell populations in the light scatter profiles of WKM cells and thymocytes were defined according to previous studies (34, 40, 41).
2.8 scRNA-seq
The single-cell RNA-seq library was constructed using the Chromium Controller and Chromium Next GEM Single Cell 3′Reagent Kits v3.1 (10x Genomics) following the standard manufacturer’s protocols. The FACS-sorted single-cell suspension was immediately loaded onto 10x Chromium iX to recover 10000 cells, followed by library construction. The library was sequenced using the Novaseq6000 system (Illumina), according to the manufacturer’s instructions. Sequencing was performed using a 28/90bp paired-end configuration. The obtained dataset was processed with Cell Ranger (v7.2.0). Oryzias_latipes.ASM223467v1.dna.toplevel.fa.gz (Ensembl) and olatipes-HdRr-ensembl-peaks2utr.v1.gtf.gz (https://figshare.com/articles/dataset/Medaka_Gene_Model_version_1/24080463?file=42403659) were used as the reference genome and annotation files, respectively.
2.9 Cell characterization and identification of differentially expressed genes
Loupe Browser v7.0.1 and v8.1.2 were used to characterize cell types. Barcodes with total Unique Molecular Identifier (UMI) counts of 2048–32768 (211–215) were used for this analysis. Cell characterization was based on gene expression profiles in t-distributed Stochastic Neighbor Embedding (t-SNE) plots. The proportion of clusters per sample was normalized, and principal component analysis (PCA) was performed using Python library scikit-learn (42). Differentially expressed genes were obtained by “compared to entire dataset” mode based on each cluster. The p-values calculated using the differential expression analysis feature were adjusted for multiple comparisons using the Benjamini–Hochberg correction. Python package Scanpy v1.9.3 (43) (https://genomebiology.biomedcentral.com/articles/10.1186/s13059-017-1382-0) was used to generate heatmaps. Genes used for cluster characterization were chosen based on expression profiles in zebrafish and mice (22, 25–27, 44–50) (Supplementary Table S1).
ighm, sid1, trac, and trdc were not annotated in medaka Ensembl ASM223467v1. Reads mapped to the target region and their cell barcodes were obtained from the bam files generated by Cell Ranger using SAMtools (ver. 1.10). Target areas were defined as ighm (8:14941689-14941969) (34) sid1 (4:24323750-24324064), trac (17:12460290-12460457) (34) and trdc (17:12510953-12511133) (51). sid1 was retrieved from the genome database of Ensembl ASM223467v1 through TBLASTN, using the amino acid sequence of zebrafish sid1 (ENSDARG00000095540) as a query. Zebrafish and medaka sid1 are commonly located next to si:ch211-1a19.3. The frequency of each cell barcode in the generated bam file was counted using the awk command, and a csv file containing the cell barcodes and their frequencies was imported into Loupe Browser’s cluster mode for visualization on a t-SNE plot.
2.10 Gene ontology analysis
GO enrichment analysis was performed for 109 upregulated genes and 79 downregulated genes in the DP T (1) cluster against the DP T (2) cluster using Metascape v3.5.20240901 (https://metascape.org/gp/index.html#/main/step1) (52). Analysis was performed using annotation datasets of complete GO biological processes and a reference list of human genes. Twelve upregulated and 20 downregulated genes that were uncharacterized or lacked human orthologs were excluded from the analysis.
2.11 Data deposition
The datasets generated in the current study are available from the DNA Data Bank of Japan (DDBJ) database (accession numbers DRA013138 and DRA017334).
3 Results
3.1 Establishment of rag1 mutant medaka lacking mature lymphocytes
To establish an immunodeficient genetic model that lacks mature lymphocytes and use it for the analysis of cellular mechanisms of lymphocyte development, rag1 mutant medaka (rag1–/–) were generated by genome editing using the CRISPR/Cas9 system, targeting exon 4 of the rag1 gene (Figure 1A). A mutant line with an 8 bp deletion in rag1 was established, which was predicted to cause a frameshift and encode 570 appropriate amino acids, followed by three unrelated amino acids and a stop codon (Figure 1A). The deduced protein lacked most of the core region including the central domain, which recognizes the recombination signal sequence heptamer and RAG2 (53, 54) (Figure 1B), and was considered a null allele. The homozygous form of this frameshift mutant did not exhibit gross developmental defects.
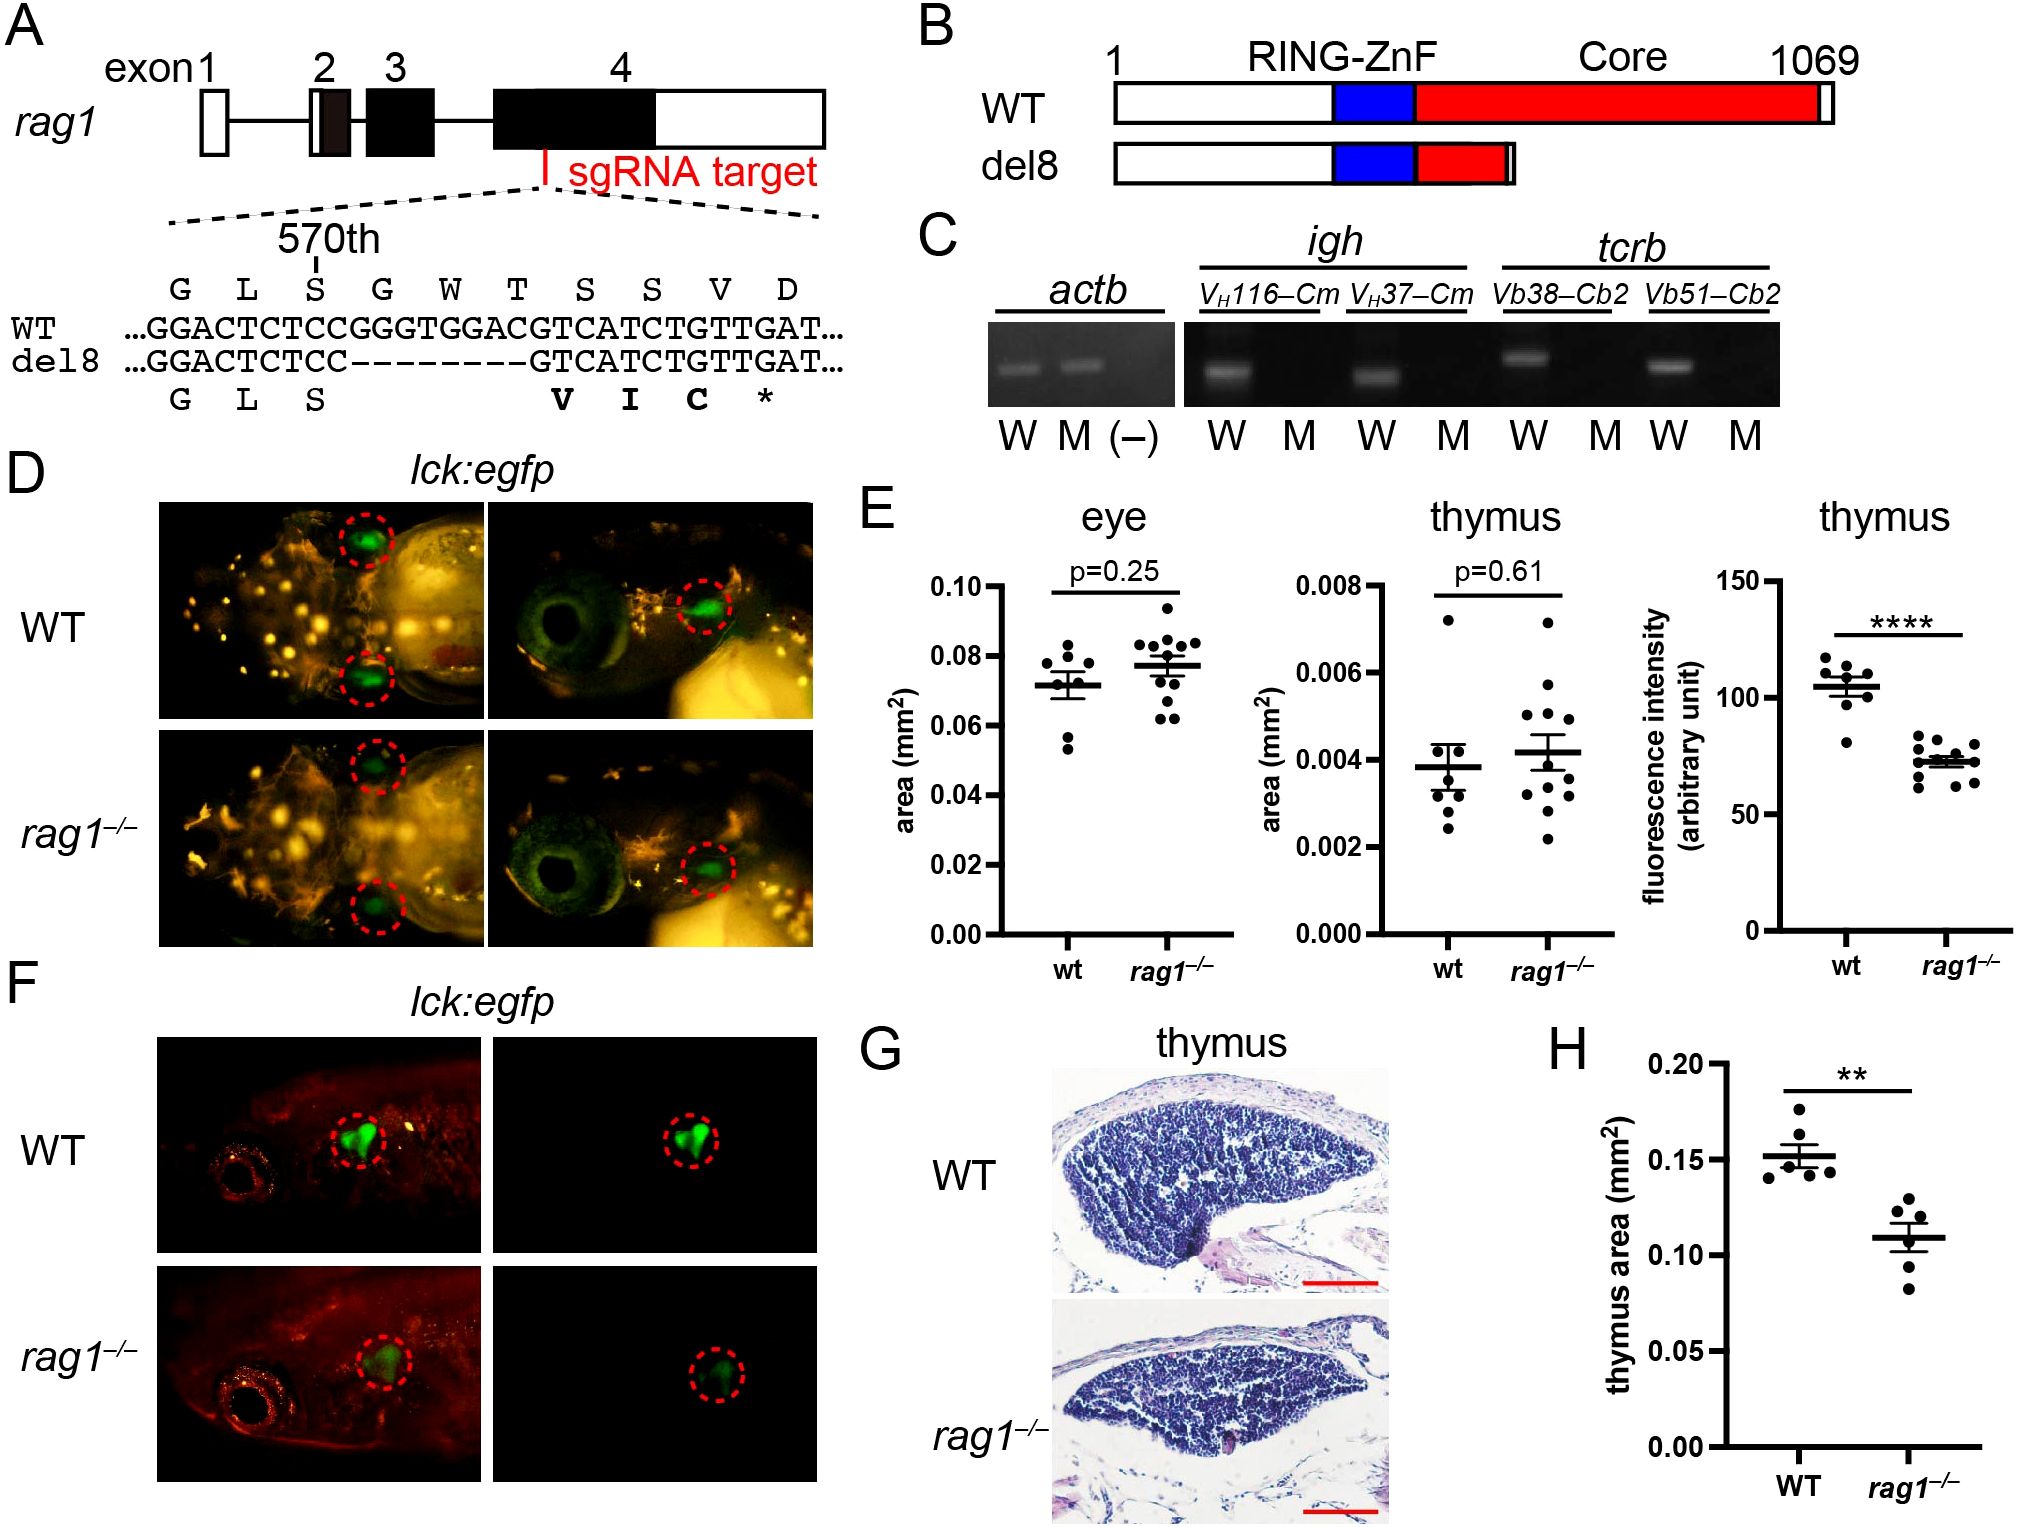
Figure 1. Generation of rag1 mutation by genome editing. (A) Exon/intron structure of the medaka rag1 gene (top). Closed boxes indicate coding exons. Open boxes indicate the untranslated exons. sgRNA target for genome editing is indicated in red font. Nucleotide and deduced amino acid sequences of the wild-type and 8 bp deletion mutant in exon 4 (bottom). Bold letters indicate unrelated amino acids. * indicates the stop codon. (B) Domain structures of the wild-type and del8 mutant Rag1 proteins. RING domain and zinc-finger domain (RING-ZnF) and Core region (Core) are indicated in blue and red, respectively. (C) Reverse transcription PCR (RT-PCR) of whole kidney cells of the indicated genotypes, using the indicated primers to detect VDJ-recombined igm and tcrb. actb expression was used as the standard. (−), water control; W, wild type; M, rag1–/–. (D) lck:EGFP expression in larval thymocytes at 10 days post-fertilization (dpf). Dorsal (left) and lateral (right) views of the indicated genotypes. Dotted circles indicate the thymus. (E) Plots of the area of the eye in the corresponding visible-light images (left) and EGFP+ thymus (middle), and the fluorescence intensity of EGFP in the thymus (right), measured using dorsal views of (E) Data represent the mean ± SEM; statistical significance was determined using an unpaired two-tailed t-test. ****p < 0.0001. (F) lck:EGFP expression in adult thymocytes at 2 months post-fertilization (mpf). Lateral views of the indicated genotypes with (left) and without (right) visible-light transmission. Dotted circles indicate the thymus. Note the less intense EGFP signals of thymocytes in rag1 mutants. (G) Transverse sections (5 µm thick) of the adult thymus were stained with hematoxylin and eosin. Scale bars: 100 µm. (H) Plots of the area of the largest portions of thymi in the indicated genotypes. Data represent mean ± SEM; statistical significance was determined using an unpaired two-tailed t-test. **p < 0.01.
First, we investigated the transcripts of rearranged lymphocyte antigen receptors in the kidney, which is equivalent to mammalian bone marrow as a site of hematopoiesis. Reverse transcription PCR (RT-PCR) analysis did not detect VDJ-recombined igm transcripts in B cells or tcrb transcripts in T cells in the rag1 mutant (Figure 1C; Supplementary Figure S1), as expected. Crossing the mutant with rag1:egfp transgenic medaka, which expresses EGFP under the control of the immature lymphocyte-specific rag1 promoter (34), revealed a reduction in EGFP-expressing cells in the larval thymus (Supplementary Figure S2A). Crossing the mutant with lck:egfp transgenic medaka (Supplementary Information, Supplementary Figure S3), which expresses EGFP under the control of the immature T and NK cell-specific lck promoter, revealed a comparative area of EGFP-expressing cells in the larval thymus (Figures 1D, E). However, the fluorescence intensity of the thymus area in the rag1 mutant was significantly reduced compared to that in the wild-type (Figure 1E), suggesting a lower lck:EGFP+ cell density in the rag1 mutant. Adult rag1 mutant of rag1:egfp and lck:egfp backgrounds exhibited a reduction in EGFP signals in the thymus (Supplementary Figure S2B; Figure 1F). Furthermore, reduction of thymus size in the rag1 mutant was confirmed by tissue sections (Figures 1G, H). These results suggest that the rag1 mutant has defects in T-cell development.
Next, B-cell development in the kidney of the rag1 mutant was assessed. Kidney sections from wild-type and rag1 mutants showed a comparable appearance of hematoxylin-rich blood cells (Figure 2A). Fluorescence-activated cell sorting (FACS) analysis of WKM cells was carried out for the rag1 mutant of the rag1:egfp background. Light scatter profiles revealed that the proportion of lymphocytes, which are mostly developing B cells (explained later in detail), against myelomonocytes was severely reduced in the rag1 mutant (Figures 2B, C). EGFP expression levels in the lymphocyte population were different between the wild type and rag1 mutant; whereas the rag1:EGFPhigh population corresponding to relatively immature B cells was increased in the rag1 mutant, rag1:EGFPlow population corresponding to relatively mature B cells was decreased in the rag1 mutant (Figures 2B, C, explained later in detail). In qPCR analysis of adult WKM cells, the expression of pan B-cell marker cd79a was significantly reduced. Contrary to a mild decrease in the expression of the early B-cell marker ebf1, expression of the relatively mature B-cell marker cd22l was severely reduced in the rag1 mutant, suggesting arrested B cell-development in the kidney. In addition, the expression of the T-cell marker cd8b was significantly decreased in rag1 mutants (Figure 2D). In contrast, the expression of the natural killer cell markers nitr17 and nkl.1 was mildly increased in rag1 mutants (Figure 2D). Among the other blood populations, the expression of the neutrophil marker mpx was comparable (Figure 2D). These results suggest that rag1 mutations affect T- and B- cell development.
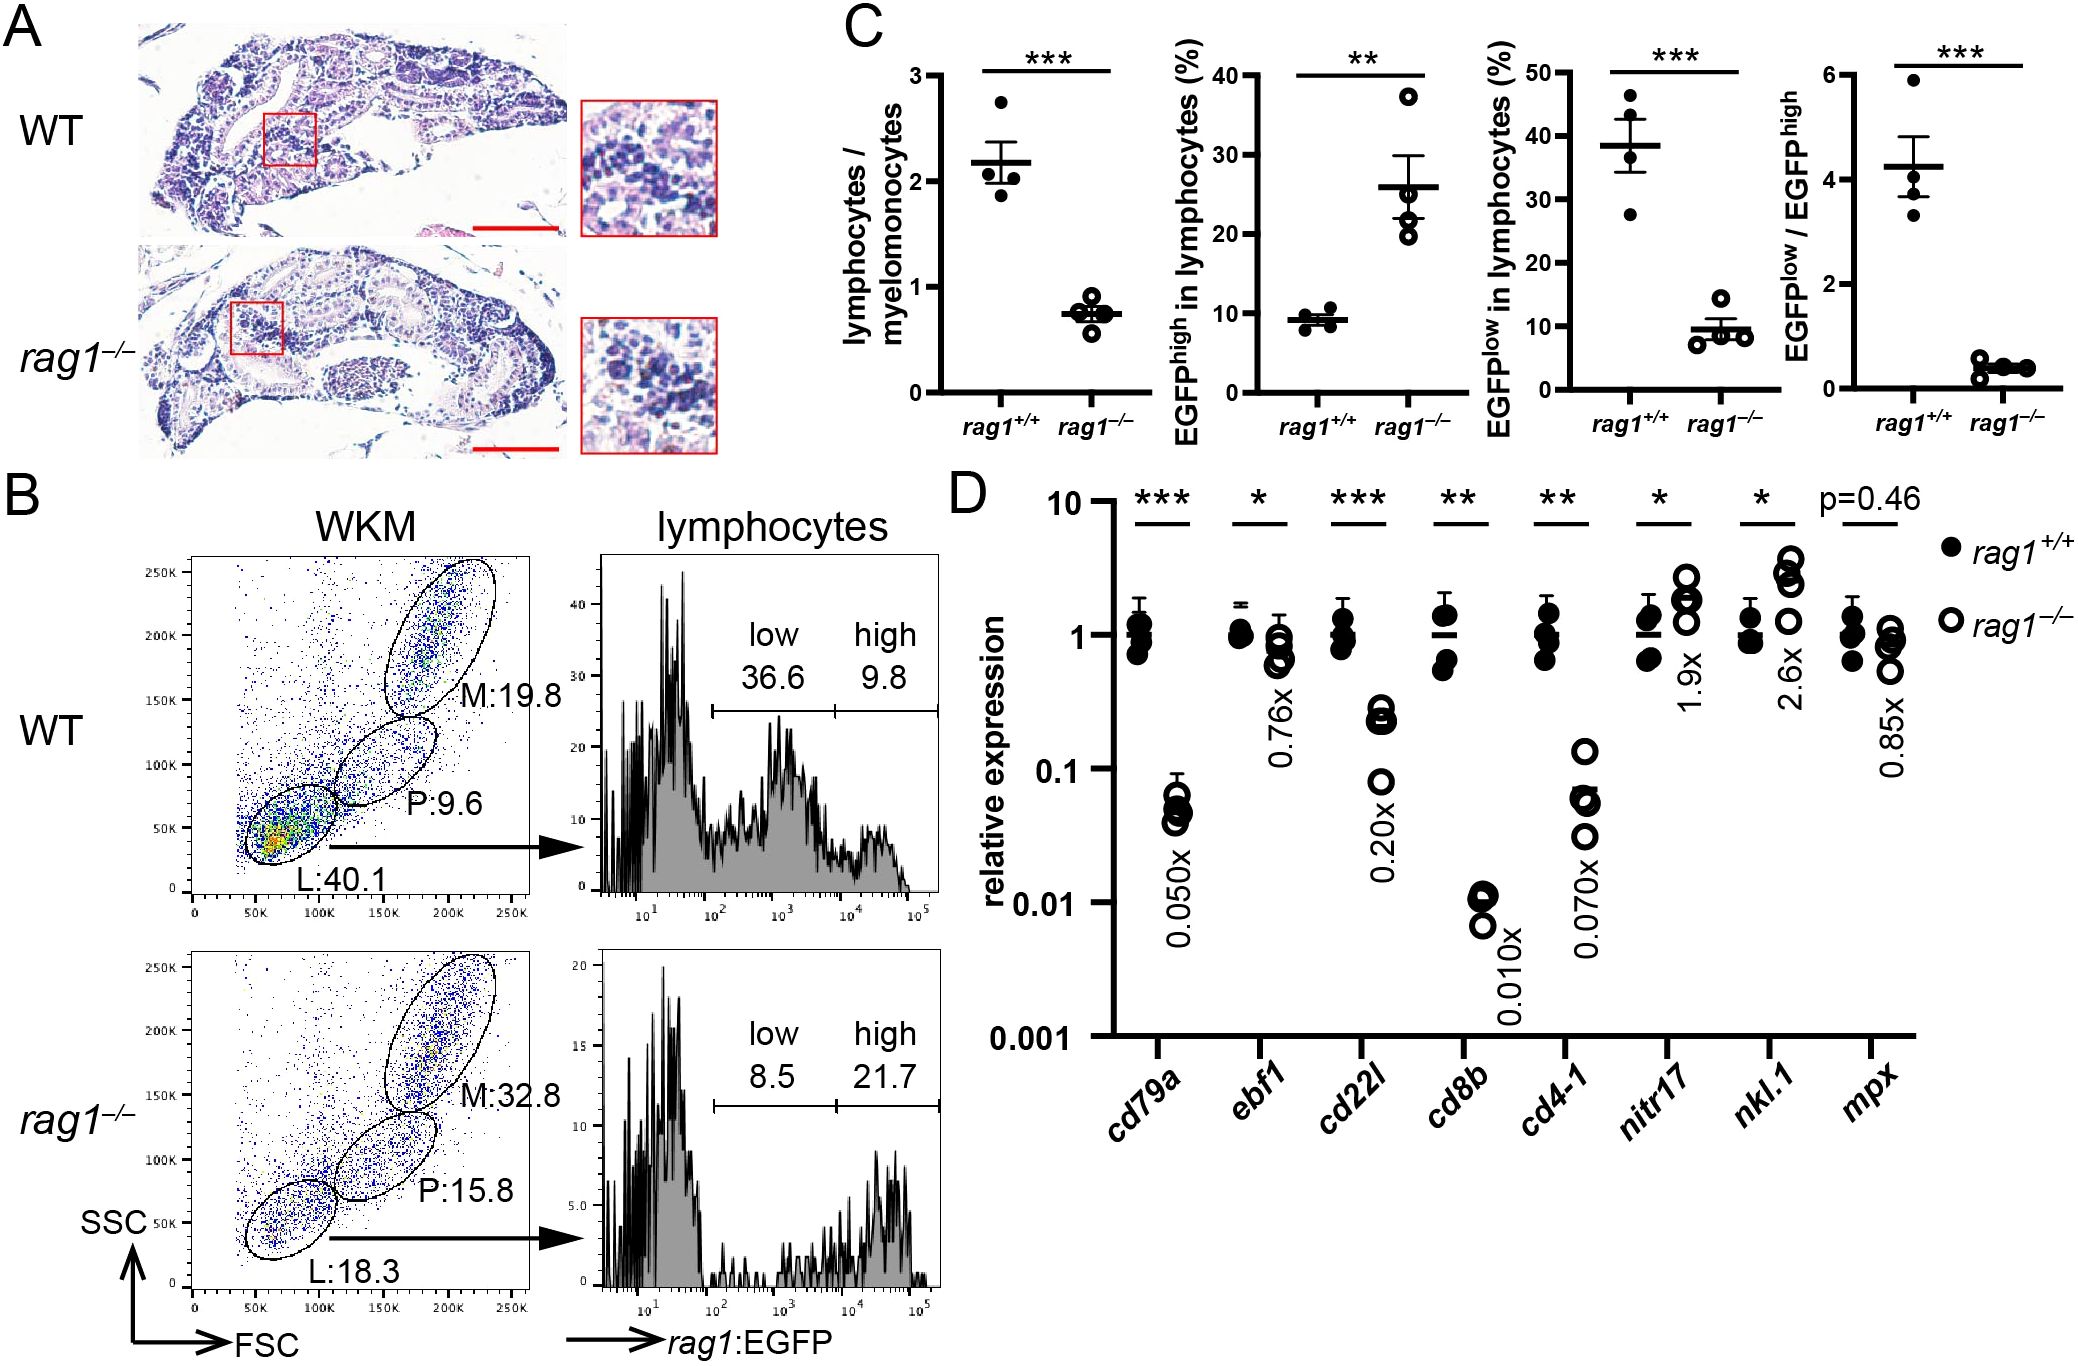
Figure 2. rag1 mutation affects B- and T- cell development. (A) Transverse sections (5 µm thick) of adult kidney of the indicated genotypes were stained with hematoxylin and eosin. Scale bars: 100 µm. Magnified images of the areas of hematopoietic cells (red squares) are also shown. Note the comparable cellularity of the kidney in the rag1 mutant. (B) Flow cytometric profiles of adult whole kidney marrow (WKM) cells of indicated genotype with rag1:egfp transgene. Light scatter profiles (left). Circles indicate lymphocyte (L), precursor (P), and myelomonocyte (M) populations. EGFP signal levels in lymphocyte populations (right). Numbers indicate proportions (%). FSC, forward scatter; SSC, side scatter. (C) Plots of lymphocytes/myelomonocytes ratio of WKM cells (left), percentage of EGFPhigh cells in lymphocytes (2nd from left), percentage of EGFPlow cells in lymphocytes (2nd from right), and EGFPlow/EGFPhigh ratio (right). Data represent mean ± SEM; statistical significance was determined using an unpaired two-tailed t-test. **p < 0.01; ***p<0.001. (D) Quantitative PCR (qPCR) analysis of the kidney cells of the indicated genotypes (n=4). The average expression level in rag1+/+ is normalized to 1. Data represent the mean ± standard error of the mean (SEM), and statistical significance was determined using an unpaired two-tailed t-test. *p < 0.05; **p < 0.01; ***p<0.001. The average expression level of each gene in the rag1 mutant is also shown. The results represent one of the two independent experiments with similar results.
3.2 Identification of stages of T-cell development in the thymus
To analyze the cellular and molecular mechanisms of T-cell development, thymocytes from two wild-type and two rag1 mutants at five months post-fertilization (mpf) were harvested separately. Cell sorting using light scatters was performed to obtain lymphocytes for single-cell transcriptome profiling (Supplementary Figure S4). It was confirmed that the lymphocyte gate used for cell sorting covered the lck:EGFP+ cells (Supplementary Figure S4). 6192 cells out of the 7390 wild-type cells, and 13239 cells out of 14528 rag1 mutant cells had appropriate UMI numbers and were accordingly used for clustering.
t-SNE visualization separated wild-type lymphocytes into 12 clusters, including 11 lck-expressing T/NK-lineage clusters and one cd79a-expressing B-cell cluster (Figure 3A). gata1-expressing erythrocytes, which seem to be contaminated by forward scatter (FSC)low erythrocytes during cell sorting, were not many enough to constitute an independent cluster (Figure 3A). Excluding this B cluster and erythrocytes from wild-type and the corresponding rag1 mutant cells, PCA analysis of 5730 cells from two wild-type and totally 12661 cells from rag1 mutant cells based on the proportion of cells in each cluster was performed, confirming genotype-dependent separation (Supplementary Figure S5A).
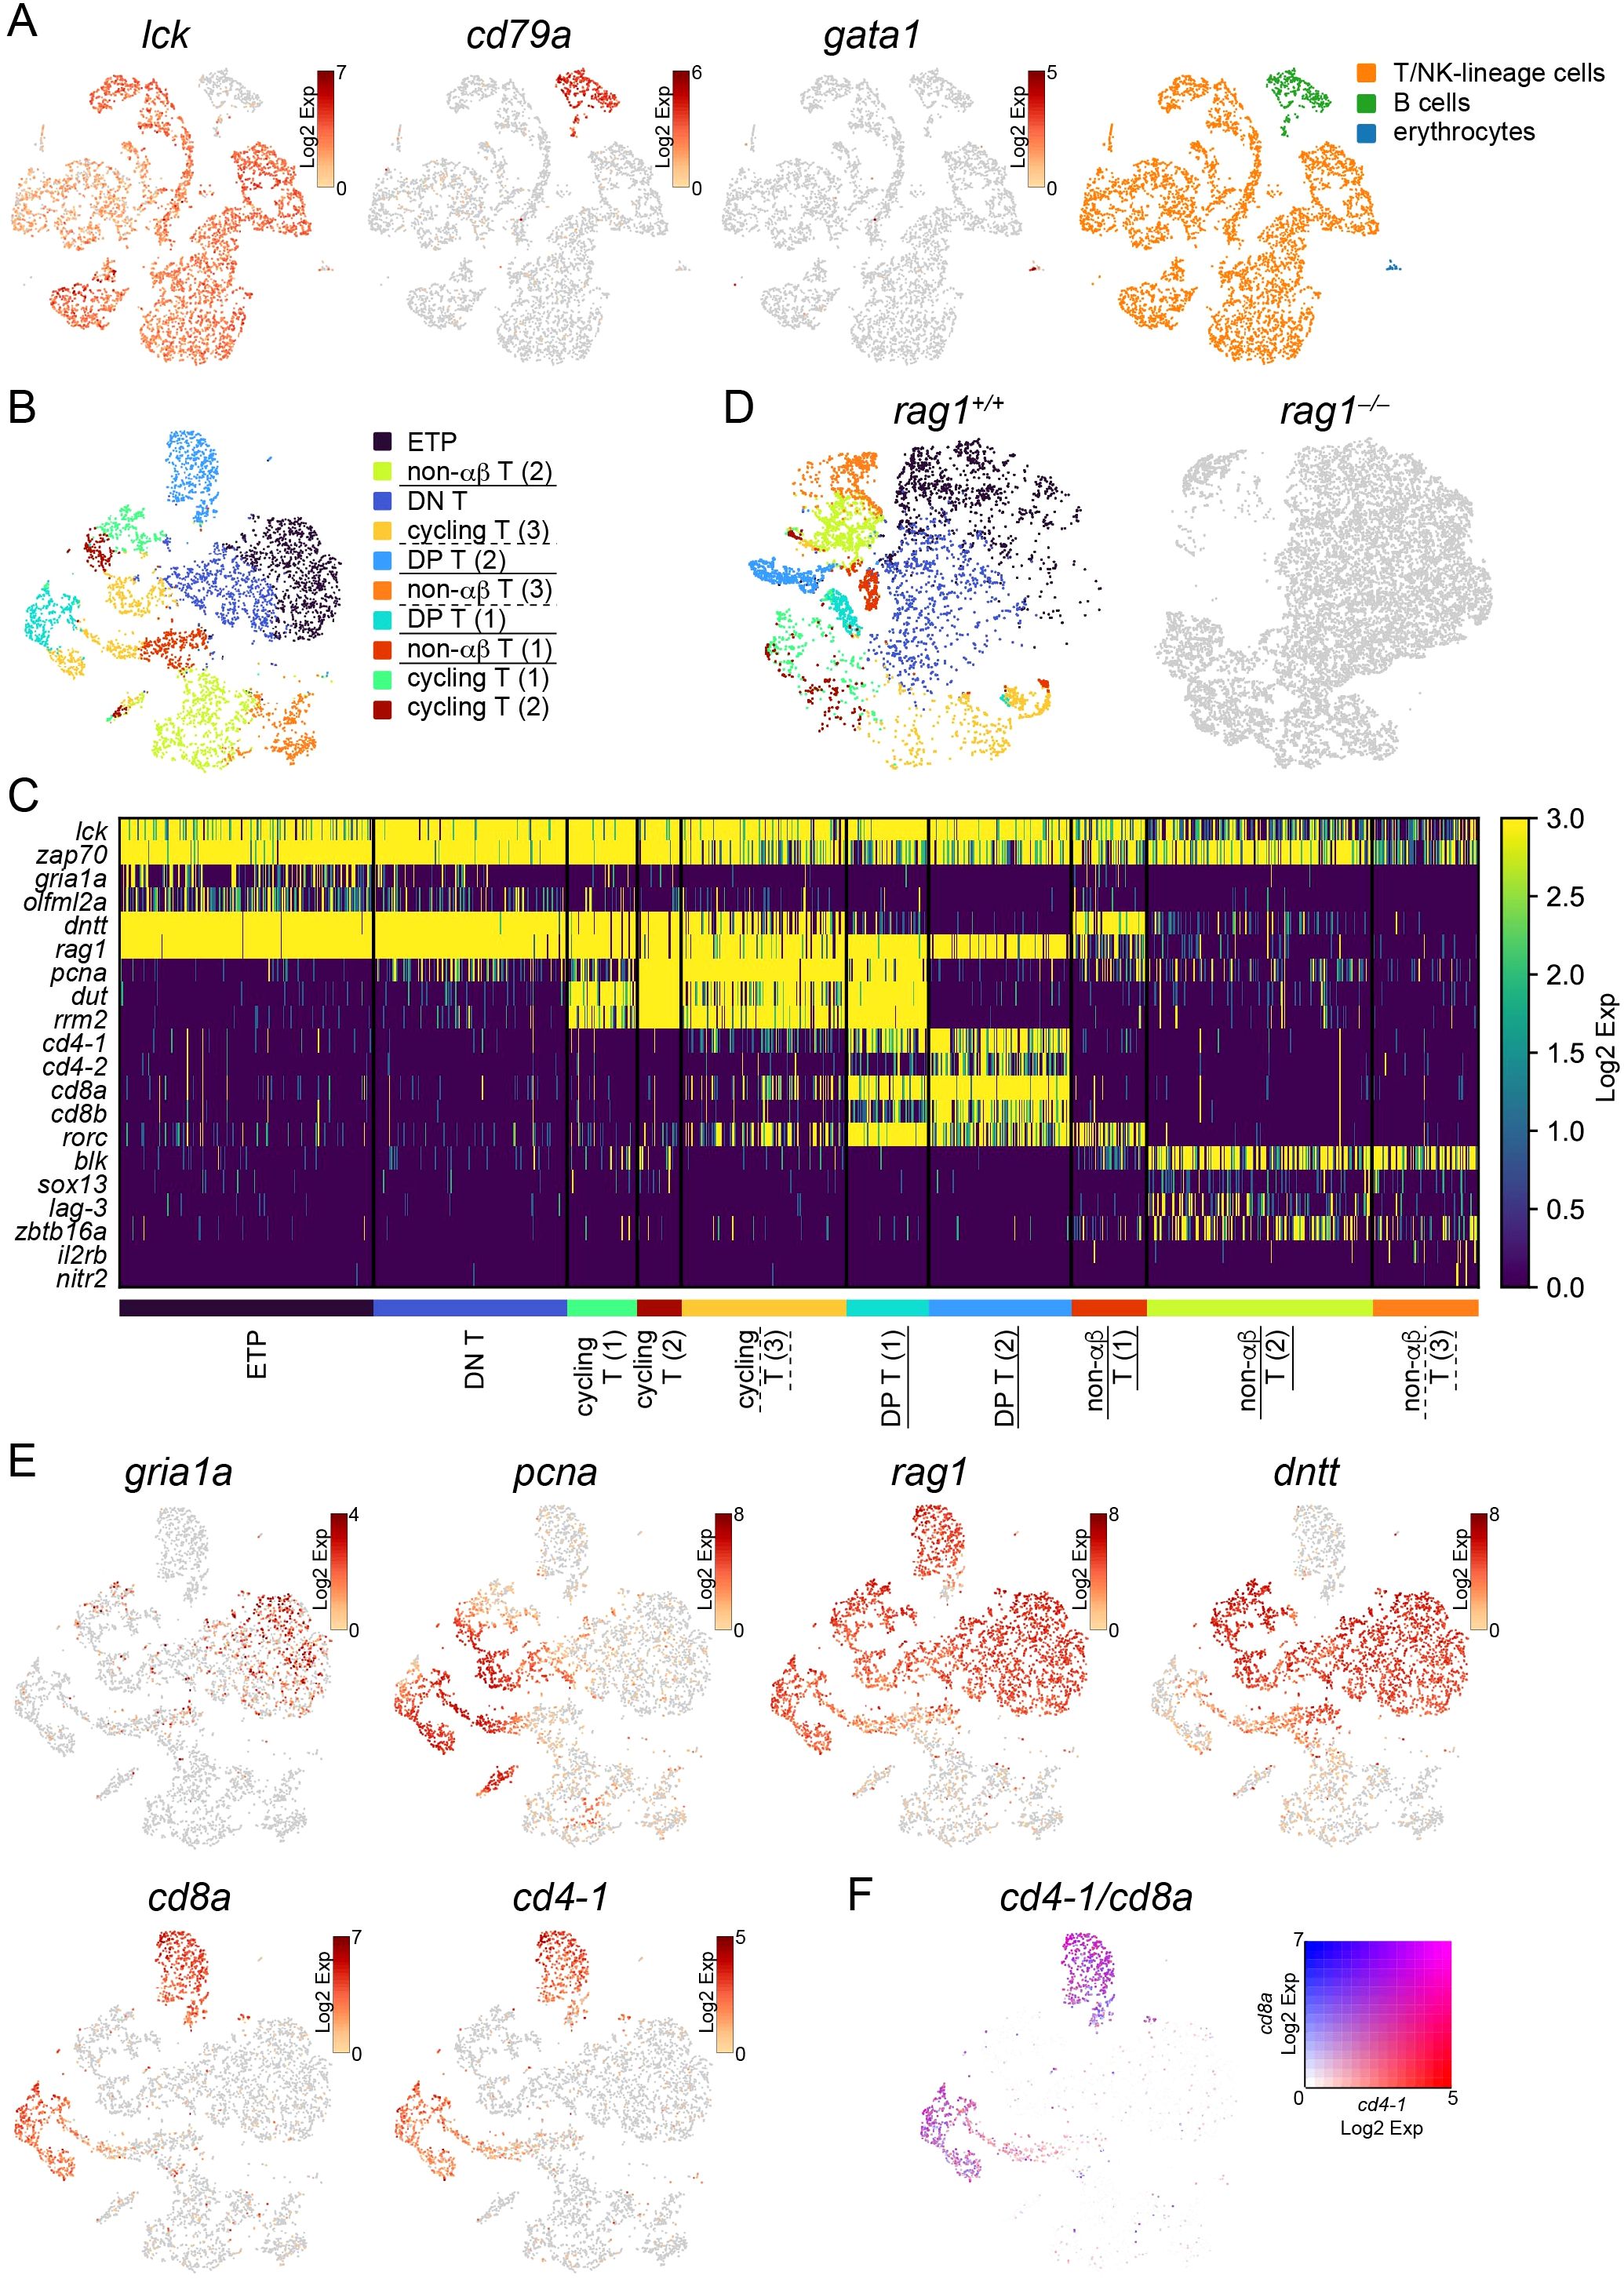
Figure 3. Categorization of developing T cells in the thymus. (A) t-SNE visualization of 6192 lymphocytes from the wild-type thymus. The expression levels of the indicated genes (left) and categorization of 12 clusters based on the expression of these genes (right) are shown. (B) t-SNE visualization of 5730 T/NK-lineage cells from wild-type thymus. Clusters with annotations were also presented. rag1-dependent clusters which are absent in the rag1 mutant in (D) are underlined. Clusters that are rag1-dependent in part are underlined with dashed lines. ETP, early T-cell progenitors; DP, double-positive. (C) Heatmap of marker gene expression in each T/NK-lineage cell cluster in wild-type. rag1-dependent clusters which are absent in the rag1 mutant in (D) are underlined. Clusters that are rag1-dependent in part are underlined with dashed lines. (D) t-SNE visualization of T/NK-lineage cells from wild-type (left) and rag1 mutant (right) thymus. A total of 5730 wild type and 12661 mutant cells are shown. Wild-type cells are colored based on the clusters in (B). Mutant cells are shown in gray. (E) t-SNE visualization of T/NK-lineage cells from wild-type thymus. Expression levels of indicated genes are shown. (F) t-SNE visualization of T/NK-lineage cells from the wild-type thymus. The merged expression levels of cd4-1 and cd8a are shown.
Next, 5730 wild-type cells in T/NK-lineage clusters were separated into 10 clusters and annotated according to subsequent analyses of gene expression patterns and rag1-dependency as described below (Figure 3B). A heat map of gene expression levels was constructed using each cluster-specific representative genes (p<0.05) and genes known to be involved in T-cell development in mammals and zebrafish (Figure 3C; Supplementary Tables S2, S3). lck and zap70 were constitutively expressed in all T/NK-lineage clusters (Figure 3C). Indication of wild-type T/NK-lineage clusters on t-SNE visualization of T/NK-lineage cells of both wild-type (5730 cells) and rag1 mutant (12661 cells) identified rag1-independent clusters (shared by wild-type and rag1 mutant) of early T-cell development and rag1-dependent clusters (absent in rag1 mutant) of late T-cell development requiring V(D)J recombination of tcr genes (Figure 3D). In contrast, re-clustering of T/NK cells from a mixture of wild-type and rag1 mutants did not generate any rag1 mutant-specific clusters (data not shown).
Cells of all five rag1-independent early clusters [Early T-cell progenitors (ETP), DN T, and cycling T (1–3)] were highly accumulated in the rag1 mutant (Figure 3D), suggesting developmental arrest at these stages. These clusters expressed rag1 and dntt (Figures 3C, E). In addition, two rag1-dependent clusters [DP T (1–2)] expressed rag1, cd4, and cd8, but not dntt (Figures 3C–E). Genes labeling proliferating cells (pcna, dut, rrm2) were commonly expressed in four clusters [cycling T (1–3), DP T (1)] (Figures 3C, E), suggesting cell proliferation before tcra or tcrb gene rearrangement. These results imply that cycling T (1–3) clusters are in the course of proliferation before tcrb gene rearrangement, and DP T (1–2) clusters expressing both cd4 and cd8 are in the more mature stage of T-cell development with ongoing or completed tcra gene rearrangement. These cd4+cd8+ double-positive (DP) T clusters commonly expressed rorc (Figure 3C).
The remaining rag1-independent cd4–cd8– double-negative (DN) clusters without proliferative gene expression (ETP and DN T) were assumed to be the most immature T cells. Although ETPs and genes specifically expressed in ETPs have been identified in zebrafish (27), these genes including cebpa, csf1rb, and fli1 were not expressed in these clusters in medaka (data not shown), suggesting that the timing of ETP immigration or gene expression patterns of ETPs is not conserved between zebrafish and medaka. Instead, the ETP cluster, not the DN T cluster, highly expressed some genes including gria1a and olfml2a (Figures 3C, E), suggesting that this ETP cluster contains recent thymic immigrants already expressing rag1.
3.3 Absence of the most developed SP T-cell populations in the wild-type thymus
In the t-SNE profile of wild-type T/NK-lineage cells, two clusters expressing cd8a and cd4-1 [DP T (1–2)] were located separately (Figures 3B, E). cd8b, whose gene product is assumed to form a heterodimer with the gene product of cd8a, and cd4-2, a teleost-specific paralogous gene of cd4-1, are widely expressed in the DP T (2) cluster. In contrast, cd8b- and cd4-2-expressing cells in the DP T (1) cluster were limited (Figure 3C; Supplementary Figure S6A). Notably, neither cd4-1+cd8a– nor cd4-1–cd8a+ SP clusters were detected (Figures 3C, E; Supplementary Figure S6A). Looking at the expression levels at the individual cell level, these genes were expressed in cells in the DP T clusters in an overlapping manner (Figure 3F).
To characterize the two DP T clusters, gene expression profiles were compared between them, and 109 and 79 genes were identified to be highly expressed in DP T (1) and DP T (2), respectively (p<0.05, log2fc>2) (Supplementary Table S4). GO analysis showed that genes related to pathways for cell division including “DNA replication-dependent chromatin assembly” (rbbp4, chaf1a, and asf1b) and “spindle elongation” (incenp, kif11, prc1, aurkb, kif23, and cdca8) were significantly enriched in DP T (1) cluster (Supplementary Figures S6B, D, F), suggesting that cells in DP T (1) cluster are more actively proliferating. On the other hand, genes related to pathways for lymphopoiesis including “T cell differentiation” and “T cell activation” (cd4-1, cd4-2, cd8a, cd8b, egr1, itk, ptger4, tespa1, and ccr9) were significantly enriched in DP T (2) cluster (Supplementary Figures S6C, E, F), suggesting that cells in DP T (2) cluster are more mature T cells. Notably, tespa1, which is required for positive selection in mammals (55), was enriched in the DP T (2) cluster. Both DP clusters express trac (Figure 4A), confirming that they are at the most mature stage of αβ T-cell development.
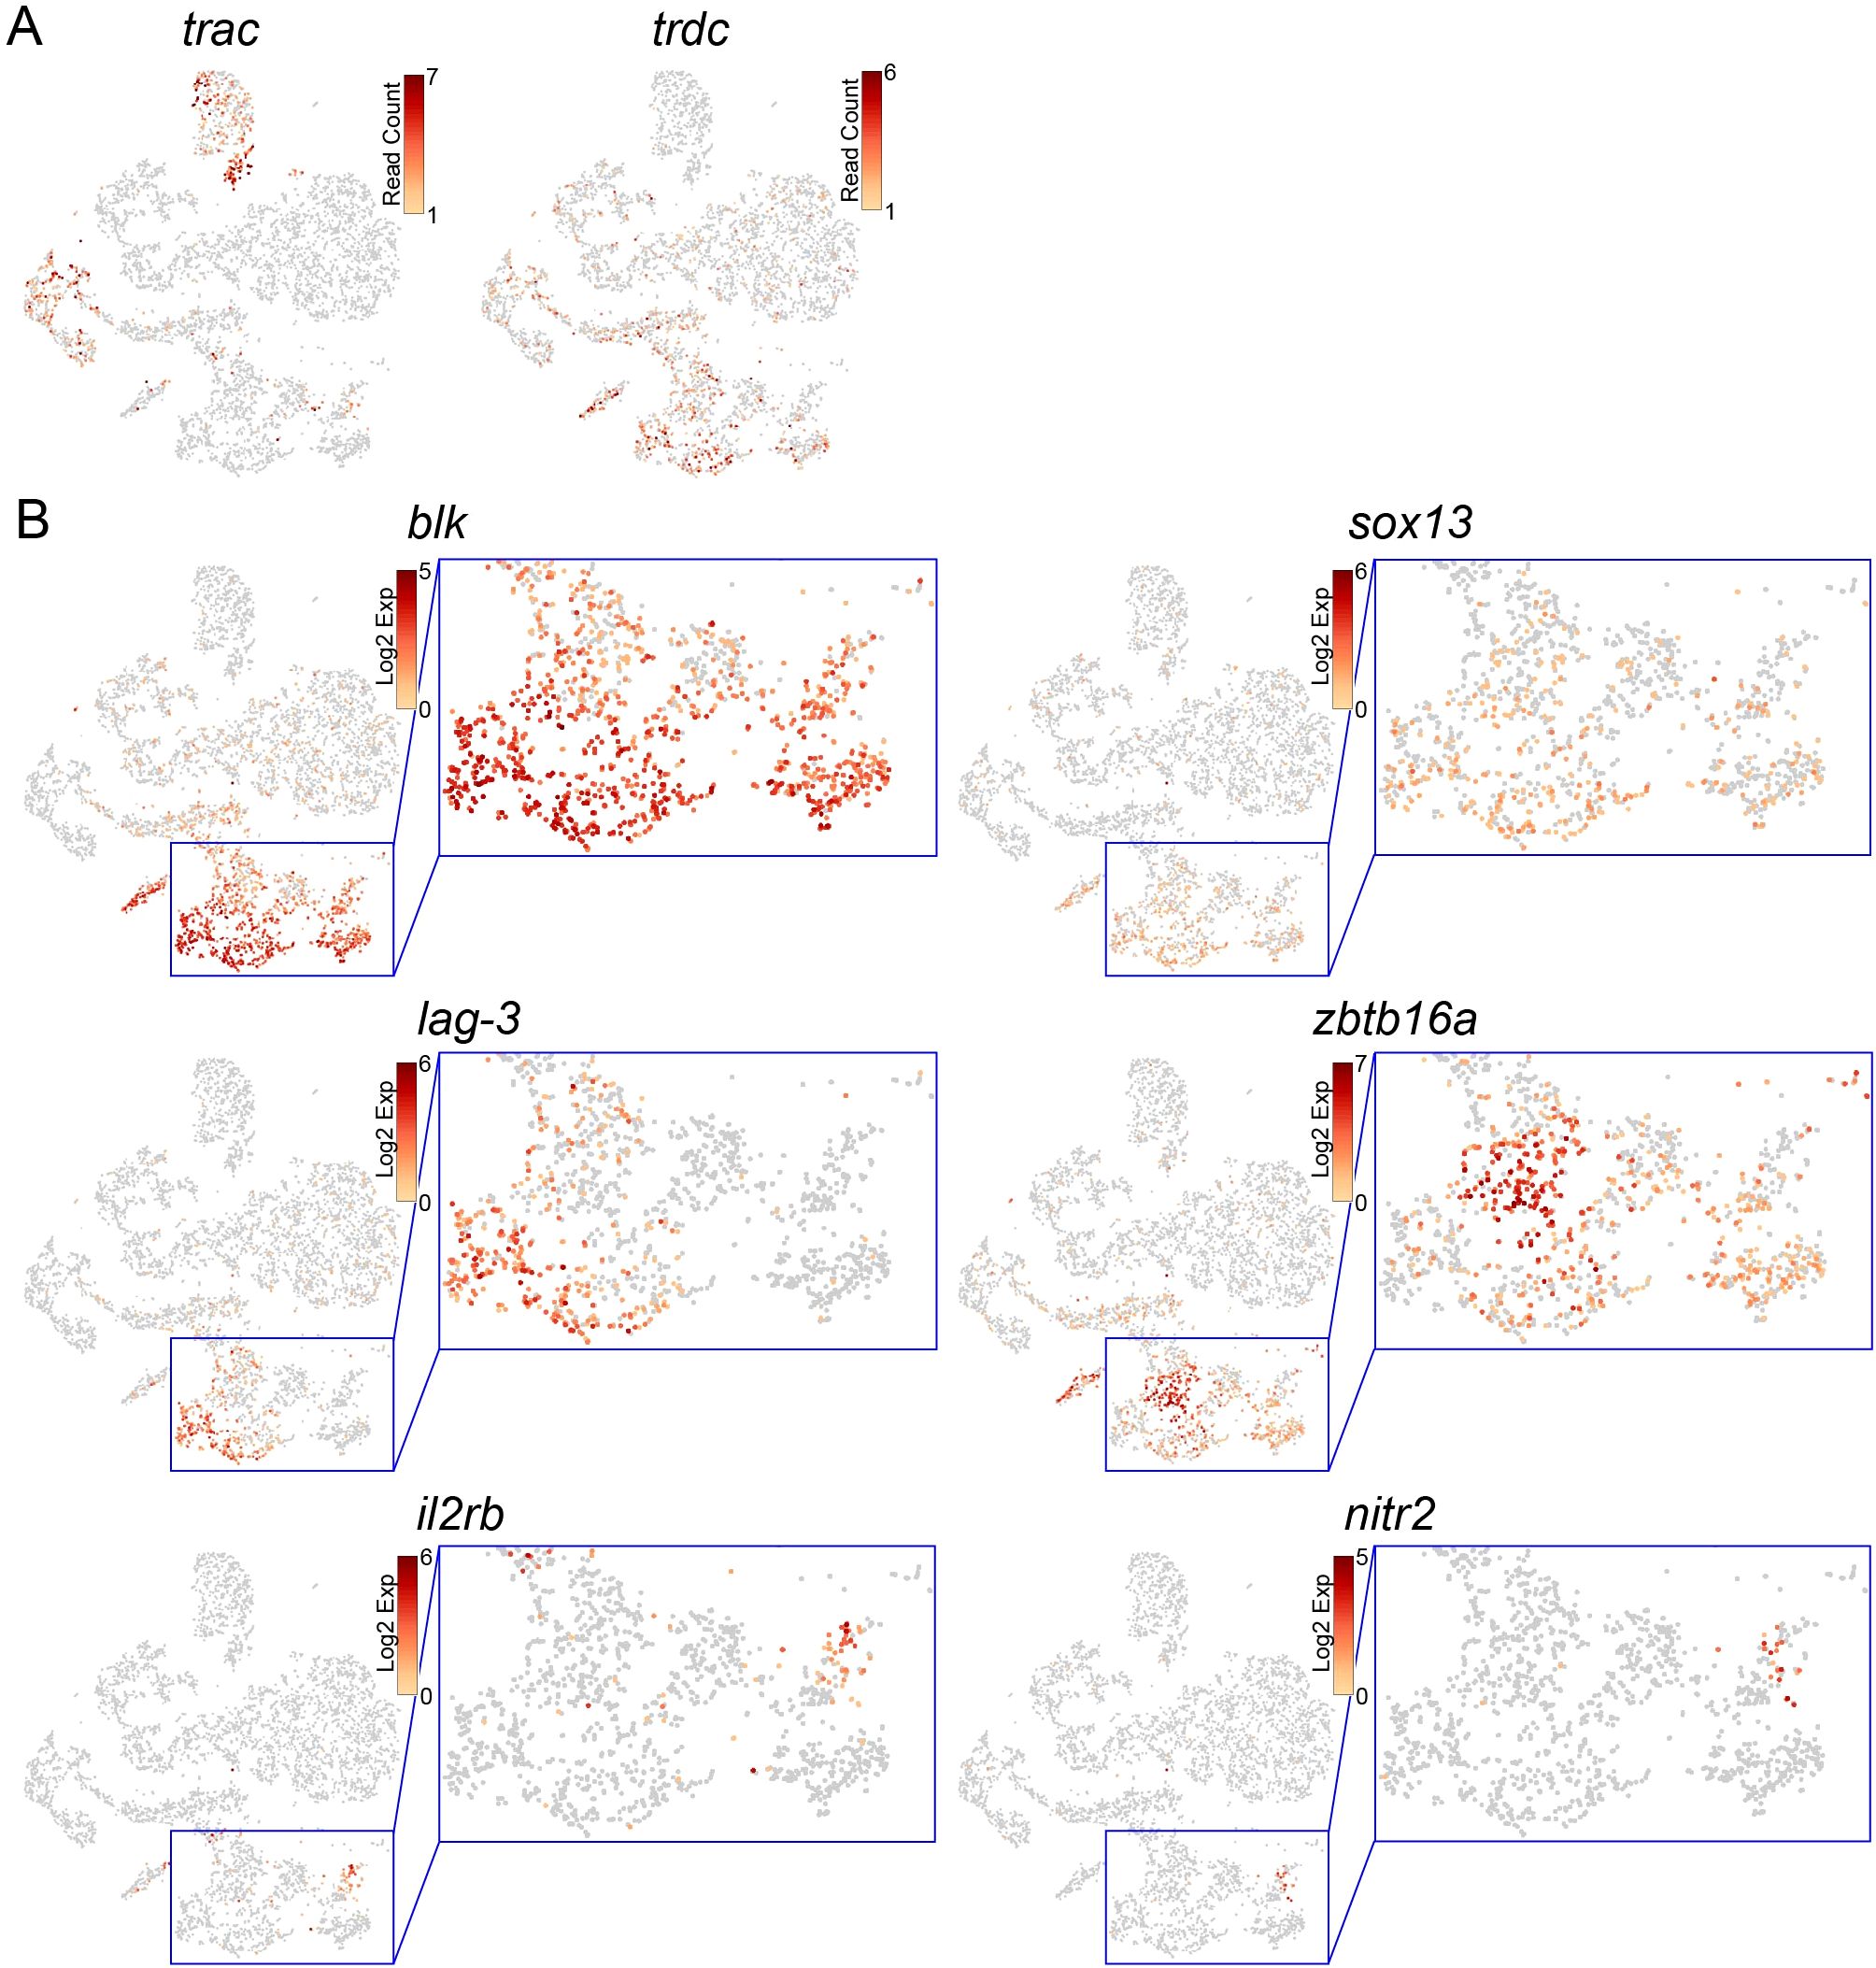
Figure 4. Identification of γδ T, NKT, and NK cells in the thymus. (A, B) t-SNE visualization of T/NK-lineage cells from the wild-type thymus. Expression levels of indicated genes are shown. Magnified images of the blue square areas in (B) are also shown.
3.4 Identification of γδT, NKT, and NK cells in the thymus
In contrast to trac expression in the two DP T clusters, trdc was expressed in a part of the three clusters [non-αβ T (1–3)] of the wild-type T/NK-lineage cells (Figure 4A). Similarly, sox13 and blk, which marked thymic γδ T cells in zebrafish (27), were also expressed in some cells in these three clusters (Figures 4B, 3C), suggesting that these clusters include γδ T-lineage cells. The expression of lymphocyte activation gene-3 (lag-3) encoding a CD4-related inhibitory receptor (56) was overlapped with the area of γδ T cells (Figures 4B, 3C). In-depth observation of these clusters showed that they also contained cells highly expressing zbtb16a, which encodes the natural killer T (NKT)-lineage-specific transcription factor Plzf (57, 58) (Figures 4B, 3C). zbtb16a expression did not merge with the area of γδ T cells. In addition, we found a rag1-independent cell mass expressing the natural killer (NK)-cell markers il2rb and nitr2 (25, 26, 59) (Figures 4B, 3C). These results suggest that, although there is no clear cluster distinction, the three non-αβ T clusters contain γδ T, NKT, and NK cells.
3.5 Identification of stages of B-cell development in the kidney
To assess the cellular and molecular basis of B-cell development, WKM cells from the three wild-type and two rag1 mutants at 2 mpf were harvested separately. Cell sorting using light scatters was carried out to obtain lymphocytes for single-cell transcriptome profiling using Cell Ranger (10x Genomics) (Supplementary Figure S4). 22929 cells out of 25103 wild-type cells and 15472 cells out of 17604 rag1 mutant cells had appropriate UMI numbers, and accordingly were used for clustering.
t-SNE visualization separated wild-type lymphocytes into 24 clusters including 19 cd79a-expressing B-lineage clusters (19804 cells, 86.4%), 2 lck-expressing T/NK cell clusters (1017 cells, 4.4%), and 3 gata1-expressing erythrocyte clusters, which seemed to be contaminated by FSClow erythrocytes during cell sorting (Figure 5A). Excluding these T/NK and erythroid clusters from wild-type and the corresponding rag1 mutant cells, PCA analysis of 19804 B-lineage cluster cells from three wild-type and 12989 cells from rag1 mutant cells based on the proportion of cells in each cluster was performed, confirming genotype-dependent separation (Supplementary Figure S5B).
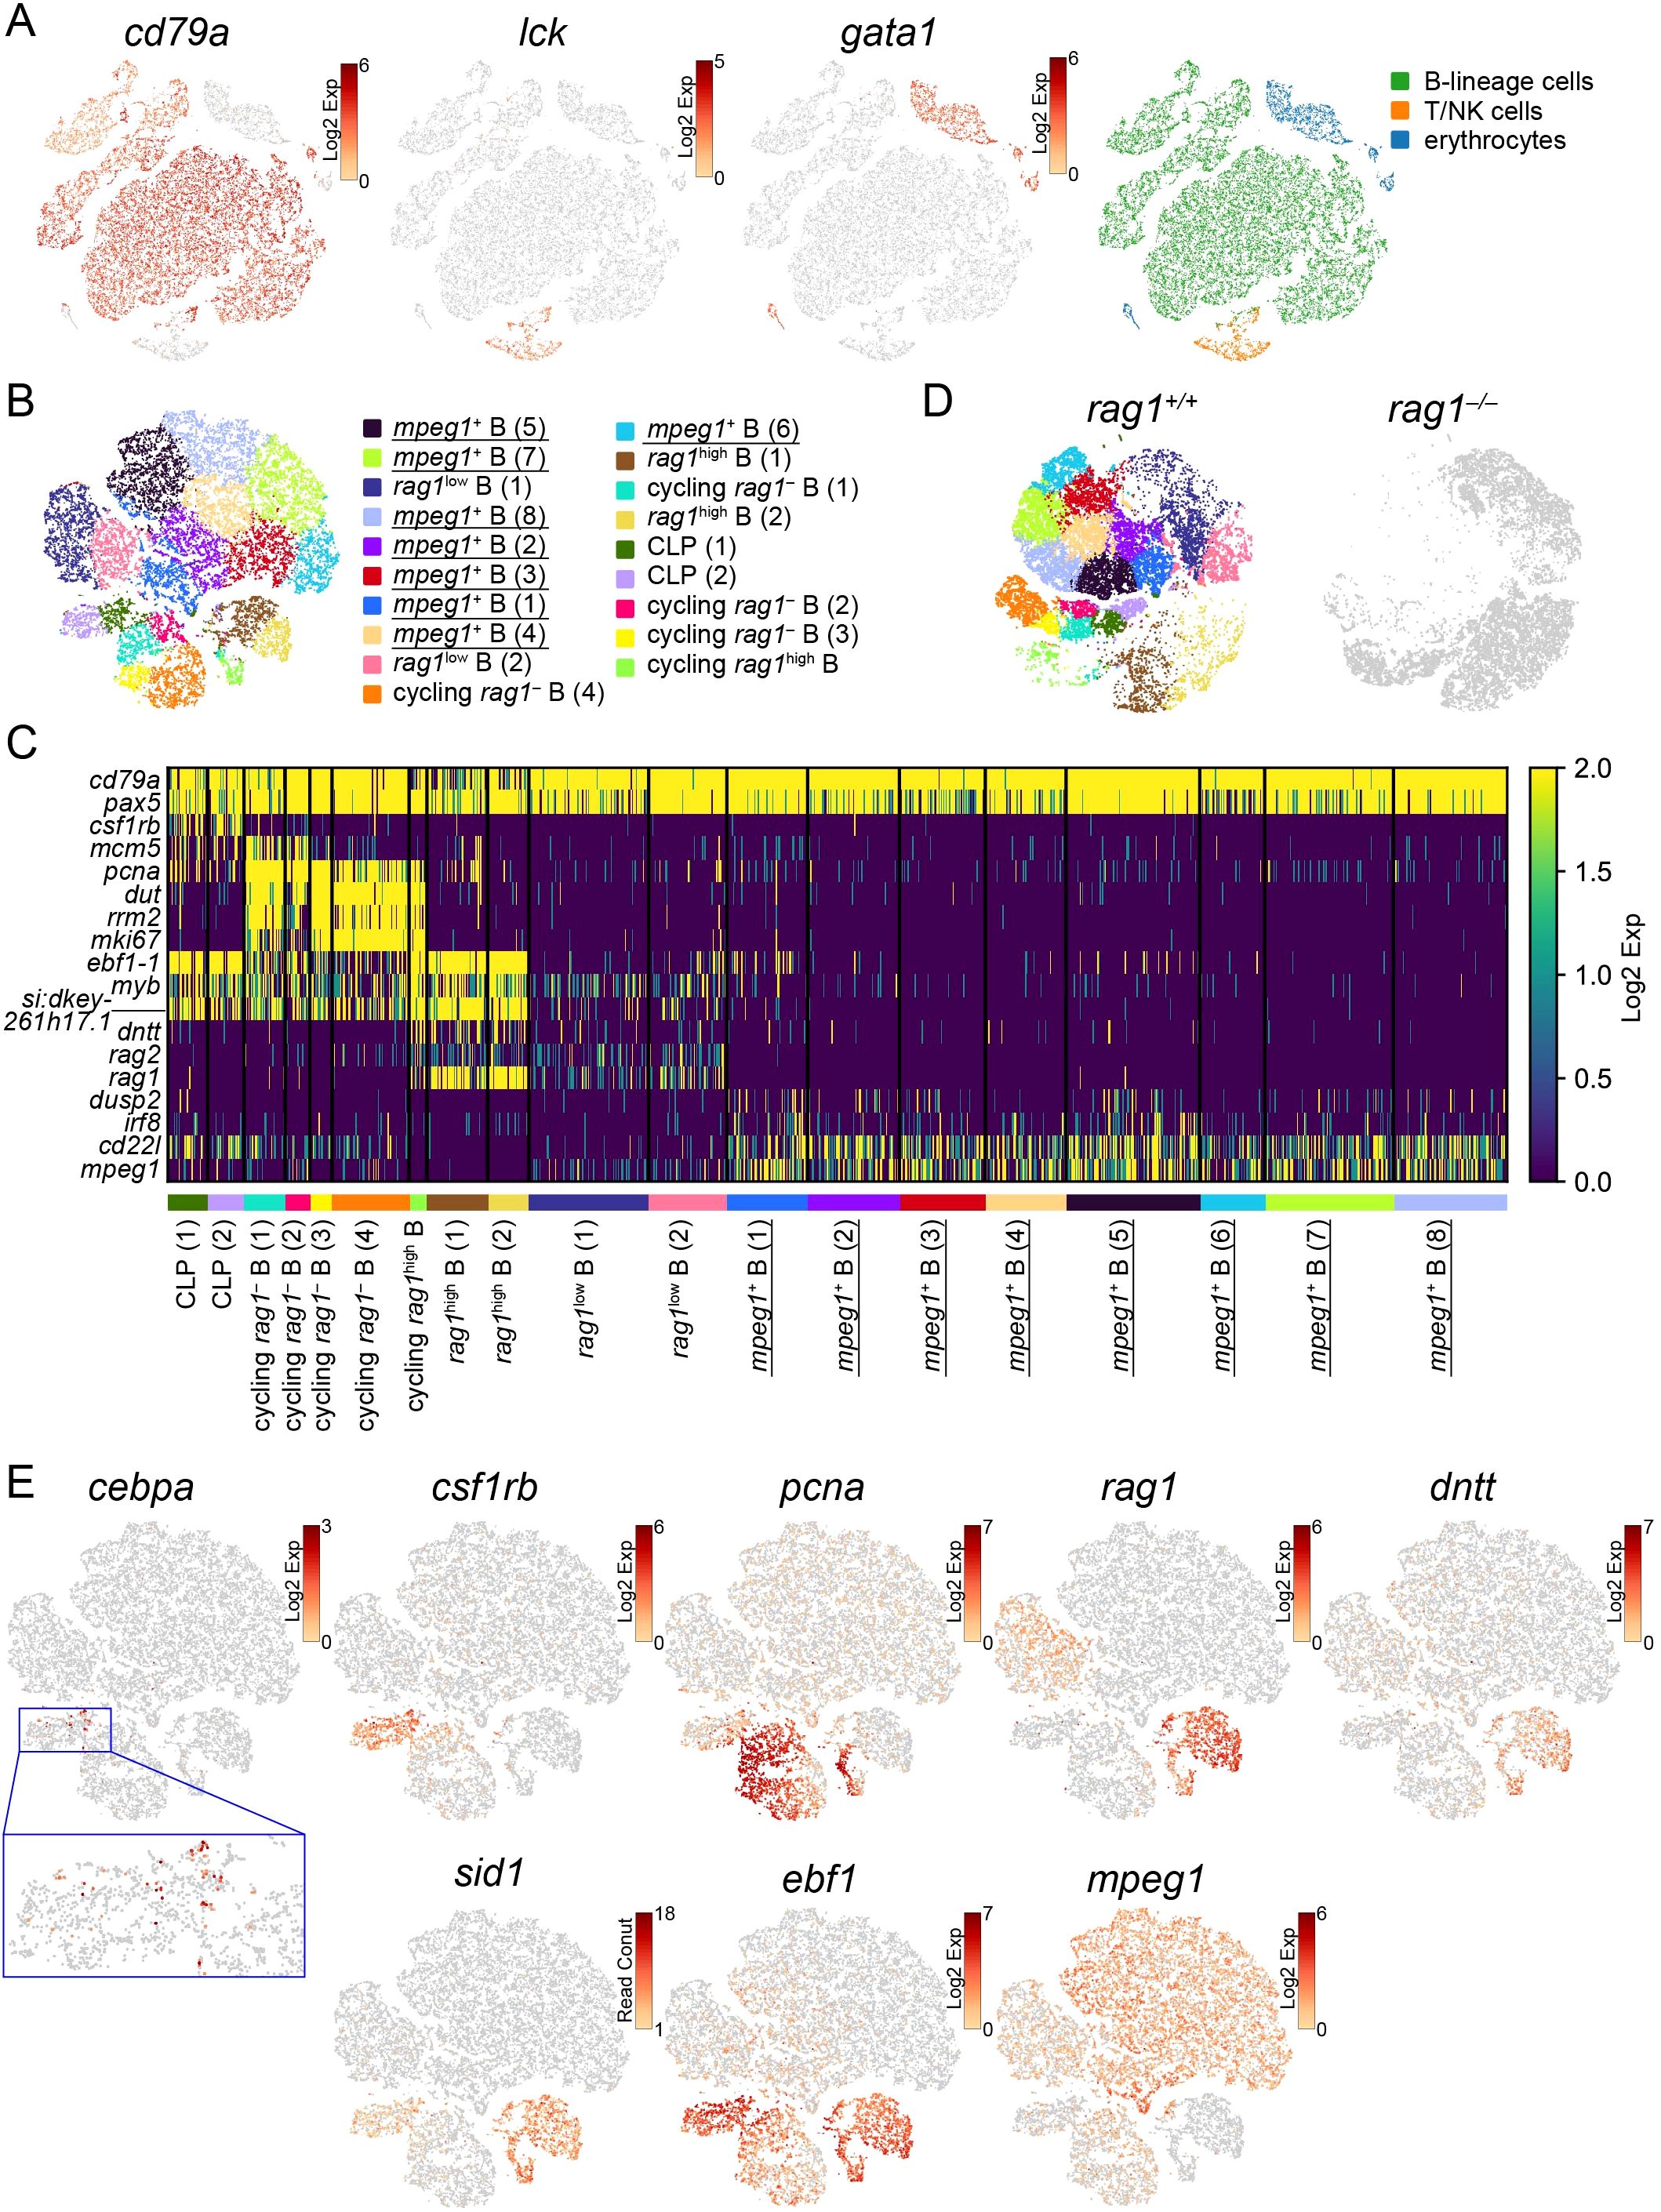
Figure 5. Categorization of developing B cells in the kidney. (A) t-SNE visualization of 22929 lymphocytes from the wild-type kidney marrow. The expression levels of the indicated genes (left) and categorization of 24 clusters based on the expression of these genes (right) are shown. CLP, common lymphoid progenitors. (B) t-SNE visualization of 19804 B-lineage cells from the wild-type kidney marrow. Clusters with annotations are also presented. rag1-dependent clusters which are absent in rag1 mutant in (D) are underlined. (C) Heatmap of marker gene expression in each B-lineage cell cluster in the wild-type. rag1-dependent clusters which are absent in rag1 mutant in (D) are underlined. (D) t-SNE visualization of B-lineage cells from wild-type (left) and rag1 mutant (right) kidney marrow. 19804 wild type and 12989 mutant cells are shown. Wild-type cells are colored based on the clusters in (B). Mutant cells are shown in gray. (E) t-SNE visualization of B-lineage cells from the wild-type kidney marrow. Expression levels of indicated genes are shown. A magnified image of the blue square area is also shown.
Next, 19804 wild-type cells in B-lineage clusters were separated into 19 clusters and annotated according to subsequent analyses of gene expression patterns and rag1-dependency as described below (Figure 5B). A heat map of gene expression levels was constructed using each cluster-specific representative genes (p<0.05) and genes known to be involved in B-cell development in mammals and zebrafish (Figure 5C; Supplementary Tables S2, S5). cd79a and pax5 were constitutively expressed in all the B-lineage clusters. Indication of wild-type B-lineage clusters on t-SNE visualization of B-lineage cells of both wild-type (19804 cells) and rag1 mutant (12989 cells) identified rag1-independent clusters (shared by wild-type and rag1 mutant) of early B cell development and rag1-dependent clusters (absent in rag1 mutant) of late B cell development requiring V(D)J recombination of immunoglobulin genes (Figure 5D). In contrast, re-clustering of B-lineage cells from the mixture of wild-type and rag1 mutants did not generate any rag1 mutant-specific clusters (data not shown).
Three clusters with high rag1 expression [cycling rag1high B, rag1high B (1–2)] and two clusters with low rag1 expression [rag1low B (1–2)] were identified (Figures 5C, E). Whereas the rag2 expression pattern basically coincided with rag1, expression of DNA nucleotidylexotransferase (dntt) and sid1, an ortholog of zebrafish sid1 that is considered to be orthologous to mammalian VPREB1 (60), was observed only in the clusters with high rag1 expression (Figures 5C, E). In the rag1 mutant, cells merging with these rag1-expressing wild-type clusters were highly accumulated (Figure 5D), suggesting developmental arrest at this stage. Accumulation of the rag1:EGFPhigh population in the rag1 mutant in the FACS analysis (Figures 2B, C) supports this notion.
Six Clusters [common lymphoid progenitors (CLP) (1–2), cycling rag1– B (1–4)] were commonly present in the wild-type and rag1 mutants and did not express rag1 (Figures 5C–E). Among these clusters, genes labeling proliferating cells (mcm5, pcna, dut, rrm2, and mki67) were commonly expressed in 4 cycling rag1– B clusters (Figures 5C, E), suggesting that these clusters represent the stage of cell proliferation before heavy chain gene rearrangement. csf1rb marking hematopoietic stem cells (27) was expressed in CLP (1-2) clusters, and cebpa marking hematopoietic stem cells as well as myeloid lineages (27) was expressed in part of the CLP (1) cluster (Figures 5C, E), suggesting that these cell populations are the earliest progenitors of the sorted lymphocytes.
Eight clusters [mpeg1+ B (1–8)] were rag1-dependent without rag1 expression (Figures 5C–E), suggesting that they were the most mature B-cell populations after completion of immunoglobulin gene rearrangement. In contrast to the expression of ebf1, myb, and si-dkey261h17.1 in early B cell-populations, these late clusters commonly express cd22l, dusp2, and mpeg1 (Figures 5C, E; Supplementary Figure S7). ebf1-expressing immature B cells, but not cd22l-high, relatively mature B cells, were present in the rag1 mutant, reflecting the qPCR results (Figure 2D).
Unlike zebrafish, in which clusters expressing igD and teleost-specific igT were separated (27, 61), igT has not been identified in medaka (62), and immunoglobulin m heavy chain (ighm)-expressing cells were scattered (Supplementary Figure S7). In zebrafish, several genes including ccr2 and several genes including irf8 were co-expressed with igcz (igT) and igcd (igD), respectively (27). However, cells expressing one of the ccr2 paralogs and irf8 did not form independent clusters in medaka (Supplementary Figure S7), indicating no sign of separation of the relatively mature B-cell populations.
3.6 Identification of T and NK cells in the kidney
To characterize T and NK cells in the kidney, lck-expressing T/NK clusters in wild-type kidney lymphocytes (Figure 5A) were focused and re-clustered. To this end, 1037 cells were separated into five clusters, all of which expressed lck and il7ra (Figure 6A; Supplementary Table S6). Indication of these wild-type T/NK-lineage clusters on t-SNE visualization of T/NK cells of both wild-type (1037 cells) and rag1 mutant (276 cells) identified one rag1-independent (NK cells) and four rag1-dependent clusters (T cells (1–3), cd79a+ T cells) (Figure 6B). The heatmap and t-SNE profiles of these clusters showed that rag1-dependent clusters commonly contained cells expressing cd4 paralogs (cd4-1 and cd4-2) or cd8 (cd8a and cd8b) (Figures 6C, D; Supplementary Figure S8), suggesting that they are T cells. Based on the expression levels at the individual cell level, cd4-1 and cd8a were separately expressed in the cells of T-cell clusters (Figure 6E), in contrast to overlapping expression in thymic DP clusters (Figure 3F), suggesting that they are mature CD4+ or CD8+ T cells.
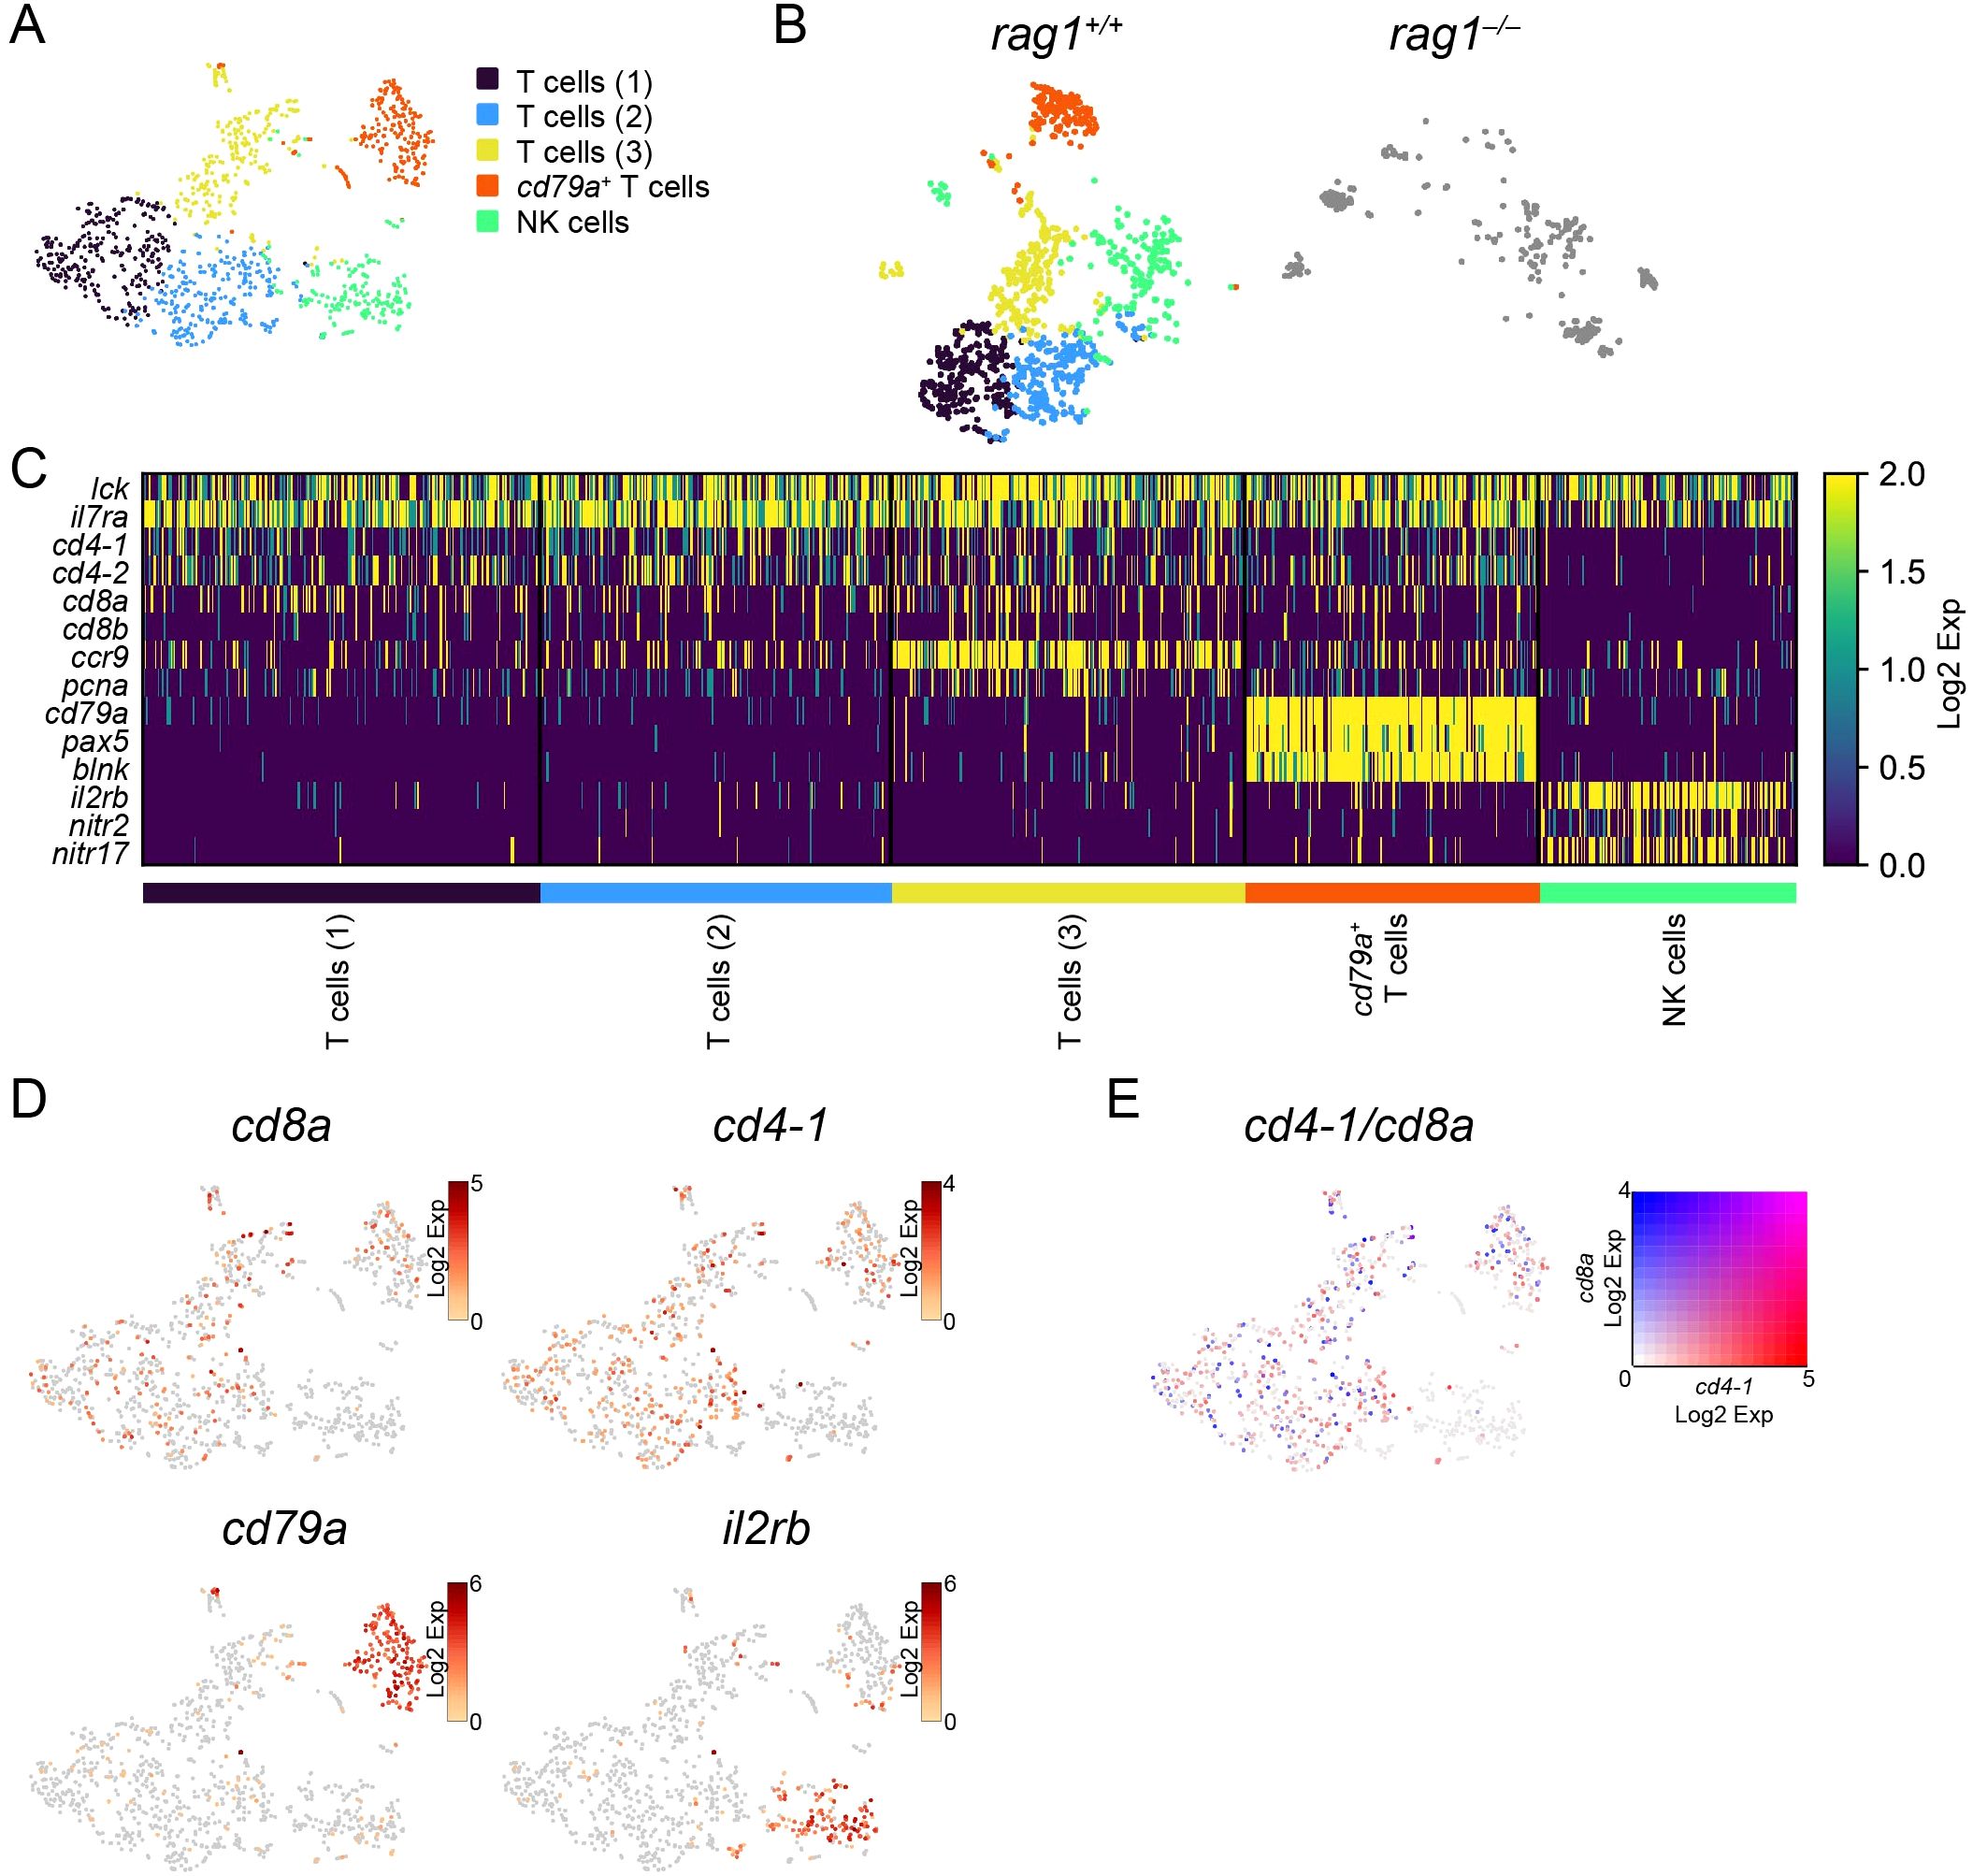
Figure 6. Categorization of T/NK cells in the kidney. (A) t-SNE visualization of 1037 T/NK cells from wild-type kidney marrow. Clusters with annotations are also presented. (B) t-SNE visualization of T/NK cells from the wild-type (left) and rag1 mutant (right) kidney marrow. Wild-type cells are colored based on the clusters in (A). Mutant cells are shown in gray. (C) Heatmap of marker gene expression in each T/NK-cell cluster in the wild-type. (D) t-SNE visualization of T/NK cells from wild-type kidney marrow. Expression levels of indicated genes are shown. (E) t-SNE visualization of T/NK-lineage cells from wild-type kidney. Merged expression levels of cd4-1 and cd8a are shown.
One of these T-cell clusters (cd79a+ T cells) also expressed B-cell markers cd79a, pax5, and blnk (Figures 6C, D). Among the three cd79a– T-cell clusters [T cells (1–3)], the T cells (3) cluster showed higher expression of genes including ccr9 and pcna (Figure 6C; Supplementary Table S6).
The rag1-independent cluster (NK cells) expressed il2rb, nitr2, and nitr17 (Figures 6C, D; Supplementary Figure S8), whose zebrafish orthologs are known markers of NK cells (25, 26, 59), suggesting that this population is composed of NK cells.
3.7 Identification of lymphoid progenitor cells already committed to the T lineage in the kidney
Another T lineage was identified in cd79a-expressing B-lineage cell clusters in the wild-type (Figure 5A). Cells expressing the T/NK-lineage markers lck and il7ra, but not cd4/cd8, were present in a portion of the CLP cluster and merged with cebpa-expressing cells (Figure 7A; Supplementary Figure S9A; Figure 5E). These cells also expressed notch1a, one of the orthologs of mammalian notch1 whose signaling is involved in T-cell fate decision (63, 64) (Supplementary Figure S9A).
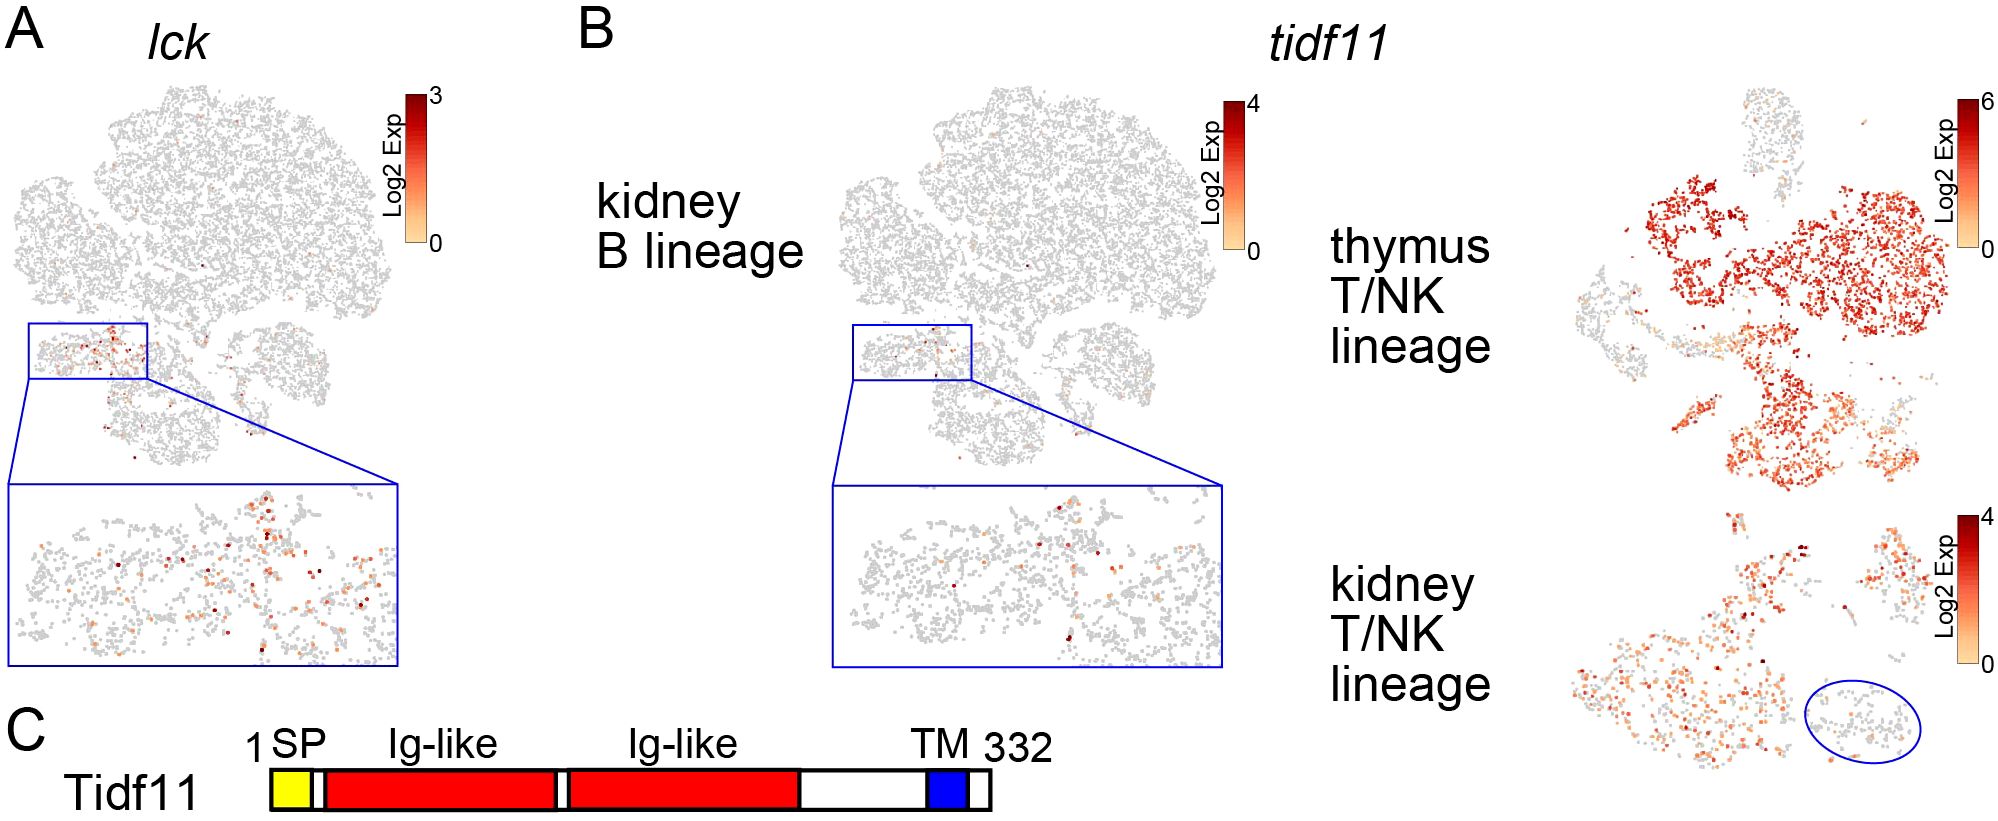
Figure 7. Identification of T-cell precursors in the kidney. (A) t-SNE visualization of B-lineage cells from the wild-type kidney marrow. Expression level of lck is shown. A magnified image of the blue square area is also shown. (B) t-SNE visualization of B-lineage cells from wild-type kidney marrow, T/NK-lineage cells from wild-type thymus, and T/NK-lineage cells from wild-type kidney. Expression level of tidf11 is shown. A magnified image of the blue square area is also shown. The NK cluster of the kidney T/NK-lineage cells is indicated by a blue circle. Note that there are few cells expressing tidf11 in the NK cluster. (C) Domain structures of Tidf11 protein with 332 amino acids. Signal peptide (SP), two immunoglobulin-like (Ig-like) domains, and transmembrane domain (TM) are indicated in yellow, red, and blue, respectively.
Some genes including interferon-induced transmembrane protein 5 (ifitm5) and t-cell-specific immunoglobulin domain family 11 (tidf11), were specifically expressed in the identical population in kidney and T cells, except for DP clusters in the thymus (Figure 7B; Supplementary Figure S9B). In the kidney, they were also expressed in mature T cells but not in NK cells (Figure 7B; Supplementary Figure S9B). ifitm5 is one of the orthologs of mammalian ifitm family genes that encode transmembrane proteins involved in helper T-cell differentiation and immune response against cancer and viral infection (65, 66). tidf11 is one of 18 family member genes on chromosome 17 (Supplementary Table S7). At least five other family member genes (tidf3, tidf7, tidf10, tidf12, and tidf16), for which the Ensembl gene ID was assigned, showed similar expression patterns to tidf11 (data not shown). As tidf family genes, except three members (tidf8, tidf9, tidf13) whose start codons have not been identified in this study, are predicted to encode transmembrane proteins with two immunoglobulin domains (Figure 7C), this family has been named the t-cell-specific immunoglobulin domain family. These results suggest that this CLP cluster contains cells committed to the T lineage and identified ifitm5 and tidf family genes already expressed at the T-lineage commitment stage and also in mature T cells.
4 Discussion
In this study, we characterized T-cell development in the thymus and B-cell development in the kidney of medaka using scRNA-seq analysis of lymphocytes in the wild-type and rag1 mutants. As a result, we found that DP cells, not SP cells, are the most developed T cells in the thymus, and lymphoid progenitor cells are already committed to the T lineage in the kidney. Thus, we clarified difference between medaka and zebrafish in molecular mechanisms underlying lymphocyte development.
Although the zebrafish rag1 mutant was established and shown to have problems in adaptive immune response due to the lack of mature lymphocytes (17, 67, 68), the compatible immunodeficient mutant of the other established teleost model is useful in terms of comparative immunity for understanding variations in fish immune systems. Accordingly, we established a rag1 mutant of medaka and characterized its phenotype. The mutant showed defects in the VDJ recombination of igh and tcrb (Figure 1) and exhibited B-cell development in the kidney and T-cell development in the thymus (Figures 1, 2). Regarding thymic T cells, although no obvious reduction in the area of lck:EGFP+ thymocytes was observed in the rag1 mutant, reduction in lck:EGFP intensity suggests a reduction in lck:EGFP+ cells in the larval rag1 mutant thymus, and a reduction in the area of the largest portions of thymic transverse sections suggests a reduction in the thickness of the adult rag1 mutant thymus (Figure 1). These phenotypes are similar to those of mammalian and zebrafish rag1 mutants (7, 17, 67, 68), suggesting the conservation of rag1 function in jawed vertebrates (Table 1).
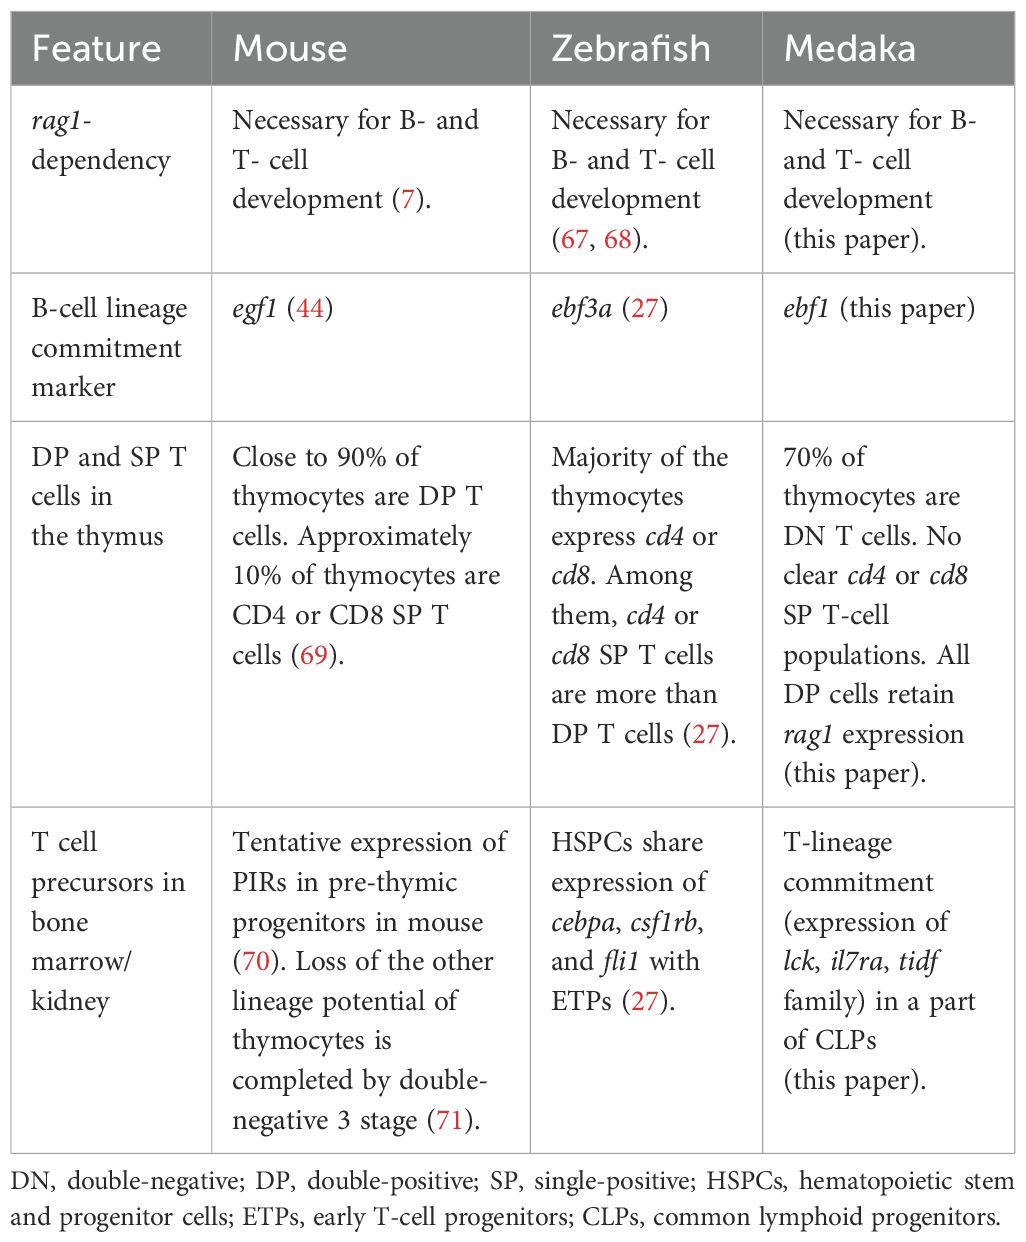
Table 1. Comparison of lymphopoiesis among mouse, zebrafish, and medaka.
For a detailed characterization of T- and B- cell development, we performed scRNA-seq analysis of lymphocytes in the thymus and kidney. In addition to the analysis of wild-type cells, analysis of rag1 mutant cells enabled us to distinguish early lymphocyte progenitors independent of Rag1 function and relatively mature populations requiring V(D)J recombination of immunoglobulin and tcr genes.
After immigration of ETPs from hematopoietic organs, αβ T-cell development follows the stages from CD4–CD8– DN, CD4+CD8+ DP, to CD4+CD8– or CD4–CD8+ SP, and the majority of the developing T cells in the thymus is DP in mammals (Table 1) (8, 69). In zebrafish, scRNA-seq analysis revealed that the majority of T-lineage cells express cd4-1 or cd8a, among which cd4 SP or cd8 SP cells are more abundant than DP cells (Table 1) (https://dr-marrow-thymus.cells.ucsc.edu) (27). Furthermore, FACS analysis of ginbuna crucian carp thymocytes using CD4-1 and CD8a antibodies showed the existence of DP (26%), CD4 SP (20%), and CD8 SP (22%) populations (72). However, in our medaka scRNA-seq analysis of thymic lymphocytes, as many as approximately 70% of the T/NK-lineage cells were DN (Figure 3). It should be noted that rag1 is already expressed in ETPs and its expression is maintained through αβ T-cell development, and developmental arrest in the rag1 mutant starts at the ETP stage (Figure 3). These results suggest that Rag1 function for tcrb gene rearrangement has already begun shortly after thymic immigration of T progenitors.
In addition to the unexpectedly low proportion of the DP population, it is surprising that neither cd4+cd8– nor cd4–cd8+ clusters were present in the medaka thymus (Figure 3). At the individual cell level, following the preceding expression of cd4-1 in the cycling T (3) cluster, cells in thymic DP T clusters exhibited overlapping expression of cd4-1 and cd8a (Figure 3). This is in contrast to kidney T cells, which are considered mature repopulated T cells, with separated expression of cd4-1 and cd8a (Figure 6). Defining the cells expressing cd4-1 or cd4-2 as cd4+ cells, and those expressing cd8a or cd8b as cd8+ cells, the proportions of cd4+cd8+ DP, cd4+cd8– SP, cd4–cd8+ SP, and cd4–cd8– DN cells in the thymic DP cluster cells were 85.8 ± 0.3%, 1.7 ± 0.7%, 9.0 ± 0.5%, and 3.4 ± 0.5%, respectively, whereas in the kidney T-cell clusters they were 1.8 ± 1.2%, 47.0 ± 2.6%, 18.6 ± 1.2%, and 32.6 ± 3.6%, respectively. Although there were a small number of SP cells in the thymic DP clusters, these SP cells did not have any differentially expressed genes compared with DP cells (data not shown), suggesting that these rare SP cells are not discrete populations with dynamic transcriptomic changes. In addition, in contrast to zebrafish, in which all SP cells and some DP cells ceased rag1 expression (27), medaka DP clusters in our study kept rag1 expression (Figure 3). These observations imply that thymic DP cells emigrate from thymus just after tcra rearrangement and positive selection before ceasing expression of rag1 and becoming SP cells (Table 1). Analysis of protein expression on the cell surface using antibodies against medaka Cd4 and Cd8 will further assess findings in this study.
In the thymus, two separate DP clusters were identified (Figures 3, 4). GO analysis of differentially expressed genes between these clusters indicated that cells in the DP T (1) cluster had higher expression of the “DNA replication-dependent chromatin assembly” and “spindle elongation” pathway genes, indicating that they are more proliferative. In contrast, cells in DP T (2) cluster have higher expression of “T cell differentiation” and “T cell activation” pathway genes including cd4, cd8, and ccr9. tespa1 required for positive selection is also highly expressed in the DP T (2) cluster (Figure 4), raising the possibility that the DP T (1) cluster includes proliferating cells before tcra gene rearrangement and the DP T (2) cluster includes cells after tcra gene rearrangement undergoing positive selection.
According to the continuous expression of rag1, the gene rearrangement of tcrb and tcra seems to occur serially (Figure 3). In this study, the timing of the gene rearrangement of tcrb and tcra was not studied. The gene encoding pre T-cell antigen receptor alpha (PTCRA), constituting pre T-cell receptor together with TCRβ (73) for β selection, has not been identified in teleosts. Hence, the timing of β selection and positive/negative selection of developing T cells was not completely identified in this study.
As non-αβ T lineages, three cell types were identified according to their marker gene expression patterns, although these cell types were not distinguished as separate clusters (Figure 4). In addition to trdc, expression of sox13 and blk, which are specifically expressed in γδ T cells in zebrafish (27), defined medaka γδ T cells (Figure 4). lag-3, an ortholog of the gene encoding an inhibitory receptor related to CD4 (56), was expressed in γδ T cells (Figure 4). This fits the case of mice, where the proportion of lag-3-expressing cells is much higher in γδ T cells than in αβ T cells (47). zbtb16a, an ortholog of the marker gene of iNKT cells (57, 58), was highly expressed in cell masses other than γδ T cells (Figure 4). However, it is unclear whether these cells have invariant TCR chains, as seen in mammals (74).
The other cell population is independent of rag1 and expresses orthologs of the zebrafish NK cell markers, il2rb and nitr2 (25, 26, 48) (Figures 3, 4). Although it is possible that related innate lymphoid cells (ILCs) are also included in this cell population, this study did not analyze enough cells to separate them, and defined this population as NK cells.
During B-cell development in the kidney, rag1 was expressed in one wave, suggesting that gene rearrangement of igh and igl seems to occur serially. The clusters expressing rag2, which encodes the partner protein of Rag1 for antigen receptor rearrangement, were identical to those expressing rag1. However, rag1high B and rag1low B clusters showed comparable expression levels of rag2 (Figure 5). This difference in the timing of expression of these genes were also observed in zebrafish (27). The expression of an ortholog of zebrafish sid1, which is considered to be orthologous to mammalian VPREB1 in rag1high clusters expressing dntt, implies that these clusters include the pre-B cell stage expressing rearranged igh, together with VpreB (Figure 5). However, the timing of the gene rearrangement of igh and igl was not studied in this study. The expression of ighm does not reflect the expression of rearranged igm because germline transcripts before rearrangement were also included, despite the fact that cells with less than 25 reads were judged as negative in Supplementary Figure S6. It is to be noted that although ebf3a is considered as a B-lineage commitment factor in zebrafish (27), our expression analysis suggests that ebf1 has such function in medaka, as in mammals (44) (Figure 5, Table 1).
In zebrafish, the most developed B cells in the kidney were clearly separated into IgD and IgT B cells according to the expression of ig and accompanying genes, including irf8 (igD B) and ccr2 (igT B) (27). In contrast, igT has not yet been identified in medaka (62). Indeed, cells expressing ighm, irf8, and ccr2 were evenly distributed in the eight most mature mpeg1+ B clusters (Figure 5; Supplementary Figure S7), indicating no sign of separation of the most mature B cells. mpeg1 was reported to be expressed by a subpopulation of B cells as well as macrophages (75). This was also true in medaka; among the B-lineage cells, mpeg1 was expressed by the most developed B cells (Figure 5).
We found rag1-independent NK clusters and rag1-dependent T clusters in lck-expressing T/NK clusters in the kidney (Figure 6). As mentioned above, T cells expressing cd4 and cd8 were not separated into independent clusters, possibly because they were not activated. The only medaka orthologue of foxp3 (ENSORLG00000025857) found to date, a marker of CD4+ regulatory T cells (Tregs) (76), was widely expressed in both cd4+ and cd8+ T cells (data not shown). Notably, there was a cluster of cells expressing both T- and B- cell markers (Figure 6). The function of this possibly novel cell population with a unique expression pattern is of particular interest.
A recent study identified zebrafish ETPs, which shared the expression of genes including cebpa, csf1rb, and fli1 with HSPCs in the kidney (27). However, none of these genes were commonly expressed in ETPs in the thymus and CLPs in the kidney in our medaka study, suggesting that timing of ETP immigration or their gene expression patterns are not conserved between zebrafish and medaka (Table 1). Indeed, cells expressing lck and il7ra were present in part of the CLP cluster in the kidney (Figure 7), suggesting that they are already committed to the T lineage. The specific expression of notch1a (Figure 7), one of the orthologs of mammalian notch1 involved in T-lineage commitment from T/B progenitors (63, 64), supports this notion. As the lymphocyte gate used for cell sorting of thymocytes covered the gross lck:EGFP+ cells (Supplementary Figure S4), it is unlikely that ETPs were omitted from our scRNA-seq analysis. In mice, Paired immunoglobulin-like receptors (PIRs) are expressed by prethymic T progenitors (Table 1) (70). However, the expression of PIRs in thymocytes is limited to the earliest intrathymic stage (70), and the other lineage potential of thymocytes is retained until the DN3 stage (71). In contrast, despite sharing the immunoglobulin domain with PIR, medaka Tidf family proteins are continuously expressed from the T-cell commitment stage in the kidney to mature T cells (Figure 7). Orthologs of tidf family genes are found in many species in the superorder Acanthopterygii including medaka and tetraodon, but not in other teleosts including zebrafish and salmon, according to the Ensembl database (data not shown), possibly reflecting the diversity of molecular mechanisms of T-lineage commitment in teleosts.
In summary, our study has characterized cellular and molecular basis of T- and B- cell development. In comparison with zebrafish mechanisms, we have shown unique features of medaka lymphopoiesis including the absence of the SP T-cell population in the thymus, and the presence of lymphoid progenitor cells expressing novel tidf family genes already committed to T lineage in the kidney. We believe that this information, in combination with future studies on immune function, will contribute to comparative immunity in teleosts in the context of evolutionary adaptation to the environment.
Data availability statement
The datasets presented in this study can be found in online repositories. The names of the repository/repositories and accession number(s) can be found in the article/Supplementary Material.
Ethics statement
The animal study was approved by Utsunomiya University Animal Experimentation Committee. The study was conducted in accordance with the local legislation and institutional requirements.
Author contributions
HS: Formal analysis, Investigation, Writing – original draft, Writing – review & editing. MM: Supervision, Writing – review & editing. NI: Conceptualization, Funding acquisition, Investigation, Writing – original draft, Writing – review & editing.
Funding
The author(s) declare financial support was received for the research, authorship, and/or publication of this article. This study was supported by JSPS KAKENHI (grant number JP21K05969 and PAGS grant numbers 16H06279 and 22H04925).
Acknowledgments
We thank NBRP Medaka (https://shigen.nig.ac.jp/medaka/) for providing OK-cab (strain ID: MT830) and cab-Tg (rag1-egfp) (strain ID: TG848), and for the medaka annotation file. We appreciate Thomas Boehm, Minoru Tanaka, and Tomonori Deguchi for their valuable comments and Ayame Ogawa, Takashi Kato, and Makoto Kashima for technical help.
Conflict of interest
The authors declare that the research was conducted in the absence of any commercial or financial relationships that could be construed as a potential conflict of interest.
Generative AI statement
The author(s) declare that no Generative AI was used in the creation of this manuscript.
Publisher’s note
All claims expressed in this article are solely those of the authors and do not necessarily represent those of their affiliated organizations, or those of the publisher, the editors and the reviewers. Any product that may be evaluated in this article, or claim that may be made by its manufacturer, is not guaranteed or endorsed by the publisher.
Supplementary material
The Supplementary Material for this article can be found online at: https://www.frontiersin.org/articles/10.3389/fimmu.2024.1517467/full#supplementary-material
References
1. Shin B, Chang SJ, MacNabb BW, Rothenberg EV. Transcriptional network dynamics in early T cell development. J Exp Med. (2024) 221:e20230893. doi: 10.1084/jem.20230893
2. Clark MR, Mandal M, Ochiai K, Singh H. Orchestrating B cell lymphopoiesis through interplay of IL-7 receptor and pre-B cell receptor signalling. Nat Rev Immunol. (2014) 14:69–80. doi: 10.1038/nri3570
3. Cunningham-Rundles C, Ponda PP. Molecular defects in T- and B-cell primary immunodeficiency diseases. Nat Rev Immunol. (2005) 5:880–92. doi: 10.1038/nri1713
4. Chen J, Liao S, Xiao Z, Pan Q, Wang X, Shen K, et al. The development and improvement of immunodeficient mice and humanized immune system mouse models. Front Immunol. (2022) 13:1007579. doi: 10.3389/fimmu.2022.1007579
5. Schatz DG, Oettinger MA, Baltimore D. The V(D)J recombination activating gene, RAG-1. Cell. (1989) 59:1035–48. doi: 10.1016/0092-8674(89)90760-5
6. Oettinger MA, Schatz DG, Gorka C, Baltimore D. RAG-1 and RAG-2, adjacent genes that synergistically activate V(D)J recombination. Science. (1990) 248:1517–23. doi: 10.1126/science.2360047
7. Mombaerts P, Iacomini J, Johnson RS, Herrup K, Tonegawa S, Papaioannou VE. RAG-1-deficient mice have no mature B and T lymphocytes. Cell. (1992) 68:869–77. doi: 10.1016/0092-8674(92)90030-g
8. Germain RN. T-cell development and the CD4-CD8 lineage decision. Nat Rev Immunol. (2002) 2:309–22. doi: 10.1038/nri798
9. Boehm T, Iwanami N, Hess I. Evolution of the immune system in the lower vertebrates. Annu Rev Genomics Hum Genet. (2012) 13:127–49. doi: 10.1146/annurev-genom-090711-163747
10. Langenau DM, Zon LI. The zebrafish: a new model of T-cell and thymic development. Nat Rev Immunol. (2005) 5:307–17. doi: 10.1038/nri1590
11. Flajnik MF. A cold-blooded view of adaptive immunity. Nat Rev Immunol. (2018) 18:438–53. doi: 10.1038/s41577-018-0003-9
12. Star B, Nederbragt AJ, Jentoft S, Grimholt U, Malmstrøm M, Gregers TF, et al. The genome sequence of Atlantic cod reveals a unique immune system. Nature. (2011) 477:207–10. doi: 10.1038/nature10342
13. Guslund NC, Solbakken MH, Brieuc MSO, Jentoft S, Jakobsen KS, Qiao SW. Single-cell transcriptome profiling of immune cell repertoire of the atlantic cod which naturally lacks the major histocompatibility class II system. Front Immunol. (2020) 11:559555. doi: 10.3389/fimmu.2020.559555
14. Swann JB, Holland SJ, Petersen M, Pietsch TW, Boehm T. The immunogenetics of sexual parasitism. Science. (2020) 369:1608–15. doi: 10.1126/science.aaz9445
15. Iwanami N. Zebrafish as a model for understanding the evolution of the vertebrate immune system and human primary immunodeficiency. Exp Hematol. (2014) 42:697–706. doi: 10.1016/j.exphem.2014.05.001
16. van der Vaart M, Spaink HP, Meijer AH. Pathogen recognition and activation of the innate immune response in zebrafish. Adv Hematol. (2012) 2012:159807. doi: 10.1155/2012/159807
17. Wienholds E, Schulte-Merker S, Walderich B, Plasterk RH. Target-selected inactivation of the zebrafish rag1 gene. Science. (2002) 297:99–102. doi: 10.1126/science.1071762
18. Jung IH, Chung YY, Jung DE, Kim YJ, Kim do H, Kim KS, et al. Impaired lymphocytes development and xenotransplantation of gastrointestinal tumor cells in prkdc-null SCID zebrafish model. Neoplasia. (2016) 18:468–79. doi: 10.1016/j.neo.2016.06.007
19. Sertori R, Jones R, Basheer F, Rivera L, Dawson S, Loke S, et al. Generation and characterization of a zebrafish IL-2Rγc SCID model. Int J Mol Sci. (2022) 23:2385. doi: 10.3390/ijms23042385
20. Langenau DM, Ferrando AA, Traver D, Kutok JL, Hezel JP, Kanki JP, et al. In vivo tracking of T cell development, ablation, and engraftment in transgenic zebrafish. Proc Natl Acad Sci USA. (2004) 101:7369–74. doi: 10.1073/pnas.0402248101
21. Bajoghli B, Aghaallaei N, Hess I, Rode I, Netuschil N, Tay BH, et al. Evolution of genetic networks underlying the emergence of thymopoiesis in vertebrates. Cell. (2009) 138:186–97. doi: 10.1016/j.cell.2009.04.017
22. Page DM, Wittamer V, Bertrand JY, Lewis KL, Pratt DN, Delgado N, et al. An evolutionarily conserved program of B-cell development and activation in zebrafish. Blood. (2013) 122:e1–11. doi: 10.1182/blood-2012-12-471029
23. Liu X, Li YS, Shinton SA, Rhodes J, Tang L, Feng H, et al. Zebrafish B cell development without a pre-B cell stage, revealed by CD79 fluorescence reporter transgenes. J Immunol. (2017) 199:1706–15. doi: 10.4049/jimmunol.1700552
24. Moore FE, Garcia EG, Lobbardi R, Jain E, Tang Q, Moore JC, et al. Single-cell transcriptional analysis of normal, aberrant, and Malignant hematopoiesis in zebrafish. J Exp Med. (2016) 213:979–92. doi: 10.1084/jem.20152013
25. Tang Q, Iyer S, Lobbardi R, Moore JC, Chen H, Lareau C, et al. Dissecting hematopoietic and renal cell heterogeneity in adult zebrafish at single-cell resolution using RNA sequencing. J Exp Med. (2017) 214:2875–87. doi: 10.1084/jem.20170976
26. Carmona SJ, Teichmann SA, Ferreira L, Macaulay IC, Stubbington MJ, Cvejic A, et al. Single-cell transcriptome analysis of fish immune cells provides insight into the evolution of vertebrate immune cell types. Genome Res. (2017) 27:451–61. doi: 10.1101/gr.207704.116
27. Rubin SA, Baron CS, Pessoa Rodrigues C, Duran M, Corbin AF, Yang SP, et al. Single-cell analyses reveal early thymic progenitors and pre-B cells in zebrafish. J Exp Med. (2022) 219:e20220038. doi: 10.1084/jem.20220038
28. Hernández PP, Strzelecka PM, Athanasiadis EI, Hall D, Robalo AF, Collins CM, et al. Single-cell transcriptional analysis reveals ILC-like cells in zebrafish. Sci Immunol. (2018) 3:eaau5265. doi: 10.1126/sciimmunol.aau5265
29. Hu CB, Wang J, Hong Y, Li H, Fan DD, Lin AF, et al. Single-cell transcriptome profiling reveals diverse immune cell populations and their responses to viral infection in the spleen of zebrafish. FASEB J. (2023) 37:e22951. doi: 10.1096/fj.202201505RRRR
30. Jones LO, Willms RJ, Xu X, Graham RDV, Eklund M, Shin M, et al. Single-cell resolution of the adult zebrafish intestine under conventional conditions and in response to an acute Vibrio cholerae infection. Cell Rep. (2023) 42:113407. doi: 10.1016/j.celrep.2023.113407
31. Wittbrodt J, Shima A, Schartl M. Medaka–a model organism from the far East. Nat Rev Genet. (2002) 3:53–64:e46994. doi: 10.1038/nrg704
32. Hilgers L, Schwarzer J. The untapped potential of medaka and its wild relatives. Elife. (2019) 8:e46994. doi: 10.7554/eLife.46994
33. Iwanami N, Takahama Y, Kunimatsu S, Li J, Takei R, Ishikura Y, et al. Mutations affecting thymus organogenesis in Medaka, Oryzias latipes. Mech Dev. (2004) 121:779–89. doi: 10.1016/j.mod.2004.03.020
34. Li J, Iwanami N, Hoa VQ, Furutani-Seiki M, Takahama Y. Noninvasive intravital imaging of thymocyte dynamics in medaka. J Immunol. (2007) 179:1605–15. doi: 10.4049/jimmunol.179.3.1605
35. Bajoghli B, Dick AM, Claasen A, Doll L, Aghaallaei N. Zebrafish and medaka: two teleost models of T-cell and thymic development. Int J Mol Sci. (2019) 20:4179. doi: 10.3390/ijms20174179
36. Sakaguchi H, Sato Y, Matsumoto R, Gomikawa J, Yoshida N, Suzuki T, et al. Maturation of the medaka immune system depends on reciprocal interactions between the microbiota and the intestinal tract. Front Immunol. (2023) 14:1259519. doi: 10.3389/fimmu.2023.1259519
37. Iwamatsu T. Stages of normal development in the medaka Oryzias latipes. Mech Dev. (2004) 121:605–18. doi: 10.1016/j.mod.2004.03.012
38. Bajoghli B, Kuri P, Inoue D, Aghaallaei N, Hanelt M, Thumberger T, et al. Noninvasive in toto imaging of the thymus reveals heterogeneous migratory behavior of developing T cells. J Immunol. (2015) 195:2177–86. doi: 10.4049/jimmunol.1500361
39. Imai T, Saino K, Matsuda M. Mutation of Gonadal soma-derived factor induces medaka XY gonads to undergo ovarian development. Biochem Biophys Res Commun. (2015) 467:109–14. doi: 10.1016/j.bbrc.2015.09.112
40. Traver D, Paw BH, Poss KD, Penberthy WT, Lin S, Zon LI. Transplantation and in vivo imaging of multilineage engraftment in zebrafish bloodless mutants. Nat Immunol. (2003) 4:1238–46. doi: 10.1038/ni1007
41. Aghaallaei N, Bajoghli B, Schwarz H, Schorpp M, Boehm T. Characterization of mononuclear phagocytic cells in medaka fish transgenic for a cxcr3a:gfp reporter. Proc Natl Acad Sci U.S.A. (2010) 107:18079–84. doi: 10.1073/pnas.1000467107
42. Pedregosa F, Varoquaux G, Gramfort A, Michel V, Thirion B, Grisel O, et al. Scikit-learn: machine learning in python. J Mach Learn Res. (2011) 12:2825–30.
43. Wolf FA, Angerer P, Theis FJ. SCANPY: large-scale single-cell gene expression data analysis. Genome Biol. (2018) 19:15. doi: 10.1186/s13059-017-1382-0
44. Lin H, Grosschedl R. Failure of B-cell differentiation in mice lacking the transcription factor EBF. Nature. (1995) 376:263–7. doi: 10.1038/376263a0
45. Detrich HW 3rd, Kieran MW, Chan FY, Barone LM, Yee K, Rundstadler JA, et al. Intraembryonic hematopoietic cell migration during vertebrate development. Proc Natl Acad Sci U.S.A. (1995) 92:10713–7. doi: 10.1073/pnas.92.23.10713
46. Hoppmann V, Wu JJ, Søviknes AM, Helvik JV, Becker TS. Expression of the eight AMPA receptor subunit genes in the developing central nervous system and sensory organs of zebrafish. Dev Dyn. (2008) 237:788–99. doi: 10.1002/dvdy.21447
47. Workman CJ, Rice DS, Dugger KJ, Kurschner C, Vignali DA. Phenotypic analysis of the murine CD4-related glycoprotein, CD223 (LAG-3). Eur J Immunol. (2002) 32:2255–63. doi: 10.1002/1521-4141(200208)32:8<2255::Aid-immu2255>3.0.Co;2-a
48. Desai S, Heffelfinger AK, Orcutt TM, Litman GW, Yoder JA. The medaka novel immune-type receptor (NITR) gene clusters reveal an extraordinary degree of divergence in variable domains. BMC Evol Biol. (2008) 8:177. doi: 10.1186/1471-2148-8-177
49. Tomarev SI, Nakaya N. Olfactomedin domain-containing proteins: possible mechanisms of action and functions in normal development and pathology. Mol Neurobiol. (2009) 40:122–38. doi: 10.1007/s12035-009-8076-x
50. Haire RN, Rast JP, Litman RT, Litman GW. Characterization of three isotypes of immunoglobulin light chains and T-cell antigen receptor alpha in zebrafish. Immunogenetics. (2000) 51:915–23. doi: 10.1007/s002510000229
51. Aghaallaei N, Dick AM, Tsingos E, Inoue D, Hasel E, Thumberger T, et al. αβ/γδ T cell lineage outcome is regulated by intrathymic cell localization and environmental signals. Sci Adv. (2021) 7:eabg3613. doi: 10.1126/sciadv.abg3613
52. Zhou Y, Zhou B, Pache L, Chang M, Khodabakhshi AH, Tanaseichuk O, et al. Metascape provides a biologist-oriented resource for the analysis of systems-level datasets. Nat Commun. (2019) 10:1523. doi: 10.1038/s41467-019-09234-6
53. Arbuckle JL, Fauss LA, Simpson R, Ptaszek LM, Rodgers KK. Identification of two topologically independent domains in RAG1 and their role in macromolecular interactions relevant to V(D)J recombination. J Biol Chem. (2001) 276:37093–101. doi: 10.1074/jbc.M105988200
54. Aidinis V, Dias DC, Gomez CA, Bhattacharyya D, Spanopoulou E, Santagata S. Definition of minimal domains of interaction within the recombination-activating genes 1 and 2 recombinase complex. J Immunol. (2000) 164:5826–32. doi: 10.4049/jimmunol.164.11.5826
55. Wang D, Zheng M, Lei L, Ji J, Yao Y, Qiu Y, et al. Tespa1 is involved in late thymocyte development through the regulation of TCR-mediated signaling. Nat Immunol. (2012) 13:560–8. doi: 10.1038/ni.2301
56. Aggarwal V, Workman CJ, Vignali DAA. LAG-3 as the third checkpoint inhibitor. Nat Immunol. (2023) 24:1415–22. doi: 10.1038/s41590-023-01569-z
57. Savage AK, Constantinides MG, Han J, Picard D, Martin E, Li B, et al. The transcription factor PLZF directs the effector program of the NKT cell lineage. Immunity. (2008) 29:391–403. doi: 10.1016/j.immuni.2008.07.011
58. Kovalovsky D, Uche OU, Eladad S, Hobbs RM, Yi W, Alonzo E, et al. The BTB-zinc finger transcriptional regulator PLZF controls the development of invariant natural killer T cell effector functions. Nat Immunol. (2008) 9:1055–64. doi: 10.1038/ni.1641
59. Yoder JA, Mueller MG, Wei S, Corliss BC, Prather DM, Willis T, et al. Immune-type receptor genes in zebrafish share genetic and functional properties with genes encoded by the mammalian leukocyte receptor cluster. Proc Natl Acad Sci U.S.A. (2001) 98:6771–6. doi: 10.1073/pnas.121101598
60. Yoder JA, Nielsen ME, Amemiya CT, Litman GW. Zebrafish as an immunological model system. Microbes Infect. (2002) 4:1469–78. doi: 10.1016/s1286-4579(02)00029-1
61. Danilova N, Bussmann J, Jekosch K, Steiner LA. The immunoglobulin heavy-chain locus in zebrafish: identification and expression of a previously unknown isotype, immunoglobulin Z. Nat Immunol. (2005) 6:295–302. doi: 10.1038/ni1166
62. Magadán-Mompó S, Sánchez-Espinel C, Gambón-Deza F. Immunoglobulin heavy chains in medaka (Oryzias latipes). BMC Evol Biol. (2011) 11:165. doi: 10.1186/1471-2148-11-165
63. Pui JC, Allman D, Xu L, DeRocco S, Karnell FG, Bakkour S, et al. Notch1 expression in early lymphopoiesis influences B versus T lineage determination. Immunity. (1999) 11:299–308. doi: 10.1016/s1074-7613(00)80105-3
64. Radtke F, Wilson A, Stark G, Bauer M, van Meerwijk J, MacDonald HR, et al. Deficient T cell fate specification in mice with an induced inactivation of Notch1. Immunity. (1999) 10:547–58. doi: 10.1016/s1074-7613(00)80054-0
65. Yánez DC, Ross S, Crompton T. The IFITM protein family in adaptive immunity. Immunology. (2020) 159:365–72. doi: 10.1111/imm.13163
66. Gómez-Herranz M, Taylor J, Sloan RD. IFITM proteins: Understanding their diverse roles in viral infection, cancer, and immunity. J Biol Chem. (2023) 299:102741. doi: 10.1016/j.jbc.2022.102741
67. Petrie-Hanson L, Hohn C, Hanson L. Characterization of rag1 mutant zebrafish leukocytes. BMC Immunol. (2009) 10:8. doi: 10.1186/1471-2172-10-8
68. Tokunaga Y, Shirouzu M, Sugahara R, Yoshiura Y, Kiryu I, Ototake M, et al. Comprehensive validation of T- and B-cell deficiency in rag1-null zebrafish: Implication for the robust innate defense mechanisms of teleosts. Sci Rep. (2017) 7:7536. doi: 10.1038/s41598-017-08000-2
69. Krueger A, Ziętara N, Łyszkiewicz M. T cell development by the numbers. Trends Immunol. (2017) 38:128–39. doi: 10.1016/j.it.2016.10.007
70. Masuda K, Kubagawa H, Ikawa T, Chen CC, Kakugawa K, Hattori M, et al. Prethymic T-cell development defined by the expression of paired immunoglobulin-like receptors. EMBO J. (2005) 24:4052–60. doi: 10.1038/sj.emboj.7600878
71. Bhandoola A, von Boehmer H, Petrie HT, Zúñiga-Pflücker JC. Commitment and developmental potential of extrathymic and intrathymic T cell precursors: plenty to choose from. Immunity. (2007) 26:678–89. doi: 10.1016/j.immuni.2007.05.009
72. Khallaf MA, Ogawa S, Toda H, Matsuura Y, Miyazawa R, Nakanishi T. Percentage Dynamics of CD4-1+ and CD8α+ T Cells in Different Tissues at Various Developmental Stages in Ginbuna Crucian Carp Carassius auratus langsdorfii. Fish Pathol. (2018) 53:10–8. doi: 10.3147/jsfp.53.10
73. Groettrup M, Ungewiss K, Azogui O, Palacios R, Owen MJ, Hayday AC, et al. A novel disulfide-linked heterodimer on pre-T cells consists of the T cell receptor beta chain and a 33 kd glycoprotein. Cell. (1993) 75:283–94. doi: 10.1016/0092-8674(93)80070-u
74. Taniguchi M, Koseki H, Tokuhisa T, Masuda K, Sato H, Kondo E, et al. Essential requirement of an invariant V alpha 14 T cell antigen receptor expression in the development of natural killer T cells. Proc Natl Acad Sci U.S.A. (1996) 93:11025–8. doi: 10.1073/pnas.93.20.11025
75. Ferrero G, Gomez E, Lyer S, Rovira M, Miserocchi M, Langenau DM, et al. The macrophage-expressed gene (mpeg) 1 identifies a subpopulation of B cells in the adult zebrafish. J Leukoc Biol. (2020) 107:431–43. doi: 10.1002/jlb.1a1119-223r
Keywords: medaka, immune system, lymphopoiesis, scRNA-seq, rag1
Citation: Sakaguchi H, Matsuda M and Iwanami N (2025) Single-cell transcriptome analysis of medaka lymphocytes reveals absence of fully mature T cells in the thymus and the T-lineage commitment in the kidney. Front. Immunol. 15:1517467. doi: 10.3389/fimmu.2024.1517467
Received: 26 October 2024; Accepted: 13 December 2024;
Published: 10 January 2025.
Edited by:
Jiong Chen, Ningbo University, ChinaReviewed by:
Fumihiko Katakura, Nihon University, JapanBo Yan, Fudan University, China
Kerry J. Laing, University of Washington, United States
Tor Gjøen, University of Oslo, Norway
Xinyu Jiang, Henan Normal University, China
Laurence Bugeon, Imperial College London, United Kingdom
Keir Balla, Chan Zuckerberg Biohub, United States
Copyright © 2025 Sakaguchi, Matsuda and Iwanami. This is an open-access article distributed under the terms of the Creative Commons Attribution License (CC BY). The use, distribution or reproduction in other forums is permitted, provided the original author(s) and the copyright owner(s) are credited and that the original publication in this journal is cited, in accordance with accepted academic practice. No use, distribution or reproduction is permitted which does not comply with these terms.
*Correspondence: Norimasa Iwanami, aXdhbmFtaUBjYy51dHN1bm9taXlhLXUuYWMuanA=