
94% of researchers rate our articles as excellent or good
Learn more about the work of our research integrity team to safeguard the quality of each article we publish.
Find out more
CLINICAL TRIAL article
Front. Immunol., 23 January 2025
Sec. Inflammation
Volume 15 - 2024 | https://doi.org/10.3389/fimmu.2024.1501660
This article is part of the Research TopicCommunity Series in Pathogenetic mechanism and therapeutic target for inflammation in autoimmune disease: Volume IIView all 8 articles
 Jindong Zhao1,2,3
 Zhaohui Fang1,2,3*
Introduction: Type 2 diabetes mellitus (T2DM) is a disease that involves autoimmunity. However, how immune cells function in the peripheral blood remains unclear. Exploring T2DM biomarkers via single-cell RNA sequencing (scRNA-seq) could provide new insights into the underlying molecular mechanisms.
Methods: The clinical trial registration number is ChiCTR2100049613. In this study, we included three healthy participants and three T2DM patients. The observed clinical indicators included weight and fasting blood glucose (FBG), glycosylated haemoglobin A1c (HbA1c) and fasting insulin levels. Direct separation and purification of peripheral blood mononuclear cells (PBMCs) were performed via the Ficoll density gradient centrifugation method. Immune cell types were identified via scRNA-seq. The differentially expressed genes, biological functions, cell cycle dynamics, and correlations between blood glucose indicators and genes in different cell types were analysed.
Results: There were differences between the healthy and T2DM groups in terms of FBG and HbA1c (p<0.05 or p<0.01). We profiled 13,591 cells and 3188 marker genes from PBMCs. B cells, T cells, monocytes, and NK cells were grouped into 4 subclusters from PBMCs. CD4+ T cells are mainly in the memory activation stage, and CD8+ T cells are effectors. Monocytes include mainly CD14+ monocytes and FCGR3A+ monocytes. There were 119 differentially expressed genes in T cells and 175 differentially expressed genes in monocytes. Gene set enrichment analysis revealed that the marker genes were enriched in HALLMARK_ INTERFERON_GAMMA_RESPONSE and HALLMARK_TNFA_SIGNALING_VIA_ NFKB. Moreover, TNFRSF1A was identified as the core gene involved in network interactions in T cells.
Discussion: Our study provides a transcriptional map of immune cells from PBMCs and provides a framework for understanding the immune status and potential immune mechanisms of T2DM patients via scRNA-seq.
Clinical trial registration: http://www.chictr.org.cn, identifier ChiCTR2100049613.
Diabetes mellitus (DM) is a metabolic disease characterized by hyperglycaemia, and it can be caused by genetic factors, environmental factors, and autoimmune factors, among others. To date, four distinct types of DM have been defined, of which type 1 DM (T1DM) is mostly an autoimmune disease. T lymphocytes are activated in vivo and cause rapid destruction and functional failure of islet beta cells, leading to the development of T1DM (1, 2). However, type 2 DM (T2DM) accounts for approximately 90–95% of DM cases, with an incidence of 11.2% in China (3). T2DM comprises a group of heterogeneous diseases whose complex pathogenesis has not been fully elucidated (4). The pathogenesis of T2DM is related mainly to insulin resistance (IR), which leads to prediabetes and ultimately DM.
Blood glucose is the main biomarker used for the diagnosis of T2DM. The discovery of other early biomarkers or molecular, pathological, and immunological changes is important for improving the diagnosis and evaluation of T2DM (5). To date, the phenotypes and roles of T cells, NK cells, monocytes and other immune cells have received less attention than those of other systems involved in DM (6, 7). In recent years, increasing evidence has shown that immune disorders are the main factors involved in the occurrence of T2DM (8–10). Single-cell RNA sequencing (scRNA-seq) is a new technique that can be used to elucidate cell heterogeneity and quantify the expression profiles of individual genes in individual cells, making it easier to study the roles of specific genes. scRNA-seq can be used to elucidate specific functional alterations in cells that may reveal cellular phenotypes and heterogeneity and to identify biomarkers for the diagnosis and treatment of T2DM; these biomarkers may also help predict outcomes and complications in individual cases (11). The role of islet cell types in the genetic signalling pathways associated with T2DM susceptibility, particularly the role of islet beta cell specificity, have been investigated (12, 13). Huang Y et al. detected 6 islet cell types and reported that SLC2A2, SERPINF1, RASGRP1 and CHL1 are biomarkers of T2DM that can be used for clinical diagnosis (14). Lee H et al. reported that CD8+ effector T cells in the peripheral blood mononuclear cells (PBMCs) of patients with T2DM had a reduced cytotoxicity score and a heightened level of exhaustion (15).
In this study, we obtained scRNA-seq data from the whole blood of healthy participants and T2DM patients by labelling single-cell clusters and identifying key cell clusters via typical gene expression levels to understand the expression of genes in every cell and the communication between cells. This analysis may provide new insights into a framework for understanding the immune status of T2DM patients (Figure 1).
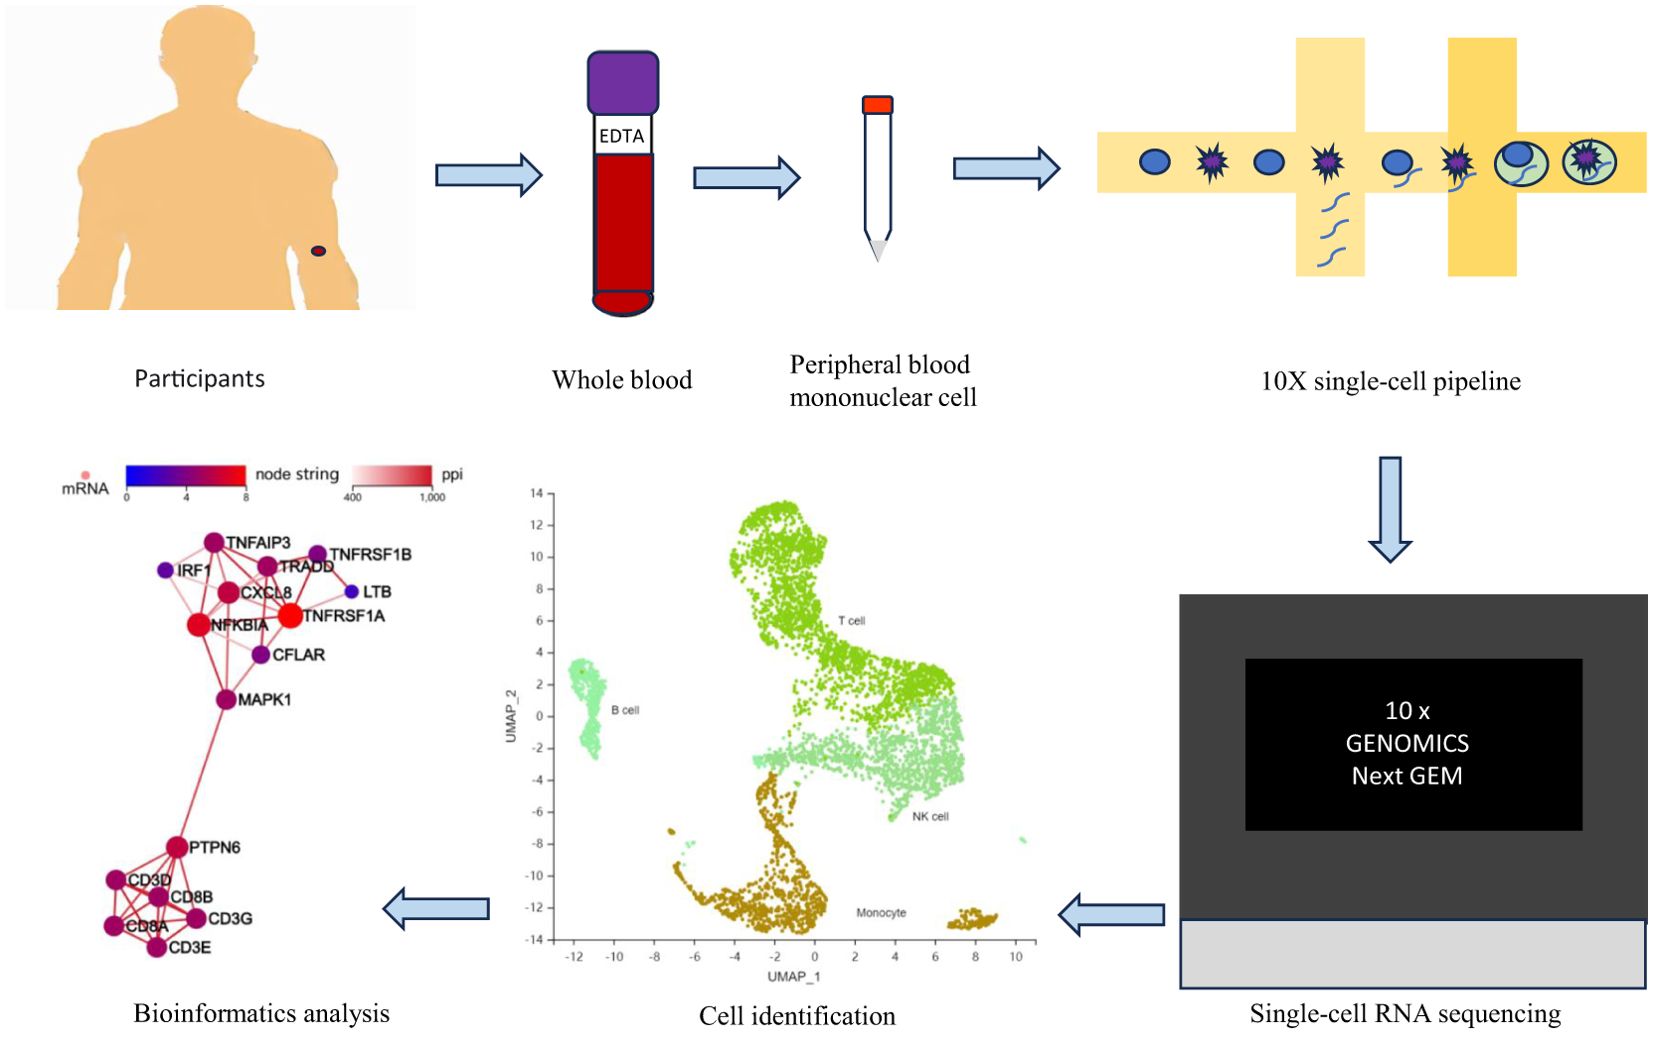
Figure 1. Research flow chart. EDTA, ethylene diamine tetraacetic acid.
This study was a prospective, controlled trial aimed at analysing the possible immune mechanisms in T2DM patients. The study was registered as a Chinese clinical trial on the WHO international clinical trial registry platform (ChiCTR2100049613). All methods were carried out in accordance with the CONSORT statement. All experimental protocols were approved by the Ethics Committee of the First Affiliated Hospital of Anhui University of Traditional Chinese Medicine. The ethics approval number is 2021AH-39. All participants provided written informed consent before participating. Three healthy participants and three patients with T2DM were included.
Patients were diagnosed with T2DM according to the guidelines for the prevention and treatment of T2DM in China (2020 edition). The diagnostic criteria for healthy participants were the absence of a history of systemic disease, such as hypertension, T2DM, or cardiopulmonary insufficiency, and no use of systemic or topical medications. The inclusion criteria for T2DM patients were a glycosylated haemoglobin A1c (HbA1c) level ≤ 7.5%, course of T2DM disease ≤ 3 years, and aged 18–70 years; both sexes were included. The participants were informed of the study procedures and voluntarily signed an informed consent form.
The exclusion criteria for T2DM patients were the presence of T1DM, gestational DM, T2DM requiring insulin therapy, or other special types of DM; acute complications of T2DM; severe cardiovascular and cerebrovascular diseases; severe primary diseases, such as liver, kidney and haematopoietic system diseases; allergy to the known ingredients of the study drug or chronic allergies; pregnancy, lactation, having recently given birth, or planning to become pregnant; long-term alcoholism, drug dependence or mental illness; and participation in another drug clinical trial within one month before the screening period for this study. Finally, all participants were deemed suitable for participation in this clinical study according to the opinion of the investigator.
The collected background information included age, sex, height, weight, etc. Fasting blood glucose (FBG), alanine aminotransferase, aspartate transaminase, blood urea nitrogen, and creatinine levels were determined with a Beckman AU5800 fully automatic biochemical analyser (Beckman, US). The level of HbA1c was determined with a Bio-Rad D-100 HbA1c analyser (Bio-Rad, US). The level of fasting insulin (FINS) was determined with an AutoLumo A2000 Plus fully automatic chemiluminescence analyser (Autobio, Zhengzhou, China). The homeostasis model assessment–IR (HOMA–IR) score was calculated as FINS (μIU/ml) × FBG (mmol/L) ÷ 22.5 (16). Safety indicators included blood pressure, heart rate, routine blood tests, and routine urine tests (Figure 2).
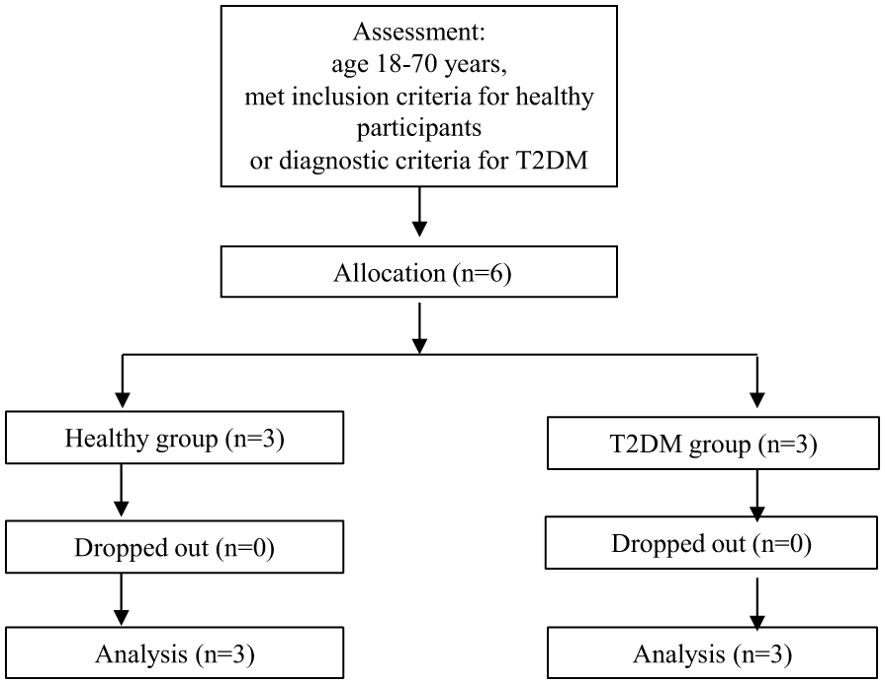
Figure 2. CONSORT participant flow chart. T2DM, type 2 diabetes mellitus.
ScRNA-seq was performed by BGI Shenzhen. The 10x Genomics Chromium allows high-throughput single-cell 3’ mRNA quantitative analysis. Afterwards, 5 mL of whole blood containing ethylene diamine tetraacetic acid was added to a 15 mL centrifuge tube with 3 mL of Ficoll lymphocyte separation media. An equal volume of 1X PBS was added to each blood sample. The diluted blood samples were layered carefully in Ficoll lymphocyte separation liquid and then centrifuged at 400 × g at 18–20°C for 30 min continuously. The mononuclear cell layer was transferred to a 15 mL sterile centrifuge tube with a sterile pipette. Three volumes of 1× PBS were added to the lymphocyte layer, which was carefully mixed via pipetting. The samples were subsequently centrifuged at 400 × g, after which the supernatant was discarded. Then, 6 mL of 1× PBS was added to the lymphocyte layer, which was again carefully mixed via pipetting. The mixture was subsequently centrifuged at 400 × g for 10 min, and the supernatant was discarded. The cells were resuspended in the desired volume of 1× PBS and stained with 0.4% trypan blue. Samples with greater than 80% cell viability were used for library construction. The prepared single-cell suspensions were subsequently partitioned into gel beads in emulsion in an automated Chromium Controller, after which the mRNAs were reverse transcribed into cDNAs. The reaction system was configured in sequence for breaking gel beads in emulsion, cDNA amplification, fragmentation, end repair, A-tailing, and adaptor ligation polymerase chain reaction. After reacting at a suitable temperature for a fixed period, the products were separately purified in an appropriately configured reaction system. After library quality control, single-stranded polymerase chain reaction products were produced via denaturation. Single-stranded cyclized products were produced with a circularization reaction system. Single-stranded circular DNA molecules were replicated, and a DNA nanoball that contained multiple copies of DNA was generated. DNA nanoballs of sufficient quality were loaded into patterned nanoarrays and sequenced through combinatorial probe–anchor synthesis.
The raw gene expression matrix generated from each sample was aggregated via Cell Ranger (v5.0.1) (17), which is provided on the 10x Genomics website. Downstream analysis was performed with the R package Seurat (v 3.2.0) (18). Specifically, cells with fewer than 200 genes or with > 90% of the proportion of the maximum genes were filtered. For the mitochondrial metric, the cells were sorted in descending order of the mitochondrial read ratio, and the top 15% of the cells were filtered. Potential doublets were identified and removed via doublet detection (19). Cell cycle analysis was performed with the cell cycle scoring function of the Seurat program. The gene expression dataset was normalized. Uniform manifold approximation and projection (UMAP) was subsequently used for two-dimensional visualization of the resulting clusters. For each cluster, marker genes were identified with the FindAllMarkers function as implemented in the Seurat package (V3.2.0, logFC > 0.25, minPct > 0.1 and Padj ≤ 0.05). The clusters were then marked as known cell types via the scRNA-seq atlas method (20). Differentially expressed genes (DEGs) across different samples were identified with the FindMarkers function (logFC > 0.25, minPct > 0.1 and Padj ≤ 0.05). Volcano plots were created with the ggplot2 package. The threshold for the log fold change was set at 0.2, and that for p values was set at 0.05. Gene Ontology (GO) analysis was performed via the phyper function of the R package (R-3.1.1). Kyoto Encyclopedia of Genes and Genomes (KEGG, V93.0) enrichment analysis results. GO and KEGG pathways with p or Q values ≤0.05 were considered significantly enriched (21).
The Type 2 Diabetes Knowledge Portal (https://t2d.hugeamp.org/) contains summary data on genetic correlations, genome annotations, bioinformatics results, expertise in T2DM and related traits, blood glucose, etc. The human genetic evidence calculator integrates several kinds of human genetic results to quantify genetic support for the involvement of a gene in a disease or phenotype of interest (22).
The statistical analyses were conducted in SPSS 23.0. Continuous variables are expressed as the means ± standard deviations. Categorical variables are presented as numbers or percentages. Two-group comparisons were conducted via independent-samples t tests or chi-square tests. A p value less than 0.05 was considered to indicate statistical significance.
There were no significant differences in age, sex, or disease course between the two groups, but there were significant differences in body mass index (BMI) or FBG and HbA1c levels between the two groups, as shown in Table 1.
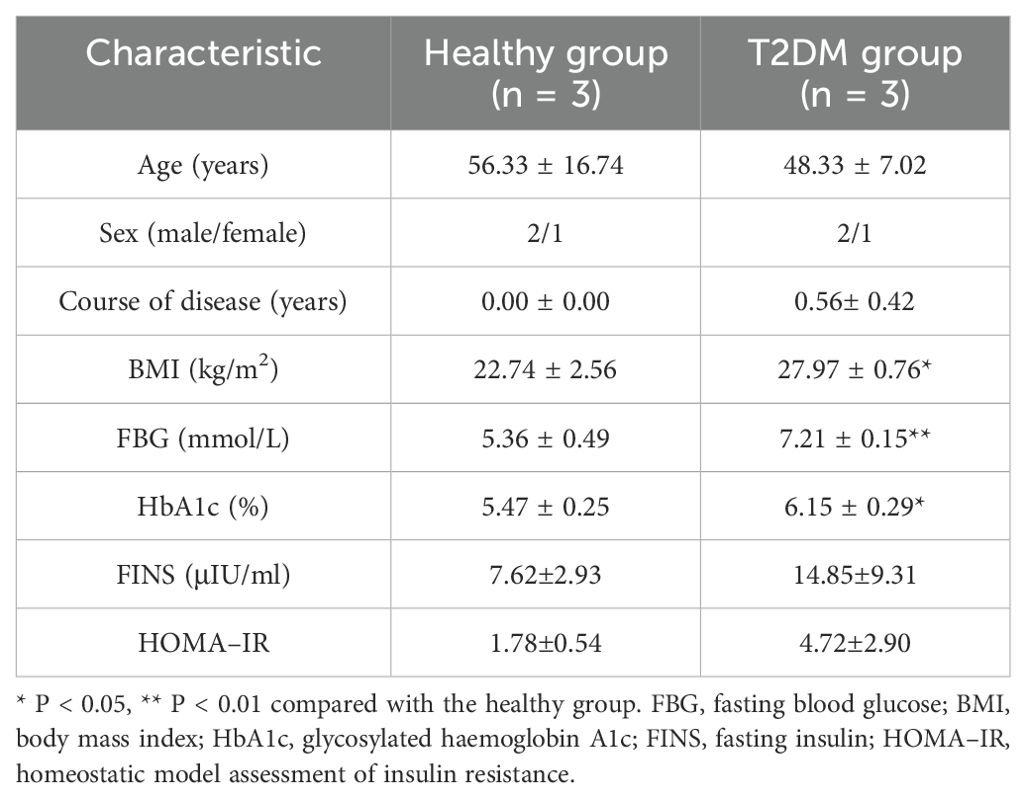
Table 1. Baseline clinical information.
After quality control and filtering, 13,591 cells remained for analysis. Unsupervised clustering of single-cell data after normalization and aggregation was performed via Seurat 3.2.0. Four cell types were identified (Figure 3A). We annotated the cell types according to the expression of classic marker genes, and the classic genes that were differentially expressed in those cells were consistent with the annotations (Figure 3B). The percentages of the 4 cell types in patients with T2DM and healthy participants are shown in Figure 3C.
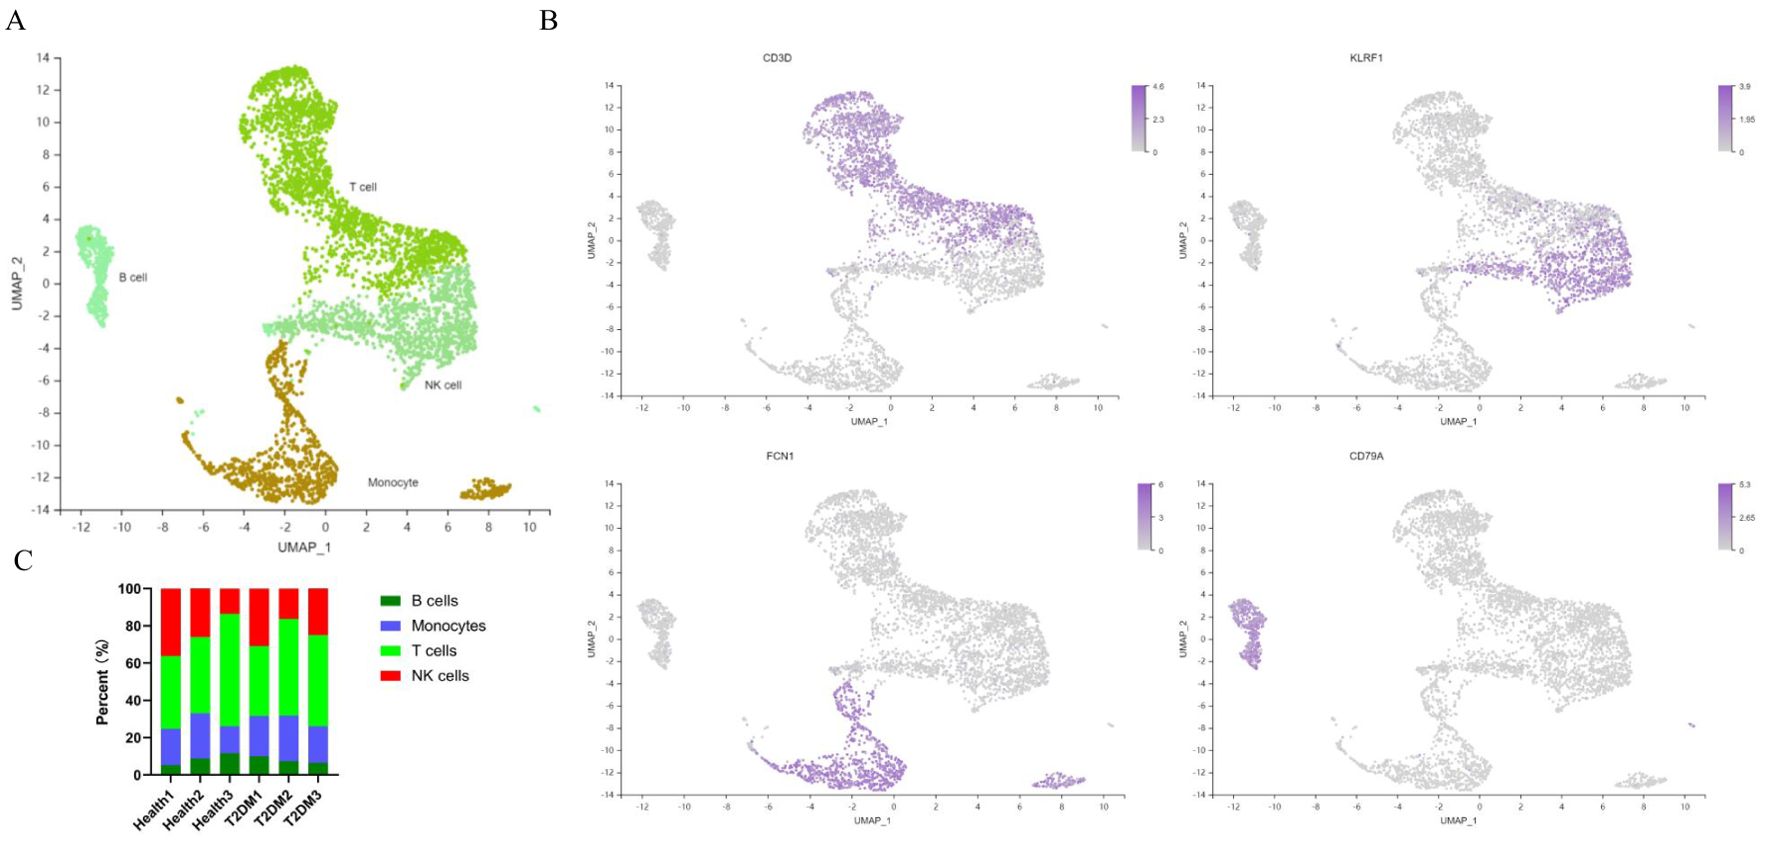
Figure 3. Cell atlas of immune infiltrates in PBMCs. (A) UMAP plot of immune cell clusters. (B) Classic marker genes for each cell type. (C) Each sample corresponds to the cell type in each cluster. PBMCs, peripheral blood mononuclear cells; UMAP, uniform manifold approximation and projection. n=3 in each group.
A total of 20,092 genes were identified in the 6 samples. Among the 4 cell types, T cells expressed the most genes (Figure 4A). A total of 3188 marker genes in the two groups were annotated to the KEGG metabolic pathway (Figure 4B). According to the KEGG pathway term level 2, 7 endocrine and metabolic diseases and 9 signal transduction pathways were screened (Figures 4C, D). In contrast, the presence of 11 marker genes, including PKM, MAPK1, MAPK3, PIK3R1, HK1, HK3, INSR, PIK3CD, SOCS1, IRS2 and TNF, was associated with T2DM status. Pathways with significant differences included the NF-κB, HIF-1 and TNF signalling pathways. Notably, the gene set enrichment analysis (GSEA) results also revealed the pathways with the greatest differences in the TNF signalling pathway (Figure 4E).
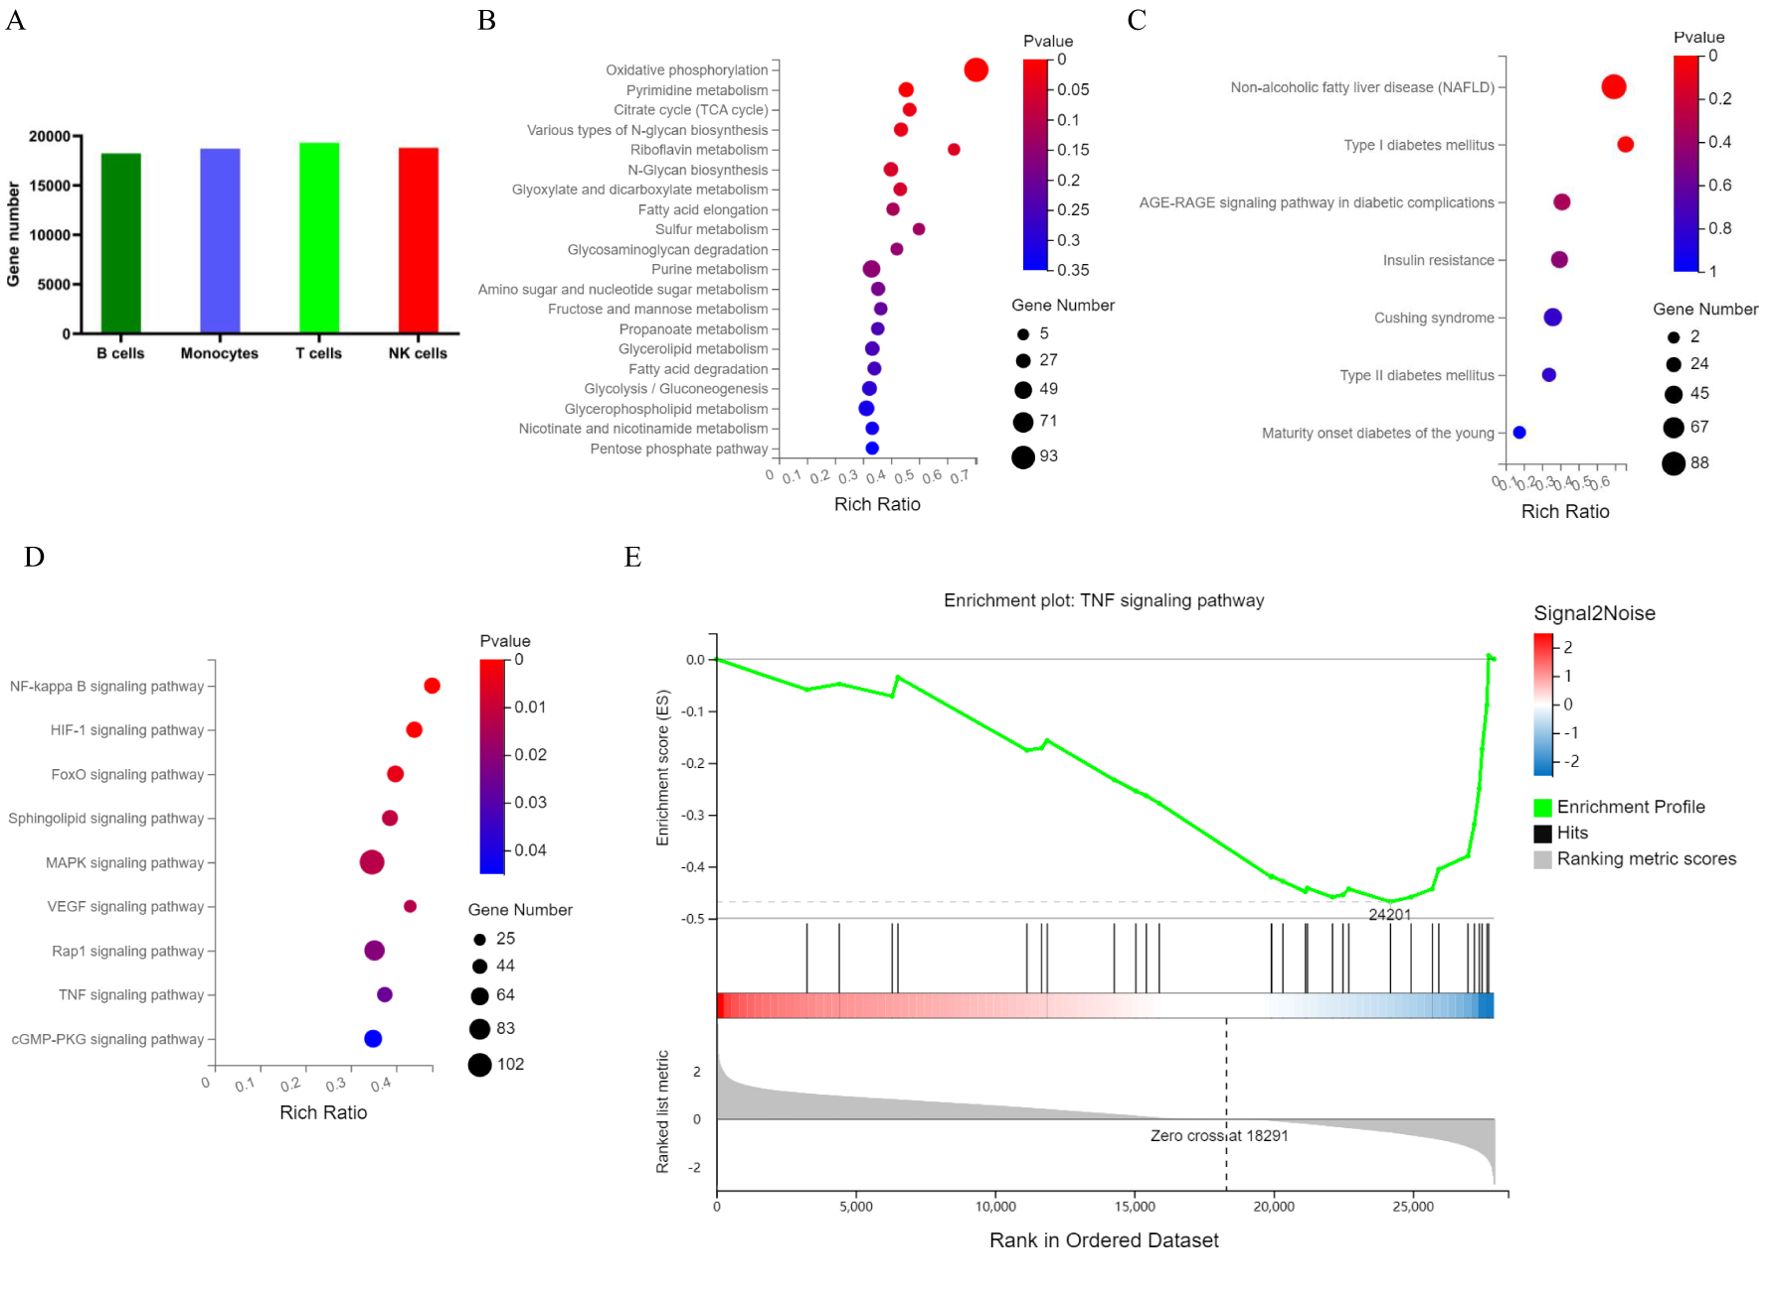
Figure 4. Map of PBMC genes and marker genes in T2DM patients. (A) The number of genes in each cluster. (B) KEGG metabolic pathways enriched with marker genes. (C) KEGG pathways enriched in marker genes of endocrine and metabolic diseases. (D) KEGG pathways enriched in marker genes of signal transduction pathways. (E) GSEA of PBMCs by marker genes. PBMCs, peripheral blood mononuclear cells; KEGG, Kyoto Encyclopedia of Genes and Genomes; GSEA, gene set enrichment analysis. n=3 in each group.
T cells are the main specific immune cells found in patients with T2DM. Unsupervised clustering of T cells revealed two CD4+ T-cell clusters (including 3127 cells) and three CD8+ T-cell clusters (including 3678 cells) (Figure 5A). T cells were annotated separately by canonical genes, and the expression of the canonical genes of these cell types was consistent with the annotation (Figure 5B). There were 387 marker genes found in CD4+ T cells and 684 marker genes in CD8+ T cells. The genes in CD4+ and CD8+ T cells were analysed, and the transcription signal score was calculated. The results suggested that CD4+ T cells in T2DM patients tended to be in memory and naïve states, whereas CD8+ T cells tended to be in effector and memory states (Figure 5C).
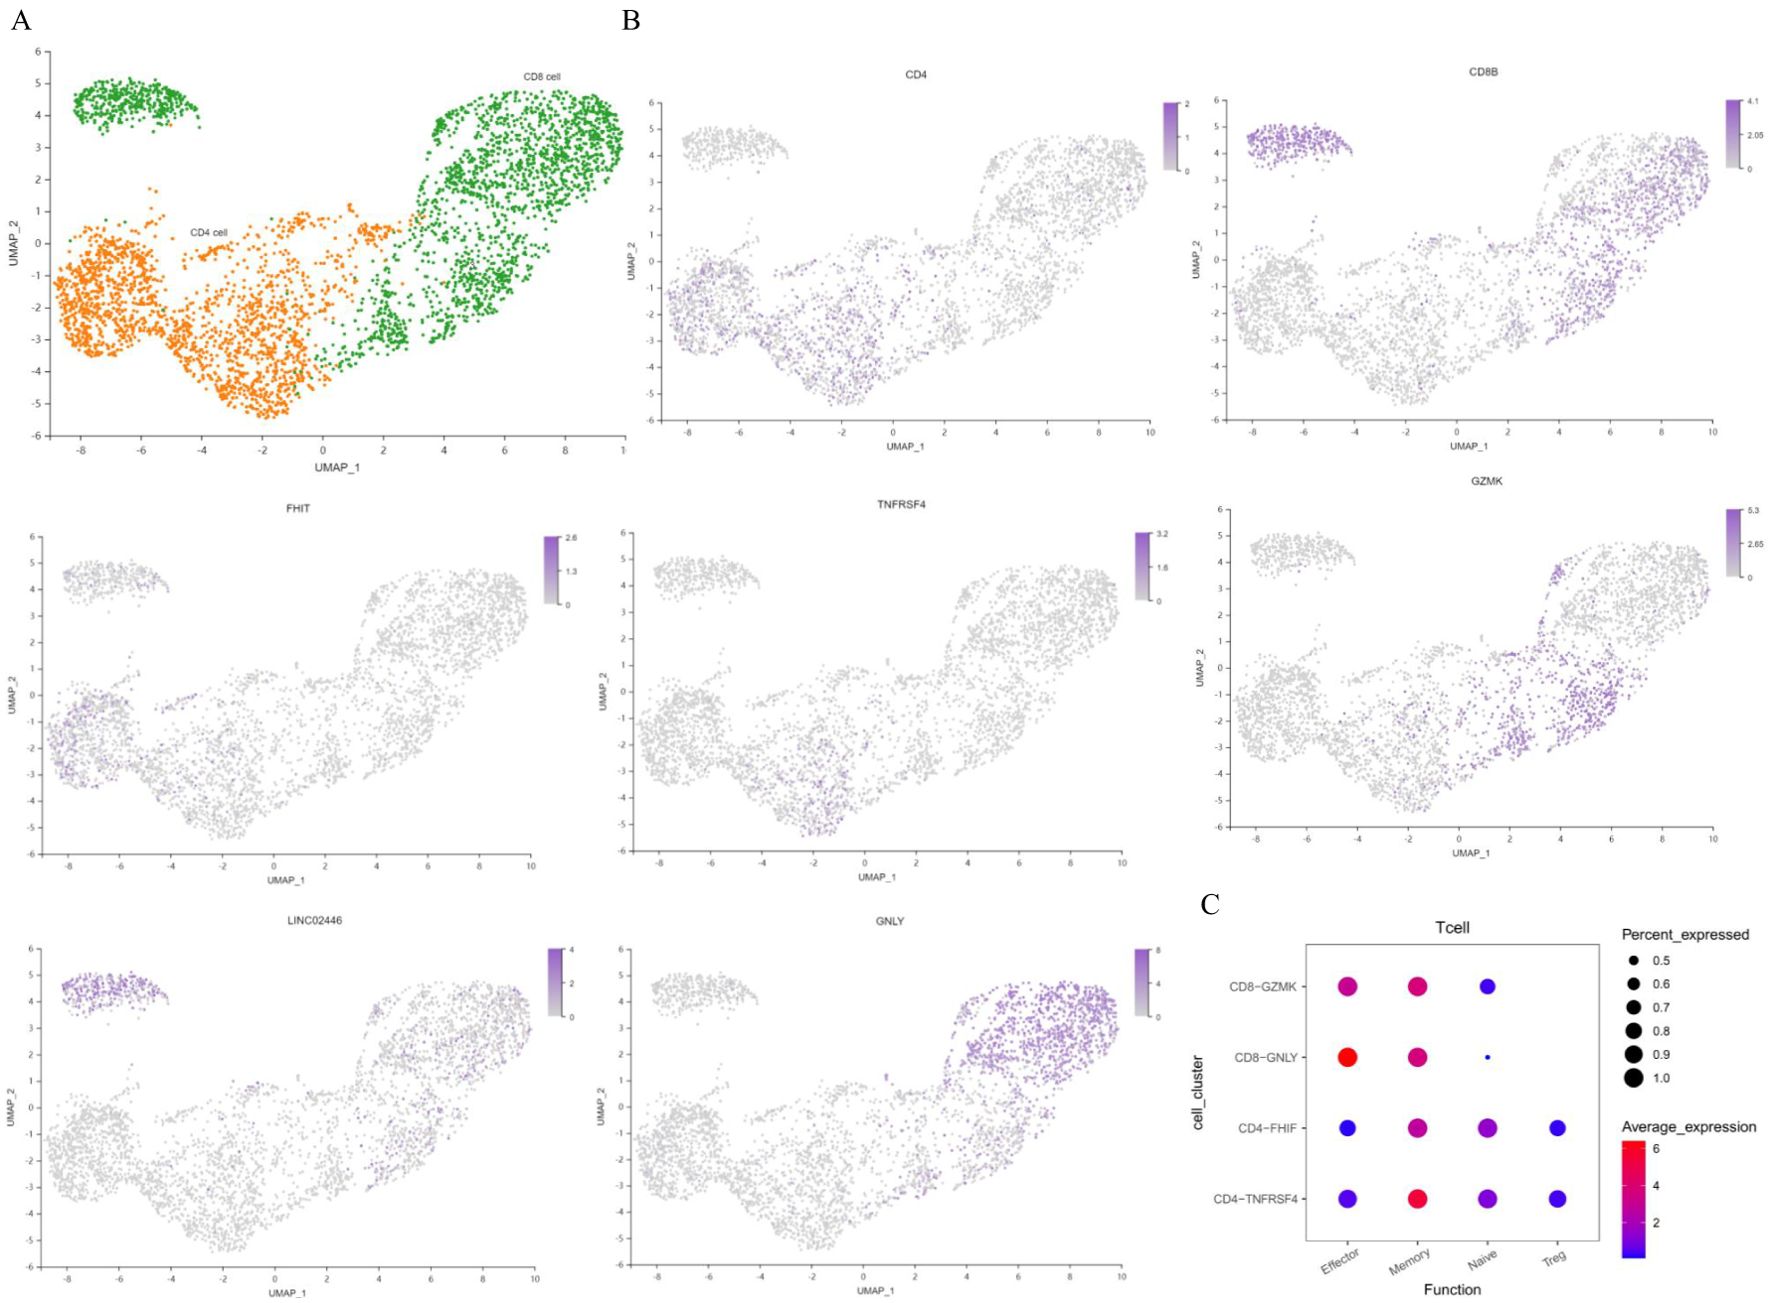
Figure 5. Characterization of T cells. (A) UMAP plot of T cells. (B) Feature map showing the marker genes for various cell types. (C) Dot plot of representative activation stage signatures in T-cell clusters. UMAP, uniform manifold approximation and projection. n=3 in each group.
The differences in the expression levels of genes between the T2DM group and the healthy group were compared to construct a volcano plot (Figure 6A). Among these genes, 58 were upregulated, and 61 were downregulated in T cells in the T2DM group. We then conducted a correlation analysis between the DEGs and clinical characteristics. The expression levels of RPL27, TXN1P and RPL37 were negatively correlated with HbA1c. The MNDA of genes was negatively correlated with FBG levels, and the expression levels of DDX5 were positively correlated with FBG levels. The expression levels of GIMAP7 were positively correlated with HOMA–IR levels (Figure 6B). GO analysis revealed that the biological process (BP) terms enriched among the DEGs were related mainly to leukocyte chemotaxis, cytoplasmic translation, positive regulation of the apoptotic signalling pathway, myeloid cell activation involved in the immune response, the T-cell receptor signalling pathway, and the immune response-regulating signalling pathway. The enriched cellular component (CC) terms were associated mainly with the cytosolic large ribosomal subunit, ribosome, cytosolic ribosome, tertiary granule membrane, and cell–substrate junction. The molecular function (MF) terms were specifically related to structural constituents of ribosome, Toll−like receptor binding, RAGE receptor binding, phospholipase inhibitor activity, and cell–cell adhesion mediator activity (Figures 6C, D). The first gene set, HALLMARK_TNFA_SIGNALING_VIA_NFKB, was used to generate a GSEA graph via HALLMARK pathway enrichment analysis (Figure 6E). The WGCNA results revealed that the genes were divided into 7 modules. According to the correlation analysis between clinical characteristics and the 7 modules, FBG levels were significantly positively correlated with the brown module. FINS and HOMA–IR levels were significantly and positively correlated with the turquoise and blue modules. With respect to the base genes with differences and the brown module, we found that HLA-DRB5, AHNAK, TYROBP and AIF1 were shared genes (Figure 6F). The KEGG results revealed that genes in the brown and turquoise modules were involved in the TNF signalling pathway, T-cell receptor signalling pathway and NF-κB signalling pathway (Figure 6G). Moreover, TNFRSF1A was the core gene in terms of network interactions in the brown module (Figure 6H).
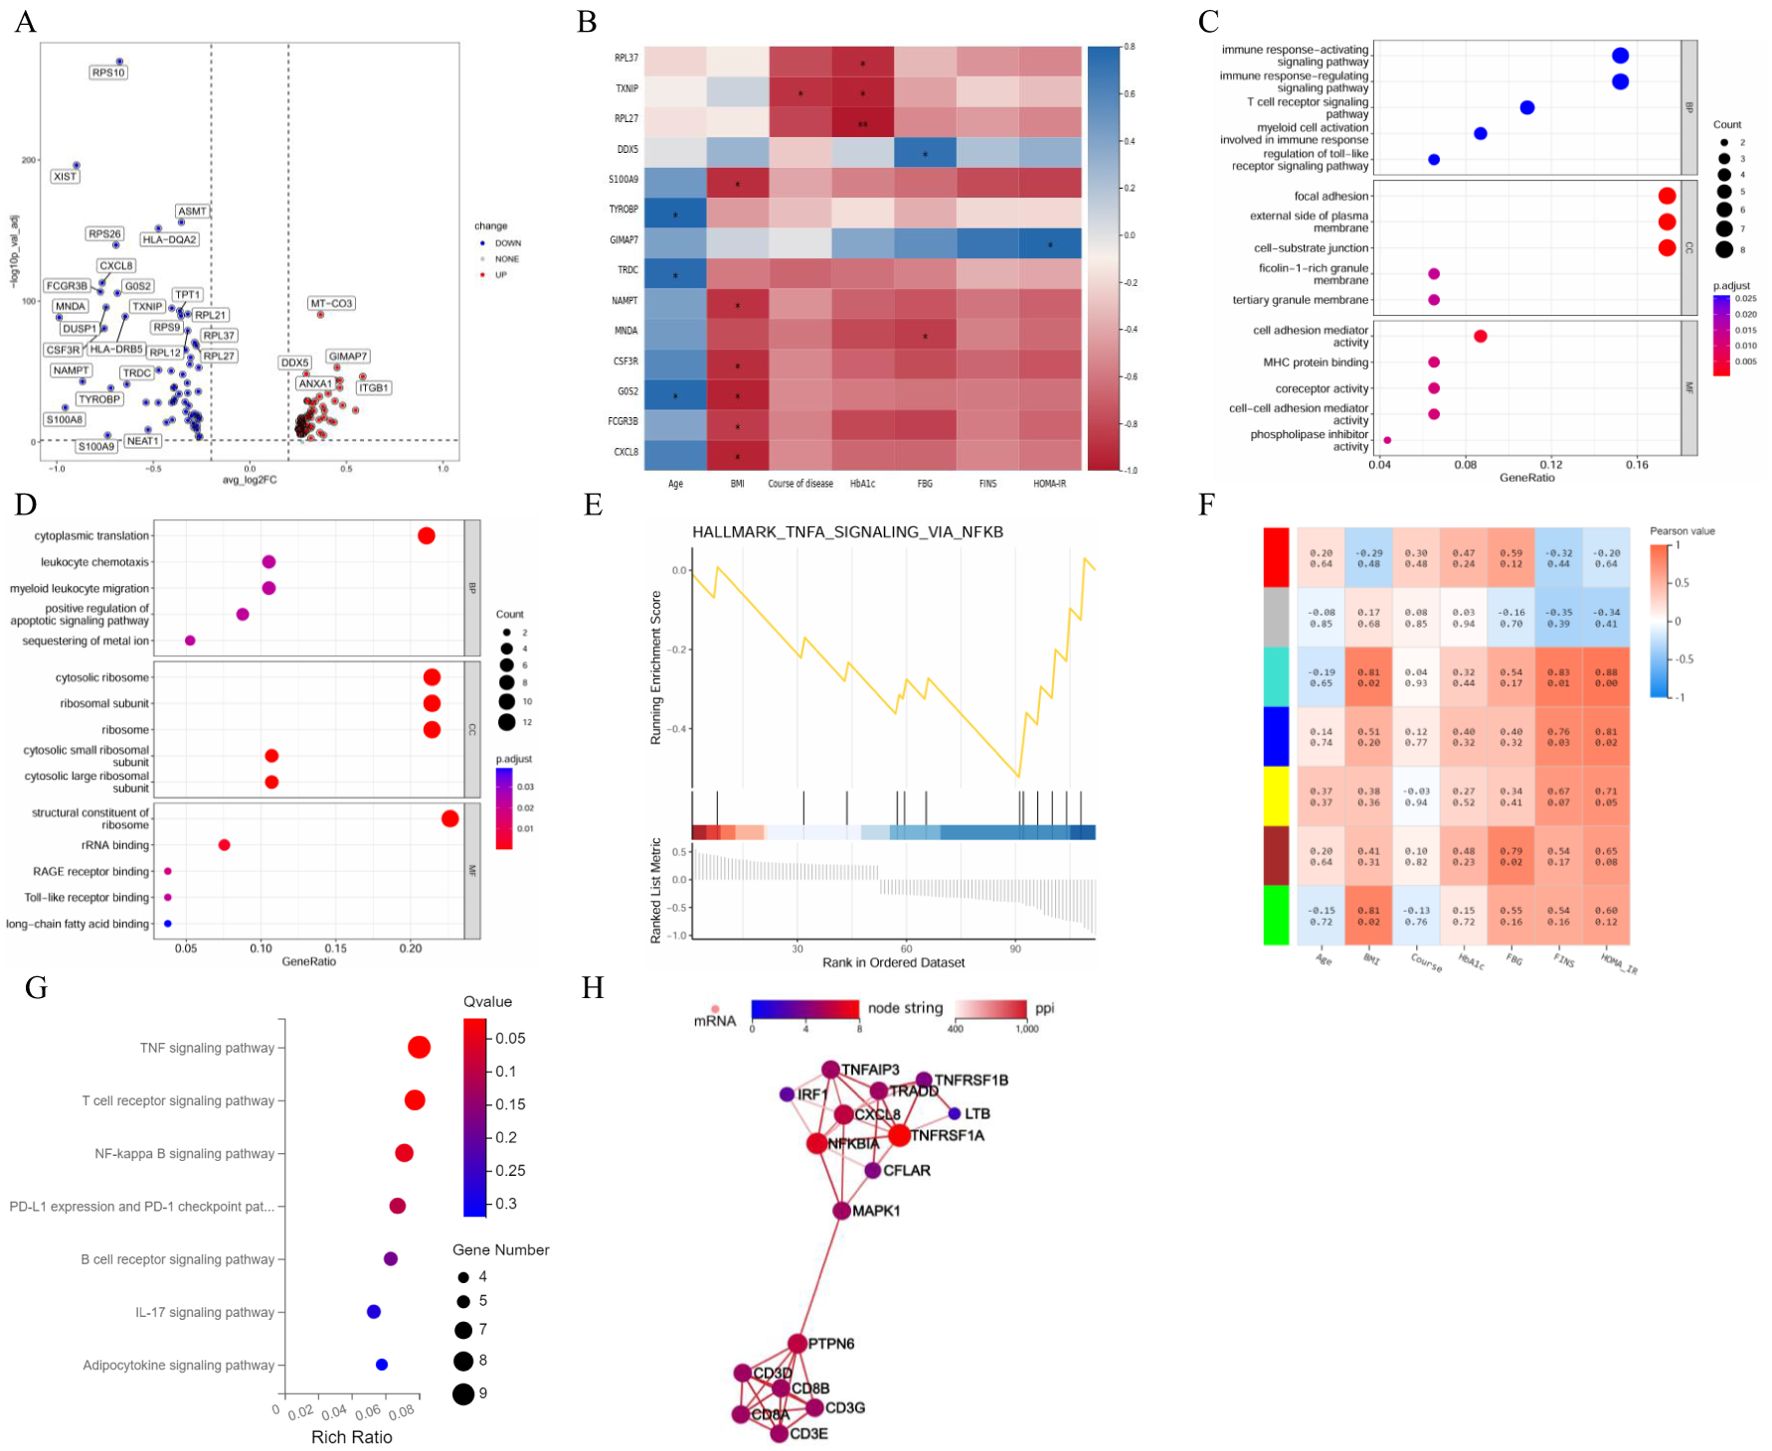
Figure 6. Integrated analysis of T cells. (A) Volcano plot showing the DEGs expressed in T cells. (B) Correlation analysis between DEGs and clinical characteristics. (C) GO enrichment analysis of upregulated marker genes. (D) GO enrichment analysis of downregulated marker genes. (E) GSEA enrichment analysis of DEGs. (F) Correlation analysis between clinical characteristics and each module. (G) KEGG pathways in the brown and turquoise modules. (H) Core genes by network interaction in the brown module. DEGs, differentially expressed genes; GSEA, gene set enrichment analysis; GO, Gene Ontology; KEGG, Kyoto Encyclopedia of Genes and Genomes; PPI, protein–protein interaction; BP, biological process; CC, cellular component; MF, molecular function. n=3 in each group.
We further analysed the cell cycle stages of T cells from healthy participants and T2DM patients. Compared with those in healthy participants, the T cells in T2DM patients were more likely to be in the G1, S and G2M states, indicating active proliferation (Figures 7A, B). The expression of the 50 top genes varied with developmental time. These genes are associated with cytoplasmic translation, cell–cell adhesion mediated by integrins, and regulation of the inflammatory response (Figure 7C). The results revealed the dynamic expression of 6 marker genes in CD4+ T cells, and different expression levels were observed at the seven stages of disease progression. The expression of the RPL32, RPS10, RPS12, RPS14 and RPS23 genes tended to increase, whereas S100A4 expression tended to decrease (Figure 7D).
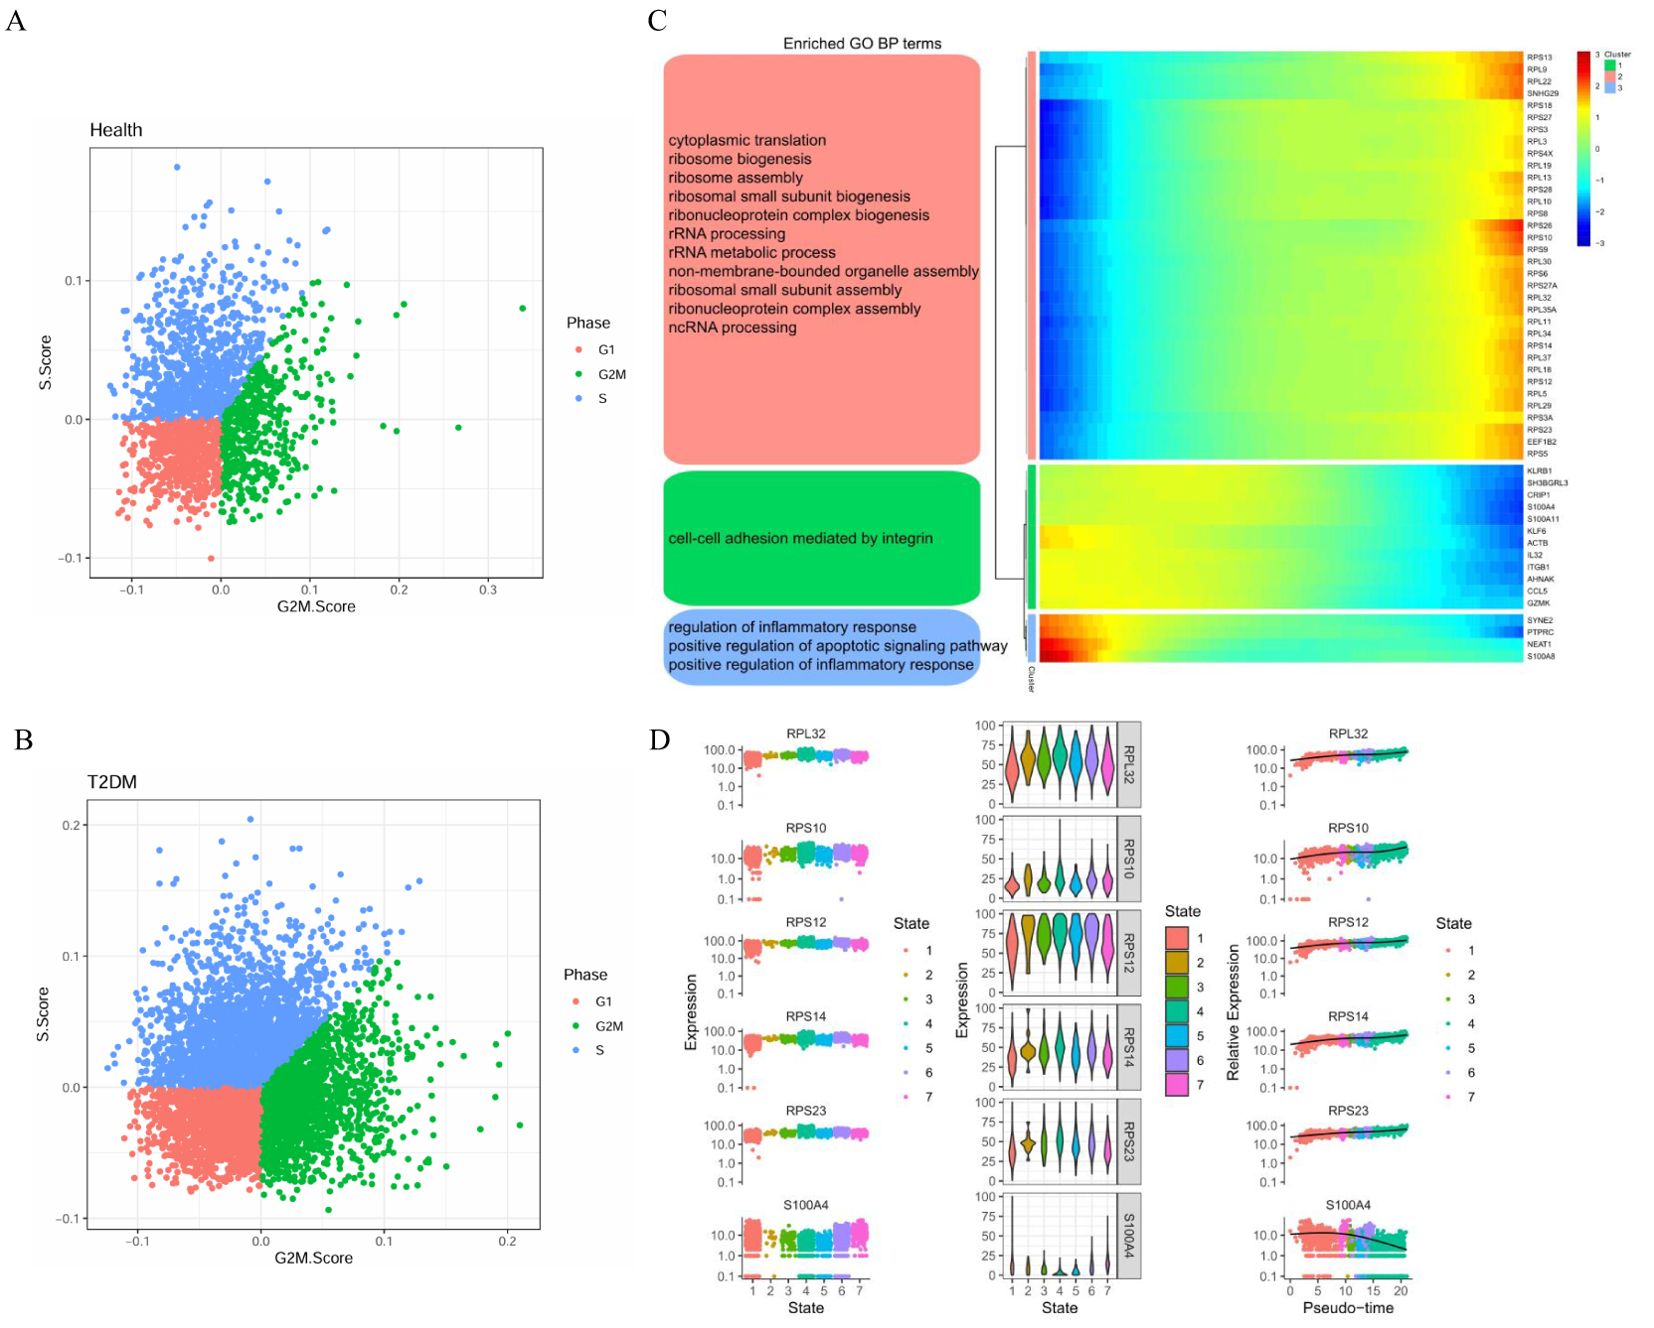
Figure 7. Cell cycle stages and gene expression with developmental time in T cells. (A) Cell cycle distribution of T cells in health group. (B) Cell cycle distribution of T cells in T2DM group. (C) Heatmap showing the dynamic gene expression of T cells and the GO analysis results. (D) Dynamic expression of the top genes in CD4+ T cells. T2DM, Diabetes mellitus; BP, biological process; GO, Gene Ontology. n=3 in each group.
Monocytes were the most abundant nonspecific immune cells in our T2DM patient cohort. Unsupervised clustering revealed two dendritic cell clusters (including 233 cells), CD14+ monocyte clusters and FCGR3A+ monocyte clusters (including 2568 cells) (Figure 8A). Monocytes were annotated separately by canonical genes, and the canonical expression of genes in these cell types was consistent with the annotation (Figure 8B). There were 666 marker genes in monocytes and 776 in dendritic cells.
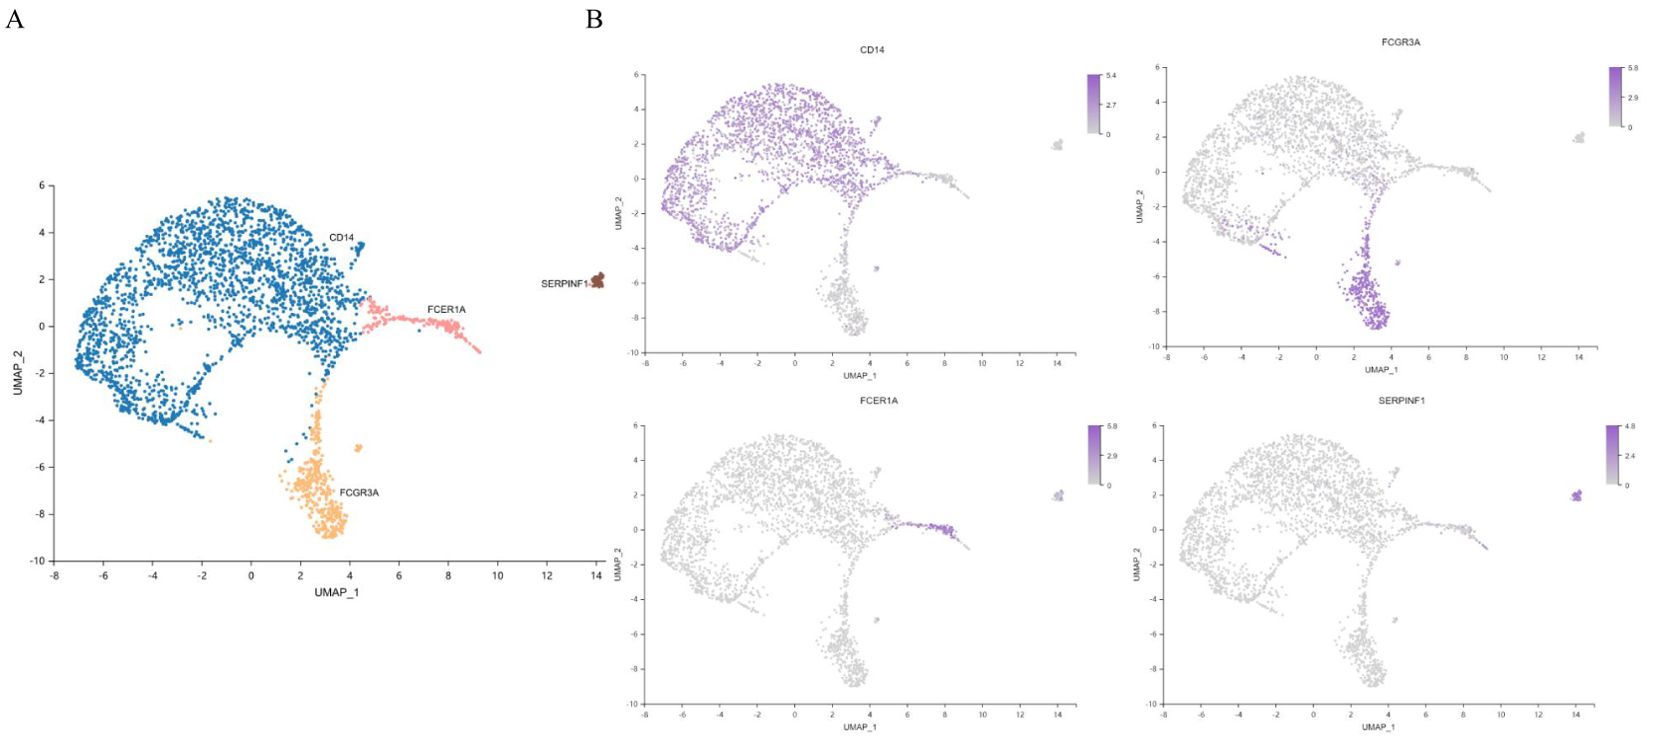
Figure 8. Characterization of monocytes. (A) UMAP plot of monocytes. (B) Feature map showing the marker genes for each cell type. UMAP, uniform manifold approximation and projection. n=3 in each group.
The differences in monocyte gene expression between the T2DM group and the healthy group were compared to construct a volcano plot (Figure 9A). Among these genes, 51 presented upregulated expression, and 124 presented downregulated expression. The expression levels of the CLEC7A, SIGLEC14 and AC018755.4 genes were negatively correlated with HbA1c levels. The expression level of VSTM1 was negatively correlated with FINS and HOMA–IR levels (Figure 9B). The GO results revealed that the enriched CC terms included mainly cytosolic ribosome, cell−substrate junctions, focal adhesion and tertiary granules. The enriched MF terms were specifically related to the structural constituents of ribosome, enzyme inhibitor activity, S100 protein binding, cytokine activity and cytokine binding (Figures 9C, D). The first gene set, HALLMARK_INTERFERON_GAMMA_RESPONSE, was utilized to generate a GSEA graph via HALLMARK pathway enrichment analysis (Figure 9E). The WGCNA results revealed that the genes were divided into 7 modules. FBG levels were significantly and negatively correlated with the red module. FINS and HOMA–IR levels were significantly negatively correlated with the brown module and the turquoise module. With respect to the base DEGs and the brown module, CLEC2B, B2M and MALAT1 were identified as shared genes (Figure 9F). According to the KEGG results, the genes in the red module were involved in the chemokine signalling pathway (Figure 9G).
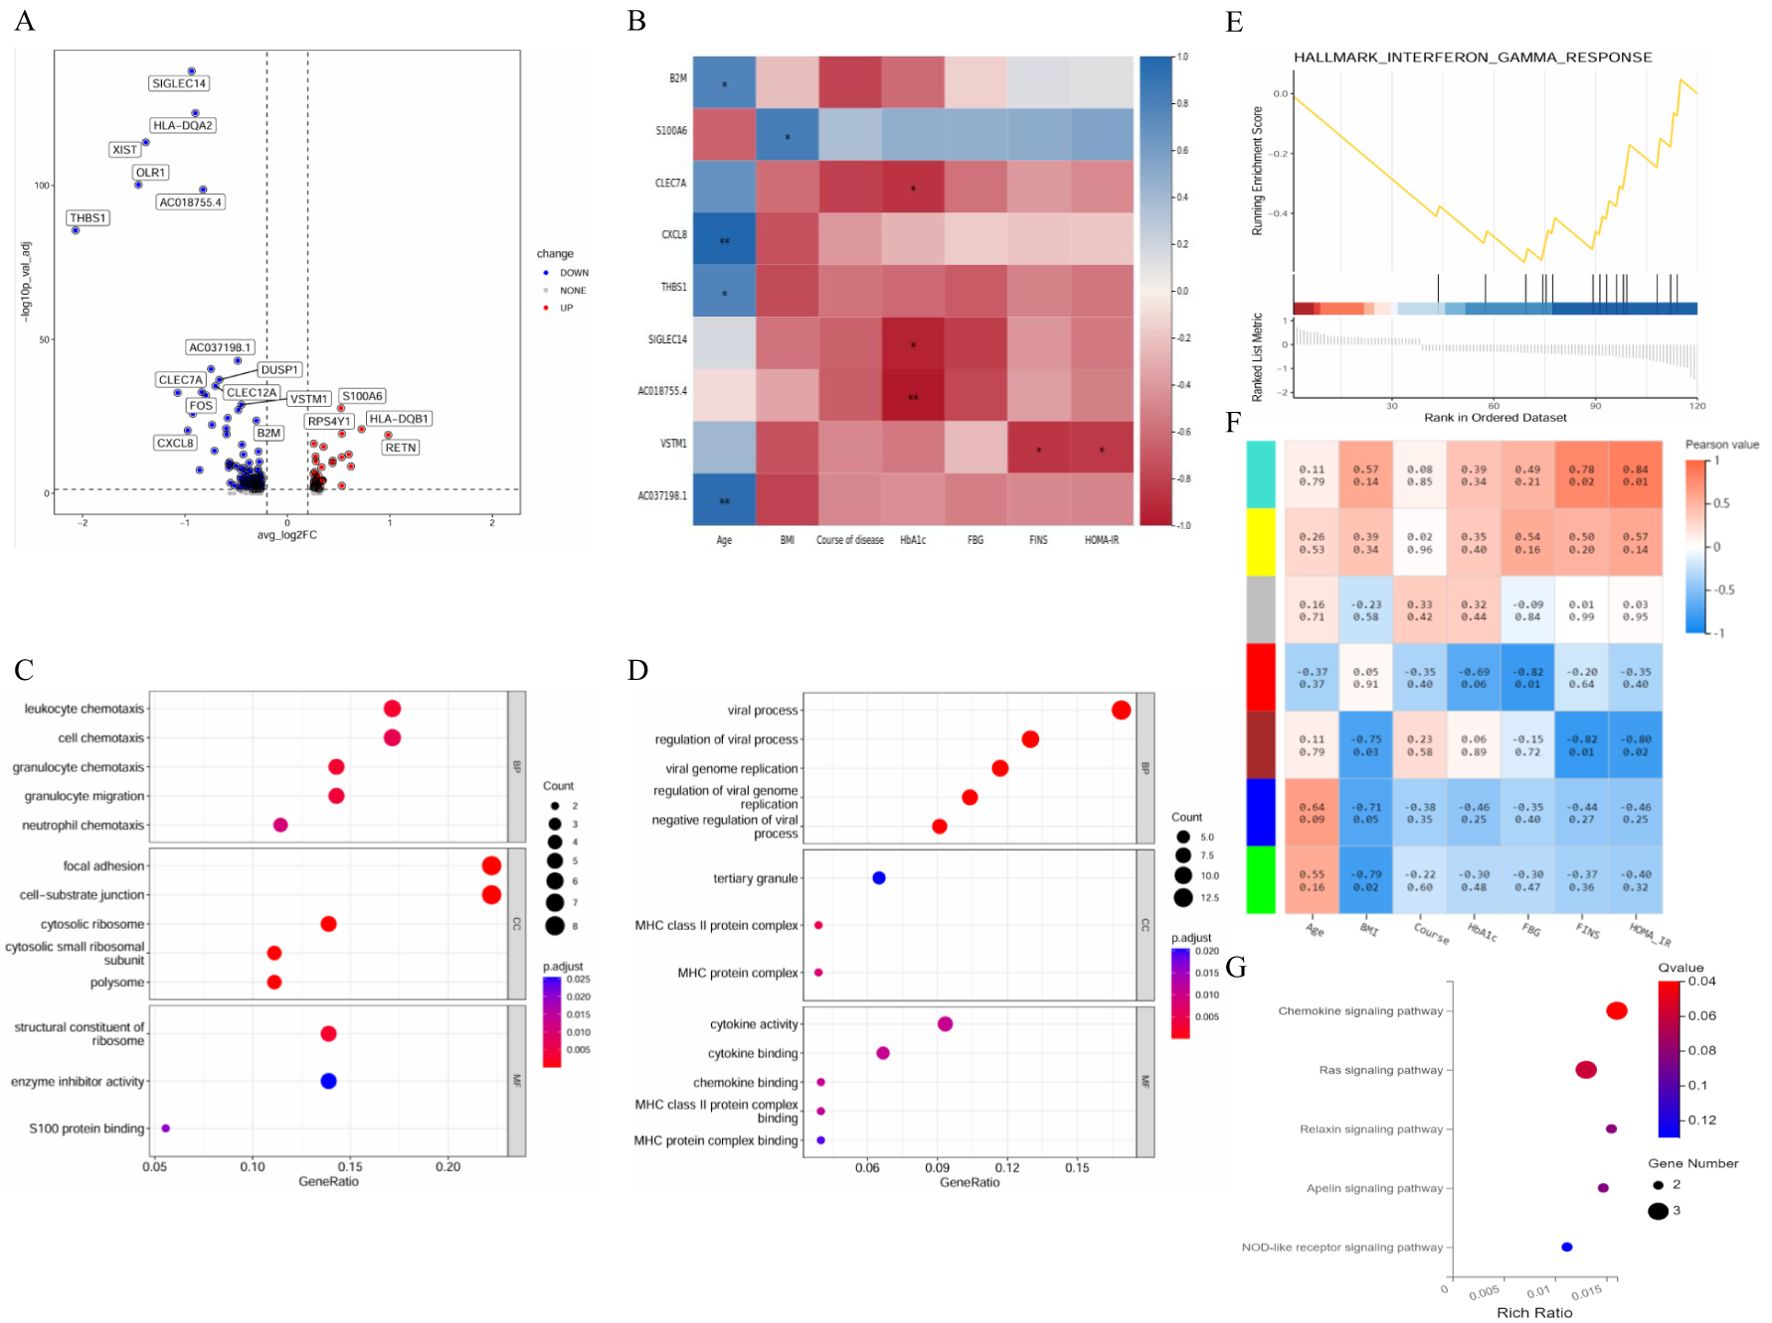
Figure 9. Integrated analysis of monocytes. (A) Volcano plot showing the DEGs in monocytes. (B) Correlation analysis between DEGs and clinical characteristics. (C) GO enrichment analysis of upregulated marker genes. (D) GO enrichment analysis of downregulated marker genes. (E) GSEA enrichment analysis of DEGs. (F) Correlation analysis between clinical characteristics and each module. (G) KEGG pathways in the red–turquoise module. DEGs, differentially expressed genes; GSEA, gene set enrichment analysis; GO, dene ontology; KEGG, Kyoto Encyclopedia of Genes and Genomes; BP, biological process; CC, cellular component; MF, molecular function. n=3 in each group.
We further analysed the cell cycle stages of monocytes from healthy participants and T2DM patients. In healthy participants, monocytes were common in the G1, S and G2M states, indicating more active proliferation in T2DM patients than in healthy participants (Figure 10A, B). The top-50 genes whose expression varied with developmental time were associated with the negative regulation of hydrolase activity, neutrophil migration, and polyamine biosynthetic processes and the positive regulation of cytokine production (Figure 10C). The results revealed the dynamic expression of 6 marker genes in CD14+ monocytes, and different expression levels were observed at the three stages of disease progression. The expression levels of the C1QA, HES4 and RHOC genes tended to increase, whereas the S100A12, S100A8, and S100A9 expression levels tended to decrease (Figure 10D).
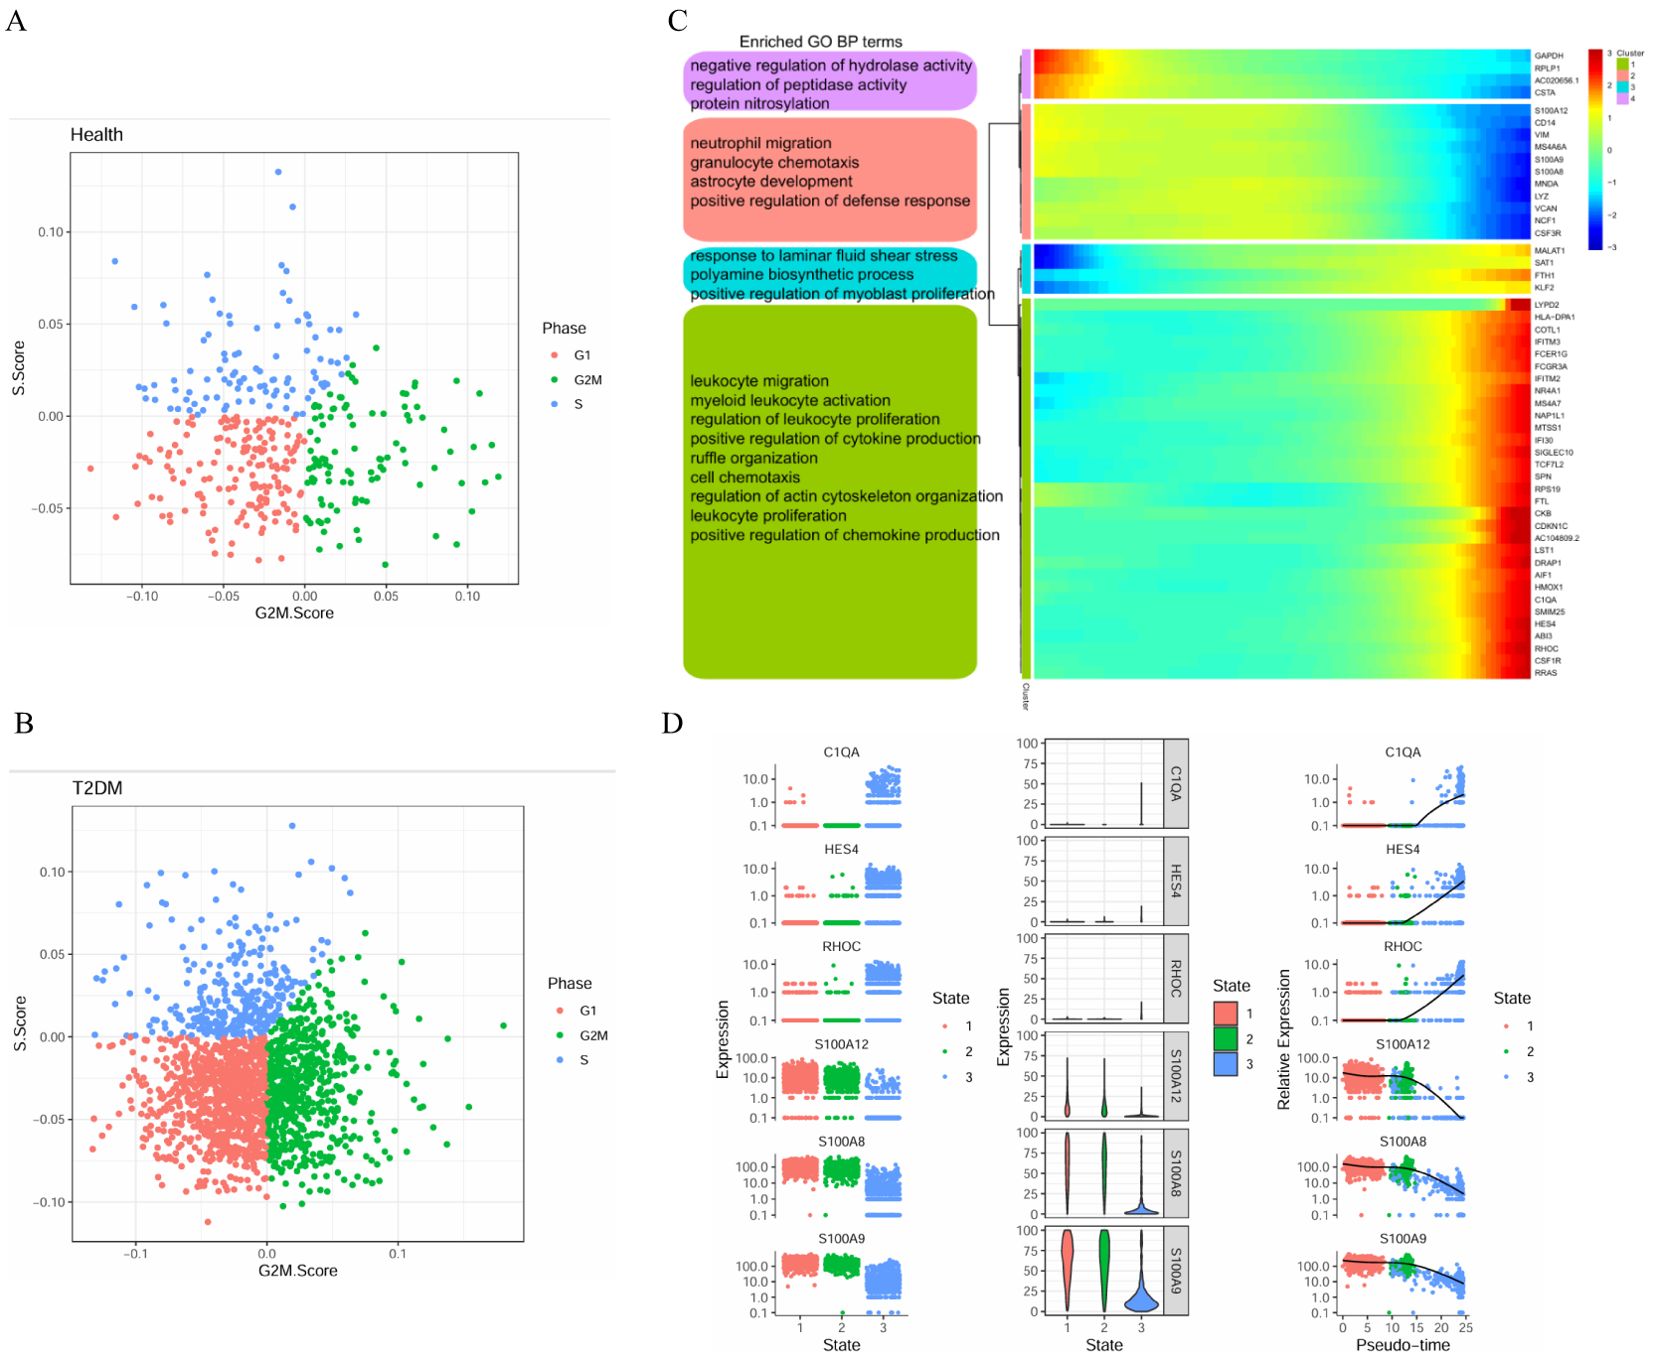
Figure 10. Cell cycle stages and gene expression in monocytes with developmental time. (A) Cell cycle distribution of monocytes in health group. (B) Cell cycle distribution of monocytes in T2DM group. (C) Heatmap showing the expression of genes related to monocytes dynamics and the GO analysis results. (D) Dynamic expression of the top genes in CD14+ monocytes. T2DM, Diabetes mellitus; BP, biological process; GO, Gene Ontology. n=3 in each group.
Compared with T1DM status, T2DM status is associated with a greater incidence, longer duration, and greater severity of complications. scRNA-seq is widely used to characterize the basic properties of cells, and the regulation of islet cells by a subpopulation of surrounding cells has been reported in patients with DM (23, 24). Since islet cells are difficult to obtain from the human body, systematically elucidating the regulation of PBMCs in patients with T2DM is important. Previous studies have suggested that the pathogenesis of T2DM involves the immune system (8, 25).
Single-cell clustering analysis revealed that the cell clusters were annotated to 4 different cell types. On the basis of the expression levels of genes associated with endocrine and metabolic diseases, KEGG enrichment analysis revealed that these genes are involved in oxidative phosphorylation, pyrimidine metabolism, the tricarboxylic acid cycle, etc. These pathways are directly or indirectly related to the development of T2DM. Both the innate immune response and adaptive immunity are involved in inflammation. Innate immunity may cause inflammation via endogenous danger signals. Adaptive immunity also provokes inflammation via cytotoxicity, cytokines and other mediators (26). There is growing evidence supporting the idea that T2DM is a chronic inflammatory disease that results in IR and hyperglycaemia (27). In this study, the stages of T-cell activation included naïve, memory, and effector T cells. CD4+ effector T cells are the main cells that exert direct immune effects. Once activated, CD4+ effector T cells and Th1 cells exhibit many significant signs and responses to immune inflammation (28). Compared with non-T2DM patients, T2DM patients had elevated percentages of CD4+ effector T cells (29). When stimulated by antigens, memory CD4+ T cells in the peripheral blood produce effector cytokines for immune protection. A high number of memory CD4+ T cells is associated with a decreased risk of developing DM (30). Regulatory T cells play a protective role against IR in the pathogenesis of T2DM (31). The accumulation of cytotoxic CD8+ effector T cells induces inflammation and IR (32). Active circulating monocytes are inflammatory effectors that might be involved in T2DM (33). In an inflammatory state, monocytes are recruited to the affected tissue. Therefore, circulating blood monocytes levels can be used as indicators of the activation of tissue immunity (34). In addition, we also need to recognize that there are still areas that need deeper investigation. For example, which immune cells in the peripheral blood are truly involved in the destruction of pancreatic islet beta cells, which T cells or monocytes can be transported to the pancreas and affect the function of beta cells, and how pancreatic beta cells and infiltrating lymphocytes interact remain to be further studied in pancreatic samples (10).
We screened several changed candidate genes in T2DM, thus providing a reference for the study of T2DM pathogenesis. Insulin can bind to its receptor, InsR, on the cell surface and undergo a series of signalling cascades to lower blood glucose levels. For example, insulin inhibits the FoxO signalling pathway and reduces gluconeogenesis activity (35). IRS2 is an insulin substrate that regulates blood glucose levels. IRS2 knockout mice exhibit IR (36, 37). HIF-1 regulates target genes involved in inflammation, and notably, increased HIF-1 signalling induces changes in monocytes that promote the development of metabolic diseases, especially glycolysis, in the livers of T2DM patients (38–40). RPL27 expression changes in capillaries (41). Moreover, it participates in glucose and lipid metabolism (42). TXN1P is differentially expressed in patients with metabolic syndrome, which includes T2DM (43). RPL37, which encodes a ribosomal protein, is the main hub gene in DM encephalopathy and has a well-documented vasoreparative capacity (44, 45). Microvascular damage caused by sustained hyperglycaemia is correlated with MNDA (46). DDX5 is differentially expressed in obese T2DM chronic wound tissue (47). CLEC7A expression may be abnormal in DM-associated inflammation (48). SIGLEC14 enhances TNF-alpha secretion, and IL-1β release may play a role in inflammation. This effect is related to lipopolysaccharides and the NLRP3 inflammasome (49, 50). There are very few reports about AC018755.4.
Jacobi reported that low expression of HLA-DRB5 was associated with an increased risk of developing T2DM (51). AHNAK influences glucose homeostasis by regulating adipose tissue insulin sensitivity and energy expenditure (52). TYROBP is a hub gene in T2DM, especially in individuals with obesity-induced DM (53). A higher CLEC-2 concentration is a risk factor for thrombotic disease in T2DM patients (54). B2M was associated with the progression of T2DM (55). MALAT1 is a potential diagnostic biomarker for T2DM (56). According to the WGCNA network interaction results, TNFRSF1A was the core gene. Among the effector genes predicted by the Type 2 Diabetes Knowledge Portal, TNFRSF1A expression levels are positively correlated with HbA1c levels (57, 58). The mechanism by which TNFRSF1A (TNFR-1 receptor) increases T2DM susceptibility is poorly understood (59). Canagliflozin modestly decreased TNFR-1 in patients with T2DM (60). T2DM is a chronic inflammatory disease, and hyperglycaemia status and NFKB1A expression levels are closely connected (61). Among the detected genes, the expression levels of GIMAP7, HLA-DQB1 and RPL37 were related to triglyceride levels in individuals without T2DM. A previous study revealed that the causal association of triglyceride levels with DM is more obvious in young, middle-aged and nonobese people with T2DM (62). Another study investigated the relationship between HLA-DQB1 expression levels and T1DM risk and reported that HLA-DQB1 expression levels were associated with susceptibility and protective effects in T2DM patients (63). The genetic characteristics of individuals with T1DM and T2DM might include common HLA targets. HLA-DRB5 expression levels are related to T2DM status, HbA1c levels and diabetic retinopathy status, and the downregulation of HLA-DRB5 expression is associated with an increased risk of developing T2DM (51). RPL12 expression levels are related to FBG levels and BMI (64). RPS10 expression levels are related to HbA1c levels and diabetic retinopathy status (65). XIST, HLA-DQA2 and CXCL8 are common DEGs between monocytes and T cells. HLA-DQA2 expression levels are related to insulin-like growth factor (IGF) levels and neuropathy status in T2DM patients (66). HALLMARK_INTERFERON_GAMMA_RESPONSE and HALLMARK_TNFA_SIGNALING_VIA_NFKB are closely associated with the oxidative stress response (67, 68). The expression levels of genes in these pathways are significantly influenced by the occurrence and development of T2DM. Inflammatory cytokines involved in the TNFA signalling pathway regulate the insulin signalling pathway through serine phosphorylation to reduce T2DM severity (69). In addition, the T-cell receptor signalling pathway may be a pathological mechanism for GDM (70), and the T2DM phenotype of GK rats may be closely related to the T-cell receptor signalling pathway (71). Studies have revealed that the NF-κB signalling pathway is involved in the pathobiology of T2DM (72). Metformin and liraglutide effectively (beneficially) modulate immune-related NF-κB and TNFA signalling (73). The chemokine signalling pathway is involved in islet β-cell damage (74) and influences the onset and progression of T2DM (75).
The 50 genes whose expression varied with developmental time were divided into 4 clusters associated with lymphocyte-mediated immunity, protein folding, immunoglobulins and cytoplasmic translation. In T2DM patients, vascular calcification has been associated with increased S100A9 expression, which promotes the release of extracellular vesicles with a high propensity for calcification from monocytes (76). Under hyperglycaemic conditions, islets trigger an inflammatory response associated with increased expression of S100A8 (77). Research has shown that plasma S100A12 levels are higher in patients with T2DM than in patients without DM. Stepwise multiple regression analyses revealed that S100A12 may be involved in chronic inflammation in T2DM patients (78). SH3BGRL3 expression levels are closely related to IGF-1 levels. IGF-1 effectively stimulates glucose uptake into muscle tissue and increases glucose metabolism throughout the body; thus, IGF-1 can lower blood glucose levels by reducing IR (79). Increased RPS10 expression, which is driven by the maternal allele, has been shown to be a risk factor for paediatric-onset T2DM (65).
We performed scRNA-seq analysis to generate a transcriptional map of immune cells from PBMCs, thus providing a framework for understanding the immune status of T2DM patients. In addition, we explored the immune state of T cells and monocytes from many perspectives. Analysis of the target genes revealed that they were differentially expressed in each of the two groups, revealing potential key genes such as TNFRSF1A. These factors may be important in the pathogenesis and development of T2DM immunity in PBMCs. These findings may provide new insights into the treatment of T2DM. Our study also has limitations that should be noted. The sample size of this study is relatively small, and there may be some bias in the results due to factors such as the severity of the patient’s condition, large age differences, and being conducted at a single research centre. In the future, we will further validate these results through multicentre clinical trials with larger sample sizes that can also include correlation analysis with pancreatic samples from patients with T2DM. Research on the interactions of different types of immune cells may be valuable for the dissection of clinical mechanisms and treatments. Molecular biology experiments should be performed to validate the mechanisms of the genes related to immunity in T2DM. Moreover, we will identify drugs that may affect these genes and observe their clinical effects through intervention.
The sequence data were obtained from the National Center for Biotechnology Information (NCBI) under the GEO accession number GSE255566. The other data are not publicly available because they contain information that could compromise the privacy of T2DM patients. Deidentified participant data supporting the published results, the study protocol, and the statistical analysis plan are available from the corresponding author reasonable request.
The studies involving humans were approved by the Ethics Committee of the First Affiliated Hospital of Anhui University of Traditional Chinese Medicine. The studies were conducted in accordance with the local legislation and institutional requirements. Written informed consent for participation in this study was provided by the participants’ legal guardians/next of kin.
JZ: Writing – original draft. ZF: Writing – review & editing.
This manuscript was previously published as a preprint at https://biorxiv.org/cgi/content/short/ 2024.01.04.574155v1. The doi is https://doi.org/10.1101/2024.01.04.574155.
The author(s) declare financial support was received for the research, authorship, and/or publication of this article. This study was supported by open bidding for selecting the best candidates for Xin’an Medicine and the Modernization of Traditional Chinese Medicine of IHM (2023CXMMTCM024 and 2023CXMMTCM003), the University Scientific Research Project of Anhui (2023AH050782), the National Natural Science Foundation of China (82474431), the Scientific Research Project of Health and Wellness in Anhui Province (AHWJ2023BAc10002), the Anhui Province Outstanding Talents Cultivation Project for Universities (2022-371), Anhui Province Clinical Medical Research Transformation Project (202427b10020046), the Anhui Province Health Backbone Talents Cultivation Object (2022-392) and Anhui University Collaborative Innovation Project (GXXT-2020-025).
The authors thank the researchers who provided the original data in the open single-cell datasets. In addition, the members of the research groups played important roles, and BGI Genomics provided technical assistance.
The authors declare that the research was conducted in the absence of any commercial or financial relationships that could be construed as a potential conflict of interest.
The author(s) declare that no Generative AI was used in the creation of this manuscript.
All claims expressed in this article are solely those of the authors and do not necessarily represent those of their affiliated organizations, or those of the publisher, the editors and the reviewers. Any product that may be evaluated in this article, or claim that may be made by its manufacturer, is not guaranteed or endorsed by the publisher.
1. Chiou J, Geusz RJ, Okino ML, Han JY, Miller M, Melton R, et al. Interpreting type 1 diabetes risk with genetics and single-cell epigenomics. Nature. (2021) 594:398–402. doi: 10.1038/s41586-021-03552-w
2. Onengut-Gumuscu S, Chen WM, Burren O, Quinlan JCCooper NJ, Mychaleckyj AR, JC, et al. Fine mapping of type 1 diabetes susceptibility loci and evidence for colocalization of causal variants with lymphoid gene enhancers. Nat Genet. (2015) 47:381–6. doi: 10.1038/ng.3245
3. Li Y, Teng D, Shi X, Qin G, Qin Y, Quan H, et al. Prevalence of diabetes recorded in mainland China using 2018 diagnostic criteria from the American Diabetes Association: national cross sectional study. BMJ. (2020) 369:m997. doi: 10.1136/bmj.m997
4. Gheibi S, Singh T, da Cunha JPMCM, Fex M, Mulder H. Insulin/glucose-responsive cells derived from induced pluripotent stem cells: disease modeling and treatment of diabetes. Cells. (2020) 9:2465. doi: 10.3390/cells9112465
5. Chen C, Xiang Q, Liu W, Liang S, Yang M, Tao J. Co-expression network revealed roles of RNA m6A methylation in human β-cell of type 2 diabetes mellitus. Front Cell Dev Biol. (2021) 9:651142. doi: 10.3389/fcell.2021.651142
6. Leete P, Oram RA, McDonald TJ, Shields BM, Ziller C, TIGI study team, et al. Studies of insulin and proinsulin in pancreas and serum support the existence of aetiopathological endotypes of type 1 diabetes associated with age at diagnosis. Diabetologia. (2020) 63:1258–67. doi: 10.1007/s00125-020-05115-6
7. Hanna SJ, Powell WE, Long AE, Robinson EJS, Davies J, Megson C, et al. Slow progressors to type 1 diabetes lose islet autoantibodies over time, have few islet antigen-specific CD8+ T cells and exhibit a distinct CD95hi B cell phenotype. Diabetologia. (2020) 63:1174–85. doi: 10.1007/s00125-020-05114-7
8. Prasad M, Chen EW, Toh SA, Gascoigne NRJ. Autoimmune responses and inflammation in type 2 diabetes. J Leukoc Biol. (2020) 107:739–48. doi: 10.1002/JLB.3MR0220-243R
9. SantaCruz-Calvo S, Bharath L, Pugh G, JSantaCruz-Calvo L, Lenin RR, Lutshumba J, et al. Adaptive immune cells shape obesity-associated type 2 diabetes mellitus and less prominent comorbidities. Nat Rev Endocrinol. (2022) 18:23–42. doi: 10.1038/s41574-021-00575-1
10. Song Y, He C, Jiang Y, Yang M, Xu Z, Yuan L, et al. Bulk and single-cell transcriptome analyses of islet tissue unravel gene signatures associated with pyroptosis and immune infiltration in type 2 diabetes. Front Endocrinol (Lausanne). (2023) 14:1132194. doi: 10.3389/fendo.2023.1132194
11. Hanna SJ, Tatovic D, Thayer TC, Dayan CM. Insights from single cell RNA sequencing into the immunology of type 1 diabetes- cell phenotypes and antigen specificity. Front Immunol. (2021) 12:751701. doi: 10.3389/fimmu.2021.751701
12. Rai V, Quang DX, Erdos MR, Cusanovich Daza DA, Narisu RM, N, et al. Single-cell ATAC-Seq in human pancreatic islets and deep learning upscaling of rare cells reveals cell-specific type 2 diabetes regulatory signatures. Mol Metab. (2020) 32:109–21. doi: 10.1016/j.molmet.2019.12.006
13. Liu G, Li Y, Zhang T, Li Li M, He S, Q, et al. Single-cell RNA sequencing reveals sexually dimorphic transcriptome and type 2 diabetes genes in mouse islet β Cells. Genomics Proteomics Bioinf. (2021) 19:408–22. doi: 10.1016/j.gpb.2021.07.004
14. Huang Y, Cai L, Liu X, Wu Y, Xiang Q, Yu R. Exploring biomarkers and transcriptional factors in type 2 diabetes by comprehensive bioinformatics analysis on RNA-Seq and scRNA-Seq data. Ann Transl Med. (2022) 10:1017. doi: 10.21037/atm-22-4303
15. Lee H, Joo JY, Song JM, Kim HJ, Kim YH, Park HR. Immunological link between periodontitis and type 2 diabetes deciphered by single-cell RNA analysis. Clin Transl Med. (2023) 13:e1503. doi: 10.1002/ctm2.v13.12
16. Zhao J, Fang Z. Alterations of the gut microbiota and metabolites by ShenZhu TiaoPi granule alleviates hyperglycemia in GK rats. Front Microbiol. (2024) 15:1420103. doi: 10.3389/fmicb.2024.1420103
17. Zheng GX, Lau BT, Schnall-Levin M, Jarosz Bell M, Hindson JM, CM, et al. Haplotyping germline and cancer genomes with high-throughput linked-read sequencing. Nat Biotechnol. (2016) 34:303–11. doi: 10.1038/nbt.3432
18. Butler A, Hoffman P, Smibert P, Papalexi E, Satija R. Integrating single-cell transcriptomic data across different conditions, technologies, and species. Nat Biotechnol. (2018) 36:411–20. doi: 10.1038/nbt.4096
19. Neely J, Hartoularos G, Bunis D, Sun Y, Lee D, Kim S, et al. Multi-Modal Single-Cell Sequencing Identifies Cellular Immunophenotypes Associated With Juvenile Dermatomyositis Disease Activity. Front Immunol. (2022) 13:902232. doi: 10.3389/fimmu.2022.902232
20. Cao Y, Wang X, Peng G. SCSA: A cell type annotation tool for single-cell RNA-seq data. Front Genet. (2020) 11:490. doi: 10.3389/fgene.2020.00490
21. Qiu X, Hill A, Packer J, Lin D, Ma YA, Trapnell C. Single-cell mRNA quantification and differential analysis with Census. Nat Methods. (2017) 14:309–15. doi: 10.1038/nmeth.4150
22. Dornbos P, Singh P, Jang DK, Mahajan A, Biddinger SB, Rotter JI, et al. Evaluating human genetic support for hypothesized metabolic disease genes. Cell Metab. (2022) 34:661–6. doi: 10.1016/j.cmet.2022.03.011
23. Elgamal RM, Kudtarkar P, Melton RL, Mummey HM, Benaglio P, Okino ML, et al. An integrated map of cell type-specific gene expression in pancreatic islets. Diabetes. (2023) 72:1719–28. doi: 10.2337/db23-0130
24. Li C, Zhu J, Wei S, Ye X, Yang L, Wang Z, et al. Intermittent protein restriction improves glucose homeostasis in Zucker diabetic fatty rats and single-cell sequencing reveals distinct changes in β cells. J Nutr Biochem. (2023) 114:109275. doi: 10.1016/j.jnutbio.2023.109275
25. Donath MY, Dinarello CA, Mandrup-Poulsen T. Targeting innate immune mediators in type 1 and type 2 diabetes. Nat Rev Immunol. (2019) 19:734–46. doi: 10.1038/s41577-019-0213-9
26. Zhou Y, Zhang H, Yao Y, Zhang X, Guan Y, Zheng F. CD4+ T cell activation and inflammation in NASH-related fibrosis. Front Immunol. (2022) 13:967410. doi: 10.3389/fimmu.2022.967410
27. Berbudi A, Rahmadika N, Tjahjadi AI, Ruslami R. Type 2 diabetes and its impact on the immune system. Curr Diabetes Rev. (2020) 16:442–9. doi: 10.2174/1573399815666191024085838
28. Raphael I, Nalawade S, Eagar TN, Forsthuber TG. T cell subsets and their signature cytokines in autoimmune and inflammatory diseases. Cytokine. (2015) 74:5–17. doi: 10.1016/j.cyto.2014.09.011
29. Rattik S, Engelbertsen D, Wigren M, Ljungcrantz I, Östling G, Persson M, et al. Elevated circulating effector memory T cells but similar levels of regulatory T cells in patients with type 2 diabetes mellitus and cardiovascular disease. Diabetes Vasc Dis Res. (2019) 16:270–80. doi: 10.1177/1479164118817942
30. Vivek S, Crimmins EM, Prizment AE, Meier HCS, Ramasubramanian R, Barcelo H, et al. Age-related Differences in T-cell Subsets and Markers of Subclinical Inflammation in Aging Are Independently Associated With Type 2 Diabetes in the Health and Retirement Study [published online ahead of print, 2023 Jun 1. Can J Diabetes. (2023) 47:594–602.e6. doi: 10.1016/j.jcjd.2023.05.010
31. Qin W, Sun L, Dong M, An G, Zhang K, Zhang C, et al. Regulatory T cells and diabetes mellitus. Hum Gene Ther. (2021) 32:875–81. doi: 10.1089/hum.2021.024
32. Nishimura S, Manabe I, Nagasaki M, Eto K, Yamashita H, Ohsugi M, et al. CD8+ effector T cells contribute to macrophage recruitment and adipose tissue inflammation in obesity. Nat Med. (2009) 15:914–20. doi: 10.1038/nm.1964
33. Blériot C, Dalmas É, Ginhoux F, Venteclef N. Inflammatory and immune etiology of type 2 diabetes. Trends Immunol. (2023) 44:101–9. doi: 10.1016/j.it.2022.12.004
34. Ratter-Rieck JM, Maalmi H, Trenkamp S, Zaharia OP, Rathmann W, Schloot NC, et al. Leukocyte counts and T-cell frequencies differ between novel subgroups of diabetes and are associated with metabolic parameters and biomarkers of inflammation. Diabetes. (2021) 70:2652–62. doi: 10.2337/db21-0364
35. Maiese K. FoxO transcription factors and regenerative pathways in diabetes mellitus. Curr Neurovasc Res. (2015) 12:404–13. doi: 10.2174/1567202612666150807112524
36. Kubota N, Kubota T, Itoh S, Kumagai H, Kozono H, Takamoto I, et al. Dynamic functional relay between insulin receptor substrate 1 and 2 in hepatic insulin signaling during fasting and feeding. Cell Metab. (2008) 8:49–64. doi: 10.1016/j.cmet.2008.05.007
37. Kubota T, Kubota N, Kadowaki T. Imbalanced insulin actions in obesity and type 2 diabetes: key mouse models of insulin signaling pathway. Cell Metab. (2017) 25:797–810. doi: 10.1016/j.cmet.2017.03.004
38. Gonzalez FJ, Xie C, Jiang C. The role of hypoxia-inducible factors in metabolic diseases. Nat Rev Endocrinol. (2018) 15:21–32. doi: 10.1038/s41574-018-0096-z
39. Li L, Pan Z, Yang X. Key genes and co-expression network analysis in the livers of type 2 diabetes patients. J Diabetes Investig. (2019) 10:951–62. doi: 10.1111/jdi.2019.10.issue-4
40. Codo AC, Davanzo GG, Monteiro LB, Souza GFD, Moraes-Vieira PM. Elevated glucose levels favor SARS-coV-2 infection and monocyte response through a HIF-1α/glycolysis-dependent axis. Cell Metab. (2020) 32:498–9. doi: 10.1016/j.cmet.2020.07.015
41. Morgenstern R, Zhang J, Johansson K. Microsomal glutathione transferase 1: mechanism and functional roles. Drug Metab Rev. (2011) 43:300–6. doi: 10.3109/03602532.2011.558511
42. Suzuki M, Tezuka K, Handa T, Sato R, Takeuchi H, Takao M, et al. Upregulation of ribosome complexes at the blood-brain barrier in Alzheimer’s disease patients. J Cereb Blood Flow Metab. (2022) 42:2134–50. doi: 10.1177/0271678X221111602
43. Senevirathna JDM, Yonezawa R, Saka T, Igarashi Funasaka Y, Yoshitake N, K, et al. Selection of a reference gene for studies on lipid-related aquatic adaptations of toothed whales (Grampus griseus). Ecol Evol. (2021) 11:17142–59. doi: 10.1002/ece3.v11.23
44. Chitrala KN, Hernandez DG, Nalls MA, Mode NA, Zonderman AB, Ezike N, et al. Race-specific alterations in DNA methylation among middle-aged African Americans and Whites with metabolic syndrome. Epigenetics. (2020) 15:462–82. doi: 10.1080/15592294.2019.1695340
45. Wei W, Zhang Q, Jin T, Zhu L, Zhao J, Li F, et al. Quantitative proteomics characterization of the effect and mechanism of trichostatin A on the hippocampus of type II diabetic mice. Cell Mol Neurobiol. (2023) 43:4309–32. doi: 10.1007/s10571-023-01424-7
46. McLoughlin KJ, Pedrini E, MacMahon M, Guduric-Fuchs J, Medina RJ. Selection of a real-time PCR housekeeping gene panel in human endothelial colony forming cells for cellular senescence studies. Front Med (Lausanne). (2019) 6:33. doi: 10.3389/fmed.2019.00033
47. Friedrichs P, Schlotterer A, Sticht C, Kolibabka M, Wohlfart P, Dietrich A, et al. Hyperglycaemic memory affects the neurovascular unit of the retina in a diabetic mouse model. Diabetologia. (2017) 60:1354–8. doi: 10.1007/s00125-017-4254-y
48. Boodhoo K, Vlok M, Tabb DL, Myburgh KH, van de Vyver M. Dysregulated healing responses in diabetic wounds occur in the early stages postinjury. J Mol Endocrinol. (2021) 66:141–55. doi: 10.1530/JME-20-0256
49. Arefin A, Gage MC. Metformin, empagliflozin, and their combination modulate ex-vivo macrophage inflammatory gene expression. Int J Mol Sci. (2023) 24:4785. doi: 10.3390/ijms24054785
50. Yamanaka M, Kato Y, Angata T, Narimatsu H. Deletion polymorphism of SIGLEC14 and its functional implications. Glycobiology. (2009) 19:841–6. doi: 10.1093/glycob/cwp052
51. Jacobi T, Massier L, Klöting N, Horn K, Schuch A, Ahnert P, et al. HLA class II allele analyses implicate common genetic components in type 1 and non-insulin-treated type 2 diabetes. J Clin Endocrinol Metab. (2020) 105:dgaa027. doi: 10.1210/clinem/dgaa027
52. Shin JH, Kim IY, Kim YN, Shin SM, Roh KJ, Lee SH, et al. Obesity resistance and enhanced insulin sensitivity in ahnak-/- mice fed a high fat diet are related to impaired adipogenesis and increased energy expenditure. PloS One. (2015) 10:139720–38. doi: 10.1371/journal.pone.0139720
53. Zhai M, Luan P, Shi Y, Li B, Kang J, Hu F, et al. Identification of three significant genes associated with immune cells infiltration in dysfunctional adipose tissue-induced insulin-resistance of obese patients via comprehensive bioinformatics analysis. Int J Endocrinol. (2021) 2021:8820089–8820101. doi: 10.1155/2021/8820089
54. Kazama F, Nakamura J, Osada M, Inoue O, Oosawa M, Tamura S, et al. Measurement of soluble C-type lectin-like receptor 2 in human plasma. Platelets. (2015) 26:711–9. doi: 10.3109/09537104.2015.1021319
55. Zhao W, Meng X, Liang J. Analysis of circRNA-mRNA expression profiles and functional enrichment in diabetes mellitus based on high throughput sequencing. Int Wound J. (2022) 19:1253–62. doi: 10.1111/iwj.13838
56. Sohrabifar N, Ghaderian SMH, Alipour Parsa S, Ghaedi H, Jafari H. Variation in the expression level of MALAT1, MIAT and XIST lncRNAs in coronary artery disease patients with and without type 2 diabetes mellitus. Arch Physiol Biochem. (2022) 128:1308–15. doi: 10.1080/13813455.2020.1768410
57. Costanzo MC, von Grotthuss M, Massung J, Jang D, Caulkins L, Koesterer R, et al. The Type 2 Diabetes Knowledge Portal: An open access genetic resource dedicated to type 2 diabetes and related traits. Cell Metab. (2023) 35:695–710. doi: 10.1016/j.cmet.2023.03.001
58. Tsai CM, Riestra AM, Ali SR, Fong JJ, Liu JZ, Hughes G, et al. Siglec-14 enhances NLRP3-inflammasome activation in macrophages. J Innate Immun. (2020) 12:333–43. doi: 10.1159/000504323
59. McDermott MF. TNF. and TNFR biology in health and disease. Cell Mol Biol (Noisy-le-grand). (2001) 47:619–35. doi: 10.1247/csf.26.169
60. Sen T, Li J, Neuen BL, Neal B, Arnott C, Parikh CR, et al. Effects of the SGLT2 inhibitor canagliflozin on plasma biomarkers TNFR-1, TNFR-2 and KIM-1 in the CANVAS trial. Diabetologia. (2021) 64:2147–58. doi: 10.1007/s00125-021-05512-5
61. Gómez-Banoy N, Cuevas V, Higuita A, Aranzález LH, Mockus I. Soluble tumor necrosis factor receptor 1 is associated with diminished estimated glomerular filtration rate in Colombian patients with type 2 diabetes. J Diabetes Complications. (2016) 30:852–7. doi: 10.1016/j.jdiacomp.2016.03.015
62. Wang X, Liu J, Cheng Z, Zhong Y, Chen X, Song W. Triglyceride glucose-body mass index and the risk of diabetes: a general population-based cohort study. Lipids Health Dis. (2021) 20:99. doi: 10.1186/s12944-021-01532-7
63. Zhang M, Lin S, Yuan X, Lin Z, Huang Z. HLA-DQB1 and HLA-DRB1 variants confer susceptibility to latent autoimmune diabetes in adults: relative predispositional effects among allele groups. Genes (Basel). (2019) 10:710. doi: 10.3390/genes10090710
64. Liu Y, Zhang X, Yang L, Zhou S, Li Y, Shen Y, et al. Proteomics and transcriptomics explore the effect of mixture of herbal extract on diabetic wound healing process. Phytomedicine. (2023) 116:154892. doi: 10.1016/j.phymed.2023.154892
65. Miranda-Lora AL, Molina-Díaz M, Cruz M, Sánchez-Urbina R, Martínez-Rodríguez NL, López-Martínez B, et al. Genetic polymorphisms associated with pediatric-onset type 2 diabetes: A family-based transmission disequilibrium test and case-control study. Pediatr Diabetes. (2019) 20:239–45. doi: 10.1111/pedi.12818
66. Elvaraj MS, Paruchuri K, Haidermota S, Bernardo R, Rich SS, Peloso GM, et al. Genome-wide discovery for diabetes-dependent triglycerides-associated loci. PloS One. (2022) 17:e0275934. doi: 10.1371/journal.pone.0275934
67. Zheng M, Hu Y, Liu O, Li S, Wang Y, Li X, et al. Oxidative stress response biomarkers of ovarian cancer based on single-cell and bulk RNA sequencing. Oxid Med Cell Longev. (2023) 2023:1261039. doi: 10.1155/2023/1261039
68. Grabež M, Škrbić R, Stojiljković MP, Vučić V, Rudić Grujić V, Jakovljević V, et al. A prospective, randomized, double-blind, placebo-controlled trial of polyphenols on the outcomes of inflammatory factors and oxidative stress in patients with type 2 diabetes mellitus. Rev Cardiovasc Med. (2022) 23:57. doi: 10.31083/j.rcm2302057
69. He J, Dai P, Liu L, Yang Y, Liu X, Li Y, et al. The effect of short-term intensive insulin therapy on inflammatory cytokines in patients with newly diagnosed type 2 diabetes. J Diabetes. (2022) 14:192–204. doi: 10.1111/1753-0407.13250
70. Chen YM, Zhu Q, Cai J, Zhao ZJ, Yao BB, Zhou LM, et al. Upregulation of T Cell Receptor Signaling Pathway Components in Gestational Diabetes Mellitus Patients: Joint Analysis of mRNA and circRNA Expression Profiles. Front Endocrinol (Lausanne). (2022) 12:774608. doi: 10.3389/fendo.2021.774608
71. Liu T, Li H, Ding G, Wang Z, Chen Y, Liu L, et al. Comparative genome of GK and wistar rats reveals genetic basis of type 2 diabetes. PloS One. (2015) 10:e0141859. doi: 10.1371/journal.pone.0141859
72. Bhardwaj R, Singh BP, Sandhu N, Singh N, Kaur R, Rokana N, et al. Probiotic mediated NF-κB regulation for prospective management of type 2 diabetes. Mol Biol Rep. (2020) 47:2301–13. doi: 10.1007/s11033-020-05254-4
73. Malvandi AM, Loretelli C, Ben Nasr M, Zuccotti GV, Fiorina P. Sitagliptin favorably modulates immune-relevant pathways in human beta cells. Pharmacol Res. (2019) 148:104405. doi: 10.1016/j.phrs.2019.104405
74. Collier JJ, Sparer TE, Karlstad MD, Burke SJ. Pancreatic islet inflammation: an emerging role for chemokines. J Mol Endocrinol. (2017) 59:R33–46. doi: 10.1530/JME-17-0042
75. Qi X, Xing Y, Wang X. Blockade of CCL2/CCR2 signaling pathway exerts anti-inflammatory effects and attenuates gestational diabetes mellitus in a genetic mice model. Horm Metab Res. (2021) 53:56–62. doi: 10.1055/a-1250-8221
76. Kawakami R, Katsuki S, Travers R, Romero DC, Becker-Greene D, Passos LSA, et al. S100A9-RAGE axis accelerates formation of macrophage-mediated extracellular vesicle microcalcification in diabetes mellitus. Arterioscler Thromb Vasc Biol. (2020) 40:1838–53. doi: 10.1161/ATVBAHA.118.314087
77. Miyashita D, Inoue R, Tsuno T, Okuyama T, Kyohara M, Nakahashi-Oda C, et al. Protective effects of S100A8 on sepsis mortality: Links to sepsis risk in obesity and diabetes. iScience. (2022) 25:105662. doi: 10.1016/j.isci.2022.105662
78. Kosaki A, Hasegawa T, Kimura T, Iida K, Hitomi J, Matsubara H, et al. Increased plasma S100A12 (EN-RAGE) levels in patients with type 2 diabetes. J Clin Endocrinol Metab. (2004) 89:5423–8. doi: 10.1210/jc.2003-032223
Keywords: type 2 diabetes mellitus, peripheral blood mononuclear cells, single-cell RNA sequencing, T cells, monocytes
Citation: Zhao J and Fang Z (2025) Single-cell RNA sequencing reveals the dysfunctional characteristics of PBMCs in patients with type 2 diabetes mellitus. Front. Immunol. 15:1501660. doi: 10.3389/fimmu.2024.1501660
Received: 25 September 2024; Accepted: 11 December 2024;
Published: 23 January 2025.
Edited by:
Jian Gao, Shanghai Children’s Medical Center, ChinaReviewed by:
Ping Zhou, University of California, Los Angeles, United StatesCopyright © 2025 Zhao and Fang. This is an open-access article distributed under the terms of the Creative Commons Attribution License (CC BY). The use, distribution or reproduction in other forums is permitted, provided the original author(s) and the copyright owner(s) are credited and that the original publication in this journal is cited, in accordance with accepted academic practice. No use, distribution or reproduction is permitted which does not comply with these terms.
*Correspondence: Zhaohui Fang, ZmFuZ3poYW9odWkxMTExQDE2My5jb20=
Disclaimer: All claims expressed in this article are solely those of the authors and do not necessarily represent those of their affiliated organizations, or those of the publisher, the editors and the reviewers. Any product that may be evaluated in this article or claim that may be made by its manufacturer is not guaranteed or endorsed by the publisher.
Research integrity at Frontiers
Learn more about the work of our research integrity team to safeguard the quality of each article we publish.