- Department of Colorectal Surgery, National Regional Medical Center, Binhai Campus of the First Affiliated Hospital, Fujian Medical University, Fuzhou, China
Background: This study aimed to investigate the prognostic significance of the log odds of negative lymph nodes/T stage ratio (LONT) and develop an efficient prognostic staging system using LONT in patients with colon mucinous adenocarcinoma (MAC).
Methods: This study included 5,236 patients diagnosed with colon MAC obtained from the Surveillance, Epidemiology, and End Results database. The Kaplan–Meier method, subgroup analysis, receiver operating characteristic (ROC) curve, and Cox proportional hazard regression model were used to determine the clinical outcomes. Recursive partitioning analysis (RPA) was used to develop a novel prognostic system.
Results: The 1-, 3-, and 5-year ROC curves, used to predict cancer-specific survival (CSS) and overall survival (OS), demonstrated that the areas under the ROC curve for LONT were superior to those of pT, pN, and pTNM stages. Additionally, a lower LONT was correlated with worse clinical outcomes. The LONT classification efficiently differentiated the prognosis of patients in terms of OS and CSS. Multivariate Cox analyses revealed that LONT was an independent prognostic factor for both CSS and OS. Based on the pT stage and LONT, a novel prognostic staging system was developed using RPA, demonstrating a good prognostic predictive performance.
Conclusion: A lower LONT was associated with worse survival in patients with colon MAC. The pT stage and LONT-based prognostic staging system facilitated risk stratification in these patients.
Introduction
Colorectal cancer ranks third globally in terms of incidence and second in mortality rates (1, 2). Adenocarcinoma is the predominant pathological type of colon cancer. Mucinous adenocarcinoma (MAC) constitutes approximately 5%–15% of colon cancer cases and often demonstrates advanced staging and lymph node metastasis (3, 4). However, the prognosis of colon MAC remains debatable (5).
The American Joint Committee on Cancer (AJCC) tumor-node-metastasis (TNM) staging system, comprising pT and pN stages, is widely used for staging patients with colon MAC. However, the pN stage exclusively considers the number of positive lymph nodes (PLNs), neglecting the significance of cleared negative lymph nodes (6–8). Considering the correlation between lymph node clearance and cancer prognosis, the lymph node ratio (LNR) and log odds of positive lymph nodes (LODDS) have been identified as prognostic indicators. LNR is defined as the ratio of PLNs to the total number of regional lymph nodes. However, this formula indicates that its prognostic utility is limited in patients with negative lymph nodes. Conversely, the LODDS accounts for both PLN and the number of negative lymph nodes, providing a comprehensive evaluation. Despite their significance, these metrics were developed solely on the basis of lymph node status and count without adjustment for clinical risk factors.
The log odds of negative lymph nodes/T stage ratio (LONT) combines data from the pT stage and negative lymph nodes. It adjusts lymph node–related information by incorporating T staging. Xie et al. (9) pioneered the application of LONT in developing a nomogram for gastric cancer. Their study revealed that patients with different TNM stages but the same LONT exhibited similar risk levels, indicating the superior prognostic capability of their model compared to TNM staging alone. Moreover, LONT has been used to develop nomograms for thyroid cancer without metastases (10) and bladder cancer (11), demonstrating better predictive capabilities than the TNM staging system. However, the use of LONT in colon MAC remains unexplored.
In this study, a population-based cohort from the Surveillance, Epidemiology, and End Results (SEER) database was used to investigate the association between LONT and the survival of patients with colon MAC. We developed a prognostic staging system on the basis of LONT to predict the survival of patients with colon MAC using recursive partitioning analysis (RPA).
Methods
Cohort characteristics
The cohort included patients with colon MAC identified from the SEER database between 2006 and 2015 using SEER*Stat software. The inclusion criteria were as follows: (1) diagnosis of colon MAC as per the International Classification of Diseases of Oncology (ICD-O-3), (2) radical surgical treatment including lymph node dissection, and (3) the absence of distant metastasis. The exclusion criteria included the following: (1) age > 75 years at diagnosis, (2) diagnosis or surgical identification of distant metastases, (3) other concurrent primary tumors, and (4) incomplete clinicopathological or follow-up data. The SEER cohort included 5,236 patients. This study was approved by the hospital ethics committee.
Data extraction
The patient data collected included age at diagnosis, sex, race, tumor size, primary tumor site, AJCC TNM stage, number of examined lymph nodes, counts of positive and negative lymph nodes, cancer-specific survival (CSS), overall survival (OS) status, and follow-up duration. The pN staging was adjusted on the basis of the latest AJCC TNM staging system.
LONT classification
The log odds of (negative lymph nodes + 1)/T stage ratio were calculated as LONT. The number of negative lymph nodes was equal to the number of lymph nodes examined minus the number of PLNs, and pT1, pT2, pT3, and pT4 were assigned values of 1, 2, 3, and 4, respectively. LONT was then grouped at intervals of 0.2. Kaplan–Meier analysis was conducted on the adjacent groups, and those exhibiting similar CSS were combined into a common subgroup.
Statistical analysis
Statistical analyses were performed using R software (version 3.6.3) and Statistical Package for the Social Sciences software (version 22.0). Receiver operating characteristic (ROC) curve analysis was conducted to assess the prognostic predictive value of the pT stage, pN stage, pTNM stage, and LONT classification. Disparities within subgroups stratified by distinct clinicopathological characteristics were assessed using Kaplan–Meier analysis. The independent risk factors for CSS and OS were identified using univariate and multivariate Cox regression analyses. A novel tumor prognostic staging system was reclassified using RPA, which is accessible online (http://rpa.renlab.org) (12). A P < 0.05 indicated a statistically significant difference.
Results
Baseline characteristics
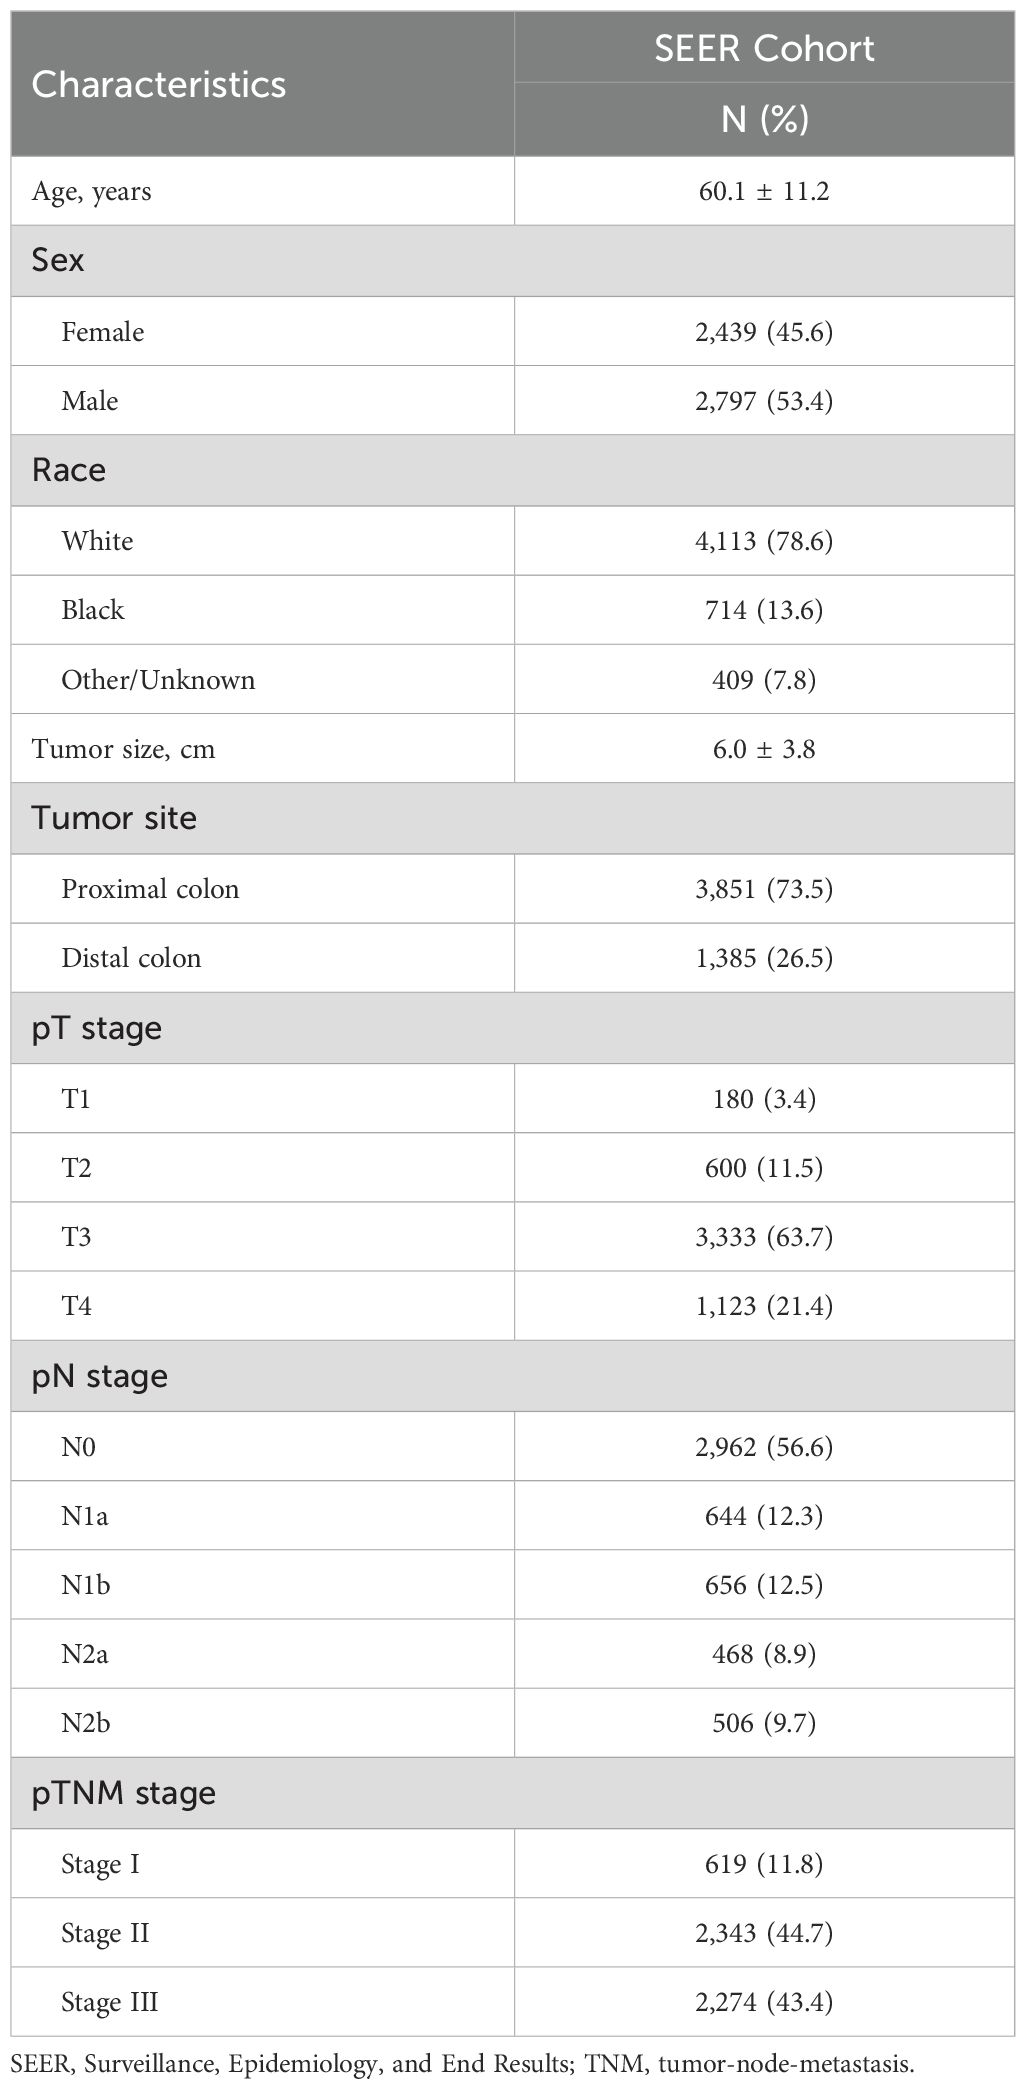
The SEER cohort included 5,236 patients, and their clinical characteristics are summarized in Table 1. The mean age of the patients was 60.1 ± 11.2 years, and 45.6% were women. The number of patients with pT3 and pT4 tumors was 3,333 (63.7%) and 1,123 (21.4%), respectively. PLNs were detected in 2,274 patients (43.4%).
The prognostic value of LONT
To investigate the prognostic assessment capabilities of LONT, ROC analysis was used to compare the predictive abilities of LONT, pT, pN, and pTNM stages for 1-, 3-, and 5-year survival LONT demonstrated superior predictive performance compared to those of the pT, pN, and pTNM stages (Figure 1). The area under the ROC curve (AUC) values for LONT in predicting 1-, 3-, and 5-year CSS were 0.727, 0.735, and 0.727, respectively (Figures 1A–D). Additionally, the AUC values for predicting 1-, 3-, and 5-year OS were 0.679, 0.699, and 0.685, respectively (Figures 1E–H). These results indicated that LONT is a valuable prognostic factor that warrants further investigation.
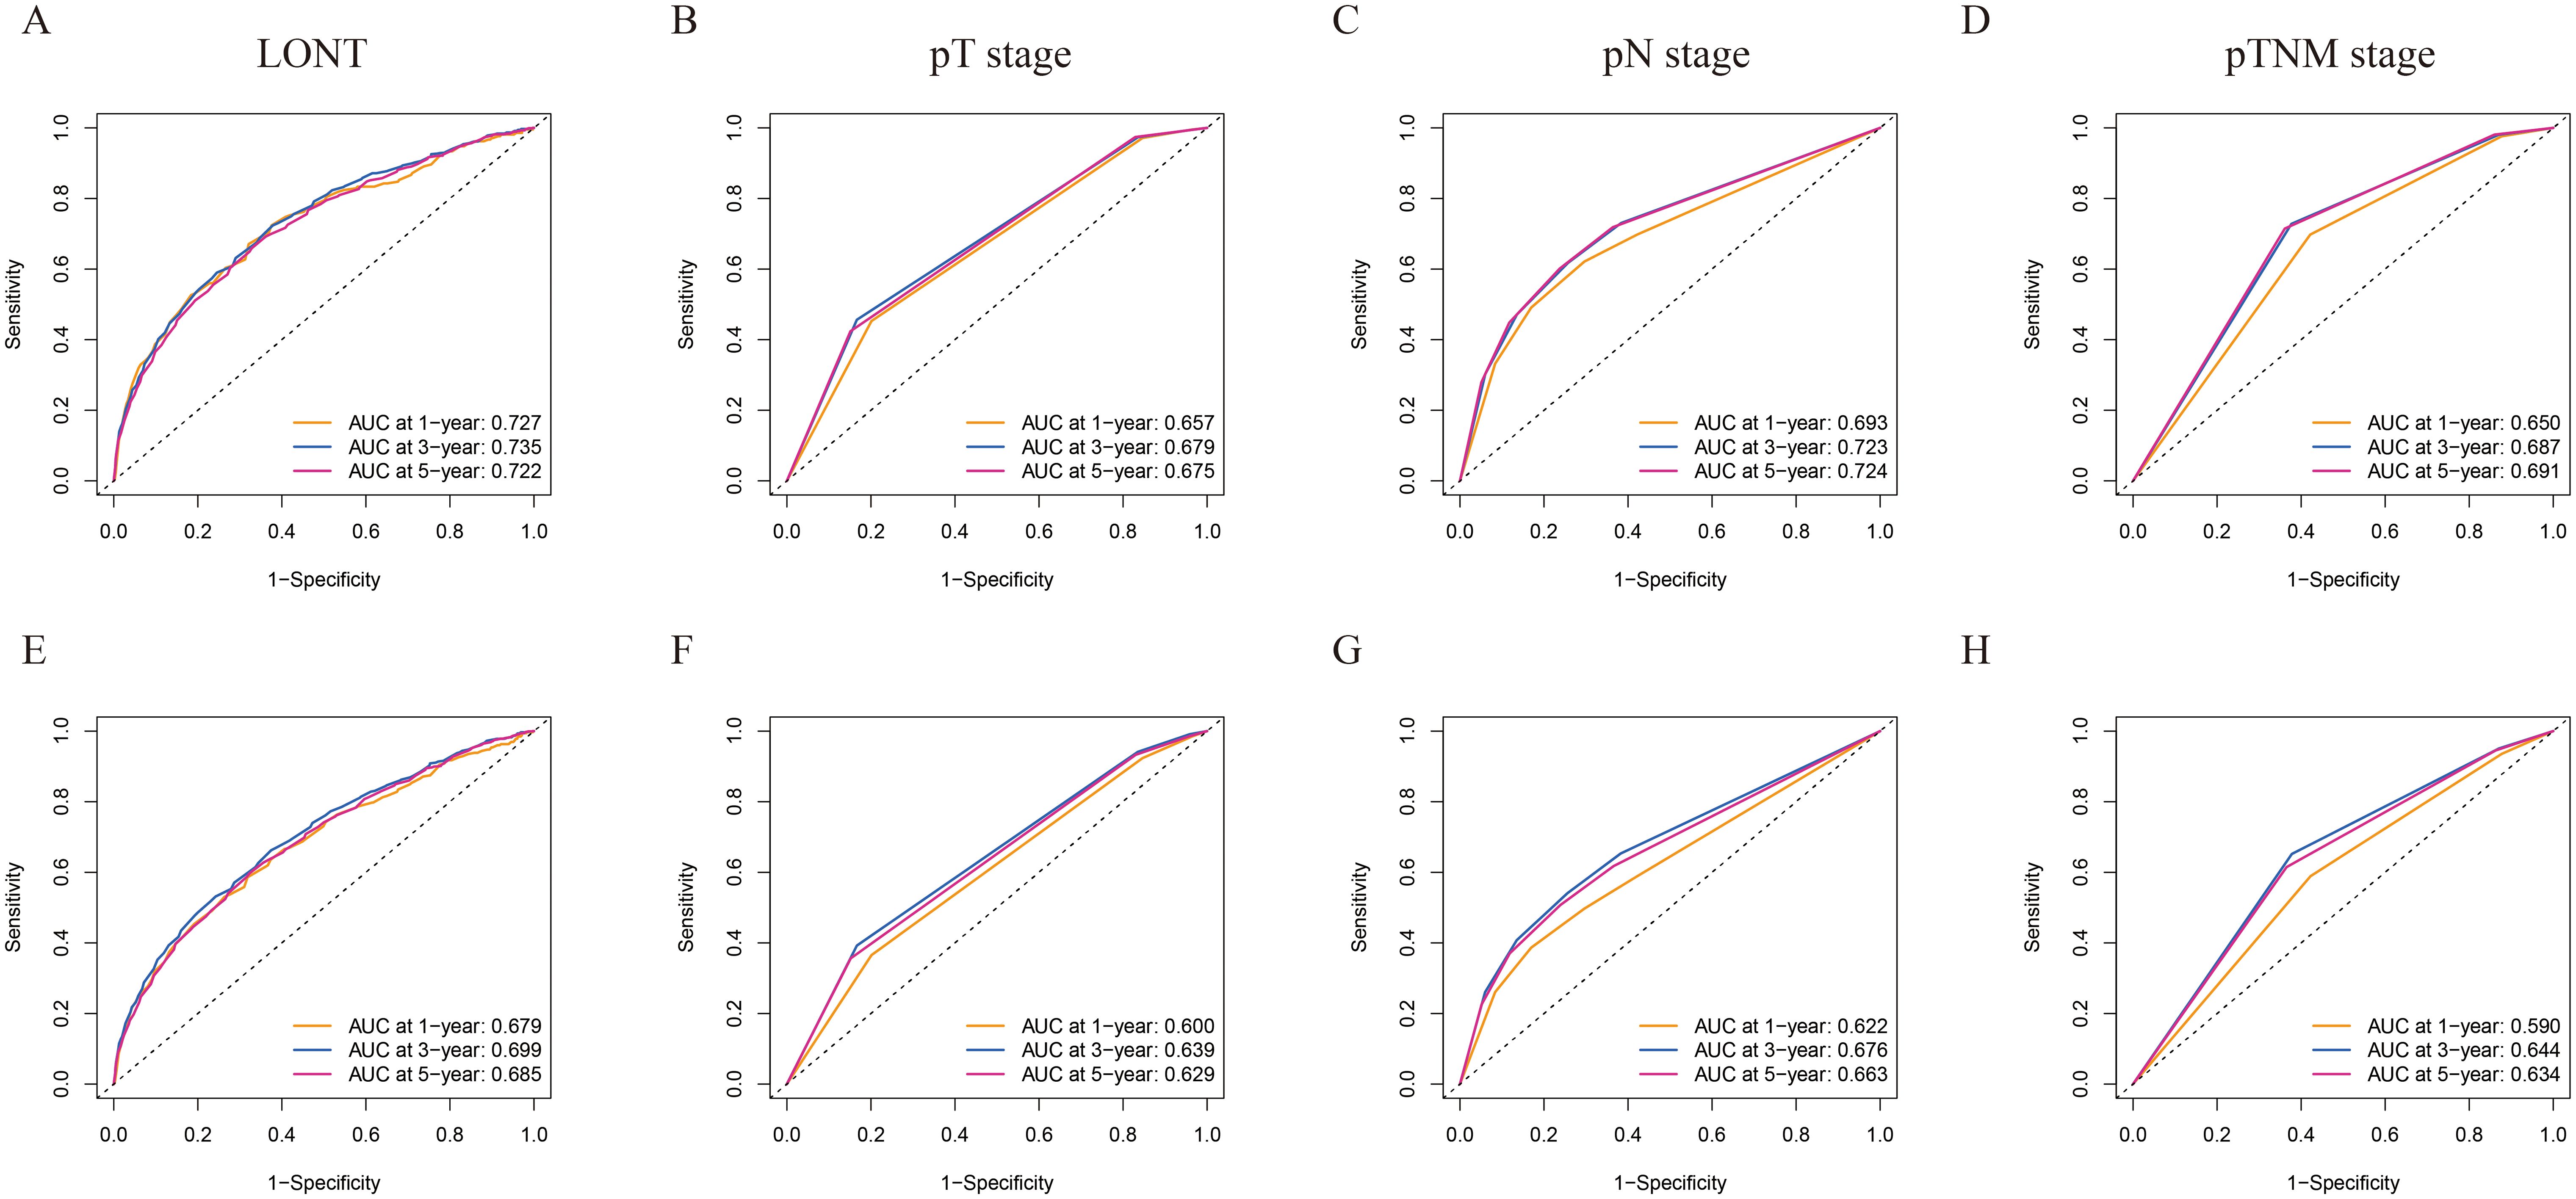
Figure 1. ROC curves of 1-, 3-, and 5-year CSS and OS prediction of (A, E) LONT; (B, F) pT stage; (C, G) pN stage; (D, H) pTNM stage. LONT demonstrated superior predictive performance compared to the pT stage, pN stage, and pTNM stage (AUC in the bottom right of the figure). ROC, receiver operating characteristic curve; CSS, cancer-specific survival; OS, overall survival; LONT, the log odds of negative lymph nodes/T stage ratio; SEER, Surveillance, Epidemiology, and End Results; AUC, area under the ROC curve.
Prognostic factors of CSS and OS
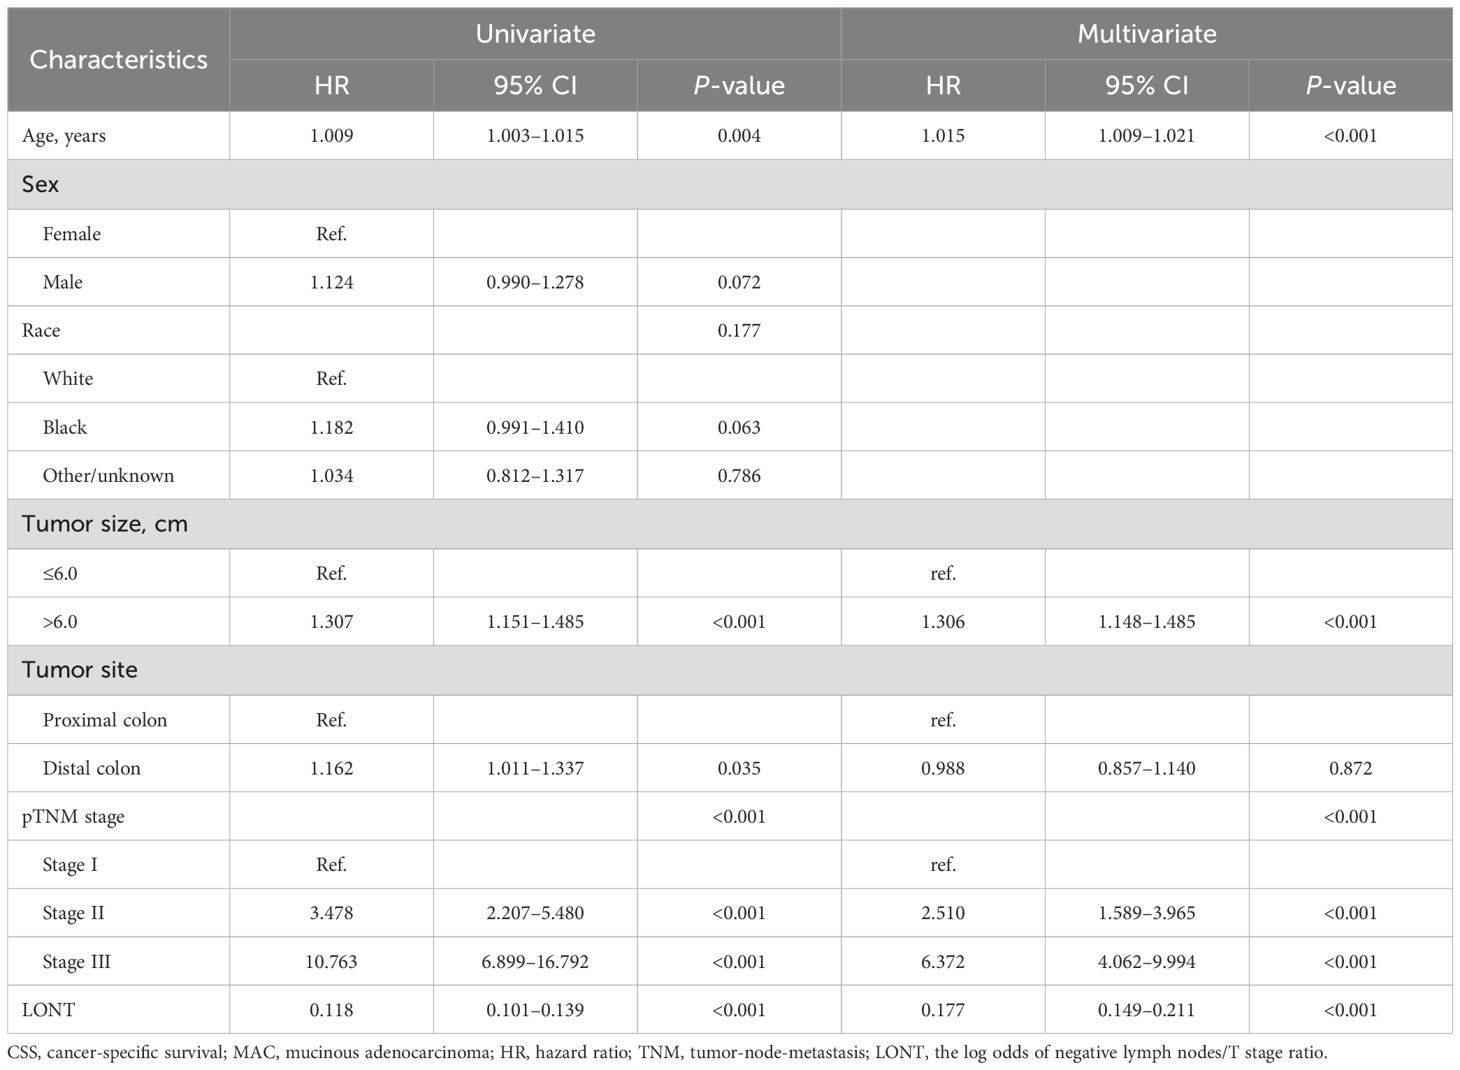
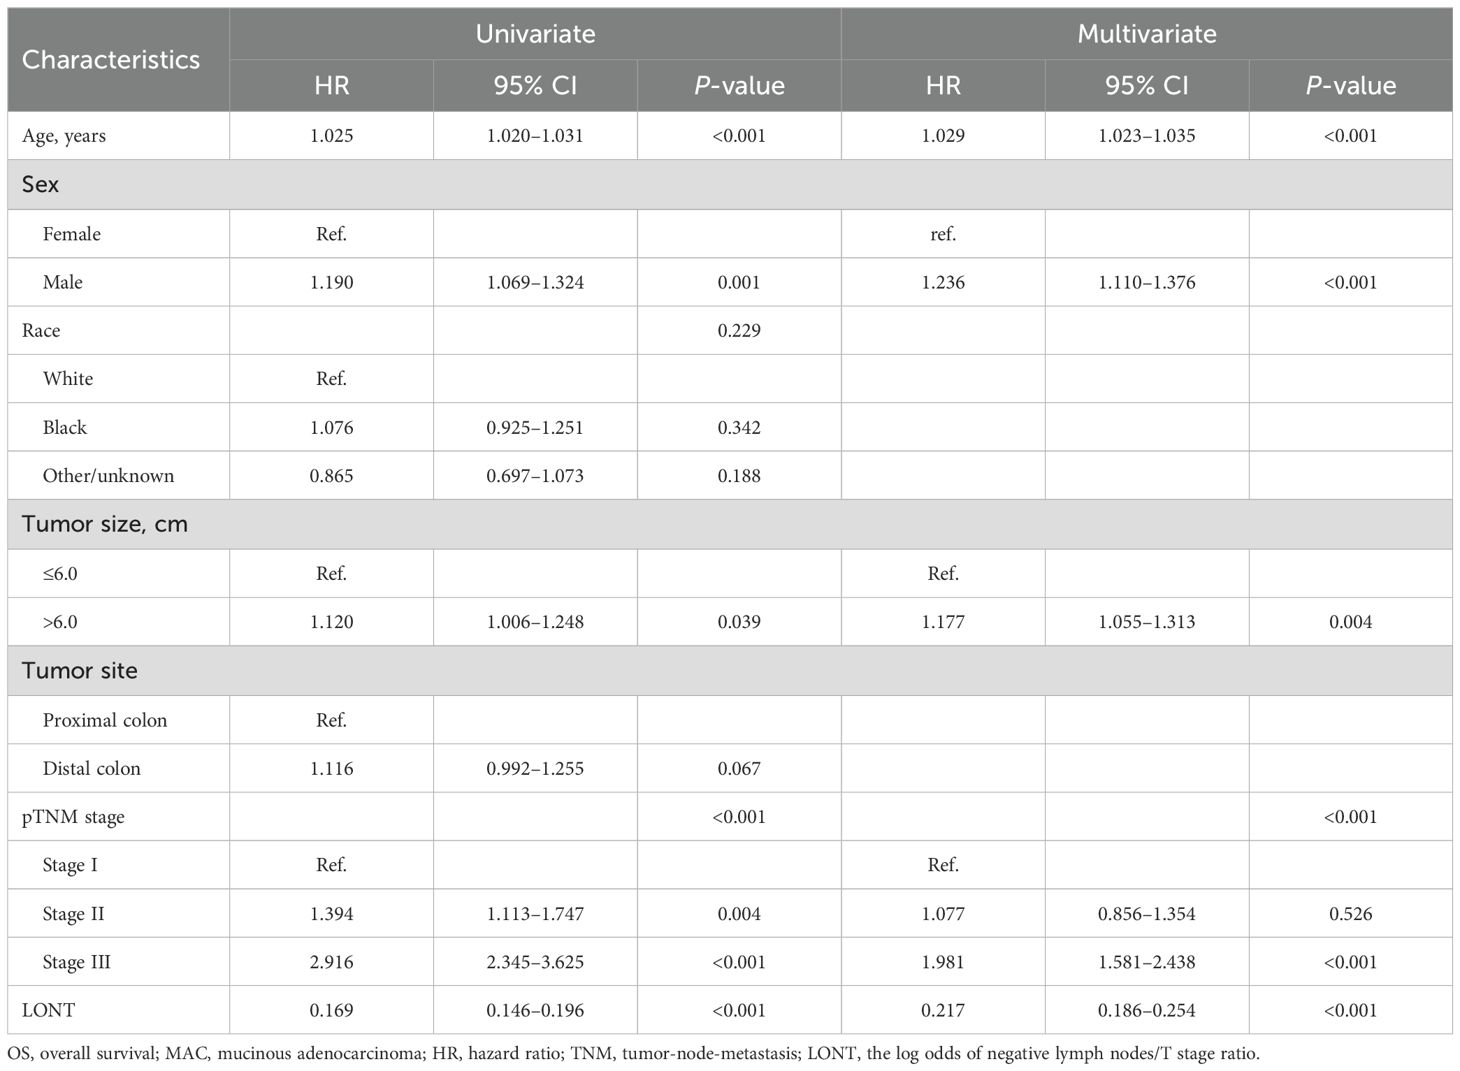
Cox regression analysis was further refined to identify independent prognostic factors in patients with colon MAC. Univariate Cox analysis revealed that age, tumor size, tumor site, pTNM stage, and LONT were significantly associated with CSS (P < 0.05). Multivariate Cox analysis demonstrated that age (P < 0.001), tumor size (P < 0.001), pTNM stage (P < 0.001), and LONT (P < 0.001) were independently associated with CSS (Table 2). The results of Cox regression analysis for identifying independent prognostic factors for OS are presented in Table 3. Univariate Cox analysis revealed that age, sex, tumor size, pTNM stage, and LONT were significantly associated with OS (P < 0.05). Multivariate Cox analysis confirmed that age (P < 0.001), sex (P < 0.001), tumor size (P = 0.004), pTNM stage (P < 0.001), and LONT (P < 0.001) were independently associated with OS. These findings underscore that LONT is an independent risk factor for both CSS and OS in patients with colon MAC.
LONT classification
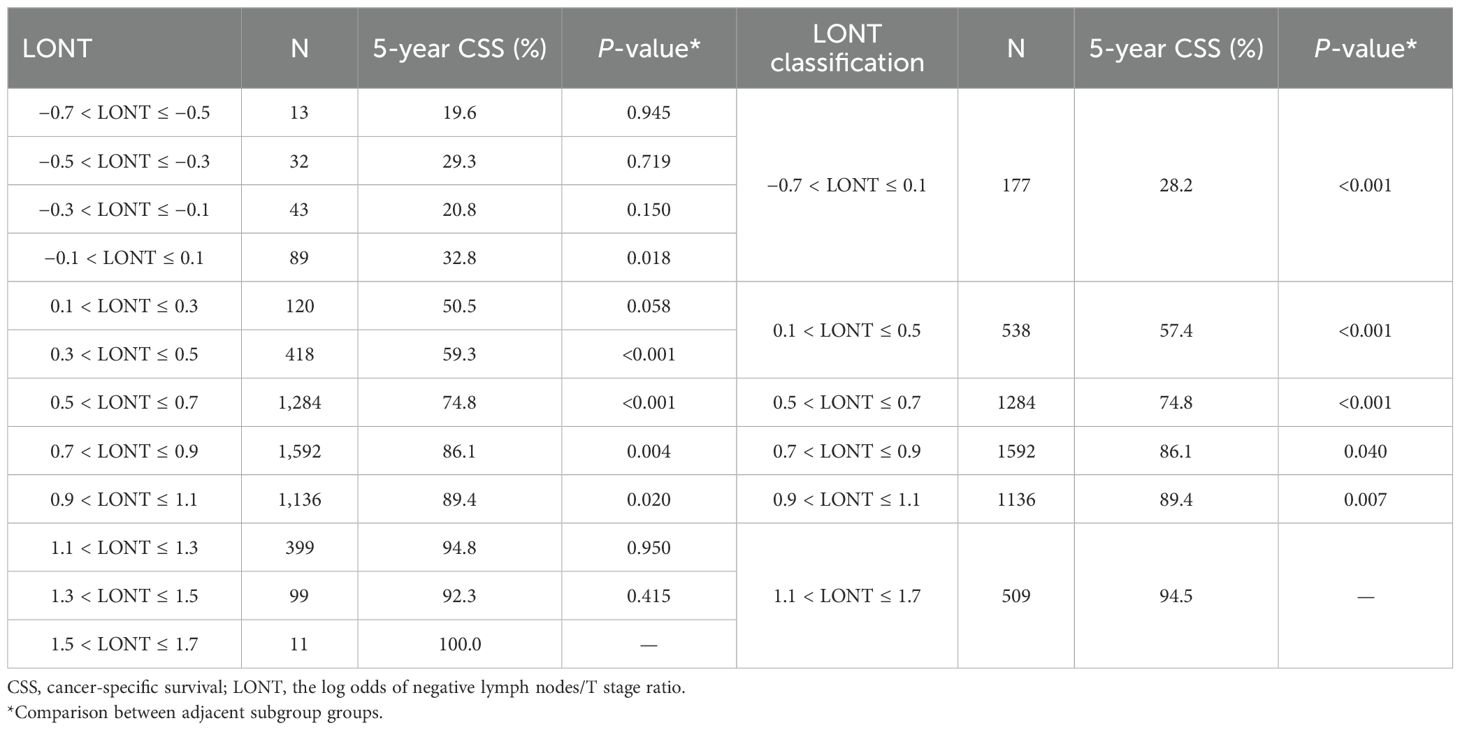
We divided LONT into six subgroups on the basis of similar CSS (Table 4): LONT1 (1.1 < LONT ≤ 1.7), LONT2 (0.9 < LONT ≤ 1.1), LONT3 (0.7 < LONT ≤ 0.9), LONT4 (0.5 < LONT ≤ 0.7), LONT5 (0.1 < LONT ≤ 0.5), and LONT6 (−0.7 < LONT ≤ 0.1). The 5-year CSS rates in these subgroups were 94.5%, 89.4%, 86.1%, 74.8%, 57.4%, and 28.2%, respectively. There were significant differences in the 5-year CSS and OS rates between the subgroups (P < 0.05; Figure 2).
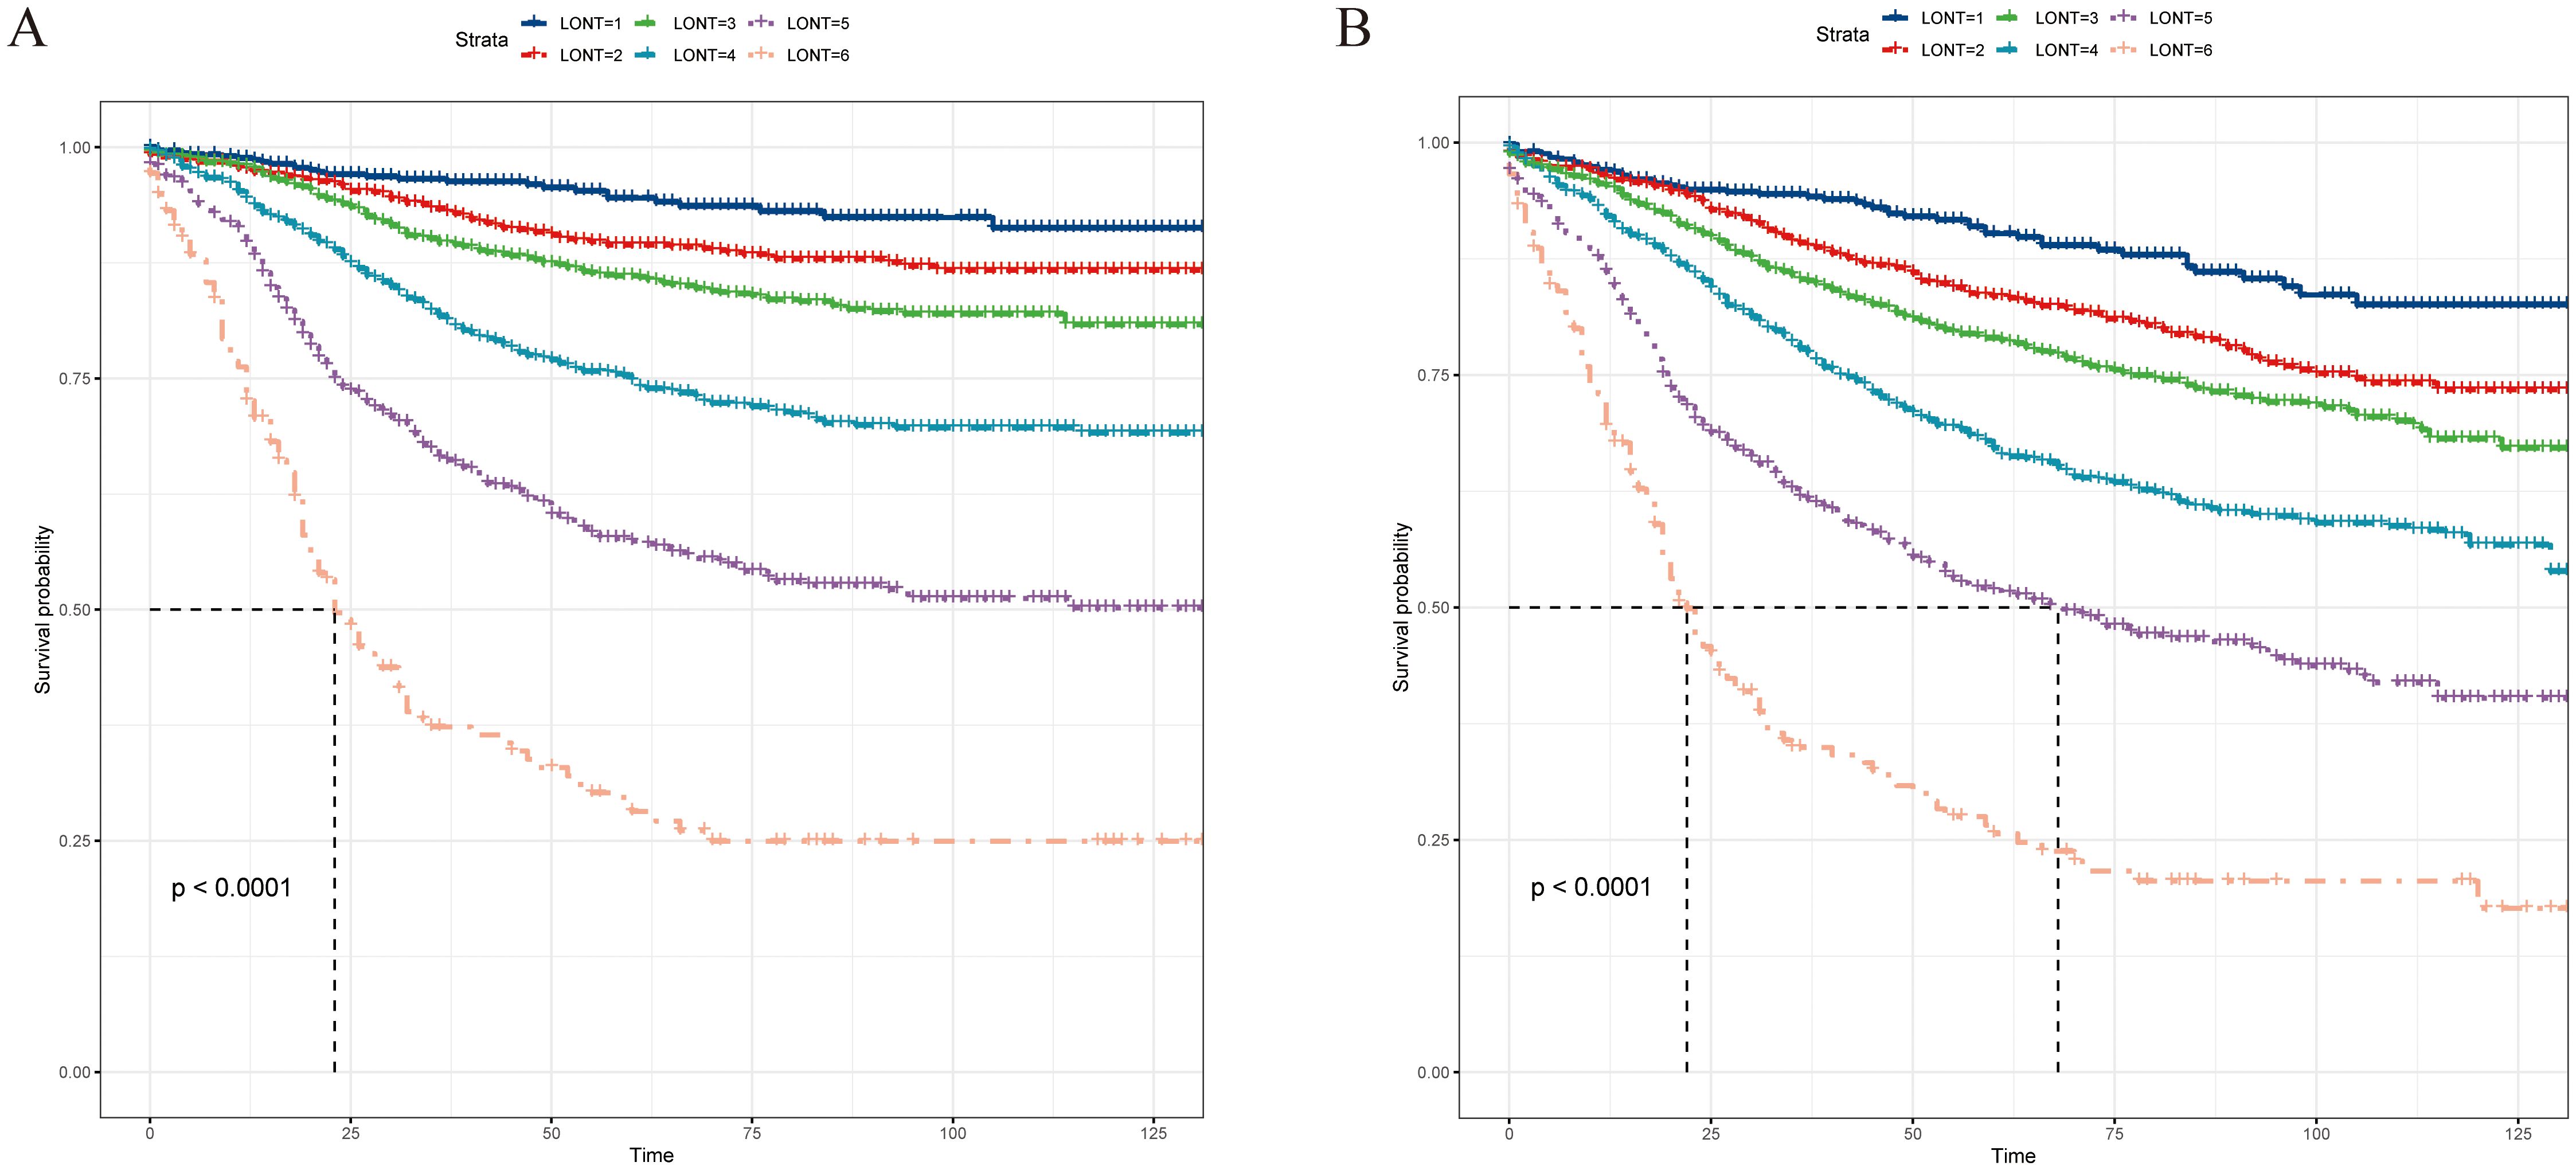
Figure 2. Kaplan–Meier curves for (A) CSS and (B) OS according to the LONT classification, and survival differences were observed (P < 0.05). CSS, cancer-specific survival; OS, overall survival; LONT, the log odds of negative lymph nodes/T stage ratio; SEER, Surveillance, Epidemiology, and End Results.
The subgroups analysis of the LONT classification
Subgroup analysis revealed that the LONT classification could identify CSS differences in pT3, pT4, pN0, pN1a, pN1b, pN2a, pN2b, pTNM II, and pTNM III stages (P < 0.05; Figure 3). However, non-significant differences were observed in the pT1 (P = 0.96), pT2 (P = 0.62), and pTNM I stage (P = 0.53) subgroups. The same trend was observed during the OS evaluation (Figure 4). Specifically, the LONT classification could distinguish OS differences in pT3 stage, pT4 stage, pN0 stage, pN1a stage, pN1b stage, pN2a stage, pN2b stage, pTNM II stage, and pTNM III stage (P < 0.05). However, non-significant differences were observed in the pT1 (P = 0.36), pT2 (P = 0.45), and pTNM I (P = 0.13) subgroups.
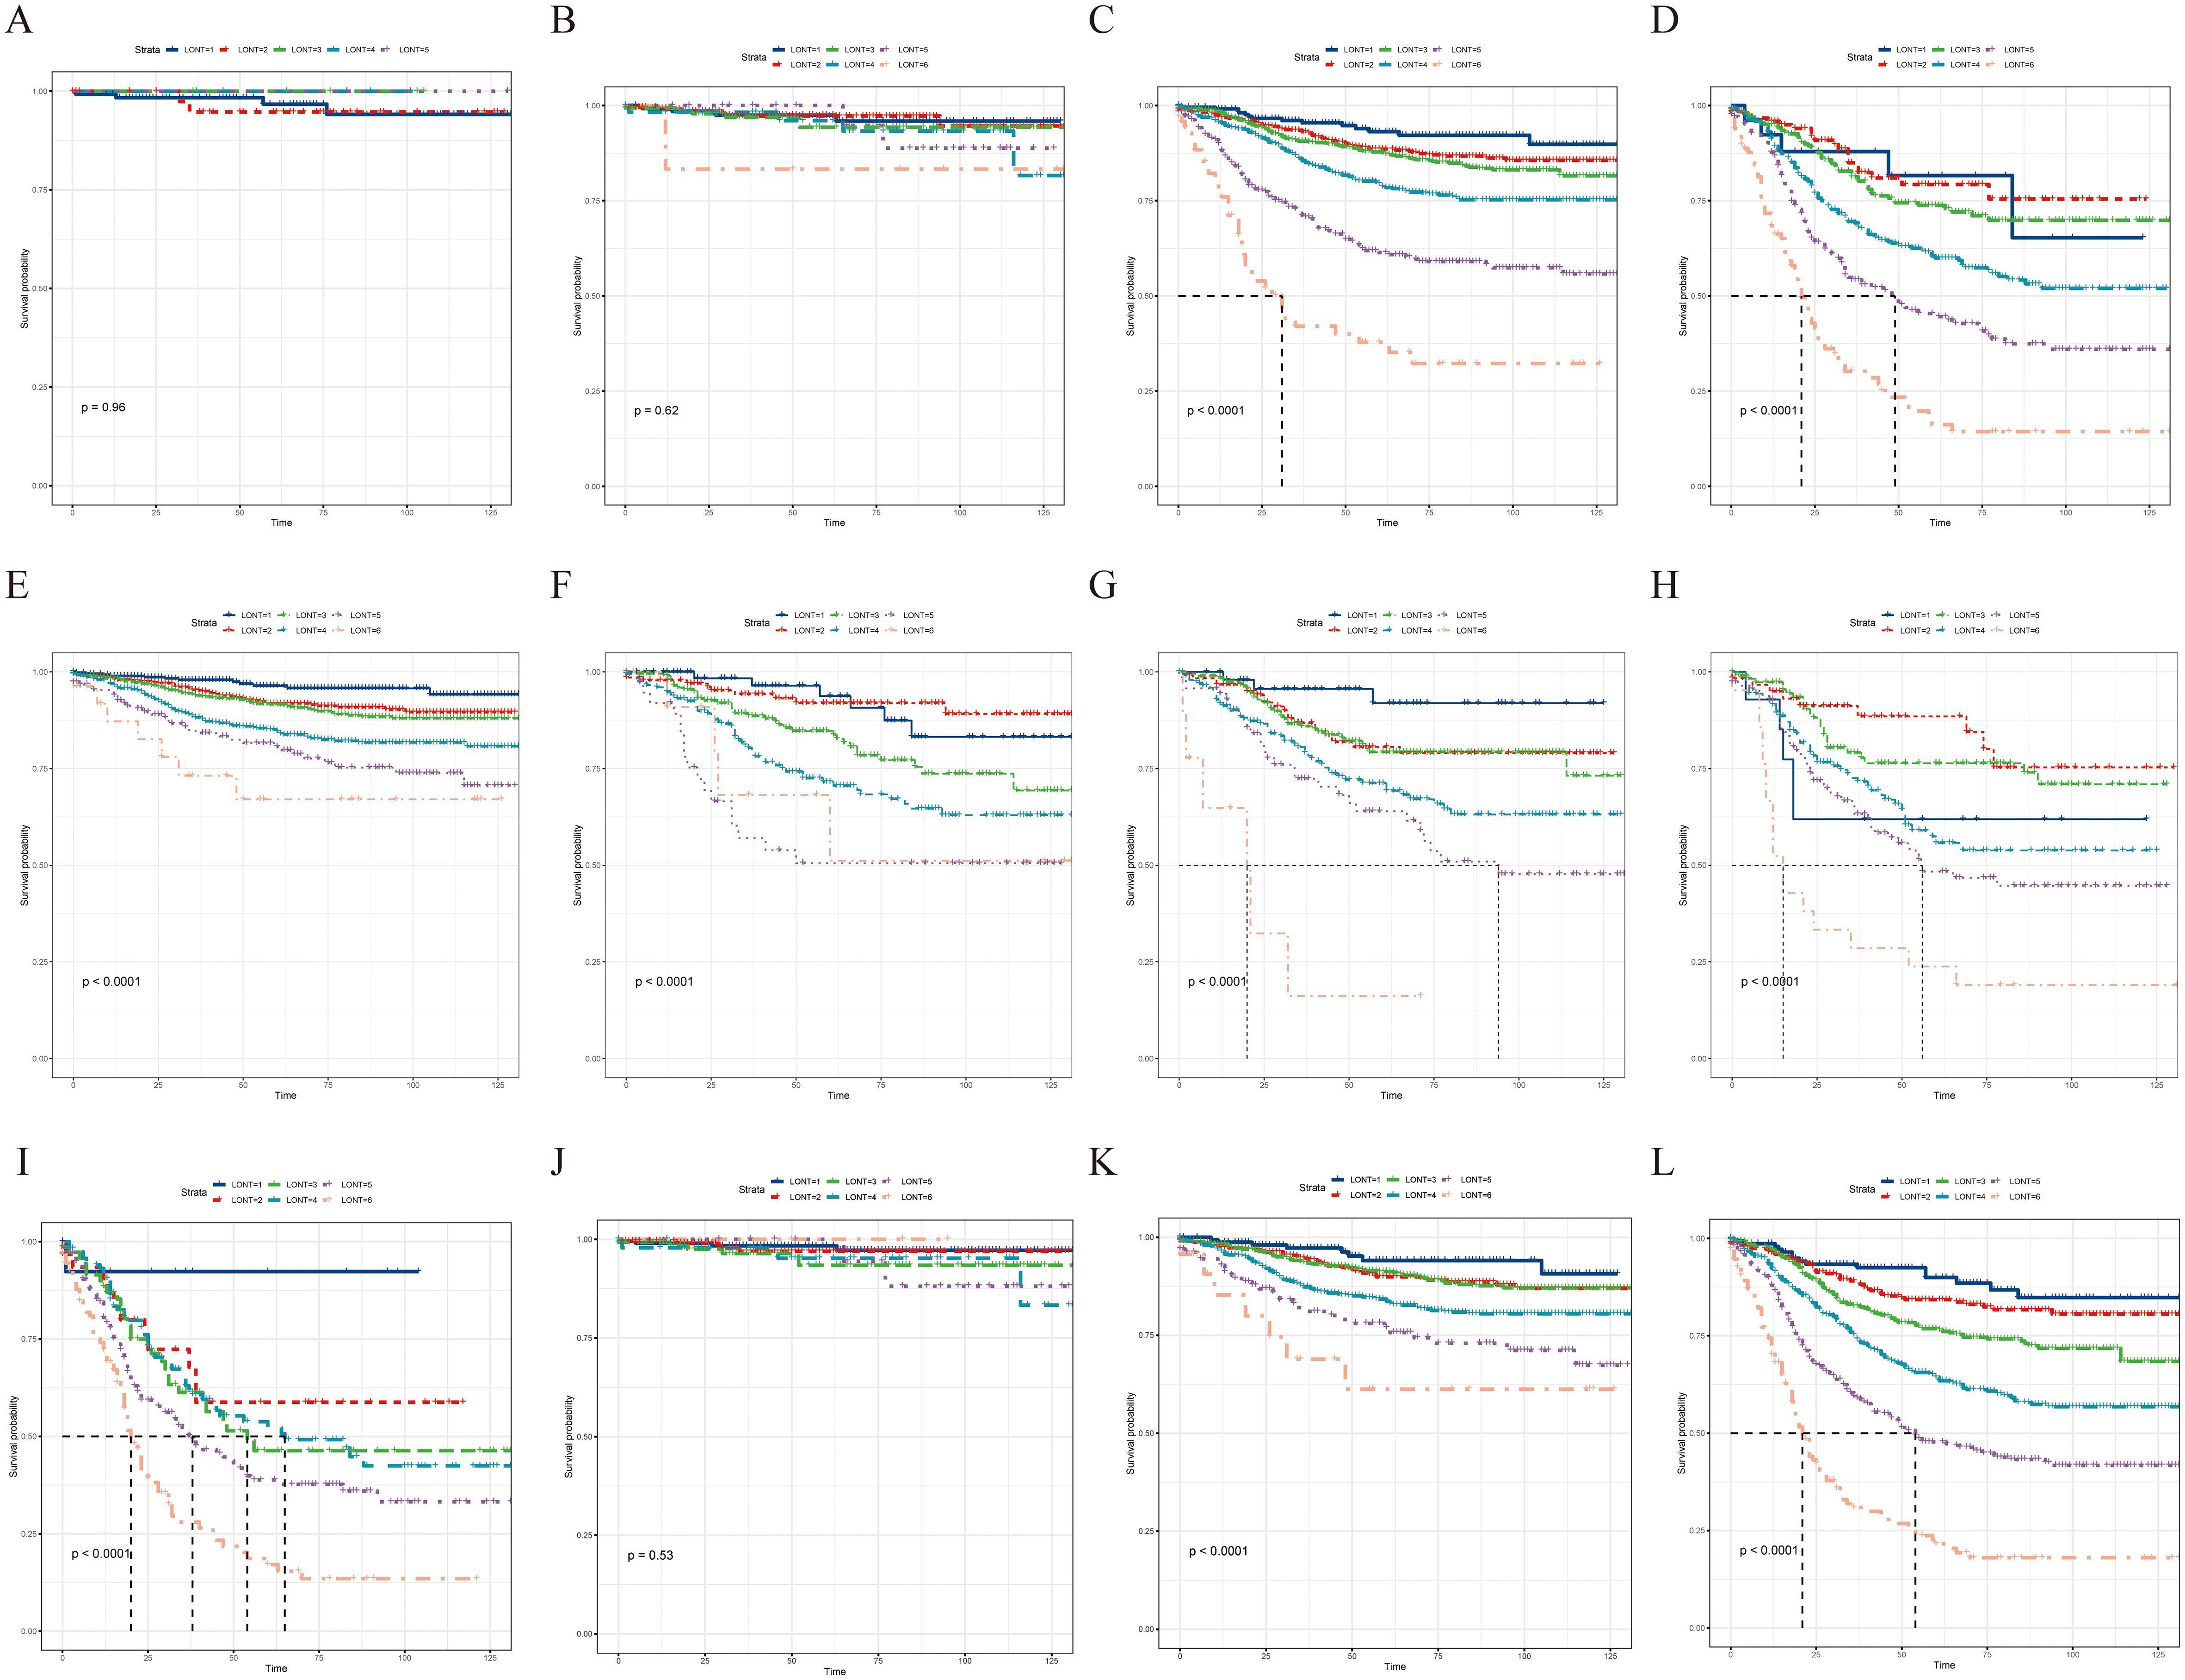
Figure 3. LONT differentiated the presentation of CSS in subgroup analyses. Kaplan–Meier curves evaluating CSS according to LONT classification in (A–D) pT stages I–III, (E–I) pN stages N0–N2b, and (J–L) pTNM stages I–III. CSS, cancer-specific survival; LONT, the log odds of negative lymph nodes/T stage ratio; TNM, tumor-node-metastasis.
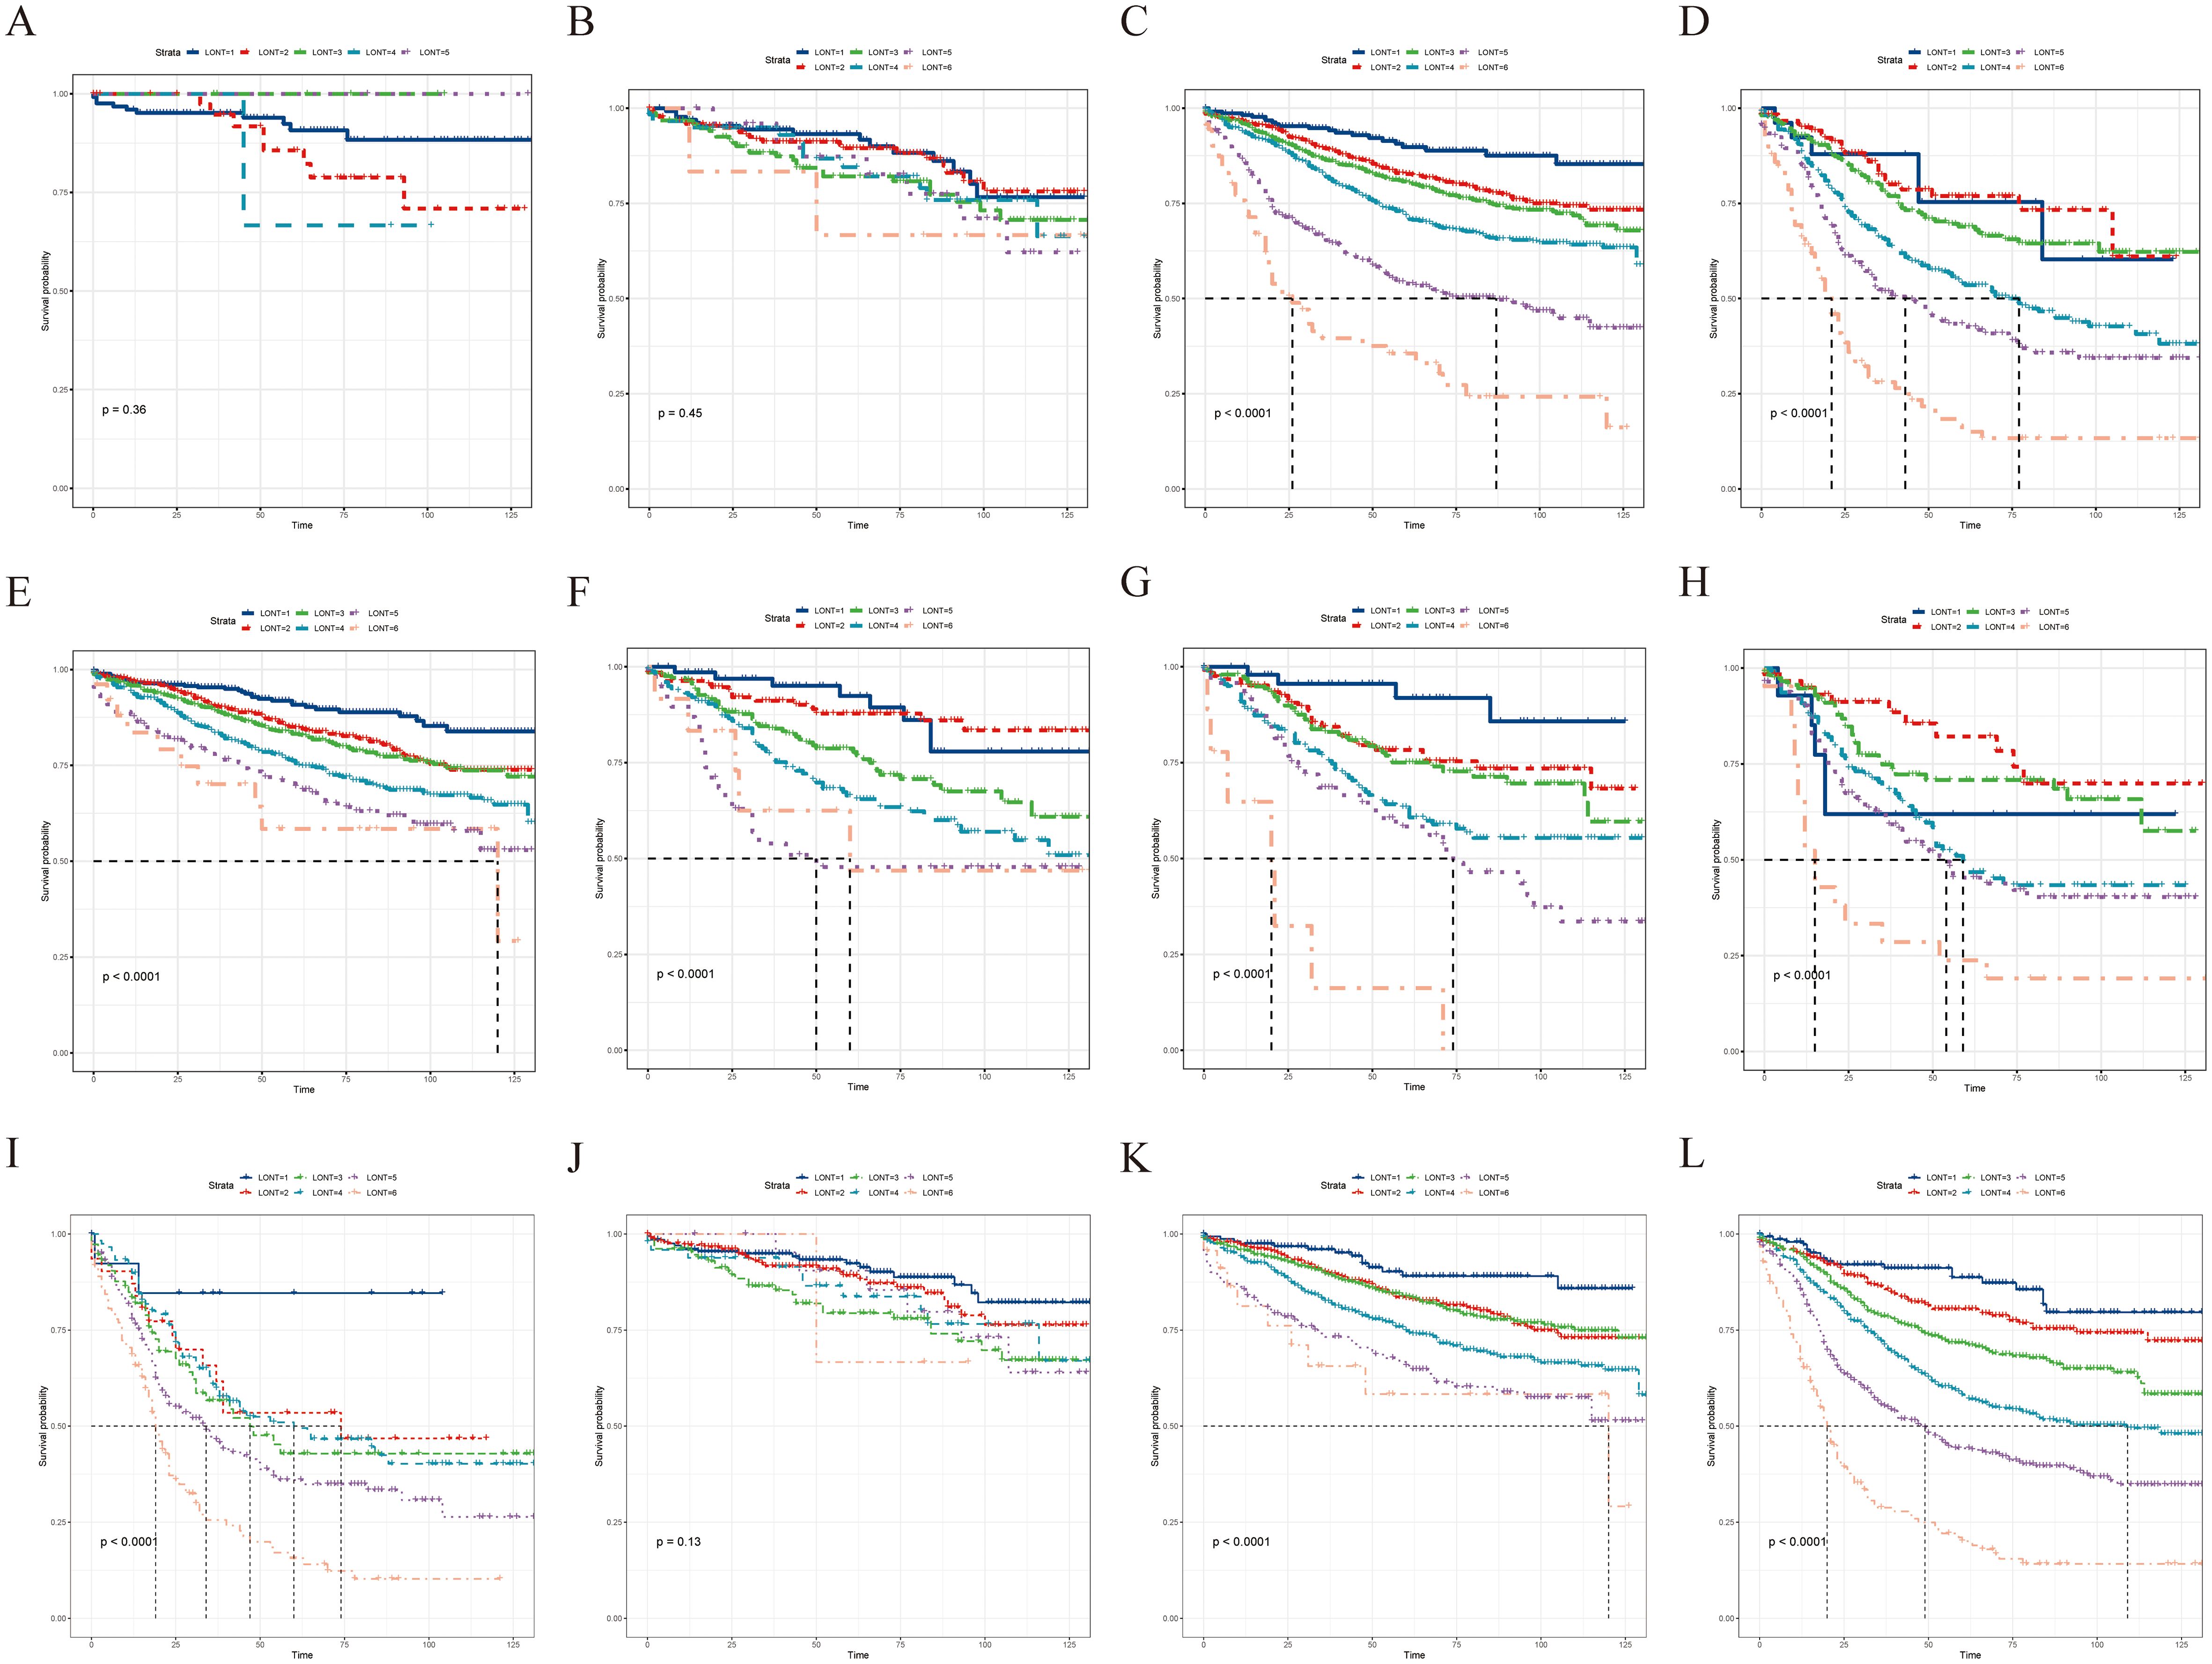
Figure 4. LONT differentiated the presentation of OS in the subgroup analyses. Kaplan–Meier curves evaluating OS according to LONT classification in (A–D) pT stages I–III, (E–I) pN stages N0–N2b, and (J–L) pTNM stages I–III. OS, overall survival; LONT, the log odds of negative lymph nodes/T stage ratio; TNM, tumor-node-metastasis.
Development of a novel prognostic staging system
On the basis of our findings, we proposed a novel prognostic staging system using RPA (Figure 5A). The RPA staging system consisted of stages I–IV (Figure 5B). Kaplan–Meier curves demonstrated survival differences between the groups (Figure 6A). Furthermore, we assessed the predictive performance of the RPA staging system using ROC analysis. The AUC values for predicting the 1-, 3-, and 5-year CSS were 0.712, 0.716, and 0.701, respectively (Figure 6B).
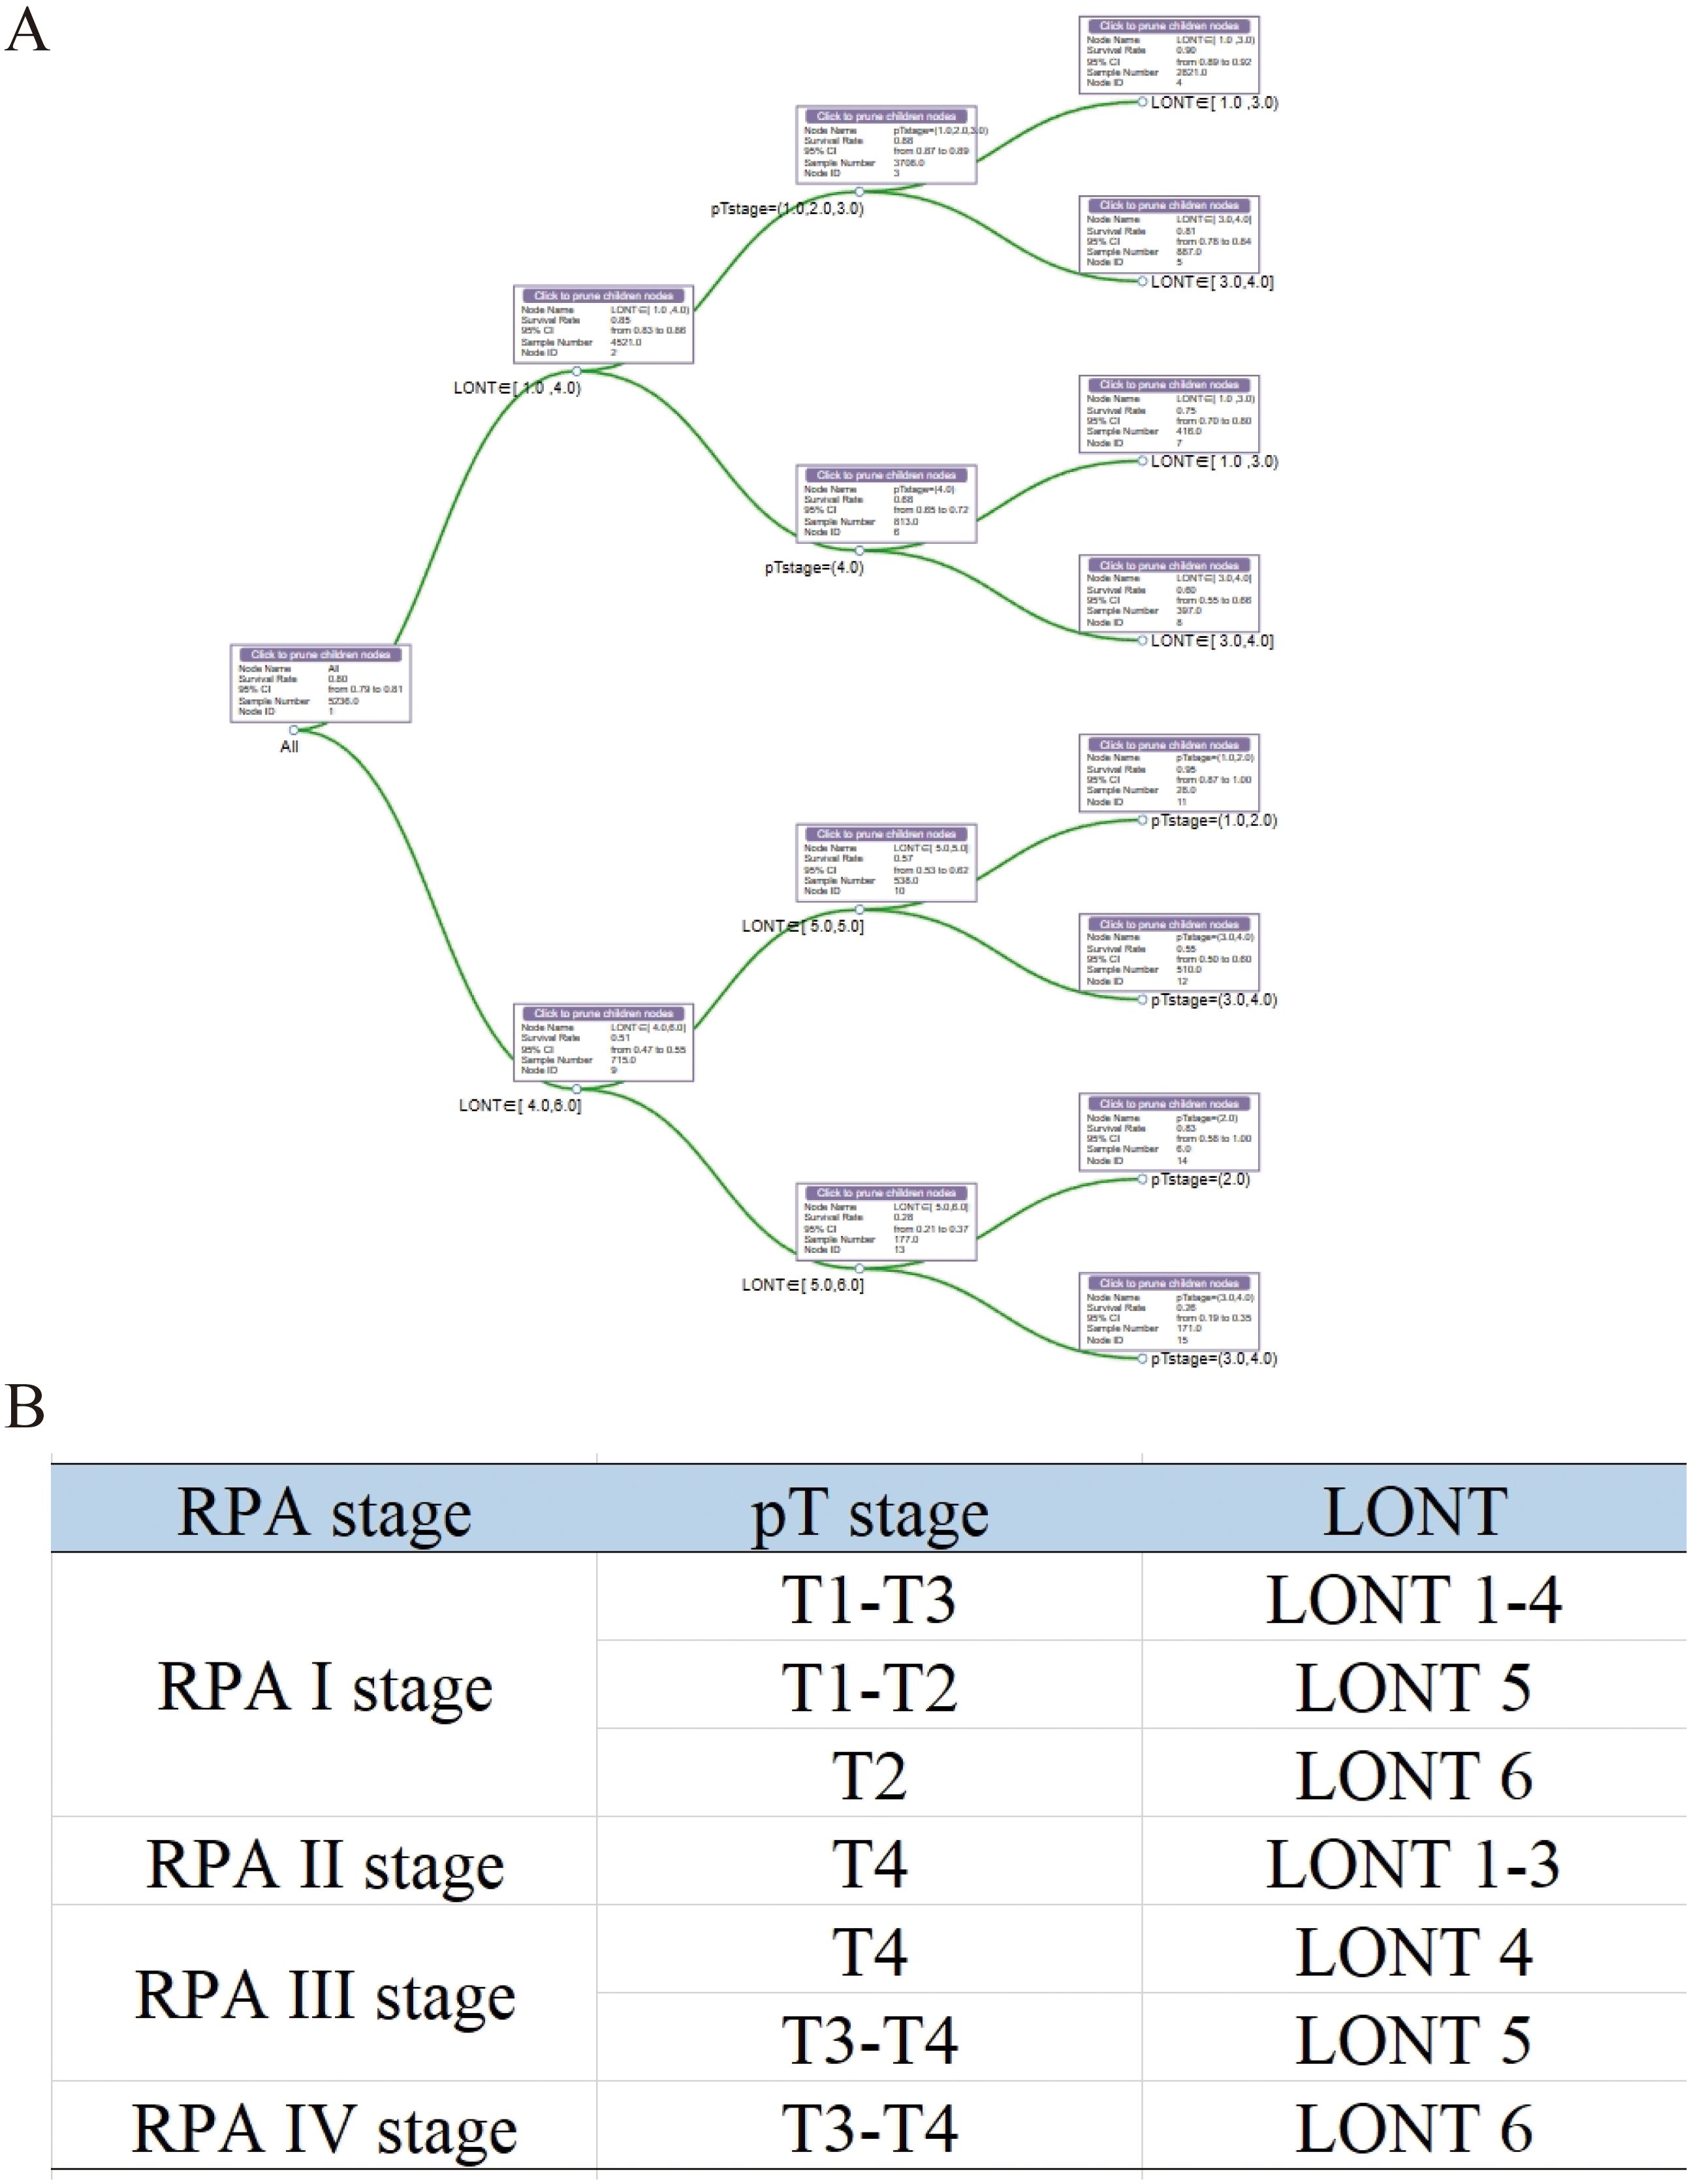
Figure 5. Development of an RPA staging system for prognostic stratification. (A) RPA for patients with colon MAC. (B) The RPA staging system. MAC, mucinous adenocarcinoma.
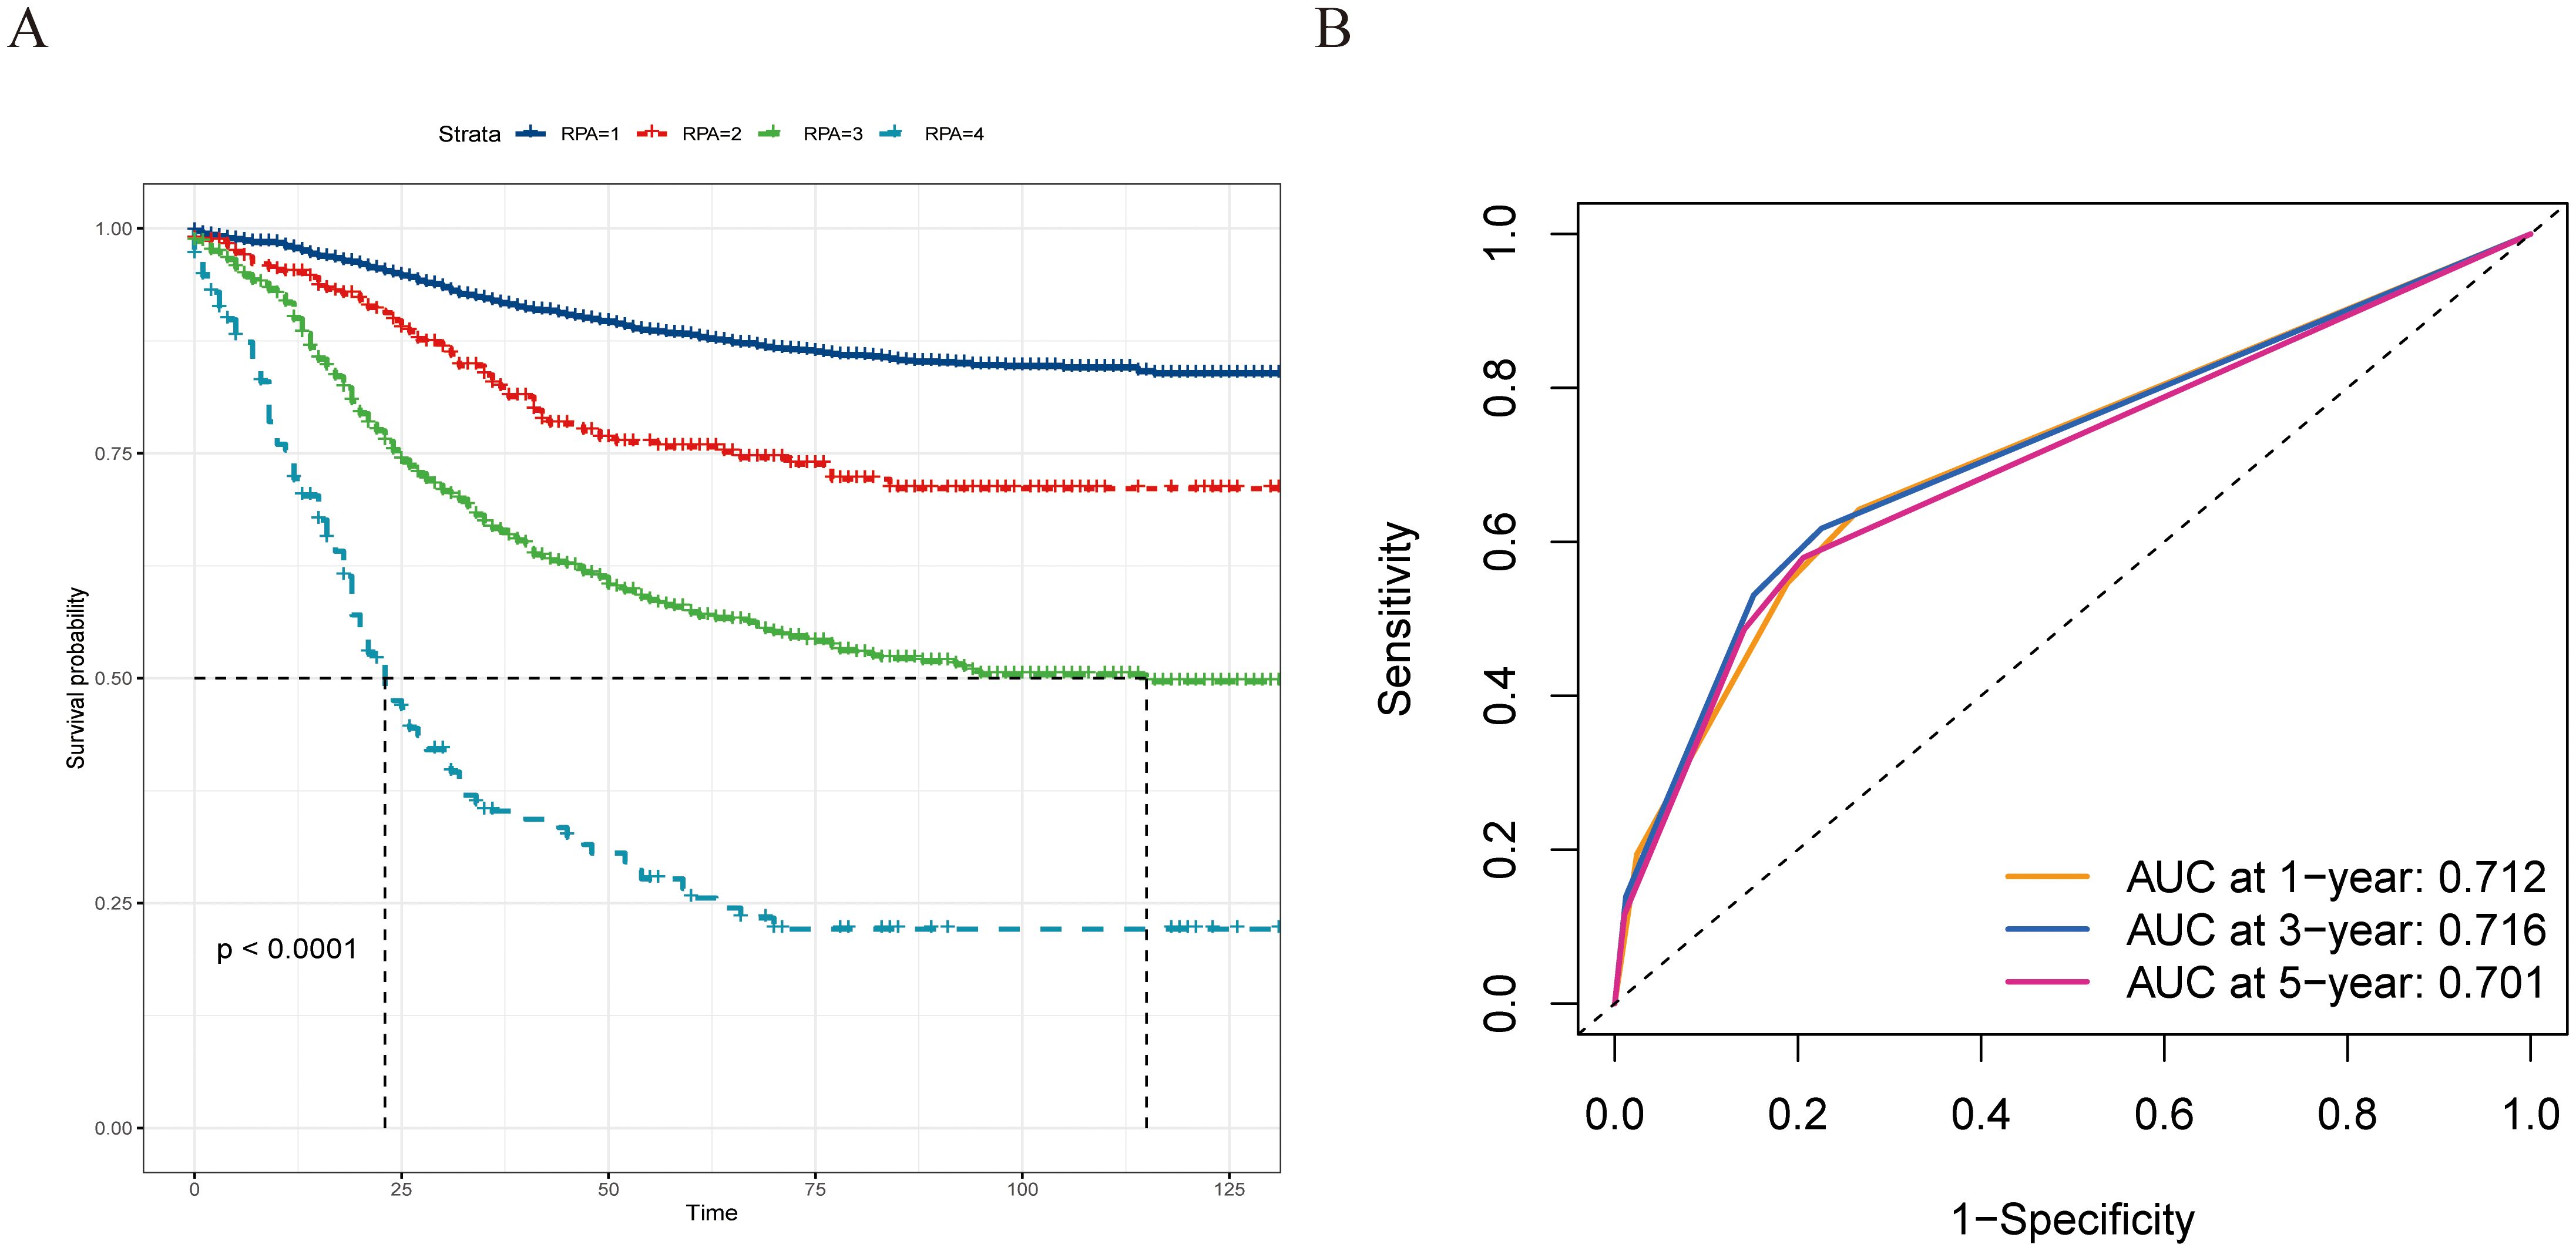
Figure 6. The prognostic evaluation capability of the recursive partitioning analysis staging system, and survival differences were observed across staging subgroups. (A) Kaplan–Meier curves evaluating CSS according to the novel staging system. (B) ROC curve of the 1-, 3-, and 5-year CSS prediction of the novel staging system (AUC in the bottom right of the figure). ROC, receiver operating characteristic curve; CSS, cancer-specific survival; AUC, the area under the ROC curve.
Discussion
This study included patients with colon MAC from the population-based SEER database, and the results demonstrated that LONT outperformed pT, pN, and pTNM stages in predicting 1-, 3-, and 5-year CSS and OS. Cox regression analysis identified LONT as an independent prognostic factor for CSS and OS. Furthermore, LONT was stratified into six subgroups, and multiple subgroup analyses revealed that LONT effectively differentiated the patient survival outcomes. Finally, a novel prognostic staging system was developed using the RPA. These findings provide valuable information to clinicians regarding the management of patients with colon MAC.
MAC is a histological subtype of colon cancer (5, 13–15). Patients with colon MAC are typically diagnosed with advanced disease (T3 or T4 stage) and lymph node metastasis (16, 17). The prognosis for colon MAC remains debatable. Several studies have linked MAC to poor outcomes (18–21). However, some studies indicate that, after adjusting for TNM staging, survival outcomes for MAC are comparable to those of adenocarcinoma (22, 23). Therefore, further evaluation of MAC prognosis is of clinical significance.
T staging and lymph node status are important prognostic factors and are integral components of the TNM staging system. Current research reveals that clinical outcomes vary among patients with the same TNM stage. This could be attributed to the limitation of N staging in reflecting the extent of lymph node dissection, as it only counts the PLNs. Standardized lymph node dissection is a surgical requirement for colon cancer. The inclusion of negative lymph nodes in the LONT calculation partially reflects the extent of lymph node dissection and metastasis. This may explain the improved prognostic predictive ability of LONT. Xie et al. (9) introduced the concept of LONT, which stands for log (NLNs+1)/T stage. This metric represents the T-stage-adjusted negative lymph nodes that reflect the extent of lymph node dissection in gastric cancer. In their study, LONT was independently correlated with gastric cancer prognosis. Yang et al. (24) also confirmed that LONT is a robust prognostic predictor in resectable gastric adenocarcinoma. Furthermore, the prognostic value of LONT has been validated in thyroid cancer without metastases (10) and bladder cancer (11). However, the prognostic value of LONT in colon MAC remains unclear. In this study, lower LONT was associated with poorer prognosis, and LONT was identified as an independent risk factor for CSS and OS in patients with colon MAC. Subgroup analysis of LONT revealed significant survival differences in the advanced pT (pT3 and pT4 stages), pN, pTNM II, and pTNM III stages. This indicates that some patients exhibited favorable outcomes in the pTNM II and pTNM III stages. Identification of these patients is clinically significant for patient management. However, LONT was unable to differentiate the prognosis in the pTNM I stage, probably due to the lower risk of early T-stage lymph node metastasis.
Given the superior performance of LONT in prognostic stratification, a new prognostic staging system was developed using RPA. RPA is used in tumor risk stratification to assist clinical decision-making by analyzing clinicopathological characteristics, making it a practical tool for the prognostic staging of various tumors (25–28). In this study, RPA was used to develop a novel RPA staging system (RPA stages I–IV) by combining the pT stage and LONT. RPA staging is performed clinically on the basis of the pathology of patients with colon MAC. Typically, a lower LONT indicates a poorer prognosis in patients with colon MAC. However, we identified some patients with lower LONT and favorable outcomes using RPA. Patients with pT2 and LONT6 (−0.7 < LONT ≤ 0.1) or pT1-T2 and LONT5 exhibited better clinical outcomes, thereby boosting the confidence of these patients to overcome the disease. Moreover, the newly established RPA staging system demonstrated a strong predictive performance for 1-, 3-, and 5-year CSS. This finding is clinically significant, aiding clinicians in devising personalized follow-up plans and providing patients with the assurance and confidence needed to overcome their condition.
Although we have elucidated the prognostic value of LONT in colon MAC for the first time, our study has certain limitations. First, despite being a population-based study, this was a retrospective study. Second, the SEER database lacks potential prognostic factors, including lymphovascular invasion, perineural invasion, and tumor budding. This limits our ability to assess the impact of lymphovascular invasion, perineural invasion, and tumor budding on the prognosis of patients with colon MAC, as well as to perform risk stratification based on these characteristics. Therefore, large-scale prospective studies are required to validate our findings further and clinically apply the RPA staging system to patients with colon MAC.
Conclusions
LONT serves as a robust prognostic marker for patients with colon MAC. A lower LONT was associated with poorer clinical outcomes. A novel staging system that combines the pT stage and LONT was developed using RPA. The RPA staging system facilitates personalized risk stratification of patients, thereby aiding clinical decision-making.
Data availability statement
The original contributions presented in the study are included in the article/supplementary material. Further inquiries can be directed to the corresponding author.
Ethics statement
The studies involving humans were approved by the Ethics Committee of the First Affiliated Hospital of Fujian Medical University. The studies were conducted in accordance with the local legislation and institutional requirements. The ethics committee/institutional review board waived the requirement of written informed consent for participation from the participants or the participants\’ legal guardians/next of kin.
Author contributions
HC: Conceptualization, Funding acquisition, Methodology, Writing – original draft. JTZ: Data curation, Formal analysis, Writing – original draft. YW: Methodology, Software, Writing – original draft. JFZ: Supervision, Writing – review & editing. XL: Supervision, Writing – review & editing. GG: Conceptualization, Funding acquisition, Supervision, Writing – review & editing.
Funding
The author(s) declare financial support was received for the research, authorship, and/or publication of this article. This study was supported by the National Natural Science Foundation of China (No.82172800), Joint Funds for the Innovation of Science and Technology, Fujian Province (No.2023Y9082), and Talent programs granted from The First Affiliated Hospital of Fujian Medical University (YJRC4198).
Acknowledgments
The authors thank all the staff in the Department of colorectal surgery, The First Affiliated Hospital of Fujian Medical University, Fuzhou, Fujian Province, People’s Republic of China.
Conflict of interest
The authors declare that the research was conducted in the absence of any commercial or financial relationships that could be construed as a potential conflict of interest.
Publisher’s note
All claims expressed in this article are solely those of the authors and do not necessarily represent those of their affiliated organizations, or those of the publisher, the editors and the reviewers. Any product that may be evaluated in this article, or claim that may be made by its manufacturer, is not guaranteed or endorsed by the publisher.
References
1. Bray F, Laversanne M, Sung H, Ferlay J, Siegel RL, Soerjomataram I, et al. Global cancer statistics 2022: GLOBOCAN estimates of incidence and mortality worldwide for 36 cancers in 185 countries. CA Cancer J Clin. (2024) 74:229–63. doi: 10.3322/caac.21834
2. Wei W, Zeng H, Zheng R, Zhang S, An L, Chen R, et al. Cancer registration in China and its role in cancer prevention and control. Lancet Oncol. (2020) 21:e342–9. doi: 10.1016/S1470-2045(20)30073-5
3. O’Connell E, Reynolds IS, McNamara DA, Burke JP, Prehn JHM. Resistance to cell death in mucinous colorectal cancer-A review. Cancers (Basel). (2021) 13(6):1389. doi: 10.3390/cancers13061389
4. Luo C, Cen S, Ding G, Wu W. Mucinous colorectal adenocarcinoma: clinical pathology and treatment options. Cancer Commun (Lond). (2019) 39:13. doi: 10.1186/s40880-019-0361-0
5. Huang A, Yang Y, Shi JY, Li YK, Xu JX, Cheng Y, et al. Mucinous adenocarcinoma: A unique clinicopathological subtype in colorectal cancer. World J gastrointestinal Surg. (2021) 13:1567–83. doi: 10.4240/wjgs.v13.i12.1567
6. Qiao Y, Zhu J, Han T, Jiang X, Wang K, Chen R, et al. Finding the minimum number of retrieved lymph nodes in node-negative colorectal cancer using Real-world Data and the SEER database. Int J Surg (London England). (2023) 109:4173–84. doi: 10.1097/JS9.0000000000000746
7. Duraker N, Civelek Çaynak Z, Hot S. The prognostic value of the number of lymph nodes removed in patients with node-negative colorectal cancer. Int J Surg (London England). (2014) 12:1324–7. doi: 10.1016/j.ijsu.2014.10.038
8. Guan X, Jiao S, Wen R, Yu G, Liu J, Miao D, et al. Optimal examined lymph node number for accurate staging and long-term survival in rectal cancer: a population-based study. Int J Surg (London England). (2023) 109:2241–8. doi: 10.1097/JS9.0000000000000320
9. Xie J, Pang Y, Li X, Wu X. The log odds of negative lymph nodes/T stage: a new prognostic and predictive tool for resected gastric cancer patients. J Cancer Res Clin Oncol. (2021) 147:2259–69. doi: 10.1007/s00432-021-03654-y
10. Wang X, Wu Y, Li X, Hong J, Zhang M. Log odds of negative lymph nodes/T stage ratio (LONT): A new prognostic tool for differentiated thyroid cancer without metastases in patients aged 55 and older. Front Endocrinol. (2023) 14:1132687. doi: 10.3389/fendo.2023.1132687
11. Chen T, Zhan X, Chen X, Jiang M, Wan H, Fu B, et al. Predictive value of the log odds of negative lymph nodes/T stage as a novel prognostic factor in bladder cancer patients after radical cystectomy. Front Oncol. (2022) 12:895413. doi: 10.3389/fonc.2022.895413
12. Xie Y, Luo X, Li H, Xu Q, He Z, Zhao Q, et al. autoRPA: A web server for constructing cancer staging models by recursive partitioning analysis. Comput Struct Biotechnol J. (2020) 18:3361–7. doi: 10.1016/j.csbj.2020.10.038
13. Reynolds IS, O’Connell E, Fichtner M, McNamara DA, Kay EW, Prehn JHM, et al. Mucinous adenocarcinoma is a pharmacogenomically distinct subtype of colorectal cancer. pharmacogenomics J. (2020) 20:524–32. doi: 10.1038/s41397-019-0137-6
14. Xu Y, Chen X, Chen Y, Wu X, Fang Q, Tan X, et al. Colorectal mucinous adenocarcinoma indicates a meaningful subtype: A whole genome sequencing study. Clin Trans Med. (2023) 13:e1246. doi: 10.1002/ctm2.v13.4
15. Debunne H, Ceelen W. Mucinous differentiation in colorectal cancer: molecular, histological and clinical aspects. Acta chirurgica Belgica. (2013) 113:385–90. doi: 10.1080/00015458.2013.11680951
16. Li J, Yang L, Bai F, Cai Y, Zhang J, Wu Z, et al. Clinicopathological, molecular features and prognosis of colorectal cancer with mucinous component. Future Oncol. (2021) 17:1351–62. doi: 10.2217/fon-2020-1055
17. Ott C, Gerken M, Hirsch D, Fest P, Fichtner-, Munker S, et al. Advanced mucinous colorectal cancer: epidemiology, prognosis and efficacy of chemotherapeutic treatment. Digestion. (2018) 98:143–52. doi: 10.1159/000487710
18. Kim CW, Cha JM, Kwak MS. Identification of potential biomarkers and biological pathways for poor clinical outcome in mucinous colorectal adenocarcinoma. Cancers (Basel). (2021) 13(13):3280. doi: 10.3390/cancers13133280
19. Mekenkamp LJ, Heesterbeek KJ, Koopman M, Tol J, Teerenstra S, Venderbosch S, et al. Mucinous adenocarcinomas: poor prognosis in metastatic colorectal cancer. Eur J Cancer. (2012) 48:501–9. doi: 10.1016/j.ejca.2011.12.004
20. Hyngstrom JR, Hu CY, Xing Y, You YN, Feig BW, Skibber JM, et al. Clinicopathology and outcomes for mucinous and signet ring colorectal adenocarcinoma: analysis from the National Cancer Data Base. Ann Surg Oncol. (2012) 19:2814–21. doi: 10.1245/s10434-012-2321-7
21. Verhulst J, Ferdinande L, Demetter P, Ceelen W. Mucinous subtype as prognostic factor in colorectal cancer: a systematic review and meta-analysis. J Clin Pathol. (2012) 65:381–8. doi: 10.1136/jclinpath-2011-200340
22. Catalano V, Loupakis F, Graziano F, Bisonni R, Torresi U, Vincenzi B, et al. Prognosis of mucinous histology for patients with radically resected stage II and III colon cancer. Ann Oncol. (2012) 23:135–41. doi: 10.1093/annonc/mdr062
23. Inamura K, Yamauchi M, Nishihara R, Kim SA, Mima K, Sukawa Y, et al. Prognostic significance and molecular features of signet-ring cell and mucinous components in colorectal carcinoma. Ann Surg Oncol. (2015) 22:1226–35. doi: 10.1245/s10434-014-4159-7
24. Yang W, Lu S, Ge F, Hua Y, Chen X. Prognostic and predictive model of the log odds of the negative lymph node/T stage ratio in resectable gastric adenocarcinoma patients. J Gastrointest Surg. (2022) 26:1743–56. doi: 10.1007/s11605-022-05408-8
25. Sun XS, Zhu MY, Wen DX, Luo DH, Sun R, Chen QY, et al. Establishment and validation of a recursive partitioning analysis based prognostic model for guiding re-radiotherapy in locally recurrent nasopharyngeal carcinoma patients. Radiotherapy oncology: J Eur Soc Ther Radiol Oncol. (2022) 168:61–8. doi: 10.1016/j.radonc.2022.01.026
26. Lin JX, Wang ZK, Wang W, Xie JW, Wang JB, Lu J, et al. Development and validation of a new staging system for node-negative gastric cancer based on recursive partitioning analysis: An international multi-institutional study. Cancer Med. (2019) 8:2962–70. doi: 10.1002/cam4.2019.8.issue-6
27. Zheng Y, Fu S, He T, Yan Q, Di W, Wang J. Predicting prognosis in resected esophageal squamous cell carcinoma using a clinical nomogram and recursive partitioning analysis. Eur J Surg Oncol. (2018) 44:1199–204. doi: 10.1016/j.ejso.2018.04.011
28. Yao Y, Sun X, Huang H, Wang Z, Fang X, Chen M, et al. Proposed prognostic subgroups and facilitated clinical decision-making for additional locoregional radiotherapy in de novo metastatic nasopharyngeal carcinoma: a retrospective study based on recursive partitioning analysis. Radiat Oncol. (2023) 18:15. doi: 10.1186/s13014-022-02168-2
Keywords: colon mucinous adenocarcinoma, LONT, prognosis, recursive partitioning analysis, staging system
Citation: Cai H, Zeng J, Wang Y, Zhuang J, Liu X and Guan G (2024) Recursive partitioning staging system based on the log odds of the negative lymph node/T stage ratio in colon mucinous adenocarcinoma. Front. Immunol. 15:1472620. doi: 10.3389/fimmu.2024.1472620
Received: 29 July 2024; Accepted: 04 December 2024;
Published: 20 December 2024.
Edited by:
Sherin Bakhashab, King Abdulaziz University, Saudi ArabiaReviewed by:
Ali-Farid Safi, Craniologicum - Center for Craniomaxillofacial Surgery, SwitzerlandShaohua Qi, Houston Methodist Research Institute, United States
Copyright © 2024 Cai, Zeng, Wang, Zhuang, Liu and Guan. This is an open-access article distributed under the terms of the Creative Commons Attribution License (CC BY). The use, distribution or reproduction in other forums is permitted, provided the original author(s) and the copyright owner(s) are credited and that the original publication in this journal is cited, in accordance with accepted academic practice. No use, distribution or reproduction is permitted which does not comply with these terms.
*Correspondence: Guoxian Guan, Zmp4aGdneEAxNjMuY29t
†These authors have contributed equally to this work
 Huajun Cai†
 Guoxian Guan