 Wei He1†
 Yanfang Li1†
 Song-Bai Liu2*†Ying Chang1†Shiyuan Han1Xingyu Han1Zixin Ma1
 Hesham M. Amin3Yao-Hua Song1*Jin Zhou4*
- 1Cyrus Tang Hematology Center, Soochow University, Suzhou, China
- 2Suzhou Key Laboratory of Medical Biotechnology, Suzhou Vocational Health College, Suzhou, China
- 3Department of Hematopathology, the University of Texas MD Anderson Cancer Center, Houston, TX, United States
- 4Department of General Surgery, the First Affiliated Hospital of Soochow University, Suzhou, China
Acetyl CoA acetyltransferase 1 (ACAT1), a mitochondrial enzyme, is mainly involved in the formation and decomposition of ketones, isoleucine, and fatty acids. Previous clinical studies showed that mutations in the ACAT1 gene lead to ketoacidosis, Notably the role of ACAT1 in human cancer’ pathogenesis varies depending on cancer type, and its specific role in gastric cancer remains largely unknown. In the current study, we found that the expression of ACAT1 in primary late-stage gastric cancer tumor tissues was significantly lower than in early-stage tumors. This observation was further confirmed in high-grade gastric cancer cell line MKN45. The expression of CD44 and OCT4 was decreased, while CD24 expression was increased by overexpressing ACAT1 in MKN45 gastric cancer cells. Moreover, the ability of gastric cancer cells to form colonies on soft agar was also reduced by ACAT1 overexpression. Likewise, overexpression of ACAT1 inhibited epithelial mesenchymal transition (EMT) in gastric cancer cells evidenced by increased expression of the epithelial marker E-Cadherin, decreased expression of mesenchymal marker vimentin, and decreased expression levels of SNAI 1/3. In addition, ACAT1 overexpression inhibited cell migration and invasion, improved the response to 5-Fluorouracil (5-FU) and etoposide. In contrast, inhibition of ACAT1 activity promoted the proliferation of gastric cancer cells. The xenotransplantation results in nude mice showed that overexpression of ACAT1 in gastric cancer cells inhibited tumor growth in vivo. In addition, the low expression of ACAT1 in gastric cancer was further validated by searching public databases and conducting bioinformatic analyses. Mechanistically, bioinformatic analysis found that the inhibitory effect of ACAT1 in gastric cancer may be related to the Adipocytokine Signaling Pathway, Ppar Signaling Pathway, Propanoate Metabolism and P53 Signaling Pathway. Correlation analysis indicated ACAT1 mRNA expression was correlated with immune infiltrates. Collectively, our data show that ACAT1 induces pronounced inhibitory effects on gastric cancer initiation and development, which may impact future strategies to treat this aggressive cancer.
Introduction
Cancer stem cells (CSCs) possess inherent ability of self-renewal and tumor-initiating. CSCs are pluripotent as they can produce diverse cell types that differentiate into different tissues that make up the entire tumor (1). To survive in hostile microenvironment and evade the host’s immune system, cancer cells undergo changes in gene expression, transition between cell types, and alter metabolism. These adaptations are crucial in for cancer establishment, growth, metastasis, and treatment resistance. CD44 and OCT4 have emerged as survival biomarkers in various solid tumors, including gastric cancer (2). CD44 expression is linked to promoting cancer cell proliferation, self-renewal, and metastasis (3–6). OCT4 contributes to tumor transformation, drug resistance (7), and invasion (8–10). In gastric cancer stem cells, CD44 is overexpressed while CD24 is under expressed (11, 12).
Epithelial mesenchymal transition (EMT) is a dynamic process involving the transformation of epithelial cells into mesenchymal cells. For cancer cells to migrate from their original location and infiltrate blood vessels, they must undergo changes that enhance their flexibility by altering the cytoskeleton. These adaptations allow tumor cells to breach the walls of small blood vessels and enter the bloodstream (13). Once in the bloodstream, these cells can migrate to invade distant organs. During EMT, epithelial cells lose their adhesion molecules, which leads to the loss of apical-basal polarity (14). EMT is also characterized by a decrease in the expression of the epithelial cell marker E-cadherin, and an increase in the mesenchymal marker vimentin (15). Understanding the roles of cancer stem cells and EMT markers is essential for advancing cancer treatment strategies.
Acetyl CoA acetyltransferase 1 (ACAT1) was initially linked to β-ketothiolase deficiency, where mutations in ACAT1 gene result in recurrent episodes of ketosis characterized by vomiting, dehydration, and shortness of breath (16–19). More recent studies have associated ACAT1 expression and cancer. Increased levels of ACAT1 have been observed in cancers of the prostate, endometrium, breast, and liver. Conversely, ACAT1 levels are decreased in renal cell carcinoma, nasopharyngeal carcinoma, and glioma. Elevated ACAT1 activity has also been detected in head and neck cancer, lung cancer, and leukemia. Notably, the expression and role of ACTA1 in gastric cancer is not completely understood. In this study, we investigated the correlation between ACAT1 expression and gastric cancer. Overexpression of ACAT1 in gastric cancer cells resulted in decreased expression levels of CD44 and OCT4, while the expression level of CD24 increased. Additionally, gastric cells with overexpressed ACAT1 exhibited significantly reduced migration and invasion abilities, and improved the response to chemotherapy drugs.
Results
The expression of ACAT1 is downregulated in advanced gastric cancer
To analyze the expression of ACAT1 in gastric cancer, a Western blot analysis was performed on 88 pairs of gastric cancer and adjacent noncancerous tissue samples from patients at stages I-IV. The results showed that ACAT1 is expressed at significantly lower levels in gastric cancer tissues than in the adjacent benign tissues (Figures 1A, B). Notably, there was a marked reduction in ACAT1 expression in late-stage gastric cancer compared to early stage cancer tissues, suggesting that ACAT1 may have an inhibitory effect on the progression of gastric cancer (Figures 1C, D).
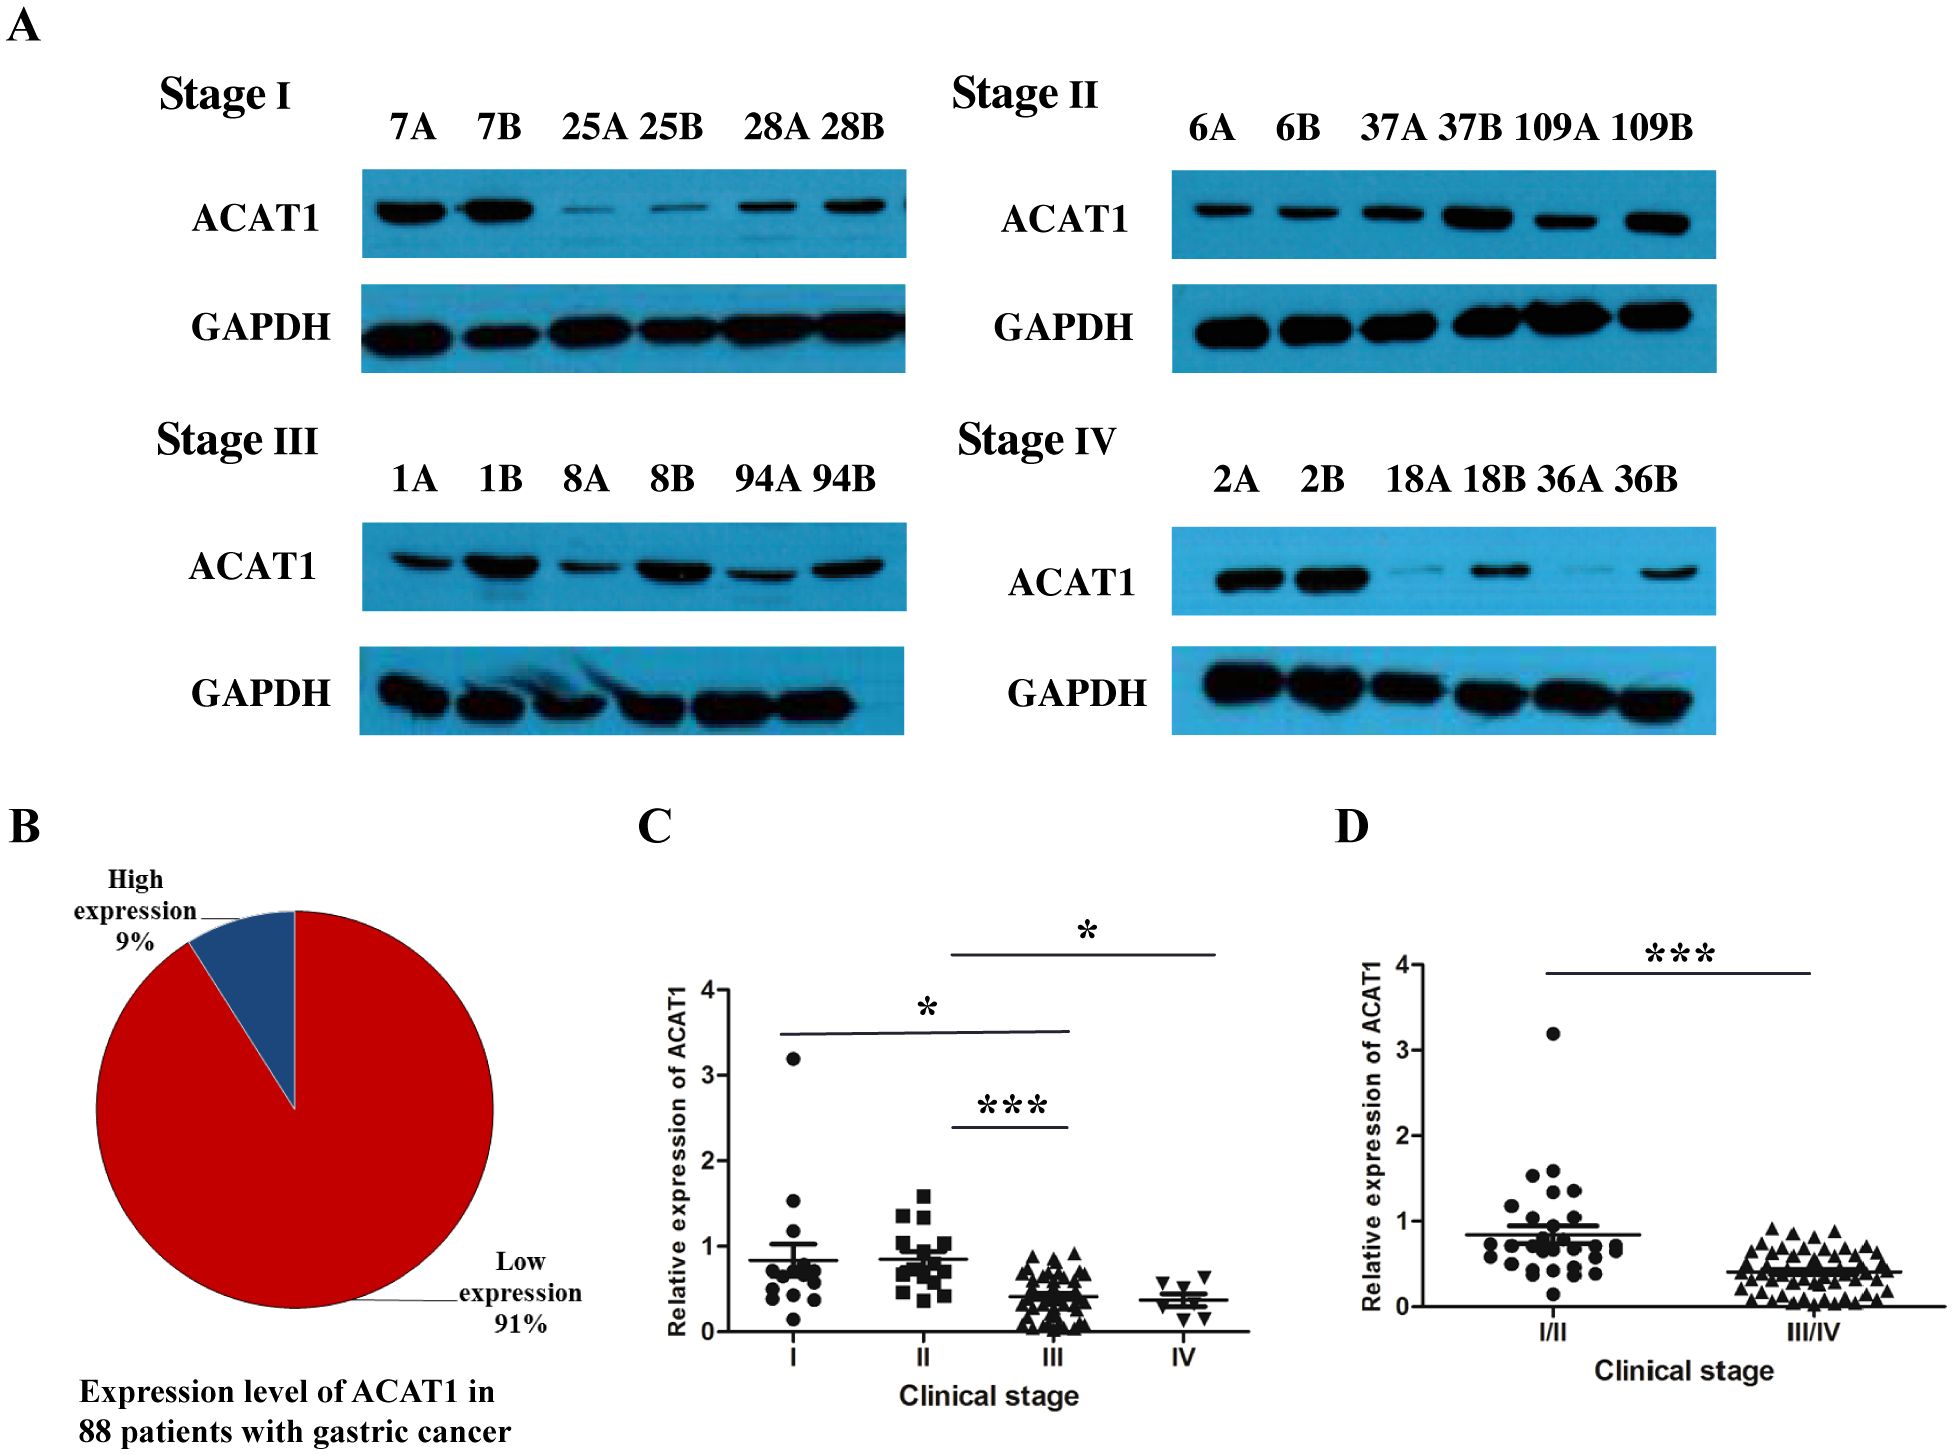
Figure 1. The relative expression of ACAT1 (cancer tissue/paracancerous tissue) was significantly decreased in patients with advanced gastric cancer. (A) Western blot analysis of protein expression of ACAT1 in gastric cancer patient tumor tissues at different stages. A: gastric cancer tissue, B: adjacent noncancerous area. (B) The proportion of patients with high expression of ACAT1 and those with low expression of ACAT1 in 88 pairs of samples with stage I-IV gastric cancer. (C, D) Relative expression of 88 pairs of gastric cancer patient samples. Relative expression = the normalized value of cancer tissue/the normalized value of adjacent tissue. Values are means ± SD. *p < 0.05, ***p < 0.001.
ACAT1 exhibits the highest expression level in AGS cells
To explore the function of ACAT1 in gastric cancer, we analyzed three different gastric cancer cell lines: MKN45, N87, and AGS. Using RT-qPCR and Western blot, we measured mRNA and protein expression levels of ACAT1 in these cell lines. Our data show that AGS cells have the highest expression of ACAT1, followed by N87 and then the MKN45 cells (Figures 2A–C). These expression levels were further confirmed through immunofluorescence staining (Figure 2D).
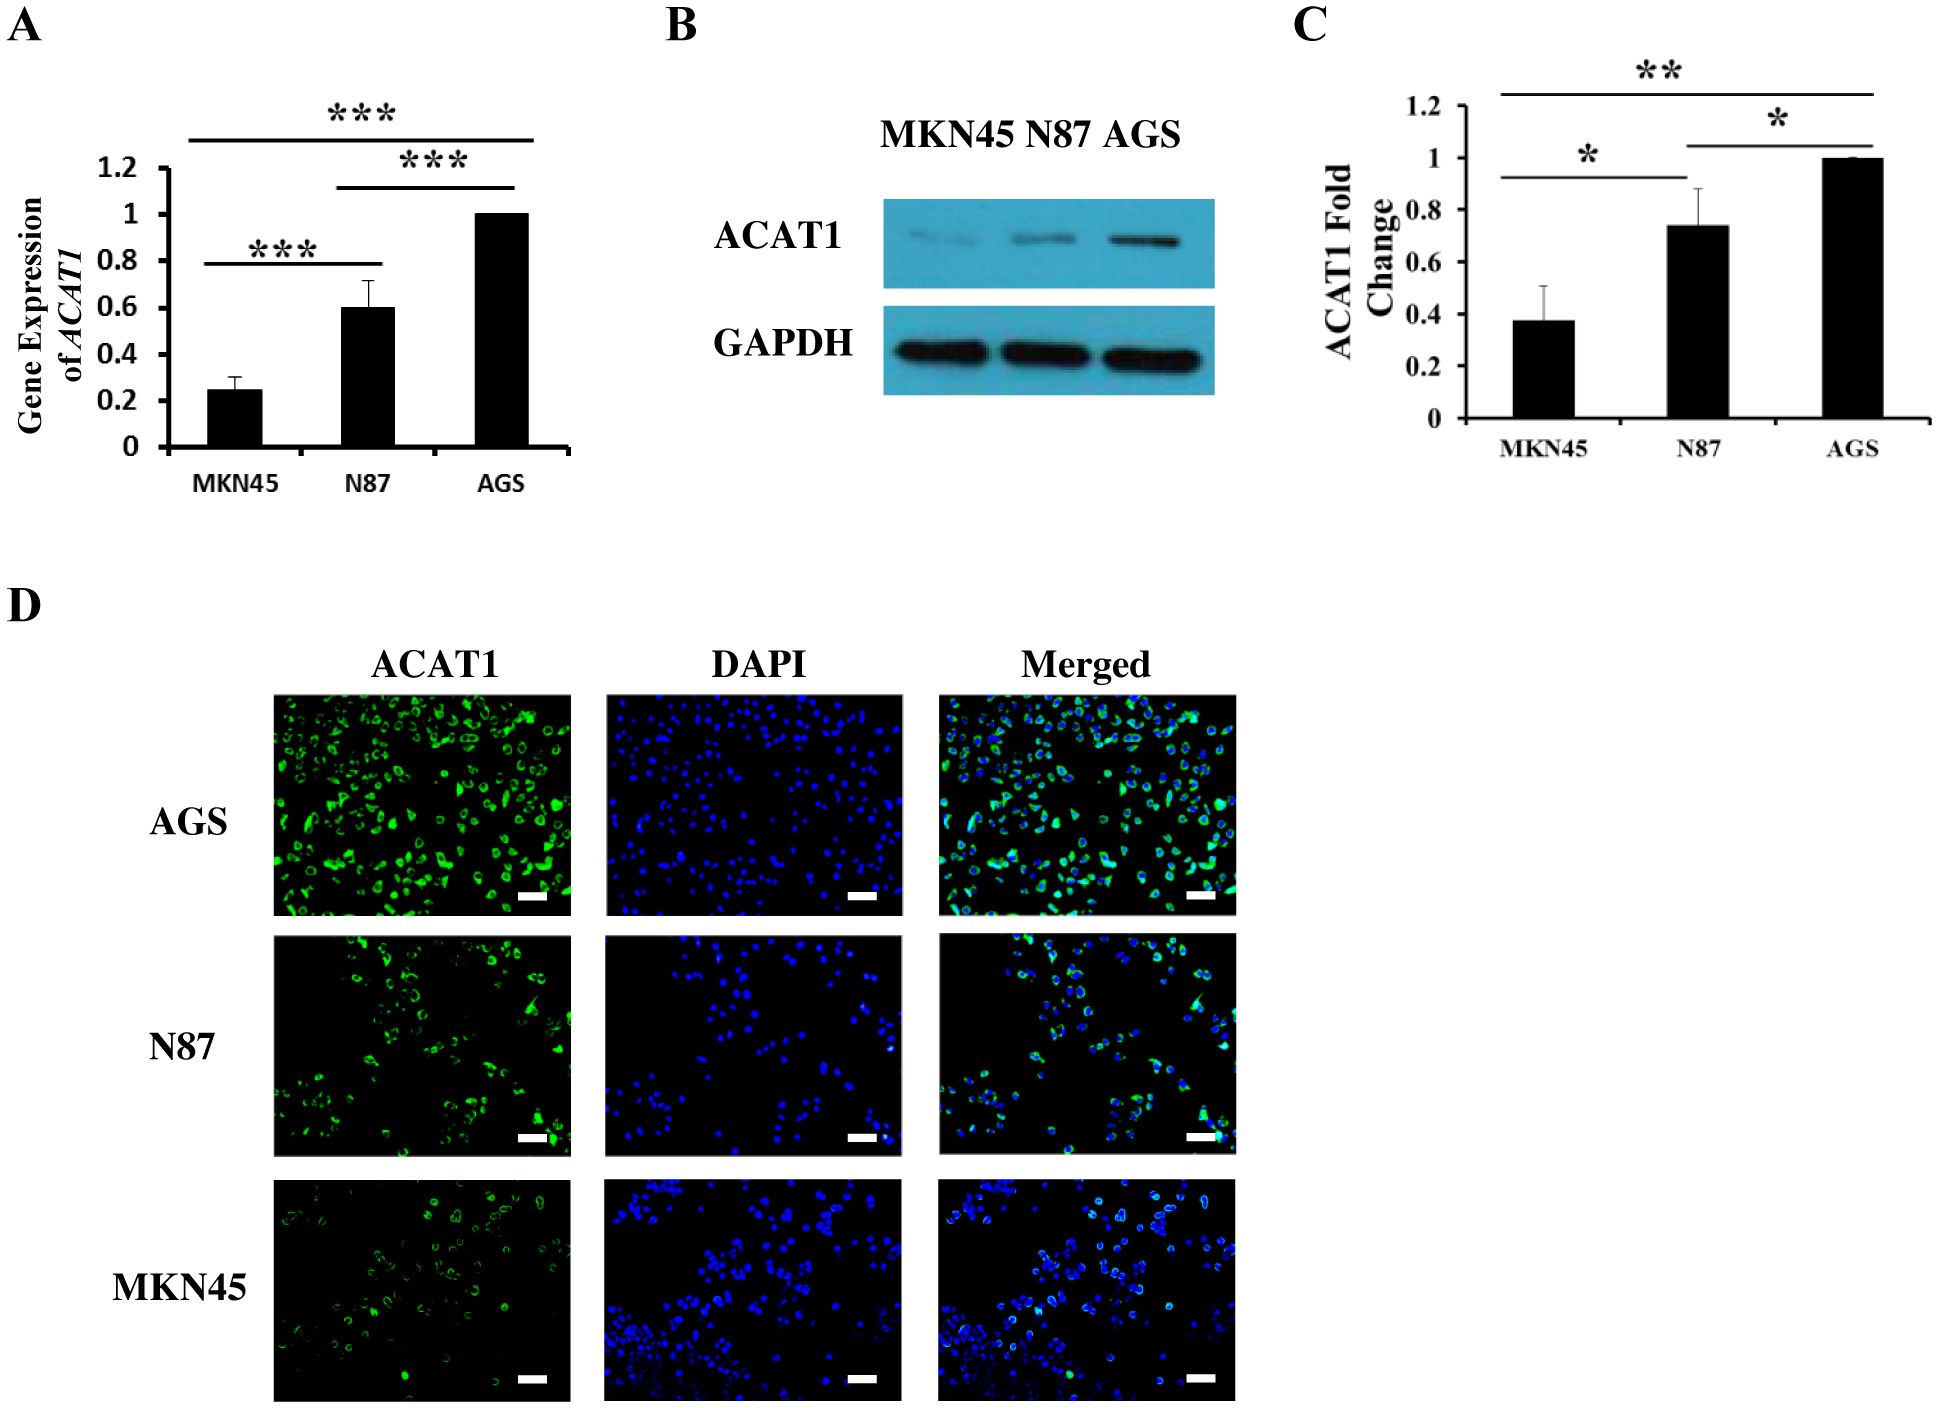
Figure 2. The expression of ACAT1 in gastric cancer cell lines MKN45, N87 and AGS. (A) RT-qPCR analysis of ACAT1 mRNA. (B, C) Western blot analysis of ACAT1. (D) Immunofluorescence staining of ACAT1 (green). The nuclei were stained with DAPI (blue). Scale bar: 100 μm. n = 3 in each group. Values are means ± SD. *p < 0.05, **p < 0.01, ***p < 0.001.
ACAT1 inhibits the expression of CD44 and OCT4
Cancer stem cells (CSCs) are a subset of cells capable of initiating tumor development. CD44 and OCT4 are commonly used indicators of gastric cancer stem cells (20, 21). We investigated the relationship between ACAT1 and the levels of CD44 and OCT4 in three different gastric cancer cell lines. The results show a significant decrease in the mRNA expression of CD44 and OCT4 in AGS and N87 cells compared to MKN45 cells (Figures 3A, B). These findings suggest a negative correlation between ACAT1 and gastric cancer stem cells markers expression, consistent with previous research (22) and our observation in patient samples.
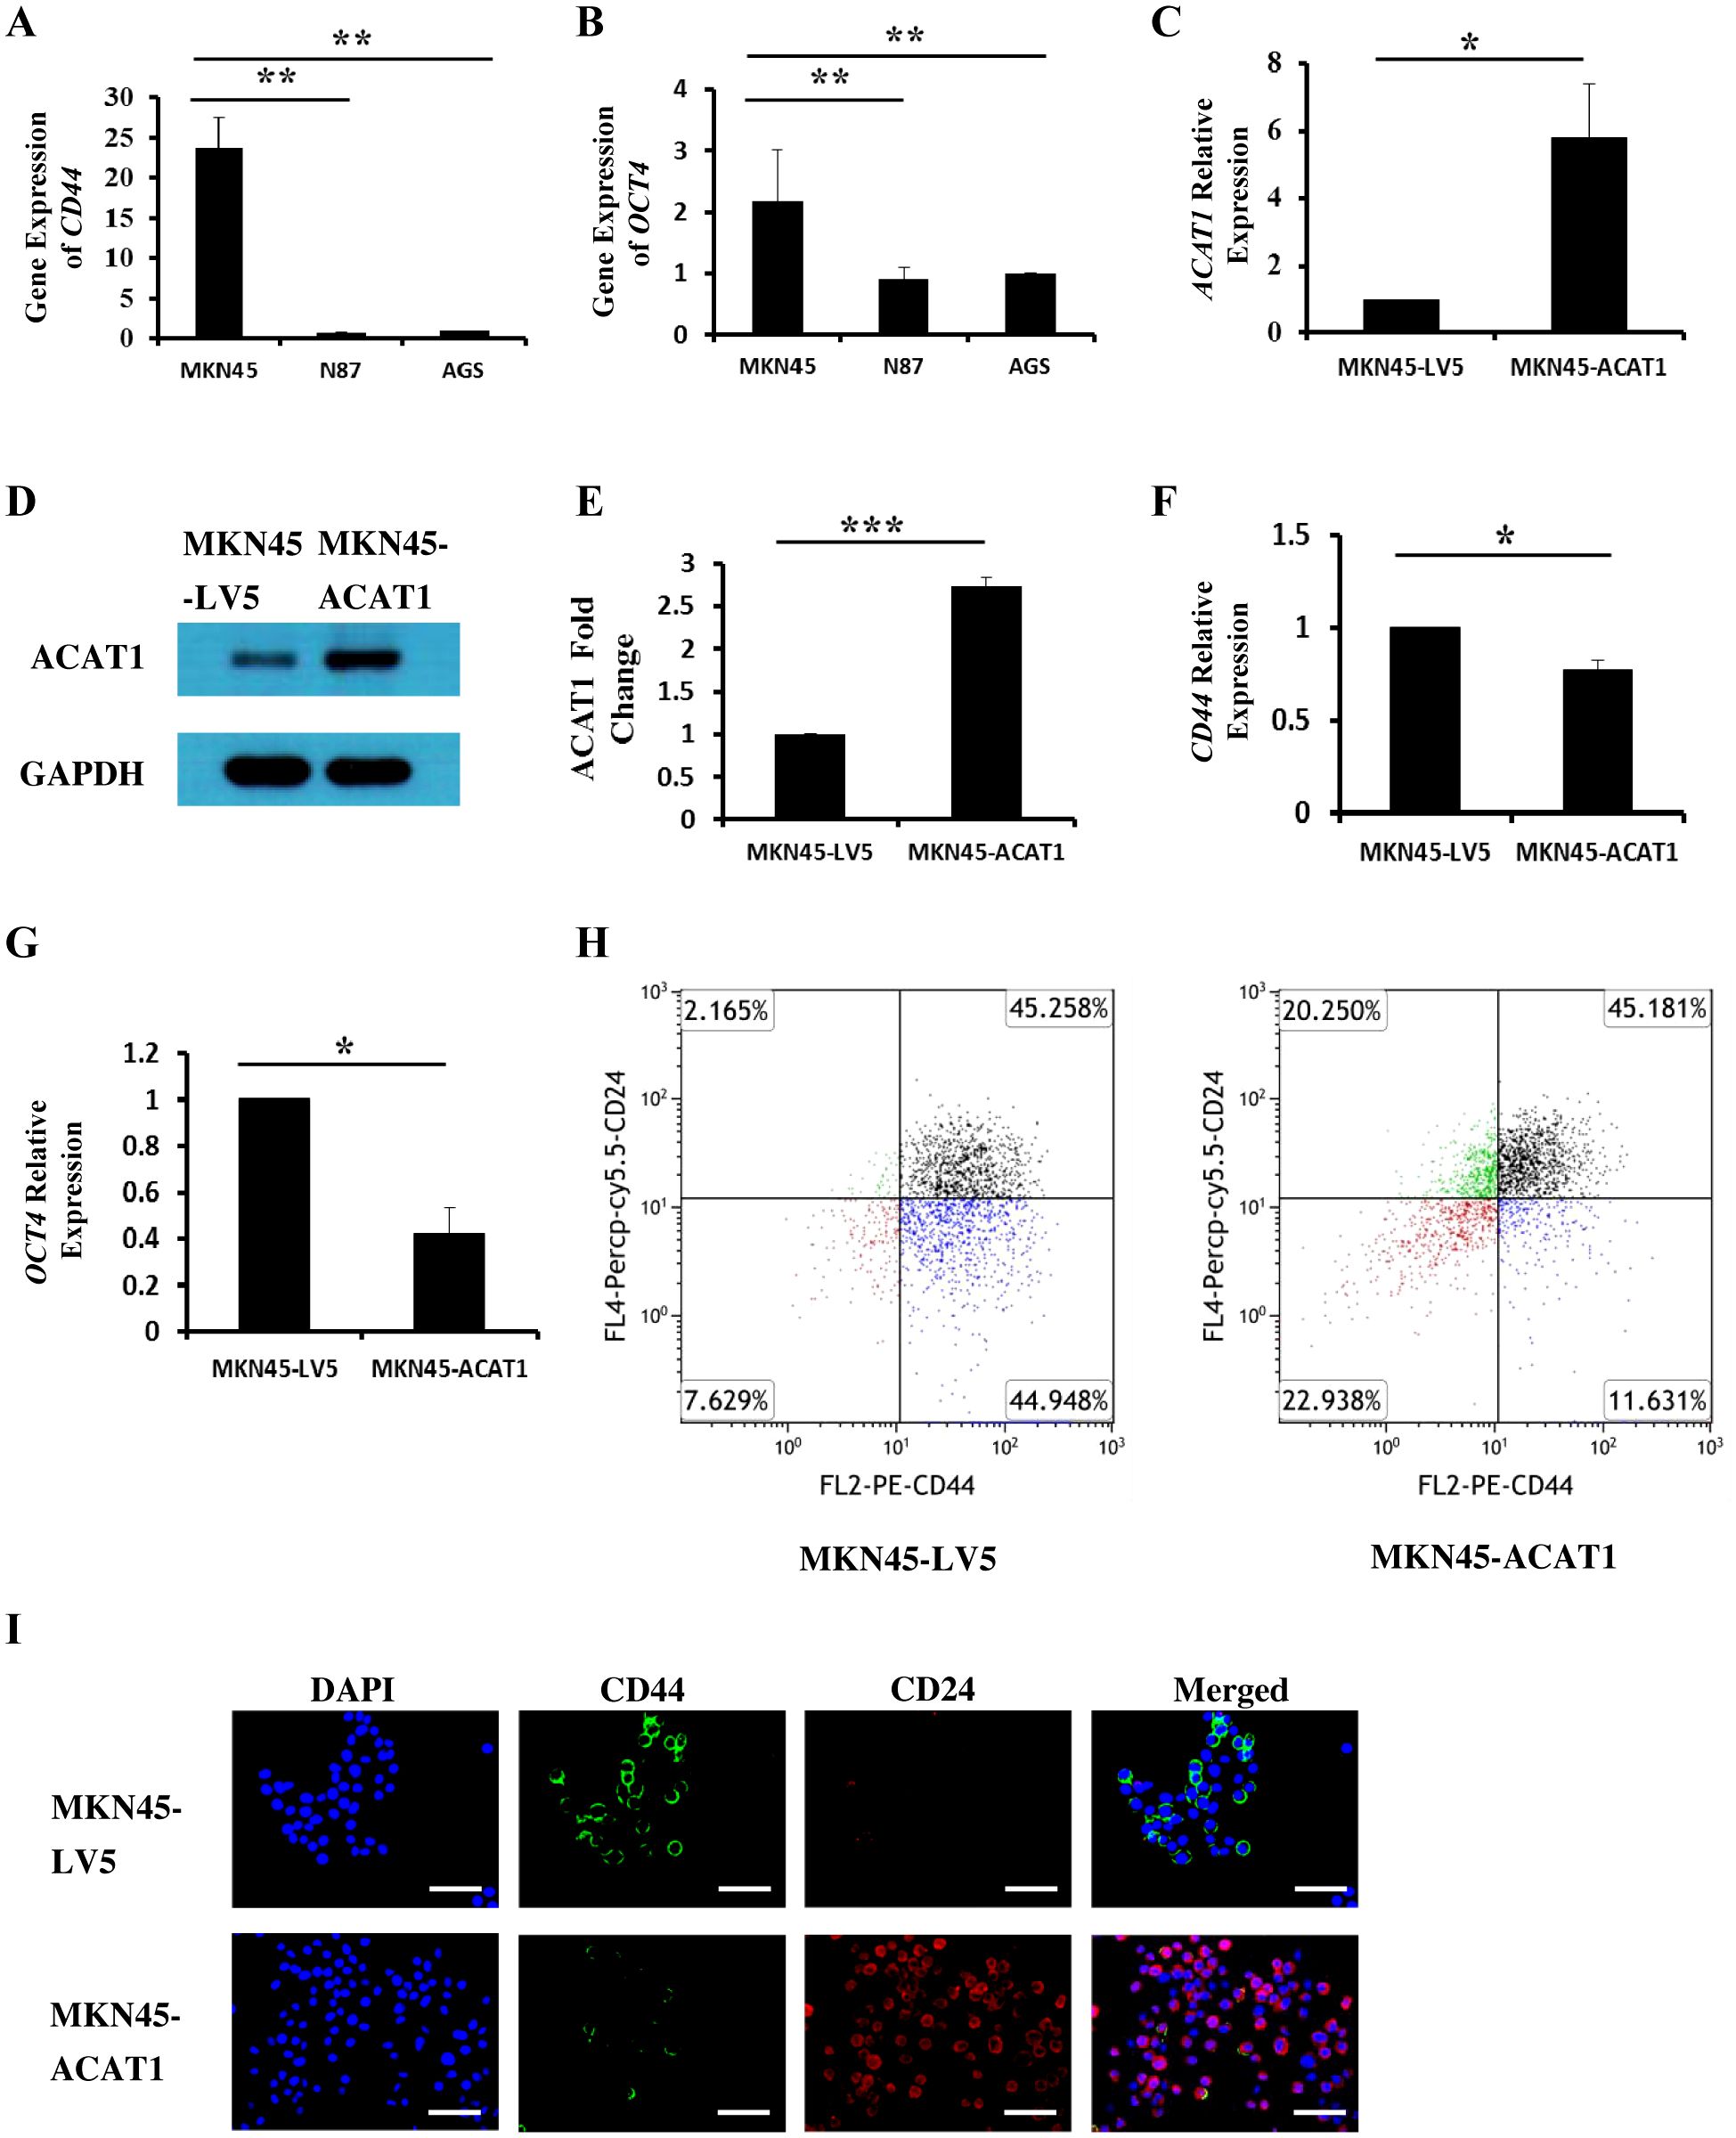
Figure 3. ACAT1 modulates the expression of stem cell markers. (A, B) RT-qPCR analysis of the mRNA expression of CD44 and OCT4 in gastric cancer cell lines MKN45, N87 and AGS. (C–E) RT-qPCR and Western blot to verify the overexpression of ACAT1 in MKN45 cells. (F, G) RT-qPCR analysis of CD44 and OCT4 in MKN45-ACAT1 cells and MKN45-LV5 cells. (H) Flow cytometric analysis of CD44 and CD24 in MKN45-ACAT1 and MKN45-LV5 cells. (I) Immunofluorescence staining of CD44 (green) and CD24 (red) in MKN45-ACAT1 and MKN45-LV5 cells. The nuclei were stained with DAPI (blue). Scale bar: 100 μm. n = 3 in each group. Values are means ± SD. *p < 0.05, **p < 0.01, ***p < 0.001.
To further investigate this possibility, we overexpressed ACAT1 in MKN45 cells (Figures 3C–E) and examined its effect on the expression of tumor stem cell markers. RT-qPCR results demonstrated that, compared to MKN45-LV5 cells, overexpression of ACAT1 significantly decreased mRNA expression of CD44 and OCT4 (Figures 3F, G).
According to existing literature, CD44 is highly expressed in stem cells from breast cancer (23), gastric cancer (11), and oral squamous cell carcinoma (24), while CD24 is typically expressed at lower levels. Our results show that overexpressing ACAT1 in MKN45 cells led to a decrease in CD44-positive cells from 90.21% to 56.81%, and an increase in CD24-positive cells from 47.42% to 65.43%. Additionally, the proportion of cells with high CD44 and low CD24 expression was significantly reduced (Figure 3H). Immunofluorescence staining confirmed the presence of CD44 and CD24 proteins on the surface of gastric cancer cells, showing that increased ACAT1 levels suppress CD44 expression and enhance CD24 expression (Figure 3I). These findings provide further evidence that ACAT1 reduces the expression of stem cell markers in gastric cancer cells.
ACAT1 inhibits the EMT process by suppressing the expression of SNAI1 and SNAI3
Epithelial-mesenchymal transition (EMT) involves epithelial cells transforming into mesenchymal cells, taking on a fibroblast-like appearance (24, 25). EMT is characterized by a reduction in epithelial cell markers and an increase in mesenchymal cell markers, facilitating enhanced cell migration and invasion (26). Immunofluorescence staining was used to measure the levels of E-cadherin (an epithelial cell marker) and vimentin (a mesenchymal cell marker) in three gastric cancer cell lines. We found that E-cadherin expression is lowest in MKN45 cells and highest in AGS cells, while vimentin exhibits the opposite pattern (Figure 4A).
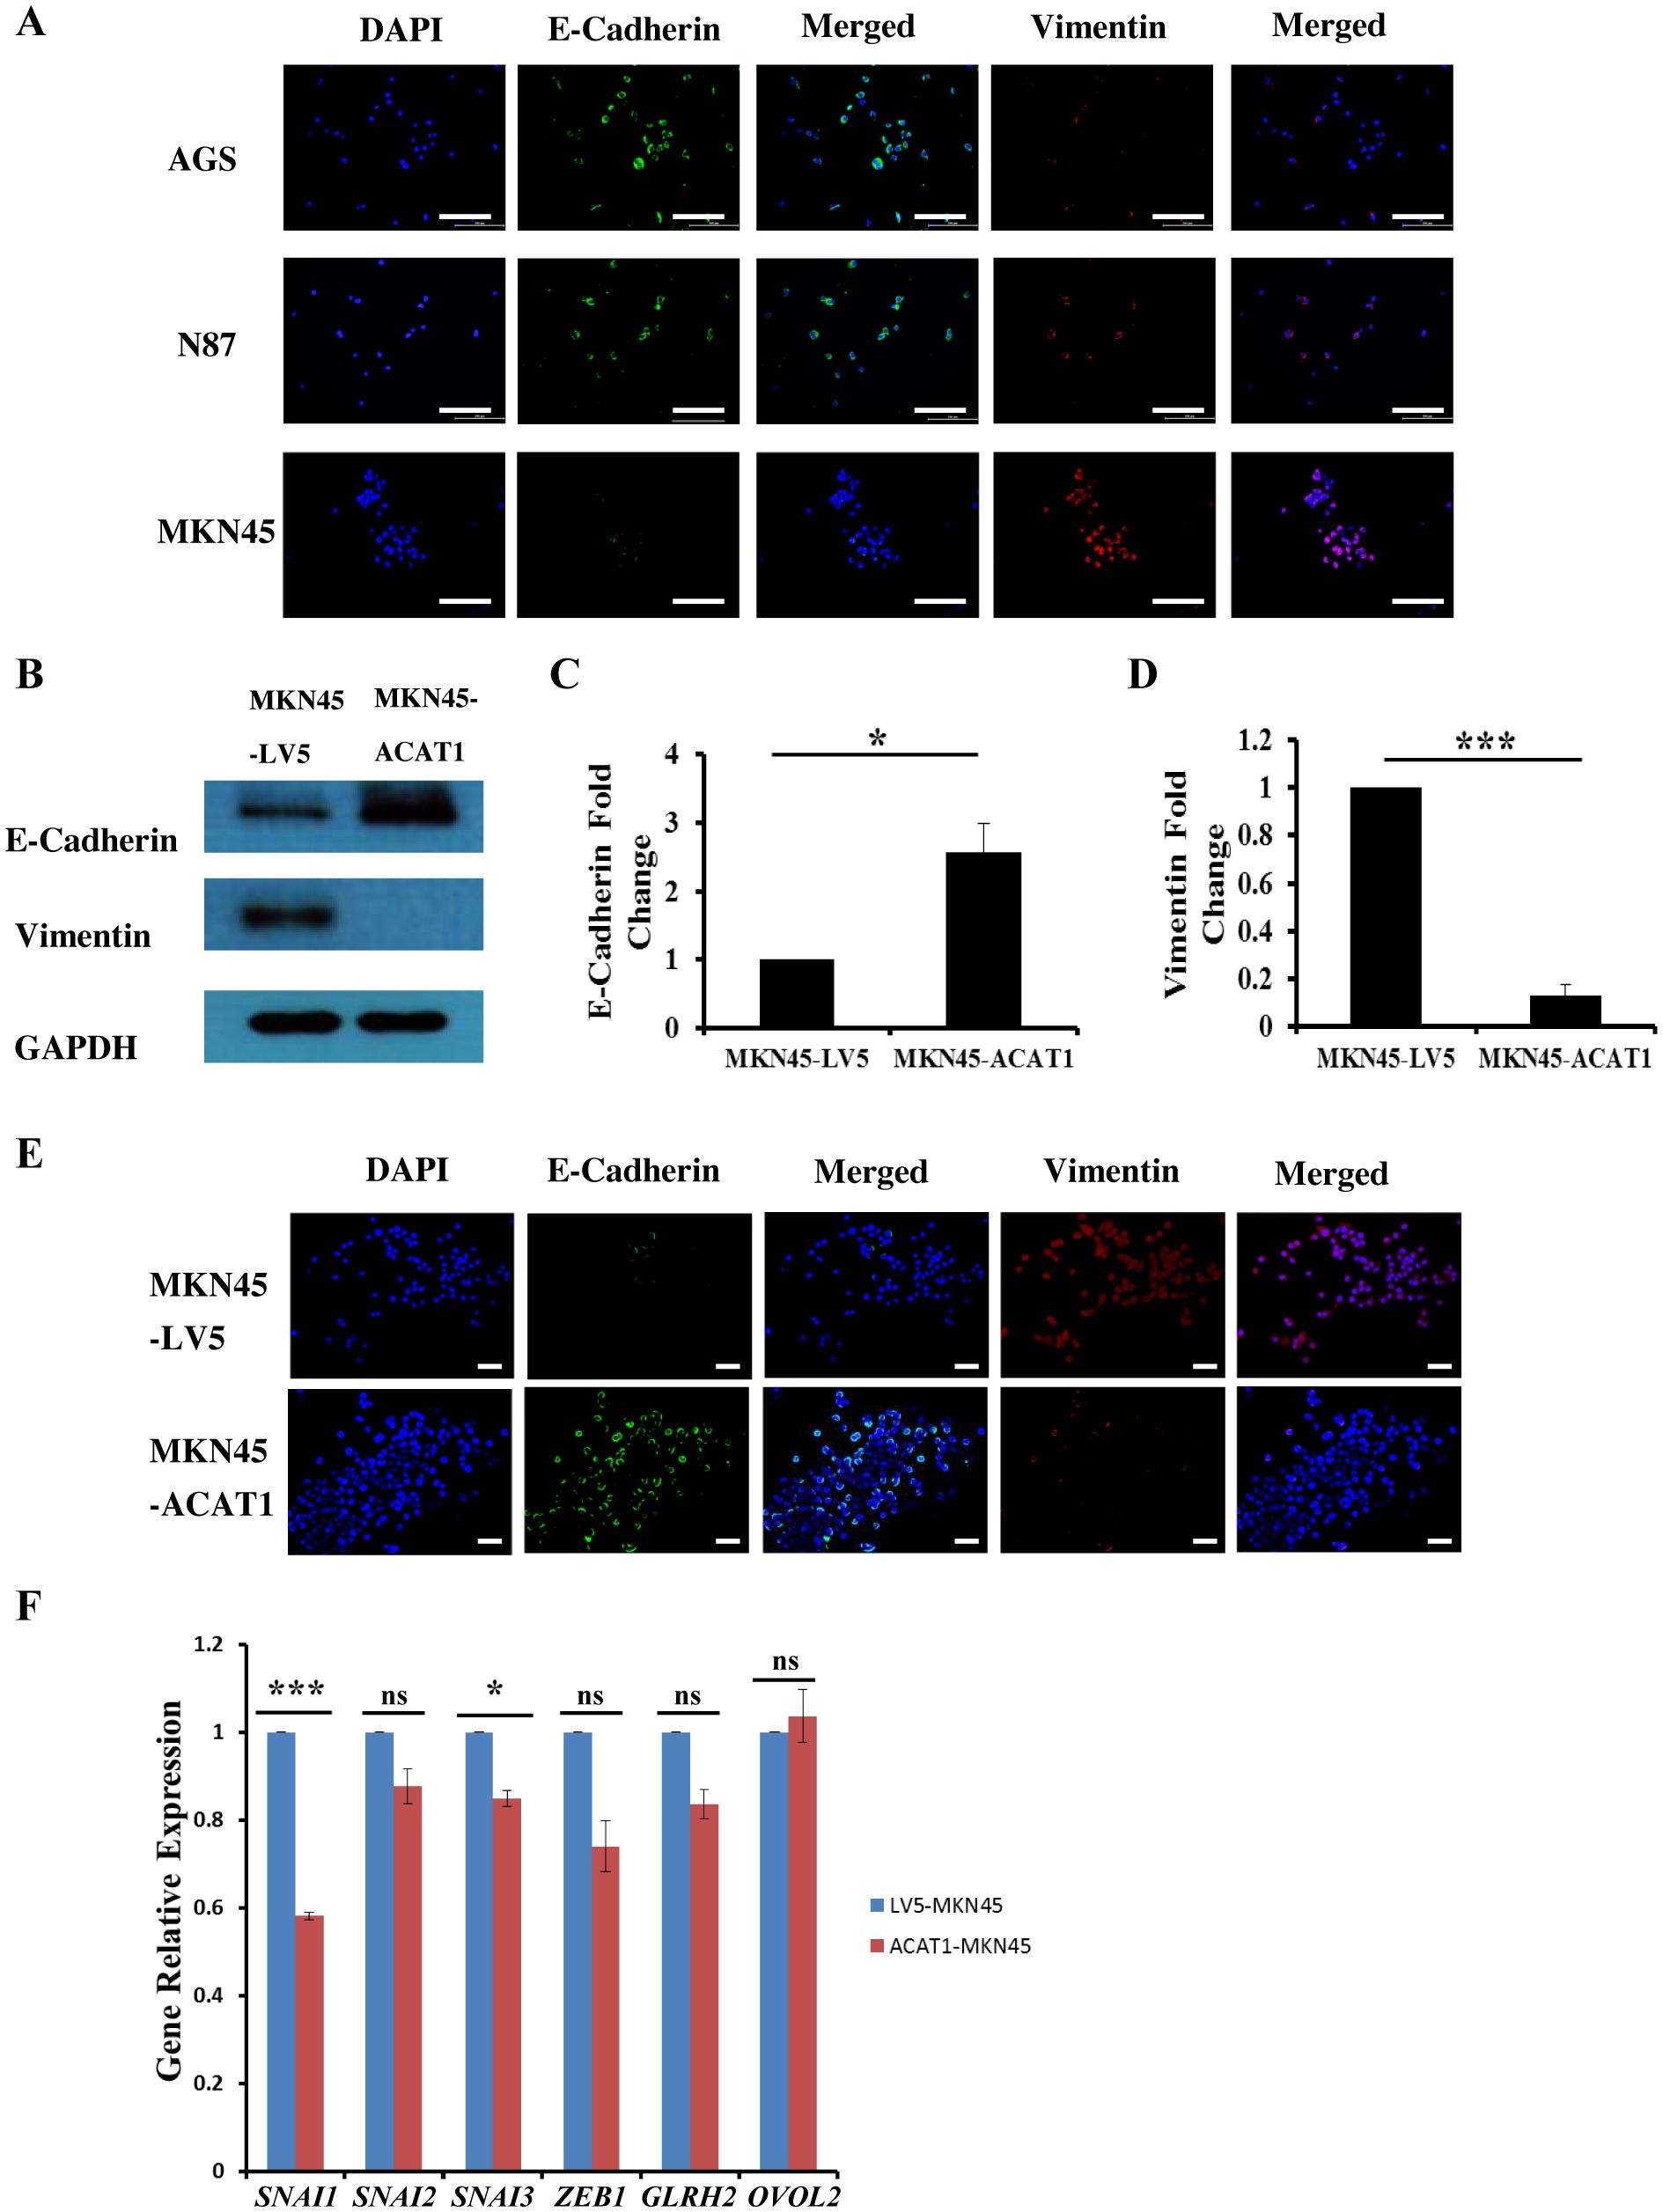
Figure 4. ACAT1 impedes the EMT process by inhibiting the expression of SNAI1 and SNAI3. (A) Immunofluorescence staining of the EMT markers E-cadherin (green) and vimentin (red) in gastric cancer cell lines MKN45, N87 and AGS. The nuclei were stained with DAPI (blue). Scale bar: 200 μm. (B–D) Western blot was performed to analyze the levels of E-Cadherin and vimentin expression in MKN45-ACAT1 cells compared to MKN45-LV5 cells. (E) Immunofluorescence staining of E-Cadherin (green) and vimentin (red) in MKN45-ACAT1 and MKN45-LV5 cells. The nuclei were stained with DAPI (blue). Scale bar: 100 μm. (F) RT-qPCR analysis of EMT-related genes in MKN45-ACAT1 and MKN45-LV5 cells. n = 3 in each group. Values are mean ± SD. ns, not significant. *p < 0.05, ***p < 0.001.
To further investigate the correlation between ACAT1 and EMT processes, we conducted experiments in MKN45 cells overexpressing ACAT1. Protein expression levels of EMT markers in MKN45-LV5 and MKN45-ACAT1 cells were assessed using Western blot analysis. Compared to MKN45-LV5 cells, overexpression of ACAT1 in MKN45-ACAT1 cells enhanced E-cadherin and suppressed vimentin expressions (Figures 4B–D). These results were consistent when immunofluorescence staining was used (Figure 4E). To further analyze the role of ACAT1 in EMT, we measured the mRNA levels of EMT-related genes. The results showed a decrease in the expression of the EMT-promoting genes SNAI1 and SNAI3 when ACAT1 was overexpressed (Figure 4F). This suggests that ACAT1 may impede the progression of EMT by suppressing these genes.
ACAT1 inhibits the migration and invasion of gastric cancer cells
Tumors can enhance their invasion of nearby tissues by secreting matrix metalloproteinases (MMPs). To determine if overexpression of ACAT1 affects the invasive potential of gastric cancer cells, we used Transwell assays. In the Transwell assay, we placed a layer of Matrigel in the chamber. Gastric cancer cells, attracted by nutrients at the bottom, secreted MMPs to pass through the Matrigel and access the nutrients needed for growth. The primary difference between cell migration and invasion assays is the presence of Matrigel, which simulates the extracellular matrix in the invasion assay. The results demonstrated that overexpression of ACAT1 in MKN45 cells significantly reduces their migration and invasion capabilities (Figures 5A–D).
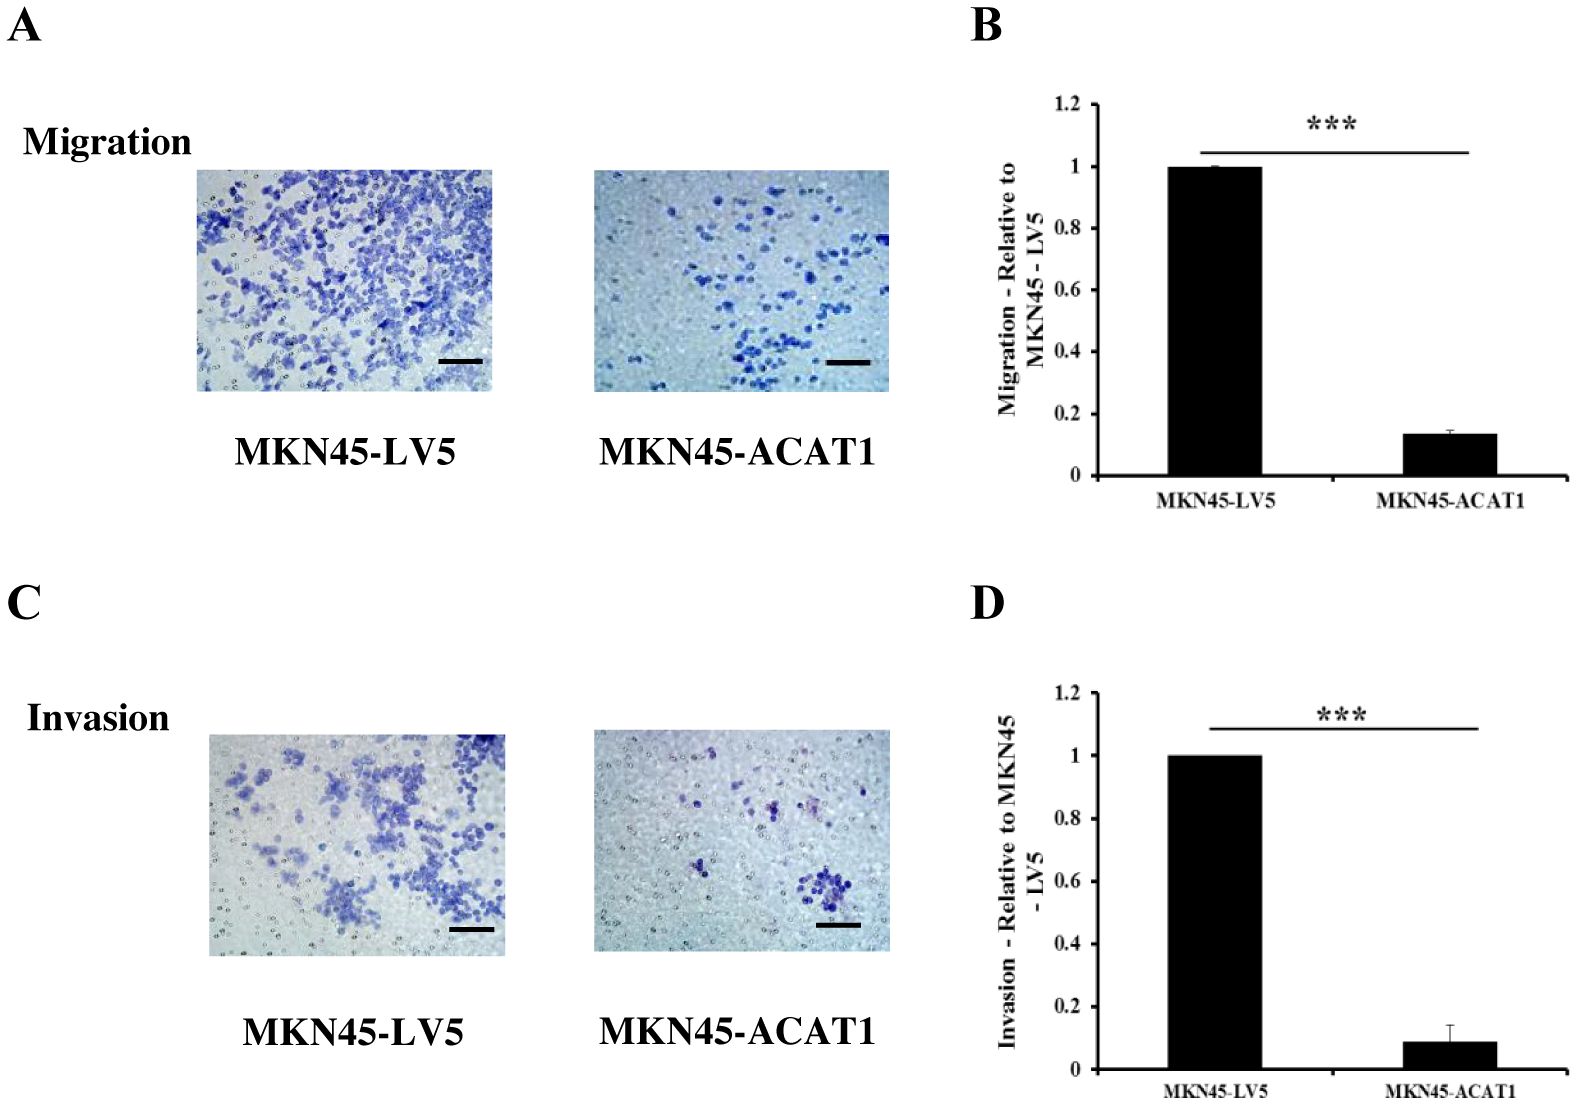
Figure 5. ACAT1 inhibits the migration and invasion of gastric cancer cells. (A–D) Transwell assay to assess the migration and invasion ability of MKN45-ACAT1 and MKN45-LV5 cells. Scale bar: 100 μm. n = 3 in each group. Values are mean ± SD. ***p < 0.001.
ACAT1 improves the response to 5-FU, etoposide and inhibits the ability of gastric cancer cells to form colonies in soft agar
Chemotherapy resistance is largely due to the presence of cancer cells acquiring stemness characteristics (27). To assess whether ACAT1 affects drug response of gastric cancer stem cells, we compared the drug response of MKN45-LV5 cells and MKN45-ACAT1 cells treated with 5-Fluorouracil (5-FU) and etoposide, two commonly used chemotherapy drugs in gastric cancer. Drug response was determined by determining the number of viable cells after treatment. Our results identified a significant decrease in the survival of MKN45-ACAT1 cells compared to MKN45-LV5 cells after treatment with 5-FU or etoposide (Figures 6A, B).
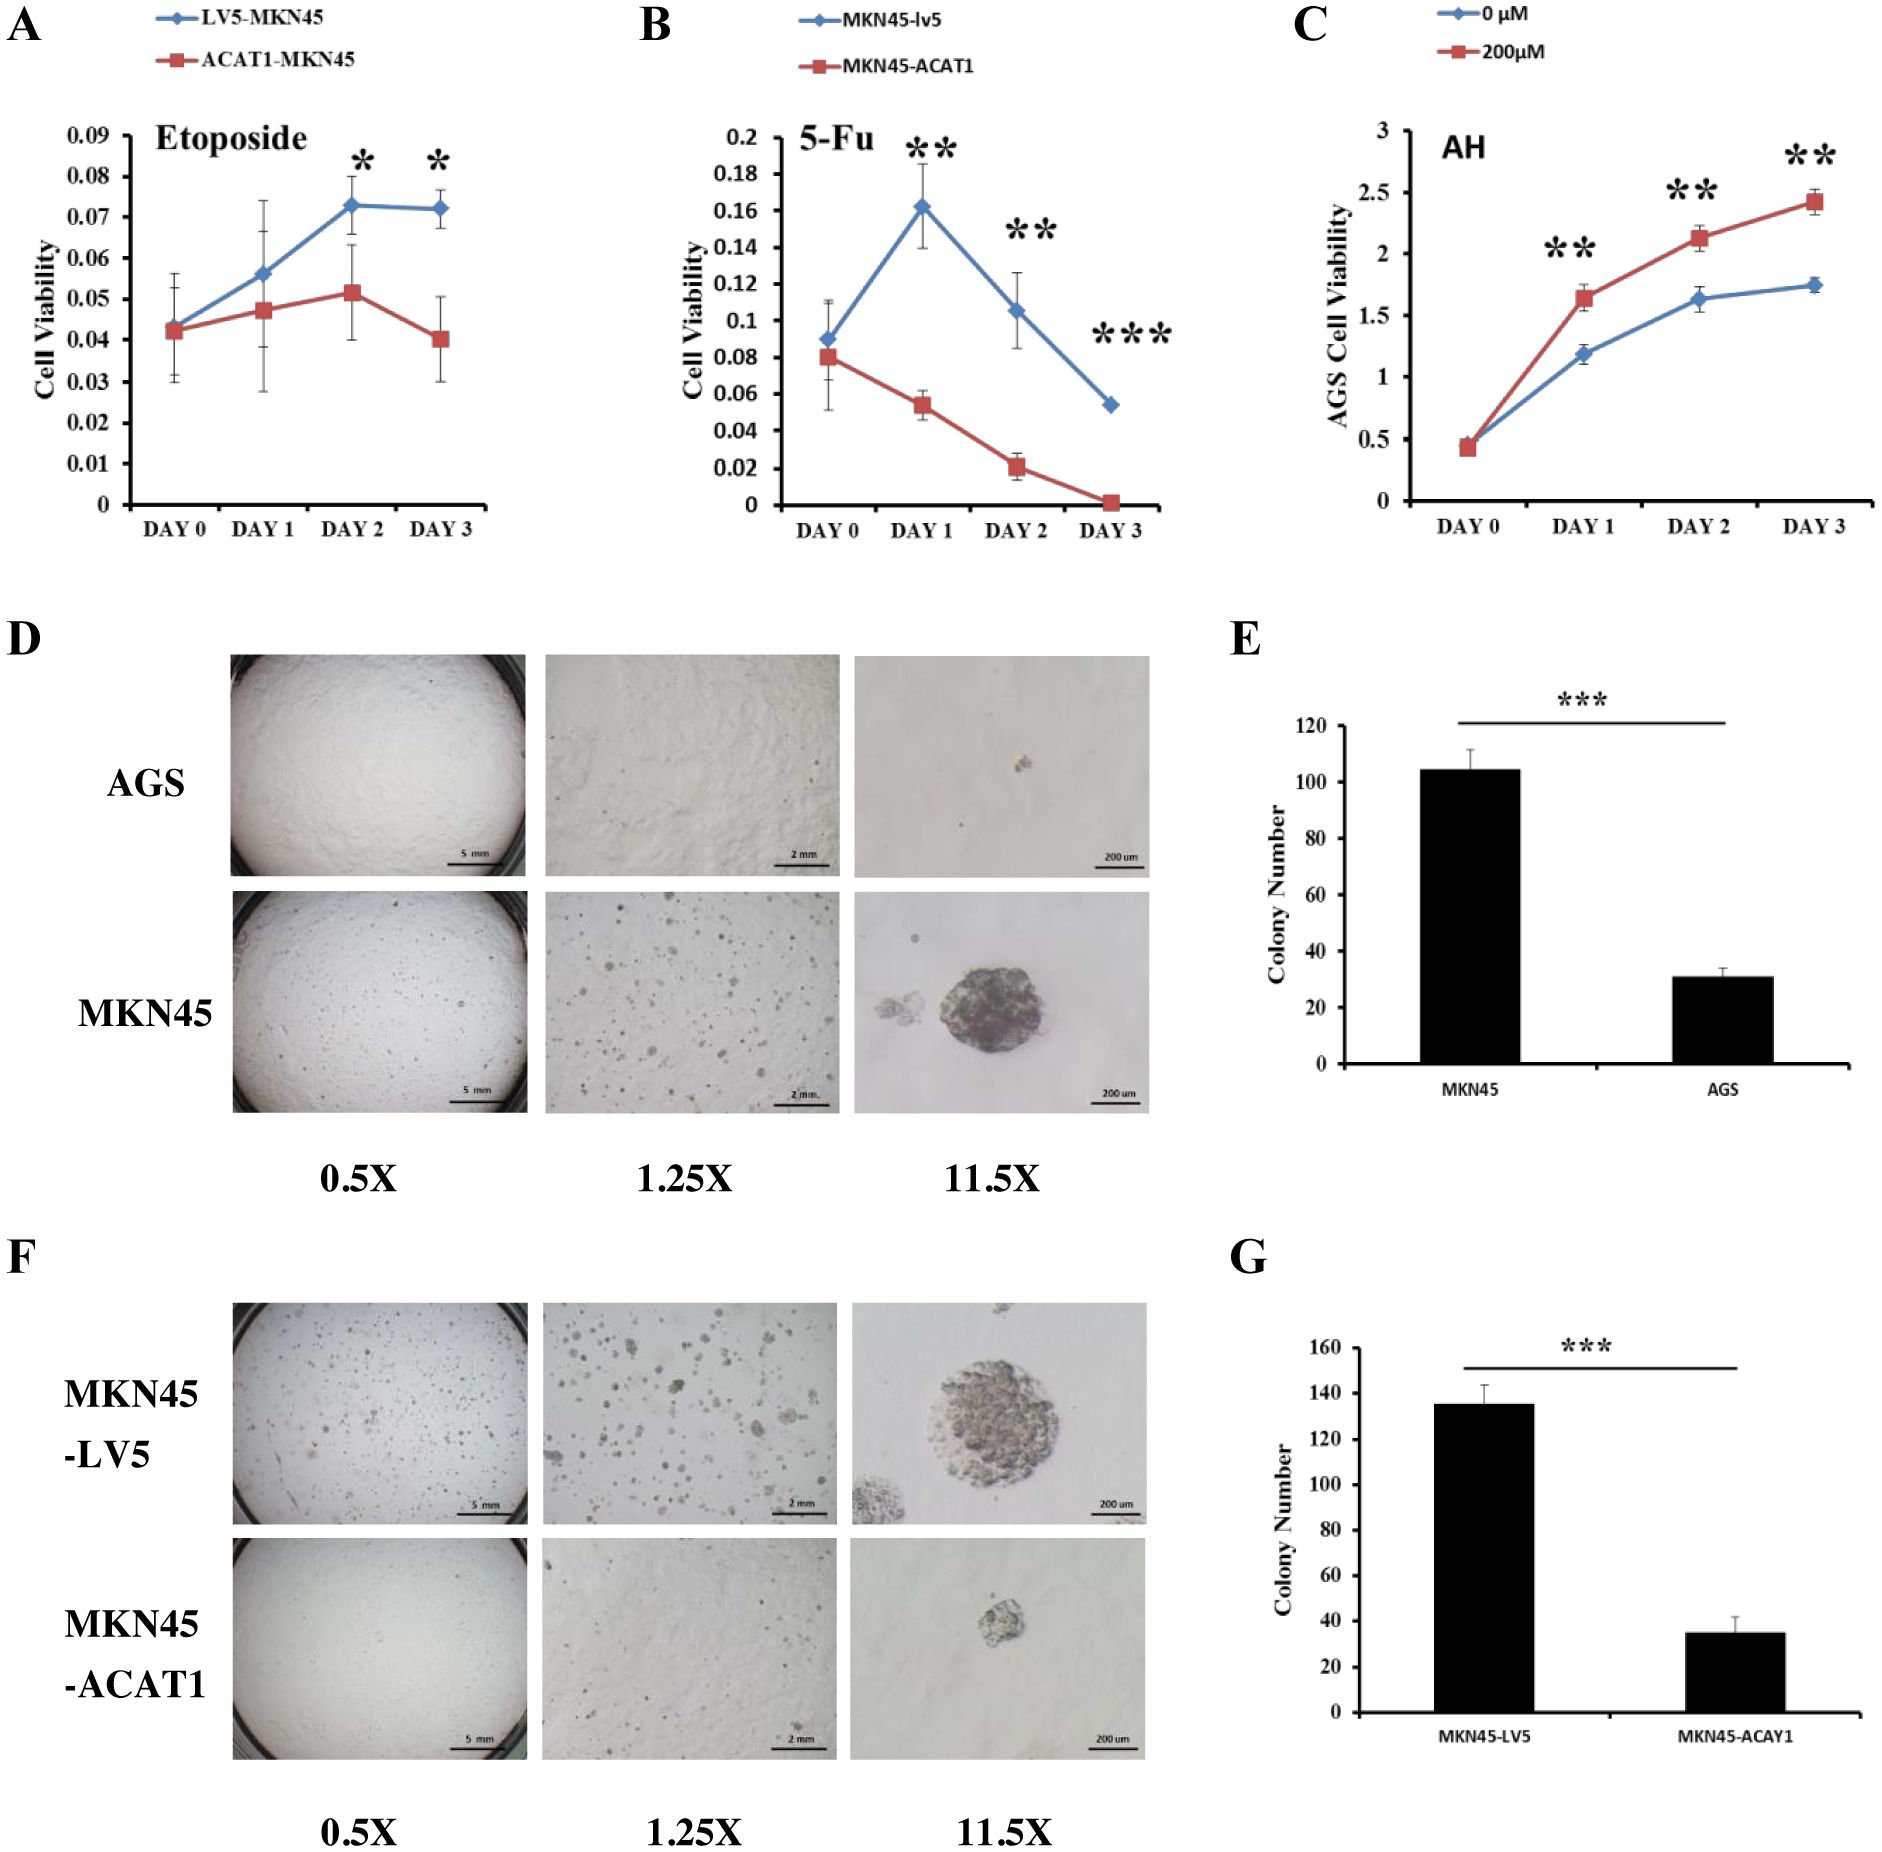
Figure 6. ACAT1 overexpression improves the response to chemotherapy drugs and inhibits the ability of gastric cancer cells to form colonies in soft agar. (A, B) The sensitivity of MKN45-ACAT1 and MKN45-LV5 cells to the chemotherapeutic drugs 5-FU (4 mM) and etoposide (80 μM) was analyzed by CCK8 reagent. (C) The sensitivity of AGS cells to the arecoline hydrobromide (200 μM) was analyzed by CCK8 reagent. (D) The anchorage-independent proliferation of AGS and control MKN45 cells was assessed through a soft agar colony formation assay. The scale bar in the 0.5X represents 5 mm, the scale bar in the 1.25X represents 2 mm and the scale bar in the 11.5X represents 200 μm. (E) The number of colonies formed by AGS and MKN45 cells. (F) The anchorage-independent growth of MKN45-ACAT1 and MKN45-LV5 cells was detected by using a soft agar colony formation assay. The scale bar in the 0.5X represents 5 mm, the scale bar in the 1.25X represents 2 mm and the scale bar in the 11.5X represents 200 μm. (G) The number of colonies formed by MKN45-ACAT1 and MKN45-LV5 cells. n = 3 in each group. Values are mean ± SD. *p < 0.05, **p < 0.01, ***p < 0.001.
Additionally, Fan et al. found that Arecoline Hydrobromide (AH) is an inhibitor of the ACAT1 tetramer (28). We treated AGS cells, which have high ACAT1 expression, with AH and conducted a cell proliferation assay. The study revealed that AH treatment significantly increased the growth rate of AGS cells compared to the control group (Figure 6C). We evaluated the ability of two gastric cancer cell lines to form colonies. The results showed that compared with AGS cells, MKN45 cells formed more and larger colonies (Figures 6D, E).
Thereafter, we conducted soft agar anchorage-independence colony formation assay using MKN45-LV5 and MKN45-ACAT1 cells to investigate the influence of ACAT1 on the colony-forming potential of gastric cancer cells. Compared with MKN45-LV5 cells, MKN45-ACAT1 cells exhibited a significant reduction in the number and volume of colonies developed in soft agar (Figures 6F, G).
ACAT1 suppresses the growth of gastric cancer xenograft tumors in nude mice
We also examined the effects of increased ACAT1 expression on tumor growth in vivo using a xenograft mouse model. Eight million MKN45-ACAT1 or control MKN45-LV5 cells, combined with Matrigel, were injected subcutaneously into the backs of male nude mice aged 6 weeks. Tumor volumes were measured starting from day 6 post-injection. After 12 days from cell injections, there was a notable difference in tumor volume between the two cell lines groups. Compared to tumors formed by MKN45-LV5 cells, those formed by MKN45-ACAT1 cells exhibited a significant decrease in volume and inhibition of growth rate (Figures 7A, B). Finally, at 21 days post-injection, tumors were excised and weighed. The weight of tumors formed by MKN45-ACAT1 cells was substantially lighter than those formed by MKN45-LV5 cells (Figures 7C, D). These findings suggest that increased expression of ACAT1 suppresses gastric cancer tumor growth in nude mice.
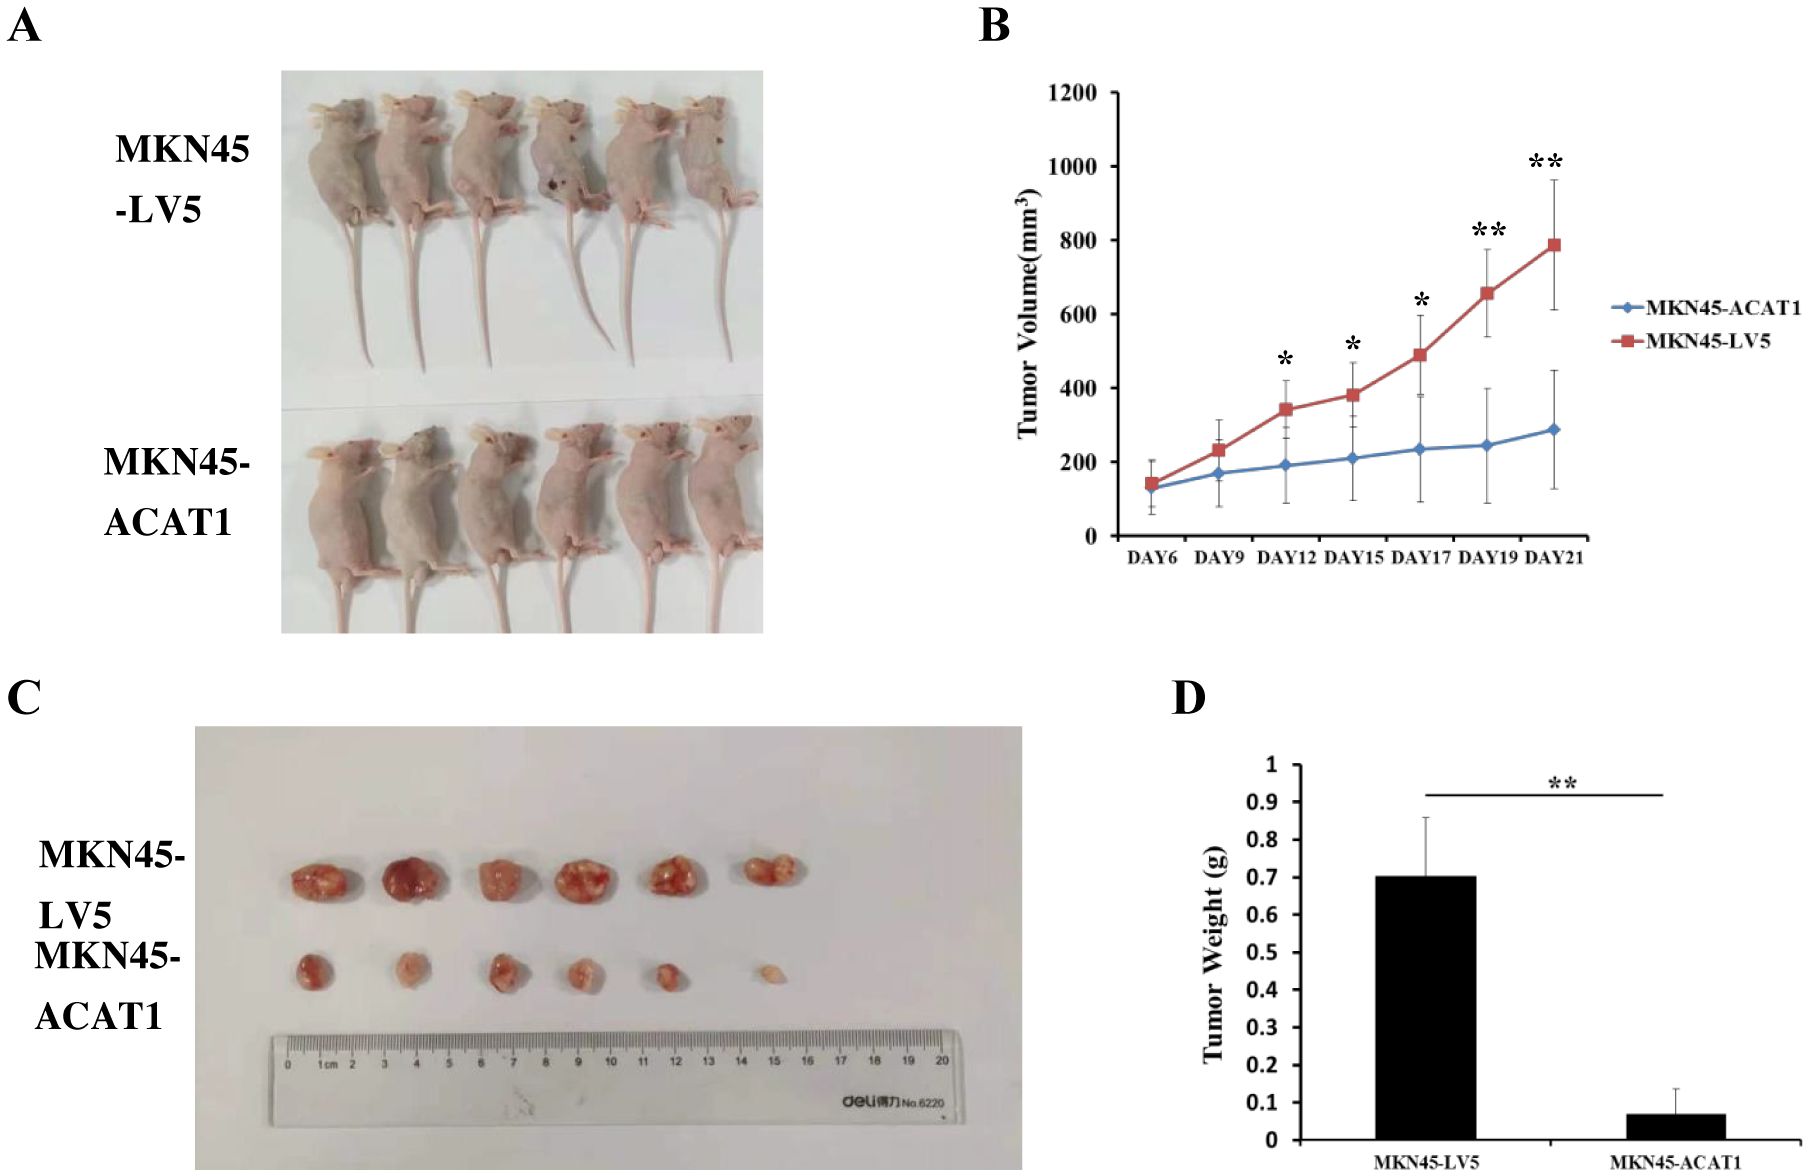
Figure 7. ACAT1 overexpression inhibits tumor growth in nude mouse xenograft model. (A) MKN45-LV5 cells or MKN45-ACAT1 cells were injected into each nude mouse, and representative images were taken on day 21 after injection. Upper panel represents MKN45-LV5; lower panel represents MKN45-ACAT1. (B) The tumor volumes were measured on day 6, 9, 12, 15, 17, 19 and 21. (C, D) On day 21, the tumors were taken out, excised, and weighed. Upper panel represents MKN45-LV5; lower panel represents MKN45-ACAT1. n = 6 in each group. Values are mean ± SD. *p < 0.05, **p < 0.01.
Expression of the ACAT1 gene to the expression pattern of whole genes and GSEA of the ACAT1 gene expression
To enhance comprehension of the biological function of the ACAT1 gene in gastric cancer, an evaluation of the ACAT1 gene expression pattern was conducted. It was discovered that the expression of 1822 genes that were in a downmodulated and 288 genes that were in an upmodulated were substantially linked to the ACAT1 gene expression (logFC > 1 and padj < 0.05) (Figure 8A). Furthermore, the gene expression heat map (Figure 8B) showed the top 20 genes exhibiting abnormal levels of expression (abslogFC > 2 and padj < 0.01). Furthermore, an analysis was conducted using TCGA gene expression data to compare the biological and functional pathways in high- and low-ACAT1 gene expression groups through Gene Set Enrichment Analysis (GSEA). The NESs indicated that the enrichment signaling pathway most relevant for ACAT1 gene expression was selected. The GSEA analysis showed that the increased ACAT1 gene expression pattern was mainly found in the Adipocytokine Signaling Pathway, Ppar Signaling Pathway, Propanoate Metabolism and P53 Signaling Pathway (Figures 8C–F). This suggests that the inhibitory effect of ACAT1 in gastric cancer may be related to the above pathways.
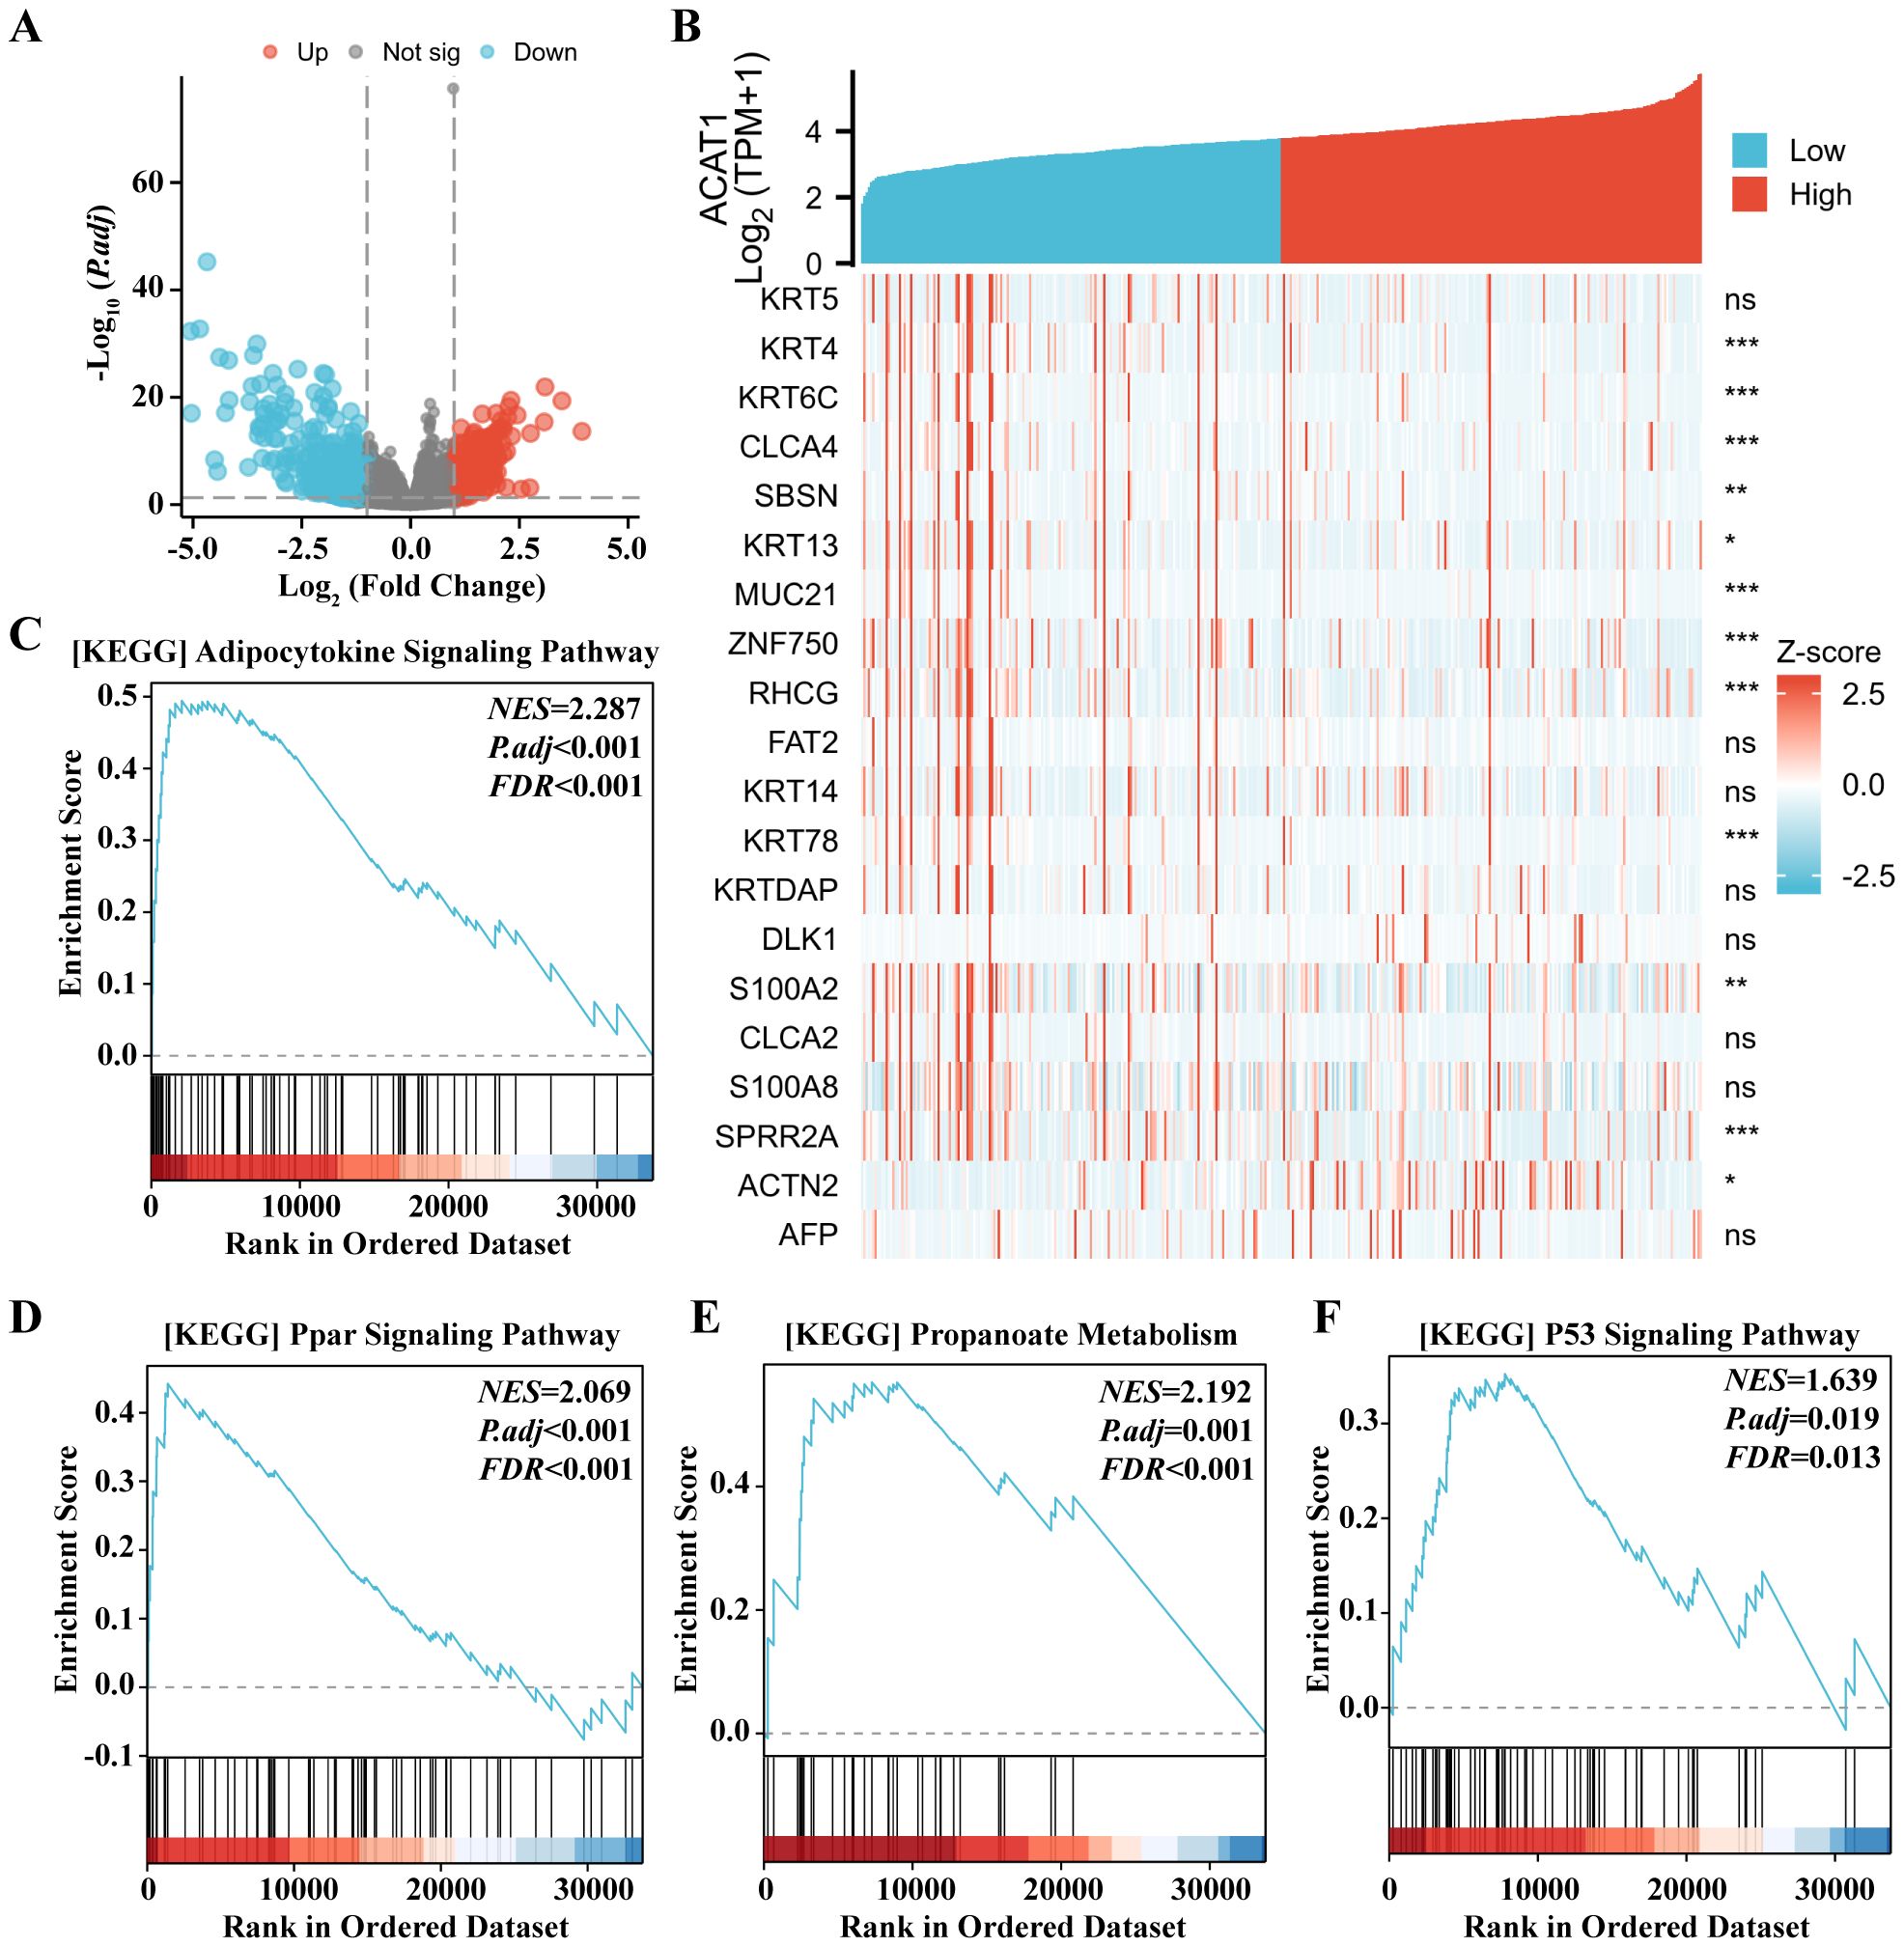
Figure 8. Expression of the ACAT1 gene to the expression pattern of whole genes and bioinformatics analysis. (A) A volcano map based on ACAT1 expression patterns illustrating the differentially expressed genes (DEGs). (B) The expression level of the ACAT1 gene was used to generate a heat map that displays 20 genes that were either upmodulated or downmodulated. (C–F) The findings of the gene set enrichment analysis (GSEA). ns, not significant. *p < 0.05, **p < 0.01, ***p < 0.001.
PPI networks and functional annotations
Through interactions with neighboring stromal cells within the tumor microenvironment (TME), tumor cells have developed adaptive mechanisms to survive under various extreme conditions such as hypoxia and elevated reactive oxygen species (ROS) (29). These stress phenotypes are considered hallmarks of cancer (30). ROS are linked to cancer initiation, development, and progression (31). To explore a potential role for the ACAT1 in modification of the gastric cancer metabolic microenvironment, we constructed PPI networks and functional annotations based on the STRING database (https://string-db.org/), GO, and KEGG analyses. Supplementary Figure S1A shows a network of ACAT1 and its 10 coexpression genes. The correlation analyses between the expression of ACAT1 and co-expressed genes in gastric cancer from TCGA are shown in Supplementary Figures S1B–I. As shown in Supplementary Figure S1J, changes in the biological process of ACAT1 are associated with increased intramolecular oxidoreductase activity, suggesting that ACAT1 may suppress tumor initiation and progression by inhibiting the production of ROS.
Correlation analysis between ACAT1 expression and immune cell infiltration in gastric cancer
The level of immune cell infiltration in the tumor microenvironment (TME) plays a cardinal role in the tumor initiation, progression, metastasis and treatment resistance of cancer (32). The relationship between the ACAT1 gene expression and 24 distinct immune cell subtypes in gastric cancer was investigated and analyzed. The ACAT1 gene expression had a strong positive correlation with T helper cells, Th2 cells, Tgd and Tcm infiltration and a strong inverse correlation with pDC and NK CD56bright cells infiltration (Figures 9A, E–J). Further investigation illustrated substantial variations in the ACAT1 gene expression level in different infiltrating immune cells, notably NK CD56bright cells, pDC, T helper cells, TReg, Th2 cells, Tgd and Tcm (Figures 9B–D).
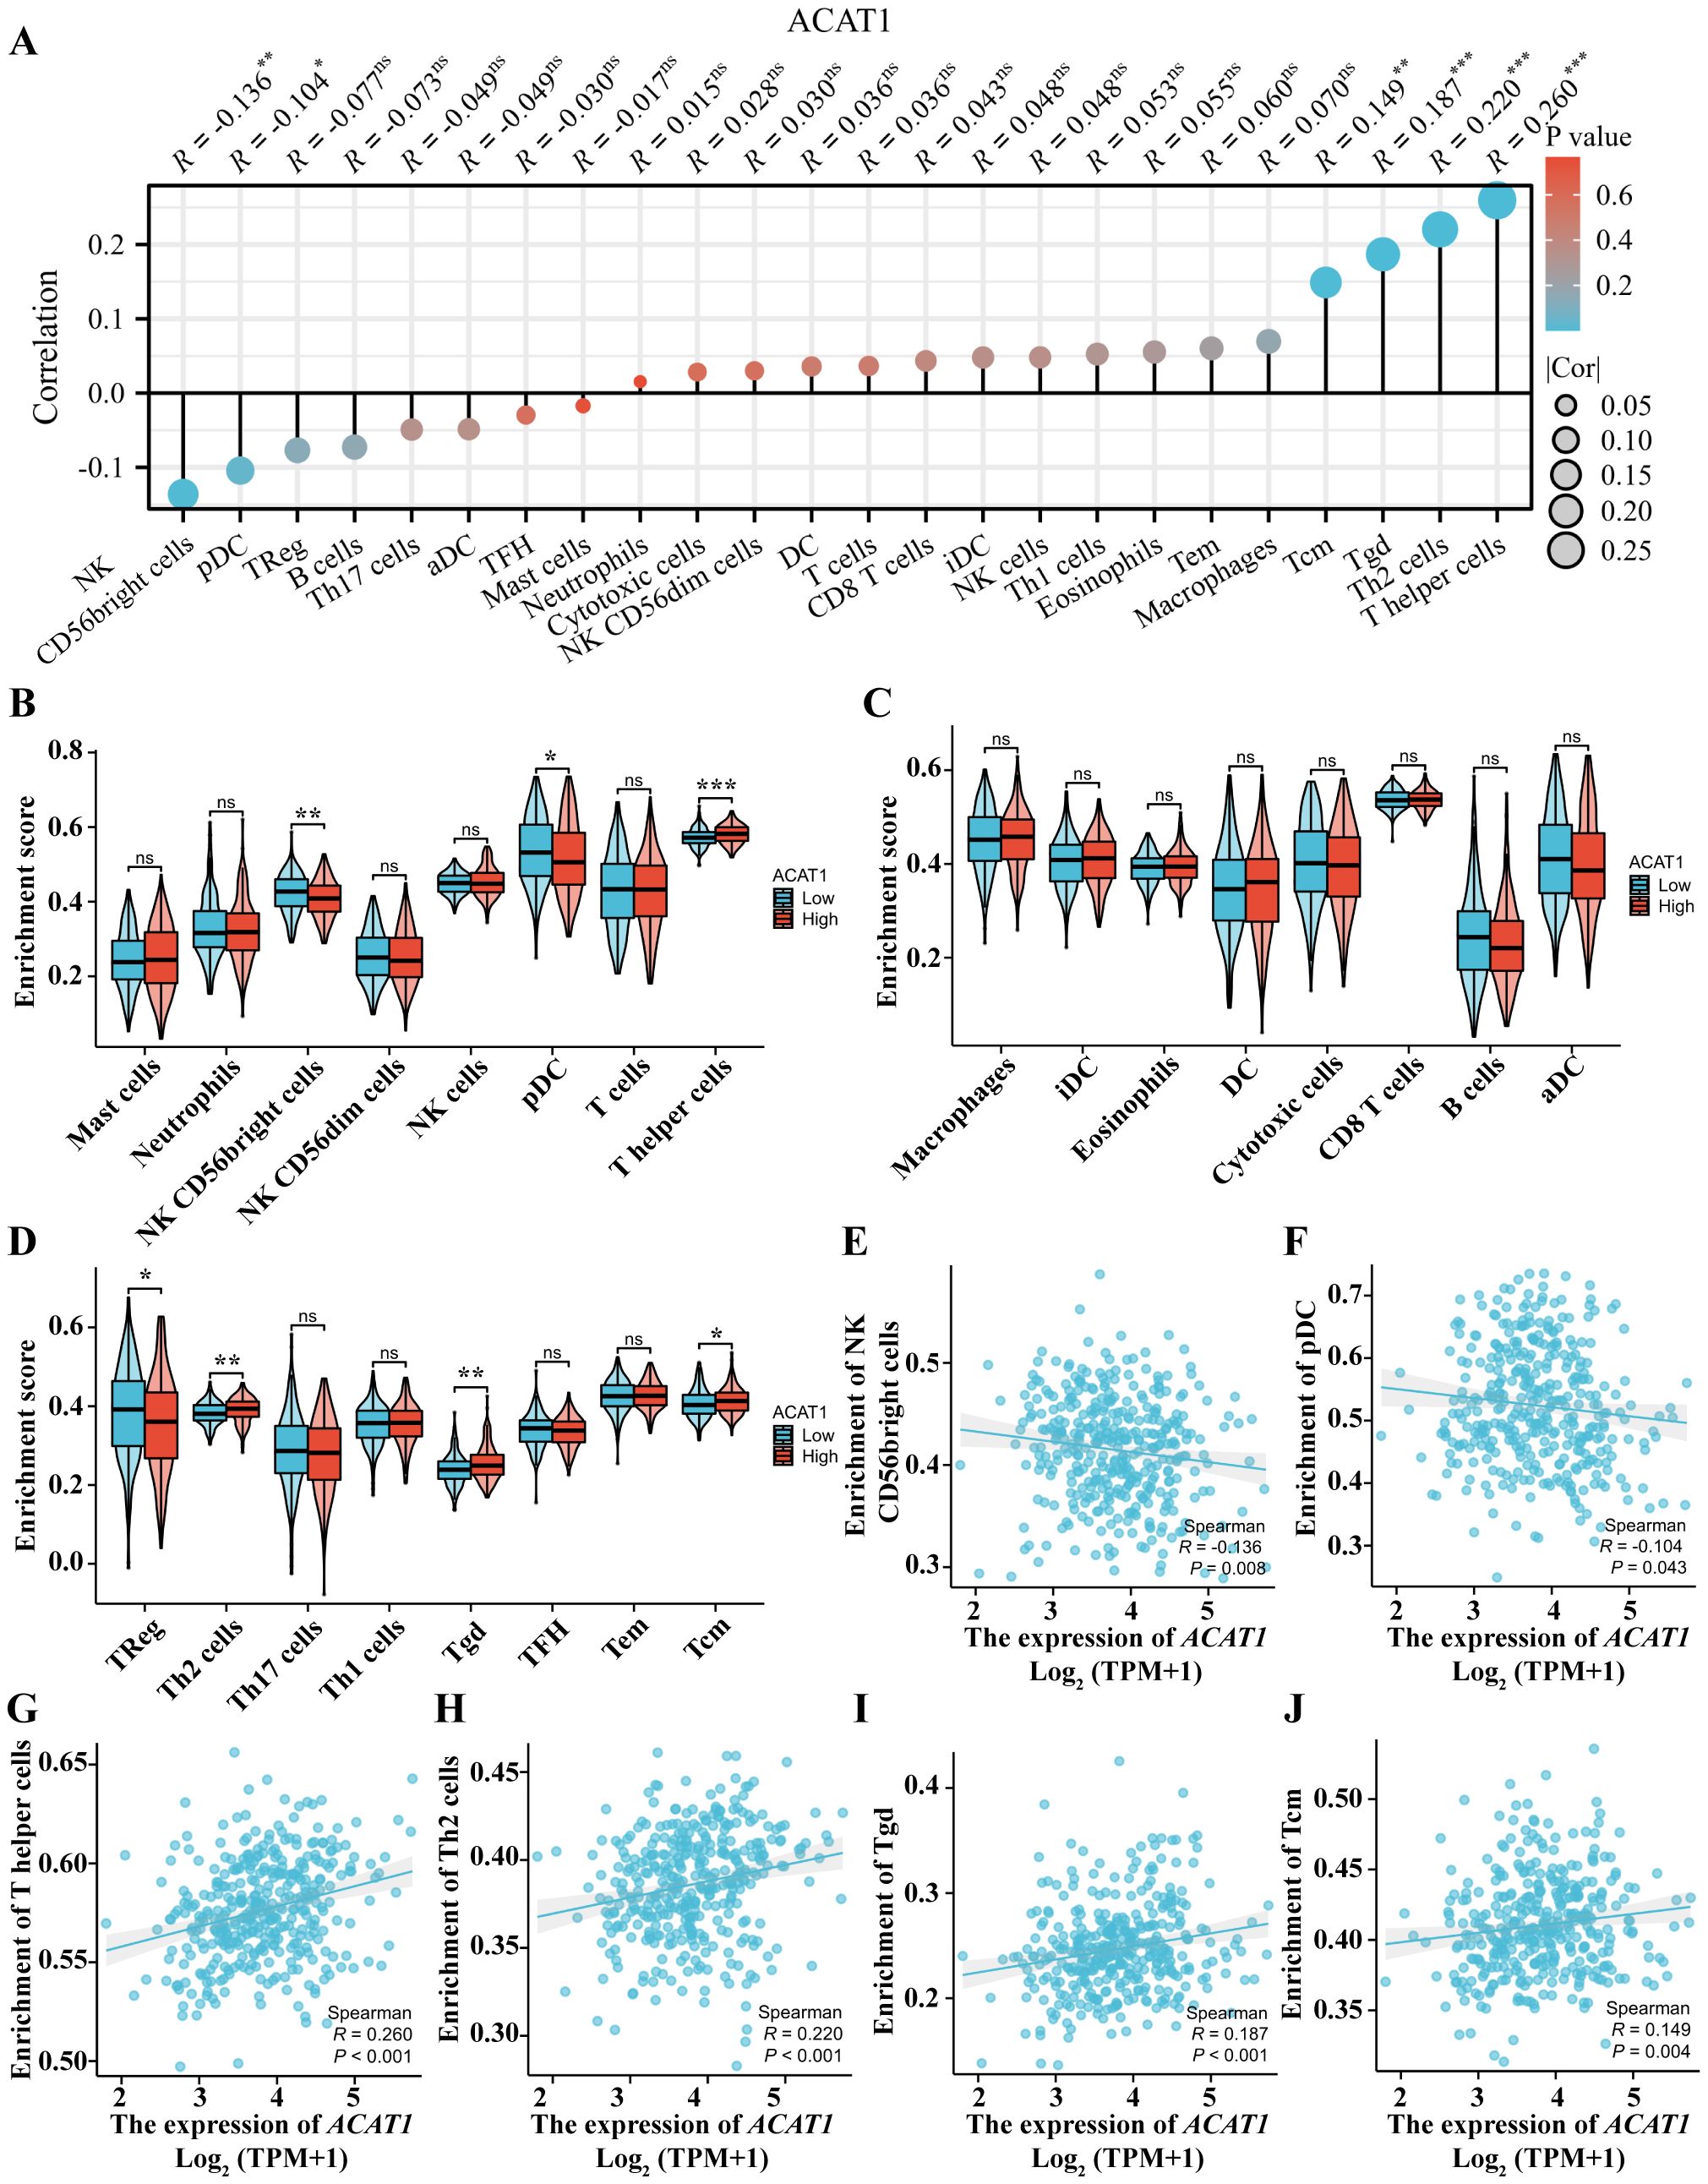
Figure 9. Relationship between the ACAT1 gene expression and immune cell infiltration. (A) The relationship between the ACAT1 gene expression and immune cell infiltration status. (B–D) Differences in the degree to which certain immune cell subsets were enriched in the ACAT1 gene high- and low-expression groups. (E–J) Relationships between the ACAT1 gene expression and tumor microenvironment characteristics. ns, not significant. *p < 0.05, **p < 0.01, ***p < 0.001.
Tumor samples exhibited reduced ACAT1 gene expression compared to normal samples
We examined the ACAT1 gene expression in pan-cancer samples and compared it to the expression in adjacent healthy tissues in the cancer genome atlas (TCGA) dataset to investigate whether low ACAT1 gene expression in cancer is a common occurrence (Supplementary Figure S2A). The TCGA database was used to make predictions about the patterns of ACAT1 mRNA expression in gastric cancer and normal tissue specimens. ACAT1 mRNA expression was notably reduced in primary tumor samples of gastric cancer compared to normal tissue samples (Supplementary Figure S2B). ACAT1 expression was found to be decreased in gastric cancer tissue specimens compared to normal tissue specimens and adjoining gastric cancer tissues, based on data from GTEx (Supplementary Figure S2C). In addition, there was a significant decrease in ACAT1 expression in gastric cancer samples when compared to corresponding adjoining samples (Supplementary Figure S2D). Furthermore, the decrease in ACAT1 expression in gastric cancer samples compared to normal samples were confirmed using the GEO datasets (GSE27342) (Supplementary Figure S2E). Likewise, analysis of Human Protein Atlas (HPA) data revealed a decrease in ACAT1 protein expression in gastric cancer tissue when compared to normal tissue (Supplementary Figure S2F). We also analyzed the correlation of ACAT1 expression with clinical features of gastric cancer patients through the UALCAN database. We found that lower ACAT1 expression was correlated with higher individual stage, tumor grade, and nodal metastasis status (Supplementary Figures S2G–I).
Diagnostic and prognostic relevance of ACAT1 expression in gastric cancer
A receiver operating characteristic (ROC) curve was constructed to examine the diagnostic significance of ACAT1 expression by comparing ACAT1 expression in normal tissue specimens (data obtained from GTEx) and adjoining gastric cancer tissues with that of gastric cancer specimens. The results showed that the area under the curve (AUC) value for ACAT1 levels was 0.590 (confidence interval = 0.484–0.695), indicating a poor overall diagnostic accuracy (Supplementary Figure S3A). Besides, we analyzed the correlation of ACAT1 expression with prognosis of gastric cancer patients from the TCGA database. The p-value of the overall survival (OS), disease-specific survival (DSS) and progression-free interval (PFS) curve is not significant (Supplementary Figures S3B–D). However, gastric cancer patients with high expression of ACAT1 perform better than those with low expression of ACAT1 in the PFS curve (Supplementary Figure S3D).
Discussion
ACAT1, a vital mitochondrial enzyme, plays a key role in metabolic processes, including the production and degradation of ketones, as well as the breakdown of isoleucine and fatty acids (33). Reports suggest that MiR-21 targets the 3’UTR of human ACAT1 mRNA, resulting in decreased ACAT1 levels, promoting cell growth (34). ACAT1 is not only regulated by MiR-21 but also modulates the pyruvate dehydrogenase complex (PDC), inhibiting its activity and shifting cellular metabolism towards aerobic glycolysis.
In tissues from gastric cancer patients and in gastric cancer cell lines, we observed negative correlation between ACAT1 expression and TNM staging. Hence, we hypothesized that ACAT1 may inhibit the establishment and progression of gastric cancer. To test this hypothesis, we developed a stably transformed gastric cancer cell line to analyze cancer stem cell markers. We found that ACAT1 decreases the levels of CD44 and OCT4, increases the levels of CD24, inhibits colony formation in soft agar, and improves the response to chemotherapy drugs such as 5-FU and etoposide. The proliferation rate of AGS cells significantly increased when treated with the ACAT1 inhibitor AH. Additionally, ACAT1 suppresses the growth of gastric cancer xenograft tumors in nude mice. In summary, ACAT1 inhibits the stemness of gastric cancer cells.
In further support of tumor-suppressor role in gastric cancer, we also found that ACAT1 negatively regulates EMT. ACAT1 increases the expression of the epithelial protein E-cadherin and decreases the expression of the mesenchymal protein vimentin. Additionally, ACAT1 suppresses the transcription of SNAI1 and SNAI3 genes, which promote EMT. EMT is closely associated with the migratory and invasive capabilities of gastric cancer cells. Moreover, our Transwell experiments revealed that ACAT1 inhibits the migratory and invasive abilities of gastric cancer cells, indicating that ACAT1 disrupts the EMT process.
EMT involves a series of complex events through which cells transition to reduce their epithelial characteristics and become more migratory. Traditionally, this transformation was thought to be complete when cells lost their epithelial markers and gained mesenchymal markers. However, new findings suggest that cells undergoing EMT are often diverse, exhibiting varying levels of both epithelial and mesenchymal markers. Cells frequently display a partial EMT phenotype and may not require a full mesenchymal transition to migrate (35). In our study, immunofluorescence staining of MKN45-LV5 and MKN45-ACAT1 cells revealed that some cells expressed both E-cadherin and vimentin, while others expressed only E-cadherin or vimentin. Overexpression of ACAT1 enhanced E-cadherin expression, decreased vimentin expression, and reversed the EMT process in the majority of cells. However, some cells still expressed vimentin, suggesting that these cells are in an intermediate state during EMT.
Previous studies have also shown enhanced methylation of ACAT1 gene promoter in renal clear cell carcinoma and nasopharyngeal carcinoma, leading to decreased ACAT1 expression and a correlation with EMT initiation (36, 37). This supports our finding that downregulation of ACAT1 promotes EMT in gastric cancer.
In addition to our current results in gastric cancer, previous studies have also shown that ACAT1 expression levels in prostate cancer are higher compared to adjacent normal tissues, with ACAT1 and SIRT5 synergistically promoting the development of invasive prostate cancer (38). ACAT1 also sensitizes doxorubicin-resistant uterine cancer cells to doxorubicin therapy (39). In liver cancer, ACAT1 promotes lipid metabolism and tumor occurrence by stabilizing FASN through the acetylation of GNPAT (40). ACAT1 also enhances leukemia generation by acetylating mutant isocitrate dehydrogenase 2 (41). ACAT1 is dysregulated in renal cell carcinoma (42, 43), nasopharyngeal carcinoma (36), and glioma (44) compared to adjacent healthy tissues. However, there have been no reports on the involvement of ACAT1 in the progression of gastric cancer.
Zhang et al. investigated the function and mechanisms of Acetyl-CoA acetyltransferase 2 (ACAT2) in gastric cancer (45). The authors demonstrate that the expression of ACAT2 was significantly increased in GC tissues compared with normal counterparts. In vitro functional studies demonstrated that the proliferation and the motility of GC cells were inhibited by ACAT2 knockdown. They further showed that ACAT2 acts as an inhibitor of YAP1 ubiquitination, thereby preventing its degradation and allowing it to accumulate in cells. This accumulation enhances the proliferation and metastatic potential of gastric cancer cells. Mechanistically, the study reveals that ACAT2 achieves this by upregulating SET domain-containing protein 7 (SETD7), a lysine methyltransferase known to promote YAP1 stability. By increasing the expression of SETD7, ACAT2 facilitates the methylation of YAP1, which in turn reduces its recognition by ubiquitin ligases, thus suppressing its ubiquitination and subsequent proteasomal degradation (45).
Cancer stem-like cells (CSCs), also known as cancer-initiating cells (CICs), represent a subpopulation of cells characterized by their high tumorigenic potential, self-renewal ability, and prominent expression of stemness-specific markers such as CD133, Nanog, Sox2, and Oct4 (46). Recent studies have identified CD44 as a universal marker for CSCs/CICs (47). In colon cancer, CD44(hi) cancer stem cells demonstrate an enhanced ability to form colonies in soft agar (48). Remarkably, as few as 10 CD44(hi) cells were capable of forming tumors in 70% of mice, whereas CD44(-) colon tumor cells were non-tumorigenic. Furthermore, CD44(hi) cells could be serially passaged in vivo, indicating their self-renewal capacity, and they formed tumors that recapitulated the heterogeneity of the original patient tumor. Bromodeoxyuridine (BrdU) labeling studies have shown that CD44(hi) cells divide more slowly than CD44(-) cells, suggesting that their tumorigenicity is not merely due to faster proliferation (48). These CSCs have been identified in several human solid tumors, including gastric cancer (2–6, 9–12). CSCs exhibit resistance to conventional chemotherapy and radiotherapy, contributing to tumor relapse and metastasis (49). Another key characteristic of CSCs is their involvement in epithelial-mesenchymal transition (EMT). Inhibiting EMT transcription factors such as TWIST, SNAIL, and SLUG, or targeting GSK-3β, has been proposed as a strategy to block the stemness properties of CSCs (50). We demonstrated that overexpression of ACAT1 reduces levels of CD44 and OCT4, inhibits colony formation in soft agar, enhances the response to chemotherapy drugs, and negatively regulates EMT. Our data suggest that ACAT1 acts as an inhibitor of cancer initiation.
In summary, we found that the expression of ACAT1 is downregulated in advanced gastric cancer. ACAT1 inhibits the migration and invasion, EMT process, and survival of gastric cancer cells. In bioinformatic analyses, ACAT1’s inhibitory effect on gastric cancer may be related to the Adipocytokine Signaling Pathway, the Ppar Signaling Pathway, propanoate metabolism, and the P53 Signaling Pathway. Immune infiltrates were correlated with the expression of ACAT1 mRNA. A limitation of our study is the lack of a deeper mechanistic understanding the ACAT1’ s role in the stemness and EMT of gastric cancer cells. Further research is needed to evaluate the functional role of ACAT1 in gastric cancer.
Materials and methods
Patients and tumor tissues
To investigate the role of ACAT1 in gastric cancer, we collected cancer tissues and adjacent tissues of gastric cancer patients at different stages from the First Affiliated Hospital of Suzhou University in Jiangsu Province, China. This study involved 88 patients, all diagnosed with gastric cancer through histopathology, and underwent resection of gastric cancer between August 2019 and May 2020. None of the patients received anticancer therapy before surgery. The tumors were staged according to the 2010 WHO Digestive System Tumor Classification Standard. Collected samples were immediately frozen in liquid nitrogen and stored for subsequent analysis.
Animals and gastric cancer xenograft tumors
Male BALB/c-Nude mice (6-8 weeks old males, SPF grade) were procured from Jiangsu Jicui Yaokang Biological Co., Ltd. Mice were housed in an SPF animal facility at Soochow University. They were kept in individually ventilated cages (IVC), Euro Standard Type IIL in groups of six with filter tops, and were provided with drinking water and standard chow ad libitum. The temperature in animal facilities was 22–26 °C, and the humidity was 55 ± 10%.
Cell lines and tissues
The human gastric cancer cell line MKN45 (Beijing Institute of Cell Biology, Chinese Academy of Sciences) and the human gastric cancer cell line N87 (Shanghai Institute of Cell Biology, Chinese Academy of Sciences) were cultured in RPMI 1640 medium (1% PS and 10% FBS). The human gastric cancer cell line AGS (Shanghai Institute of Cell Biology, Chinese Academy of Sciences) was cultured in F-12K medium (1% PS and 10% FBS). The human renal epithelial cells 293T (Shanghai Institute of Cell Biology, Chinese Academy of Sciences) was cultured in DMEM medium (1% PS and 10% FBS).
Antibodies
ACAT1 (TA392867, 1:1000 dilution for WB, 1:100 dilution for IF) was from Origene. GAPDH (2118S, 1:5000 dilution for WB), E-cadherin (14472S, 1:1000 dilution for WB, 1:100 dilution for IF), Vimentin (5741S, 1:1000 dilution for WB, 1:100 dilution for IF), CD44 (3570S, 1:400 dilution for IF), Anti-mouse IgG (HRP-linked, 7076S, 1:5000 dilution for WB), and Anti-rabbit IgG (HRP-linked, 7074S, 1:5000 dilution for WB) were from Cell Signaling Technology. CD44-PE (550989, 1:50 dilution for FCM) and CD24-PerCP-Cy5.5 (561647, 1:50 dilution for FCM) were from BD. CD24 (ab202073, 1:100 dilution for IF) was from Abcam. Alexa Fluor 488 goat anti-mouse IgG1 (A21121, 1:500 dilution for IF), Alexa Fluor 488 goat anti-mouse IgG(H+L) (A11001, 1:500 dilution for IF), Alexa Fluor 568 goat anti-rabbit IgG(H+L) (A11010, 1:500 dilution for IF), Alexa Fluor 568 goat anti-mouse IgG2a (A21134, 1:500 dilution for IF) were from Thermo Fisher Scientific.
Western blot
Cell or tissue samples were treated with lysis buffer from Cell Signaling Technology (46232S) and centrifuged to remove insoluble particles. Proteins were separated using SDS-PAGE and subsequently transferred to a PVDF membrane. The membrane was blocked with 5% nonfat milk powder for 2 hours at room temperature. Primary antibodies were incubated with the membranes overnight at 4°C. After three washes with TBST solution, membranes were exposed to secondary antibodies. The bands were visualized using ECL chemiluminescence reagent (PerkinElmer, NEL120001EA).
Immunofluorescence staining
When the cells reached a density of 80% - 90%, the initial medium was removed, and the cells were rinsed with PBS. They were then treated with immunostaining fixative solution (Beyotime, P0098) for 10 minutes at room temperature. Following this, the cells were washed and treated with Triton X-100 solution (Sigma-Aldrich, 9002-93-1) for 10 minutes at room temperature to permeabilize them. After blocking with immunostaining blocking solution (Beyotime, P0102), primary antibodies were added and incubated with the cells overnight at 4°C. The next day, secondary antibodies were applied for 1 hour at room temperature in the dark. Finally, the cells were incubated with DAPI (Sigma-Aldrich, D8417) diluted in distilled water for 5 minutes at room temperature.
RT-qPCR
RNA was extracted using the Trizol solution (Invitrogen, 15596026). Primers for RT-qPCR were created using the Origene website (https://www.origene.com/) and the NCBI-Primer BLAST website (https://www.ncbi.nlm.nih.gov/) for validation. Hongxun Biological Co., Ltd. synthesized the primers. The Ct value was measured using the Quant Studio 6 real-time fluorescence quantitative PCR instrument, and the relative expression level of mRNA was determined using the 2-ΔΔCt method. The RT-qPCR primer set sequences are shown as Supplementary Table S1.
Construction of ACAT1 overexpressing cells
The ACAT1 cDNA was amplified using primers that containing the SphI and BamHI restriction site sequence, utilizing the KOD enzyme reaction system from Toyobo (KOD201). The item was replicated in the LV5 plasmid from GenePharma. Lentivirus produced in 293T cells was used to infect the gastric cancer cells, which were then treated with Puromycin for screening (51). The sequences of ACAT1-CDS and ACAT1-overexpression primers are shown as Supplementary Table S2.
Flow cytometric analysis
We used 1 x 10⁷ gastric cancer cells for flow cytometry analysis. Following incubation with the initial antibodies, the cells were washed and then passed through a 70 μm filter before being examined using a flow cytometer.
Migration and invasion assays
The procedures for migration and invasion have been described in detail in our previous publication (52). The procedure for cell migration is similar to that of invasion, except that Matrigel was not added.
Drug sensitivity experiments
Three thousand cells were resuspended in 200 μl of medium (either normal or containing drugs) and placed in a 96-well plate. The plate was then incubated at 37°C with 5% CO2 for 30 minutes. After incubation, 20 μl of CCK8 reagent was added to each well at day 0, 1, 2 and 3. The optical density (OD) at 450 nm was measured using a microplate reader after incubation with CCK8 reagent for 2 h. The OD value of the blank medium served as a control, and the relative levels of proliferation were determined after standardization.
Colony formation in soft agar
A soft agar assay was conducted in a Petri dish containing 3000 cells following the procedure we have previously described with modifications (53). The bottom layer contains 0.5% agarose and the top layer contains 0.4% low melting point agarose.
Data source
The TCGA, a data platform accessible at https://portal.gdc.cancer.gov, offers clinicopathological information on 33 cancer types as part of a major genome project, easily accessible to researchers and scholars. Clinical information of patients with gastric cancer and high-throughput RNA sequencing (RNA-seq) data was retrieved from the TCGA database. The Human Protein Atlas (HPA) provides comprehensive information on the gene expression and protein profiles of diverse human samples, such as tissues, cells, and disease states. At present, the online database includes information about the unique locations of 44 healthy tissues and the top twenty commonly identified types of cancer. Additionally, the database includes information on protein immunohistochemistry in both tumor and normal human tissue samples.
GEO analysis
All microarray data was downloaded from the GEO database (http://www.ncbi.nih.gov/geo). Box plots are drawn by boxplot of R.
UALCAN analysis
The UALCAN website offers a comprehensive and interactive analysis of bioinformatics using RNA-seq and clinical information from 31 different types of cancers in TCGA database (http://ualcan.path.uab.edu/). The database has the capability to analyze gene expression across various tumor stages or subtypes, along with additional clinicopathological characteristics. We analyzed the level of ACAT1 expression in relation to key clinical characteristics including cancer stage, grade of tumor, and presence of nodal metastasis.
GSEA analysis
The GSEA method (54) was utilized in every study to rank the genome a thousand times and identify pathways linked to ACAT1 gene expression. During the GSEA examination, it was established that the critical value for significant results was an adjusted p-value less than 0.05 and a false discovery rate (FDR) below 0.25. Enrichment analysis results were determined based on the normalized enrichment scores (NESs) and adjusted p-values.
Analysis of the infiltration of immune cells
The analysis of the infiltration of immune cells were performed using a method as described (55).
Clinical statistical analysis of diagnosis and prognosis
This part was performed as previously described (55).
Statistical methods
All experiments were repeated more than 3 times, and the data were processed by Excel, GraphPad Prism, and SPSS Statistics. The data were expressed as means ± SD, and statistical significance was analyzed by t test. Western blot was used to detect the data of gastric cancer patient tissue samples by nonparametric test Mann-Whitney analysis. n=3 in all experiments except the nude mouse tumor formation experiment, where n=6. In all results, p < 0.05 indicates that the data difference is statistically significant.
Data availability statement
The original contributions presented in the study are included in the article/Supplementary Material. Further inquiries can be directed to the corresponding authors.
Ethics statement
The studies involving humans were approved by Research Ethics Committee of the First Affiliated Hospital of Soochow University. The studies were conducted in accordance with the local legislation and institutional requirements. The participants provided their written informed consent to participate in this study. The animal study was approved by Institutional Laboratory Animal Care and Use Committee of Soochow University. The study was conducted in accordance with the local legislation and institutional requirements.
Author contributions
WH: Data curation, Formal analysis, Writing – original draft. YL: Data curation, Formal analysis, Writing – original draft. S-BL: Conceptualization, Methodology, Writing – original draft, Writing – review & editing. YC: Data curation, Formal analysis, Writing – original draft. SH: Data curation, Formal analysis, Writing – original draft. XH: Data curation, Formal analysis, Writing – original draft. ZM: Data curation, Formal analysis, Writing – original draft. HA: Writing – review & editing. Y-HS: Conceptualization, Methodology, Writing – original draft, Writing – review & editing. JZ: Conceptualization, Funding acquisition, Methodology, Writing – original draft, Writing – review & editing.
Funding
The author(s) declare financial support was received for the research, authorship, and/or publication of this article. This work was supported by grants to JZ: the National Natural Science Foundation of China (NSFC, grant no. 81871952 and no. 82372887), the Natural Science Foundation of Jiangsu Province (grant no. BK20221242), Gusu Health Talents Cultivation Program, China (grant no. GSWS2019008), the “Qinglan Project” in Jiangsu Colleges and Universities, the Special Project of Diagnosis and Treatment Technology for Clinical Key Diseases in Suzhou (grant no. LCZX202202), the Clinical Medicine peak project of Suzhou Medical College of Soochow University, the Leading talent project of “Boxi Excellent Talent Training Plan” of the First Affiliated Hospital of Soochow University, the Youth Science and Technology of Suzhou Science and Education Project (grant no. KJXW2023005), Boxi Youth Natural Science Foundation of the First Affiliated Hospital of Soochow University (grant no. BXQN2023027).
Acknowledgments
We thank Xiantao academic platform (https://www.xiantao.love/products) for their support in visualization.
Conflict of interest
The authors declare that the research was conducted in the absence of any commercial or financial relationships that could be construed as a potential conflict of interest.
Publisher’s note
All claims expressed in this article are solely those of the authors and do not necessarily represent those of their affiliated organizations, or those of the publisher, the editors and the reviewers. Any product that may be evaluated in this article, or claim that may be made by its manufacturer, is not guaranteed or endorsed by the publisher.
Supplementary material
The Supplementary Material for this article can be found online at: https://www.frontiersin.org/articles/10.3389/fimmu.2024.1449525/full#supplementary-material
References
1. Abbaszadegan MR, Bagheri V, Razavi MS, Momtazi AA, Sahebkar A, Gholamin M. Isolation, identification, and characterization of cancer stem cells: A review. J Cell Physiol. (2017) 232:2008–18. doi: 10.1002/jcp.25759
2. Bagheri V, Memar B, Behzadi R, Aliakbarian M, Jangjoo A, Bahar MM, et al. Isolation and identification of chemotherapy-enriched sphere-forming cells from a patient with gastric cancer. J Cell Physiol. (2018) 233:7036–46. doi: 10.1002/jcp.26627
3. Su J, Wu S, Wu H, Li L, Guo T. CD44 is functionally crucial for driving lung cancer stem cells metastasis through Wnt/beta-catenin-FoxM1-Twist signaling. Mol Carcinog. (2016) 55:1962–73. doi: 10.1002/mc.22443
4. Cho Y, Lee HW, Kang HG, Kim HY, Kim SJ, Chun KH. Cleaved CD44 intracellular domain supports activation of stemness factors and promotes tumorigenesis of breast cancer. Oncotarget. (2015) 6:8709–21. doi: 10.18632/oncotarget.3325
5. Cui J, Li P, Liu X, Hu H, Wei W. Abnormal expression of the Notch and Wnt/beta-catenin signaling pathways in stem-like ALDH(hi)CD44(+) cells correlates highly with Ki-67 expression in breast cancer. Oncol Lett. (2015) 9:1600–6. doi: 10.3892/ol.2015.2942
6. Ponta H, Sherman L, Herrlich PA. CD44: from adhesion molecules to signaling regulators. Nat Rev Mol Cell Biol. (2003) 4:33–45. doi: 10.1038/nrm1004
7. Wang YJ, Herlyn M. The emerging roles of Oct4 in tumor-initiating cells. Am J Physiol Cell Physiol. (2015) 309:C709–18. doi: 10.1152/ajpcell.00212.2015
8. Fujino S, Miyoshi N. Oct4 gene expression in primary colorectal cancer promotes liver metastasis. Stem Cells Int. (2019) 2019:7896524. doi: 10.1155/2019/7896524
9. Dai X, Ge J, Wang X, Qian X, Zhang C, Li X. OCT4 regulates epithelial-mesenchymal transition and its knockdown inhibits colorectal cancer cell migration and invasion. Oncol Rep. (2013) 29:155–60. doi: 10.3892/or.2012.2086
10. Zhao RC, Zhou J, Chen KF, Gong J, Liu J, He JY, et al. The prognostic value of combination of CD90 and OCT4 for hepatocellular carcinoma after curative resection. Neoplasma. (2016) 63:288–98. doi: 10.4149/neo_2016_036
11. Hui D, Chen J, Jiang Y, Pan Y, Zhang Z, Dong M, et al. CD44(+)CD24(-/low) sphere-forming cells of EBV-associated gastric carcinomas show immunosuppressive effects and induce Tregs partially through production of PGE2. Exp Cell Res. (2020) 390:111968. doi: 10.1016/j.yexcr.2020.111968
12. Chekhun VF, Lukianova NY, Chekhun SV, Bezdieniezhnykh NO, Zadvorniy TV, Borikun TV, et al. Association of CD44(+)CD24(-/low) with markers of aggressiveness and plasticity of cell lines and tumors of patients with breast cancer. Exp Oncol. (2017) 39:203–11. doi: 10.31768/2312-8852.2017.39(3):203-211
13. Thiery JP. Epithelial-mesenchymal transitions in tumor progression. Nat Rev Cancer. (2002) 2:442–54. doi: 10.1038/nrc822
14. Valdes F, Alvarez AM, Locascio A, Vega S, Herrera B, Fernandez M, et al. The epithelial mesenchymal transition confers resistance to the apoptotic effects of transforming growth factor Beta in fetal rat hepatocytes. Mol Cancer Res. (2002) 1:68–78.
15. Molaei F, Forghanifard MM, Fahim Y, Abbaszadegan MR. Molecular signaling in tumorigenesis of gastric cancer. Iran BioMed J. (2018) 22:217–30. doi: 10.22034/ibj.22.4.217
16. Kilic-Yildirim G, Durmus-Aydogdu S, Ceylaner S, Sass JO. Beta-ketothiolase deficiency: An unusual cause of recurrent ketoacidosis. Turk J Pediatr. (2017) 59:471–4. doi: 10.24953/turkjped.2017.04.016
17. Otsuka H, Sasai H, Nakama M, Aoyama Y, Abdelkreem E, Ohnishi H, et al. Exon 10 skipping in ACAT1 caused by a novel c.949G>A mutation located at an exonic splice enhancer site. Mol Med Rep. (2016) 14:4906–10. doi: 10.3892/mmr.2016.5819
18. Fukao T, Nguyen HT, Nguyen NT, Vu DC, Can NT, Pham AT, et al. A common mutation, R208X, identified in Vietnamese patients with mitochondrial acetoacetyl-CoA thiolase (T2) deficiency. Mol Genet Metab. (2010) 100:37–41. doi: 10.1016/j.ymgme.2010.01.007
19. Fukao T, Aoyama Y, Murase K, Hori T, Harijan RK, Wierenga RK, et al. Development of MLPA for human ACAT1 gene and identification of a heterozygous Alu-mediated deletion of exons 3 and 4 in a patient with mitochondrial acetoacetyl-CoA thiolase (T2) deficiency. Mol Genet Metab. (2013) 110:184–7. doi: 10.1016/j.ymgme.2013.07.004
20. Kodama H, Murata S, Ishida M, Yamamoto H, Yamaguchi T, Kaida S, et al. Prognostic impact of CD44-positive cancer stem-like cells at the invasive front of gastric cancer. Br J Cancer. (2017) 116:186–94. doi: 10.1038/bjc.2016.401
21. de Gonzalo-Calvo D, Lopez-Vilaro L, Nasarre L, Perez-Olabarria M, Vazquez T, Escuin D, et al. Intratumor cholesteryl ester accumulation is associated with human breast cancer proliferation and aggressive potential: a molecular and clinicopathological study. BMC Cancer. (2015) 15:460. doi: 10.1186/s12885-015-1469-5
22. Takaishi S, Okumura T, Tu S, Wang SS, Shibata W, Vigneshwaran R, et al. Identification of gastric cancer stem cells using the cell surface marker CD44. Stem Cells. (2009) 27:1006–20. doi: 10.1002/stem.30
23. Camerlingo R, Ferraro GA, De Francesco F, Romano M, Nicoletti G, Di Bonito M, et al. The role of CD44+/CD24-/low biomarker for screening, diagnosis and monitoring of breast cancer. Oncol Rep. (2014) 31:1127–32. doi: 10.3892/or.2013.2943
24. Thiery JP, Sleeman JP. Complex networks orchestrate epithelial-mesenchymal transitions. Nat Rev Mol Cell Biol. (2006) 7:131–42. doi: 10.1038/nrm1835
25. Shook D, Keller R. Mechanisms, mechanics and function of epithelial-mesenchymal transitions in early development. Mech Dev. (2003) 120:1351–83. doi: 10.1016/j.mod.2003.06.005
26. Yang J, Mani SA, Weinberg RA. Exploring a new twist on tumor metastasis. Cancer Res. (2006) 66:4549–52. doi: 10.1158/0008-5472.CAN-05-3850
27. Yu Y, Yang X, Reghu S, Kaul SC, Wadhwa R, Miyako E. Photothermogenetic inhibition of cancer stemness by near-infrared-light-activatable nanocomplexes. Nat Commun. (2020) 11:4117. doi: 10.1038/s41467-020-17768-3
28. Fan J, Lin R, Xia S, Chen D, Elf SE, Liu S, et al. Tetrameric acetyl-coA acetyltransferase 1 is important for tumor growth. Mol Cell. (2016) 64:859–74. doi: 10.1016/j.molcel.2016.10.014
29. Policastro LL, Ibanez IL, Notcovich C, Duran HA, Podhajcer OL. The tumor microenvironment: characterization, redox considerations, and novel approaches for reactive oxygen species-targeted gene therapy. Antioxid Redox Signal. (2013) 19:854–95. doi: 10.1089/ars.2011.4367
30. Hanahan D, Weinberg RA. Hallmarks of cancer: the next generation. Cell. (2011) 144:646–74. doi: 10.1016/j.cell.2011.02.013
31. Saha SK, Lee SB, Won J, Choi HY, Kim K, Yang GM, et al. Correlation between oxidative stress, nutrition, and cancer initiation. Int J Mol Sci. (2017) 18:1544. doi: 10.3390/ijms18071544
32. He M, Han Y, Cai C, Liu P, Chen Y, Shen H, et al. CLEC10A is a prognostic biomarker and correlated with clinical pathologic features and immune infiltrates in lung adenocarcinoma. J Cell Mol Med. (2021) 25:3391–9. doi: 10.1111/jcmm.16416
33. Kano M, Fukao T, Yamaguchi S, Orii T, Osumi T, Hashimoto T. Structure and expression of the human mitochondrial acetoacetyl-CoA thiolase-encoding gene. Gene. (1991) 109:285–90. doi: 10.1016/0378-1119(91)90623-j
34. Chanyshev MD, Razumova YV, Ovchinnikov VY, Gulyaeva LF. MiR-21 regulates the ACAT1 gene in MCF-7 cells. Life Sci. (2018) 209:173–78. doi: 10.1016/j.lfs.2018.08.010
35. Hutchins EJ, Bronner ME. A spectrum of cell states during the epithelial-to-mesenchymal transition. Methods Mol Biol. (2021) 2179:3–6. doi: 10.1007/978-1-0716-0779-4_1
36. Lu Y, Zhou X, Zhao W, Liao Z, Li B, Han P, et al. Epigenetic inactivation of acetyl-CoA acetyltransferase 1 promotes the proliferation and metastasis in nasopharyngeal carcinoma by blocking ketogenesis. Front Oncol. (2021) 11:667673. doi: 10.3389/fonc.2021.667673
37. Han P, Wu S, Li L, Li D, Zhao J, Zhang H, et al. Epigenetic inactivation of ACAT1 promotes epithelial-mesenchymal transition of clear cell renal cell carcinoma. Genes Genomics. (2022) 44:487–97. doi: 10.1007/s13258-021-01211-y
38. Saraon P, Trudel D, Kron K, Dmitromanolakis A, Trachtenberg J, Bapat B, et al. Evaluation and prognostic significance of ACAT1 as a marker of prostate cancer progression. Prostate. (2014) 74:372–80. doi: 10.1002/pros.22758
39. Lo YW, Lin ST, Chang SJ, Chan CH, Lyu KW, Chang JF, et al. Mitochondrial proteomics with siRNA knockdown to reveal ACAT1 and MDH2 in the development of doxorubicin-resistant uterine cancer. J Cell Mol Med. (2015) 19:744–59. doi: 10.1111/jcmm.12388
40. Gu L, Zhu Y, Lin X, Tan X, Lu B, Li Y. Stabilization of FASN by ACAT1-mediated GNPAT acetylation promotes lipid metabolism and hepatocarcinogenesis. Oncogene. (2020) 39:2437–49. doi: 10.1038/s41388-020-1156-0
41. Chen D, Xia S, Zhang R, Li Y, Famulare CA, Fan H, et al. Lysine acetylation restricts mutant IDH2 activity to optimize transformation in AML cells. Mol Cell. (2021) 81:3833–3847.e11. doi: 10.1016/j.molcel.2021.06.027
42. Zhao Z, Wu F, Ding S, Sun L, Liu Z, Ding K, et al. Label-free quantitative proteomic analysis reveals potential biomarkers and pathways in renal cell carcinoma. Tumor Biol. (2015) 36:939–51. doi: 10.1007/s13277-014-2694-2
43. Chen L, Peng T, Luo Y, Zhou F, Wang G, Qian K, et al. ACAT1 and metabolism-related pathways are essential for the progression of clear cell renal cell carcinoma (ccRCC), as determined by co-expression network analysis. Front Oncol. (2019) 9:957. doi: 10.3389/fonc.2019.00957
44. Maurer GD, Brucker DP, Bahr O, Harter PN, Hattingen E, Walenta S, et al. Differential utilization of ketone bodies by neurons and glioma cell lines: a rationale for ketogenic diet as experimental glioma therapy. BMC Cancer. (2011) 11:315. doi: 10.1186/1471-2407-11-315
45. Zhang M, Cai F, Guo J, Liu S, Ma G, Cai M, et al. ACAT2 suppresses the ubiquitination of YAP1 to enhance the proliferation and metastasis ability of gastric cancer via the upregulation of SETD7. Cell Death Dis. (2024) 15:297. doi: 10.1038/s41419-024-06666-x
46. He Q, Li Z. The dysregulated expression and functional effect of CaMK2 in cancer. Cancer Cell Int. (2021) 21:326. doi: 10.1186/s12935-021-02030-7
47. Wu X, Meng X, Chang TS, Feng S, Lee M, Jaiswal S, et al. Multi-modal imaging for uptake of peptide ligand specific for CD44 by hepatocellular carcinoma. Photoacoustics. (2022) 26:100355. doi: 10.1016/j.pacs.2022.100355
48. Chu P, Clanton DJ, Snipas TS, Lee J, Mitchell E, Nguyen ML, et al. Characterization of a subpopulation of colon cancer cells with stem cell-like properties. Int J Cancer. (2009) 124:1312–21. doi: 10.1002/ijc.24061
49. Corgnac S, Damei I, Gros G, Caidi A, Terry S, Chouaib S, et al. Cancer stem-like cells evade CD8(+)CD103(+) tumor-resident memory T (T(RM)) lymphocytes by initiating an epithelial-to-mesenchymal transition program in a human lung tumor model. J Immunother Cancer. (2022) 10:e004527. doi: 10.1136/jitc-2022-004527
50. Vijay GV, Zhao N, Den Hollander P, Toneff MJ, Joseph R, Pietila M, et al. GSK3beta regulates epithelial-mesenchymal transition and cancer stem cell properties in triple-negative breast cancer. Breast Cancer Res. (2019) 21:37. doi: 10.1186/s13058-019-1125-0
51. Zheng J, Lou J, Li Y, Qian P, He W, Hao Y, et al. Satellite cell-specific deletion of Cipc alleviates myopathy in mdx mice. Cell Rep. (2022) 39:110939. doi: 10.1016/j.celrep.2022.110939
52. Wang X, Zhi Q, Liu S, Xue SL, Shen C, Li Y, et al. Identification of specific biomarkers for gastric adenocarcinoma by ITRAQ proteomic approach. Sci Rep. (2016) 6:38871. doi: 10.1038/srep38871
53. Wu C, Ding H, Wang S, Li Y, Liu SB, Wang X, et al. DAXX inhibits cancer stemness and epithelial-mesenchymal transition in gastric cancer. Br J Cancer. (2020) 122:1477–85. doi: 10.1038/s41416-020-0800-3
54. Subramanian A, Tamayo P, Mootha VK, Mukherjee S, Ebert BL, Gillette MA, et al. Gene set enrichment analysis: a knowledge-based approach for interpreting genome-wide expression profiles. Proc Natl Acad Sci USA. (2005) 102:15545–50. doi: 10.1073/pnas.0506580102
Keywords: gastric cancer, ACAT1, tumor stem cells, EMT, mitochondrial enzyme
Citation: He W, Li Y, Liu S-B, Chang Y, Han S, Han X, Ma Z, Amin HM, Song Y-H and Zhou J (2024) From mitochondria to tumor suppression: ACAT1's crucial role in gastric cancer. Front. Immunol. 15:1449525. doi: 10.3389/fimmu.2024.1449525
Received: 15 June 2024; Accepted: 08 August 2024;
Published: 23 August 2024.
Edited by:
Gang Ye, Sichuan Agricultural University, ChinaReviewed by:
Meng Jia, University of Pennsylvania, United StatesRania Hassan Mohamed, Ain Sham University, Egypt
Xingxing Yuan, Heilongjiang Academy of Traditional Chinese Medicine, China
Copyright © 2024 He, Li, Liu, Chang, Han, Han, Ma, Amin, Song and Zhou. This is an open-access article distributed under the terms of the Creative Commons Attribution License (CC BY). The use, distribution or reproduction in other forums is permitted, provided the original author(s) and the copyright owner(s) are credited and that the original publication in this journal is cited, in accordance with accepted academic practice. No use, distribution or reproduction is permitted which does not comply with these terms.
*Correspondence: Jin Zhou, MTM5MTM1MDYzNjlAMTYzLmNvbQ==; Song-Bai Liu, bGl1c29uZ2JhaUAxMjYuY29t; Yao-Hua Song, eWFvaHVhX3NvbmcxQHlhaG9vLmNvbQ==
†These authors have contributed equally to this work