 Xiaodong Niu
 Tao Chang
 Yanhui Liu
 Yuan Yang
 Qing Mao
94% of researchers rate our articles as excellent or good
Learn more about the work of our research integrity team to safeguard the quality of each article we publish.
Find out more
ORIGINAL RESEARCH article
Front. Immunol., 11 September 2024
Sec. Cancer Immunity and Immunotherapy
Volume 15 - 2024 | https://doi.org/10.3389/fimmu.2024.1447879
This article is part of the Research TopicCombination Immunotherapy and Immune Response Assessment of Brain TumoursView all 9 articles
Background: This study aimed to identify prognostic factors for survival and develop a prognostic nomogram to predict the survival probability of elderly patients with lower-grade gliomas (LGGs).
Methods: Elderly patients with histologically confirmed LGG were recruited from the Surveillance, Epidemiology, and End Results (SEER) database. These individuals were randomly allocated to the training and validation cohorts at a 2:1 ratio. First, Kaplan−Meier survival analysis and subgroup analysis were performed. Second, variable screening of all 13 variables and a comparison of predictive models based on full Cox regression and LASSO-Cox regression analyses were performed, and the key variables in the optimal model were selected to construct prognostic nomograms for OS and CSS. Finally, a risk stratification system and a web-based dynamic nomogram were constructed.
Results: A total of 2307 elderly patients included 1220 males and 1087 females, with a median age of 72 years and a mean age of 73.30 ± 6.22 years. Among them, 520 patients (22.5%) had Grade 2 gliomas, and 1787 (77.5%) had Grade 3 gliomas. Multivariate Cox regression analysis revealed four independent prognostic factors (age, WHO grade, surgery, and chemotherapy) that were used to construct the full Cox model. In addition, LASSO-Cox regression analysis revealed five prognostic factors (age, WHO grade, surgery, radiotherapy, and chemotherapy), and a LASSO model was constructed. A comparison of the two models revealed that the LASSO model with five variables had better predictive performance than the full Cox model with four variables. Ultimately, five key variables based on LASSO-Cox regression were utilized to develop prognostic nomograms for predicting the 1-, 2-, and 5-year OS and CSS rates. The nomograms exhibited relatively good predictive ability and clinical utility. Moreover, the risk stratification system based on the nomograms effectively divided patients into low-risk and high-risk subgroups.
Conclusion: Variable screening based on LASSO-Cox regression was used to determine the optimal prediction model in this study. Prognostic nomograms could serve as practical tools for predicting survival probabilities, categorizing these patients into different mortality risk subgroups, and developing personalized decision-making strategies for elderly patients with LGGs. Moreover, the web-based dynamic nomogram could facilitate its use in the clinic.
Diffuse gliomas are categorized into three grades (grades 2, 3, and 4) based on histopathological and molecular characteristics according to the classification guidelines for central nervous system (CNS) tumors (1, 2). Among diffuse gliomas, glioblastoma (GBM) is the most prevalent histological type, accounting for more than half of all gliomas (3, 4). Additionally, lower-grade gliomas (LGGs) include Grade 2 and 3 (called Grade II and III previously) gliomas, which are distinguished by similar mitotic activity, mutations in isocitrate dehydrogenase (IDH), and survival outcomes characterized by specific molecular features that distinguish them from GBM (5–7). LGGs can occur in all age groups, and the peak incidence of astrocytoma occurs in the fourth decade of life, whereas oligodendrogliomas typically affect a slightly older population (8, 9). Moreover, elderly patients with LGGs typically exhibit poorer survival outcomes due to increasing medical comorbidities and diminished physiological reserves, making their clinical management challenging.
To our knowledge, several predictive models have been developed for patients with GBMs or high-grade gliomas in middle-aged and older populations (10–13). Although previous studies have identified various prognostic factors for overall survival in LGG patients (14, 15), little is known about the prognostic factors influencing survival in elderly patients with LGG, and no specific clinical prognostic model tailored to this population has been established. Given the limited inclusion of older data in prior studies, developing a prognostic model dedicated to elderly patients is imperative. In this investigation, we aimed to extract and analyze data from elderly LGG patients with large sample sizes from the Surveillance, Epidemiology, and End Results (SEER) database to determine independent prognostic factors for overall survival (OS) and cancer-specific survival (CSS) based on different regression methods. Subsequently, we constructed a novel nomogram and risk stratification system, which could help clinicians quickly develop clinical assessments and personalized decision-making strategies for elderly patients with LGGs.
Elderly lower-grade glioma (LGG) patients (aged over 65 years) were identified from the Surveillance, Epidemiology, and End Results (SEER) database (17 registries) spanning from 2000 to 2016 using SEER*Stat 8.3.6 software. LGGs included oligodendroglioma, diffuse astrocytoma (DA), anaplastic oligodendroglioma (AO), and anaplastic astrocytoma (AA) on the basis of the International Classification of Diseases for Oncology, third edition (ICD-O-3). The inclusion criteria were as follows: 1) confirmed diagnosis of LGG; 2) aged older than 65 years; and 3) availability of key clinical and survival data (including age, sex, surgical interventions, survival duration, and outcomes) from the SEER database. Patients lacking the abovementioned critical clinical data were excluded. A flowchart detailing the case inclusion and exclusion criteria is illustrated in Figure 1. A total of 2307 elderly patients with LGGs from the SEER database were enrolled in this study. These individuals were randomly divided into training and validation cohorts at a ratio of 2:1 to establish and validate the prognostic nomograms for OS and CSS. This study was reported in line with the Strengthening the Reporting of Cohort Studies in Surgery (STROCSS) criteria (16). This study involving humans was approved by the ethics committee of the West China Hospital, Sichuan University.
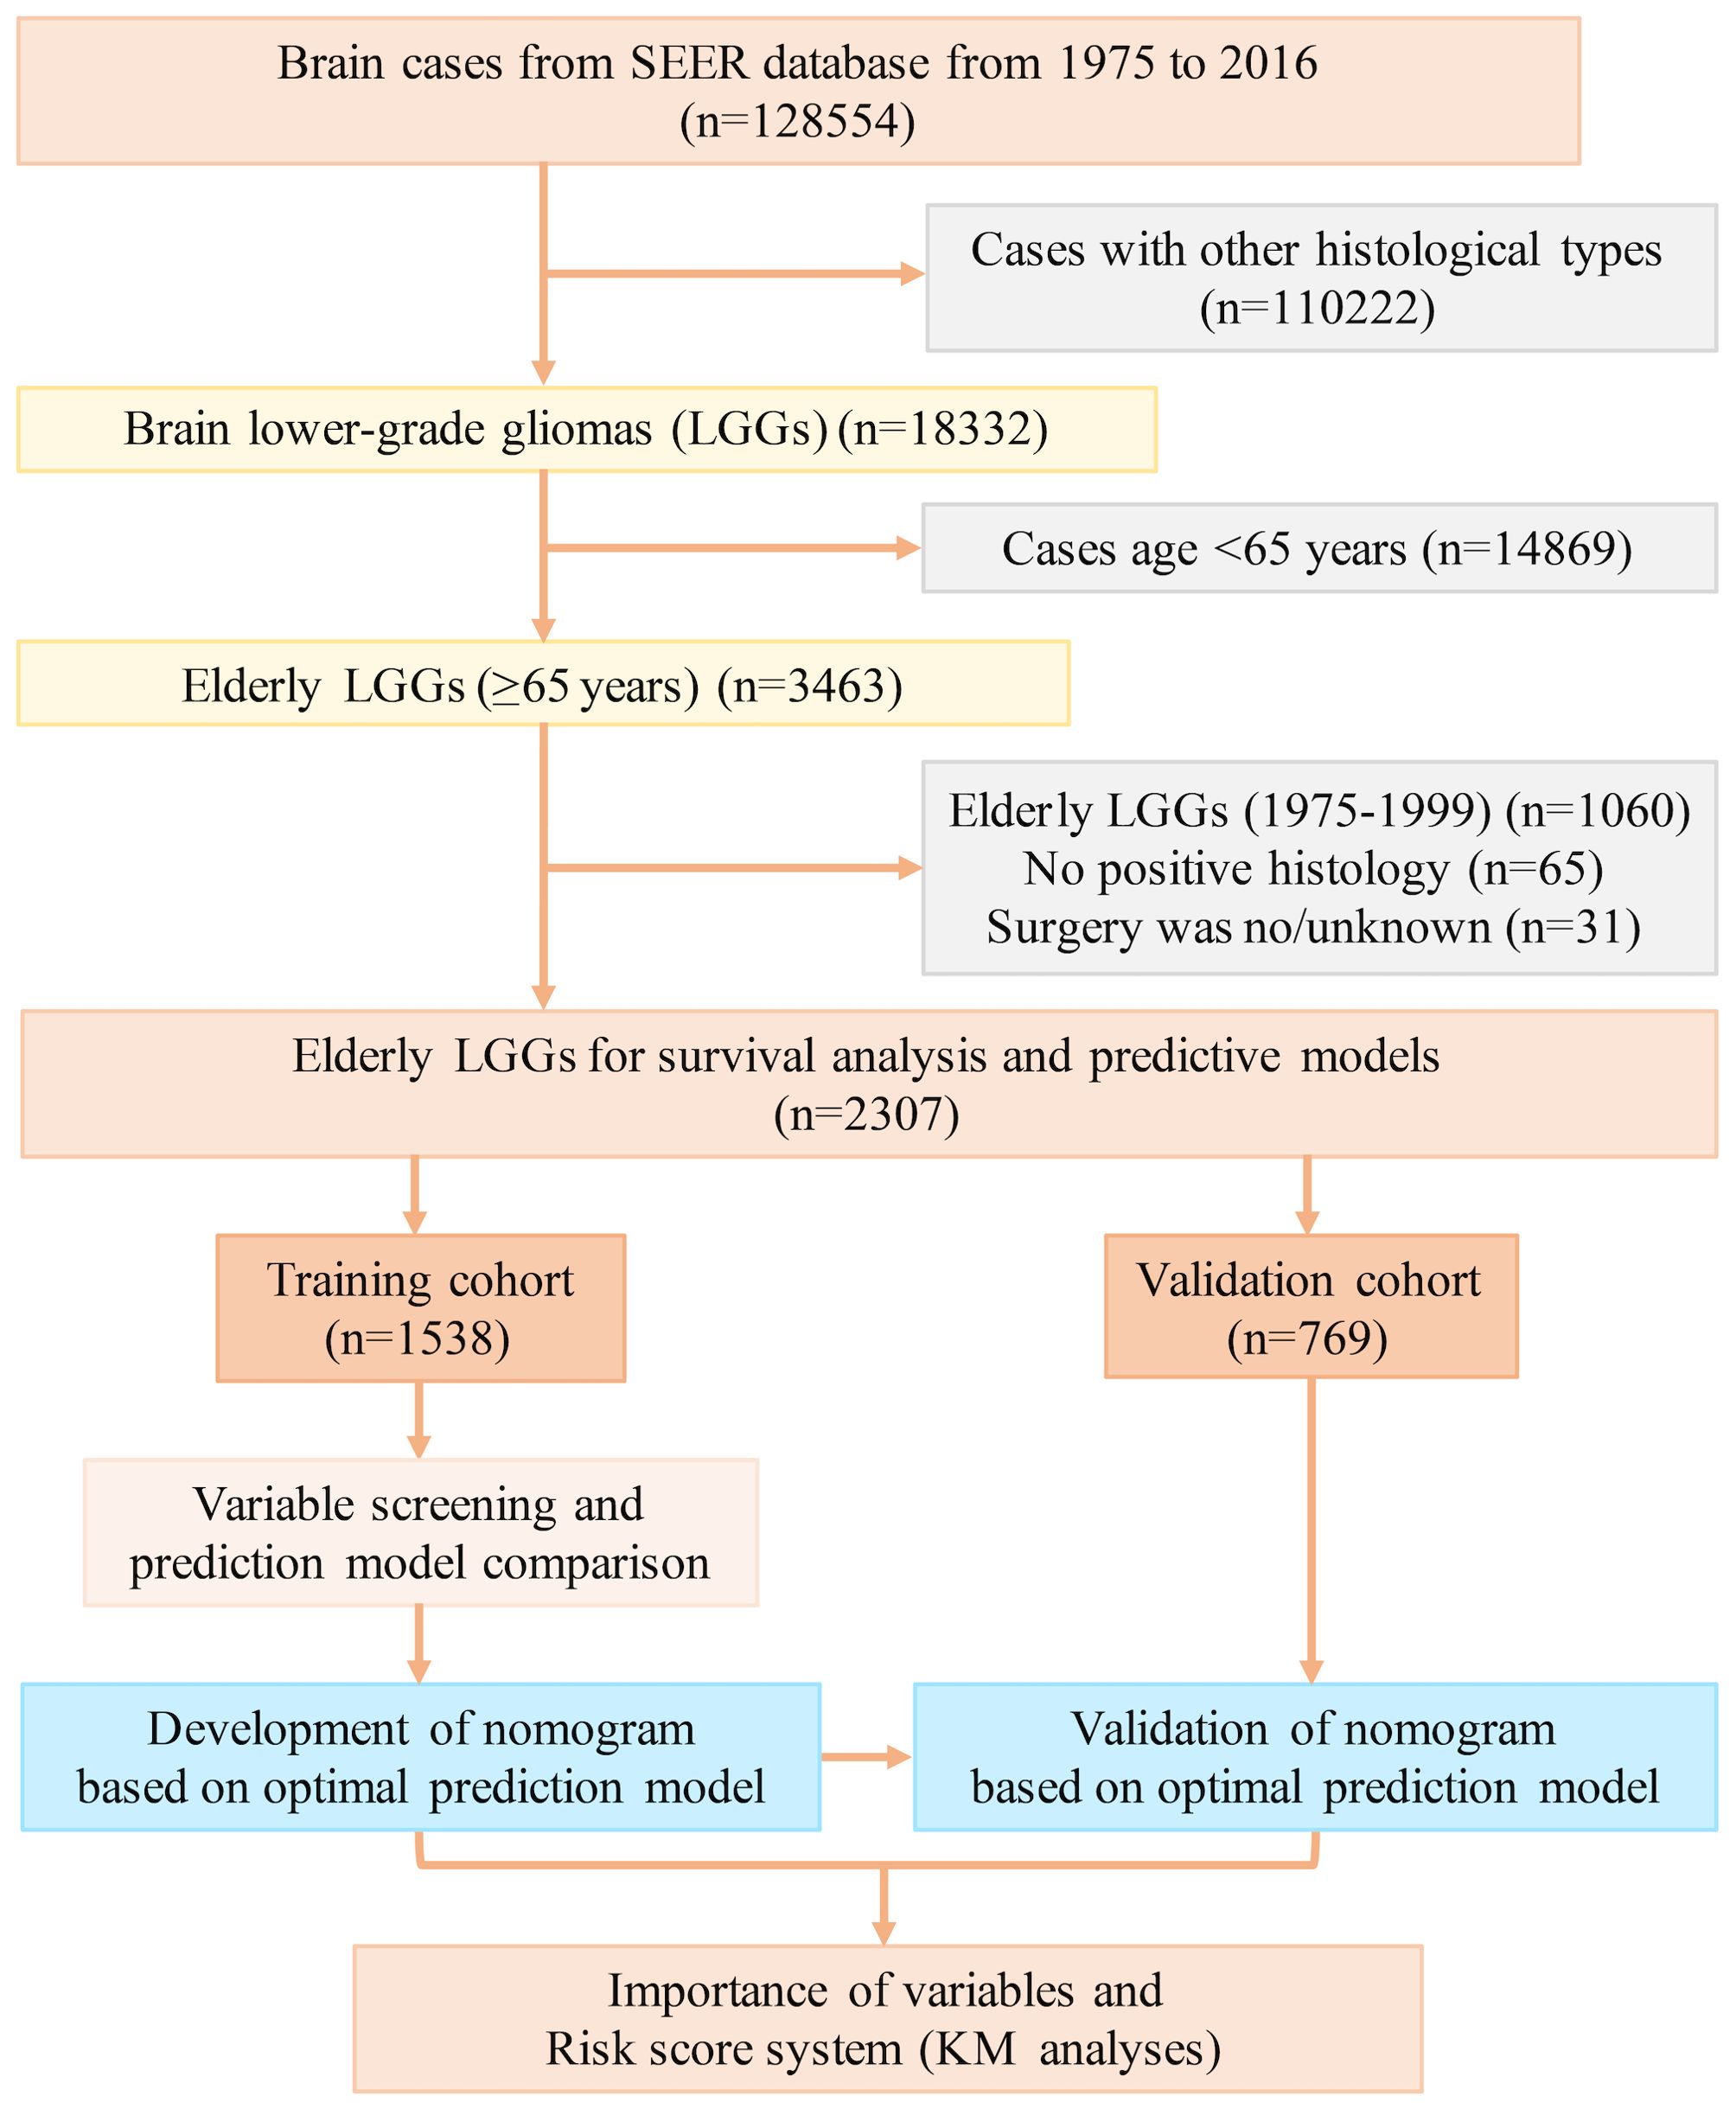
Figure 1. The flow diagram of case inclusion and exclusion. LGG, lower-grade glioma; SEER, Surveillance, Epidemiology, and End Results.
The characteristics of elderly LGG patients were outlined based on key variables of interest, including patient demographics (age, sex, race, insurance coverage, and year of diagnosis), tumor attributes (location, size, stage), treatment modalities (surgery type, radiotherapy, chemotherapy), survival time (months), and vital status for an individual patient. These variables were extracted from the SEER database and further categorized according to the database codes. Race was divided into White, Black, and other groups (comprising American Indian/AK Native, and Asian/Pacific Islander). Age was stratified into three groups: 65-69, 70-79, and ≥80 years. The year of diagnosis was categorized into two intervals: 2000-2009 and 2010-2016. The tumor location was recorded as unilateral or bilateral/midline. The tumor site was specified as the frontal or nonfrontal lobes. Tumor stage was defined as local or invasive/distant involvement. The median tumor size served as the size cutoff. Tumor grade was classified into grade 2 (oligodendroglioma and DA) and grade 3 (AO and AA). The surgical type or extent of resection (EOR) was documented as gross total resection (GTR), subtotal resection (STR), partial resection (PR), or biopsy (refer to the SEER Program Coding and Staging Manual 2024, Appendix C: Surgery Codes). OS was defined as the time interval between the initial diagnosis and mortality from any cause. CSS is defined as the time interval between the initial diagnosis and mortality from cancer-related causes. OS and CSS were defined as the primary endpoints of this study.
Kaplan−Meier (K−M) survival analysis with a log-rank test was employed to evaluate the impact of variables of interest on OS. Univariate and multivariate Cox regression analyses were performed to calculate hazard ratios (HRs) with corresponding 95% confidence intervals (CIs) and to identify independent prognostic factors for OS and CSS in the training cohort. A P value less than 0.05 for these variables was considered to indicate statistical significance.
In this study, a total of 13 variables were included. First, all 13 variables were included in the model (Model 1). Furthermore, univariate Cox regression was used to screen the variables with significant differences in survival, which were then included to determine the independent prognostic factors via multivariate Cox regression and to construct a full Cox model (Model 2). Additionally, LASSO regression is a novel method for variable screening that is based on the Cox model (LASSO-Cox regression) by applying a penalized regression on all variable coefficients (16). Lambda.1se represents the optimal lambda (λ) for screening the variables and was used to construct the LASSO model (Model 3). The above three predictive models in the training cohort were evaluated via Harrell’s concordance index (C-index) and area under the curve (AUC) values of receiver operating characteristic (ROC) curves. The optimal predictive model was further used to construct a prognostic nomogram for visualization.
Variables included in the optimal predictive model were incorporated to construct prognostic nomograms for predicting 1-year, 2-year, and 5-year OS and CSS in elderly patients with LGGs. Next, we validated the nomogram’s predictive ability and clinical utility with internal and external validation consisting of 1000 bootstrap resamples of the models. Discrimination and reliability were assessed by computing the C-index and AUC values. Higher C-index and AUC values indicated superior discrimination ability (range: 0.5-1.0). Calibration plots were generated to verify the consistency between the predicted and observed values. Decision curve analysis (DCA) curves were generated to assess the clinical utility of the prognostic nomograms. Additionally, the importance of variables in the prognostic nomogram model was evaluated via the random forest model and machine learning. Finally, a risk stratification system based on the nomograms and a web-based dynamic nomogram was constructed.
Continuous variables are presented as the mean ± standard deviation, and comparisons were made using t-tests and chi-squared tests for continuous and categorical variables, respectively. K−M curves with log-rank tests were utilized to assess the influence of variables on OS. Cox regression and LASSO regression analyses were conducted to determine the independent prognostic factors for OS and CSS. Lambda.1se represented the optimal lambda (λ) for screening the variables. The median total score of the nomogram was defined as the cutoff value of the risk score. The importance of variables and prognostic nomograms were performed using R software packages, including “survival”, “rms”, “regplot”, “survivalROC”, “ggDCA”, “glmnet”, “randomForest”, “xgboost”, “shapviz”, “nomogramFormula”, and “DynNom”. A two-sided P value <0.05 was considered to indicate statistical significance. Statistical analyses were performed using R (version 4.2.2) software.
A total of 2307 elderly patients with LGGs were enrolled in this study. Among these patients, 1220 were male (52.9%) and 1087 were female (47.1%). The median age was 72 years, with a mean age of 73.30 ± 6.22 years. The age distribution consisted of 789 (34.2%) patients aged 65-69 years, 1094 (47.4%) aged 70-79 years, and 424 (18.4%) aged ≥80 years. The majority of patients were White (2097, 90.4%), followed by Black (104, 4.7%) and other racial groups (106, 4.9%). The most prevalent tumor site was the frontal lobe (679, 29.4%). Patients were categorized based on tumor size: <38 mm (724, 31.4%) and ≥38 mm (735, 31.9%) subgroups. The majority of patients exhibited local tumor involvement (2208, 95.7%), with a small fraction showing invasive/distant tumor extension (25 patients, 1.1%). According to the World Health Organization (WHO) grade, 520 (22.5%) patients had Grade 2 gliomas, while 1787 (77.5%) had Grade 3 gliomas. The surgical resection types included GTR/STR (394, 17.1%), PR/biopsy (867, 37.5%), and no surgery (1046, 45.4%). Radiotherapy was administered to 803 (34.8%) patients, and chemotherapy was administered to 989 (42.9%) patients. Adjuvant therapy was stratified into the following subgroups: chemoradiotherapy (534, 23.2%), radiotherapy only (269, 11.6%), chemotherapy only (455, 19.7%), and no adjuvant therapy (1049, 45.5%). All enrolled patients were randomly divided into a training cohort (n=1538, 66.7%) and a validation cohort (n=769, 33.3%) for the development and validation of prognostic nomograms, with no significant intergroup differences observed (P>0.05). Table 1 presents the population characteristics and clinical features of both cohorts.
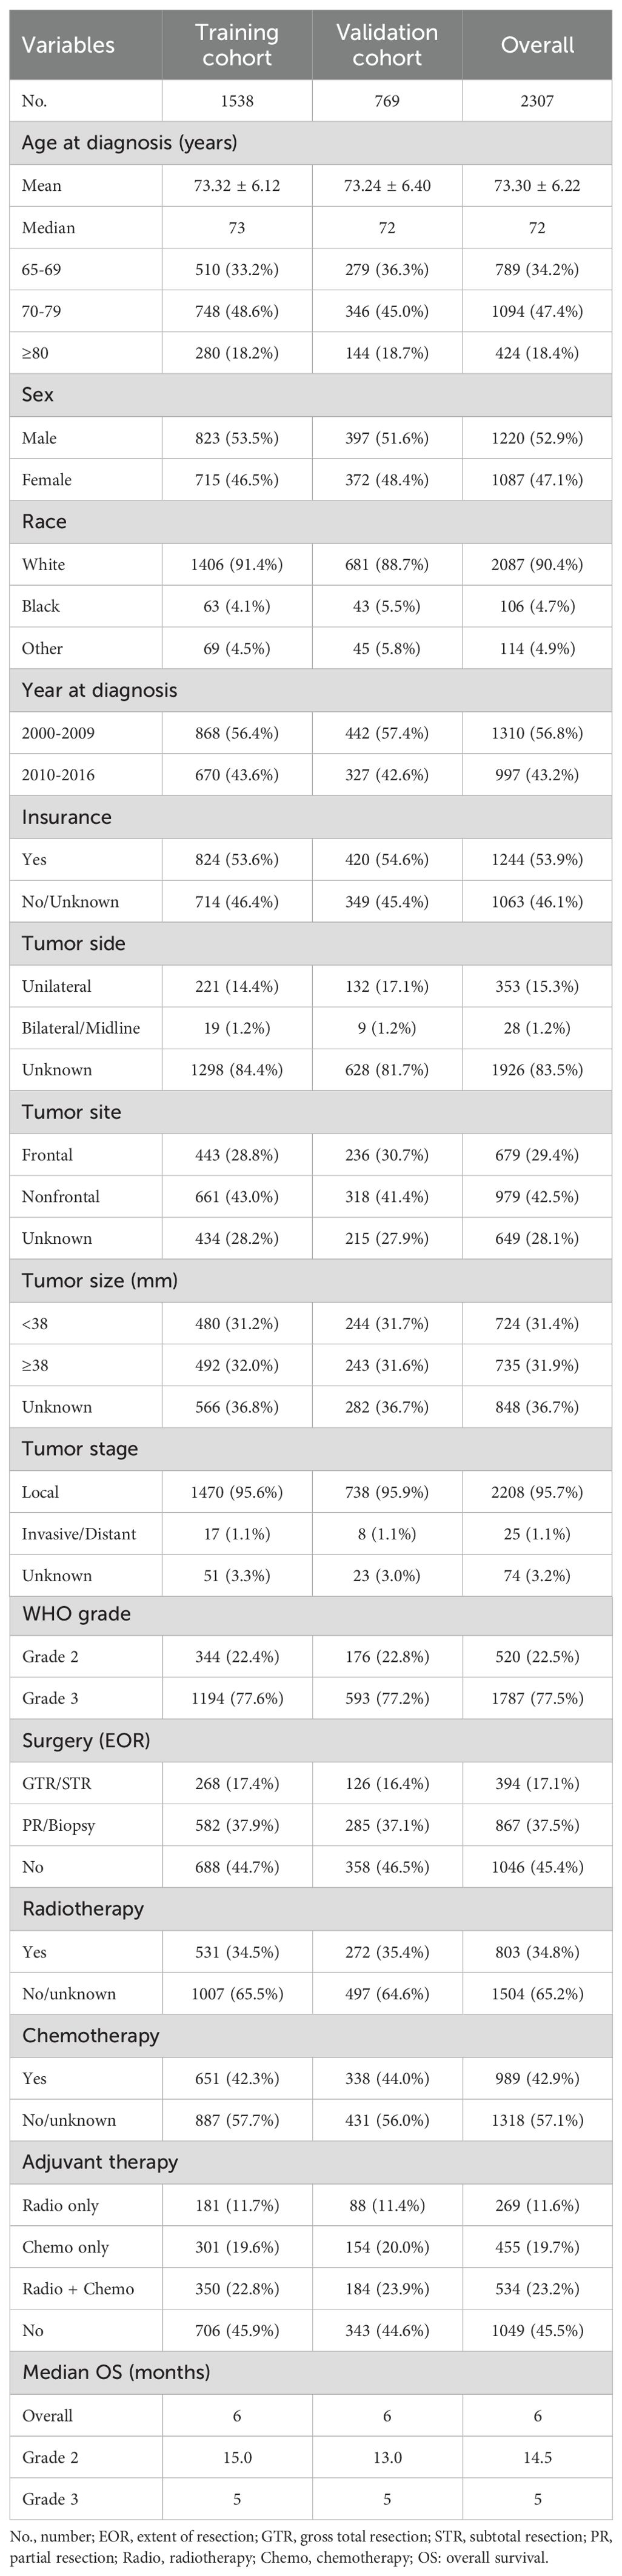
Table 1. Summary of clinicopathologic features and treatments of elderly patients with LGGs.
All elderly patients with LGGs had a median OS of 6.0 months and a mean OS of 16.2 months. When stratified by WHO grade, patients with Grade 2 gliomas (22.5%) had longer OS than did those with Grade 3 gliomas (77.5%), with median OS of 14.5 months and 5 months, respectively (Table 1). K−M analysis was used to determine the impact of variables on OS in the training cohort. Variables such as younger age, grade 2 tumors, maximal resection (GTR/STR), and adjuvant therapy (radiotherapy and chemotherapy) were associated with better survival outcomes (Figure 2). According to subgroup analyses based on WHO grade, different treatment modalities had varying impacts on OS. Notably, Grade 2 patients who underwent maximal resection without adjuvant chemoradiotherapy had the most favorable survival outcomes (Supplementary Figure 1), whereas Grade 3 patients benefitted more from surgical resection combined with adjuvant therapy (Supplementary Figure 2).
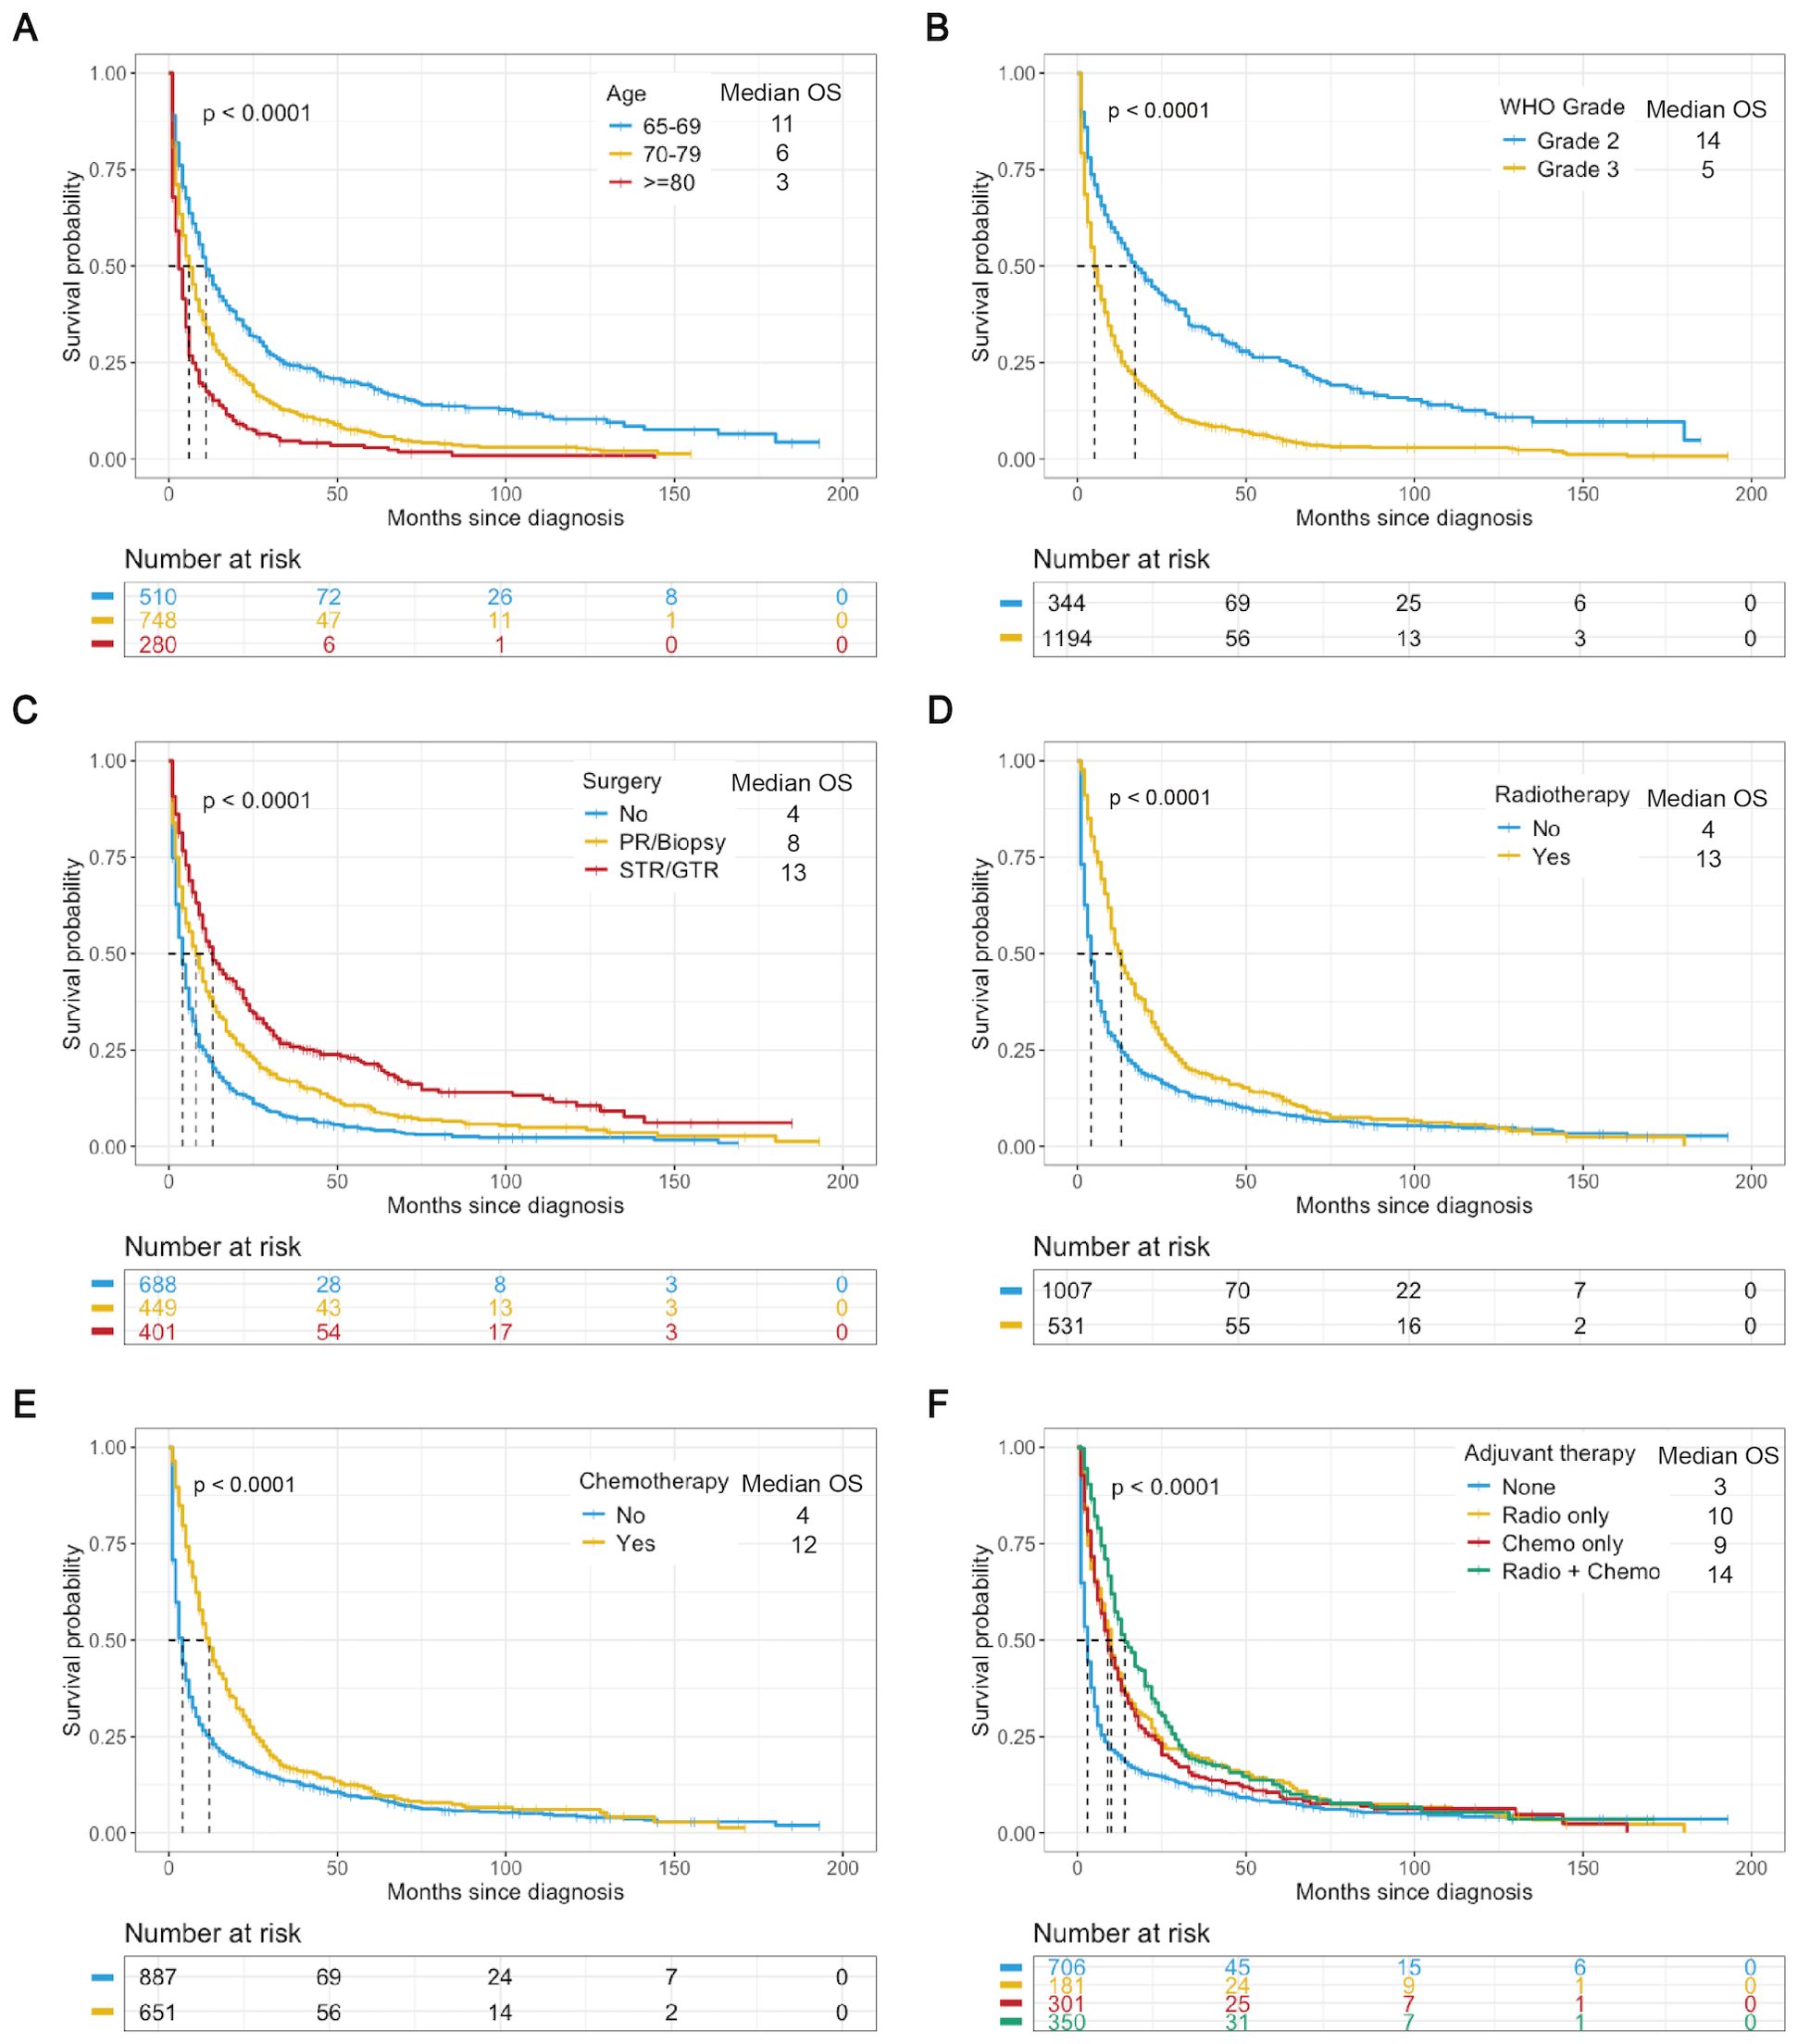
Figure 2. K−M analysis determining the impact of variables on OS (months) in the training cohort. Stratified by age (A), WHO grade (B), surgery (C), radiotherapy (D), chemotherapy (E), and adjuvant therapy (F). Chemo, chemotherapy; Radio, radiotherapy.
Univariate and multivariate Cox regression analyses identified 4 variables (age, WHO grade, surgery, and chemotherapy) as independent prognostic factors for OS and CSS (Supplementary Table 1). In addition, we used LASSO-Cox regression to screen for variables significantly associated with OS and CSS. The curves of the regression coefficient versus log (λ) and the partial likelihood deviation versus log (λ) were used to screen 5 independent prognostic factors associated with OS and CSS (age, WHO grade, surgery, radiotherapy, and chemotherapy) when lambda.1se represented the optimal lambda (Figure 3). Multivariate Cox regression analyses showed that these five variables (P<0.05) were independent prognostic factors for OS and CSS. On the basis of the above, we constructed three predictive models (Models 1, 2, and 3) according to the number of variables based on the different screening methods. Three predictive models were compared by using the C-index (Table 2) and AUC values (Table 3). The results showed that Model 3 (LASSO model, five variables) had higher C-index and AUC values than Model 2 (four variables) and had the same predictive power as Model 1 (all variables). Thus, we decided that the five variables (age, WHO grade, surgery, radiotherapy, and chemotherapy) in Model 3 (the optimal predictive model) were further utilized to construct the prognostic nomogram.
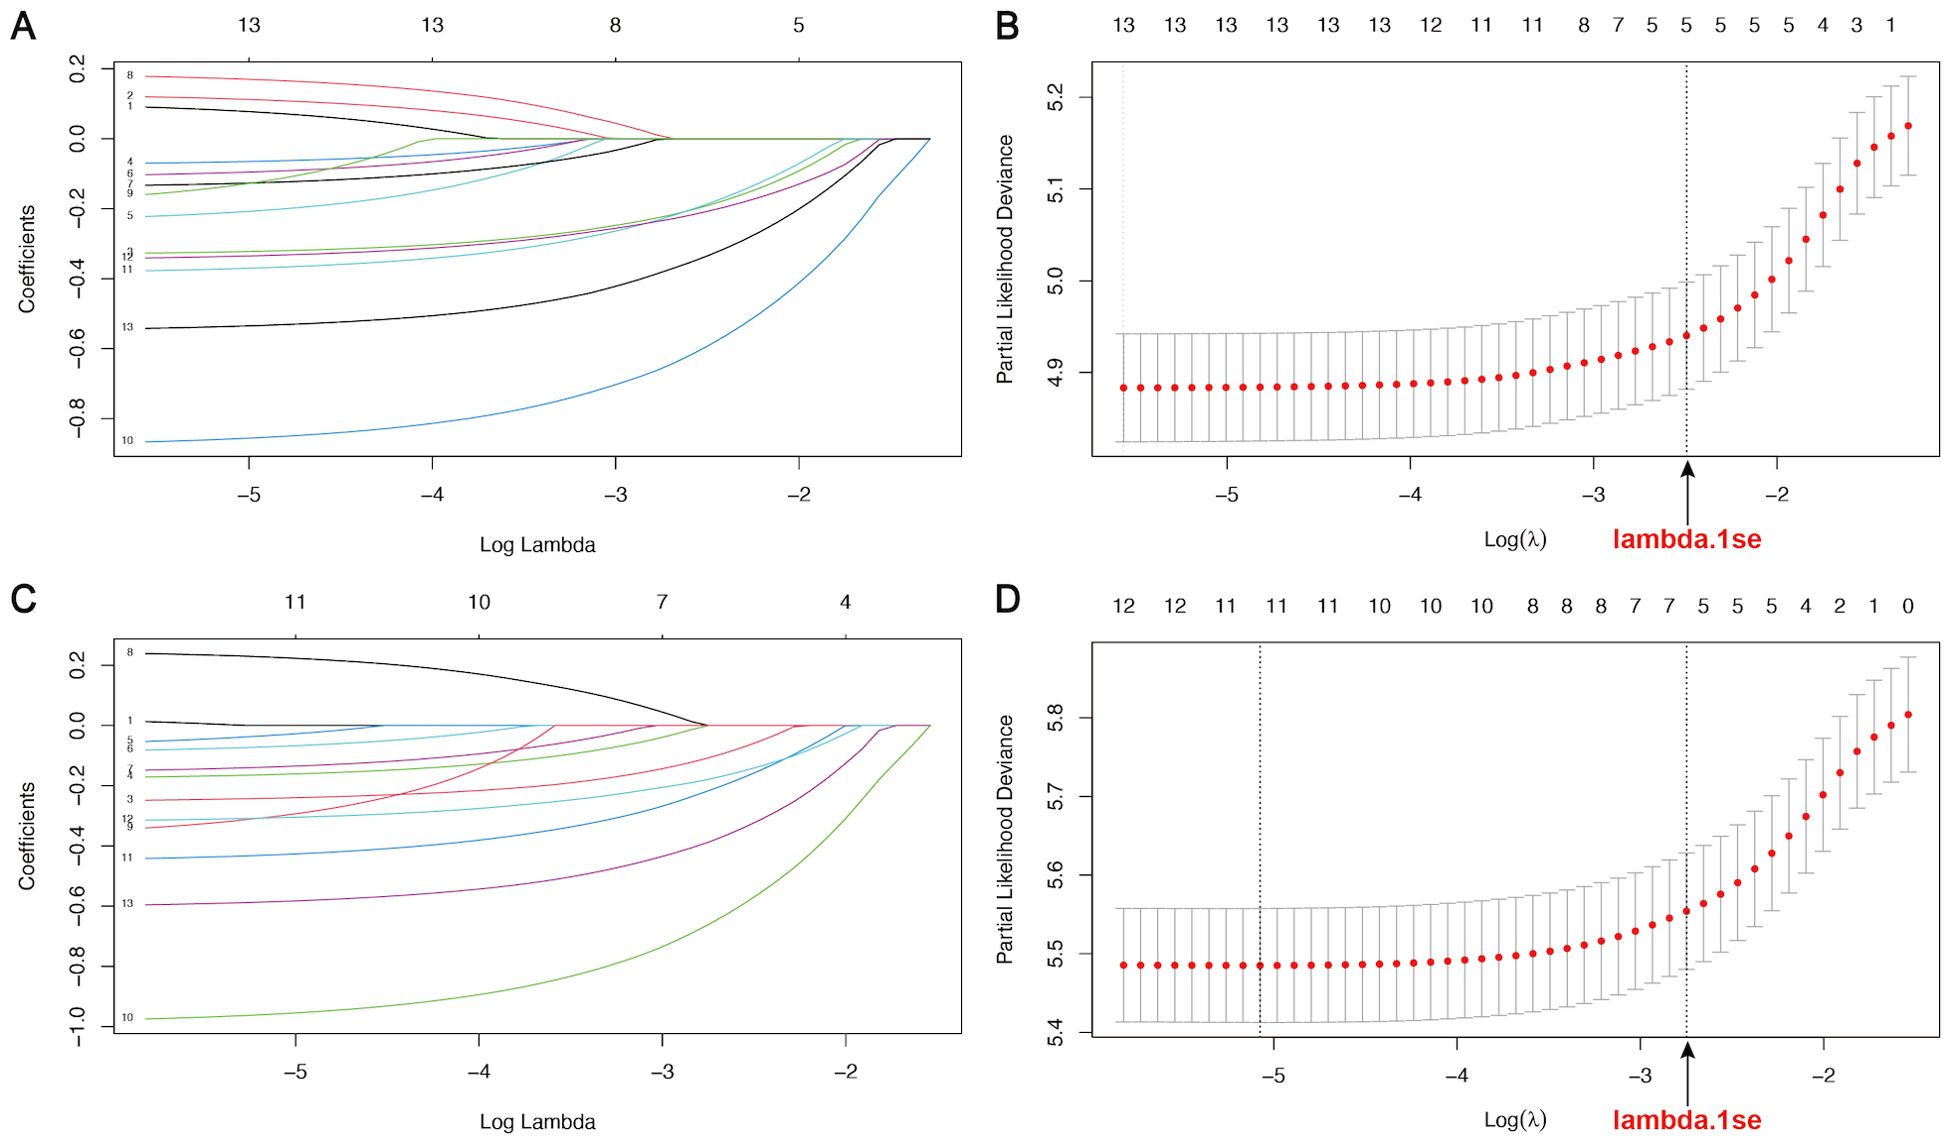
Figure 3. LASSO regression curves of variables in the training cohort. (A, B) The curve of the regression coefficient versus log (λ) and the partial likelihood deviation versus log (λ) for OS. (C, D) The curve of the regression coefficient versus log (λ) and the partial likelihood deviation versus log (λ) for CSS. Lambda.1se represents the optimal lambda (λ) for screening the variables.
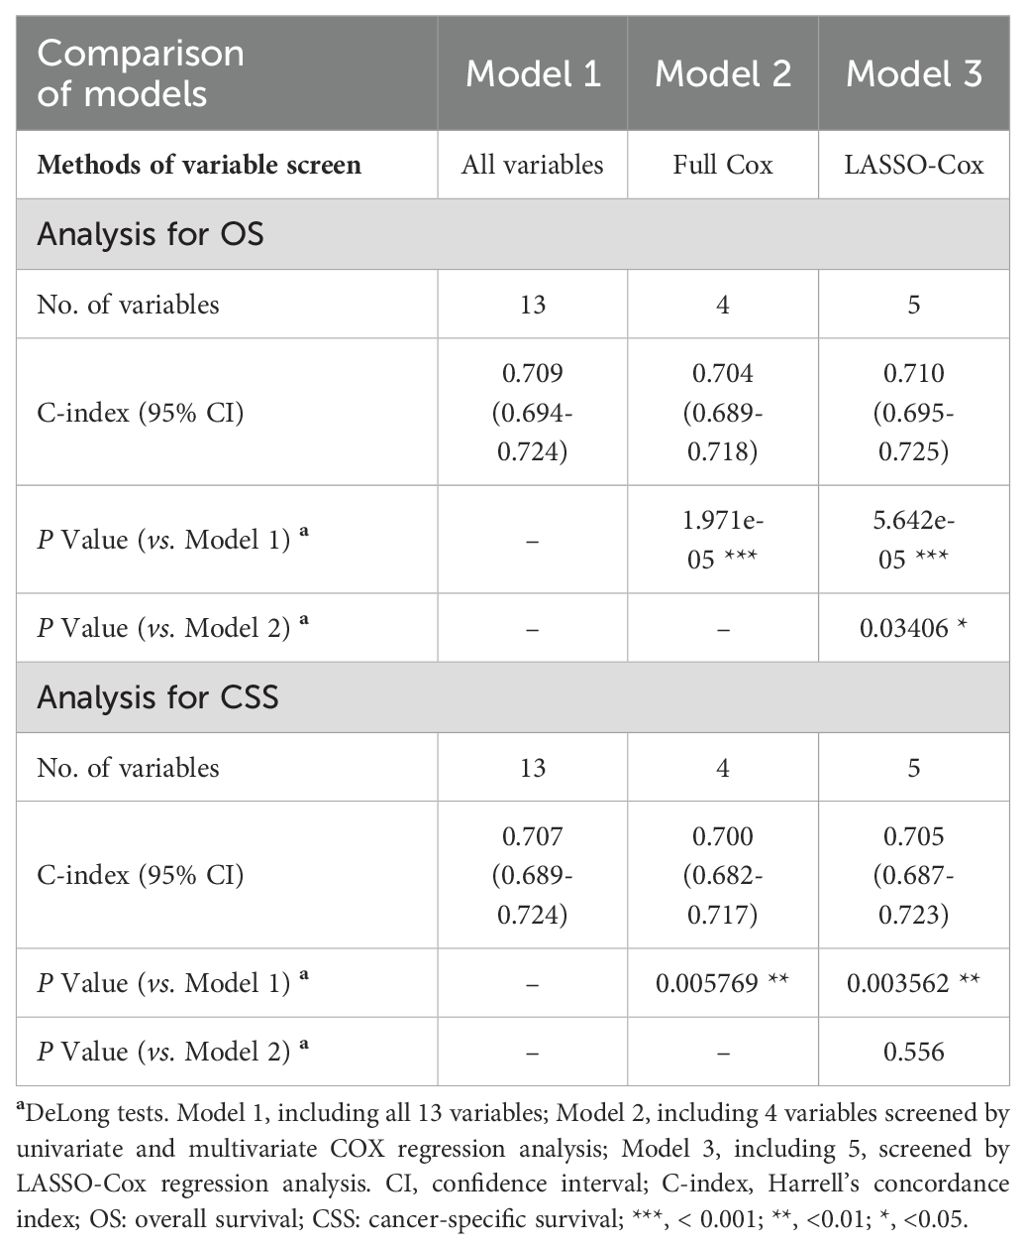
Table 2. The comparison of C-index of different models in the training cohort.
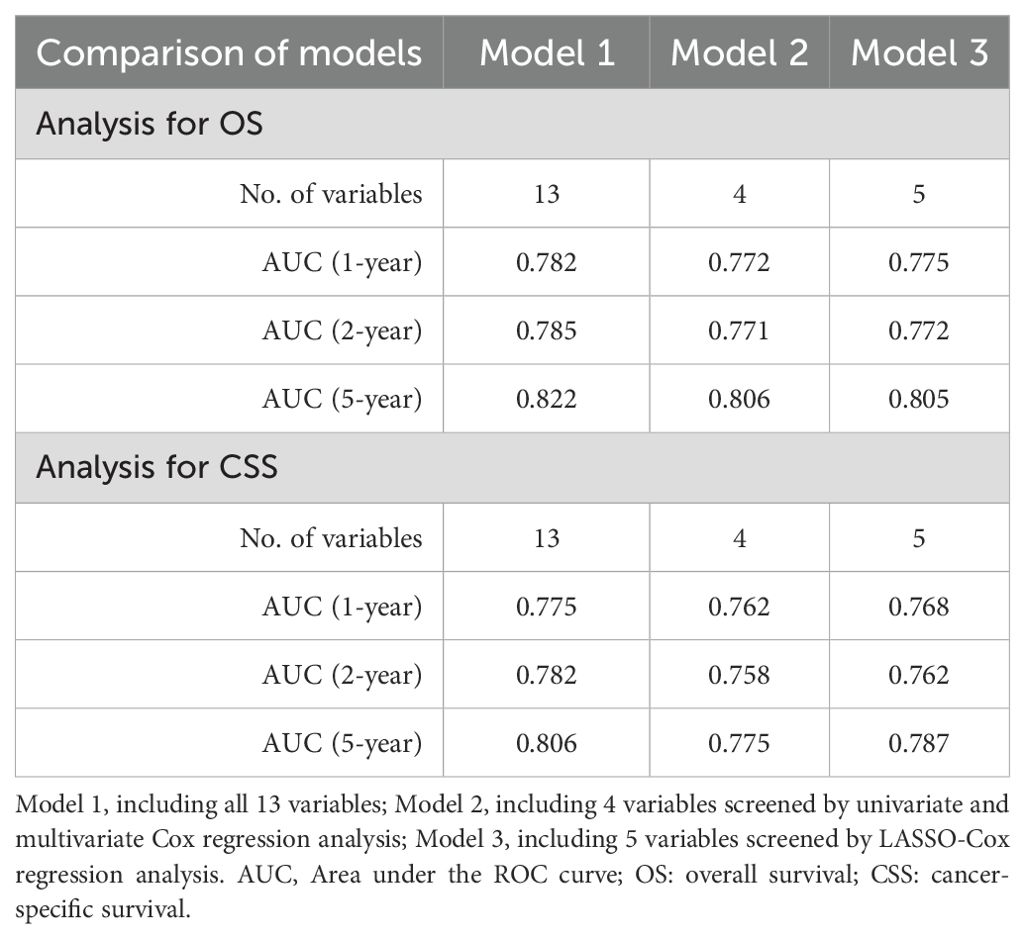
Table 3. The comparison of AUC values of three models in the training cohort.
The importance of five key variables derived from the Model 3 (the LASSO model) was further evaluated using the random forest model and machine learning (Figure 4). The mean square error (%IncMSE) and node purity (IncNodePurity) values were calculated to assess the model based on random forest (Figure 4A). Higher %IncMSE values reflected notable enhancements, and IncNodePurity quantified the improvement in node purity with the introduction of a feature, highlighting the critical importance of WHO grade and age in enhancing the model’s predictive accuracy. Moreover, a machine learning approach was utilized to interpret the impact of variables on the model’s predictive accuracy. The mean Shapley additive explanations (SHAP) scores of five key variables highlighted their significant contributions to predictive effectiveness (Figures 4B, C). According to the above importance analysis of the variables, age is still a very important variable affecting survival and the predictive power of the nomogram, although the variable was screened from the elderly population.
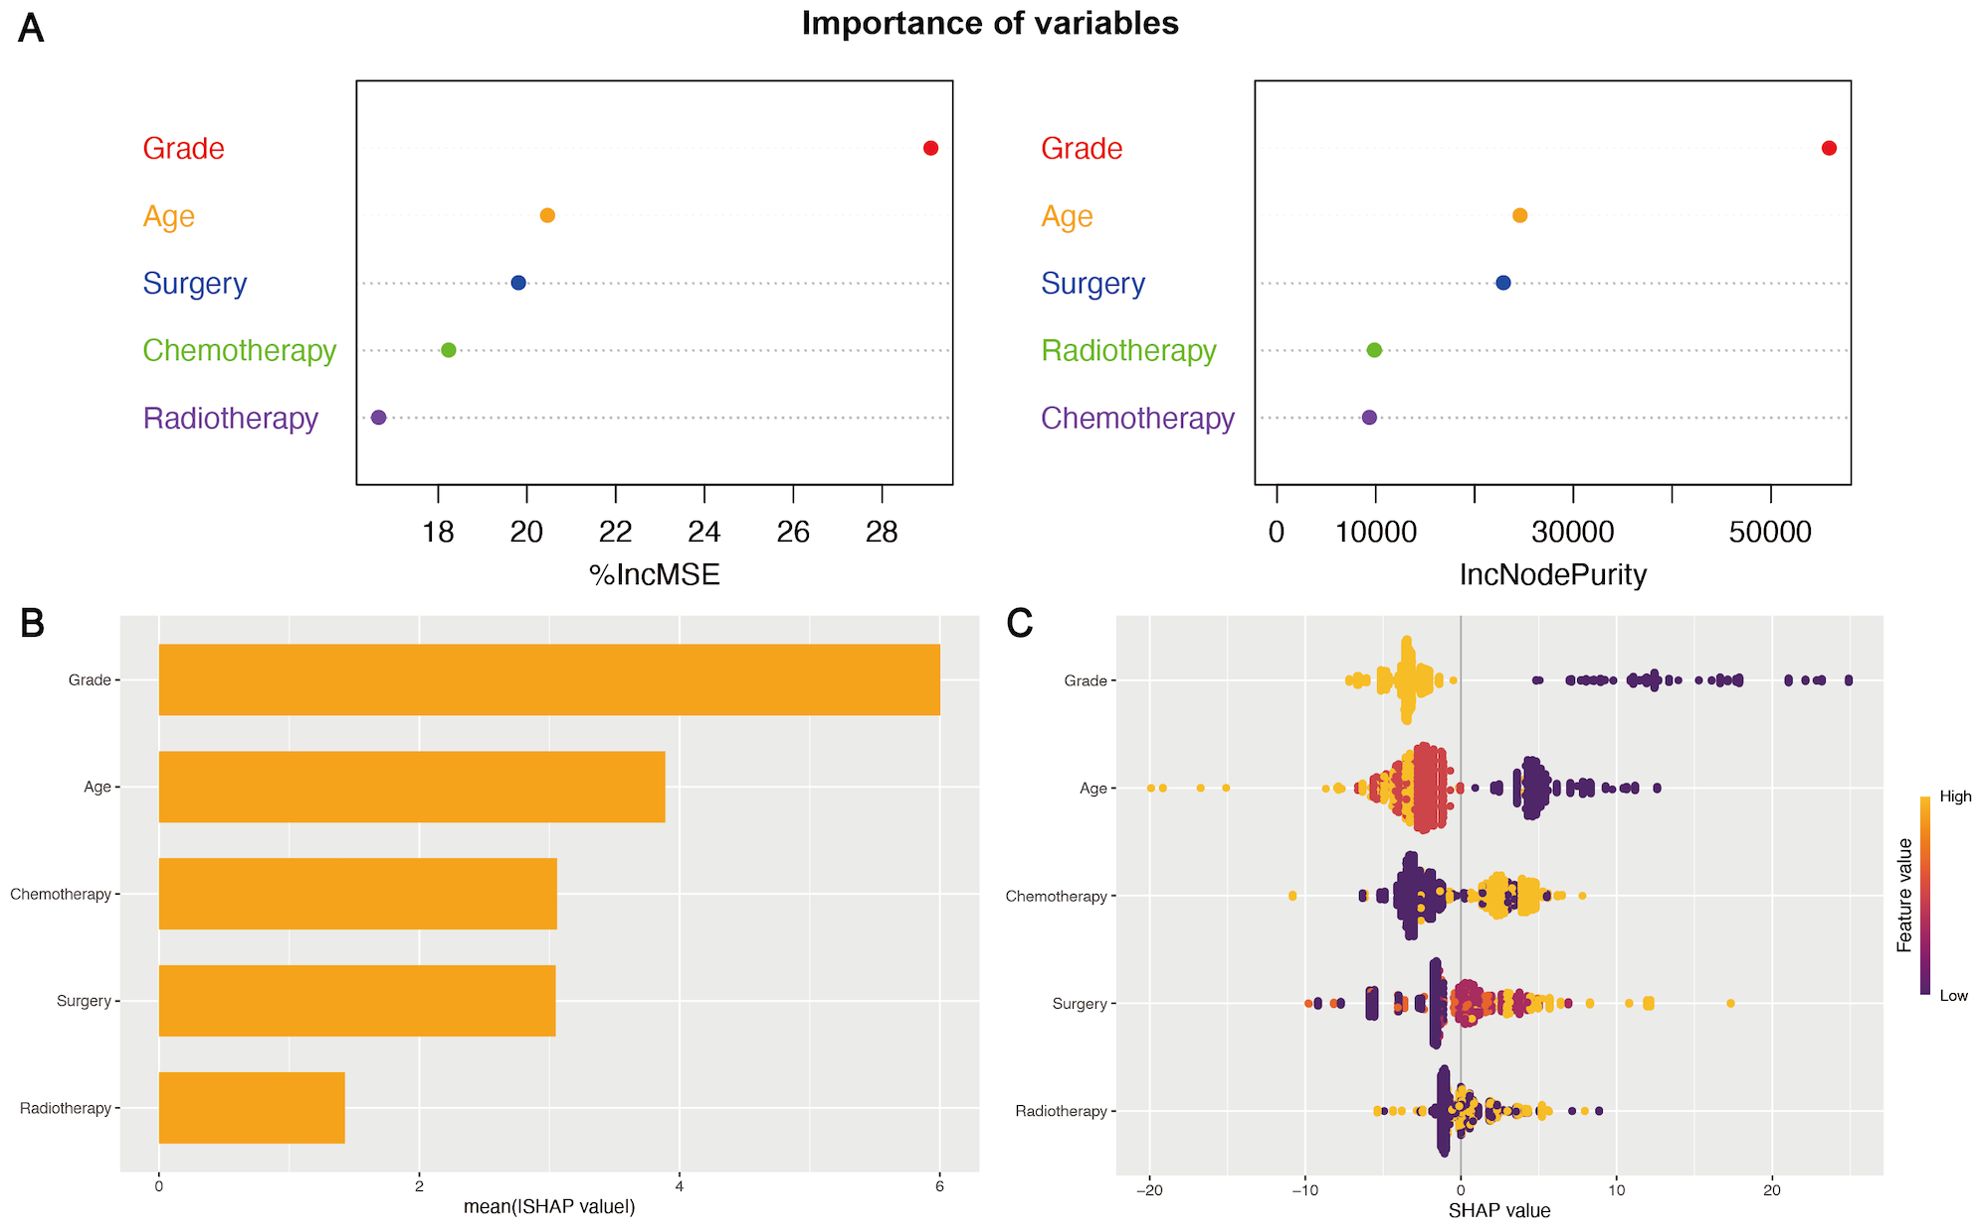
Figure 4. The importance of variables in the prognostic nomogram. (A) The IncMSE (left) and IncNodePurity (right) based on the random forest model emphasized the notable influence of variables on the model’s predictive accuracy. (B, C) SHAP summary plots of variables in the nomogram. The ranking of variables’ importance according to the mean SHAP value in machine learning (B). A wider spread of points in the beeswarm plot indicated a stronger influence of the variables in the model (C).
The five independent prognostic predictors (age, WHO grade, surgery, radiotherapy, and chemotherapy) were pooled to construct prognostic nomograms that can quantitatively predict the 1-year, 2-year, and 5-year OS (Figure 5) and CSS (Supplementary Figure 3). Internal and external validation of these prognostic nomograms was conducted to assess their discrimination ability and reliability in the training and validation cohorts. The C-indexes for the nomogram for OS were 0.708 (95% CI, 0.693-0.723) and 0.694 (95% CI, 0.674-0.714) for internal and external validation, respectively. Similarly, the C-index values for the nomogram for CSS were 0.704 (95% CI, 0.687-0.721) and 0.680 (95% CI, 0.660-0.700) for internal and external validation, respectively. These C-index and AUC values indicated the relatively good predictive ability and applicability of the nomograms (Table 4). Additionally, the ROC curves and calibration plots for 1-, 2-, and 5-year OS demonstrated good predictive performance and consistency across both the training and validation cohorts. Furthermore, DCA curves revealed that the prognostic nomograms for OS and CSS offered a greater net benefit than did the WHO grade (Figure 6; Supplementary Figure 4).
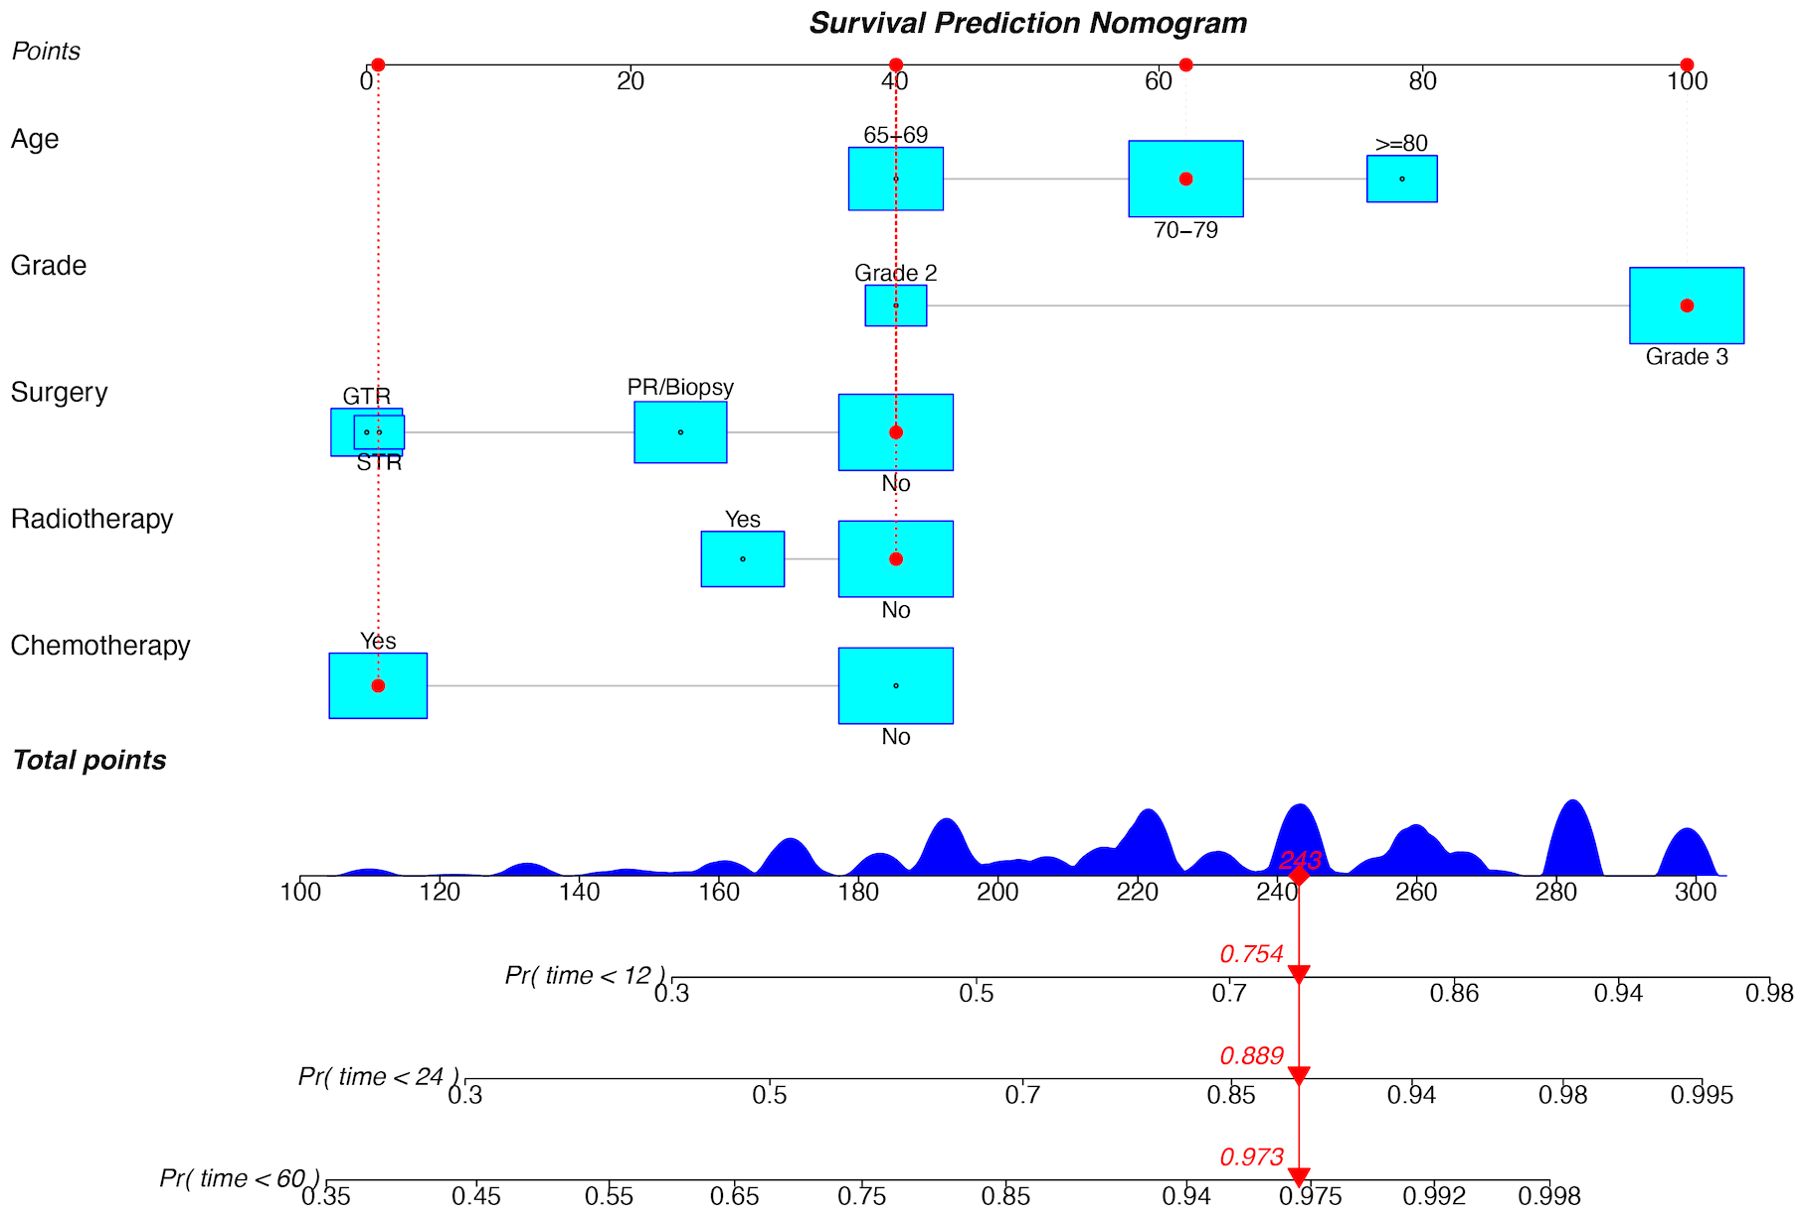
Figure 5. Prognostic nomogram for OS in the training cohort. GTR, gross total resection; STR, subtotal resection; PR, partial resection; Pr, probability.
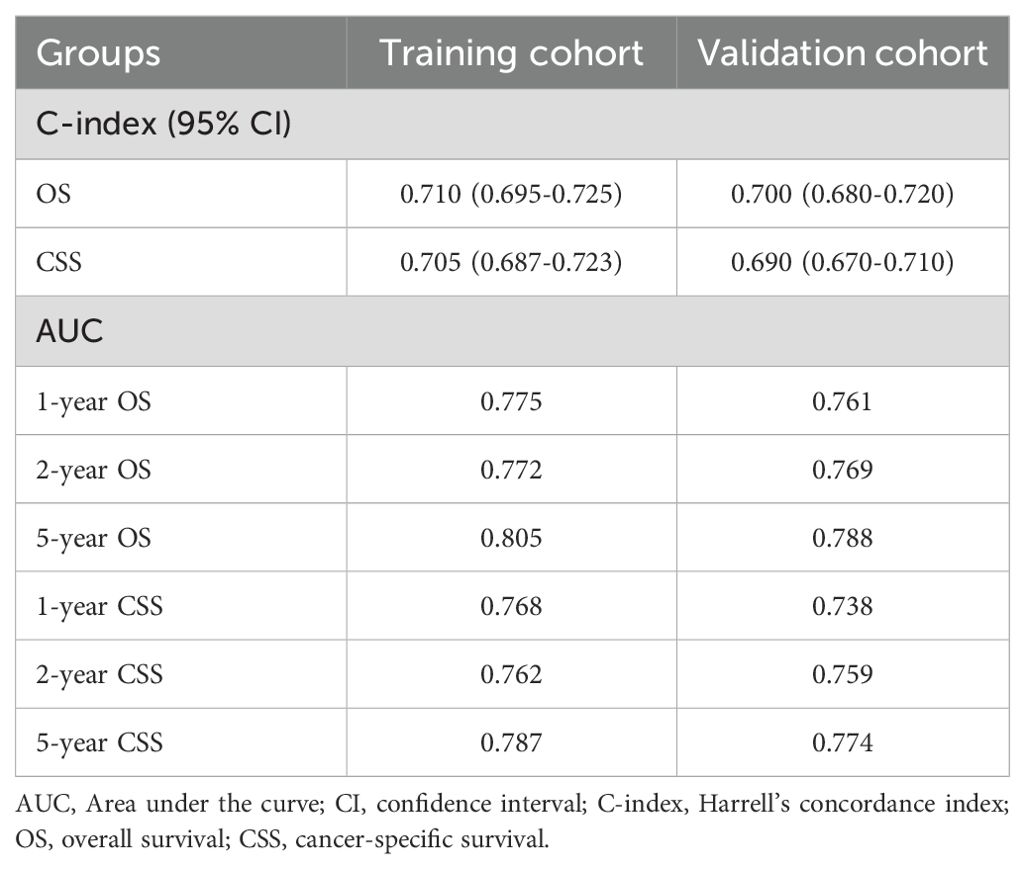
Table 4. The C-index and AUC values of the prognostic nomograms for OS and CSS in the training and validation cohorts.
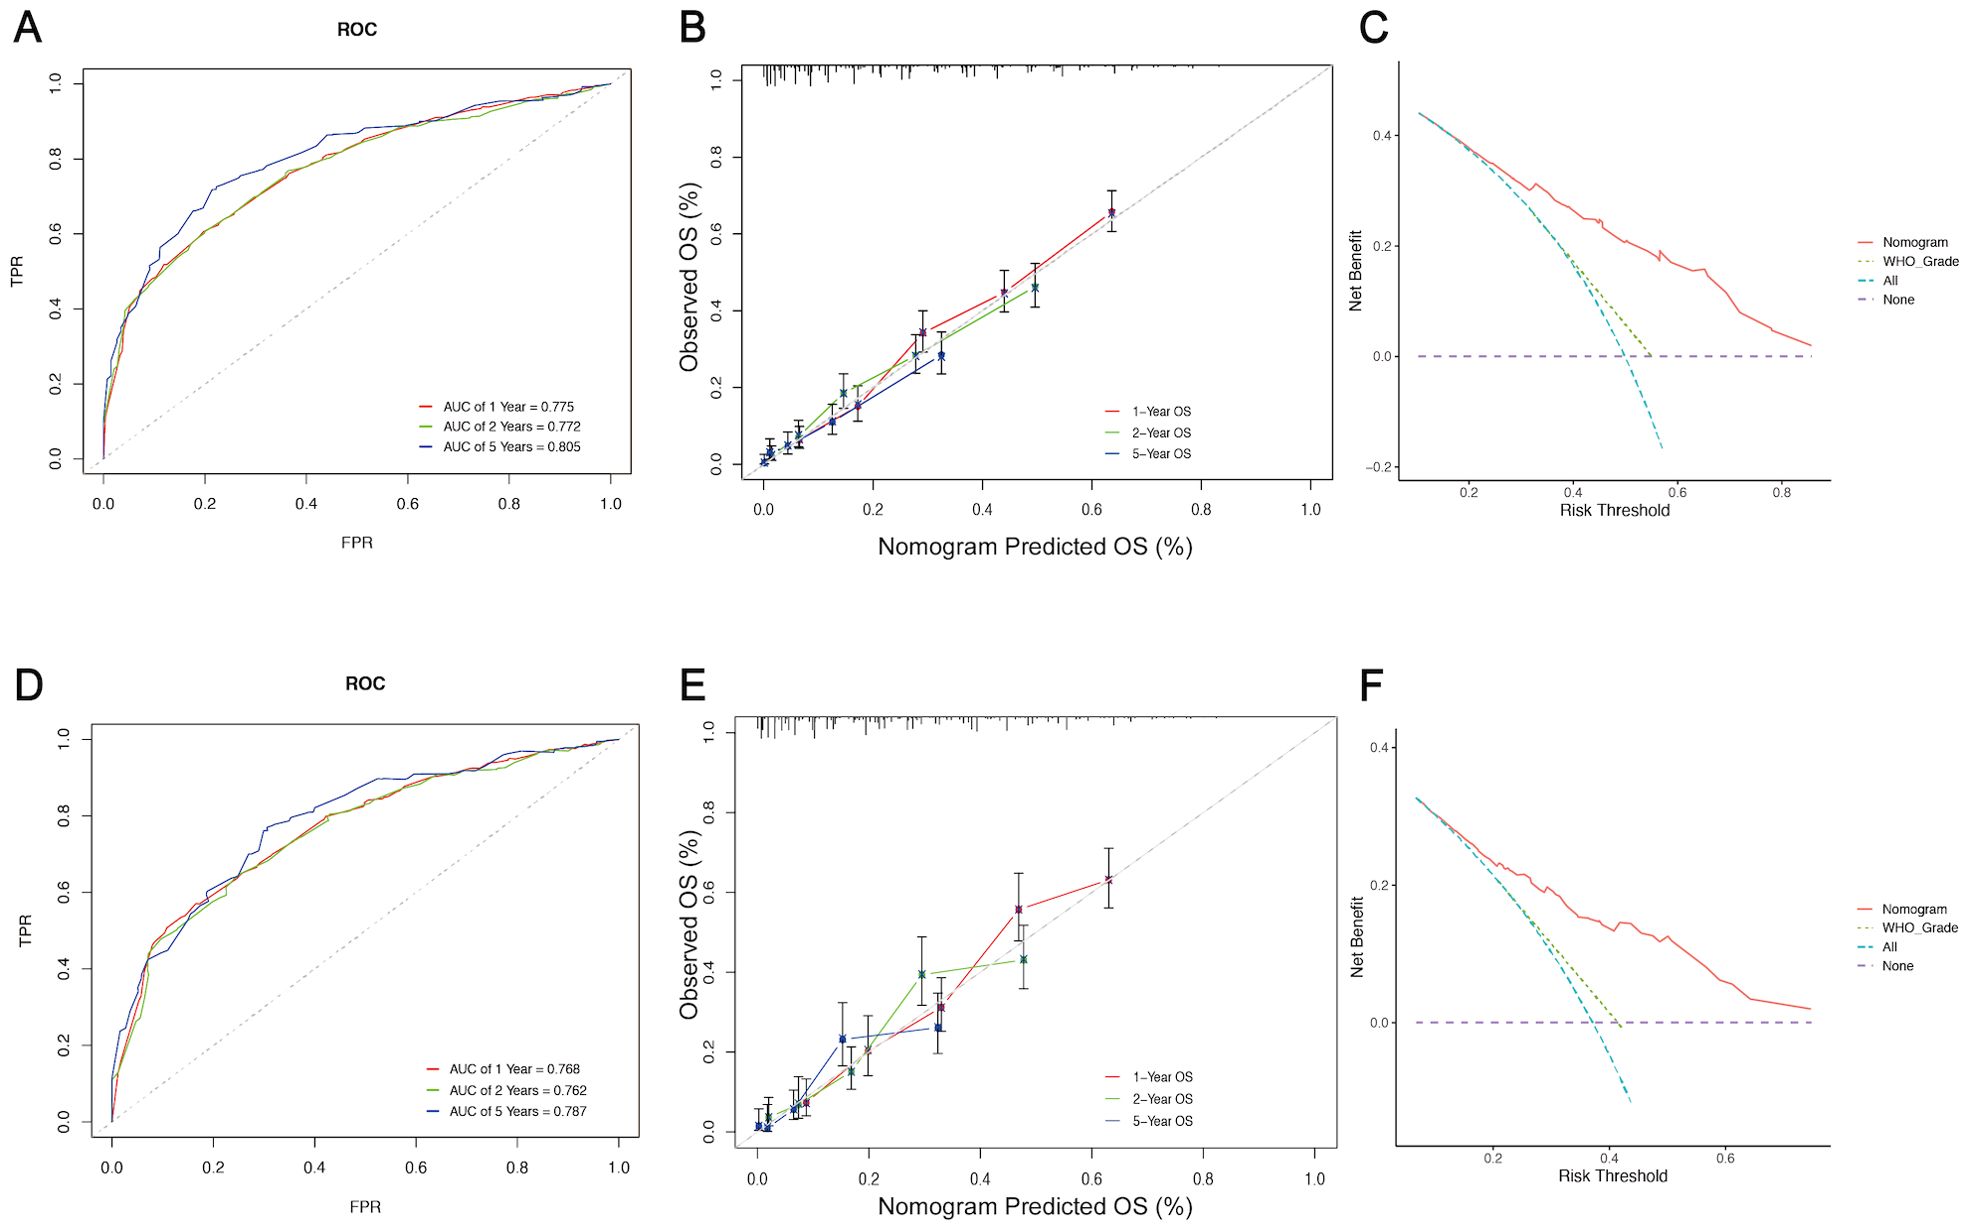
Figure 6. Assessment and validation of the prognostic nomogram for OS. ROC curves (A), calibration curves (B), and DCA curves (C) of the nomogram in the training cohort. ROC curves (D), calibration curves (E), and DCA curves (F) of the nomogram in the validation cohort. ROC curve, Receiver operating characteristic curve; DCA, Decision Curve Analysis; FPR, False positive rate; TPR, True positive rate.
Elderly patients with LGGs were categorized into two subgroups of mortality risk according to the median total score of the nomogram: the low-risk subgroup and the high-risk subgroup. Furthermore, the K−M survival curves revealed a significant difference in survival between these two groups in the training and validation cohorts, suggesting that the prognostic nomograms had significant clinical value for OS and CSS prediction (Figure 7). Additionally, a web-based dynamic nomogram was constructed to facilitate the clinical application of the predictive model. By inputting the corresponding information of the independent prognostic factors, the survival probability of elderly patients with LGGs could be quickly predicted. This dynamic nomogram is available on the following website: https://allenscu.shinyapps.io/olderLGG/. Moreover, we present an example of an application for calculating the OS survival probability according to different parameters of various variables (Figure 8).
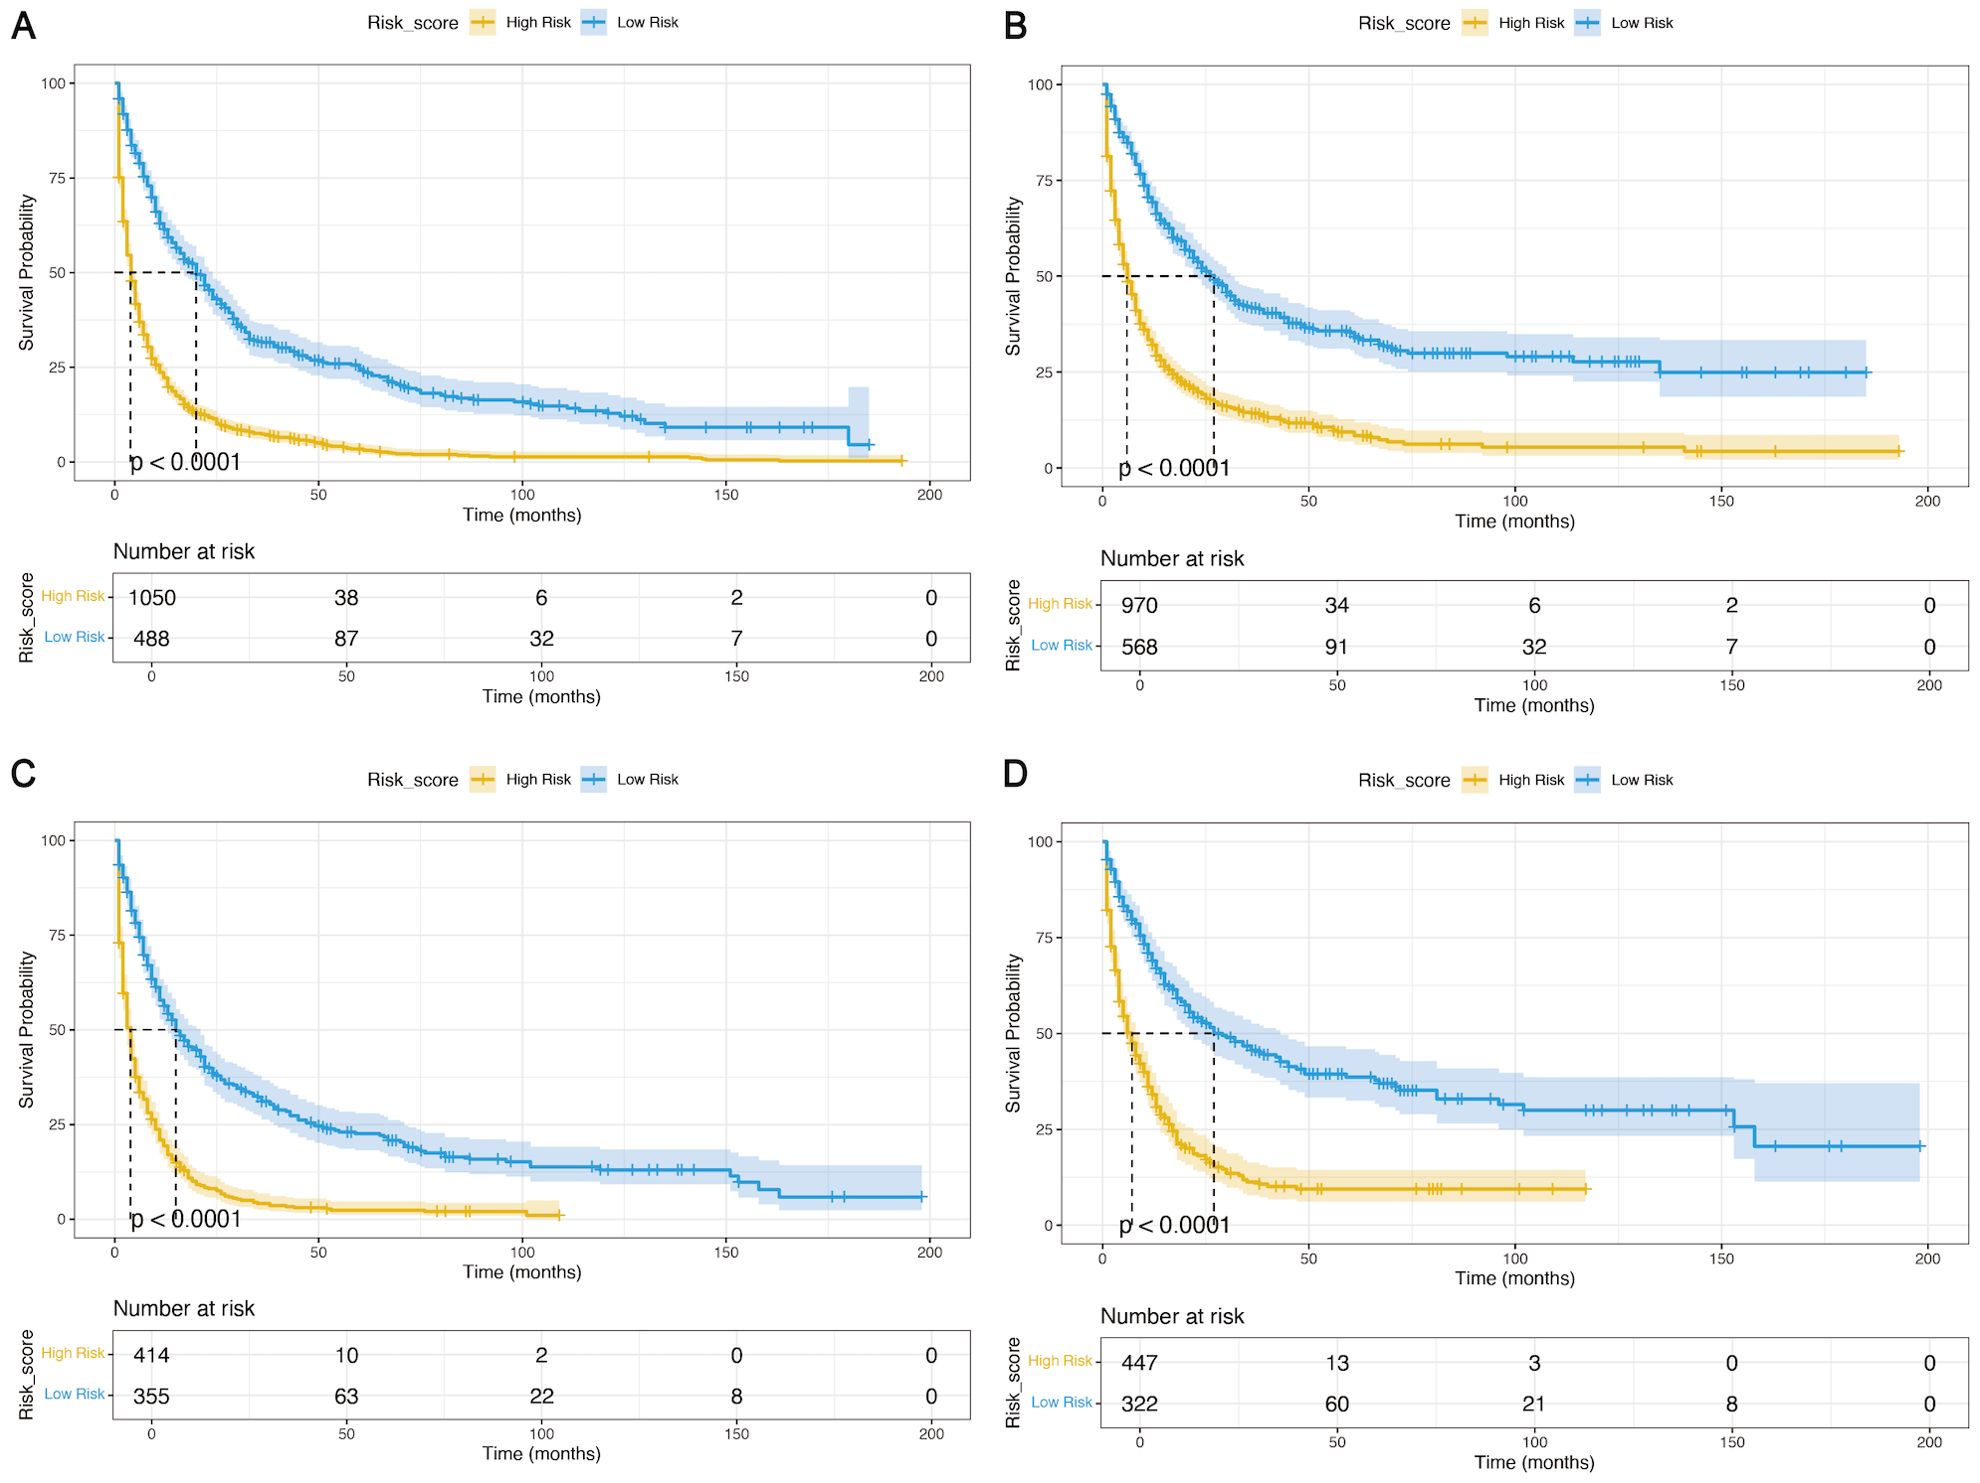
Figure 7. K−M analyses were used to determine the impact of the risk stratification system based on the prognostic nomograms on OS and CSS. (A, B) Based on the nomograms on OS (A) and CSS (B) in the training cohort. (C, D) Based on the nomogram on OS (C) and CSS (D) in the validation cohort.
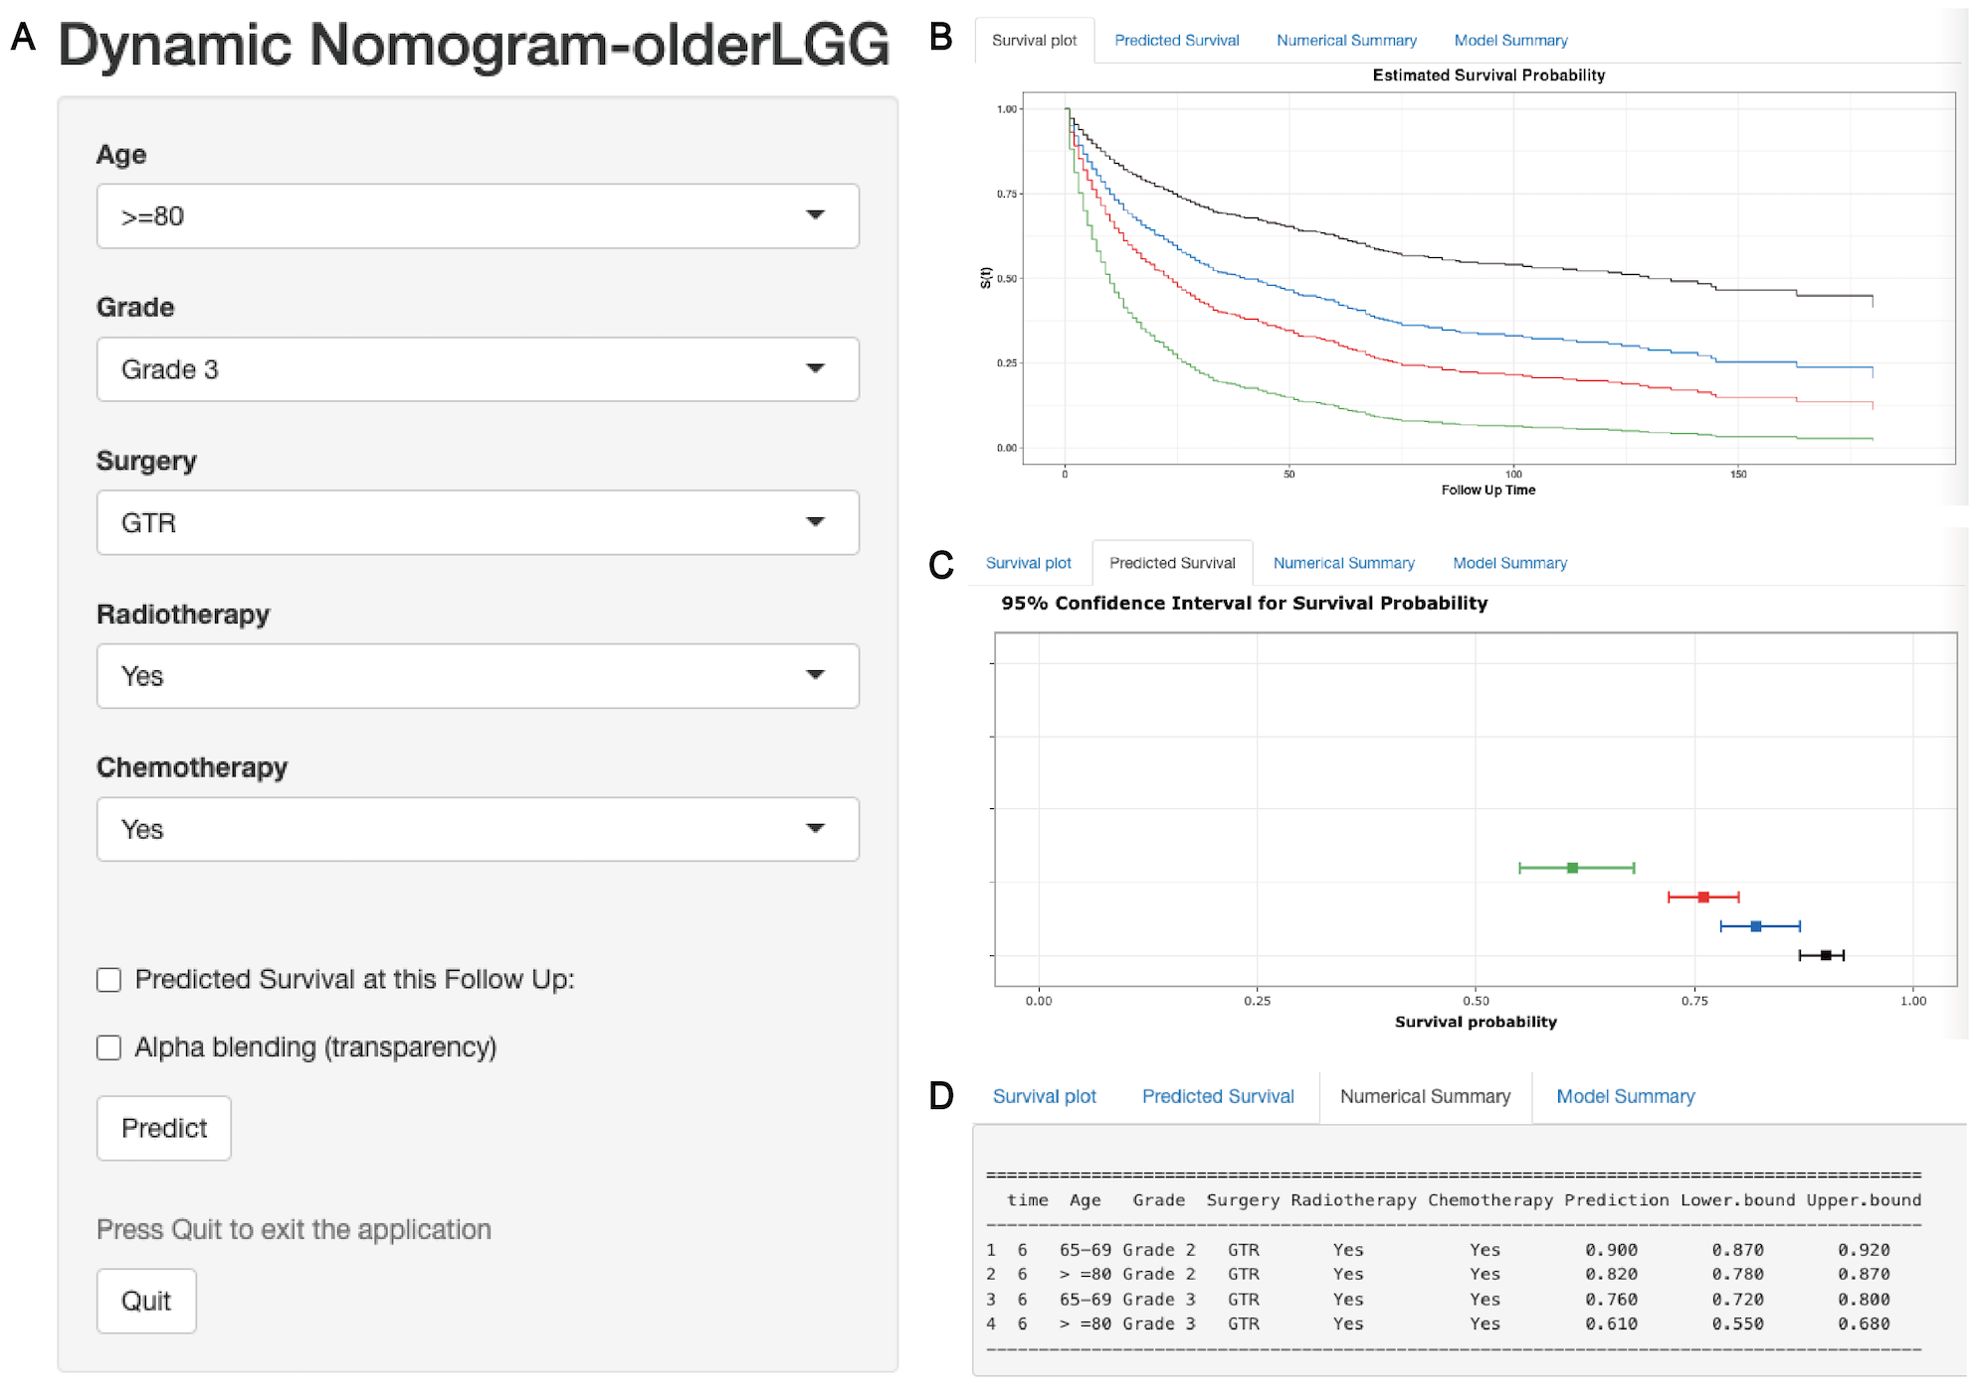
Figure 8. A web-based dynamic nomogram for predicting OS of older patients with LGGs. (A) The nomogram incorporated a panel of independent prognostic factors for the prediction of survival outcomes. (B) A survival plot depicting OS based on different clinical features. (C) The graphical summary included line segments indicating the 95% confidence intervals (CIs) for the estimated survival probability. (D) The numerical summary provided detailed information on the variable features and exact predictive values of OS.
LGGs are characterized by relatively slow growth, infiltrative behavior, and progression and constitute approximately 15% of all adult brain glial tumors (3). In contrast, glioblastoma (GBM) is more prevalent in elderly patients, whereas LGGs are relatively uncommon in the elderly population (9, 17, 18). Previously, Gittleman et al. (15) constructed a survival nomogram for patients with LGGs that included mainly patients <65 years old. Moreover, this prognostic nomogram showed some differences in prediction efficiency among different races when it was validated in a large-scale Asian cohort (19). Given the limited inclusion of older data in prior studies, this study identified independent prognostic factors affecting survival and constructed prognostic nomograms for predicting the OS and CSS probabilities of elderly patients with LGGs at the individual patient level.
This study included a total of 13 variables and the optimal variables were screened by using different methods (Cox regression and LASSO-Cox regression analysis). First, we identified four independent prognostic factors (age, WHO grade, surgery, and chemotherapy, included in the Model 2) that impact OS and CSS using full Cox regression. Additionally, LASSO regression is a novel method for variable screening that involves applying a penalized regression on all variable coefficients, which can exclude the coefficients of relatively unimportant independent variables from the model (20–24). Gu et al. (23) used two variable screening methods in the validation cohort of postoperative pancreatic fistula after pancreatoduodenectomy, and the results revealed that the Lasso-logistic regression model included the optimal independent variables and had better predictive ability than the full logistic regression model. Thus, we used this novel method (LASSO regression analysis based on the Cox model) to screen five variables (age, WHO grade, surgery, radiotherapy, and chemotherapy included in Model 3), which included one more radiotherapy variable than the above Cox regression. A comparison of Model 2 and Model 3 revealed that the prediction ability of Model 3 was better than that of Model 2. Moreover, the five variables in the Model 3 were more closely related to the clinical management of LGG patients. Finally, 5 variables in the Model 3 were included to construct prognostic nomograms.
According to the importance analysis of the five variables, the random forest model and SHAP machine learning analysis revealed the significant impact of WHO grade and age on the predictive accuracy of the model, facilitating the interpretation of variable influence in the nomogram (25–27). Despite emerging studies focusing on elderly individuals (aged over 65 years), age still emerged as a significant independent prognostic factor of OS and CSS, with older patients exhibiting poorer survival outcomes, mirroring findings in GBM patients spanning various age groups (28–32). In addition, the other three variables (surgery, radiotherapy, and chemotherapy) also play important roles in affecting the survival and predictive performance of the model. Surgical resection is considered the primary treatment for LGGs, and GTR of the tumor is associated with better survival outcomes than STR, PR, or biopsy in diffuse gliomas, regardless of grade (33–35). In our study, we found that GTR was significantly associated with longer OS in grade 2 or 3 elderly patients with LGGs. Previous evidence has also supported the importance of maximal safe resection and recommended GTR for elderly patients with LGG (35). However, notably, the treatment protocols and diagnostic criteria have evolved over a relatively long span (2000 ~ 2016). In this study, a greater proportion of patients without surgical intervention (45.4%) and a lower proportion of patients receiving adjuvant therapy (54.5%) had a generally poorer prognosis observed in this study, which might have impacted the study conclusions and should be interpreted with caution. Furthermore, postoperative adjuvant therapy has been shown to prolong the OS of LGG patients, especially those with high-risk gliomas (36–39). In our study, although molecular and risk feature data for elderly LGG patients were lacking, subgroup analysis demonstrated that GTR/STR combined with adjuvant therapy, including radiotherapy and chemotherapy, led to better survival outcomes in grade 3 gliomas. However, in grade 2 gliomas, GTR/STR without adjuvant therapy, especially radiotherapy, provided the best survival benefit. These findings align with those of previous studies and strengthen the evidence on the postoperative management of LGGs in elderly patients (38).
Finally, five key variables screened by LASSO-Cox regression analysis were utilized to construct prognostic nomograms for OS and CSS. A nomogram is a visual representation of a predictive model commonly utilized to predict disease outcomes, including survival for various diseases (25, 40–42). To the best of our knowledge, several clinical prognostic models have been developed for LGGs based on clinical and genetic signatures (43, 44). Moreover, predictive models (43) based on special gene and metabolic signatures restrict their general application in the clinic due to the limited clinical detection of specific genetic features. However, there is a lack of clinically prognostic nomograms specifically designed for the elderly population with LGGs. Compared with the previous survival prediction model for patients with LGGs with an average age of approximately 40 years (44), our nomogram model was unable to include two variables (IDH molecular status and preoperative neurological deficit) due to database limitations. However, we included two additional independent prognostic variables (radiotherapy and chemotherapy) in the nomogram model tailored to elderly LGG patients using the largest sample size, and the performance of the prognostic nomograms demonstrated relatively good predictive ability for survival in these elderly individuals. DCA curves were utilized to further evaluate the clinical effectiveness of the nomogram models (27, 42). DCA curves indicated that the prognostic nomograms provided a superior net benefit compared with the WHO grading system.
Moreover, a risk stratification system based on prognostic nomograms was developed for elderly patients with LGGs, which could effectively stratify these patients into low-risk and high-risk subgroups. This risk stratification system can assist clinicians in determining treatment strategies and could effectively avoid wasting medical resources. Moreover, a web-based dynamic nomogram for elderly LGG patients has been developed to facilitate its use in the clinic and could help clinicians quickly develop personalized decision-making strategies (42, 45).
This retrospective study has several limitations. First, considering the number of included patients over a long period, changes in glioma classification guidelines may impact overall survival outcomes and prognostic factors for patients with LGGs (46). For example, the minority of histological LGGs with molecular features of GBMs were diagnosed as grade 4 gliomas according to the latest guidelines (46). However, crucial variables and molecular markers, such as the Karnofsky Performance Scale (KPS) score, IDH mutation status, and 1p/19q codeletion, were not recorded in the SEER database and thus cannot be incorporated into the model. Finally, given that the training and validation datasets for the predictive models were derived from the SEER database, it is imperative to conduct future validations of the nomogram’s performance and reliability across different databases.
In summary, this study identified five independent prognostic factors using LASSO-Cox regression with a larger sample size for elderly patients with LGGs from the SEER database. By integrating these prognostic factors, novel prognostic nomograms were constructed to predict the 1-year, 2-year, and 5-year probabilities of OS and CSS. Moreover, the construction of the risk stratification system and web-based dynamic nomogram further facilitated its use in the clinic and could help clinicians quickly develop clinical assessments and personalized decision-making strategies.
The original contributions presented in the study are included in the article/Supplementary Material. Further inquiries can be directed to the corresponding authors.
The studies involving humans were approved by West China Hospital of Sichuan University. The studies were conducted in accordance with the local legislation and institutional requirements. Written informed consent for participation was not required from the participants or the participants’ legal guardians/next of kin in accordance with the national legislation and institutional requirements.
XN: Conceptualization, Data curation, Funding acquisition, Methodology, Software, Writing – original draft. TC: Data curation, Writing – original draft. YZ: Supervision, Writing – review & editing. YL: Conceptualization, Supervision, Writing – review & editing. YY: Conceptualization, Funding acquisition, Supervision, Writing – review & editing. QM: Conceptualization, Funding acquisition, Supervision, Writing – review & editing.
The authors declare financial support was received for the research, authorship, and/or publication of this article. This work was supported by the National Natural Science Foundation of China (Nos. 82203456 and 82072773), China Postdoctoral Science Foundation (No. 2022M712255), Project of Science & Technology Department of Sichuan Province (Nos. 2023NSFSC1868 and 2023YFG0127), Postdoctoral Research Fund, Sichuan University (No. 2024SCU12016) and Postdoctoral Research Fund, West China Hospital, Sichuan University (No. 2023HXBH070).
The authors thank American Journal Experts (AJE) for assisting in the preparation of our manuscript.
The authors declare that the research was conducted in the absence of any commercial or financial relationships that could be construed as a potential conflict of interest.
All claims expressed in this article are solely those of the authors and do not necessarily represent those of their affiliated organizations, or those of the publisher, the editors and the reviewers. Any product that may be evaluated in this article, or claim that may be made by its manufacturer, is not guaranteed or endorsed by the publisher.
The Supplementary Material for this article can be found online at: https://www.frontiersin.org/articles/10.3389/fimmu.2024.1447879/full#supplementary-material
1. Louis DN, Perry A, Reifenberger G, von Deimling A, Figarella-Branger D, Cavenee WK, et al. The 2016 world health organization classification of tumors of the central nervous system: a summary. Acta Neuropathol. (2016) 131:803–20. doi: 10.1007/s00401-016-1545-1
2. Louis DN, Perry A, Wesseling P, Brat DJ, Cree IA, Figarella-Branger D, et al. The 2021 WHO classification of tumors of the central nervous system: A summary. Neuro Oncol. (2021) 23:1231–51. doi: 10.1093/neuonc/noab106
3. Ostrom QT, Price M, Neff C, Cioffi G, Waite KA, Kruchko C, et al. CBTRUS statistical report: primary brain and other central nervous system tumors diagnosed in the United States in 2015–2019. Neuro Oncol. (2022) 24:V1–V95. doi: 10.1093/neuonc/noac202
4. Schaff LR, Mellinghoff IK. Glioblastoma and other primary brain Malignancies in adults. JAMA. (2023) 329:574. doi: 10.1001/jama.2023.0023
5. Schiff D, Van Den Bent M, Vogelbaum MA, Wick W, Miller CR, Taphoorn M, et al. Recent developments and future directions in adult lower-grade gliomas: Society for Neuro-Oncology (SNO) and European Association of Neuro-Oncology (EANO) consensus. Neuro Oncol. (2019) 21:838–54. doi: 10.1093/neuonc/noz033
6. Dao Trong P, Gluszak M, Reuss D, von Deimling A, Wick A, König L, et al. Isocitrate-dehydrogenase-mutant lower grade glioma in elderly patients: treatment and outcome in a molecularly characterized contemporary cohort. J Neurooncol. (2023) 161:605–15. doi: 10.1007/s11060-022-04230-1
7. Raman F, Mullen A, Byrd M, Bae S, Kim J, Sotoudeh H, et al. Evaluation of RANO criteria for the assessment of tumor progression for lower-grade gliomas. Cancers (Basel). (2023) 15:3274. doi: 10.3390/cancers15133274
8. Eckel-Passow JE, Lachance DH, Molinaro AM, Walsh KM, Decker PA, Sicotte H, et al. Glioma groups based on 1p/19q, IDH, and TERT promoter mutations in tumors. N Engl J Med. (2015) 372:2499–508. doi: 10.1056/NEJMoa1407279
9. Lee B, Hwang S, Bae H, Choi KH, Suh YL. Diagnostic utility of genetic alterations in distinguishing IDH-wildtype glioblastoma from lower-grade gliomas: Insight from next-generation sequencing analysis of 479 cases. Brain Pathol. (2024) 34:e13234. doi: 10.1111/bpa.13234
10. Gittleman H, Cioffi G, Chunduru P, Molinaro AM, Berger MS, Sloan AE, et al. An independently validated nomogram for isocitrate dehydrogenase-wild-type glioblastoma patient survival. Neuro-Oncol Adv. (2019) 1:vdz007. doi: 10.1093/noajnl/vdz007
11. Niu X, Yang Y, Zhou X, Zhang H, Zhang Y, Liu Y, et al. A prognostic nomogram for patients with newly diagnosed adult thalamic glioma in a surgical cohort. Neuro Oncol. (2021) 23:337–8. doi: 10.1093/neuonc/noaa268
12. Niu X, Chang T, Yang Y, Mao Q. Prognostic nomogram models for predicting survival probability in elderly glioblastoma patients. J Cancer Res Clin Oncol. (2023) 149:14145–57. doi: 10.1007/s00432-023-05232-w
13. Zhang H, Jiang X, Ren F, Gu Q, Yao J, Wang X, et al. Development and external validation of dual online tools for prognostic assessment in elderly patients with high-grade glioma: a comprehensive study using SEER and Chinese cohorts. Front Endocrinol (Lausanne). (2023) 14:1307256. doi: 10.3389/fendo.2023.1307256
14. Aoki K, Nakamura H, Suzuki H, Matsuo K, Kataoka K, Shimamura T, et al. Prognostic relevance of genetic alterations in diffuse lower-grade gliomas. Neuro Oncol. (2018) 20:66–77. doi: 10.1093/neuonc/nox132
15. Gittleman H, Sloan AE, Barnholtz-Sloan JS. An independently validated survival nomogram for lower-grade glioma. Neuro Oncol. (2020) 22:665–74. doi: 10.1093/neuonc/noz191
16. Mathew G, Agha R, Albrecht J, Goel P, Mukherjee I, Pai P, et al. STROCSS 2021: Strengthening the reporting of cohort, cross-sectional and case-control studies in surgery. Int J Surg. (2021) 96:106165. doi: 10.1016/j.ijsu.2021.106165
17. Minniti G, Lombardi G, Paolini S. Glioblastoma in elderly patients: current management and future perspectives. Cancers (Basel). (2019) 11:336. doi: 10.3390/cancers11030336
18. Youssef G, Miller JJ. Lower grade gliomas. Curr Neurol Neurosci Rep. (2020) 20:21. doi: 10.1007/s11910-020-01040-8
19. Han M-Z, Huang B, Ni S-L, Wang J, Li X-G, Bjerkvig R. A validated prognostic nomogram for patients with newly diagnosed lower-grade gliomas in a large-scale Asian cohort. Neuro Oncol. (2020) 22:729–31. doi: 10.1093/neuonc/noaa027
20. TIBSHIRANI R. THE LASSO METHOD FOR VARIABLE SELECTION IN THE COX MODEL. Stat Med. (1997) 16:385–95. doi: 10.1002/(SICI)1097-0258(19970228)16:4<385::AID-SIM380>3.0.CO;2-3
21. Wang Q, Qiao W, Zhang H, Liu B, Li J, Zang C, et al. Nomogram established on account of Lasso-Cox regression for predicting recurrence in patients with early-stage hepatocellular carcinoma. Front Immunol. (2022) 13:1019638. doi: 10.3389/fimmu.2022.1019638
22. Zhang Y, Guo L, Dai Q, Shang B, Xiao T, Di X, et al. A signature for pan-cancer prognosis based on neutrophil extracellular traps. J Immunother. Cancer. (2022) 10:e004210. doi: 10.1136/jitc-2021-004210
23. Gu Z, Du Y, Wang P, Zheng X, He J, Wang C, et al. Development and validation of a novel nomogram to predict postoperative pancreatic fistula after pancreatoduodenectomy using lasso-logistic regression: an international multi-institutional observational study. Int J Surg. (2023) 109:4027–40. doi: 10.1097/JS9.0000000000000695
24. Feng Y, Yang J, Duan W, Cai Y, Liu X, Peng Y. LASSO-derived prognostic model predicts cancer-specific survival in advanced pancreatic ductal adenocarcinoma over 50 years of age: a retrospective study of SEER database research. Front Oncol. (2024) 13:1336251. doi: 10.3389/fonc.2023.1336251
25. Wang R, Dai W, Gong J, Huang M, Hu T, Li H, et al. Development of a novel combined nomogram model integrating deep learning-pathomics, radiomics and immunoscore to predict postoperative outcome of colorectal cancer lung metastasis patients. J Hematol Oncol. (2022) 15:11. doi: 10.1186/s13045-022-01225-3
26. Li J, Huang L, Liao C, Liu G, Tian Y, Chen S. Two machine learning-based nomogram to predict risk and prognostic factors for liver metastasis from pancreatic neuroendocrine tumors: a multicenter study. BMC Cancer. (2023) 23:529. doi: 10.1186/s12885-023-10893-4
27. Yang C, Liu Z, Fang Y, Cao X, Xu G, Wang Z, et al. Development and validation of a clinic machine-learning nomogram for the prediction of risk stratifications of prostate cancer based on functional subsets of peripheral lymphocyte. J Transl Med. (2023) 21:465. doi: 10.1186/s12967-023-04318-w
28. Babu R, Komisarow JM, Agarwal VJ, Rahimpour S, Iyer A, Britt D, et al. Glioblastoma in the elderly: The effect of aggressive and modern therapies on survival. J Neurosurg. (2016) 124:998–1007. doi: 10.3171/2015.4.JNS142200
29. Connon FV, Rosenthal MA, Drummond K. Glioblastoma multiforme in the very elderly. Neurosurg Rev. (2016) 39:55–61. doi: 10.1007/s10143-015-0652-0
30. Schwartz C, Romagna A, Stefanits H, Zimmermann G, Ladisich B, Geiger P, et al. Risks and benefits of glioblastoma resection in older adults: A retrospective Austrian multicenter study. World Neurosurg. (2020) 133:e583–91. doi: 10.1016/j.wneu.2019.09.097
31. Derby S, Jackson MR, Williams K, Stobo J, Kelly C, Sweeting L, et al. Concurrent olaparib and radiation therapy in older patients with newly diagnosed glioblastoma: the phase 1 dose-escalation PARADIGM trial. Int J Radiat Oncol. (2024) 118:1371–8. doi: 10.1016/j.ijrobp.2024.01.011
32. Stadler C, Gramatzki D, Le Rhun E, Hottinger AF, Hundsberger T, Roelcke U, et al. Glioblastoma in the oldest old: Clinical characteristics, therapy, and outcome in patients aged 80 years and older. Neuro-Oncol Pract. (2024) 11:132–41. doi: 10.1093/nop/npad070
33. Ius T, Mazzucchi E, Tomasino B, Pauletto G, Sabatino G, Della Pepa GM, et al. Multimodal integrated approaches in low grade glioma surgery. Sci Rep. (2021) 11:9964. doi: 10.1038/s41598-021-87924-2
34. Rossi M, Gay L, Ambrogi F, Conti Nibali M, Sciortino T, Puglisi G, et al. Association of supratotal resection with progression-free survival, Malignant transformation, and overall survival in lower-grade gliomas. Neuro Oncol. (2021) 23:812–26. doi: 10.1093/neuonc/noaa225
35. Wang P, Luo C, Hong PJ, Rui WT, Wu S. The Role of Surgery in IDH-Wild-Type Lower-Grade Gliomas: Threshold at a High Extent of Resection Should be Pursued. Neurosurgery. (2021) 88:1136–44. doi: 10.1093/neuros/nyab052
36. Al Feghali KA, Buszek SM, Elhalawani H, Chevli N, Allen PK, Chung C. Real-world evaluation of the impact of radiotherapy and chemotherapy in elderly patients with glioblastoma based on age and performance status. Neuro-Oncol Pract. (2021) 8:199–208. doi: 10.1093/nop/npaa064
37. Qiu X, Chen Y, Bao Z, Chen L, Jiang T. Chemoradiotherapy with temozolomide vs. radiotherapy alone in patients with IDH wild-type and TERT promoter mutation WHO grade II/III gliomas: A prospective randomized study. Radiother Oncol. (2022) 167:1–6. doi: 10.1016/j.radonc.2021.12.009
38. Tom MC, Milano MT, Chao ST, Soltys SG, Knisely JPS, Sahgal A, et al. Executive summary of American Radium Society’s appropriate use criteria for the postoperative management of lower grade gliomas. Radiother Oncol. (2022) 170:79–88. doi: 10.1016/j.radonc.2022.03.018
39. Sauvageot S, Boetto J, Duffau H. Surgical, functional, and oncological considerations regarding awake resection for giant diffuse lower-grade glioma of more than 100 cm3. J Neurosurg. (2023) 139:934–43. doi: 10.3171/2023.2.JNS222755
40. Balachandran VP, Gonen M, Smith JJ, DeMatteo RP. Nomograms in oncology: more than meets the eye. Lancet Oncol. (2015) 16:e173–80. doi: 10.1016/S1470-2045(14)71116-7
41. Park SY. Nomogram: An analogue tool to deliver digital knowledge. J Thorac Cardiovasc Surg. (2018) 155:1793. doi: 10.1016/j.jtcvs.2017.12.107
42. Wang Y, Wang X, Yu T, Wang Z, Zhang H, Chao B, et al. Epidemiology and survival of patients with spinal meningiomas: a large retrospective cohort study. Int J Surg. (2024) 110:921–33. doi: 10.1097/JS9.0000000000000884
43. Lam LHT, Chu NT, Tran T-O, Do DT, Le NQK. A radiomics-based machine learning model for prediction of tumor mutational burden in lower-grade gliomas. Cancers (Basel). (2022) 14:3492. doi: 10.3390/cancers14143492
44. Zhu Q, Liang Y, Fan Z, Liu Y, Zhou C, Zhang H, et al. Development and validation of a novel survival prediction model for newly diagnosed lower-grade gliomas. Neurosurg Focus. (2022) 52:E13. doi: 10.3171/2022.1.FOCUS21596
45. Jiang Y, Hu H, Shao X, Li W, Lu Y, Liang J, et al. A novel web-based dynamic prognostic nomogram for gastric signet ring cell carcinoma: a multicenter population-based study. Front Immunol. (2024) 15:1365834. doi: 10.3389/fimmu.2024.1365834
Keywords: cancer-specific survival, elderly, lower-grade glioma, nomogram, overall survival, SEER
Citation: Niu X, Chang T, Zhang Y, Liu Y, Yang Y and Mao Q (2024) Variable screening and model construction for prognosis of elderly patients with lower-grade gliomas based on LASSO-Cox regression: a population-based cohort study. Front. Immunol. 15:1447879. doi: 10.3389/fimmu.2024.1447879
Received: 12 June 2024; Accepted: 26 August 2024;
Published: 11 September 2024.
Edited by:
Haihui Jiang, Peking University Third Hospital, ChinaReviewed by:
Ke Sai, Sun Yat-sen University Cancer Center (SYSUCC), ChinaCopyright © 2024 Niu, Chang, Zhang, Liu, Yang and Mao. This is an open-access article distributed under the terms of the Creative Commons Attribution License (CC BY). The use, distribution or reproduction in other forums is permitted, provided the original author(s) and the copyright owner(s) are credited and that the original publication in this journal is cited, in accordance with accepted academic practice. No use, distribution or reproduction is permitted which does not comply with these terms.
*Correspondence: Yanhui Liu, eWhsaXUyMDAxQDE2My5jb20=; Yuan Yang, eWFuZ3l1YW5Ad2Noc2N1LmNu; Qing Mao, cWluZ21hbzIwMDBAMTYzLmNvbQ==
Disclaimer: All claims expressed in this article are solely those of the authors and do not necessarily represent those of their affiliated organizations, or those of the publisher, the editors and the reviewers. Any product that may be evaluated in this article or claim that may be made by its manufacturer is not guaranteed or endorsed by the publisher.
Research integrity at Frontiers
Learn more about the work of our research integrity team to safeguard the quality of each article we publish.