 Qiangqiang Qin1†
 Qingxuan Li
 Wen Gu
 Xuejun Guo
94% of researchers rate our articles as excellent or good
Learn more about the work of our research integrity team to safeguard the quality of each article we publish.
Find out more
ORIGINAL RESEARCH article
Front. Immunol., 24 July 2024
Sec. Inflammation
Volume 15 - 2024 | https://doi.org/10.3389/fimmu.2024.1441838
This article is part of the Research TopicCommunity Series in Inflammation in Respiratory and Neurological Diseases and the immune-interaction of the lung-brain axis: Volume IIView all 10 articles
Background: The clinical presentation of Community-acquired pneumonia (CAP) in hospitalized patients exhibits heterogeneity. Inflammation and immune responses play significant roles in CAP development. However, research on immunophenotypes in CAP patients is limited, with few machine learning (ML) models analyzing immune indicators.
Methods: A retrospective cohort study was conducted at Xinhua Hospital, affiliated with Shanghai Jiaotong University. Patients meeting predefined criteria were included and unsupervised clustering was used to identify phenotypes. Patients with distinct phenotypes were also compared in different outcomes. By machine learning methods, we comprehensively assess the disease severity of CAP patients.
Results: A total of 1156 CAP patients were included in this research. In the training cohort (n=809), we identified three immune phenotypes among patients: Phenotype A (42.0%), Phenotype B (40.2%), and Phenotype C (17.8%), with Phenotype C corresponding to more severe disease. Similar results can be observed in the validation cohort. The optimal prognostic model, SuperPC, achieved the highest average C-index of 0.859. For predicting CAP severity, the random forest model was highly accurate, with C-index of 0.998 and 0.794 in training and validation cohorts, respectively.
Conclusion: CAP patients can be categorized into three distinct immune phenotypes, each with prognostic relevance. Machine learning exhibits potential in predicting mortality and disease severity in CAP patients by leveraging clinical immunological data. Further external validation studies are crucial to confirm applicability.
Community-acquired pneumonia (CAP) is an acute parenchymal lung infection caused by a variety of microorganisms outside the hospital. Despite advancements in rapid diagnostic testing, novel treatment options, and vaccine development, CAP continues to be one of the predominant causes of hospitalization, morbidity, and mortality globally (1). Severe community-acquired pneumonia (SCAP) is presently defined as the condition of patients requiring admission to the Intensive Care Unit (ICU) for mechanical ventilation (MV) or intensive respiratory or vasopressor support (IRVS) (2). Among 7,449 patients enrolled in the United States between 2014 and 2016, the 30-day mortality rate for SCAP was 6% (3). Consequently, the prompt identification and immediate management of SCAP are crucial for reducing its mortality rate. Presently, numerous methods are employed to evaluate the severity of CAP, primarily relying on established scores and guidelines. Nonetheless, these methods exhibit multiple limitations that impede their utility as clinical decision support tools (4–6).
In recent decades, machine learning (ML) algorithms have shown better performance in predicting various diseases or clinical conditions. Research has consistently illustrated the efficacy of ML in managing critically ill patients by predicting length of stay, risk of ICU readmission, and mortality rates. Recently, Jeon Et al. established that ML models significantly outperform traditional severity-of-illness scoring systems in predicting ICU mortality among patients with severe pneumonia (7). Xu et al. found that the ML model based on available clinical features is feasible and effective in predicting adverse outcomes such as mortality inCAP patients and ICU admission (8).
The clinical manifestations of CAP are highly variable. As a result, patients with CAP who are hospitalized present with a wide range of clinical symptoms, vital signs, and laboratory findings. Previously, Stefano Aliberti et al. divided patients into three different clinical phenotypes based on the presence or absence of acute respiratory failure and severe sepsis at admission, which showed significant differences in mortality (9). As infections advance, a range of resident and mobilized immune cells are activated to combat the invading pathogens. Research indicates that both the inflammatory response and immune regulation are pivotal in the pathogenesis of SCAP and acute respiratory distress syndrome (ARDS) (10). However, to date, limited studies have explored the immune phenotypes associated with CAP and their correlation with patient clinical outcomes. Therefore, we hypothesize that distinct clusters of characteristics present in CAP patients at admission may form identifiable subgroups or phenotypes, potentially signaling disparate prognoses for the illness and serving a vital function in the early detection of SCAP. This study sought to ascertain if immune phenotypes in patients with CAP can be identified using immunological data, to evaluate their correlation with prognosis, and to predict the likelihood of SCAP.
In this research, electronic health records of patients diagnosed with CAP admitted to the Respiratory and Critical Care department of Xin Hua Hospital Affiliated to Shanghai Jiao Tong University School of Medicine between January 1, 2020 and October 31, 2023 were retrospectively collected. All patients incorporated in this research were required to meet the diagnostic criteria of CAP and to have blood samples collected within the first 24 hours of admission. However, the study excluded patients who met any of the following exclusion criteria: (1) age under 18 years; (2) diagnosis of an autoimmune or hematologic malignancy; (3) a subsequent diagnosis of conditions such as pulmonary tuberculosis or idiopathic pulmonary fibrosis; and (4) those who declined further treatment or were transferred to another hospital. (see Figure 1, Supplementary Figure S1 for details). Additionally, in this study, we exclusively consider data from the initial hospital admission for individuals who experienced multiple admissions (11). Vital signs(heart rate, systolic blood pressure and diastolic blood pressure, temperature, respiratory rate and mentation), demographic information(age, sex, height, weight), laboratory indicators(WBC, Neutrophil cell count, IgA, IgE, IgM, IL-6, IL-8, CD3, CD4, CD8, etc.) were collected within 24h after admission, and other variables (days from symptom onset, chief complaint, length of stay, application of assisted ventilation, and clinical outcome) were also extracted after patients discharged. Upon applying our predefined inclusion and exclusion criteria, we successfully enrolled a cohort of 1,165 eligible patients for this study.
Figure 1 The flowchart of this research.
Patients were randomly allocated to the training and validation cohorts in a ratio of 7:3 to ensure reproducibility and consistency in the modeling outcomes (12). And a meticulously curated dataset comprising various laboratory indicators has been compiled for this analysis. When addressing missing values, we employed two distinct strategies. For variables with less than 20% missing data, imputation was performed using the Multivariate Imputation by Chained Equations (MICE) package (13). Conversely, variables with 20% or more missing data were excluded entirely to preserve the integrity and robustness of the study (14). This methodological approach refined our dataset to encompass 79 laboratory indicators. Moreover, given the study’s emphasis on exploring the immune phenotype of community-acquired pneumonia, we cumulatively identified 31 immunological laboratory variables as the focal point for clustering analysis. To identify commonalities among different patients based on laboratory examinations, we applied the unsupervised ‘consensus clustering’ algorithm within the training cohort to ascertain the optimal number of clusters. Subsequently, we corroborated the findings in both the validation cohort and the meta-cohort. Additionally, to verify the integrity of the clustering process, our dataset underwent analysis using the NBclust (15)clustering algorithm. Additionally, we employed an alluvial plot to visualize the discrepancies between conventional grading systems and our machine learning approach. Lastly, we presented chord diagrams to illustrate the associations between laboratory indicators and clinical immune phenotypes.
CAP patients were classified into three distinct immune phenotypes (Phenotype A, Phenotype B, and Phenotype C). Utilizing prior knowledge and clinical expertise, indicators such as the necessity for mechanical ventilation, admission to the intensive care unit, or mortality due to the disease were employed as surrogate markers of SCAP in this investigation. The primary outcome was the in-hospital mortality rate. Secondary outcomes included the 28-day mortality rate, the likelihood of progressing to severe pneumonia, length of stay, days of ventilation, days in the ICU, ICU-free days, and the probability of respiratory support. Upon stratification of pneumonia patients into three immune phenotypes, we assessed differences in all-cause in-hospital mortality rates across the meta, training, and validation cohorts. Simultaneously, we examined the 28-day mortality rate and the risk of severe disease progression within these cohorts. This approach facilitated a detailed evaluation of mortality outcomes associated with different immune phenotypes in community-acquired pneumonia.
To assess the predictive performance of machine learning (ML) methods based on Zaoqu liu’s framework (16), nine algorithms were employed for patient prognosis prediction in both the training and validation cohorts. The model with the highest average concordance index (C-index) across these cohorts will be considered the most effective. Additionally, this study expanded its methodology to include thirteen ML algorithms for forecasting the risk of severity in CAP patients, specifically: Lasso, Ridge, Elastic Net (Enet), Stepwise GLM (Stepglm), Support Vector Machine (SVM), Gradient Boosting Machine (GBM), Linear Discriminant Analysis (LDA), Partial Least Squares and Logistic Regression Model (plsRglm), Random Forest, and Naive Bayes (17–19). Consistently, the model that exhibits superior performance across both cohorts will be identified as the optimal model. To guarantee the robustness and reliability of our models, we meticulously selected only those comprising more than five variables. This strategy enabled clinicians to concentrate on the most informative and stable combinations of predictors. Moreover, we incorporated the publicly accessible dataset GSE188309 (20), which concentrates on community-acquired pneumonia, into our analysis to ascertain potential immune infiltration from a transcriptomic perspective.
Generally, CURB-65 and PSI scoring systems were frequently utilized in clinical settings to evaluate the severity of pneumonia patients with CAP. However, recent studies have highlighted significant limitations within these systems (21, 22). In response, we developed a model utilizing machine learning techniques and evaluated its predictive accuracy using the Receiver Operating Characteristic (ROC) curve, in comparison to traditional scoring systems.
In this study, the Shapiro-Wilk test was utilized to assess the normality of continuous variables prior to the formal analysis. For comparisons, the Mann–Whitney U-test was applied to non-normally distributed continuous variables, while the Student’s t-test was used for those with a normal distribution, as appropriate. For categorical variables, the Kruskal-Wallis test or the Chi-square test was employed where relevant. Continuous variables were presented as mean ± SD for normally distributed data and as median (interquartile range, IQR) for non-normally distributed data. Categorical variables were reported as frequencies and percentages. All data generation, processing, statistical analyses, and plotting were performed using R software version 4.2.0. A p-value of less than 0.05 was considered statistically significant, although this was not explicitly mentioned in the report.
Approval was obtained from the Institutional Review Board (IRB) of Xinhua Hospital, Shanghai Jiao Tong University School of Medicine, Shanghai, China, and a waiver of consent was granted because the study used electronic medical record data and blood test results from normal clinical visits (Approval Number: XHEC-C-2024-026-1; Approval Date: 2024-03-19; Study Title: Clinical Study Based on Comprehensive Multi-omics Analysis of Peripheral Blood for Community Acquired Pneumonia). All procedures were followed in accordance with the IRBs standards on human experimentation and the Helsinki Declaration of 1975.
This study reviewed the records of 12,000 individuals discharged from the Respiratory Department of Xinhua Hospital between January 1, 2020, and October 31, 2023. Of these, 1,379 were diagnosed with CAP. Following the application of exclusion criteria, 223 patients were omitted from the study. Consequently, a cohort of 1,156 CAP patients was established for inclusion in the research. Patients were allocated into two groups: a training cohort consisting of 809 patients and a validation cohort of 347 patients, using a randomization ratio of 7:3. Table 1 presents the baseline characteristics of the combined meta-cohort, along with those of the training and validation cohorts separately. Among the participants, 8 required treatment with an invasive ventilator, 96 received non-invasive ventilation, and 46 underwent therapy with high-flow nasal cannula. In this study, 53 patients succumbed to their conditions, while 239 required admission to the intensive care unit. The median hospital stay for the meta cohort was 9 days, with an interquartile range (IQR) of 7–14 days. The three most frequent symptoms among the patients were cough (76%, n=880), fever (54%, n=626), and sputum production (52%, n=600). Consistent with prior research (23, 24), the most prevalent comorbidities included hypertension (40%, n=467) and type 2 diabetes mellitus (22%, n=252). To determine the latent immune phenotypes of CAP, the “Consensus Cluster Plus” package was utilized for consensus clustering across the training, validation, and meta cohorts. This analysis identified three distinct immune phenotypes within each cohort, as demonstrated in Figures 2A, B, Supplementary Figures S3A, B, and S4A, B, indicating that a tripartite classification was most suitable for the data. The “nbclust” package (15, 25) was routinely utilized for unsupervised clustering to ascertain the optimal number of clusters. In agreement with the majority rule, three distinct clusters were deemed to be ideal for all cohorts, as depicted in the Supplementary Materials (Supplementary Figures S2A, S3C, and S4C). Grounded on these findings and informed by prior knowledge, a tripartite classification of phenotypes was determined to be most appropriate. The results of clustering were visualized by t-distributed stochastic neighbor embedding (t-SNE), Principal Component Analysis (PCA) and Uniform Manifold Approximation and Projection (UMAP) plot, as shown in Figure 2C, Supplementary Figures S2B, C, S3D–F, and S4D–F. The baseline characteristics of each cohort are presented in Table 2 and Supplementary Tables S1, S2. The three distinct immune phenotypes varied in size, ranging from 16.8% to 43.4% of the cohorts, and demonstrated differences in clinical presentations and patterns of organ dysfunction. These variances are detailed in Supplementary Tables S1, S2, and Figures 3A–D, Supplementary Figures S7A–D, and S8A–D. Within the training cohort, patients with CAP were grouped into three phenotypes based on distinct laboratory features. Phenotype A patients exhibited elevated levels of prealbumin. In contrast, phenotype B was characterized by reduced IgG4, triglycerides, and uric acid levels. Patients classified as phenotype C tended to be older males with a higher likelihood of being admitted to the ICU. Variations in laboratory indicators were apparent among the three immune phenotypes. According to the standardized mean difference between phenotypes (Figures 3E–G), phenotype A patients showed fewer laboratory abnormalities and less evidence of organ dysfunction. Conversely, phenotype B patients had indicators suggestive of renal dysfunction, while those in phenotype C were more likely to display increased inflammatory markers (such as IL-2R, IL-8, IL-6), alongside reduced immunologic parameters of inflammation (e.g., CD3, CD4, CD8), lower albumin levels, and elevated body temperatures. Patients classified as Phenotype B tend to demonstrate moderate abnormalities in their laboratory tests. Relative to Phenotype A, those with Phenotype B show elevated levels of neutrophils, C-reactive protein (CRP), and erythrocyte sedimentation rate (ESR). In addition, there is a concurrent suppression of lymphocytes and their subsets. The levels of IgG4 do not vary significantly between these phenotypes. Patients identified as Phenotype C also manifest a similar pattern, with increased inflammatory markers (IL-2R, neutrophil count, and ESR) and decreased immunological indicators (CD3+CD4+CD8+ lymphocytes); however, IgG, IgA, and TNF-α levels remain statistically unchanged. When drawing comparisons between Phenotypes B and C, a rise in IL-2R, CRP, ESR, and IgE is noted, along with a reduction in lymphocyte-related indicators. These differential markers underscore their importance in phenotype classification and, indirectly, the robustness of this classification scheme. Further corroboration of these findings is evident in the validation and meta cohorts, as depicted in Supplementary Figures S7E–G and S8E–G.
Table 1 Characteristics of the study population and outcomes of community acquired pneumonia patients.
Figure 2 Consensus Clustering and visualization. (A) Identification of three immune phenotypes of community acquired pneumonia (CAP) patients by consensus clustering. (B) Cumulative distribution function (CDF) curve illustrated consensus distribution for each phenotype. (C) T-distributed stochastic neighbor embedding (t-SNE) method successfully divided CAP patients into three distinct immune phenotypes. The purple dot represent patients belong to phenotype A. Patients with phenotype B are represented by a yellow dot, and those with phenotype C by a blue dot. CAP, community acquired pneumonia; t-SNE, T-distributed stochastic neighbor embedding; CDF, Cumulative distribution function.
Table 2 Characteristics and outcomes of community acquired pneumonia patients divided by immune phe Notypes in training cohort.
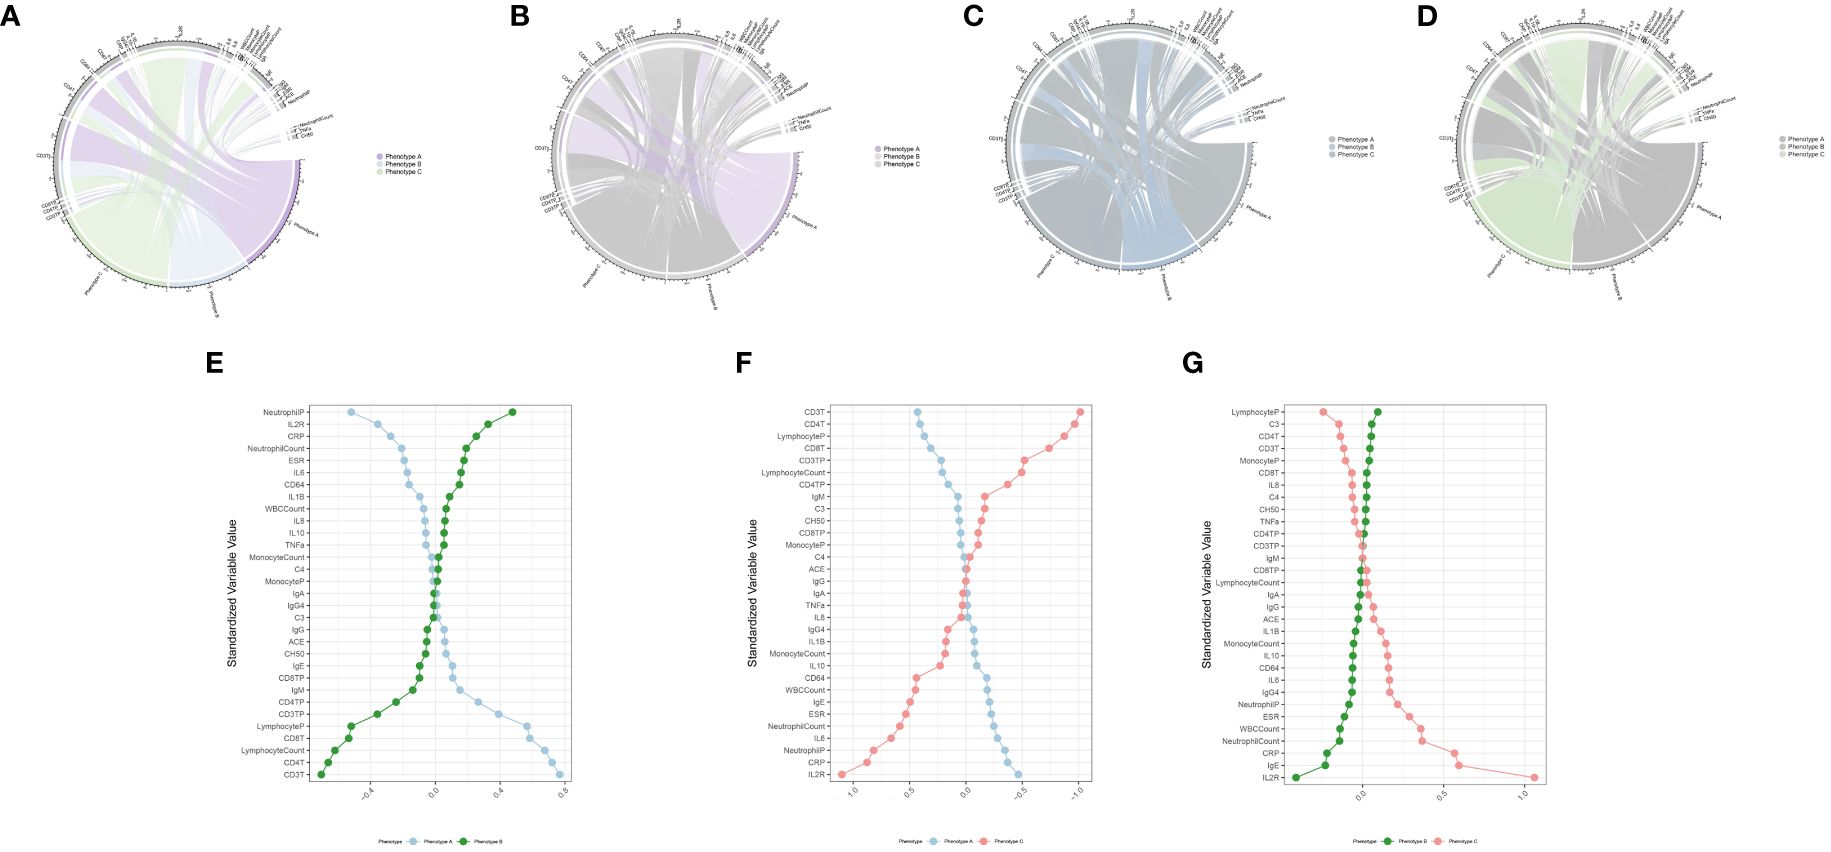
Figure 3 Association and variation between clinical immunological indicators and three phenotypes. Chord diagram (A–D) of the association between clinical immunological variables and each phenotype in training cohort. Different phenotypes were shown in different colors: phenotype A is purple, phenotype B is blue, and phenotype C is green. Rank plot (E–G) of variable mean among various phenotypes in training cohort. Variables were normalized by mean and standard error.
In current research, distinct immune phenotypes were correlated with primary and secondary outcomes. Within the training cohort, Phenotype C had the highest inpatient mortality rate, with 21 deaths (15.4%, n=136), markedly higher than that observed in Phenotype A (0 deaths, 0%, n=322) and Phenotype B (19 deaths, 5.4%, n=351) (P<0.001). Furthermore, Phenotype C experienced the highest 28-day mortality rate with 17 deaths (12.5%, n=136) compared to Phenotypes A (0 deaths, 0%, n=322) and B (13 deaths, 3.7%, n=351). Similar trends in survival outcomes were observed in the meta and validation cohorts, as detailed in Supplementary Tables S1 and S2. Across all three cohorts, patients characterized as Phenotype C consistently exhibited a poorer prognosis compared to those classified as Phenotypes A and B (P<0.001; Figures 4A, B, Supplementary Figures S5A, B, and S6A, B). Furthermore, the three clinically derived immune phenotypes showed notable differences across all primary and secondary outcomes (Figures 4C–H, Supplementary Figures S5C–H, and S6C–H). Our investigation also explored the correspondence between the immune phenotypes identified in this study and traditional clinical categorizations such as CURB-65 and PSI. The results indicate that our immune phenotyping operates independently of these conventional classifications (Figure 6I, Supplementary Figures S9A, B), firmly establishing the utility and precision of our clustering approach. The presented evidence highlights distinct clinical outcomes among the phenotypes and underscores the significance of adopting this new classification in clinical practice, thereby demonstrating its practical relevance.
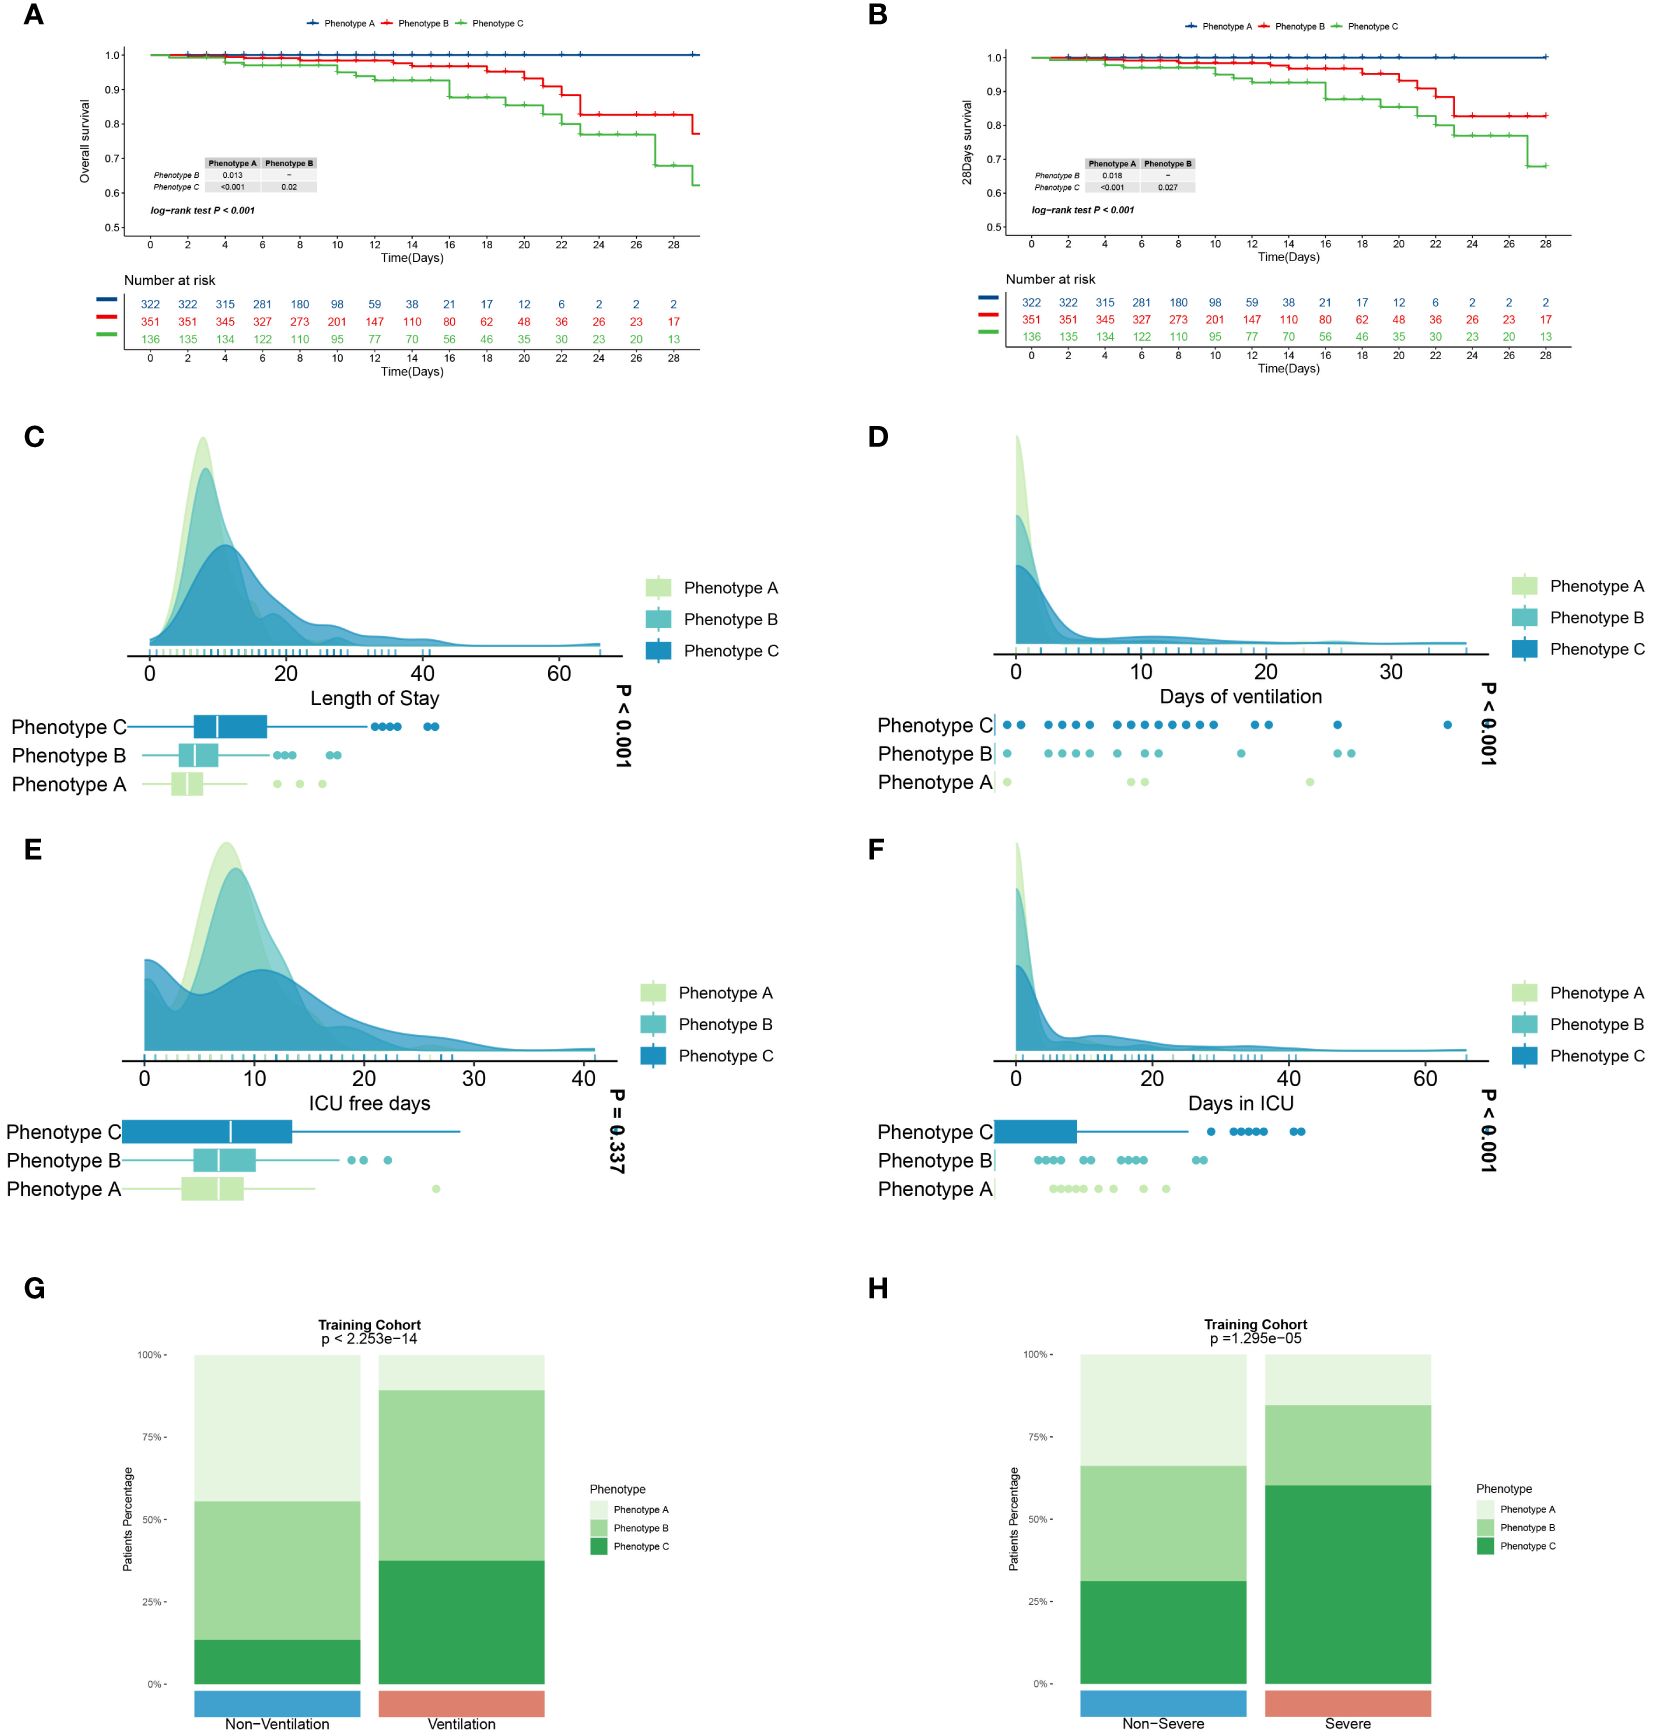
Figure 4 Primary and secondary outcomes among three distinct immune phenotypes in training cohort. (A) Survival curves for various phenotype patients during their hospitalization. (B) Survival curves for various phenotype patients over 28 days. Blue line represents Phenotype A patients, red for Phenotype B patients, and green for Phenotype C patients. CAP patients in Phenotype A had a better prognosis than those in Phenotype A and C (P<0.05).Phenotype C CAP patients experience extended hospital stays (C) and ICU stays (F), prolonged ventilation days (D), and fewer ICU-free days (E) in comparison to patients with the other two phenotypes. Green represents Phenotype A patients, light blue for Phenotype B patients, and dark blue for Phenotype C patients. Patients with phenotype C comprise a greater proportion of patients requiring assisted ventilation (G) and those with severe pneumonia (H). Differences are observed in patient composition with respect to ventilation and the presence of severe pneumonia. P<0.001.
Based on the immunological laboratory indicators available at Xinhua Hospital, variables exhibiting a missing rate exceeding 20% were excluded. Consequently, 31 clinical immunological laboratory indicators were selected for model development. Contrary to previous research (7, 26), our investigation not only concentrates on the prognosis of patients with CAP but also considers the likelihood of disease severity. In recent years, machine learning has gained widespread application in medical research, demonstrating robust predictive performance (27–29). Several studies have also examined the application of machine learning in forecasting CAP outcomes (7, 30, 31). However, these investigations have predominantly utilized a narrow range of machine learning algorithms and have focused primarily on predicting mortality. Physicians should, however, consider strategies for the early identification of potentially severe pneumonia patients. To address the limitations of previous research, this study has developed survival models for patients and predictive models for assessing the severity of the risk. Nine machine learning algorithms—namely, SuperPC, PlsRocx, Elastic Net, Ridge, Lasso, stepwise Cox, Random Survival Forests (RSF), and Gradient Boosting Machine (GBM)—were applied to both training and validation cohorts to facilitate optimal model selection. The results indicated that SuperPC exhibited strong predictive performance with a training cohort C-index of 0.784 and a validation cohort C-index of 0.935, averaging at 0.86 (Figure 5A). Consequently, it was chosen as the superior prognostic model. The variables included in the prognostic model were presented in Supplementary Table S3. Additionally, in order to identify severe patients earlier, we utilized 12 common machine learning algorithms (RF, GBM, Stepglm, Lasso, Enet, Glmboost, LDA, Ridge, plsRglm, xgboost, naivebayes, and SVM) to construct a predictive model for severe pneumonia. The results indicate that the random forest algorithm demonstrated the highest predictive performance in both the training cohort and the validation cohort (training cohort C-index: 0.998, validation cohort C-index: 0.794, average C-index: 0.896, Figure 5B). The variables encompassed in this model are also detailed in Supplementary Table S3. In this study, we conducted a rigorous evaluation of ourmodels' performance through a comparative analysis with conventional evaluationmetrics by examining their Receiver Operating Characteristic (ROC) curves (see Figures 6C–H). Remarkably, the machine learning approaches we employed demonstrated superior performance to traditional evaluation criteria, not only within the training cohort but also in the validation cohort and meta cohort (see Supplementary Figure S10). This finding underscores the potential of machine learning methodologies in enhancing predictive accuracy in this context. Furthermore, we leveraged a transcriptome database related to CAP, GSE188309, which includes data from 198 patients (refer to Supplementary Tables S4 and S5 for details) (20, 32). Using Single Sample Gene Set Enrichment Analysis (ssGSEA), an algorithm frequently utilized for assessing immune infiltration (33), we analyzed the GSE188309 dataset and identified differences in activated CD4+ T cell levels between survivors and nonsurvivors (see Supplementary Figure S11). This underscores the significance of CD4+ T cells as a crucial variable in our models. Surprisingly, CD4+ T cells were incorporated into both the prognostic and predictive models, highlighting their critical role in forecasting the severity and clinical outcomes for patients with CAP. Additionally, to validate the performance of our models, we compared their Receiver Operating Characteristic (ROC) curves with those derived from conventional evaluation criteria. Collectively, our results bolster the credibility of using machine learning to predict patient prognosis.

Figure 5 Heatmap dipicted C-index of various machine learning method in training and validation cohort for patients’ outcome (A) and pneumonia severity (B).
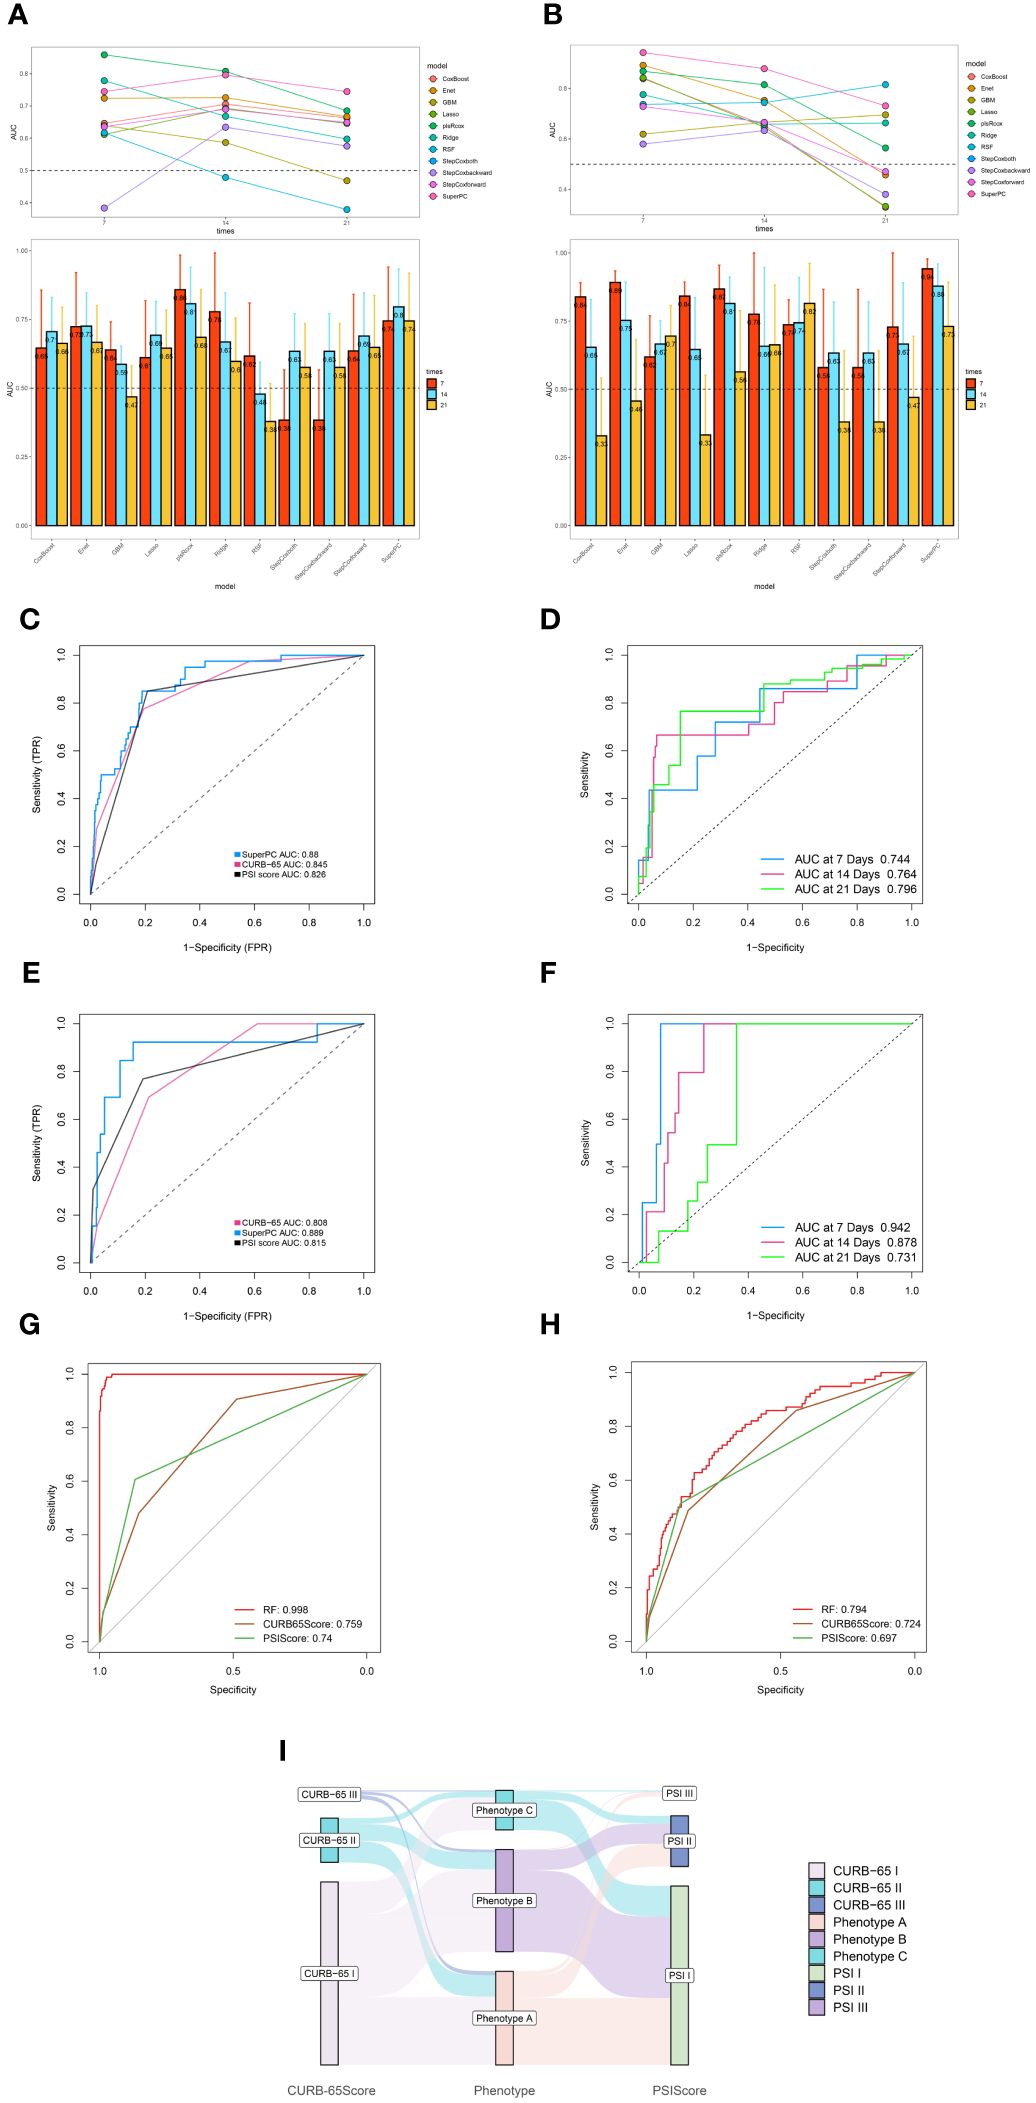
Figure 6 Robust performance of machine learning algorithm. (A) Time dependent bar and line graph of 9 machine learning methods at 7 days, 14days, and 21 days in training cohort. (B) Time dependent bar and line graph of 9 machine learning methods at 7 days, 14days, and 21 days in validation cohort. (C) The performance of SuperPC method and conventional PSI and CURB-65 evaluation criteria in training cohort. (D) Time dependent ROC curve of SuperPC method at 7 days, 14 days, 21 days in training cohort. (E) The performance of SuperPC method and conventional PSI and CURB-65 evaluation criteria in validation cohort. (F) Time dependent ROC curve of SuperPC method at 7 days, 14 days, 21 days in validation cohort. The performance of Random forest method and conventional PSI and CURB-65 evaluation criteria in training (G) and validation (H) cohort for predicting severe pneumonia. (I) Sankey plot illustrated the relationship between immune phenotypes and conventional pneumonia severity index (PSI) and CURB-65 evaluation criteria in Training cohort.
In this investigation, we identified and substantiated three distinct immune phenotypes through dual clustering techniques, analyzing data from 1,165 hospitalized patients with CAP. Phenotype C emerged as indicative of a poorer prognosis, lengthier hospitalization, and an increased need for assisted ventilation. Moreover, the study employed over 20 machine-learning algorithms to forecast both the prognosis and severity of CAP.
Current literature includes descriptions of phenotypes in patients with ARDS and sepsis. In their work, Calfee et al. identified two distinct ARDS phenotypes through latent class analysis (LCA), employing biomarkers and clinical data in a retrospective examination of two randomized controlled trials (RCTs) (34). Similarly, Christopher W. Seymour and colleagues (11) delineated four sepsis phenotypes, establishing correlations between host-response patterns and clinical outcomes via retrospective analysis. The secretion of inflammatory cytokines and the modulation of immune cell activity are critical in the pathogenesis of SCAP. Consequently, assessment of the immune phenotype in individuals with CAP can enable clinicians to more accurately distinguish patients at risk of progressing to SCAP. In a study conducted by Raul M. Mackenzie (35), a cohort of 217 hospitalized CAP patients underwent evaluation of lymphocyte subsets, inflammatory mediators, and immunoglobulin subclasses, revealing a distinctive lymphopenicCAP profile. This profile, characterized by diminished CD4+ lymphocytes, elevated inflammatory responses, and reduced IgG2 concentrations, was associated with increased disease severity upon admission and a poorer overall prognosis. Notwithstanding these findings, the study was limited by a relatively small sample size and predominantly included immunocompetent patients. By contrast, our research encompasses a broader demographic and a significantly larger sample size, thus providing a more comprehensive understanding of the immunological landscape in CAP. This study aimed to delineate immune phenotypes that correlate with the prognosis of patients with CAP. Analysis of 31 immunological and inflammatory parameters was conducted through unsupervised clustering, employing the “Consensus clustering” algorithm. We identified three distinct CAP immune phenotypes: Phenotype A emerged as the least severe, characterized by the lowest deviations in laboratory markers and organ function. In stark contrast, Phenotype C represented the most critical illness phenotype, marked by an increased frequency of ICU admissions and prevalence among elderly patients. Phenotype B represented an intermediate level of severity. The early detection of Phenotype C is thus crucial for improving outcomes in SCAP patients. Intriguingly, these immunophenotypes could not be completely accounted for by traditional severity scores such as the PSI and CURB-65. Most patients with low PSI and CURB-65 scores were classified under Phenotypes A and B; however, a minority presented with the high-risk Phenotype C. Therefore, incorporating immunophenotyping into the assessment offers a valuable tool for the early recognition of high-risk patients, who score low on CURB-65 and PSI indices, significantly contributing to the enhancement of their clinical prognosis.
Although immune phenotypes offer valuable insights, they do not achieve the prognostic precision of predictive models. To assess the reliability of immune phenotypes in real-world clinical contexts, we examined the association between immune phenotype classification and clinical outcomes. Our findings indicated that the three deduced immune phenotypes exhibited significant disparities across all primary and secondary outcomes measured. Notably, patients categorized within Phenotype C experienced poorer prognostic outcomes compared to those with Phenotypes A and B. These observations underscore the utility of immune phenotype classification for prognostic evaluation in patients with CAP.
Multiple studies have demonstrated the efficacy of ML in enhancing mortality predictions for patients with CAP. Cilloniz et al. reported that an adapted SeF model employing ML exhibited promise in augmenting the accuracy of mortality predictions for CAP patients within the context of a derivation-validation retrospective study (6). Despite such advancements, research on prognostic models for CAP that incorporate immunological markers remains scarce. In our investigation, we performed an analysis of data derived from the immunological laboratory indicators of CAP patients. Our findings indicate that the prognostic model established via the SuperPC algorithm demonstrates a robust predictive capability. When juxtaposed with existing models, such as CURB-65 and PSI, our model achieves a comparable mean C-index, suggesting its utility as an adjunctive tool for the clinical assessment of CAP patients. Our research not only corroborates the existing literature regarding CAP patient prognosis but also extends the analysis to encompass the likelihood of the severity of the disease. In evaluating 12 different ML algorithms, we ascertained that the Random Forest algorithm delivers a superior mean C-index, which signifies a more potent predictive performance specifically for patients with SCAP.
Lymphocytopenia has been acknowledged as an independent risk factor for adverse outcomes in patients with CAP (36). The cause of lymphocytopenia is unknown, although several causes have been proposed, such as increased apoptosis, limitations in the host immune system’s mobilization of these cells, or compartmentation at the site of infection ADDIN EN.CITE (35). Variations in lymphocyte subsets, particularly in CD4 T cells, have been implicated in the immunopathogenesis of CAP. Indeed, alterations in CD4 T cells have been associated with increased disease severity, particularly in the elderly and frail patient populations (37, 38). Our study corroborates these findings by demonstrating the prognostic and predictive significance of CD4 T cell changes. Furthermore, an analysis of the GSE188309 dataset reinforced the observation of a discernible difference in the activation levels of CD4 T cells between survivors and non-survivors of CAP. These results underscore the pivotal role of CD4 T cells in forecasting clinical outcomes and determining disease severity in CAP patients. At present, the mechanism of CD4 T cells participating in CAP is complex and not completely clear. More studies are focused on the mechanism of CD4+T cells in pneumonia caused by viral infection, especially pneumonia caused by SARS-CoV-2. CD4+T cells can differentiate into a range of helper and effector cell types, thereby exerting antiviral capabilities. Virus-specific CD4+ T cells differentiate into Th1 cells and T follicular help-er cells (Tfh). Th1 cells have antiviral activity by producing IFNγ and related cytokines. Specific circulating Tfh cells (cTfh) are produced during acute SARS-CoV-2 infection (39). A study by Liu et al. analyzed the lymphocyte subsets of COVID-19-associated pneumonia and CAP and showed that CD16+CD56+%, CD4+/CD8+ ratio, CD19+, and CD3+CD4+ independently predicted differentiation of COVID-19 and CAP. CD3+CD4+ and CD3+CD8+ counts were independent predictors of disease severity (40).
For pneumonia caused by other pathogens, regulatory CD4+CD25+ T cells were found to suppress respiratory inflammation by promoting IL-17 and IFN-γ responses in a mouse model of mycoplasma pneumonia (41). However, the exact mechanisms underlying these observations in our study warrant comprehensive investigation through basic experimental research.
Our study’s principal finding demonstrates that evaluating immunological parameters upon hospital admission assists in stratifying CAP patients into three distinct immune phenotypes. Moreover, these immune phenotypes show a strong correlation with patient prognoses. We also discerned significant predictive capabilities within the SuperPC algorithm, suggesting its utility as an ancillary tool for assessing CAP. Notably, our investigation constitutes the most extensive analysis of CAP clinical phenotypes to date. An additional strength of this study is its breadth; rather than focusing on CAP related to specific pathogens, it encompasses a comprehensive evaluation of the immunophenotypes across the spectrum of CAP. This approach allows for patient classification and tailored intervention prior to the confirmation of precise etiologic agents, offering crucial guidance, especially for cases where pathogen identification proves challenging. Moreover, the rigorous application of inclusion and exclusion criteria enhances the applicability of our findings, rendering the results of significant relevance to the broader patient population.
Our study possesses several limitations. Firstly, its scope is confined to a single center, which may not be representative of broader populations, in contrast to multi-center studies. Secondly, the retrospective nature of our research necessitates the implementation of a prospective study to corroborate our findings and inform future clinical practice. Looking ahead, the inclusion of a wider range of variables beyond immunological indicators will enable a more comprehensive assessment of multi-organ involvement in patients with CAP. And finally, other experiment methods for example flow mass spectrometry can be applied in figuring out the potential mechanism of CD4 T cells in CAP.
The data analyzed in this study is subject to the following licenses/restrictions: Contact corresponding author for the dataset. Requests to access these datasets should be directed Z3VveHVlanVuQHhpbmh1YW1lZC5jb20uY24=.
The studies involving humans were approved by Institutional Review Board (IRB) of Xinhua Hospital, Shanghai Jiao Tong University School of Medicine, Shanghai, China. The studies were conducted in accordance with the local legislation and institutional requirements. Written informed consent for participation was not required from the participants or the participants’ legal guardians/next of kin in accordance with the national legislation and institutional requirements.
QQ: Writing – review & editing, Writing – original draft, Visualization, Validation, Software, Resources, Project administration, Methodology, Investigation, Formal Analysis, Data curation, Conceptualization. HY: Writing – original draft, Investigation, Conceptualization. JZ: Writing – original draft, Investigation, Conceptualization. XX: Writing – review & editing, Data curation. QL: Writing – review & editing, Visualization, Conceptualization. WG: Writing – review & editing, Writing – original draft, Supervision, Software, Funding acquisition, Conceptualization. XG: Writing – review & editing, Supervision, Conceptualization.
The author(s) declare financial support was received for the research, authorship, and/or publication of this article. This work received funding from the Shanghai Science and Technology Commission (Grant No. 22Y11901700).
The authors declare that the research was conducted in the absence of any commercial or financial relationships that could be construed as a potential conflict of interest.
All claims expressed in this article are solely those of the authors and do not necessarily represent those of their affiliated organizations, or those of the publisher, the editors and the reviewers. Any product that may be evaluated in this article, or claim that may be made by its manufacturer, is not guaranteed or endorsed by the publisher.
The Supplementary Material for this article can be found online at: https://www.frontiersin.org/articles/10.3389/fimmu.2024.1441838/full#supplementary-material
Supplementary Table 1 | Characteristics and outcomes of patients divided by immune phenotypes in validation cohort.
Supplementary Table 2 | Characteristics and outcomes of patients divided by immune phenotypes in meta cohort.
Supplementary Table 3 | Features incorporated in prognostic and diagnostic model.
Supplementary Table 4 | Expression matrix of GSE188309.
Supplementary Table 5 | Clinical information of GSE188309.
Supplementary Figure 1 | Graphic flowchart of this research.
Supplementary Figure 2 | Visualization of clustering and dimensionality reduction results of training cohort. (A) Nbclust method illustrated the optimal groups of training cohort was three. (B) Principal Component Analysis (PCA) method successfully divided CAP patients into three distinct immune phenotypes. (C) Uniform Manifold Approximation and Projection (UMAP) method successfully divided CAP patients into three distinct immune phenotypes. Patients with phenotype B are represented by a yellow dot, the blue dots represent patients belong to phenotype and those with phenotype C by a purple dot.
Supplementary Figure 3 | Consensus Clustering and dimensionality reduction visualization in validation cohort. (A) Identification of three immune phenotypes of community acquired pneumonia (CAP) patients by consensus clustering. (B) Cumulative distribution function (CDF) curve illustrated consensus distribution for each phenotype. (C) Visualization of Nbclust method in determining optimal clusters of CAP patients. (D) T-distributed stochastic neighbor embedding(t-SNE) method successfully divided CAP patients into three distinct immune phenotypes. (E) Uniform Manifold Approximation and Projection (UMAP) method successfully divided CAP patients into three distinct immune phenotypes. (F) Principal Component Analysis (PCA) method successfully divided CAP patients into three distinct immune phenotypes.
Supplementary Figure 4 | Consensus Clustering and dimensionality reduction visualization in meta cohort. (A) Identification of three immune phenotypes of community acquired pneumonia(CAP) patients by consensus clustering. (B) Cumulative distribution function(CDF) curve illustrated consensus distribution for each phenotype. (C) Visualization of Nbclust method in determining optimal clusters of CAP patients. (D) T-distributed stochastic neighbor embedding(t-SNE) method successfully divided CAP patients into three distinct immune phenotypes. (E) Uniform Manifold Approximation and Projection(UMAP) method successfully divided CAP patients into three distinct immune phenotypes. (F) Principal Component Analysis (PCA) method successfully divided CAP patients into three distinct immune phenotypes.
Supplementary Figure 5 | Primary and secondary outcomes among three distinct immune phenotypes in validation cohort. (A) Survival curves for various phenotype patients during their hospitalization. (B) Survival curves for various phenotype patients over 28 days. Blue line represents Phenotype A patients, red for Phenotype B patients, and green for Phenotype C patients. Phenotype A had a better prognosis than those in Phenotype A and C (P<0.05).Phenotype C CAP patients experience extended hospital stays (C), prolonged ventilation days (D), ICU stays (F) and fewer ICU-free days (E) in comparison to patients with the other two phenotypes. Green represents Phenotype A patients, light blue for Phenotype B patients, and dark blue for Phenotype C patients. CAP patients in Patients with phenotype C comprise a greater proportion of patients requiring assisted ventilation (G) and those with severe pneumonia (H). Differences are observed in patient composition with respect to ventilation and the presence of severe pneumonia. P<0.001.
Supplementary Figure 6 | Primary and secondary outcomes among three distinct immune phenotypes in meta cohort. (A) Survival curves for various phenotype patients during their hospitalization. (B) Survival curves for various phenotype patients over 28 days. Blue line represents Phenotype A patients, red for Phenotype B patients, and green for Phenotype C patients. Phenotype A had a better prognosis than those in Phenotype A and C (P<0.05).Phenotype C CAP patients experience extended hospital stays (C), prolonged ventilation days (D), ICU stays (F) and fewer ICU-free days (E) in comparison to patients with the other two phenotypes. Green represents Phenotype A patients, light blue for Phenotype B patients, and dark blue for Phenotype C patients. CAP patients in Patients with phenotype C comprise a greater proportion of patients requiring assisted ventilation (G) and those with severe pneumonia (H). Differences are observed in patient composition with respect to ventilation and the presence of severe pneumonia. P<0.001.
Supplementary Figure 7 | Association and variation between clinical immunological indicators and three phenotypes. Chord diagram (A-D) of the association between clinical immunological variables and each phenotype in validation cohort. Different phenotypes were shown in different colors: phenotype A is purple, phenotype B is blue, and phenotype C is green. Rank plot (E-G) of variable mean among various phenotypes in training cohort. Variables were normalized by mean and standard error.
Supplementary Figure 8 | Association and variation between clinical immunological indicators and three phenotypes. Chord diagram (A-D) of the association between clinical immunological variables and each phenotype in meta cohort. Different phenotypes were shown in different colors: phenotype A is purple, phenotype B is blue, and phenotype C is green. Rank plot (E-G) of variable mean among various phenotypes in training cohort. Variables were normalized by mean and standard error.
Supplementary Figure 9 | Sankey plot illustrated the relationship between immune phenotypes and conventional pneumonia severity index (PSI) and CURB-65 evaluation criteria in validation (A) cohort and meta cohort (B).
Supplementary Figure 10 | Robust performance of machine learning algorithm. (A) The performance of riskscore and conventional PSI and CURB-65 evaluation criteria in meta cohort. (B) Time dependent ROC curve of riskscore method at 7 days, 14 days, 21 days in meta cohort. (C) The performance of Random forest method and conventional PSI and CURB-65 evaluation criteria in meta cohort.
Supplementary Figure 11 | The immune infiltration landscape of patients with community acquired pneumonia. (A) Box plot illustrated different types of immune cell between alive and deceased CAP patients. (B) Cellular interaction of immune cell types. Positive correlation is indicated in red and negative correlation in blue.
CAP, Community-acquired pneumonia; ML, Machine learning; SCAP: Severe community-acquired pneumonia; MV, mechanical ventilation; IRVS, intensive respiratory or vasopressor support; IDSA, Infectious Diseases Society of America; ATS, American Thoracic Society; ARDS, Acute respiratory distress syndrome; t-SNE, t-distributed Stochastic Neighbor Embedding; PCA, Principal Component Analysis; UMAP, Uniform Manifold Approximation and Projection; CDF, Cumulative distribution function; ROC, Receiver Operating Characteristic; IRB, Institutional Review Board; ARDS, Acute Respiratory Distress Syndrome; RCT, Randomized Controlled Trial.
1. Phua J, Dean NC, Guo Q, Kuan WS, Lim HF, Lim TK. Severe community-acquired pneumonia: timely management measures in the first 24 hours. Crit Care (London England). (2016) 20:237. doi: 10.1186/s13054-016-1414-2
2. Torres A, Chalmers J, Dela Cruz C, Dominedò C, Kollef M, Martin-Loeches I, et al. Challenges in severe community-acquired pneumonia: a point-of-view review. Intensive Care Med. (2019) 45:159–71. doi: 10.1007/s00134-019-05519-y
3. Peyrani P, Arnold FW, Bordon J, Furmanek S, Luna CM, Cavallazzi R, et al. Incidence and mortality of adults hospitalized with community-acquired pneumonia according to clinical course. Chest. (2020) 157:34–41. doi: 10.1016/j.chest.2019.09.022
4. Zhang ZX, Yong Y, Tan WC, Shen L, Ng HS, Fong KY. Prognostic factors for mortality due to pneumonia among adults from different age groups in Singapore and mortality predictions based on PSI and CURB-65. Singapore Med J. (2018) 59:190–8. doi: 10.11622/smedj.2017079
5. Parsonage M, Nathwani D, Davey P, Barlow G. Evaluation of the performance of CURB-65 with increasing age. Clin Microbiol infection. (2009) 15:858–64. doi: 10.1111/j.1469-0691.2009.02908.x
6. Cilloniz C, Ward L, Mogensen M, Pericàs J, Méndez R, Gabarrús A, et al. Machine-learning model for mortality prediction in patients with community-acquired pneumonia: development and validation study. Chest. (2023) 163:77–88. doi: 10.1016/j.chest.2022.07.005
7. Jeon E, Lee H, Park T, Jin K, Ryu B, Lee H, et al. Machine learning-based prediction of in-ICU mortality in pneumonia patients. Sci Rep. (2023) 13:11527. doi: 10.1038/s41598-023-38765-8
8. Zhixiao X, Kun G, Weiwei C, Jingwen L, Chengshui C. Performance of machine learning algorithms for predicting adverse outcomes in community-acquired pneumonia. Front Bioeng Biotechnol. (2022) 10:903426. doi: 10.3389/fbioe.2022.903426
9. Aliberti S, Brambilla AM, Chalmers JD, Cilloniz C, Ramirez J, Bignamini A, et al. Phenotyping community-acquired pneumonia according to the presence of acute respiratory failure and severe sepsis. Respir Res. (2014) 15(1):27. doi: 10.1186/1465-9921-15-27
10. Ning L, Shishi Z, Bo W, Huiqing L. Targeting immunometabolism against acute lung injury. Clin Immunol. (2023) 249:109289. doi: 10.1016/j.clim.2023.109289
11. Seymour C, Kennedy J, Wang S, Chang C, Elliott C, Xu Z, et al. Derivation, validation, and potential treatment implications of novel clinical phenotypes for sepsis. JAMA. (2019) 321:2003–17. doi: 10.1001/jama.2019.5791
12. Chen Q, Pan T, Wang Y, Schoepf U, Bidwell S, Qiao H, et al. A coronary CT angiography radiomics model to identify vulnerable plaque and predict cardiovascular events. Radiology. (2023) 307:e221693. doi: 10.1148/radiol.221693
13. Zhang Z. Multiple imputation with multivariate imputation by chained equation (MICE) package. Ann Trans Med. (2016) 4:30. doi: 10.3978/j.issn.2305-5839.2015.12.63
14. Liang W, Liang H, Ou L, Chen B, Chen A, Li C, et al. Development and validation of a clinical risk score to predict the occurrence of critical illness in hospitalized patients with COVID-19. JAMA Internal Med. (2020) 180:1081–9. doi: 10.1001/jamainternmed.2020.2033
15. Mueller Y, Schrama T, Ruijten R, Schreurs M, Grashof D, van de Werken H, et al. Stratification of hospitalized COVID-19 patients into clinical severity progression groups by immuno-phenotyping and machine learning. Nat Commun. (2022) 13:915. doi: 10.1038/s41467-022-28621-0
16. Liu Z, Liu L, Weng S, Guo C, Dang Q, Xu H, et al. Machine learning-based integration develops an immune-derived lncRNA signature for improving outcomes in colorectal cancer. Nat Commun. (2022) 13:816. doi: 10.1038/s41467-022-28421-6
17. Dam T, Roggeveen L, van Diggelen F, Fleuren L, Jagesar A, Otten M, et al. Predicting responders to prone positioning in mechanically ventilated patients with COVID-19 using machine learning. Ann Intensive Care. (2022) 12:99. doi: 10.1186/s13613-022-01070-0
18. Wei Q, Chen Z, Tang Y, Chen W, Zhong L, Mao L, et al. External validation and comparison of MR-based radiomics models for predicting pathological complete response in locally advanced rectal cancer: a two-centre, multi-vendor study. Eur radiology. (2023) 33:1906–17. doi: 10.1007/s00330-022-09204-5
19. Li X, Zhang H, Zhao S, Tang K. Predicting risky sexual behavior among college students through machine learning approaches: cross-sectional analysis of individual data from 1264 universities in 31 provinces in China. JMIR Public Health surveillance. (2023) 9:e41162. doi: 10.2196/41162
20. Viasus D, Simonetti AF, Nonell L, Vidal O, Meije Y, Ortega L, et al. Whole-blood gene expression profiles associated with mortality in community-acquired pneumonia. Biomedicines. (2023) 11(2):429. doi: 10.3390/biomedicines11020429
21. Viasus D, Del Rio-Pertuz G, Simonetti A, Garcia-Vidal C, Acosta-Reyes J, Garavito A, et al. Biomarkers for predicting short-term mortality in community-acquired pneumonia: A systematic review and meta-analysis. J infection. (2016) 72:273–82. doi: 10.1016/j.jinf.2016.01.002
22. Cerda-Mancillas M, Santiago-Germán D, Andrade-Bravo B, Pedraza-Olivares F, Valenzo-Hernández F, Leaños-Miranda A, et al. D-dimer as A biomarker of severity and adverse outcomes in patients with community acquired pneumonia. Arch Med Res. (2020) 51:429–35. doi: 10.1016/j.arcmed.2020.04.014
23. Artero A, Madrazo M, Fernández-Garcés M, Muiño Miguez A, González García A, Crestelo Vieitez A, et al. Severity scores in COVID-19 pneumonia: a multicenter, retrospective, cohort study. J Gen Internal Med. (2021) 36:1338–45. doi: 10.1007/s11606-021-06626-7
24. Peña J, Rascón-Pacheco R, Ascencio-Montiel I, González-Figueroa E, Fernández-Gárate J, Medina-Gómez O, et al. Hypertension, diabetes and obesity, major risk factors for death in patients with COVID-19 in Mexico. Arch Med Res. (2021) 52:443–9. doi: 10.1016/j.arcmed.2020.12.002
25. Zhang H, Zang C, Xu Z, Zhang Y, Xu J, Bian J, et al. Data-driven identification of post-acute SARS-CoV-2 infection subphenotypes. Nat Med. (2023) 29:226–35. doi: 10.1038/s41591-022-02116-3
26. Wang B, Li Y, Tian Y, Ju C, Xu X, Pei S. Novel pneumonia score based on a machine learning model for predicting mortality in pneumonia patients on admission to the intensive care unit. Respir Med. (2023) 217:107363. doi: 10.1016/j.rmed.2023.107363
27. Balch J, Chen U, Liesenfeld O, Starostik P, Loftus T, Efron P, et al. Defining critical illness using immunological endotypes in patients with and without sepsis: a cohort study. Crit Care. (2023) 27:292. doi: 10.1186/s13054-023-04571-x
28. Guan C, Ma F, Chang S, Zhang J. Interpretable machine learning models for predicting venous thromboembolism in the intensive care unit: an analysis based on data from 207 centers. Crit Care. (2023) 27:406. doi: 10.1186/s13054-023-04683-4
29. Evrard B, Woillard J, Legras A, Bouaoud M, Gourraud M, Humeau A, et al. Diagnostic, prognostic and clinical value of left ventricular radial strain to identify paradoxical septal motion in ventilated patients with the acute respiratory distress syndrome: an observational prospective multicenter study. Crit Care. (2023) 27:424. doi: 10.1186/s13054-023-04716-y
30. Zhao Y, Zhang R, Zhong Y, Wang J, Weng Z, Luo H, et al. Statistical analysis and machine learning prediction of disease outcomes for COVID-19 and pneumonia patients. Front Cell infection Microbiol. (2022) 12:838749. doi: 10.3389/fcimb.2022.838749
31. Chen S, Zhou Z, Wang Y, Chen S, Jiang J. Machine learning-based identification of cuproptosis-related markers and immune infiltration in severe community-acquired pneumonia. Clin Respir J. (2023) 17:618–28. doi: 10.1111/crj.13633
32. Li W, Liu P, Liu H, Zhang F, Fu Y. Integrative analysis of genes reveals endoplasmic reticulum stress-related immune responses involved in dilated cardiomyopathy with fibrosis. Apoptosis. (2023) 28:1406–21. doi: 10.1007/s10495-023-01871-z
33. Mo S, Jin B, Tseng Y, Lin L, Lin L, Shen X, et al. A precise molecular subtyping of ulcerative colitis reveals the immune heterogeneity and predicts clinical drug responses. J Trans Med. (2023) 21:466. doi: 10.1186/s12967-023-04326-w
34. Calfee C, Delucchi K, Parsons P, Thompson B, Ware L, Matthay M. Subphenotypes in acute respiratory distress syndrome: latent class analysis of data from two randomised controlled trials. Lancet Respir Med. (2014) 2:611–20. doi: 10.1016/S2213-2600(14)70097-9
35. Méndez R, Menéndez R, Amara-Elori I, Feced L, Piró A, Ramírez P, et al. Lymphopenic community-acquired pneumonia is associated with a dysregulated immune response and increased severity and mortality. J infection. (2019) 78:423–31. doi: 10.1016/j.jinf.2019.04.006
36. Bermejo-Martin J, Cilloniz C, Mendez R, Almansa R, Gabarrus A, Ceccato A, et al. Lymphopenic community acquired pneumonia (L-CAP), an immunological phenotype associated with higher risk of mortality. EBioMedicine. (2017) 24:231–6. doi: 10.1016/j.ebiom.2017.09.023
37. Wang J, Pei L, Zhao T, Liu X, Wang Q, Zhang S, et al. CD4 T cells related to disease severity in elderly and frailty community-acquired pneumonia patients: A retrospective cohort study. Immunity Inflammation disease. (2023) 11:e1009. doi: 10.1002/iid3.1009
38. Bian L, Bi Y, Zhou S, Chen Z, Wen J, Shi J, et al. T cell responses in senior patients with community-acquired pneumonia related to disease severity. Exp Cell Res. (2017) 361:56–62. doi: 10.1016/j.yexcr.2017.09.041
39. Alessandro S, Shane C. Adaptive immunity to SARS-CoV-2 and COVID-19. Cell. (2021) 184(4):861–80. doi: 10.1016/j.cell.2021.01.007
40. Guohong L, Xianghu J, Xiaojiao Z, Yunbao P, Haibo X. Analysis of lymphocyte subpopulations and cytokines in COVID-19-associated pneumonia and community-acquired pneumonia. J Immunol Res. (2021) 2021:6657894. doi: 10.1155/2021/6657894
Keywords: community-acquired pneumonia, immune phenotype, machine learning, unsupervised clustering, risk stratification
Citation: Qin Q, Yu H, Zhao J, Xu X, Li Q, Gu W and Guo X (2024) Machine learning-based derivation and validation of three immune phenotypes for risk stratification and prognosis in community-acquired pneumonia: a retrospective cohort study. Front. Immunol. 15:1441838. doi: 10.3389/fimmu.2024.1441838
Received: 31 May 2024; Accepted: 05 July 2024;
Published: 24 July 2024.
Edited by:
Ping Yuan, Tongji University, ChinaReviewed by:
Lan Jiang, First Affiliated Hospital of Wannan Medical College, ChinaCopyright © 2024 Qin, Yu, Zhao, Xu, Li, Gu and Guo. This is an open-access article distributed under the terms of the Creative Commons Attribution License (CC BY). The use, distribution or reproduction in other forums is permitted, provided the original author(s) and the copyright owner(s) are credited and that the original publication in this journal is cited, in accordance with accepted academic practice. No use, distribution or reproduction is permitted which does not comply with these terms.
*Correspondence: Wen Gu, Z3V3ZW5AeGluaHVhbWVkLmNvbS5jbg==; Xuejun Guo, Z3VveHVlanVuQHhpbmh1YW1lZC5jb20uY24=
†These authors have contributed equally to this work
Disclaimer: All claims expressed in this article are solely those of the authors and do not necessarily represent those of their affiliated organizations, or those of the publisher, the editors and the reviewers. Any product that may be evaluated in this article or claim that may be made by its manufacturer is not guaranteed or endorsed by the publisher.
Research integrity at Frontiers
Learn more about the work of our research integrity team to safeguard the quality of each article we publish.