 Lin Liu1
 Hua Fan
- 1Department of Hematology, The Forth Affiliated Hospital of China Medical University, Shenyang, China
- 2Department of Breast Surgery, The First Affiliated Hospital of China Medical University, Shenyang, China
Background: Chimeric antigen receptor T cell (CAR-T) is a promising treatment for aggressive Non-Hodgkin lymphoma (NHL). The aim of the meta-analysis was to determine the association between metabolic tumor volumes (MTV) derived on positron emission tomography before CAR-T infusion and the survival of patients with NHL.
Methods: Relevant observational studies pertaining to the purpose of the meta-analysis were obtained through a search of PubMed, Web of Science, and Embase from inception of the databases to April 1, 2024. The data was combined using a random-effects model that accounted for the potential influence of between-study heterogeneity.
Results: Fifteen observational studies were included. Pooled results showed that compared to those with a lower MTV, the NHL patients with a higher MTV before CAR-T infusion were associated with a poor progression-free survival (hazard ratio [HR]: 1.73, 95% confidence interval [CI]: 1.48 to 2.02, p < 0.001; I2 = 20%) and overall survival (HR: 2.11, 95% CI: 1.54 to 2.89, p < 0.001; I2 = 58%). Subgroup analysis showed that the association between MTV and survival of NHL patients after CAR-T was not significantly impacted by study design, methods for determination of MTV cutoff, or analytic models (univariate or multivariate, p for each subgroup all < 0.05). Subgroup analysis suggested a stronger association between MTV and poor survival outcomes in patients with median of lines of previous treatment of 2 or 3 as compared to those of 4 (p for subgroup difference < 0.05). Further meta-regression analyses suggested that the association between MTV and survival was not significantly affected by sample size, age, proportion of men, cutoff value of MTV, follow-up duration, or study quality scores (p all > 0.05).
Conclusion: A high MTV at baseline is associated with a poor survival of NHL patients after CAR-T.
Systematic Review Registration: https://inplasy.com/, identifier INPLASY (INPLASY202450069).
Introduction
Non-Hodgkin lymphoma (NHL) represents a heterogeneous group of lymphoid malignancies characterized by the proliferation of abnormal lymphocytes (1, 2). It ranks among the most prevalent hematologic malignancies globally, with its incidence steadily rising over the past few decades (3, 4). NHL encompasses various subtypes, each with distinct clinical features, prognoses, and treatment responses (5). While advancements in therapy have improved outcomes for many patients, the management of aggressive NHL subtypes remains challenging. Among the emerging treatment modalities, chimeric antigen receptor T cell (CAR-T) therapy has garnered significant attention for its remarkable efficacy in treating relapsed or refractory NHL (6, 7).
CAR-T therapy involves genetically modifying patients’ T cells to express chimeric antigen receptors targeting specific antigens, such as CD19, expressed on the surface of lymphoma cells (8, 9). Upon infusion back into the patient, these engineered T cells recognize and eliminate malignant cells, leading to durable remissions in a subset of patients (8, 9). Despite its unprecedented success, not all patients respond favorably to CAR-T therapy (10, 11), highlighting the need for reliable prognostic markers to identify individuals likely to benefit from treatment. In this context, metabolic tumor volume (MTV) derived from positron emission tomography (PET) imaging has emerged as a promising biomarker for predicting treatment outcomes in NHL patients undergoing CAR-T therapy (12).
PET is a non-invasive imaging modality that provides functional information about tumor metabolism (13). By measuring the metabolic activity of tumors through the uptake of radiolabeled tracers, PET imaging enables the quantification of MTV, representing the total volume of metabolically active tumor tissue (13). High MTV levels have been associated with aggressive disease biology, treatment resistance, and poor prognosis in various cancer types, including NHL (14–16). Given its ability to capture the metabolic heterogeneity of tumors, MTV derived from PET holds potential as a prognostic biomarker for identifying patients at high risk of treatment failure or disease relapse following CAR-T therapy. Therefore, this meta-analysis aims to systematically evaluate the association between MTV and survival outcomes in NHL patients treated with CAR-T therapy, providing valuable insights into risk stratification and personalized treatment approaches in this patient population.
Materials and methods
The Preferred Reporting Items for Systematic reviews and Meta-Analyses (PRISMA) statement (2020) (17, 18) was followed in this study. The Cochrane Handbook (19) for systematic review and meta-analysis was referenced throughout the study. The PRISMA Checklist of the meta-analysis is shown in Supplementary Material 1. The protocol of the study has been registered at the International Platform of Registered Systematic Review and Meta-analysis Protocols (INPLASY, https://inplasy.com/) with the registration number: INPLASY202450069.
Literature search
Three electronic databases including PubMed, Web of Science, and Embase were used for literature search with a predefined combined search term including (1) “Chimeric Antigen Receptor” OR “Chimeric Antigen Receptors” OR “Chimeric T Cell Receptors” OR “Chimeric T-Cell Receptors” OR “Chimeric Antigen Receptor T Cell” OR “CAR-T” OR “Artificial T Cell Receptors” OR “Artificial T-Cell Receptors” OR “chimeric immunoreceptors” OR “Axicabtagene ciloleucel” OR “Axi-cel” OR “KTE-C19” OR “KTEC19” OR “CTL-019” OR “CTL019” OR “Yescarta” OR “Lisocabtagene” OR “maraleucel” OR “Liso-cel” OR “JCAR-017” OR “JCAR017” OR “Breyanzi” OR “Brexucabtagene” OR “autoleucel” OR “Brexu-cel” OR “KTE-X19” OR “KTEX19” OR “Tecartus” OR “Tisagenlecleucel” OR “Tisa-cel” OR “Kymriah” OR “ART-19” OR “CART19” OR “Axicabtagene” OR “ciloleucel” OR “Idecabtagene” OR “vicleucel” OR “Ciltacabtegene” OR “autoleucel”; (2) “lymphoma” OR “non-Hodgkin lymphoma”; (3) “18F-FDG PET/CT” OR “positron emission tomography” OR “positron emission tomography-computed tomography” OR “PET-CT” OR “PET” OR “PET CT” OR “PET/CT” OR “fluorodeoxyglucose” OR “metabolic tumor volume” OR “MTV”; and (4) “survival” OR “overall survival” OR “progression-free survival” OR “OS” OR “PFS” OR “death” OR “mortality” OR “progression” OR “prognosis” OR “cohort” OR “longitudinal” OR “prospective” OR “retrospective” OR “followed” OR “follow-up”. The detailed search strategy for each database is shown in Supplementary Material 2. Only studies with human subjects and published in peer-reviewed journals in English were included. A second-round check-up for the references of the relevant articles was also conducted. The final database search was achieved on April 1, 2024.
Inclusion and exclusion criteria
Inclusion criteria:
(1) Observational studies with longitudinal follow-up published as full-length articles, such as cohort studies, nested case-control studies and post-hoc analysis of clinical trials;
(2) Studies involving adult patients with NHL who have not received CAR-T before inclusion;
(3) A PET scan (CT or MRI) was performed before CAR-T infusion, and MTV was derived from PET scan and analyzed as a categorized variable; the cutoff for defining a high versus a low MTV was consistent with the cutoffs used among the original studies;
(4) Compared the median progression-free survival (PFS) and/or overall survival (OS) after CAR-T treatment between NHL patients with a high versus a low MTV at baseline, and reported the hazard ratio (HR) and 95% confidence interval (CI) for the outcomes; or these data could be calculated or estimated from the original articles. For PFS, the outcome was defined as relapse, progression, all-cause deaths or the time of last follow-up, while for OS the outcome was defined as all-cause deaths or the time of last follow-up.
We excluded reviews, editorials, preclinical studies, cross-sectional studies, studies that included patients of Hodgkin lymphoma, without a PET scan at baseline, studies that did not measure MTV, studies of patients that did not receive CAR-T, or studies that did not report OS or PFS. In cases where there was potential overlap in patient population across multiple studies, only the study with the largest sample size was included in this analysis.
Data collection and quality assessment
Two separate authors (LL and FJ) conducted a thorough search of academic literature, performed data collection and analysis, and independently assessed the quality of the studies. Any discrepancies that arose were resolved by involving the third author (HF) in discussion for final decision-making. Data on study information, design, patient characteristics including factors such as sample size, age, sex, diagnosis, Eastern Cooperative Oncology Group performance status (ECOG PS), medians of previous lines of therapy including transplant, lymphodepletion method, treatment information (type of CAR-T), imaging used for PET scan, timing of PET scan, methods to determine cutoff of MTV, cutoff value of MTV, median follow-up duration, survival outcomes (median PFS or OS), analytic model (univariate or multivariate), and whether the studies and the researchers were industry supported were extracted. The assessment of study quality was carried out using the Newcastle-Ottawa Scale (NOS) (20), which involved scoring based on criteria including participant selection process, comparability among groups, and validity of outcomes. This scale utilized a rating system ranging from 1 to 9 stars; higher stars indicated better study quality. The certainty of evidence was evaluated with the five Grading of Recommendations Assessment, Development, and Evaluation (GRADE) considerations of within- and across-study risk of bias (limitations in the study design and execution or methodological quality), inconsistency (or heterogeneity), indirectness of evidence, and imprecision of the effect estimates and risk of publication bias (21). A summary of findings table was made for the outcomes based on the Cochrane Handbook (19).
Statistical methods
The association between baseline MTV and survival of patients with NHL after CAR-T therapy was presented as the HR and 95% CI compared between patients with a high versus low MTV before CAR-T infusion. Data of HRs and standard errors were calculated based on the 95% CIs or p values, followed by a logarithmical transformation to ensure stabilized variance and normalized distribution (19). The heterogeneity among studies was assessed using the Cochrane Q test and I2 statistic (22, 23), with I2 > 50% indicating significant statistical heterogeneity. In view of the differences of patient diagnosis, regimen of CAR-T, cutoff of MTV, and follow-up durations etc. across the included studies, significant clinical heterogeneity was deemed among these studies, and a random-effects model was used accordingly to incorporate the potential influence of heterogeneity (19). Sensitivity analysis involving exclusion of one study at a time was conducted to assess the robustness of findings (19). Subgroup analyses were performed to investigate if features such as study design, methods for determining the cutoff of MTV, analytic models, lines of previous treatment, and whether the study/researcher was industry supported could significantly affected the meta-analysis results (19). The univariate meta-regression analysis was performed to evaluate the potential influence of these variables on the outcomes, such as sample size, mean age, proportion of men, cutoff of MTV, follow-up duration, and study quality scores (19). Publication bias estimation involved constructing funnel plots initially evaluated through visual inspection for symmetricity before being analyzed using Egger’s regression test (24), where p < 0.05 indicates statistical significance. These analyses were conducted utilizing RevMan Version 5.1 from Cochrane Collaboration in Oxford, UK and Stata software version 12 from Stata Corporation in College Station, TX.
Results
Study inclusion
The process of selecting relevant studies for inclusion in the meta-analysis is depicted in Figure 1. Initially, 1037 potentially pertinent records were identified through thorough searches of three databases. Among these, 399 were removed due to duplication. Subsequent screening based on the titles and abstracts resulted in the exclusion of an additional 638 studies that did not align with the aim of the meta-analysis. The full texts of the remaining 43 records underwent independent review by two authors, leading to the removal of a further 28 studies for various reasons detailed in Figure 1. Ultimately, 15 observational studies remained and were considered suitable for subsequent quantitative analyses (25–39).
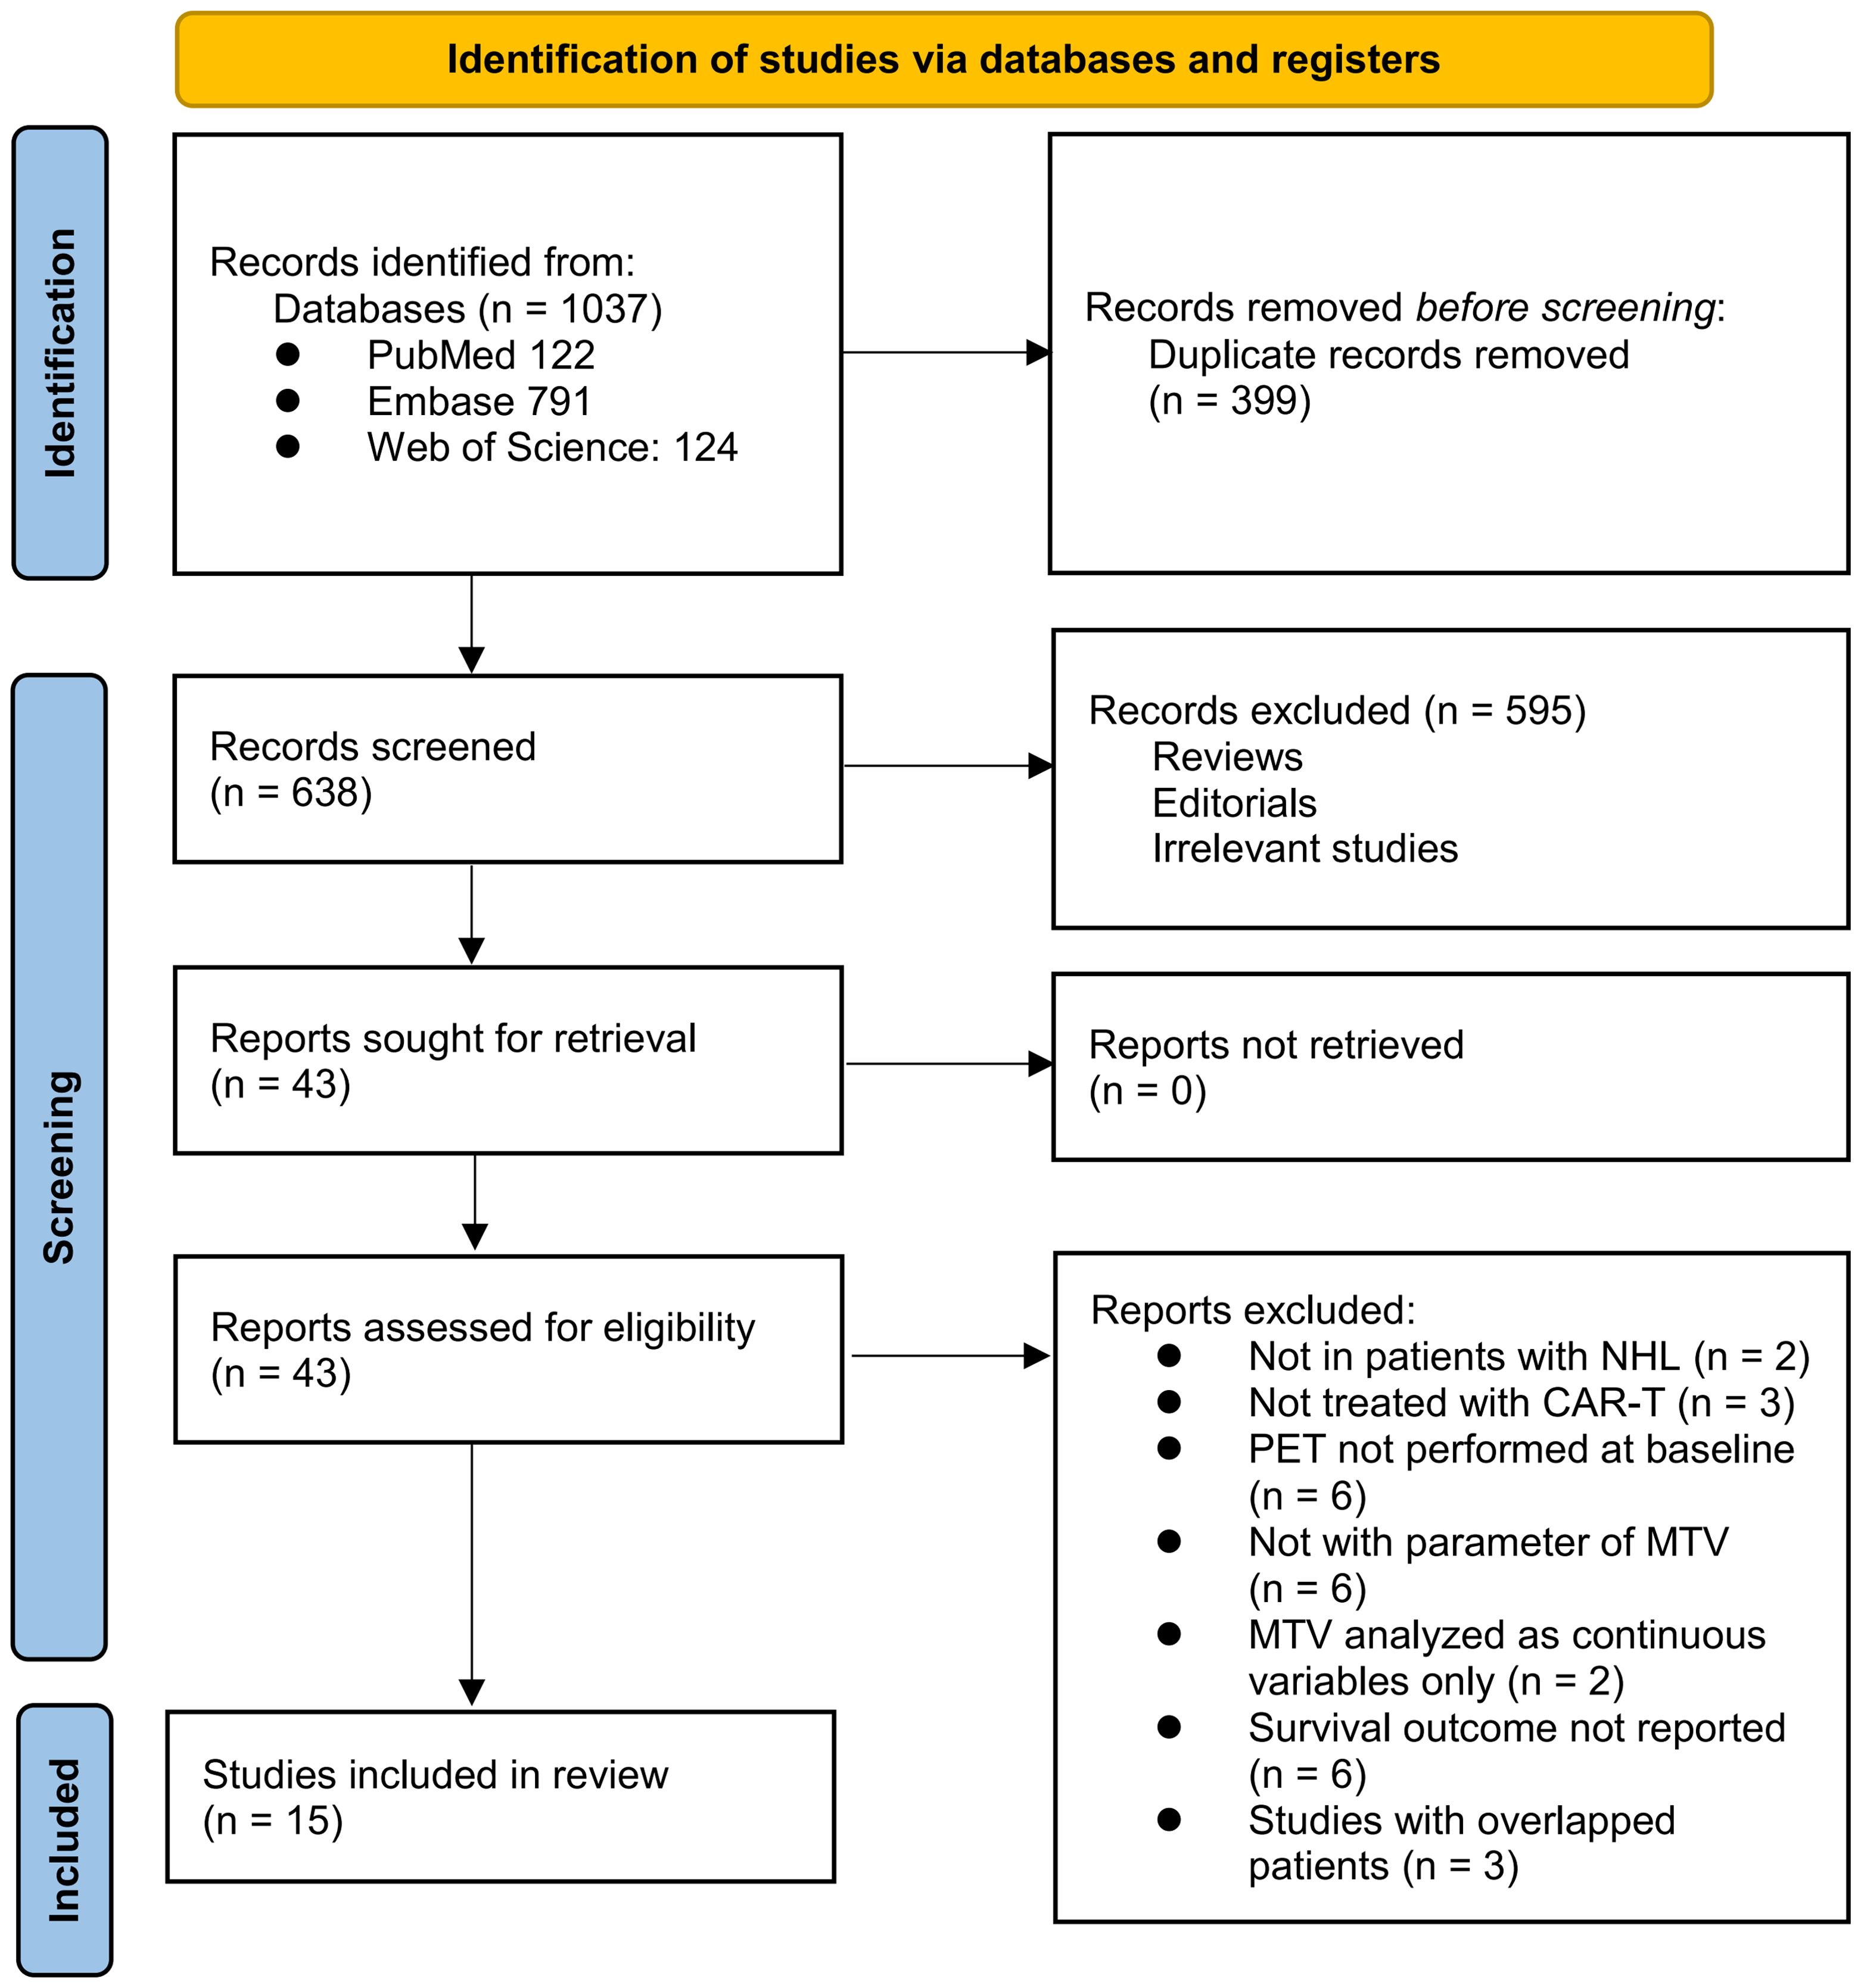
Figure 1. PRISMA flow diagram.
Overview of the studies’ characteristics
Tables 1, 2 present the summarized characteristics of the included observational studies. Overall, four prospective studies (29, 30, 32, 33), 10 retrospective studies (25–28, 31, 34, 35, 37–39), and one post-hoc analysis (36) were included in the meta-analysis. Since one (26) of the included studies involved two independent cohorts of patients with NHL, these cohorts were included in the meta-analysis separately. These studies were published between 2019 and 2024, and performed in China, the United States, France, Sweden, Germany, Italy, Spain, and the Netherlands. All of the studies included patients with NHL, mostly of patients with relapsed or refractory large B-cell lymphoma. The sample size of the included study was generally small, varying from 16 to 175. The mean ages of the patients were 43 to 67 years, and the proportions of men varying between 44.0 to 76.9%. The median of previous lines of treatment was reported in seven studies, with 2 in one study (37), 3 in three studies (26, 31, 39), and 4 in another three studies (25, 28, 29). The methods of lymphodepletion were reported in eight studies, all of which were with fludarabine and cyclophosphamide (25–27, 29–32, 36). All of the included patients received the CAR-T treatment, with axicabtagene ciloleucel, tisagenlecleucel, brexucabtagene autoleucel, or lisocabtagene maraleucel. The PET scan was performed before CAR-T infusion, and the cutoff of MTV was determine by the medians of MTV in nine studies (25–30, 32, 33, 36), and via the Receiver Operating Characteristic (ROC) analysis in six studies (31, 34, 35, 37–39). The cutoff values for determining the high versus low MTV varied between 7.1 to 450 mL. The median follow-up duration was 7.7 to 42.6 months. The endpoint of PFS was reported in 15 cohorts (26–39), and the endpoint of OS was reported in 13 cohorts (25–27, 29–31, 33–35, 37–39). The univariate regression model was used in 11 cohorts (25, 27–30, 32, 34, 35, 37–39) in analyzing the association between MTV and survival outcome, while multivariate model was used in five cohorts (26, 31, 33, 36). Ten of the included studies or their researchers were industry supported (26, 28–33, 36, 38, 39), while five of them were not (25, 27, 34, 35, 37). The NOS of the included studies were five to nine stars, suggesting overall moderate to good study quality (Table 3).
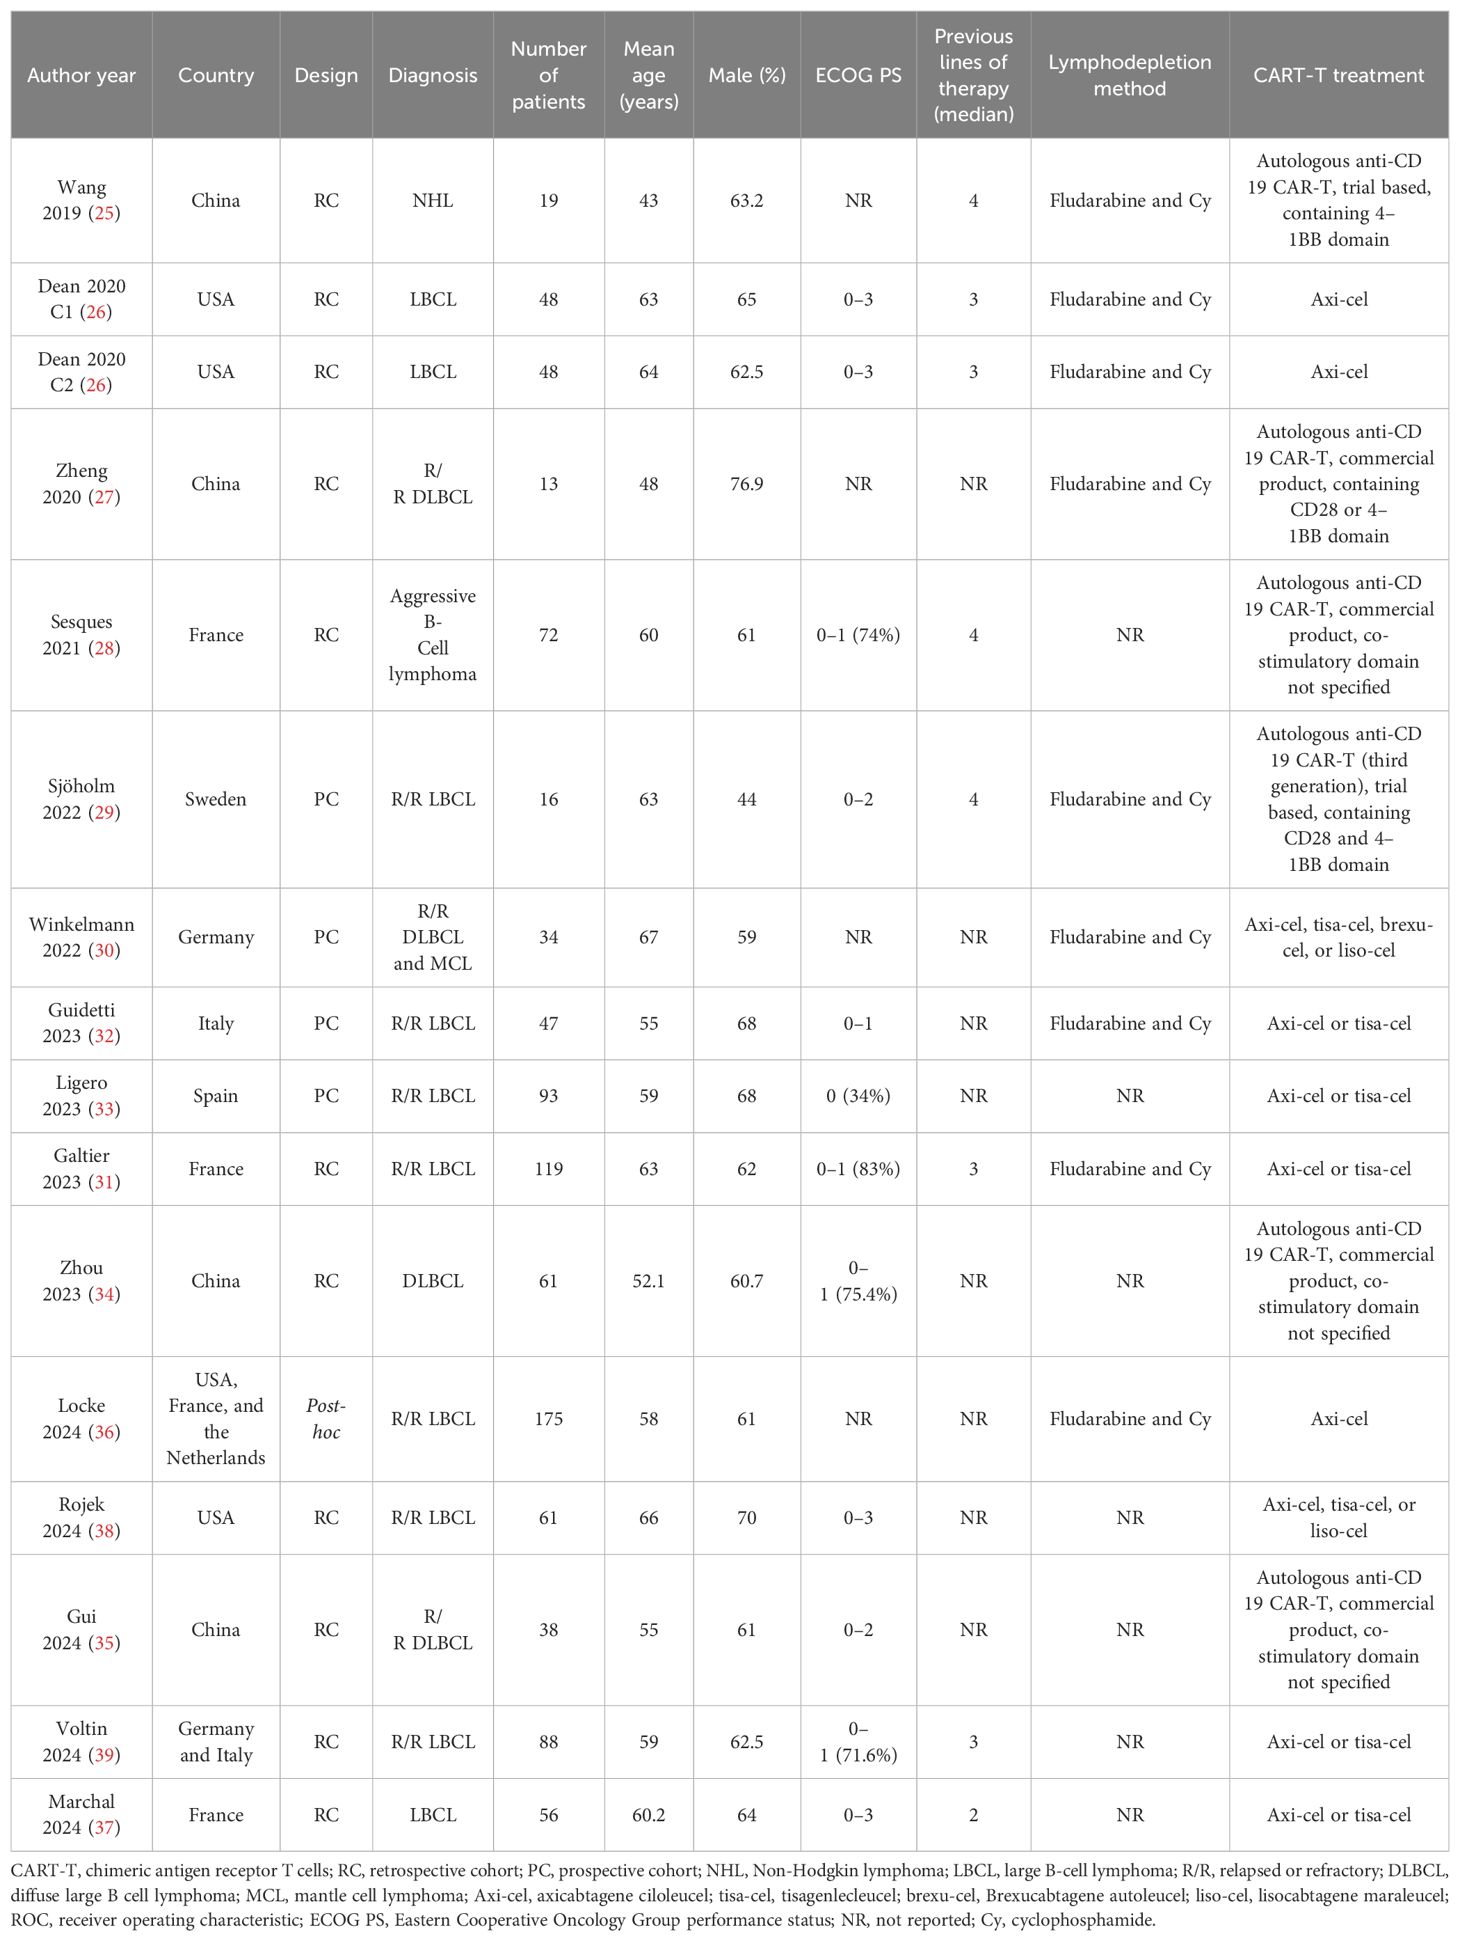
Table 1. Patient and treatment characteristics of the included studies.
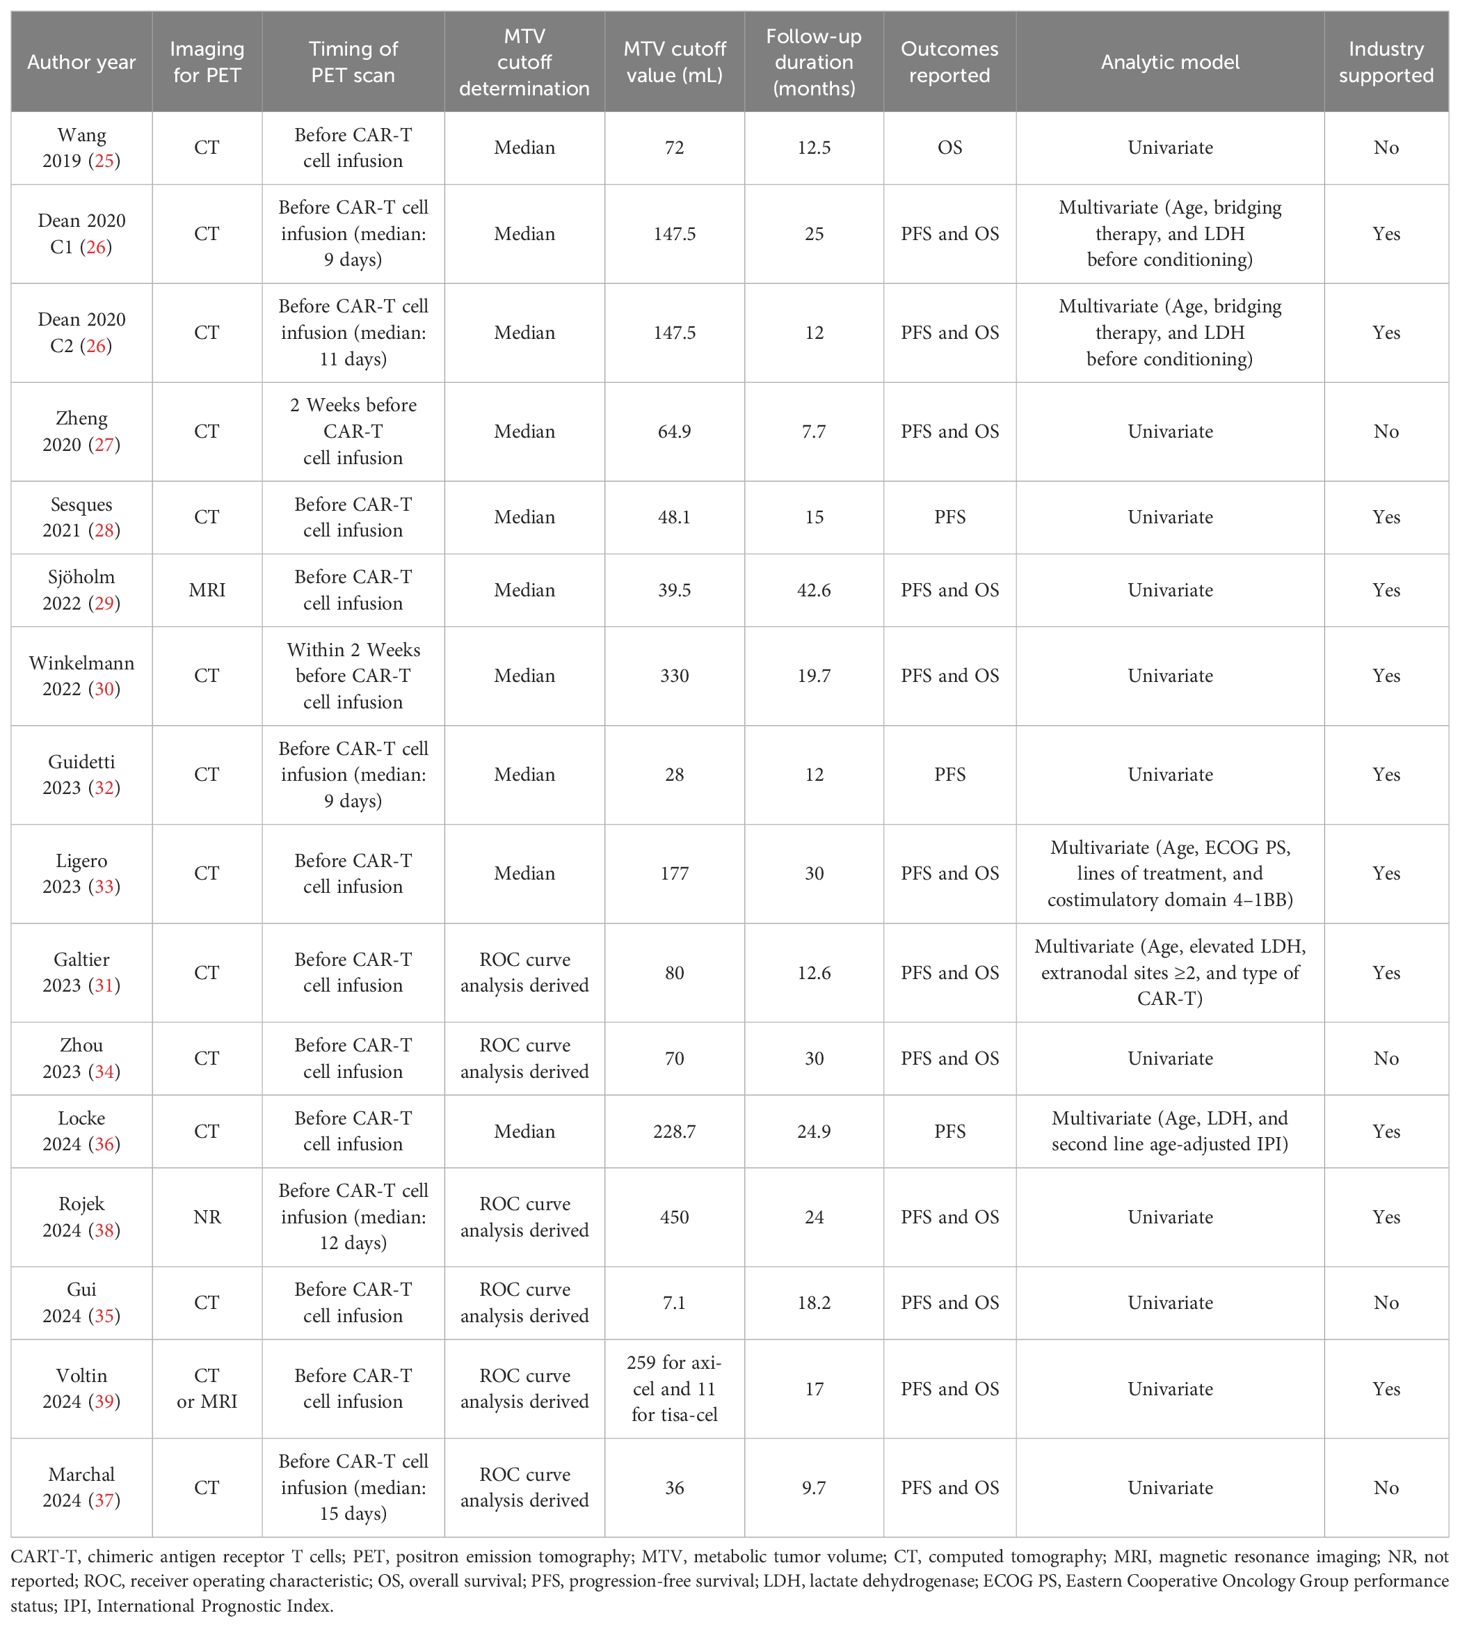
Table 2. PET imaging and follow-up characteristics of the included studies.
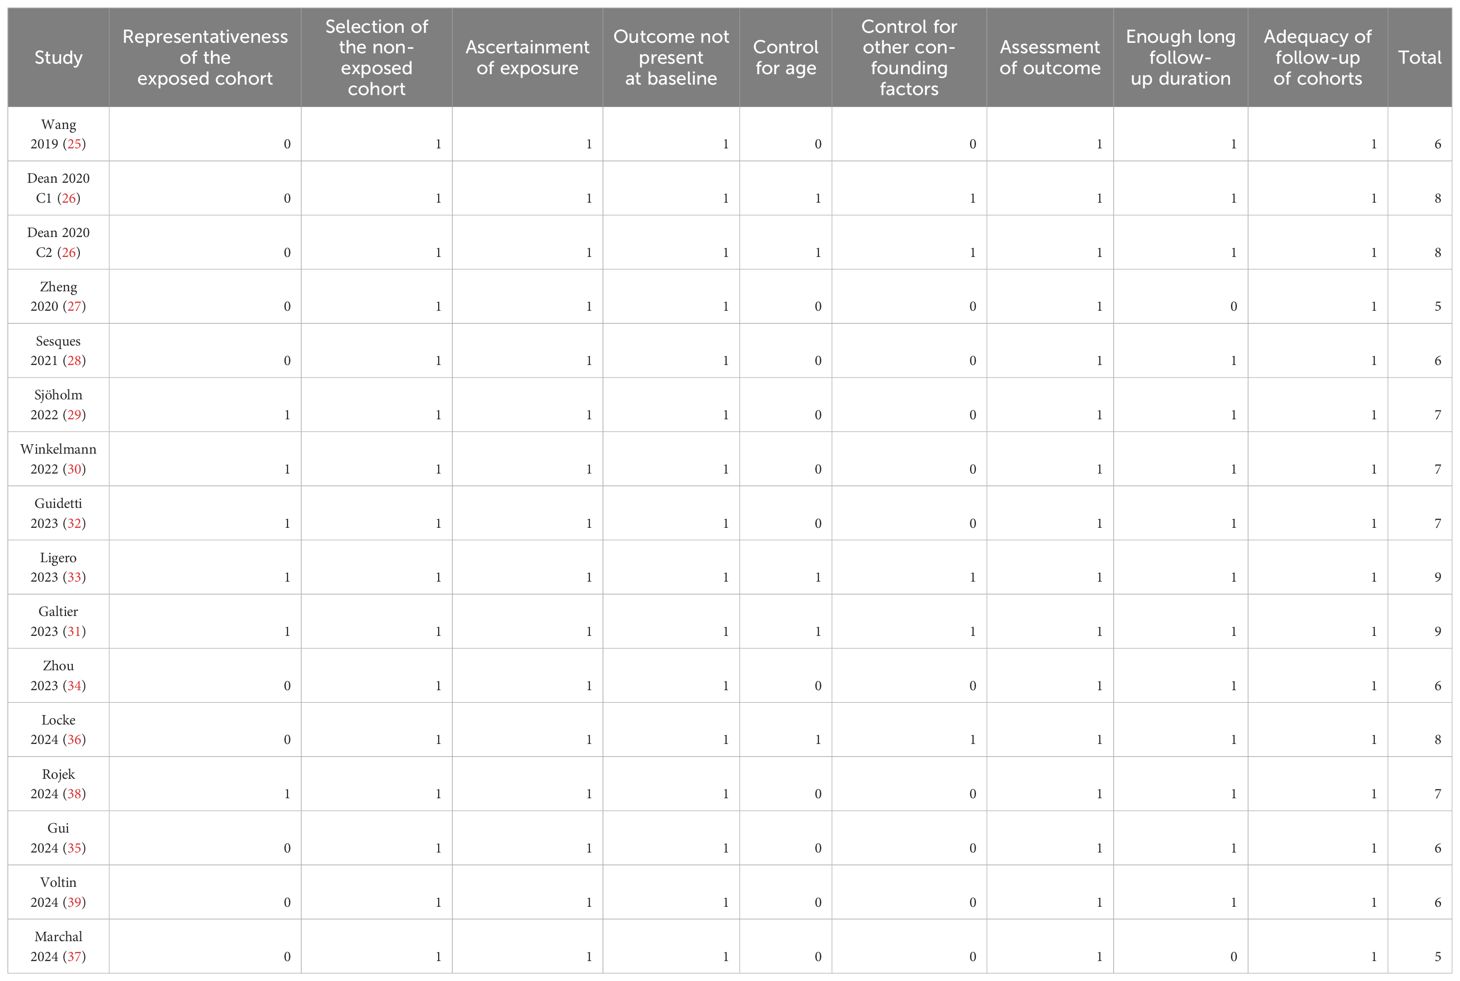
Table 3. Study quality evaluation via the Newcastle-Ottawa Scale.
Meta-analysis for the association between MTV and PFS after CAR-T
Pooled results of 15 cohorts from 14 studies (26–39) suggested that compared to patients with a lower MTV at baseline, the NHL patients with a higher MTV before CAR-T infusion were associated with a poor PFS (HR: 1.73, 95% CI: 1.48 to 2.02, p < 0.001; I2 = 20%; Figure 2A) with a high certainty of evidence (Table 4). Results of the “leave-one-out” sensitivity analyses showed similar results (HR: 1.66 to 1.79, p all < 0.001; Table 5). In addition, sensitivity analysis limited to studies using lymphodepletion with fludarabine and cyclophosphamide showed similar results (HR: 1.71, 95% CI: 1.37 to 2.13, p < 0.001; I2 = 22%).
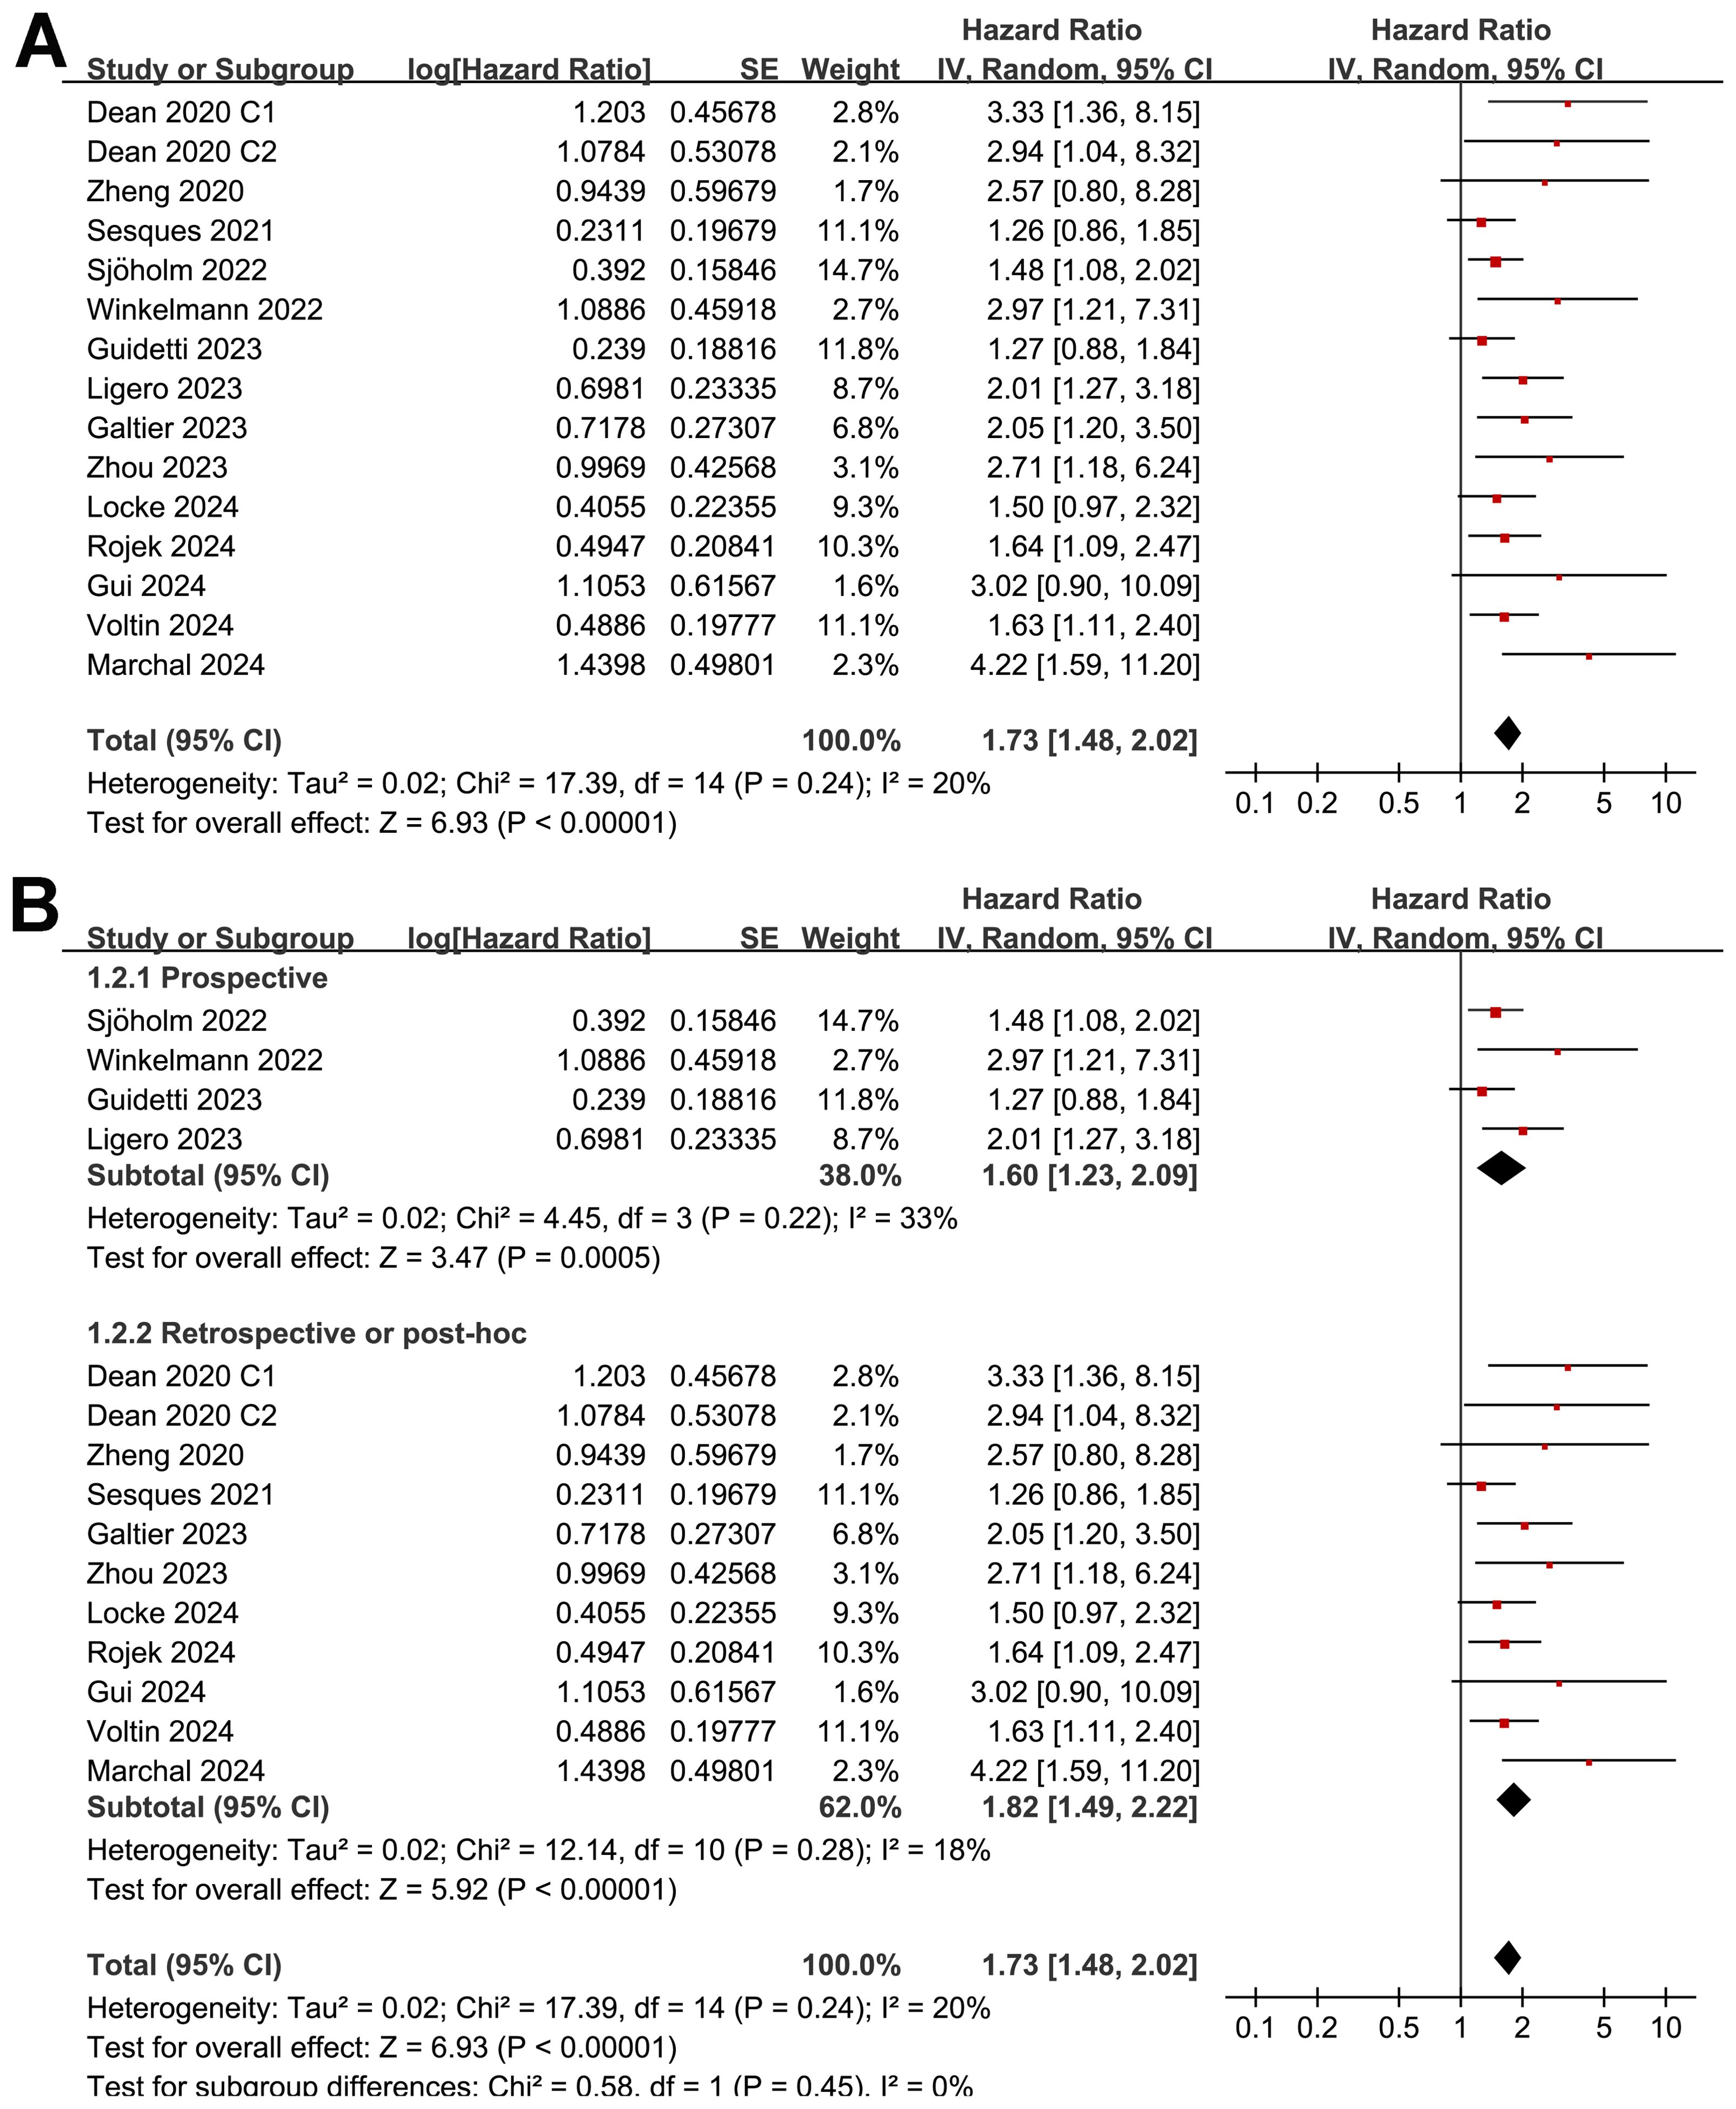
Figure 2. Forest plots for the meta-analysis of the association between MTV at baseline and PFS of NHL patients after CAR-T therapy; (A), forest plots for the overall meta-analysis; and (B), forest plots for the subgroup analysis according to study design.
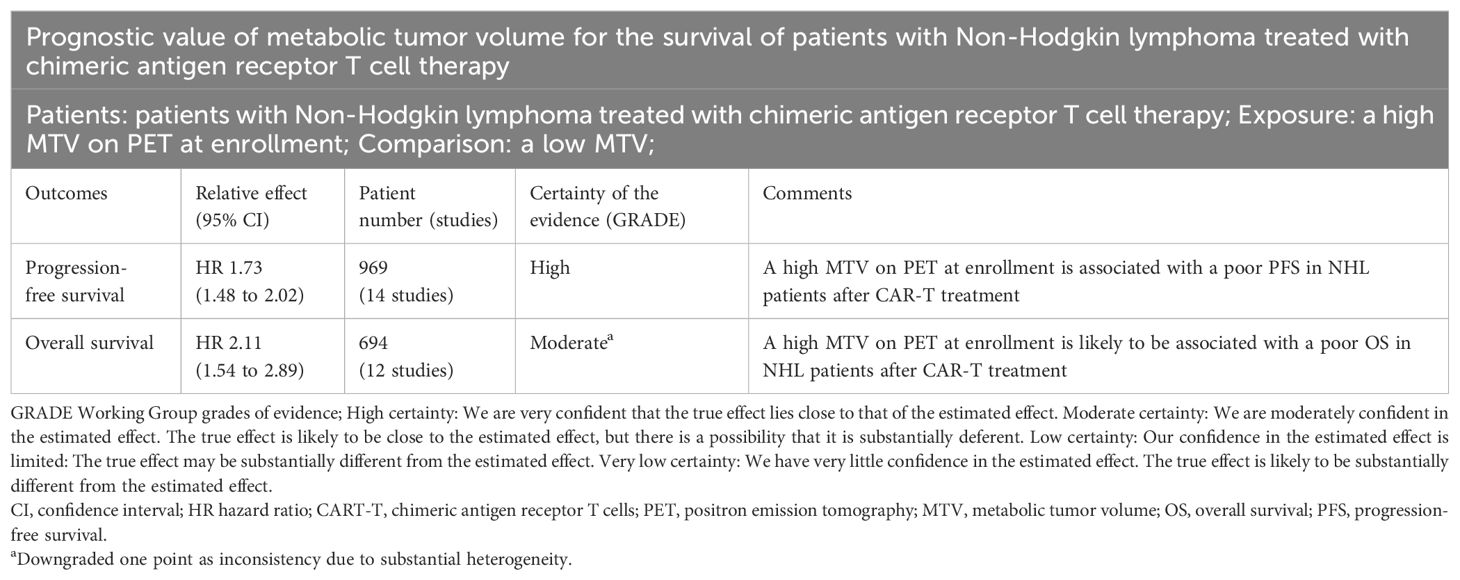
Table 4. Summary of findings.
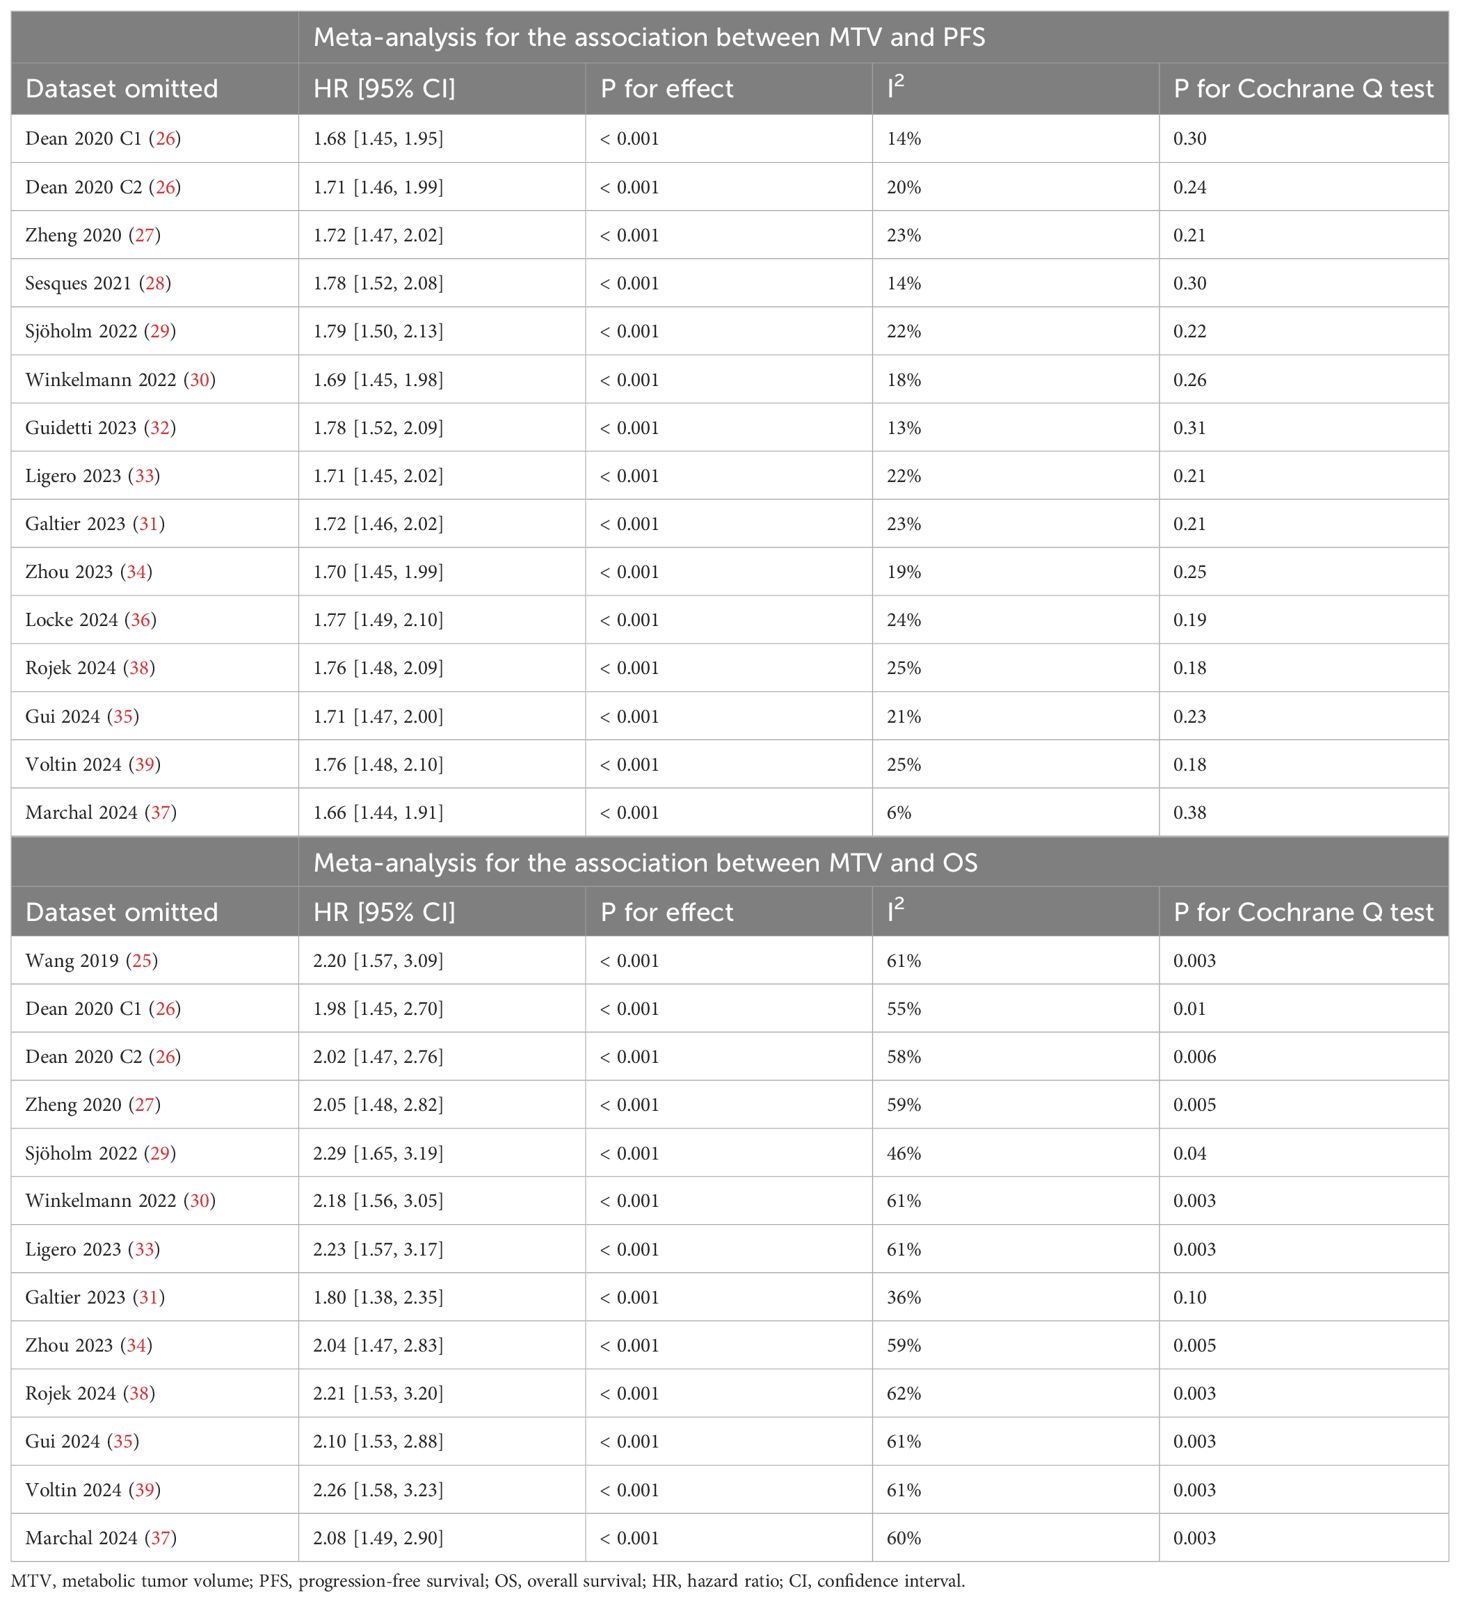
Table 5. Sensitivity analysis by excluding one dataset at a time for the association between MTV and survival outcomes.
The subgroup analysis showed that the association between MTV and the PFS of NHL patients after CAR-T was consistent in prospective and retrospective/post-hoc studies (HR: 1.60 versus 1.82, p for subgroup difference = 0.45; Figure 2B), in studies with cutoff of MTV determined by the median or ROC curve analysis (HR: 1.62 versus 1.90, p for subgroup difference = 0.30; Figure 3A), and in studies with univariate and multivariate analyses (HR: 1.64 versus 1.95, p for subgroup difference = 0.29; Figure 3B). Interestingly, a stronger association between MTV and PFS was observed for patients with median of lines of previous treatment of 2 or 3 as compared to those of 4 (HR: 2.20 versus 1.39, p for subgroup difference = 0.03; Figure 4A). In addition, a stronger association between MTV and PFS was also observed in non-industry supported studies as compared to industry supported studies (HR: 3.08 versus 1.61, p for subgroup difference = 0.02; Figure 4B).
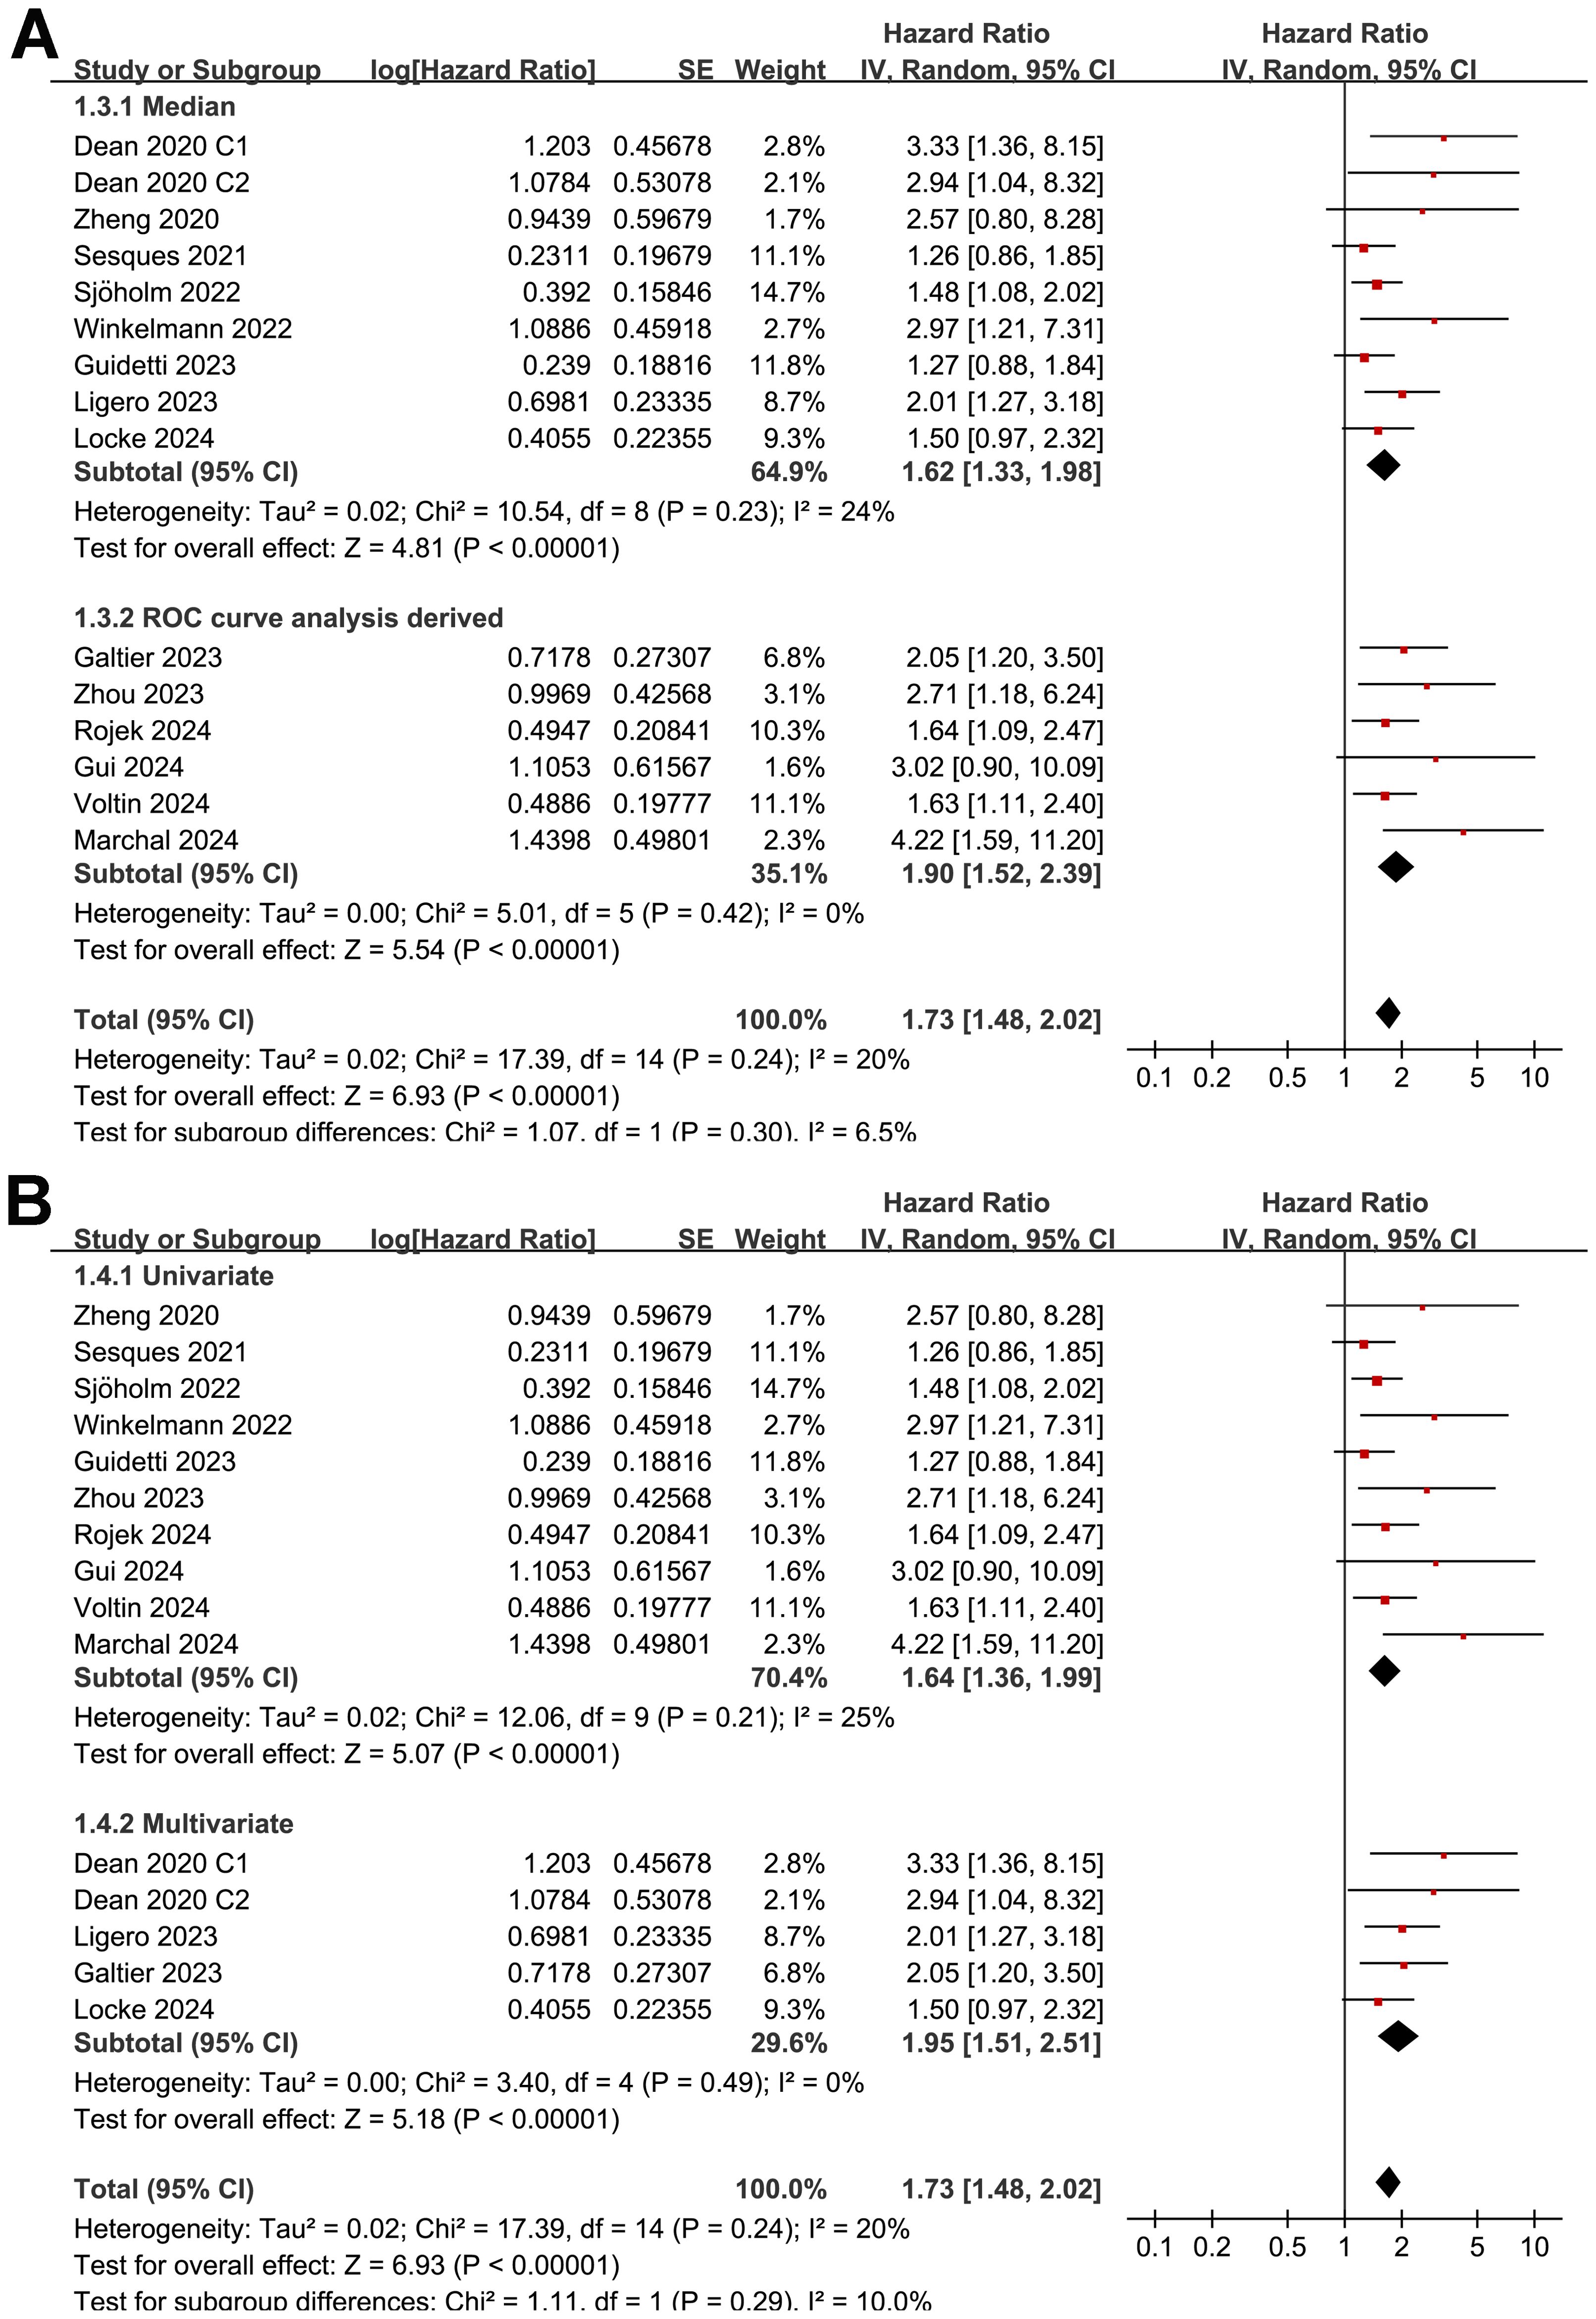
Figure 3. Forest plots for the subgroup analysis of the association between MTV at baseline and PFS of NHL patients after CAR-T therapy; (A), forest plots for the subgroup analysis according to the methods for determining the cutoff of MTV; and (B), forest plots for the subgroup analysis according to the analytic models.
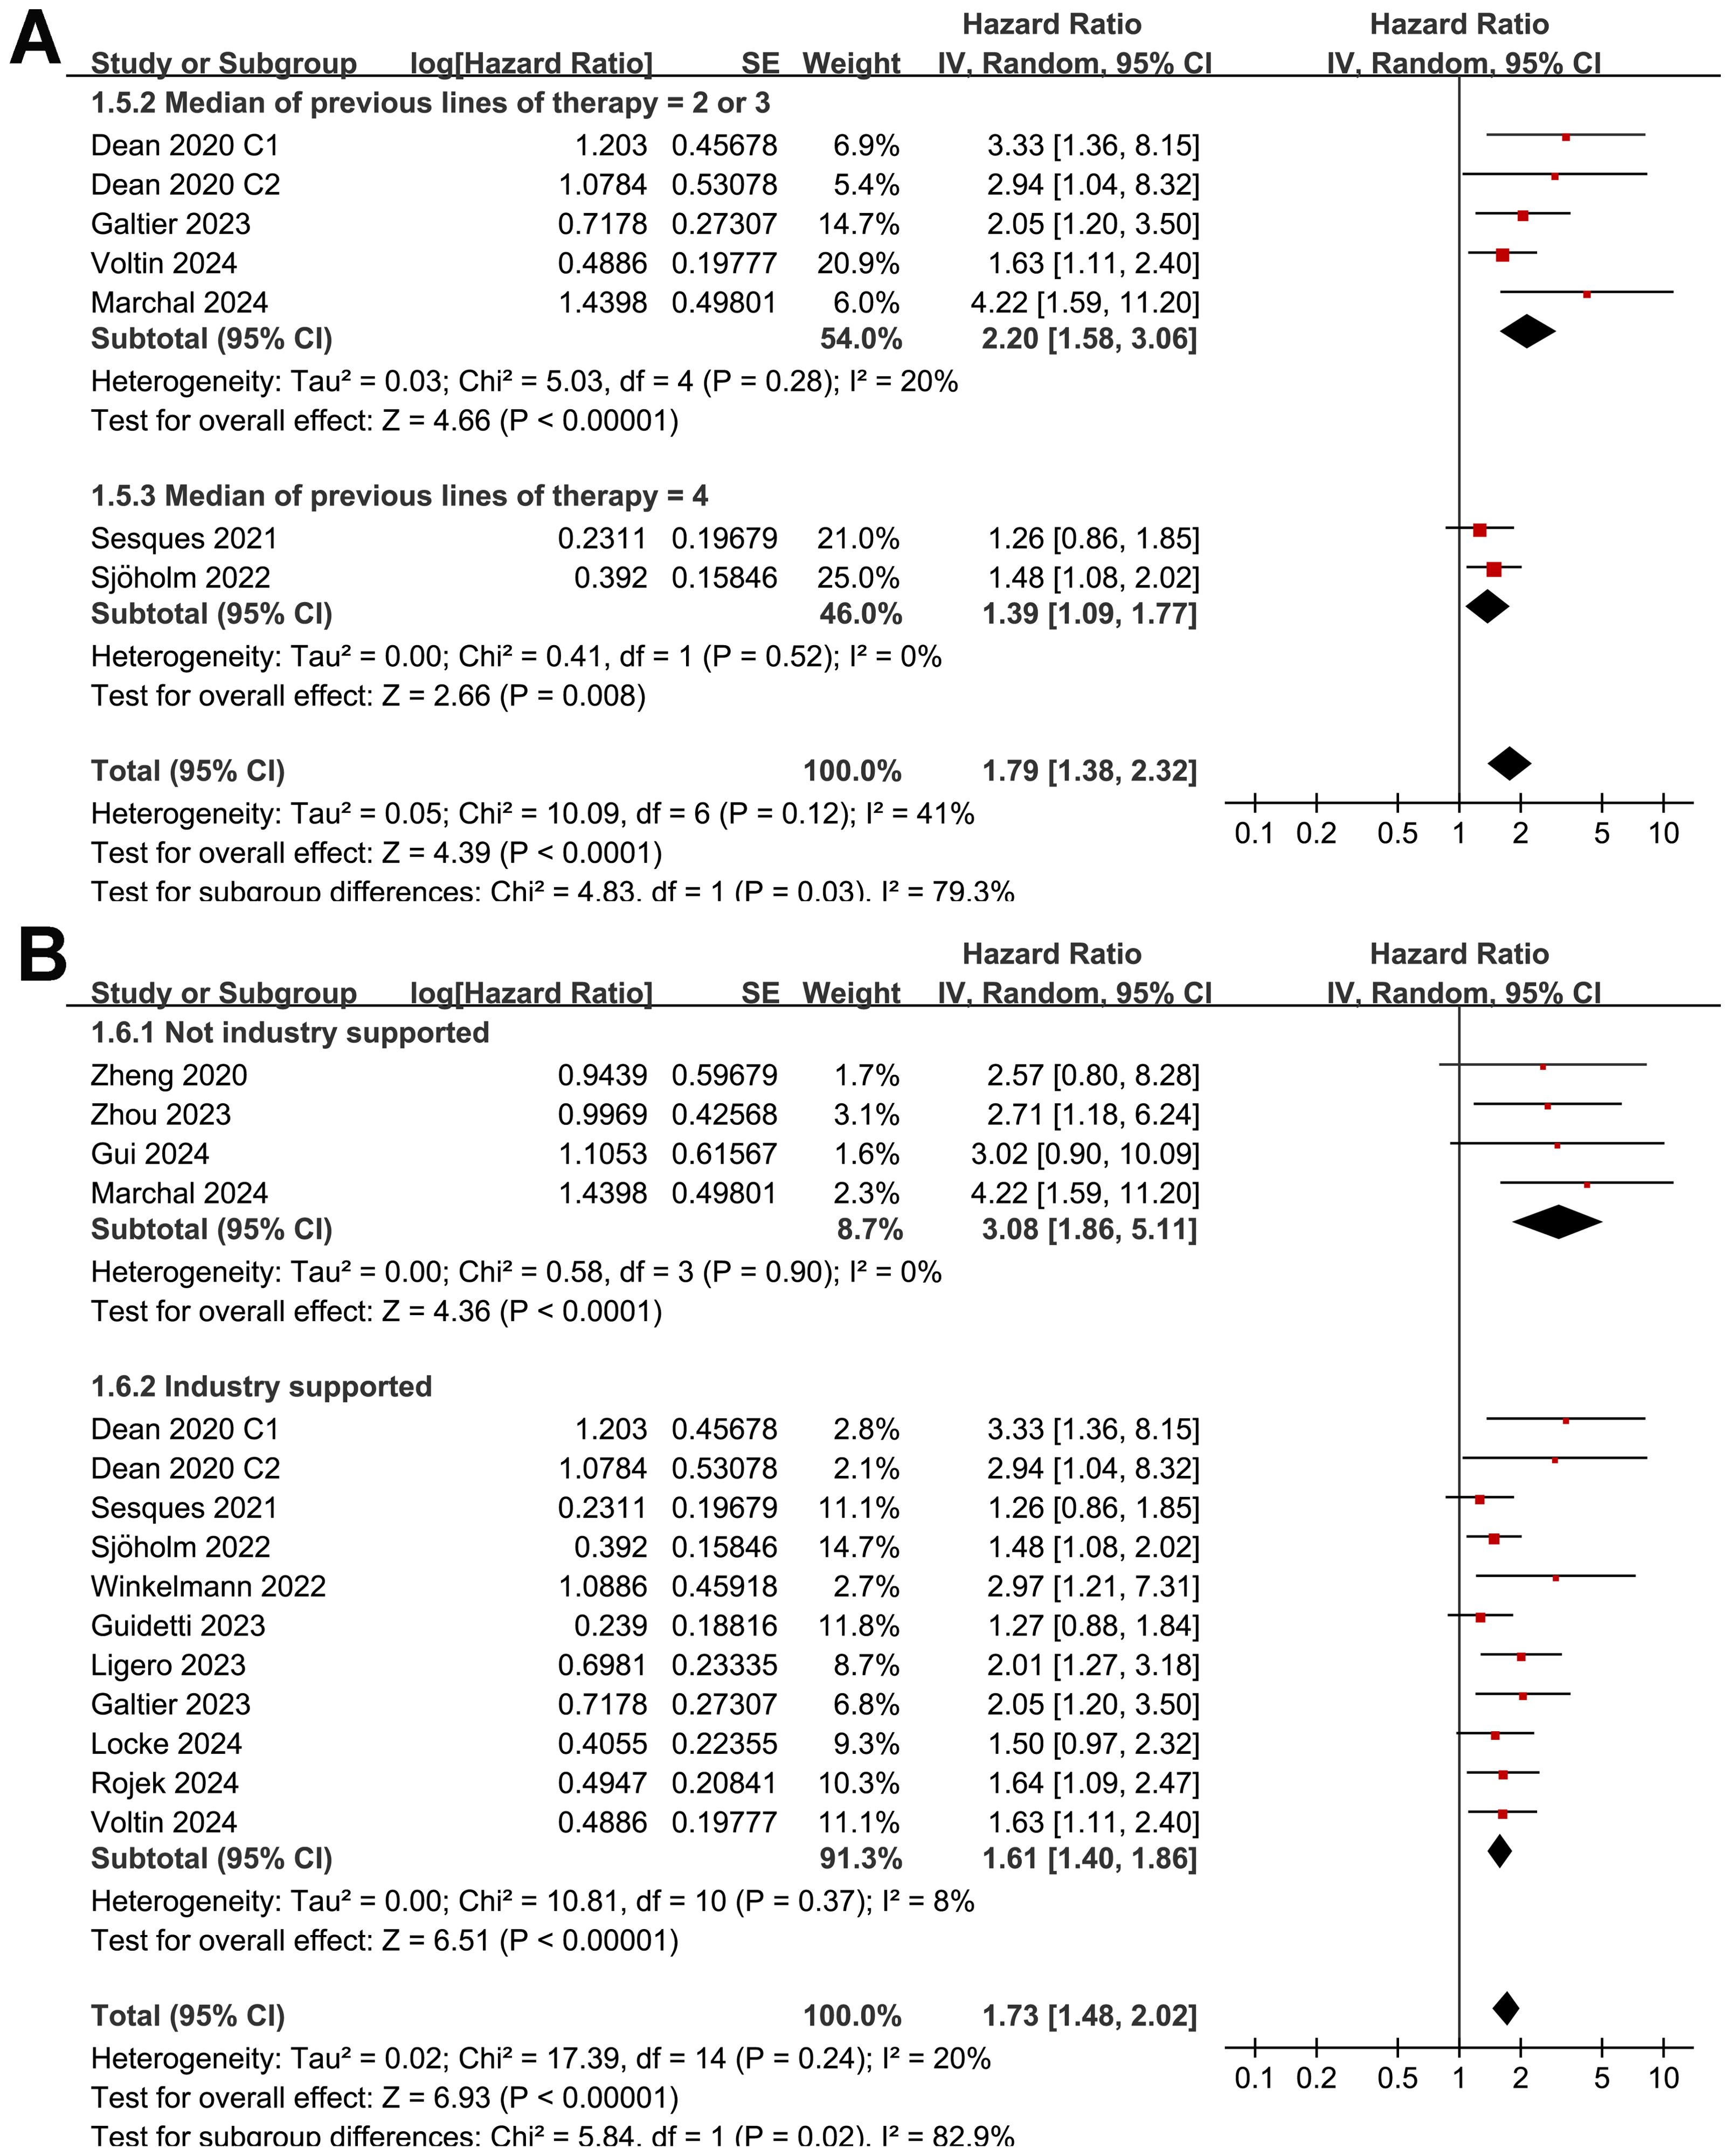
Figure 4. Forest plots for the subgroup analysis of the association between MTV at baseline and PFS of NHL patients after CAR-T therapy; (A), forest plots for the subgroup analysis according to the median of previous lines of treatments; and (B), forest plots for the subgroup analysis according to whether the study was industry supported.
Further meta-regression analyses suggested that the association between MTV and PFS of NHL patients after CAR-T was not significantly affected by study sample size, mean age, proportion of men, cutoff value of MTV, follow-up duration, or study quality scores (Table 6, p all > 0.05).
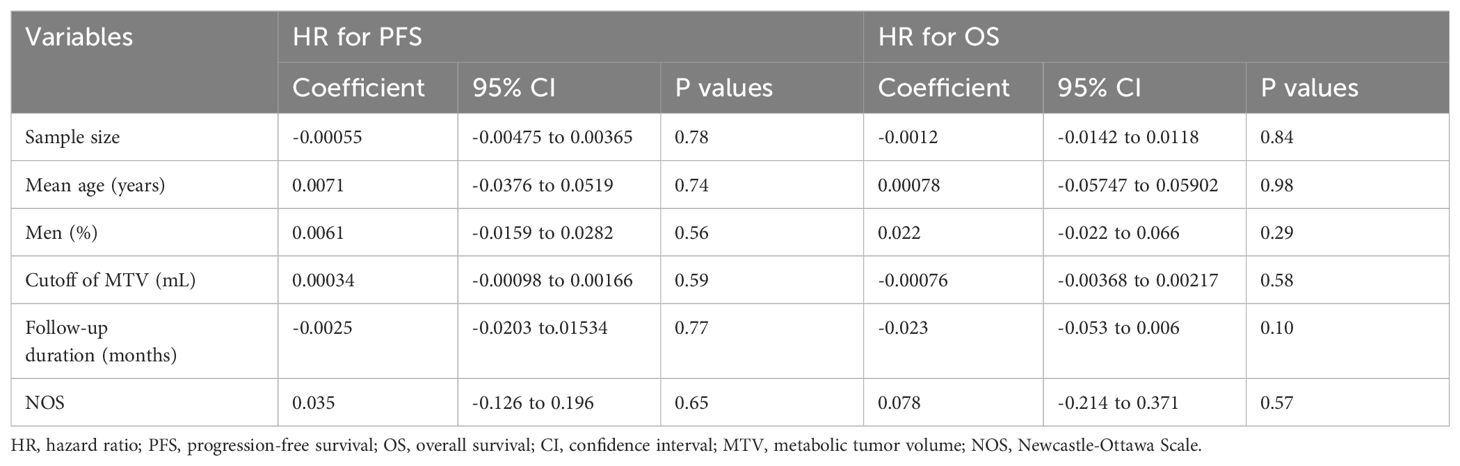
Table 6. Results of univariate meta-regression analysis.
Meta-analysis for the association between MTV and OS after CAR-T
Synthesized results of 11 cohorts (25, 27–30, 32, 34, 35, 37–39) suggested a potential association between a high MTV at baseline and the poor OS of patients after CAR-T therapy (HR: 2.11, 95% CI: 1.54 to 2.89, p < 0.001; I2 = 58%; Figure 5A) with a moderate certainty of evidence (Table 4). The results of the “leave-one-out” sensitivity analyses further confirmed the robustness of the finding (HR: 1.80 to 2.29, p all < 0.05; Table 5). Additionally, sensitivity analysis limited to studies using lymphodepletion with fludarabine and cyclophosphamide showed similar results (HR: 2.53, 95% CI: 1.39 to 4.64, p = 0.003; I2 = 75%).
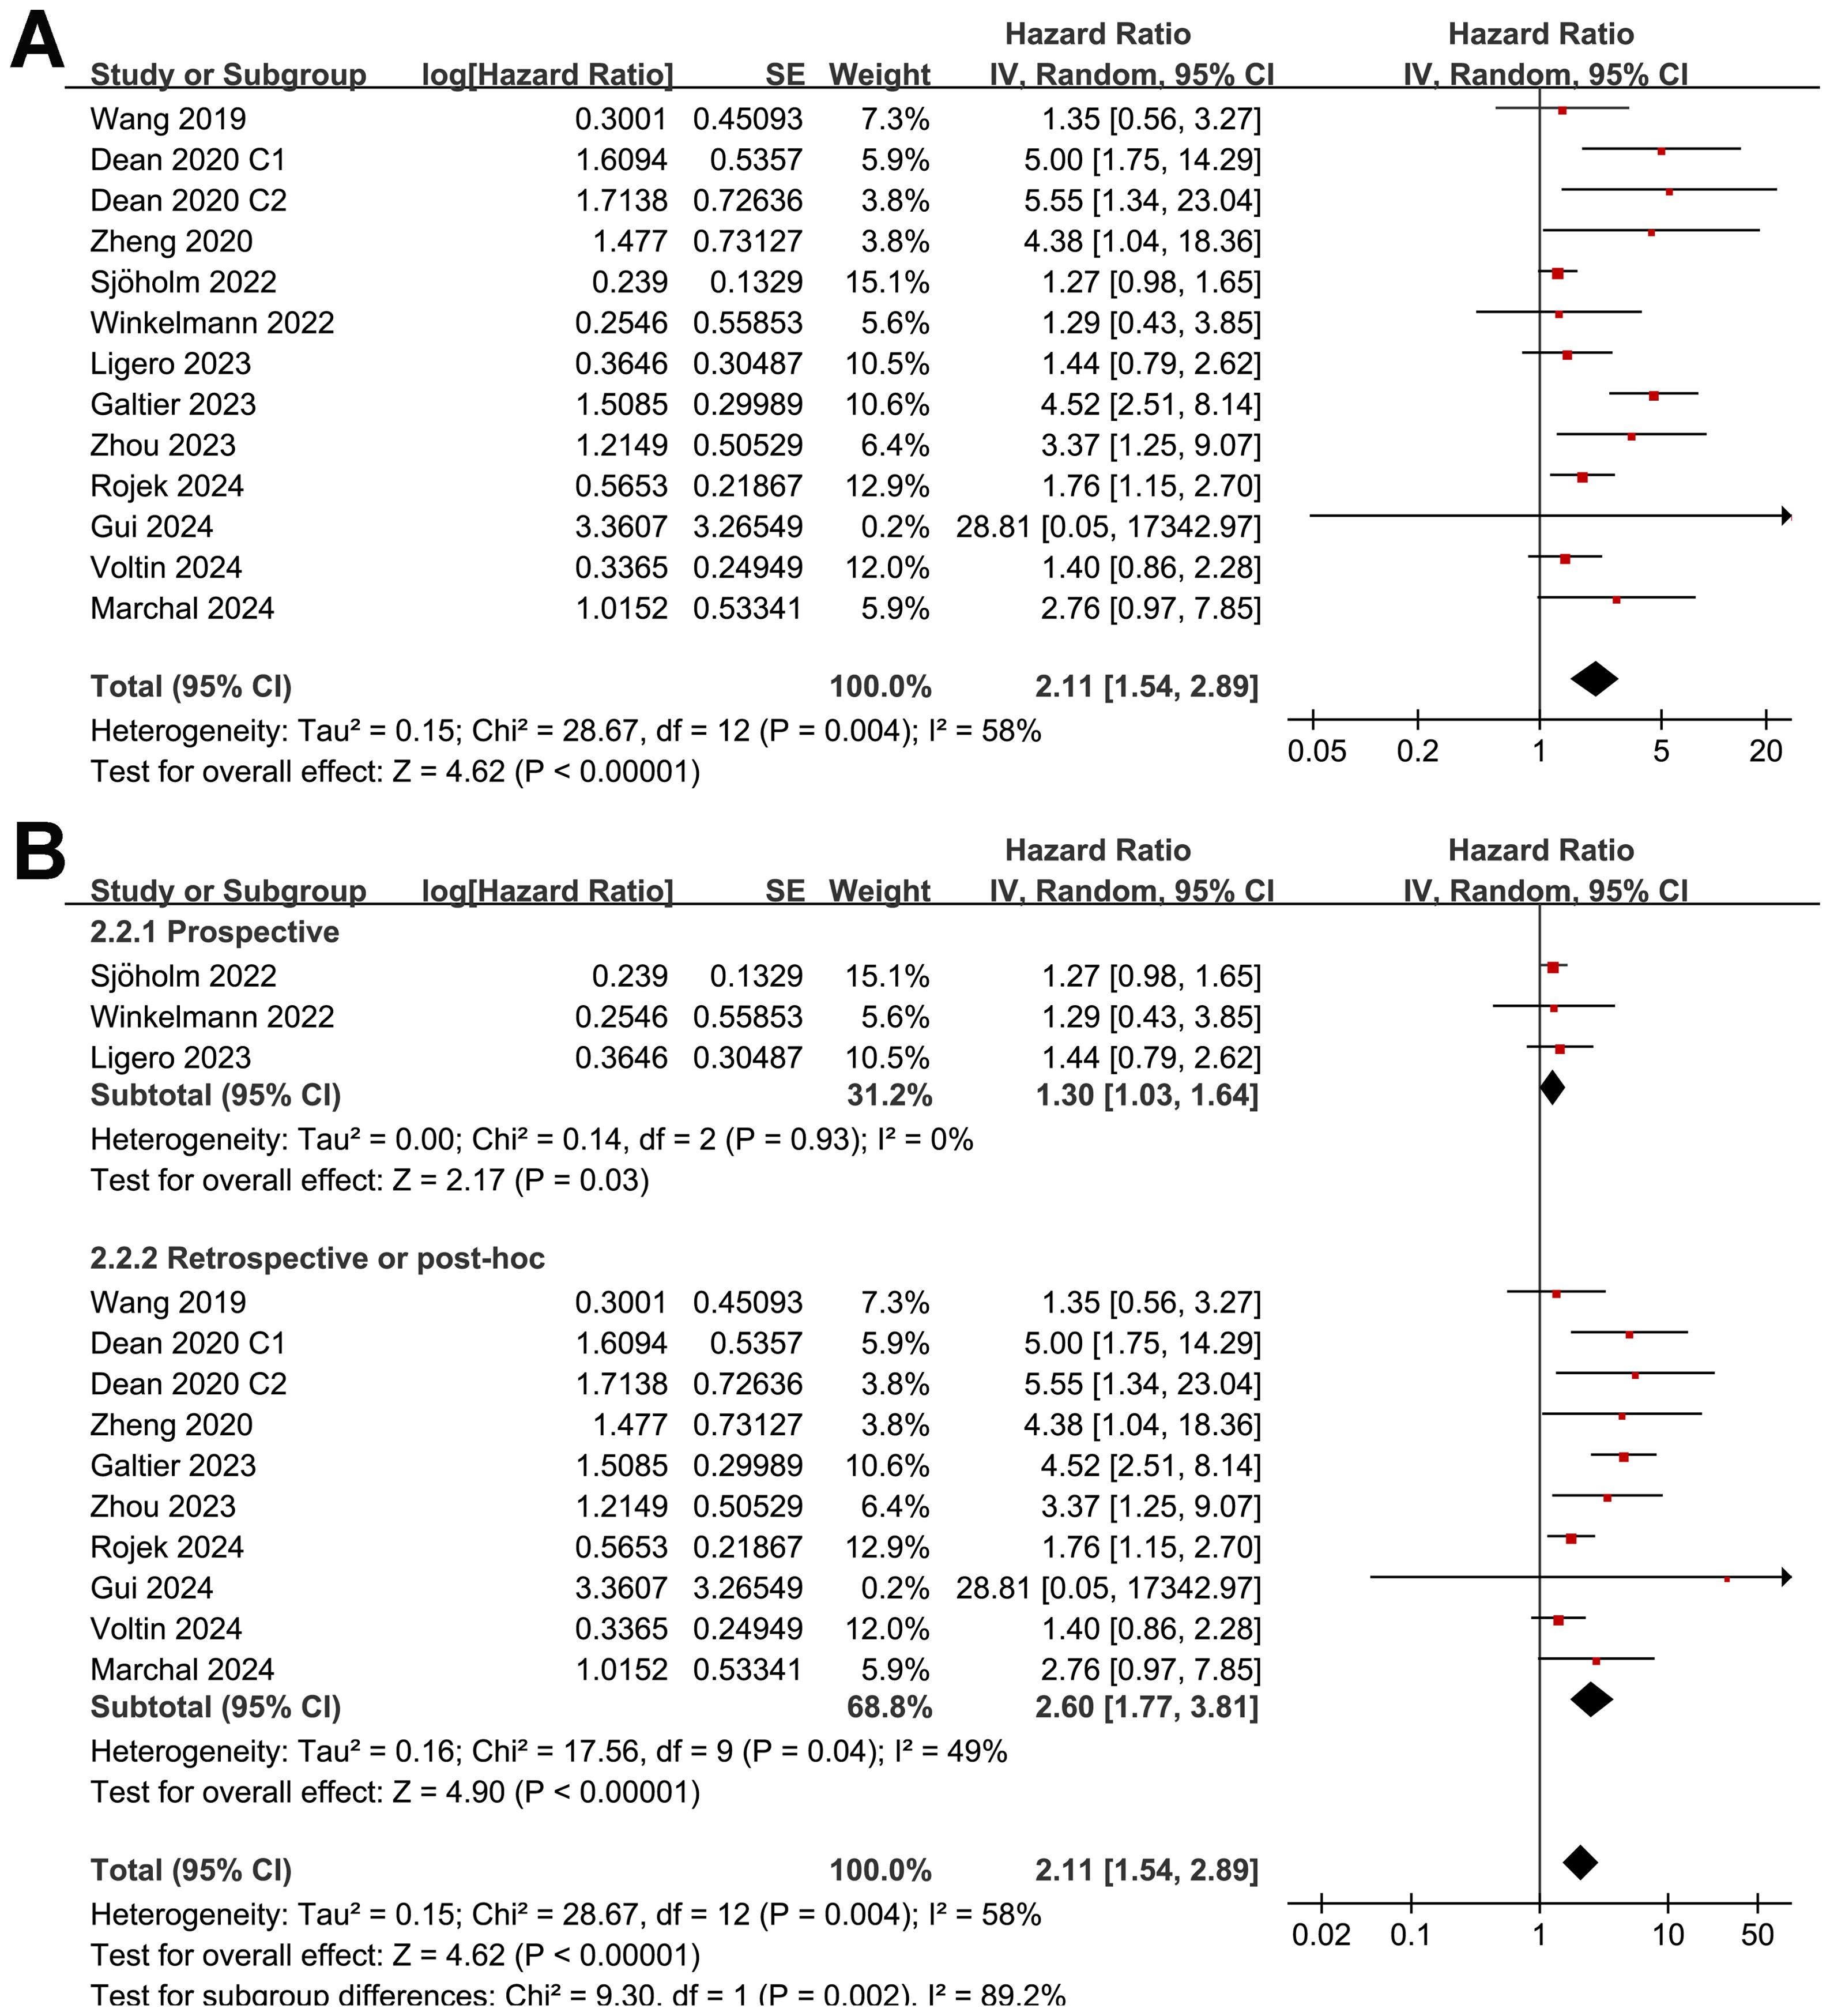
Figure 5. Forest plots for the meta-analysis of the association between MTV at baseline and OS of NHL patients after CAR-T therapy; (A), forest plots for the overall meta-analysis; and (B), forest plots for the subgroup analysis according to study design.
Although the results were both statistically significant, the subgroup analysis suggested a stronger association between MTV and poor OS in retrospective/post-hoc studies than in the prospective studies (HR: 2.60 versus 1.30, p for subgroup difference = 0.002; Figure 5B). Further subgroup analyses showed that the association between a high MTV and poor OS was not significantly affected by methods for defining the cutoff of MTV (HR: 1.86 versus 2.40, p for subgroup difference = 0.43; Figure 6A) or the analytic models (HR: 1.56 versus 3.34, p for subgroup difference = 0.05; Figure 6B). Interestingly, a stronger association between MTV and OS was observed for patients with median of lines of previous treatment of 2 or 3 as compared to those of 4 (HR: 3.15 versus 1.28, p for subgroup difference = 0.03; Figure 7A). A similar association between MTV and OS was observed in non-industry supported and industry supported studies (HR: 2.46 versus 2.00, p for subgroup difference = 0.53; Figure 7B).
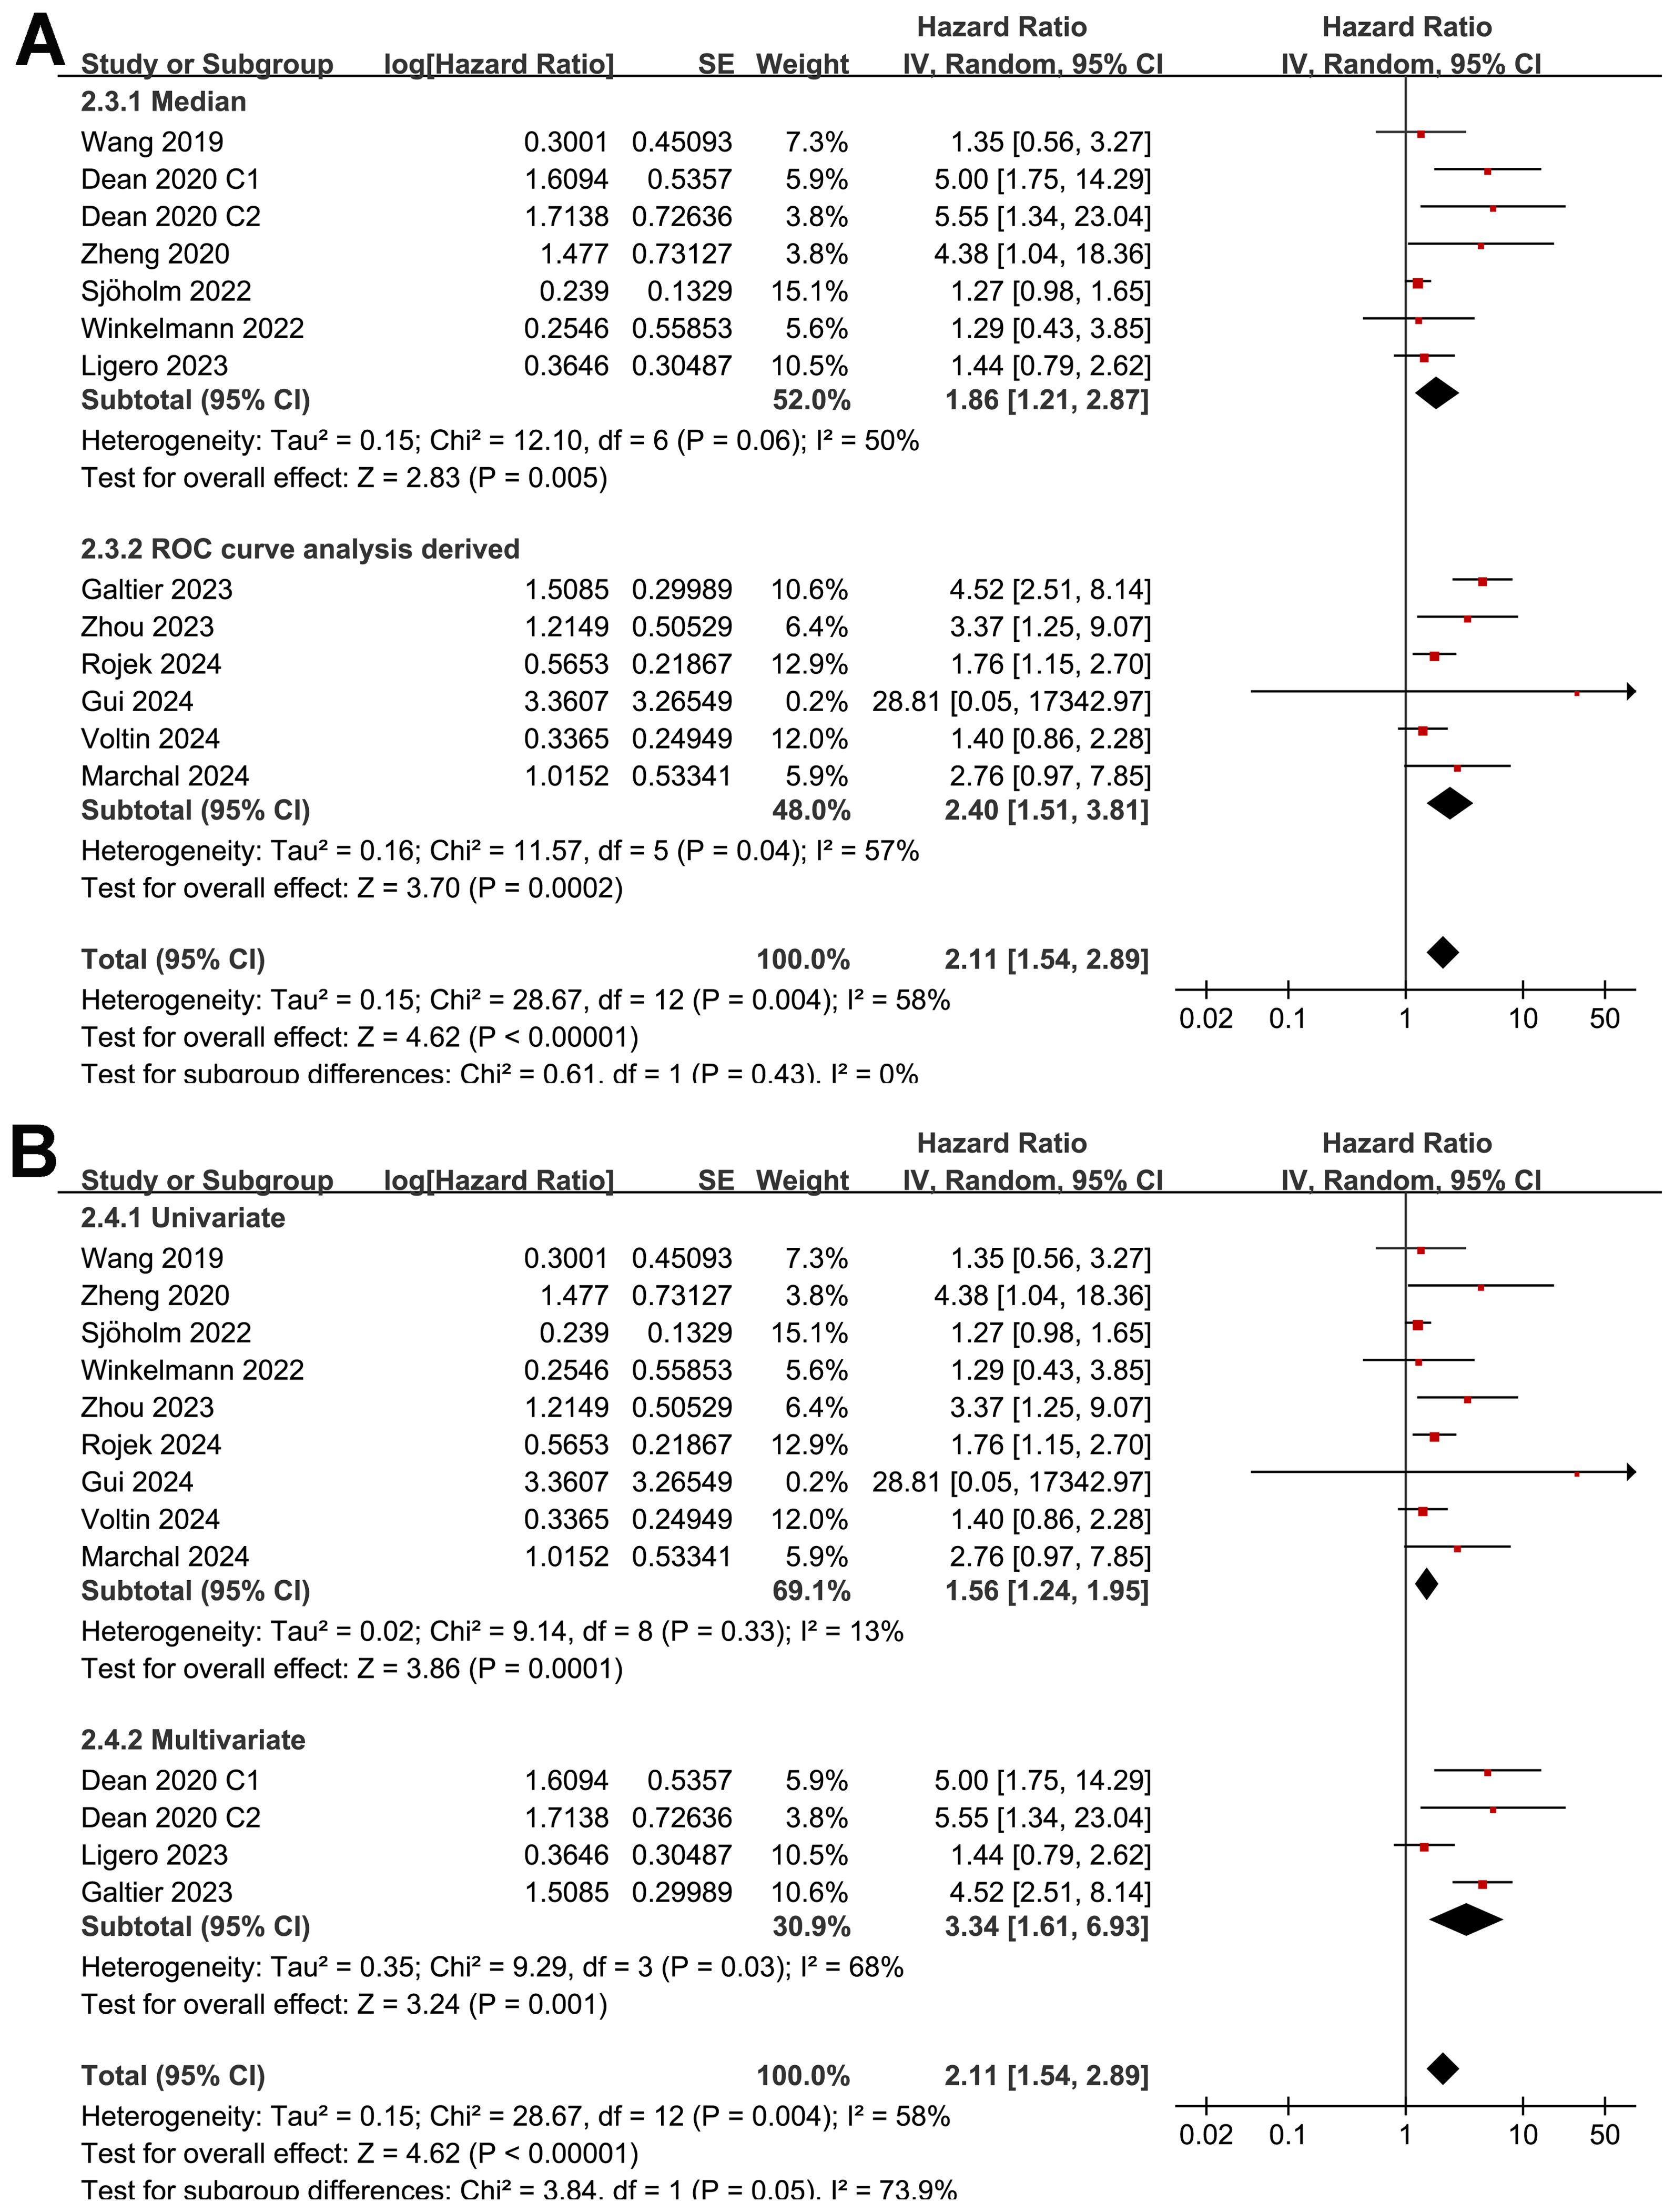
Figure 6. Forest plots for the subgroup analysis of the association between MTV at baseline and OS of NHL patients after CAR-T therapy; (A), forest plots for the subgroup analysis according to the methods for determining the cutoff of MTV; and (B), forest plots for the subgroup analysis according to the analytic models.
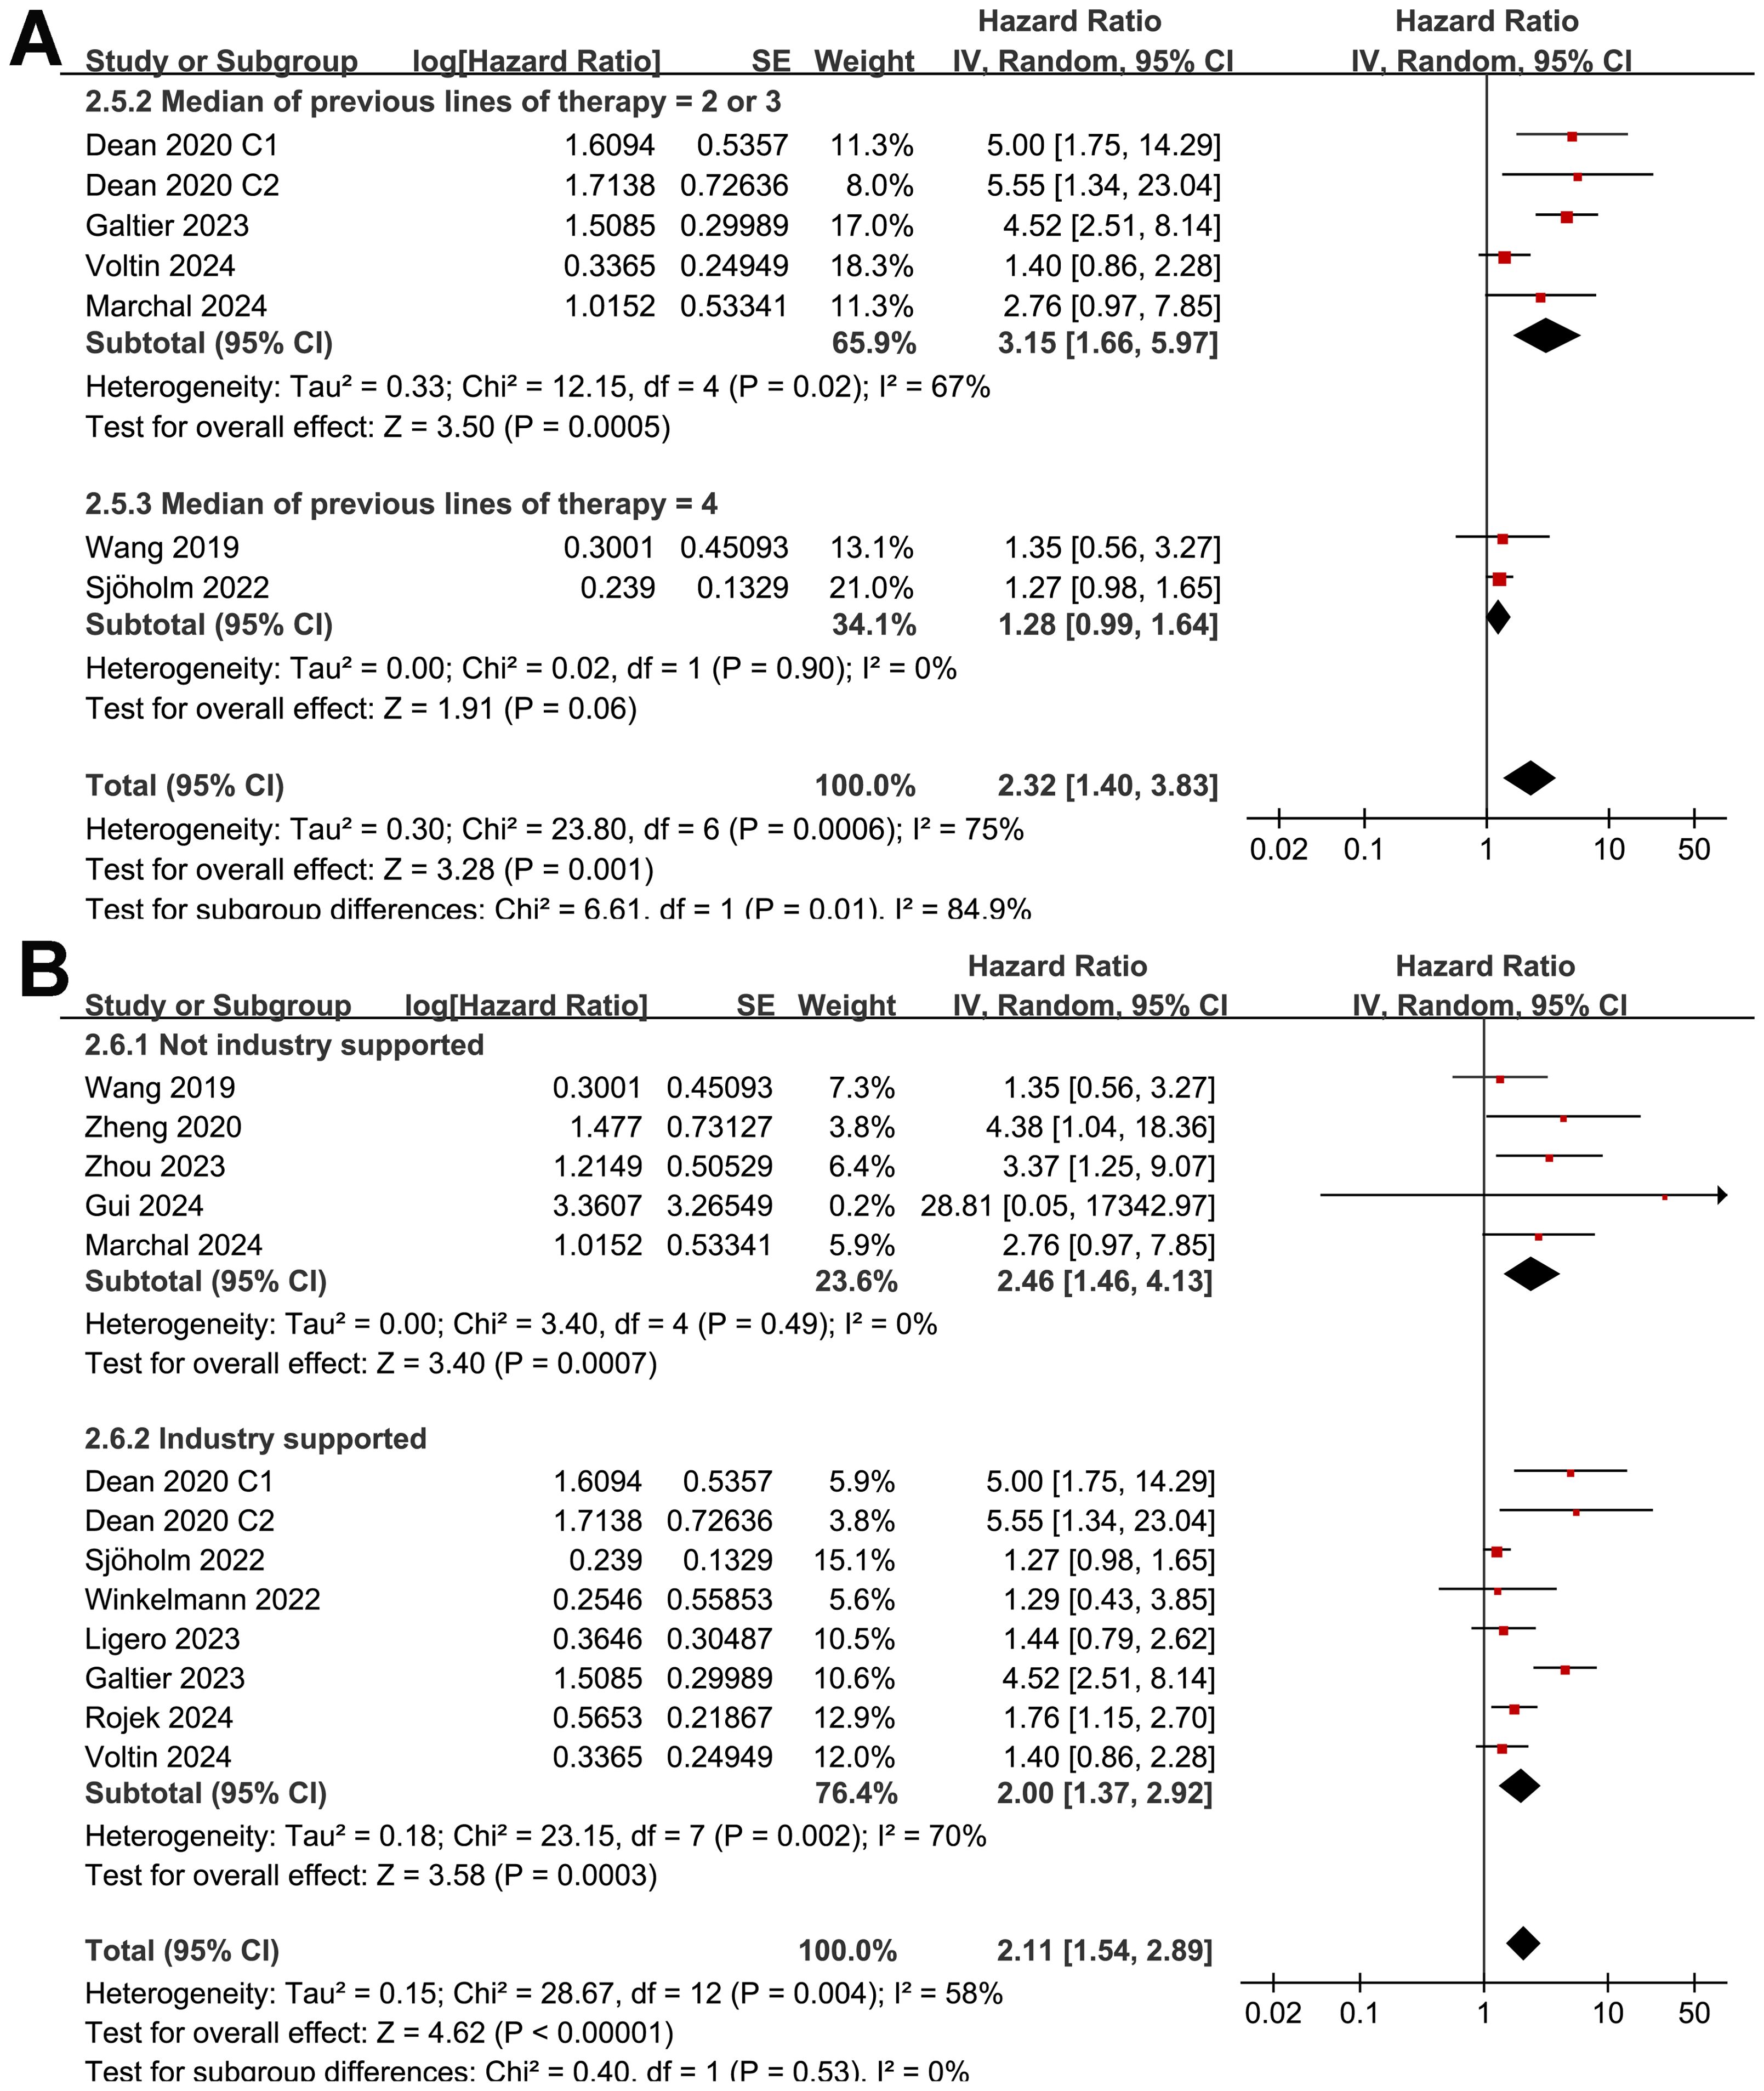
Figure 7. Forest plots for the subgroup analysis of the association between MTV at baseline and OS of NHL patients after CAR-T therapy; (A), forest plots for the subgroup analysis according to the median of previous lines of treatments; and (B), forest plots for the subgroup analysis according to whether the study was industry supported.
The results of the meta-regression analysis did not suggest the association between a high MTV and poor OS was significantly modified by the study sample size, mean age, proportion of men, cutoff value of MTV, follow-up duration, or study quality scores (Table 6, p all > 0.05).
Publication bias evaluation
Funnel plots in Figures 8A, B display the meta-analyses of the relationships between MTV at baseline with PFS and OS in NHL patients after CAR-T therapy. The symmetrical nature of the funnel plots indicates a low likelihood of publication biases. Additionally, Egger’s regression test results also suggest a low risk of publication bias (p = 0.13 for the outcome of PFS and 0.25 for the outcome of OS).
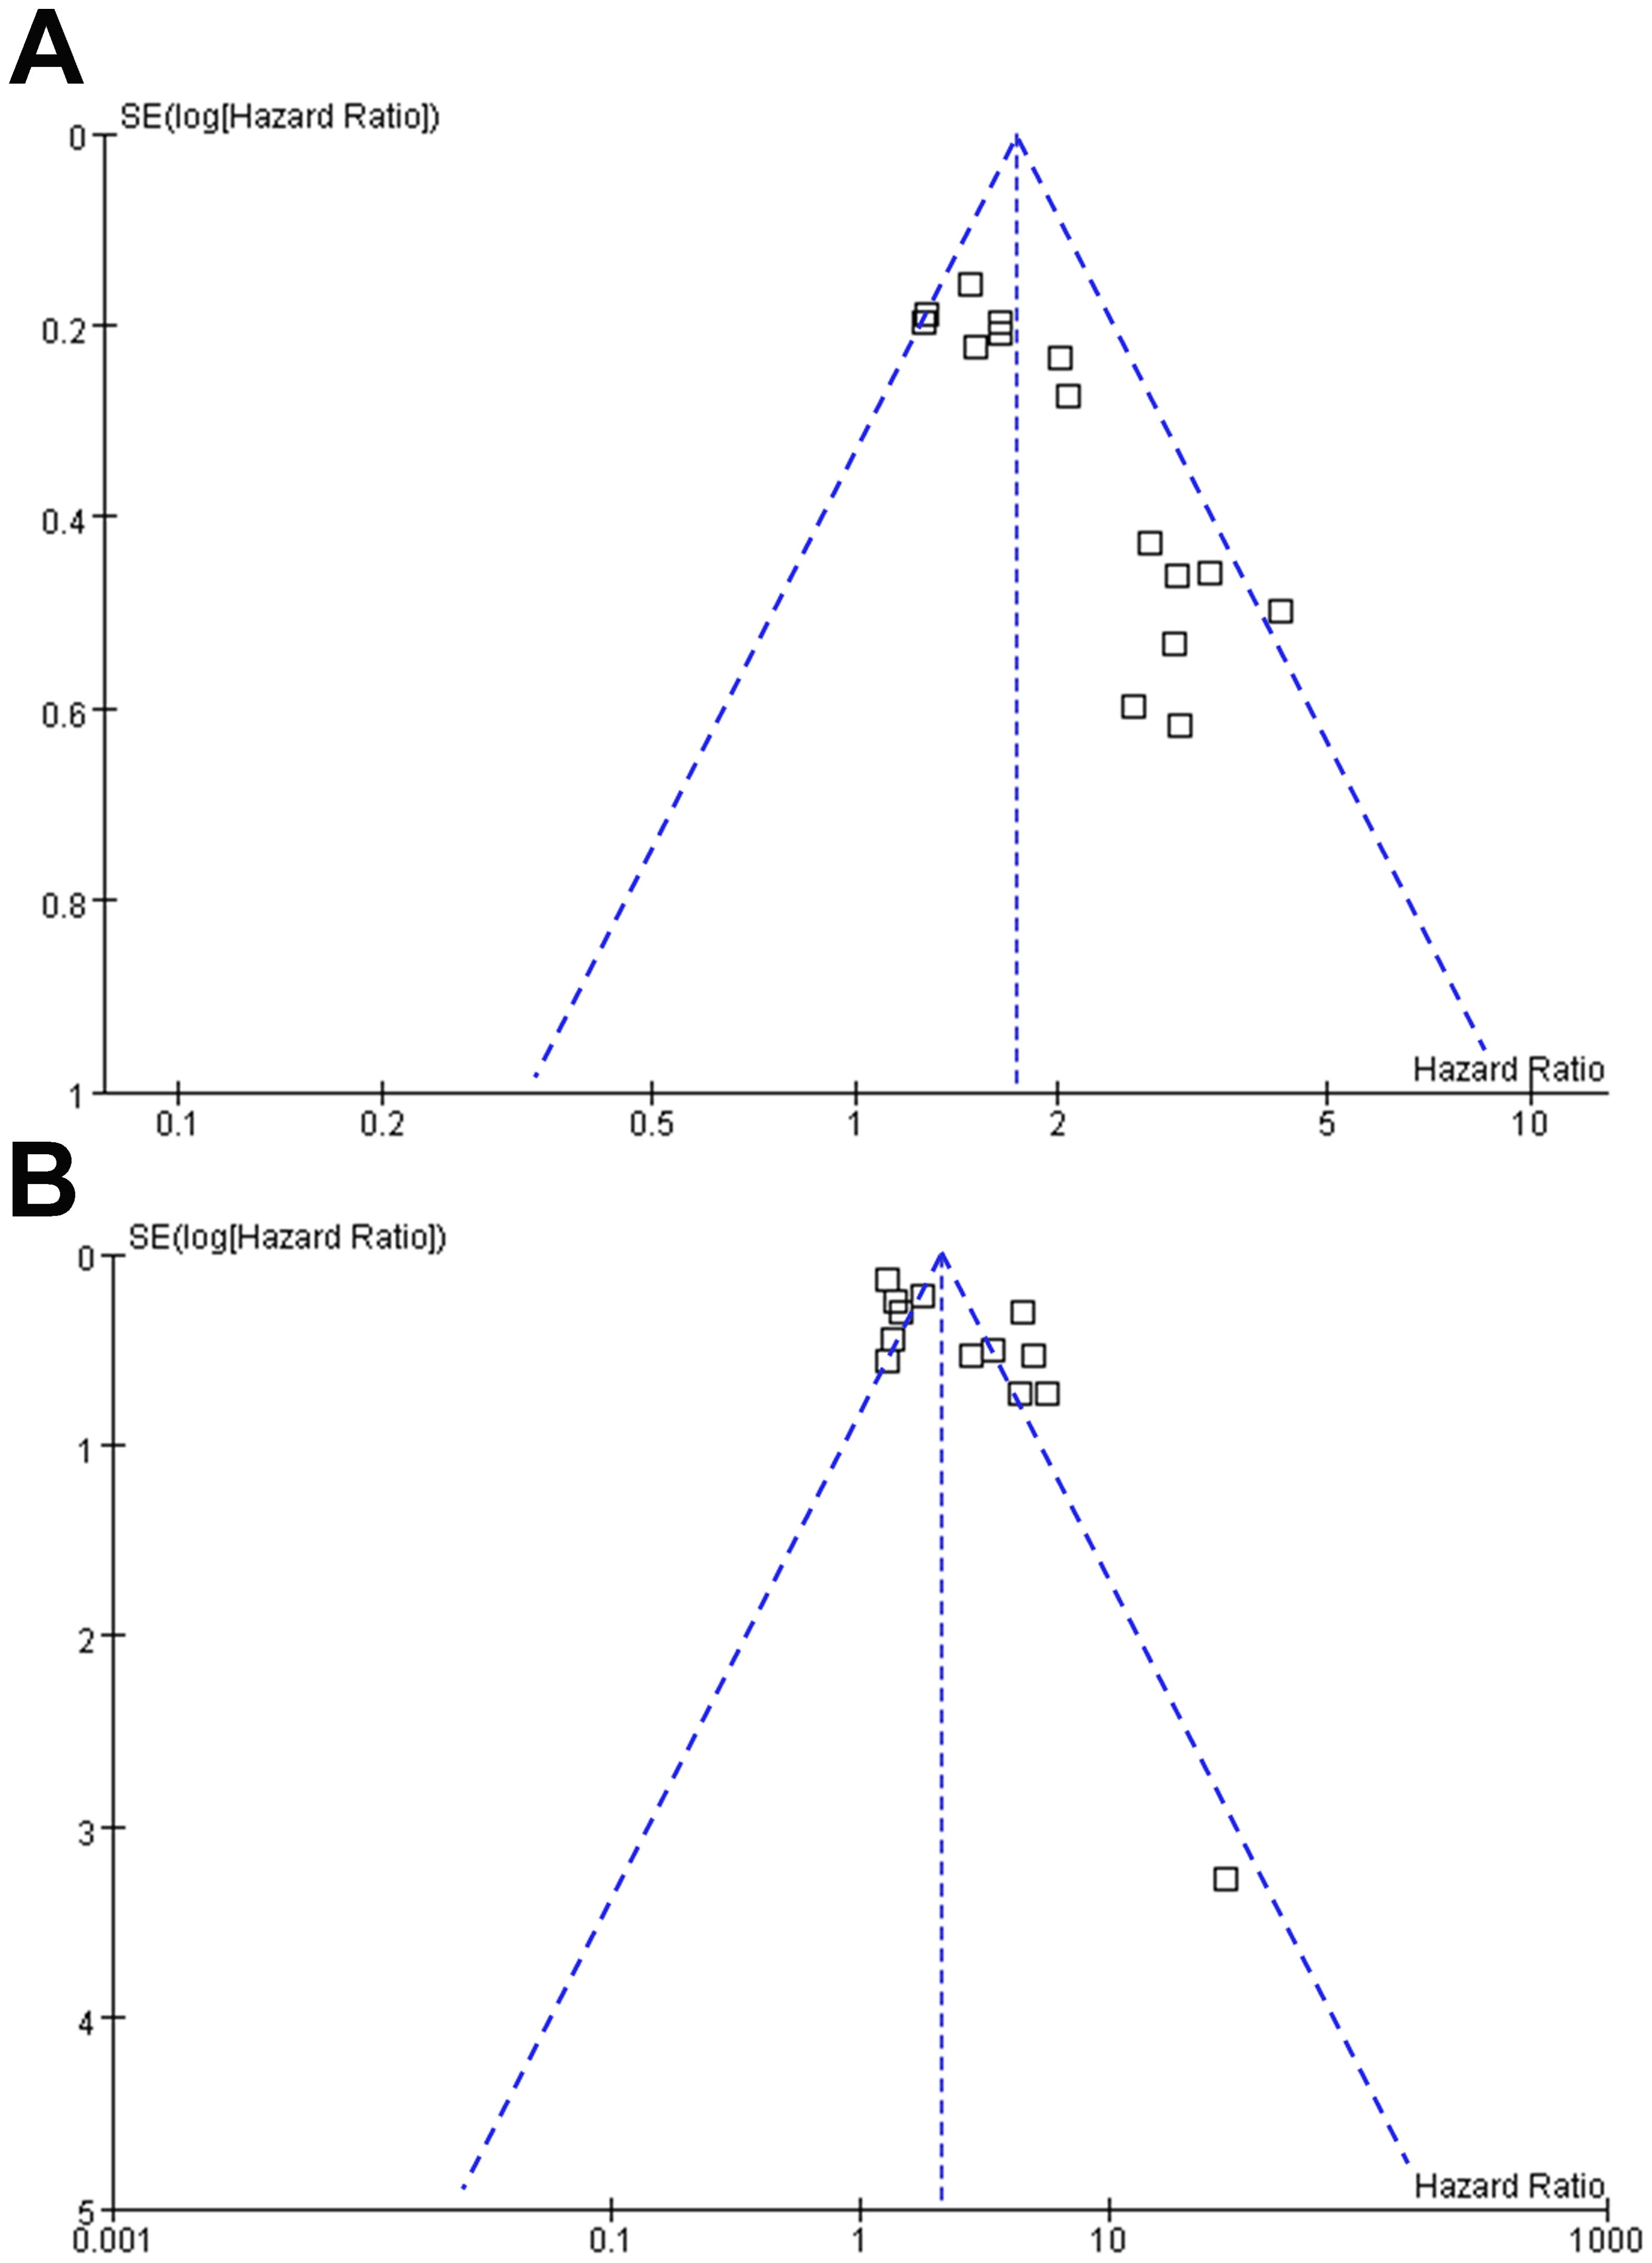
Figure 8. Funnel plots for the publication bias underlying the meta-analyses of the association between MTV at baseline and survival of NHL patients after CAR-T therapy; (A), funnel plots for the outcome of PFS; and (B), funnel plots for the outcome of OS.
Discussion
The findings of this meta-analysis confirmed the prognostic value of MTV derived from PET in patients with NHL undergoing CAR-T therapy. The pooled results from 15 observational studies demonstrate a consistent association between higher baseline MTV and poorer survival outcomes, including PFS and OS following CAR-T therapy. Interestingly, subgroup analysis suggested a stronger association between MTV and poor OS/PFS in patients with median of lines of previous treatment of 2 or 3 as compared to those with 4. In addition, subgroup analyses revealed that this association remained robust across different study designs, methods for determining MTV cutoffs, and analytical models, suggesting the reliability and generalizability of the findings. Furthermore, meta-regression analyses indicated that various factors, including sample size, patient demographics, MTV cutoff values, and study quality, did not significantly influence the observed association between MTV and survival, reinforcing the validity of the results.
The association between high MTV and poor survival outcomes in NHL patients after CAR-T therapy might be attributed to several potential mechanisms. Firstly, elevated MTV reflects a higher tumor burden and metabolic activity, indicating more aggressive disease biology and increased resistance to therapy (40). Secondly, tumors with high metabolic activity may exhibit greater heterogeneity and genomic instability, leading to treatment resistance and disease relapse (41). Moreover, the tumor microenvironment characterized by metabolic dysregulation, hypoxia, and immune evasion may contribute to therapeutic resistance and tumor progression (42). In addition, a high MTV has been related to an increased risk of CAR-T related toxicity in patients with NHL, such as the risk of grade 3+ immune effector cell-associated neurotoxicity syndrome (43, 44), which may also be an important reason for the reduced OS in these patients. Understanding these underlying mechanisms can guide the development of novel therapeutic strategies targeting metabolic vulnerabilities or enhancing CAR-T cell efficacy in high-MTV tumors.
Results of subgroup analysis findings showed a stronger association between MTV and poor OS/PFS in patients with median of lines of previous treatment of 2 or 3 as compared to those with 4, which suggests that the prognostic value of MTV on PET scans in patients with NHL undergoing CAR T-cell therapy might be modulated by the number of previous treatment lines. However, these findings suggest that patients with fewer lines of treatment may have a higher risk of poor outcome (PFS/OS), which seems paradoxical considering patients with fewer lines of treatment are expected to have fitter T-cells (45, 46) and better treatment outcomes after CAR-T therapy. It seems that there are other confounding factors accounting for these results, such as potentially increased rate of CAR-T toxicities or infections in patients with fewer lines of treatment, which were not assessed in this meta-analysis. Besides, meta-analysis for the outcomes of PFS and OS analysis showed moderate and high heterogeneity, respectively. Therefore the results should be interpreted very cautiously. Moreover, for the subgroups with the median of previous lines treatment of 4, very few studies (only 2) were available, which probably is too small to capture the true effect. Additionally, separate sub-analysis on the CAR-T product was not undertaken, which may also have an impact on the outcomes. For example, the study with the third generation CAR has been included in the analysis (29) and currently there is not strong evidence on how these products perform and their impact on outcomes, especially compared with the licensed second generation ones. Accordingly, future prospective studies with large sample size are still needed to determine whether previous lines of treatment may modify the association between MTV and survival outcomes of NHL patients after CAR-T therapy, and to explore the potential underlying mechanisms.
The strengths of this meta-analysis include its comprehensive literature search, rigorous inclusion criteria, and robust statistical analyses accounting for heterogeneity across studies. However, certain limitations should be acknowledged. First, 11 retrospective or post-hoc analysis was included in the meta-analysis, which may expose the results to the risk of recall and selection biases. However, subgroup analysis according to study design showed consistent results. Second, 13 of the included studies enrolled patients with LBC, and the results of the meta-analysis were mostly driven by studies with patients of LBCL. The association between MTV and the survival of patients with other subtypes of NHL should still be investigated in the future. Third, moderately statistical heterogeneity was observed for the meta-analysis of the association between MTV and OS of NHL patients after CAR-T therapy, and the subgroup analysis results based on limited study-level data suggest that the number of previous treatment lines may modulate the association. We were unable to determine the influence of patient physical status on the association between MTV and survival outcomes in a subgroup or meta-regression analysis because none of the included studies reported the outcome according to the class of ECOG PS, and on study-level, data of ECOG PS of the included studies were reported in a non-uniform manner. In addition, recent publications have correlated a high tumor burden (reflected by MTV) with a higher risk of infections, and the latter has been related with a higher non-relapse mortality in the long-term which may impact the survival outcomes (12, 47). However, only one of the included studies reported the incidence of infection of the included patients (38). Future studies are needed to determine if the incidence of infection after CAR-T may modify the association between MTV and survival outcomes of patients with NHL. Finally, the univariate-regression analysis was used in 11 of the included studies. Although a consistent result was observed in subgroup analysis of multivariate analysis, we could not exclude the possibility that residual unadjusted factors may confound the association between a high baseline MTV and poor survival of NHL patients after CAR-T therapy.
MTV offers several advantages in the assessment of NHL patients undergoing CAR-T therapy. Firstly, it provides a quantitative measure of tumor burden, enabling a comprehensive evaluation beyond conventional anatomical imaging modalities. This quantitative assessment facilitates early detection of disease progression or response to therapy, guiding timely adjustments in treatment strategies. Additionally, high baseline MTV serves as a prognostic biomarker, aiding in risk stratification and identification of patients at higher risk of treatment failure or disease relapse. Despite its potential advantages, the measurement of MTV presents several methodological challenges that need to be addressed (48, 49). Variability in PET imaging protocols, including tracer dose and uptake time, can impact the accuracy and reproducibility of MTV measurements (48). Standardization of imaging protocols across institutions is crucial to ensure consistency and comparability of MTV values. Furthermore, accurate delineation of tumor boundaries on PET images is challenging, particularly in cases of diffuse or heterogeneous disease involvement (48, 49). Standardized segmentation algorithms and quality assurance measures are needed to improve reproducibility. Moreover, PET/CT fusion artifacts and optimal thresholding methods for defining metabolically active tumor voxels pose additional challenges to MTV measurement (48). Advanced image registration techniques and standardized thresholding algorithms are required to mitigate artifacts and improve the reliability of MTV quantification (48). Despite these challenges, addressing methodological considerations in MTV measurement will enhance its utility as a prognostic biomarker and guide clinical decision-making in the management of NHL patients undergoing CAR-T therapy.
From a clinical perspective, the identification of high MTV as a predictor of poor survival outcomes in NHL patients treated with CAR-T therapy has important implications for risk stratification, treatment selection, and patient management. Incorporating MTV assessment into routine clinical practice may facilitate personalized treatment approaches, such as intensification of therapy or consideration of alternative treatment strategies in patients with high-risk disease. Furthermore, future studies should focus on validating these findings in prospective cohorts, elucidating the biological mechanisms underlying the association between MTV and survival, and exploring therapeutic strategies to overcome treatment resistance in high-MTV tumors.
Conclusions
In conclusion, this meta-analysis provides pilot evidence for the prognostic significance of MTV in NHL patients undergoing CAR-T therapy. Higher baseline MTV is consistently associated with poorer survival outcomes, highlighting its potential utility as a predictive biomarker for risk stratification and treatment optimization in this patient population. Further research efforts are warranted to validate these findings, elucidate underlying mechanisms, and translate these insights into clinical practice to improve outcomes for NHL patients undergoing CAR-T therapy.
Data availability statement
The original contributions presented in the study are included in the article/Supplementary Material. Further inquiries can be directed to the corresponding authors.
Author contributions
LL: Conceptualization, Formal analysis, Investigation, Methodology, Validation, Writing – original draft, Writing – review & editing. FJ: Data curation, Formal analysis, Investigation, Methodology, Supervision, Validation, Writing – original draft, Writing – review & editing. HF: Conceptualization, Formal analysis, Funding acquisition, Resources, Software, Supervision, Validation, Writing – review & editing.
Funding
The author(s) declare financial support was received for the research, authorship, and/or publication of this article. This study is supported by General program of National Natural Science Foundation of China (No.: 82073282).
Conflict of interest
The authors declare that the research was conducted in the absence of any commercial or financial relationships that could be construed as a potential conflict of interest.
Publisher’s note
All claims expressed in this article are solely those of the authors and do not necessarily represent those of their affiliated organizations, or those of the publisher, the editors and the reviewers. Any product that may be evaluated in this article, or claim that may be made by its manufacturer, is not guaranteed or endorsed by the publisher.
Supplementary material
The Supplementary Material for this article can be found online at: https://www.frontiersin.org/articles/10.3389/fimmu.2024.1433012/full#supplementary-material
References
1. Siegel RL, Giaquinto AN, Jemal A. Cancer statistics, 2024. CA Cancer J Clin. (2024) 74:12–49. doi: 10.3322/caac.21820
2. Shankland KR, Armitage JO, Hancock BW. Non-hodgkin lymphoma. Lancet. (2012) 380:848–57. doi: 10.1016/S0140-6736(12)60605-9
3. Miranda-Filho A, Pineros M, Znaor A, Marcos-Gragera R, Steliarova-Foucher E, Bray F. Global patterns and trends in the incidence of non-Hodgkin lymphoma. Cancer Causes Control. (2019) 30:489–99. doi: 10.1007/s10552-019-01155-5
4. Zhang N, Wu J, Wang Q, Liang Y, Li X, Chen G, et al. Global burden of hematologic Malignancies and evolution patterns over the past 30 years. Blood Cancer J. (2023) 13:82. doi: 10.1038/s41408-023-00853-3
5. Ansell SM. Non-hodgkin lymphoma: diagnosis and treatment. Mayo Clin Proc. (2015) 90:1152–63. doi: 10.1016/j.mayocp.2015.04.025
6. Pang Y, Ghosh N. Novel and multiple targets for chimeric antigen receptor-based therapies in lymphoma. Front Oncol. (2024) 14:1396395. doi: 10.3389/fonc.2024.1396395
7. Giraudo MF, Jackson Z, Das I, Abiona OM, Wald DN. Chimeric antigen receptor (CAR)-T cell therapy for non-hodgkin’s lymphoma. Pathog Immun. (2024) 9:1–17. doi: 10.20411/pai.v9i1
8. June CH, Sadelain M. Chimeric antigen receptor therapy. N Engl J Med. (2018) 379:64–73. doi: 10.1056/NEJMra1706169
9. Abbasi S, Totmaj MA, Abbasi M, Hajazimian S, Goleij P, Behroozi J, et al. Chimeric antigen receptor T (CAR-T) cells: Novel cell therapy for hematological Malignancies. Cancer Med. (2023) 12:7844–58. doi: 10.1002/cam4.5551
10. Cappell KM, Sherry RM, Yang JC, Goff SL, Vanasse DA, McIntyre L, et al. Long-term follow-up of anti-CD19 chimeric antigen receptor T-cell therapy. J Clin Oncol. (2020) 38:3805–15. doi: 10.1200/JCO.20.01467
11. Jacobson CA, Munoz J, Sun F, Kanters S, Limbrick-Oldfield EH, Spooner C, et al. Real-world outcomes with chimeric antigen receptor T cell therapies in large B cell lymphoma: A systematic review and meta-analysis. Transplant Cell Ther. (2024) 30:77.e1– e15. doi: 10.1016/j.jtct.2023.10.017
12. Linguanti F, Abenavoli EM, Berti V, Lopci E. Metabolic imaging in B-cell lymphomas during CAR-T cell therapy. Cancers (Basel). (2022) 14. doi: 10.3390/cancers14194700
13. Murad V, Kohan A, Ortega C, Prica A, Veit-Haibach P, Metser U. Role of FDG PET/CT in patients with lymphoma treated with chimeric antigen receptor T-cell therapy: current concepts. AJR Am J Roentgenol. (2024) 222:e2330301. doi: 10.2214/AJR.23.30301
14. Barrington SF. Advances in positron emission tomography and radiomics. Hematol Oncol. (2023) 41 Suppl 1:11–9.
15. Pellegrino S, Fonti R, Pulcrano A, Del Vecchio S. PET-based volumetric biomarkers for risk stratification of non-small cell lung cancer patients. Diagnostics (Basel). (2021) 11. doi: 10.3390/diagnostics11020210
16. Tutino F, Giovannini E, Pastorino S, Ferrando O, Giovacchini G, Ciarmiello A. Methodological aspects and the prognostic value of metabolic tumor volume assessed with 18F-FDG PET/CT in lymphomas. Curr Radiopharm. (2022) 15:259–70. doi: 10.2174/1874471015666220329120631
17. Page MJ, McKenzie JE, Bossuyt PM, Boutron I, Hoffmann TC, Mulrow CD, et al. The PRISMA 2020 statement: an updated guideline for reporting systematic reviews. BMJ. (2021) 372:n71.
18. Page MJ, Moher D, Bossuyt PM, Boutron I, Hoffmann TC, Mulrow CD, et al. PRISMA 2020 explanation and elaboration: updated guidance and exemplars for reporting systematic reviews. BMJ. (2021) 372:n160. doi: 10.1136/bmj.n160
19. Higgins J, Thomas J, Chandler J, Cumpston M, Li T, Page M, et al. Cochrane Handbook for Systematic Reviews of Interventions version 6.2. London, UK: The Cochrane Collaboration (2021). Available at: www.training.cochrane.org/handbook.
20. Wells GA, Shea B, O’Connell D, Peterson J, Welch V, Losos M, et al. The Newcastle-Ottawa Scale (NOS) for assessing the quality of nonrandomised studies in meta-analyses (2010). Available online at: http://www.ohri.ca/programs/clinical_epidemiology/oxford.asp (Accessed April 20, 2024).
21. Guyatt G, Oxman AD, Akl EA, Kunz R, Vist G, Brozek J, et al. GRADE guidelines: 1. Introduction-GRADE evidence profiles and summary of findings tables. J Clin Epidemiol. (2011) 64:383–94. doi: 10.1016/j.jclinepi.2010.04.026
22. Higgins JP, Thompson SG. Quantifying heterogeneity in a meta-analysis. Stat Med. (2002) 21:1539–58. doi: 10.1002/sim.1186
23. Patsopoulos NA, Evangelou E, Ioannidis JP. Sensitivity of between-study heterogeneity in meta-analysis: proposed metrics and empirical evaluation. Int J Epidemiol. (2008) 37:1148–57. doi: 10.1093/ije/dyn065
24. Egger M, Davey Smith G, Schneider M, Minder C. Bias in meta-analysis detected by a simple, graphical test. BMJ. (1997) 315:629–34. doi: 10.1136/bmj.315.7109.629
25. Wang J, Hu Y, Yang S, Wei G, Zhao X, Wu W, et al. Role of fluorodeoxyglucose positron emission tomography/computed tomography in predicting the adverse effects of chimeric antigen receptor T cell therapy in patients with non-hodgkin lymphoma. Biol Blood Marrow Transplant. (2019) 25:1092–8. doi: 10.1016/j.bbmt.2019.02.008
26. Dean EA, Mhaskar RS, Lu H, Mousa MS, Krivenko GS, Lazaryan A, et al. High metabolic tumor volume is associated with decreased efficacy of axicabtagene ciloleucel in large B-cell lymphoma. Blood Adv. (2020) 4:3268–76. doi: 10.1182/bloodadvances.2020001900
27. Zheng XQ, Ding CY, Zou YX, Zhu HY, Wang L, Fan L, et al. Roles of PET/CT in predicting the prognosis of diffuse large B cell lymphoma patients treated with chimeric antigen receptor T cell therapy. Chin J Exp Hematol. (2020) 28:1189–96.
28. Sesques P, Tordo J, Ferrant E, Safar V, Wallet F, Dhomps A, et al. Prognostic impact of 18F-FDG PET/CT in patients with aggressive B-cell lymphoma treated with anti-CD19 chimeric antigen receptor T cells. Clin Nucl Med. (2021) 46:627–34. doi: 10.1097/RLU.0000000000003756
29. Sjoholm T, Korenyushkin A, Gammelgard G, Saren T, Lovgren T, Loskog A, et al. Whole body FDG PET/MR for progression free and overall survival prediction in patients with relapsed/refractory large B-cell lymphomas undergoing CAR T-cell therapy. Cancer Imaging. (2022) 22:76. doi: 10.1186/s40644-022-00513-y
30. Winkelmann M, Bucklein VL, Blumenberg V, Rejeski K, Ruzicka M, Unterrainer M, et al. Lymphoma tumor burden before chimeric antigen receptor T-Cell treatment: RECIL vs. Lugano vs. metabolic tumor assessment. Front Oncol. (2022) 12:974029. doi: 10.3389/fonc.2022.974029
31. Galtier J, Vercellino L, Chartier L, Olivier P, Tabouret-Viaud C, Mesguich C, et al. Positron emission tomography-imaging assessment for guiding strategy in patients with relapsed/refractory large B-cell lymphoma receiving CAR T cells. Haematologica. (2023) 108:171–80. doi: 10.3324/haematol.2021.280550
32. Guidetti A, Dodero A, Lorenzoni A, Pizzamiglio S, Argiroffi G, Chiappella A, et al. Combination of Deauville score and quantitative positron emission tomography parameters as a predictive tool of anti-CD19 chimeric antigen receptor T-cell efficacy. Cancer. (2023) 129:255–63. doi: 10.1002/cncr.34532
33. Ligero M, Simo M, Carpio C, Iacoboni G, Balaguer-Montero M, Navarro V, et al. PET-based radiomics signature can predict durable responses to CAR T-cell therapy in patients with large B-cell lymphoma. EJHaem. (2023) 4:1081–8. doi: 10.1002/jha2.757
34. Zhou Y, Zhang B, Han J, Dai N, Jia T, Huang H, et al. Development of a radiomic-clinical nomogram for prediction of survival in patients with diffuse large B-cell lymphoma treated with chimeric antigen receptor T cells. J Cancer Res Clin Oncol. (2023) 149:11549–60. doi: 10.1007/s00432-023-05038-w
35. Gui J, Li M, Xu J, Zhang X, Mei H, Lan X. [(18)F]FDG PET/CT for prognosis and toxicity prediction of diffuse large B-cell lymphoma patients with chimeric antigen receptor T-cell therapy. Eur J Nucl Med Mol Imaging. (2024). doi: 10.1007/s00259-024-06667-0
36. Locke FL, Oluwole OO, Kuruvilla J, Thieblemont C, Morschhauser F, Salles GA, et al. Axicabtagene ciloleucel versus standard of care in second-line large B-cell lymphoma: outcomes by metabolic tumor volume. Blood. (2024). doi: 10.1182/blood.2023021620
37. Marchal E, Palard-Novello X, Lhomme F, Meyer ME, Manson G, Devillers A, et al. Baseline [(18)F]FDG PET features are associated with survival and toxicity in patients treated with CAR T cells for large B cell lymphoma. Eur J Nucl Med Mol Imaging. (2024) 51:481–9. doi: 10.1007/s00259-023-06427-6
38. Rojek AE, Kline JP, Feinberg N, Appelbaum DE, Pu Y, Derman BA, et al. Optimization of metabolic tumor volume as a prognostic marker in CAR T-cell therapy for aggressive large B-cell NHL. Clin Lymphoma Myeloma Leuk. (2024) 24:83–93. doi: 10.1016/j.clml.2023.09.005
39. Voltin CA, Paccagnella A, Winkelmann M, Heger JM, Casadei B, Beckmann L, et al. Multicenter development of a PET-based risk assessment tool for product-specific outcome prediction in large B-cell lymphoma patients undergoing CAR T-cell therapy. Eur J Nucl Med Mol Imaging. (2024) 51:1361–70. doi: 10.1007/s00259-023-06554-0
40. Meignan M, Cottereau AS, Specht L, Mikhaeel NG. Total tumor burden in lymphoma - an evolving strong prognostic parameter. Br J Radiol. (2021) 94:20210448. doi: 10.1259/bjr.20210448
41. Cheson BD. PET/CT in lymphoma: current overview and future directions. Semin Nucl Med. (2018) 48:76–81. doi: 10.1053/j.semnuclmed.2017.09.007
42. Chauvie S, Ceriani L, Zucca E. Radiomics in Malignant lymphomas. In: Lymphoma [Internet]. (Brisbane (AU): Exon Publications) (2021).
43. Breen WG, Young JR, Hathcock MA, Kowalchuk RO, Thorpe MP, Bansal R, et al. Metabolic PET/CT analysis of aggressive Non-Hodgkin lymphoma prior to Axicabtagene Ciloleucel CAR-T infusion: predictors of progressive disease, survival, and toxicity. Blood Cancer J. (2023) 13:127. doi: 10.1038/s41408-023-00895-7
44. Ababneh HS, Ng AK, Abramson JS, Soumerai JD, Takvorian RW, Frigault MJ, et al. Metabolic parameters predict survival and toxicity in chimeric antigen receptor T-cell therapy-treated relapsed/refractory large B-cell lymphoma. Hematol Oncol. (2024) 42:e3231. doi: 10.1002/hon.3231
45. Mehta PH, Fiorenza S, Koldej RM, Jaworowski A, Ritchie DS, Quinn KM. T cell fitness and autologous CAR T cell therapy in haematologic Malignancy. Front Immunol. (2021) 12:780442. doi: 10.3389/fimmu.2021.780442
46. Noll JH, Levine BL, June CH, Fraietta JA. Beyond youth: Understanding CAR T cell fitness in the context of immunological aging. Semin Immunol. (2023) 70:101840. doi: 10.1016/j.smim.2023.101840
47. Kampouri E, Little JS, Rejeski K, Manuel O, Hammond SP, Hill JA. Infections after chimeric antigen receptor (CAR)-T-cell therapy for hematologic Malignancies. Transpl Infect Dis. (2023) 25 Suppl 1:e14157. doi: 10.1111/tid.14157
48. El-Galaly TC, Villa D, Cheah CY, Gormsen LC. Pre-treatment total metabolic tumour volumes in lymphoma: Does quantity matter? Br J Haematol. (2022) 197:139–55.
Keywords: Non-Hodgkin lymphoma, chimeric antigen receptor T, metabolic tumor volume, positron emission tomography, survival
Citation: Liu L, Jin F and Fan H (2024) Metabolic tumor volume and the survival of patients with Non-Hodgkin lymphoma treated with chimeric antigen receptor T cell therapy: a meta-analysis. Front. Immunol. 15:1433012. doi: 10.3389/fimmu.2024.1433012
Received: 15 May 2024; Accepted: 09 August 2024;
Published: 29 August 2024.
Edited by:
Saad Zafar Usmani, Levine Cancer Institute, United StatesReviewed by:
Vincenzo Maria Perriello, University of Perugia, ItalyStella Bouziana, King’s College Hospital NHS Foundation Trust, United Kingdom
Copyright © 2024 Liu, Jin and Fan. This is an open-access article distributed under the terms of the Creative Commons Attribution License (CC BY). The use, distribution or reproduction in other forums is permitted, provided the original author(s) and the copyright owner(s) are credited and that the original publication in this journal is cited, in accordance with accepted academic practice. No use, distribution or reproduction is permitted which does not comply with these terms.
*Correspondence: Feng Jin, amluZmVuZ19jbXVAaG90bWFpbC5jb20=; Hua Fan, ZmFuaHVhX2psdUBob3RtYWlsLmNvbQ==