 Irina Larionova1,2*†
 Pavel Iamshchikov1,2†
 Anna Kazakova1,2Militsa Rakina1
 Maxim Menyalo2Kadriia Enikeeva3
 Guzel Rafikova3Yuliya Sharifyanova3
 Valentin Pavlov3Alisa Villert2Larisa Kolomiets2
 Julia Kzhyshkowska1,3,4,5*
- 1Laboratory of Translational Cellular and Molecular Biomedicine, National Research Tomsk State University, Tomsk, Russia
- 2Cancer Research Institute, Tomsk National Research Medical Center, Russian Academy of Sciences, Tomsk, Russia
- 3Institute of Urology and Clinical Oncology, Bashkir State Medical University of the Ministry of Health of Russia, Ufa, Russia
- 4Institute of Transfusion Medicine and Immunology, Institute for Innate Immunoscience (MI3), Medical Faculty Mannheim, University of Heidelberg, Mannheim, Germany
- 5German Red Cross Blood Service Baden-Württemberg – Hessen, Mannheim, Germany
Ovarian cancer (OC) is the most lethal gynecologic malignancy worldwide. The major clinical challenge includes the asymptomatic state of the disease, making diagnosis possible only at advanced stages. Another OC complication is the high relapse rate and poor prognosis following the standard first-line treatment with platinum-based chemotherapy. At present, numerous clinical trials are being conducted focusing on immunotherapy in OC; nevertheless, there are still no FDA-approved indications. Personalized decision regarding the immunotherapy, including immune checkpoint blockade and immune cell–based immunotherapies, can depend on the effective antigen presentation required for the cytotoxic immune response. The major aim of our study was to uncover tumor-specific transcriptional and epigenetic changes in peripheral blood monocytes in patients with high-grade serous ovarian cancer (HGSOC). Another key point was to elucidate how chemotherapy can reprogram monocytes and how that relates to changes in other immune subpopulations in the blood. To this end, we performed single-cell RNA sequencing of peripheral blood mononuclear cells (PBMCs) from patients with HGSOC who underwent neoadjuvant chemotherapeutic treatment (NACT) and in treatment-naïve patients. Monocyte cluster was significantly affected by tumor-derived factors as well as by chemotherapeutic treatment. Bioinformatical analysis revealed three distinct monocyte subpopulations within PBMCs based on feature gene expression – CD14.Mn.S100A8.9hi, CD14.Mn.MHC2hi and CD16.Mn subsets. The intriguing result was that NACT induced antigen presentation in monocytes by the transcriptional upregulation of MHC class II molecules, but not by epigenetic changes. Increased MHC class II gene expression was a feature observed across all three monocyte subpopulations after chemotherapy. Our data also demonstrated that chemotherapy inhibited interferon-dependent signaling pathways, but activated some TGFb-related genes. Our results can enable personalized decision regarding the necessity to systemically re-educate immune cells to prime ovarian cancer to respond to anti-cancer therapy or to improve personalized prescription of existing immunotherapy in either combination with chemotherapy or a monotherapy regimen.
1 Introduction
Ovarian cancer (OC) is the most lethal gynecologic malignancy in the world (1). In 2022 there were 324,603 incidences of OC and 206,956 deaths worldwide (2). According to the Globocan’s 2022 projections, by the year 2040 incidence will have risen by 42% to a total of just over 446,000, with an even larger increase in the number of deaths each year (up nearly 52% to over 314,000) (3). Most patients with ovarian cancer are asymptomatic and are often diagnosed at advanced stages. This has led to OC being labeled as the “silent killer” (1). The principal hallmark of advanced-stage OC is ascites — the accumulation of excessive fluid containing cellular and acellular components in the abdomen (4). Advanced stages of OC are associated with poor prognosis and a significant decrease in survival rate compared to those diagnosed at stage I, although survival rate may vary according to the different disease histotypes (5). High-grade serous ovarian cancer (HGSOC) accounts for approximately 70% of all cases, making it the most common and deadliest histotype (1).
Most OC patients undergo primary debulking surgery combined with platinum/taxan-based chemotherapy, with or without the angiogenesis inhibitor bevacizumab, and, in certain cases, followed by maintenance treatment with poly-ADP-ribose polymerase (PARP) inhibitors (6, 7). However, if complete cytoreduction cannot be achieved by debulking surgery, an alternative therapeutic option for these patient groups is neoadjuvant chemotherapy (NACT) (8). Despite a good response to standard first-line chemotherapy, relapse occurs in 70% of patients within a short period of time (4, 6).
The tumor microenvironment (TME) in ovarian cancer is complex and unique, containing multiple cell types populating both fluid (ascites) and solid (omentum) niches (4, 7). TME targeting in ovarian cancer is intensely developing and the main focus is on immune cells, cancer-associated fibroblasts, endothelial cells and ECM-tumor cell interactions (7, 9–11). Among cells of innate immune system, tumor-associated macrophages (TAMs) are the most abundant cell population in the TME. TAMs may facilitate tumor growth, activate angiogenesis, induce immunosuppression and mediate chemoresistance (12, 13). The major plastic source for TAMs are peripheral blood monocytes (14, 15). Accumulating evidence suggests that the tumor-induced systemic environment can re-program monocytes before their arrival to the tumor site (14). Several studies reported transcriptional alterations in circulating monocytes in several cancers, including human breast cancer (16, 17), colorectal cancer (18, 19), renal cancer (20), and hepatic cancer (21). Role of circulating monocytes in ovarian cancer progression and response to chemotherapeutic intervention remains undefined which indicates high relevance of all attempts to uncover pro- and anti-tumor phenotypes of monocytes.
In our study we present the results of single-cell RNAseq analysis of peripheral blood mononuclear cells (PBMCs) from patients with HGSOC. One of the major aims of our study was to evaluate the effects of chemotherapy on the peripheral immune system, and to this end we compared samples of patients who were treated with neoadjuvant chemotherapy (NACT) before surgery and treated only by standard care therapy (debulking surgery and adjuvant chemo(targeted) therapy). We focused on monocyte population as it was one of the most altered by both cancer-derived systemic factors and NACT subset.
2 Materials and methods
2.1 Clinical samples
The study group consisted of 10 cases of advanced stage HGSOC (IIIС stage) diagnosed and treated in the Cancer Research Institute, Tomsk National Research Medical Centre (Tomsk, Russia). Patients had no acute pathologies, no infectious disorders, and did not have a history of any other types of cancer in addition to HGSOC. All 10 samples were used to conduct reduced representation bisulfite sequencing (RRBS) and 6 samples were used for single-cell RNA sequencing. Study group was divided according to treatment plan: 3 patients received platinum-based neoadjuvant chemotherapy (NACT) [carboplatin plus paclitaxel] prior to surgery and 3 patients had debulking surgery without upfront NACT. After surgery all patients received platinum/taxane-based adjuvant chemotherapy.
Healthy volunteers (N=10) were enrolled in this study as a control group. The inclusion criteria for the healthy cohort were: no active medical conditions, and no current or past history of an oncology disease.
The study received approval from the Local Committee for Medical Ethics and was conducted in accordance with the guidelines of the Declaration of Helsinki and the International Conference on Harmonization Good Clinical Practice Guidelines (ICH GCP). Written informed consent was obtained from all subjects, including the patients/participants, who willingly provided their consent to participate in the study.
2.2 Monocyte isolation
Peripheral whole-blood samples were collected from patients with ovarian cancer (n=10) and healthy donors (n=10). The peripheral blood mononuclear cells (PBMCs) were separated from whole blood by density gradient centrifugation using Lymphosep, Lymphocyte Separation Media (#L0560-500, Biowest, France), 1.077 g/ml density, at 600g for 30 minutes. The isolation of monocytes from PBMCs was performed using positive magnetic selection with CD14+ MACS beads (#130-050-201, Miltenyi Biotech, Germany), resulting in 90–98% monocyte purity as confirmed by flow cytometry. After monocyte isolation, the samples were washed twice with DPBS without calcium and magnesium at 300 g for 10 minutes. Subsequently, the cell precipitate was lysed using lysis buffer RLT (#79216, Qiagen, USA) and stored at -80°C until further experiments. Lysed monocytes were used for DNA isolation and reduced representation bisulfite sequencing (RRBS-Seq).
2.3 PBMC preparation for single-cell sequencing
PBMCs were washed twice with DPBS without calcium and magnesium at 300 g for 10 minutes and counted using CytoFLEX flow cytometer (Beckman Coulter, USA). 1×10⁶ PBMCs were used to prepare cell suspension for single-cell sequencing. Cells were put into 1.5 ml cryo tubes and mixed with 500 μl of X-VIVO™ 10 Medium (#180989, Lonza, Switzerland), 400 μl of fetal bovine serum (#10500064, ThermoFisher Scientific, USA), and 100 μl of dimethyl sulfoxide (#F135, Paneco, Russia). Subsequently, the cell suspension was stored in cryo container at -80°C for 48 hours, and then stored in liquid nitrogen until further experiments (but not more than 6 months).
2.4 Single-cell sequencing
Single-cell RNA sequencing was performed on the Chromium X platform, using the 10х Genomics Chromium Next GEM Single Cell 3′ Reagent Kit v3.1. (10х Genomics, USA). Prior to library preparation, cells were counted and quality of samples was assessed. Up to 8000 cells were used for further manipulations. cDNA amplification and library construction were conducted following the manufacturer’s protocol. Sequencing was performed with the Illumina Nextseq 2000 platform (Illumina, USA).
2.5 Single-cell RNAseq data analysis
Basic processing of raw sequencing data was performed in Cell Ranger 7.1.0 (22) using human genome reference GRCh38-2020-A with default parameters. Resulting gene-barcode matrices were analyzed in Seurat (23) in R environment. Doublet cells effect was addressed with scDblFinder (24). SCTransform normalization was used to normalize raw counts. Linear dimension reduction was performed with PCA. Batch correction was performed using Harmony. First 40 Harmony corrected principal components were used in clustering and non-linear dimension reduction via UMAP in Seurat. Resulting cell clusters were annotated using SingleR (25) with Monaco et al. reference (26) and manual annotation with Human Protein Atlas scRNAseq human blood atlas (27). Differential gene expression analysis between sample groups was conducted with pseudo-bulk approach (28). Thus, individual cell clusters having not less than 45 cells and 1000 total raw counts were sample-wise aggregated using sum of raw counts. Batch-effect was corrected using ComBat-seq (29), and differential expression analysis was conducted in DESeq2 package (30). Gene set enrichment analysis (GSEA) was carried out with fgsea package (31). Individual cell clusters having not less than 45 cells and 1000 total raw counts were sample-wise aggregated using sum of raw counts. AUGUR tool (32) was used to indicate most responsive cells to biological perturbations in single-cell data. Compositional data analysis was performed with scCODA tool (33) to analyze changes in cell abundancies. UCell packages (34) was used to evaluate gene signatures distribution among cell clusters and sample groups. Cell-cell communication was profiled with ligand-receptor interaction analysis in Liana tool (35). Gene coexpression networks in monocytes were analyzed with hdWGCNA package (36). Co-expression modules were analyzed with fgsea package to evaluate enrichment of modules in different samples groups. Visualization was performed using Seurat, scCustomize (37), Cpubr (38), EnhancedVolcano (39) and ggplot2 (40).
2.6 DNA extraction
DNA were extracted from lysed monocyte samples using AllPrep DNA/RNA/miRNA Universal Kit (#80224, Qiagen, USA). The quality of DNA was assessed by TapeStation 4150 automated electrophoresis system (#RRID: SCR_019393, Agilent Technology, USA). The quantity of DNA was assessed by Qubit 4 fluorometer (#RRID: SCR_018095, ThermoFisher Scientific, USA).
2.7 Reduced representation bisulfite sequencing
Samples were purified using magnetic beads AMPure XP (Beckman Coulter) and concentration was controlled using Fluoroskan. Libraries were prepared using Zymo-Seq RRBS Library Kit (#D5461) and Zymo-Seq UDI Primer Plate (#D3096) (Zymo Research, USA), according to the manufacturer’s instructions. Sequencing was performed by the Illumina NovaSeq 6000 platform (Illumina, USA).
2.8 Reduced representation bisulfite sequencing data analysis
RRBS sequencing data processing included quality control and trimming of technical sequences, mapping of reads to the reference genome, counting the level of cytosine methylation in the CpG context, and differential methylation analysis. Quality control and trimming of adapter sequences were performed in FastQC programs (41) and Trim_Galore (42). Mapping of RRBS reads to the human reference genome GRCh38 was performed using the Bismark program (43). Cytosine methylation levels in CpG context were also counted in Bismark. Differential methylation analysis was performed in the R environment, using the edgeR package (44), negative binomial modeling of raw methylation counts to search for differentially methylated CpG sites was performed following this manual (45). We obtained a list of genes with hyper- and hypomethylated CpG sites in proximity of promoter regions (-10000 and +10000 bp from transcription start site), and enriched the obtained gene list by biological pathways in the online tool Enrichr (46).
3 Results
3.1 Single cell RNAseq analysis revealed tumor-specific re-programming of peripheral blood monocytes
PBMCs were obtained from six patients with high-grade serous ovarian carcinoma (HGSOC) and six healthy donors (Figure 1A). Blood samples were collected after 2-3 courses of platinum-based neoadjuvant chemotherapy (NACT) for three patients and after surgery without NACT courses for other three cases. All patients underwent adjuvant chemotherapy (paclitaxel+carboplatin) after surgery. Isolated PBMCs were analyzed on a 10x Chromium platform, and the transcriptome of each sample was obtained using Illumina NextSeq 2000 platform. Raw sequencing reads were processed using Cell Ranger 7.1.0 (look material and methods section) to perform quality control, read alignment in individual cells, and count gene-barcode matrix. Resulting gene-barcode matrices were processed via Seurat package in R environment. Cells with less than 300 detected genes, 1000 UMIs, 5% of ribosomal transcripts, and more than 10% of mitochondrial transcripts were filtered out as low-quality cells. Removal of cell doublets was addressed with scDblFinder tool. Raw counts normalization was performed via SCTransform for further PCA and UMAP dimension reduction and Louvain clustering in Seurat. A total of 28,779 high-quality cells and 17 cell clusters were obtained for analysis. Two samples obtained from healthy donors failed quality control (QC) and were excluded in the further analysis. UMAP plots of PBMCs derived from treated and untreated patients with HGSOC (n = 6) and healthy donors (n = 4) are shown in Figure 1B. The PBMC clusters were annotated automatically using SingleR tool with Monaco et al. reference and manually using Human Protein Atlas human blood single-cell atlas (27). Concordant result was used as final annotation comprising following known cell lineages: T/NK cells (Treg; CD4.T.naive; CD8.T.naive; CD4.T.EM; MAIT.T.; CD8.T.EM; NK.CD56lo; NK.CD56hi), myeloid cells (CD14.Mn.S100A8.9hi; CD14.Mn.MHC2hi; CD16.Mn; mDC), B-cells (B.naïve; B.memory; Plasma.cell), pDC and Platelets (Figure 1B). Top marker genes for each cell type cluster are indicated in Dot plot (Figure 1C).
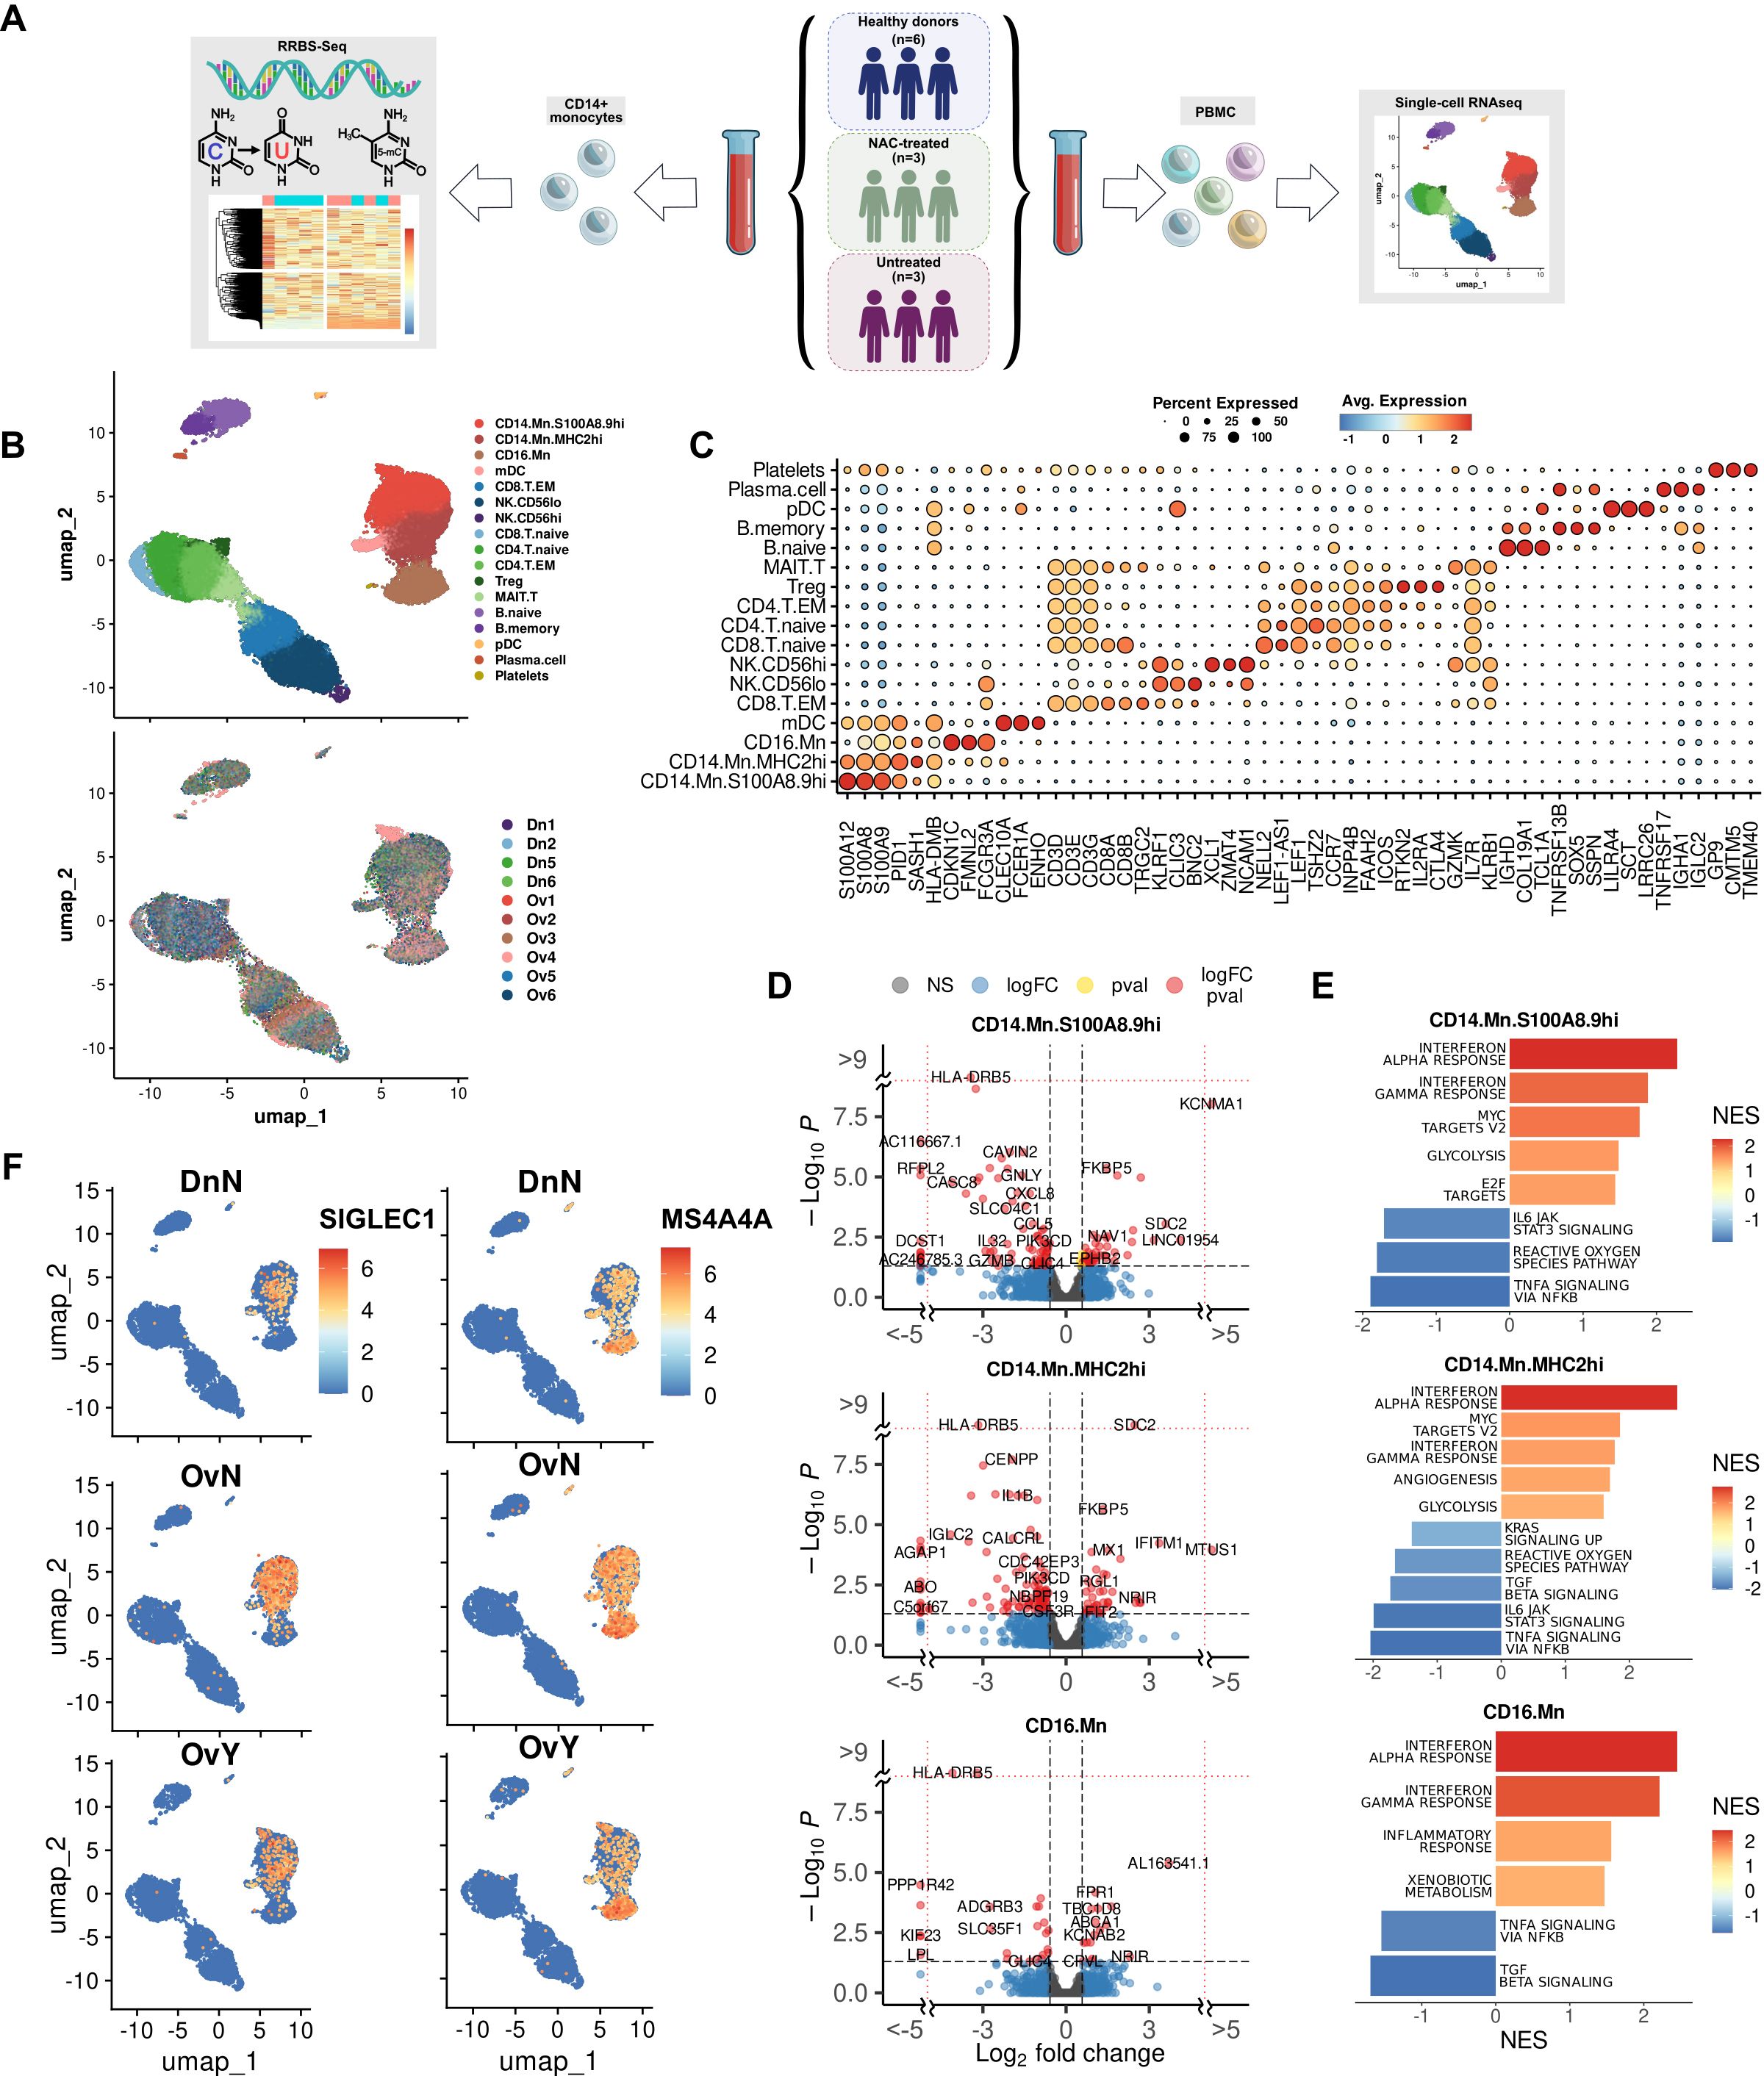
Figure 1. Single cell RNAseq analysis of PBMCs in high-grade serous ovarian carcinoma revealed tumor-specific programming of monocytes (A) Overall study design. (B) Distribution of PBMC cell clusters and individual samples in UMAP 2D dimensions. (C) Dot plot discriminates marker genes for each cluster. (D) Volcano plots demonstrate p-value and log2fold-change value for DEGs in each monocyte subpopulation (CD14.Mn.S100A8.9hi; CD14.Mn.MHC2hi; CD16.Mn) versus healthy control (|L2FC|>0.58, FDR<0.05). (E) Bar plots with GSEA results indicate top deregulated pathways in each monocyte subpopulation (CD14.Mn.S100A8.9hi; CD14.Mn.MHC2hi; CD16.Mn) versus healthy control (FDR<0.1). (F) Localization of SIGLEC1 and MS4A4A gene expression among individual cells on UMAP. DnN – healthy control (donor group), OvN – treatment-naive group, OvY – NAC-treated group.
We next proceeded with detailed analysis of monocyte cell cluster to elucidate the differences in monocyte profile between the tumor and healthy states. In order to detect differentially expressed genes between three groups, we used pseudo-bulk approach with DESeq2. The analysis revealed the tumor-specific functional activation of the following processes: cell surface interactions at vascular wall, glycolysis, MTORC1 signaling, serine/threonine kinase activity, angiogenesis, interferon alpha/beta signaling, and interferon gamma signaling. Among up-regulated genes there were SDC2, FKBP5, MX1, IFITM1, DAPK1, FABP5, SIGLEC1, CEBPD, ABCA1, AREG, CD63, and others (Supplementary Figure S1A). The most significant down-regulated genes included HLA-DRB5, HLA-DQA2, LRAR1, CXCL8, IL1B, JUNB, CCL5, GZMB, TNF, and IL32 related to MHC II protein complex, chemokine and cytokine activity, LPS-mediated signaling, TLR signaling, neutrophil migration and chemotaxis, and antigen binding (Supplementary Figure S1B). We concluded that tumor induces monocyte reprogramming towards activating monocyte interaction with vascular wall and suppressing antigen presentation and immune-inflammatory state.
We then questioned whether it can be related to variability in gene patterns for distinct monocyte subpopulations. Three main subpopulations of monocytes were assigned based on the distinct marker profile: CD14.Mn.S100A8.9hi, CD14.Mn.MHC2hi and CD16.Mn (Figures 1B, C). We investigated tumor-related changes in each monocyte subset separately. In CD14.Mn.S100A8.9hi cluster, cancer-specific genes of interest included SIGLEC1, MX1, FKBP5, AREG, HBEGF, LYZ, OAS1, CEBPD, FABP5, MARCO, CD163, DAPK1, and PECAM1 among others, related to interferon alpha/gamma pathway, glycolysis, MTORC1 signaling, hypoxia, endocytosis receptor activity, and serine/threonine kinase activity (Figures 1D, E). In CD14.Mn.MHC2hi cluster the up-regulation of the following genes of interest was detected in cancer: SDC2, MS4A4A, MX1, FKBP5, OAS1, CEBPD, FABP5, DAPK1, CD63, IFITM1, VSIG4, and CXCR4 annotated with interferon alpha/gamma, MYC targets, angiogenesis, glycolysis, oxidative phosphorylation, MTORC1 signaling, and HSF1 activation. Among suppressed pathways there are inflammation, neutrophil chemotaxis, antimicrobial activity, and TGFb-signaling (Figures 1D, E). CD16.Mn cluster was less represented in amount with activated genes in cancer samples. Higher expression of HIF1A, ABCA1, FPR1, CD63, and FCN1 was found in cancer compared to healthy state (Figures 1D, E).
Several up-regulated genes, i.e. SIGLEC1 and MS4A4A were indicative only for monocyte cluster within whole PBMC population (Figure 1F). We focused on two functionally attractive for monocyte/macrophage lineage cell genes – SIGLEC1 and MS4A4A. Herewith SIGLEC1 is specifically expressed in CD14.Mn.S100A8.9hi cluster, and MS4A4A was significantly indicative for CD14.Mn.MHC2hi cluster (Figure 1F).
In total, the presence of cancer induced general pro-tumor reprogramming of monocytes by activating interferon pathways, angiogenesis, glycolysis, oxidative phosphorylation, and lipid metabolism. These changes were strongly indicative for S100A8.9hi and MHC2hi subsets, but in less extend for CD16 subset.
3.2 Platinum-based chemotherapy induces monocyte transcriptional programming that differs from overall tumor-specific changes in monocyte profile
In advanced ovarian cancer NACT is a treatment strategy that favors optimal cytoreduction and decreases rates of perioperative morbidity. Despite the high response rate to NACT, tumor progression after or during NACT courses remains an unresolved challenge (8, 47). There is still no indication for immunotherapy for HGSOC patients treated or untreated with NACT, and the lack of effective molecular and cellular targets justifies the intensive investigations of immune-related mechanisms (48). The data on monocyte reprogramming under the chemotherapy in cancer is limited (15). To understand whether chemotherapy can affect monocyte profile in ovarian cancer, we performed comparative analysis of a) NACT-treated PBMC samples with untreated PBMCs and b) NACT-treated PBMC samples with healthy donors` samples.
First, we questioned which cell types are the most responsive to NACT-dependent effects in our single-cell data. We applied Augur, a method to prioritize the cell types most responsive to biological perturbations in a multidimensional space of single-cell data (32). Augur employs a machine-learning framework abolished the dependence on the total number of cells. Mathematically, this method uses area under the receiver operating characteristic curve (AUC) accounting both the amount and magnitude of simulated differential expression. According to this method, cell subsets in NACT-treated samples where the Augur score increased significantly (Augur score more than 0,7) compared to healthy control, included pDC [0,731], CD14.Mn.MHC2hi [0,726], and CD16.Mn [0,715] (Figure 2A). When comparing untreated samples with healthy controls prioritized cell populations included Plasma.cell [0,768] and NK.CD56lo [0.715] (Figure 2A). In compliance with this algorithm, monocyte cluster undergoes a more extensive transcriptional reprogramming particularly under NACT rather than just in the presence of the tumor overall.
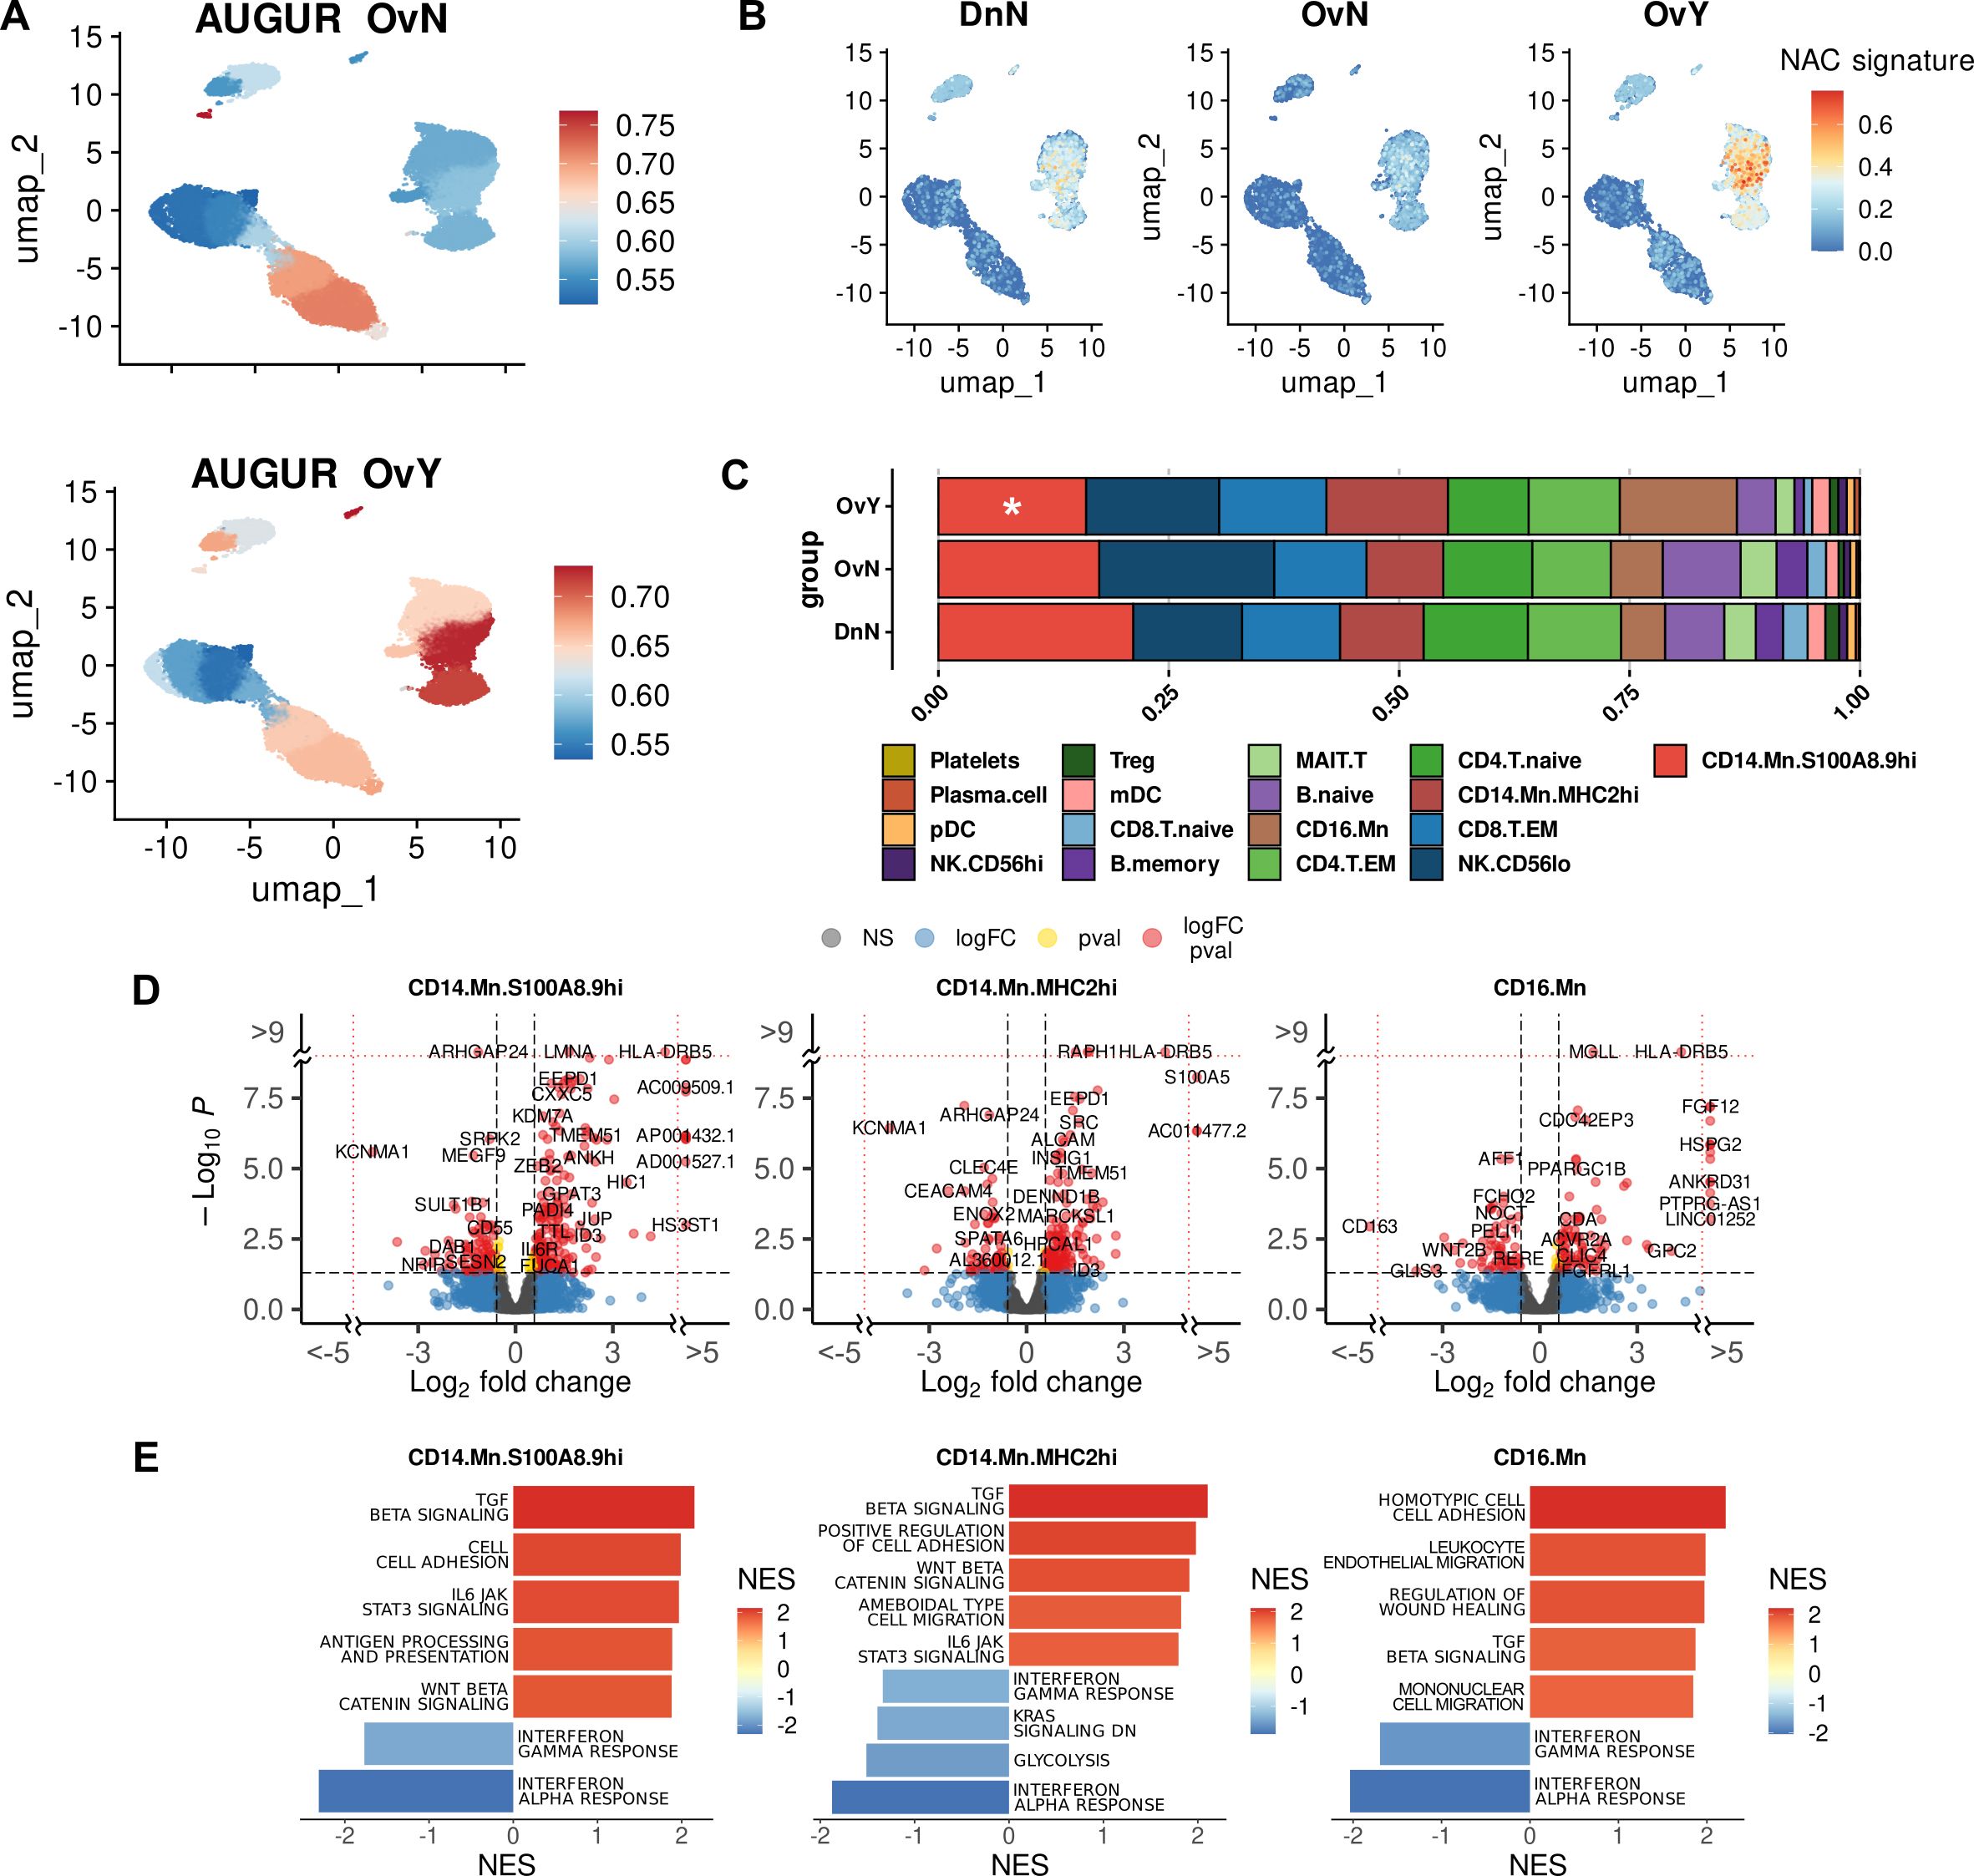
Figure 2. Chemotherapy-induced transcriptional programming in cancer monocytes (A) Augur demonstrates top-affected cell types in naive tumor PBMCs (upside) and in NAC-treated PBMCs (underside) (indicated by Augur score). (B) NAC-related gene signature obtained using UCell tool. (C) Abundance plot demonstrated cell content in studied cohorts. *Significant difference in cell abundance in NAC vs. Dn (FDR<0.1). (D) Volcano plots demonstrate p-value and log2fold-change value for DEGs in each monocyte subpopulation (CD14.Mn.S100A8.9hi; CD14.Mn.MHC2hi; CD16.Mn) of NAC-treated monocytes versus healthy control (|L2FC|>0.58, FDR<0.05). (E) Bar plots with GSEA results indicate top deregulated pathways in each monocyte subpopulation (CD14.Mn.S100A8.9hi; CD14.Mn.MHC2hi; CD16.Mn) of NAC-treated monocytes versus healthy control (FDR<0.1). DnN – healthy control (donor group), OvN – treatment-naive group, OvY – NAC-treated group.
Further in-depth bioinformatic analysis confirmed that chemotherapy affects the monocyte transcriptome more intensely than the tumor-related systemic influence from untreated samples. In NACT-treated patients, there were 241 (FDR < 0.05) activated genes in total in the monocyte cluster compared to healthy donors. This is more than six times the number of activated genes in untreated cancer samples versus healthy controls (39 genes, FDR < 0.05). The most interesting genes included TMEM51, NOTCH1, EEPD1, MAFB, HLA-DRB5, LRPAP1, TSNARE1, HDAC9, SNAI3, SEMA4A, MARCO, CD63, LRPAP1, ABCA1, and HLA-DQB2 among others, annotated with lipid metabolism, NOTCH signaling, cellular response to low-density lipoproteins, mononuclear cell differentiation, lymphocyte/leukocyte differentiation, regulation of Ras protein signal transduction, regulation of small GTPase mediated signal transduction, leukocyte transendothelial migration, oxidative phosphorylation, VEGF signaling, adhesion molecule binding, MTORC1 signaling, and WNT beta catenin signaling (Supplementary Figures S2A, B). Such functional pathways like TLR receptor signaling, TNF signaling pathway, complement activation, humoral immune response, and cellular amino acid catabolic processes were suppressed in monocytes under NACT. In monocyte subpopulations (CD14.Mn.S100A8.9hi, CD14.Mn.MHC2hi and CD16.Mn) there were some specific changes under NAC compared to healthy control monocytes (Supplementary Figures S2C, D).
When comparing NACT-treated samples with untreated ones in cancer patients the expression of TMEM51, NOTCH1, EEPD1, MAFB, and HLA-DRB5 remained increased in monocytes of treated patients (Figure 2B). All these genes are remarkably specific for monocyte cluster within other PBMC clusters as well as for CD14.Mn.S100A8.9hi and CD14.Mn.MHC2hi subpopulations, but not for CD16.Mn (except HLA-DRB5) one within the whole monocyte cluster. Functional annotations confirmed the particular activation of the following pathways for NACT-treated monocytes when comparing to untreated ones: leukocyte transendothelial migration, MHC class II protein complex binding, cell adhesion molecules, TGFb signaling, cholesterol homeostasis, Wnt beta catenin signaling, and ECM binding (Supplementary Figures S2E, F). Interesting that SIGLEC1 remained to be a signature gene for S100A8.9hi untreated monocytes, and MS4A4A – for MHC2hi untreated monocytes. It means that chemotherapy may not affect their expression. By comparing treated vs untreated cancer samples, we also found upregulation of glycolysis regulator PFKFB3 in NACT-induced monocytes. In our recent study PFKFB3 was indicated as a prognostic biomarker for colon cancer (19). Its expression was significantly elevated in peripheral blood monocytes in colon cancer compared to rectal cancer and healthy control. PFKFB3 expression correlated to M2-polarized macrophages and indicated poor prognosis in colon cancer patients (19).
To show what affected the change of the monocyte subpopulation composition more – the tumor itself, in case of tumor-naïve samples, or the added effect of chemotherapeutic treatment we then analyzed our single-cell data comparing compositional changes of major cell types in PBMCs between cancer patients and healthy controls. The single-cell compositional data analysis (scCODA) was applied (30). In contrast to other commonly used models, scCODA proposes Bayesian approach for cell-type composition differential abundance analysis. It allows to work with low number of experimental replicates and accounts joint modeling of all measured cell-type proportions instead of individual ones. Reference cell type was set automatically to NK.CD56hi. Decreased proportions of CD14.Mn.S100A8.9hi cell subsets were observed in NACT-treated cancer patients compared to healthy controls (log2FC=0,824, FDR=0,1) (Figure 2C). It can be explained by their facilitated recruitment to tumor promoted by chemotherapeutic treatment (49). Despite the only slight decrease in the amount of S100A8.9hi monocytes, this fact did not diminish NACT-mediated effects.
We analyzed specific effects of NAC by comparison of NAC-treated monocytes vs. treatment-naive samples. In CD14.Mn.S100A8.9hi subset we found the upregulation of mentioned above NACT-affected genes TMEM51, NOTCH1, EEPD1, MAFB, and HLA-DRB5 as well as more unique genes for this cluster SERPINB2, SMAD6, TGFBR2, ID1, PXN, ADAM10, ADAM9, ITGAX, IL31RA, IL6R, and RHOU among others. The activation of cell adhesion molecule binding, MHC class II protein complex binding, leukocyte transmigration, TGFb signaling, and other pathways was observed (Figures 2D, E). The expression of such genes as HLA-DQA2, CD300LD, S100A5 LGALS1, ELOVL5, SPRED2, SLC2A3, ELOVL5, NINJ1, HMGA1, and E2F3 was exclusively elevated in CD14.Mn.MHC2hi monocytes of treated patients compared to untreated monocytes. Activated genes were related to the following pathways: peptide antigen assembly with MHC protein complex, leukocyte cell-cell adhesion, positive regulation of wound healing, regulation of Notch signaling pathway, regulation of cell-cell adhesion, regulation of angiogenesis, leukocyte transendothelial migration, Rap1 signaling pathway, adherens junction, and antigen processing and presentation (Figures 2D, E). CD16.Mn subset was less numerically significant compared to other subsets (Figures 2D, E).
3.3 Antigen presentation is a distinct feature for chemotherapy-induced monocytes
Platinum-based chemotherapy can induce immunogenic cell death (ICD) associated with tumor cell damage, leading to cell surface protein expression, cytokine secretion, or plasma membrane rupture and subsequent release of the intracellular material (50, 51). The released intracellular molecules that are damage-related molecular patterns (DAMPs) make antigen-presenting cell (APCs) including macrophages sensitive to the recognition of tumor antigens. MHC class II molecules are expressed primarily on the surface of APCs and present peptides derived from extracellular antigens (52). Monocytes/macrophages are the most abundant MHC class II positive cells in tumor microenvironment (53).
Surprisingly, we revealed notable and specific upregulation of genes of MHC class II protein complex, in monocytes under chemotherapy treatment, but not in untreated monocytes. These genes include HLA-DRB5, HLA-DQA2, HLA-DQB1, and HLA-DQB2 (Figure 3A). Increased MHC class II gene expression was driven largely by classical monocytes (S100A8.9hi and MHC2hi) it was a feature of chemotherapeutic impact across all three monocyte subsets. Antigen presentation requires not only the expression of HLA genes on APCs, but also the activation of T cells (54, 55). We analyzed whether T lymphocytes which interact with APCs can be functionally affected by NACT. No remarkable changes were observed in CD4 naïve T, CD4 memory T, and Treg cells. But there were significant changes in transcriptomic profile of CD8 memory T cells. We noticed decreased expression of IL7R, IL12RB2, IL5RA, IL21R, GZMK, and other genes in CD8.T.EM subset (Figure 3B). These interleukin receptors are responsible for thymic development, T cell maturation and T-cell immune response (56–58), and their inhibition can lead to defected immune response. Downregulation of these T cell regulatory genes was observed for both NACT-treated and untreated samples, indicating that changes in CD8+ T cell transcriptome is induced by tumor-released factors and are not altered by chemotherapy (Supplementary Figures S3A, B).
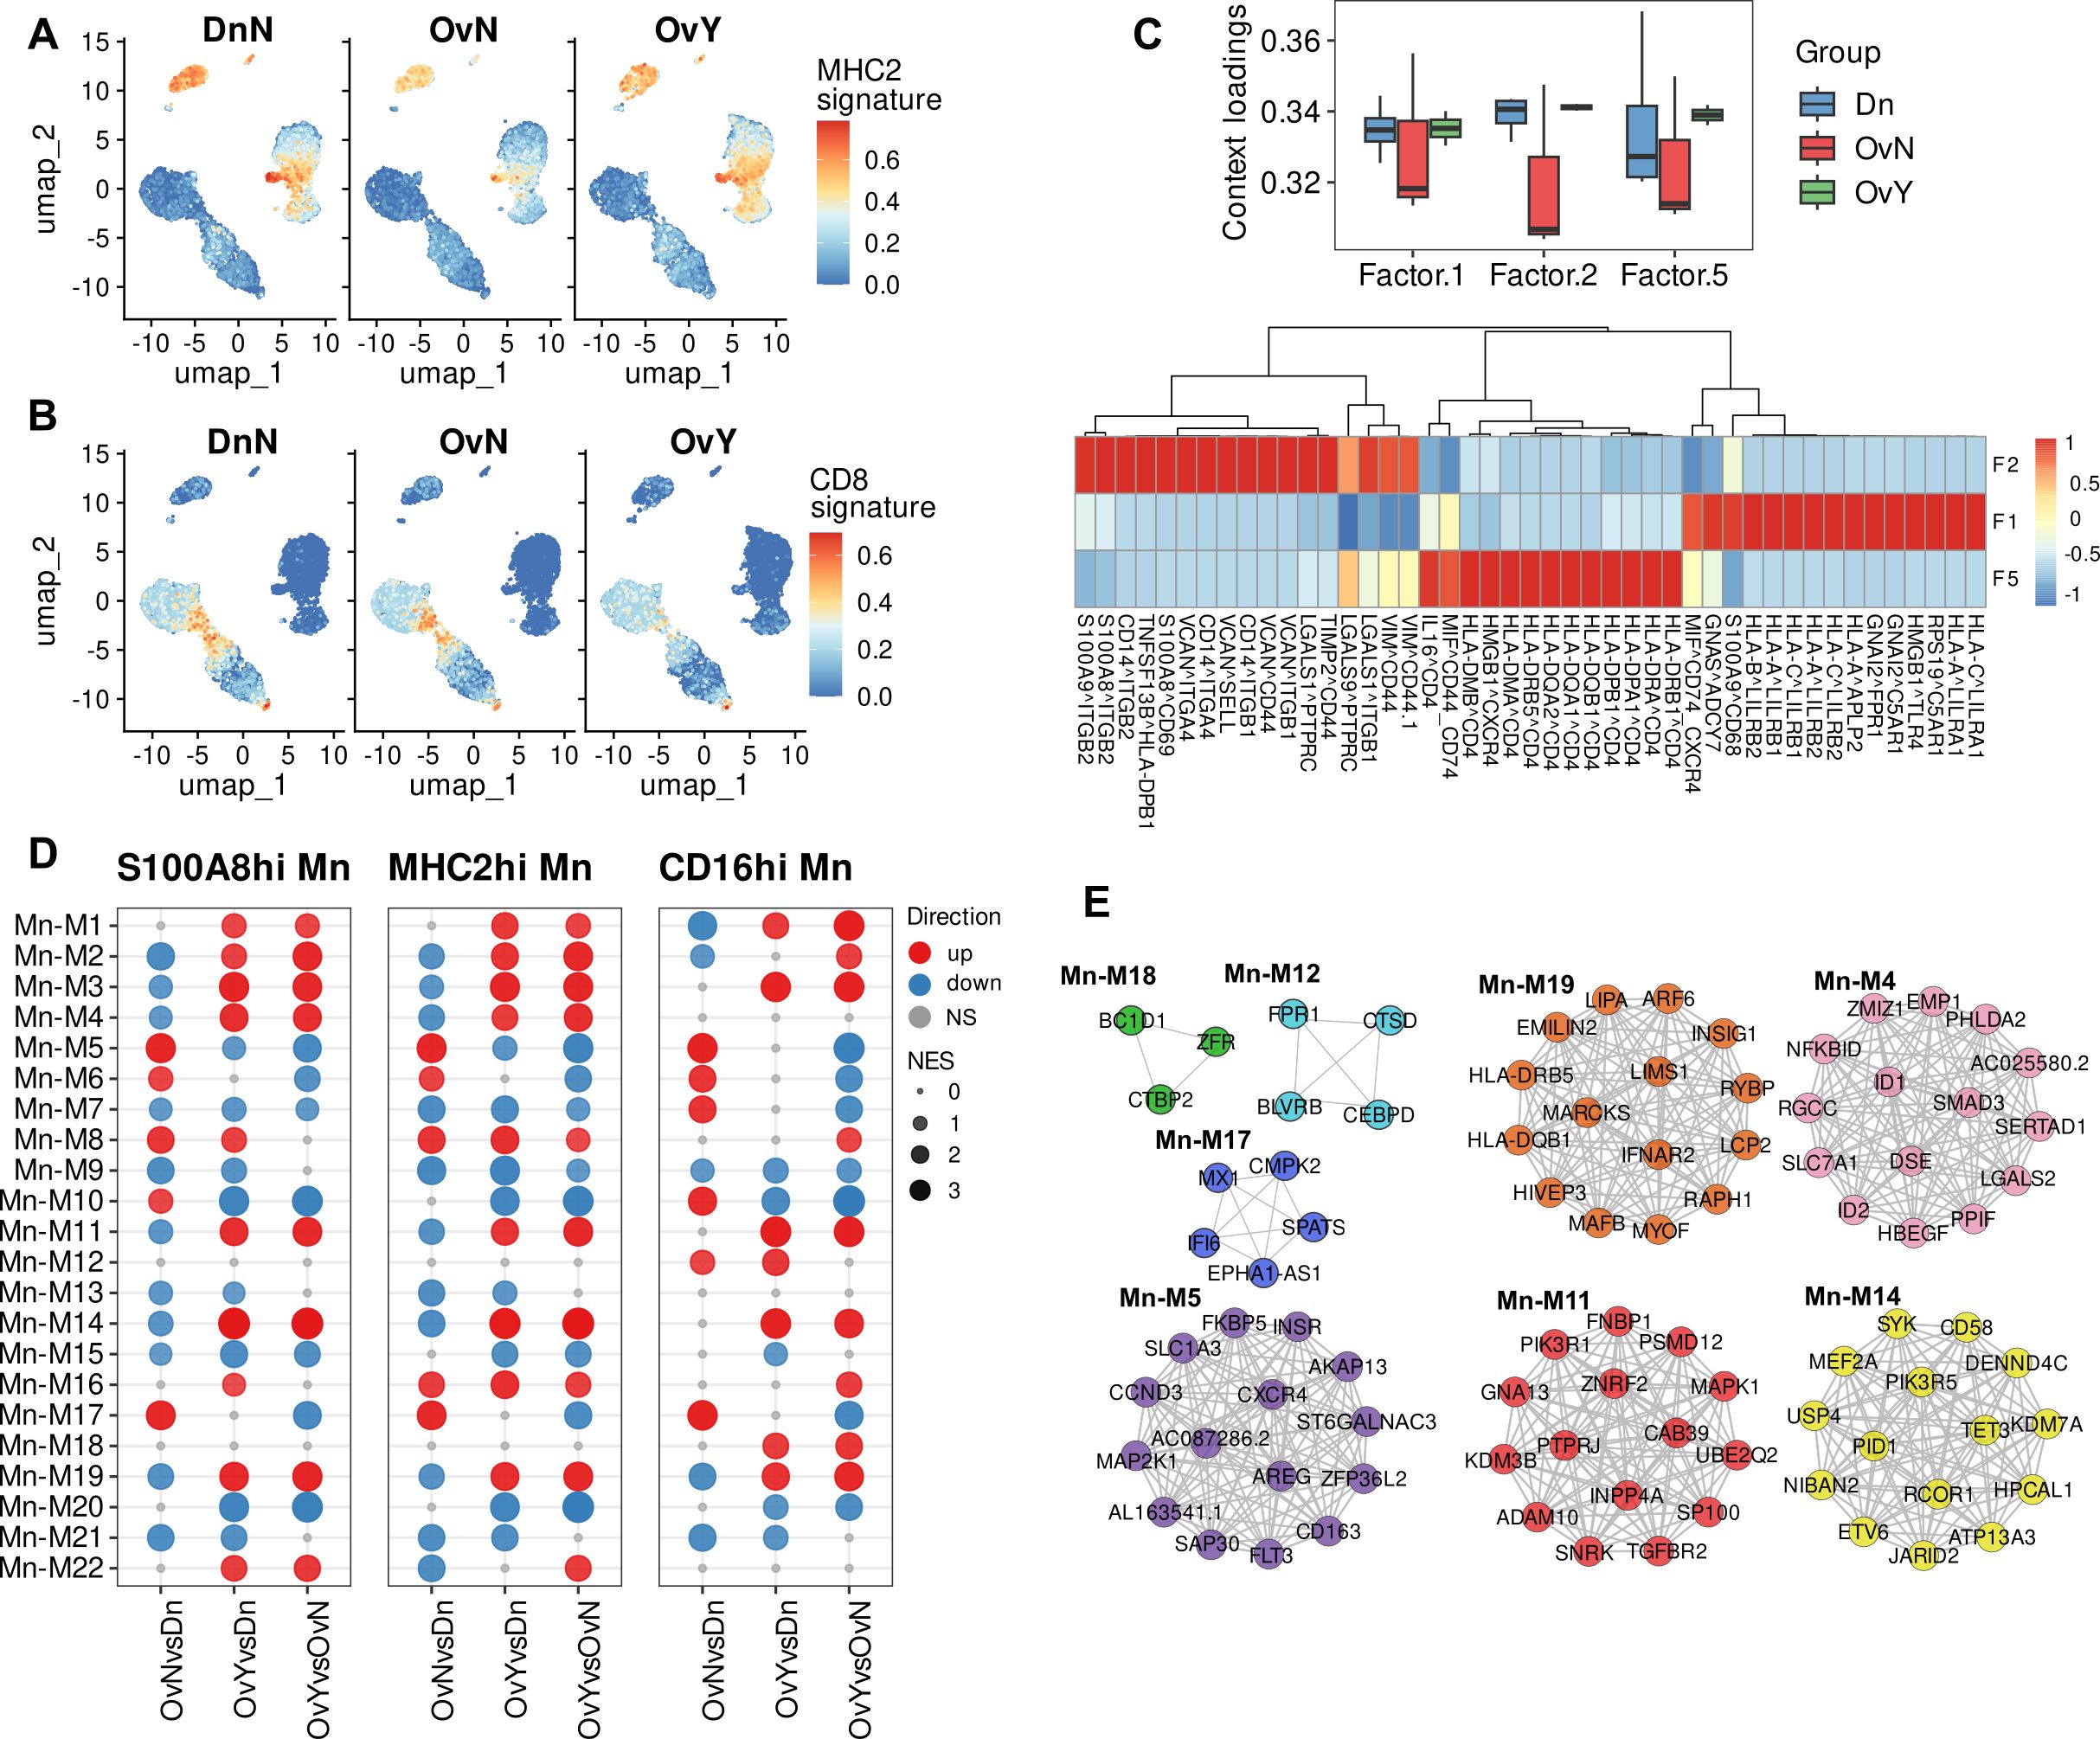
Figure 3. Chemotherapy induces activation of antigen presentation in peripheral blood monocytes. (A) NAC-related gene signature (MHC2 signature) obtained using UCell tool. (B) CD8-associated gene signature obtained using UCell tool (C) Factor loadings per each group (constructed using LIANA with Tensor-cell2cell) (Upside). Top 15 ligand-receptor pairs associated with factor 1, factor 2 and factor 5 (Underside). (D) Module enrichment with GSEA in individual comparison by monocyte subpopulations (CD14.Mn.S100A8.9hi; CD14.Mn.MHC2hi; CD16.Mn) (FDR<0.05). NS, not significant. OvNvsDnN – treatment-naive vs. healthy control; OvYvsDn – NAC-treated vs. healthy control; OvYvsOvN – NAC-treated vs. treatment-naive. (E) DEGs (FDR<0.1) reveled in distinct module-associated groups.
We then directed to ligand-receptor identification which may underlie the interactions within PBMCs. To decipher cell-cell communications in PBMCs affected by NACT, we used tool integrated LIANA, a database of ligand-receptor interactions, and Tensor-cell2cell, a dimensionality reduction approach devised to uncover cell-cell communication programs across multiple samples (59). After inferring cell-cell communication with LIANA from our PBMC data, and running a Tensor Component Analysis with Tensor-cell2cell, 7 factors were obtained (Supplementary Figure S4), each of which represents a different cell-cell communication program. Four vectors that include the sample, ligand-receptor interaction, sender cell type, and receiver cell type were obtained for each factor (Supplementary Figure S4).
Applied bioinformatics tool demonstrated that factor 5 was associated with antigen presentation via MHC class II molecules and their interactions with CD4 T cells (Figure 3C). We then focused on the factors where monocytes were “sender cells” or “receiver cells”. Most selectively monocytes act as the “receiver cells” within other PBMCs in factor 1. In-depth analysis revealed that Factor 1 is related to antigen presentation via MHC class I molecules as well as monocyte activation (Figure 3C). Oppositely, in factor 2 monocytes in addition to acting as the “receiver cells”, also were the main “sender cells”. A number of cell-cell interactions, associated with adhesion molecules, were indicative of factor 2 and likely characterized the adhesion to the vascular wall, which conforms to the DEG analysis described above. Most interesting was the fact that factor 1 and factor 2 were suppressed in untreated patients and were similar for NACT-treated samples and donors’ samples, while factor 5 related to antigen presentation via MHC class II was upregulated in NACT-induced PBMCs. This is in line with our above-mentioned results and further confirms the noticeable activation of antigen presentation via MHC class II in monocytes under chemotherapy.
3.4 Chemotherapy-induced antigen presentation potential in monocytes is accompanied by inhibition of interferon signaling and activation of pro-tumor monocyte polarization
Next, we analyzed gene networks provided by distinct co-expression modules built by closely correlated transcript patterns. We used hdWGCNA, a comprehensive base for analyzing co-expression networks in high-dimensional transcriptomics data (36). This bioinformatics tool allowed us to reveal 22 co-expression modules for monocytes that differed between investigated groups (Figure 3D). All modules contain strongly correlated hub genes. Functional annotations performed with Enrichr and names we gave to modules are indicated in Table 1.
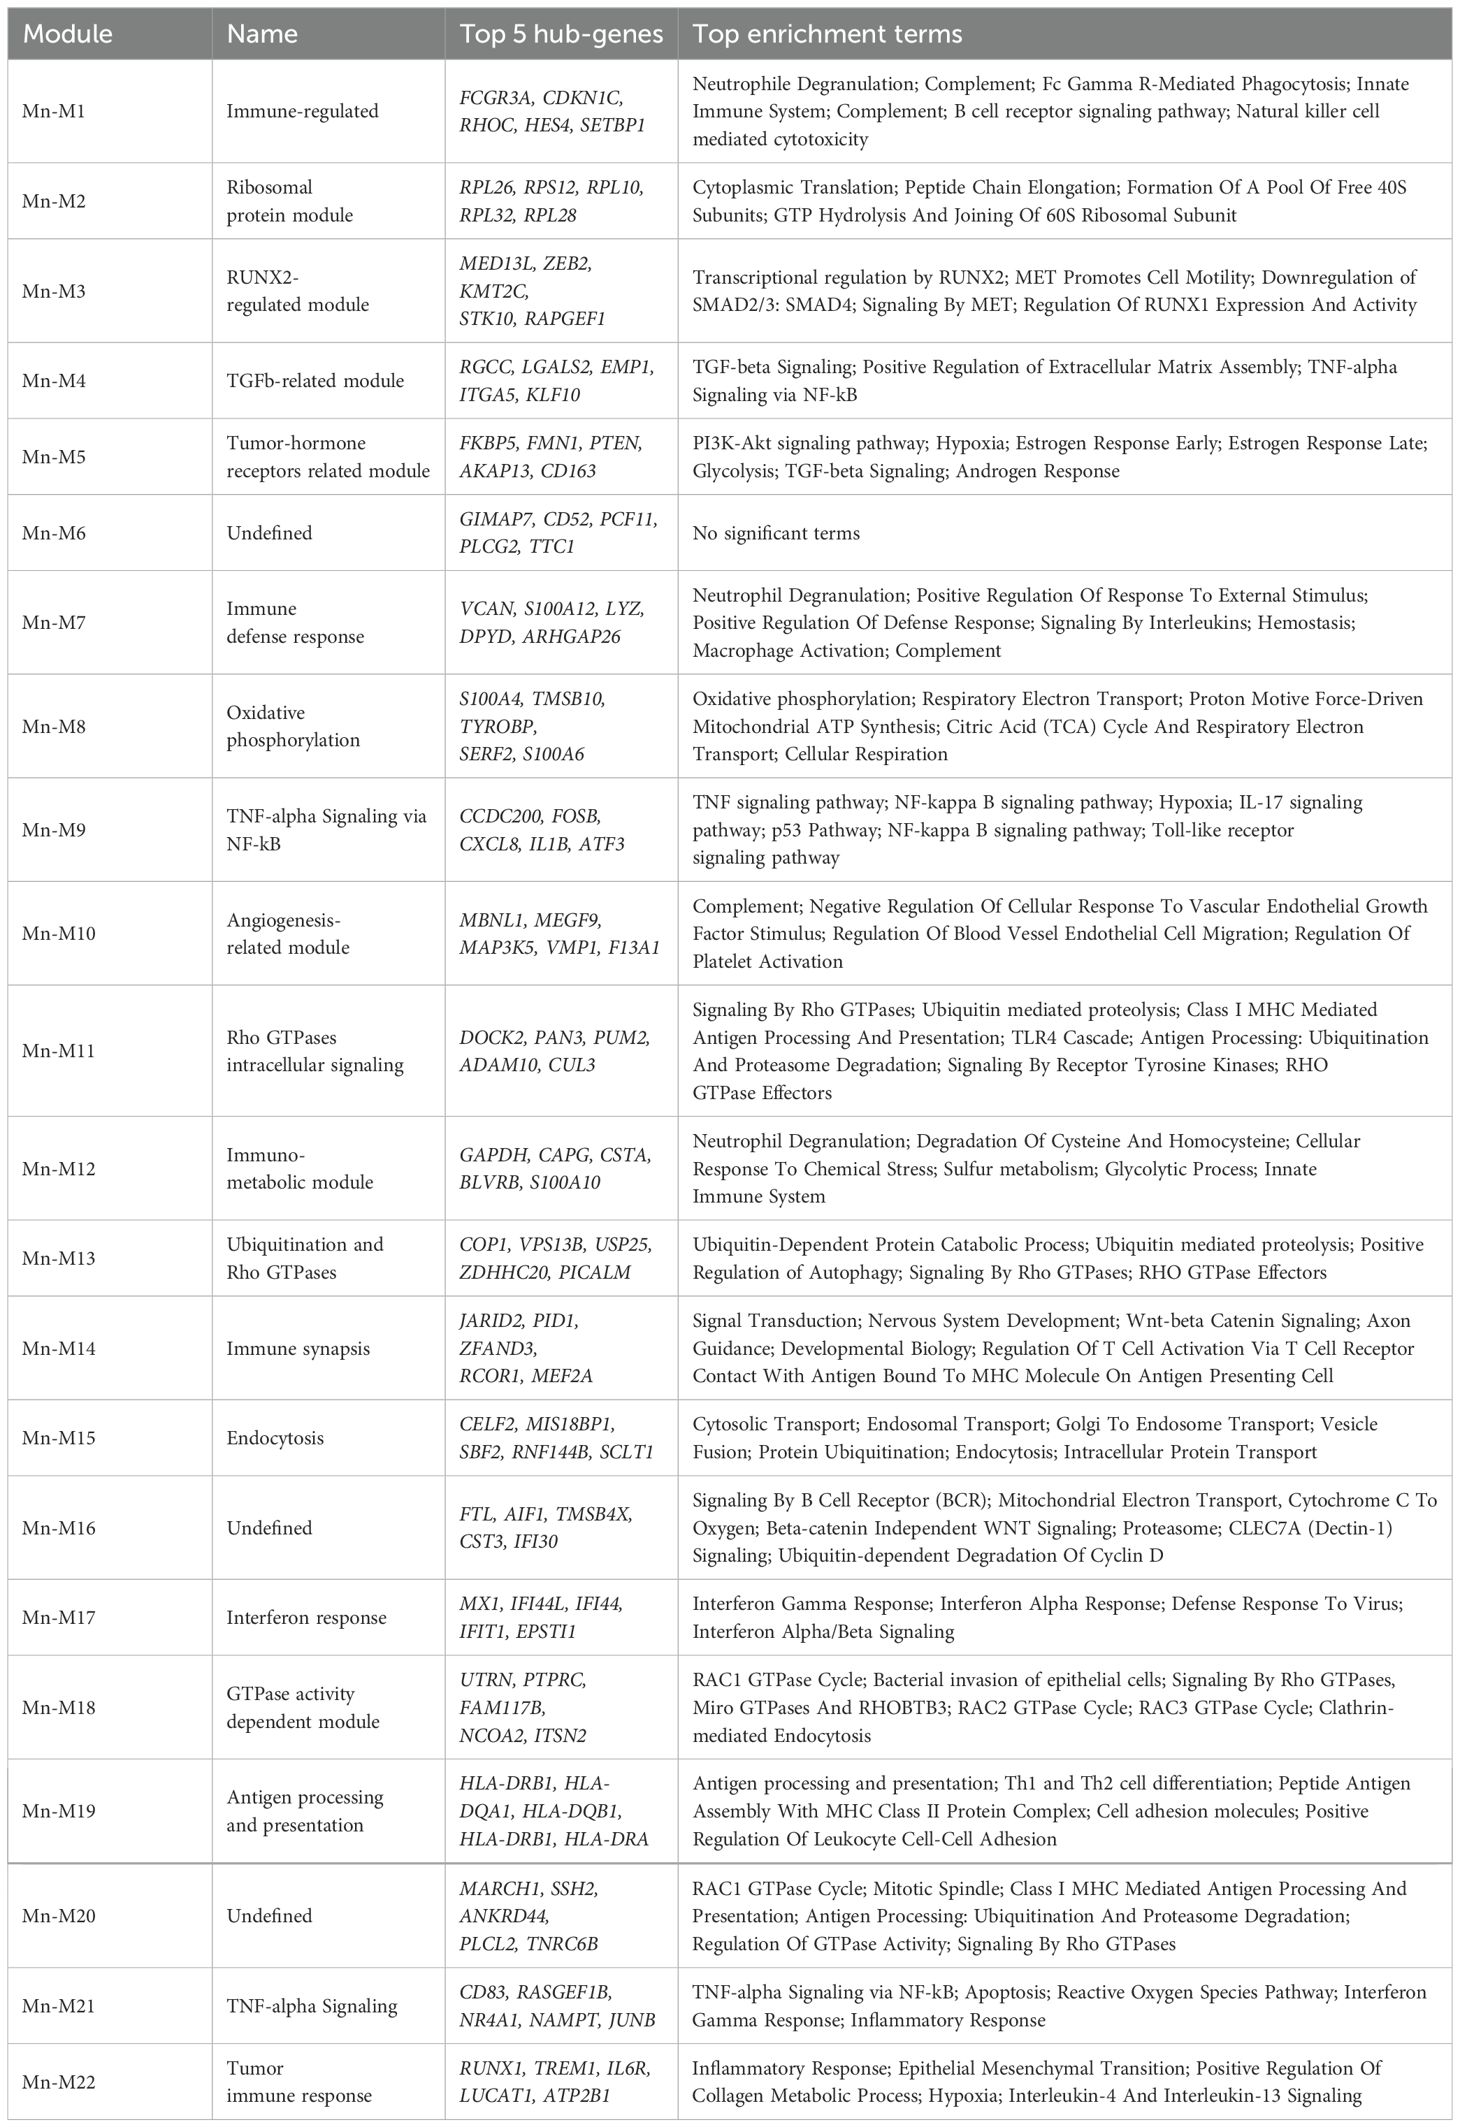
Table 1. Module characteristics.
We registered the most essential alterations in modules M4, M5, M7, M11, M14, M17, and M19. Among these modules, M4, M11, M14 and M19 were significantly upregulated in NACT-affected monocytes (Figure 3D). Module of special focus was M19 related to antigen presentation via MHC class II. HLA-DR and HLA-DQ genes formed hub gene pattern for this module (Figure 3E). Module 4 was characterized by multiple processes mainly related to TGFb signaling, one of the main indicator of M2 pro-tumor macrophage polarization (12). M11 was associated with Rho GTPases intracellular signaling that regulates cell adhesion and motility, as well as endocytic and exocytic vesicle trafficking (59, 60). Module 14, which we annotated as “immune synapse”, was functionally attractive. This module caught our close attention due to the significant upregulation of its core genes associated with the formation of immune synapses (61–63) in our NACT-treated samples. Less is known about the formation of such synapses between monocytes and lymphocytes, but it is critical for understanding how the presentation of tumor antigens from macrophage/monocyte to T cell can be impaired by anti-cancer treatment.
Oppositely, M17 related to interferon response was clearly suppressed in NACT-treated samples but activated in tumor untreated samples. We referred M7 to immune defense response module and it was accurately inhibited in both treated and untreated cancer samples, indicating general tumor-induced immune suppression. Different mechanisms of immune dysfunction in cancer are known (64, 65). Interesting observation was made for M5 that was assigned with processes related to the tumor-hormone receptors interactions, including estrogen and androgen responses (Table 1). M5 expressed differently in treated and untreated samples: increased in treatment-naïve samples and downregulated in NACT-affected ones (Figure 3D). Altogether these data indicated that NACT induces antigen presentation activity coming with inhibition of IFN-dependent factors, immunosuppression and increasing pro-tumor orientation.
M12 and M18 were clearly defined as CD16-spesific modules and were annotated with multiple immune regulated functions as well as with GTPase activity. According to the literature data, non-classical CD14lowCD16hi monocytes involved in the patrolling and innate local surveillance, and did not cross-present antigen to CD8+ T cells (66). Non-classical monocytes patrol the vasculature, clearing dying endothelial cells, and protecting vessel health (49, 67). Above we noticed that despite the CD16hi subset undergoing both overall tumor-dependent and NACT-specific changes, these changes are represented less extensively compared to CD14-expressing subsets (S100A8.9hi and MHC2hi).
3.5 Chemotherapy-activated antigen presentation potential in monocytes is not epigenetically controlled
It is known that functional reprogramming of cells can be driven by synchronized regulation of gene expression, which is mediated by epigenetic modulation (68). To check whether the expression of HLA class II genes is regulated epigenetically, we performed CpG methylation analysis by reduced representation bisulfite sequencing (RRBS). RRBS was done on peripheral blood CD14+ monocytes obtained from eight HGSOC patients (n=3 for NACT-treated and n=5 for treatment-naïve) and healthy volunteers (n=10). Raw read processing and QC resulted in eight high quality samples having about 30 million raw reads each. After CpG methylation calling in Bismark there were around 385 million CpG sites detected with 40.5% mean methylation in group without NACT and 41.3% mean methylation in NACT group. Raw CpG coverage matrices from Bismark were imported in R environment and analyzed using generalized linear modeling in edgeR package. CpG sites were excluded if came from chrY and unassembled chromosomes and if had less than 8x coverage resulting in 1,303,255 CpG sites. M-values of CpG methylation was used in exploratory analysis. Top 10 000 variable CpG sites were used in principal component analysis (PCA) and hierarchal clustering (Figures 4A, B). Exploratory analysis did not indicate significant difference between NACT-treated and treatment-naïve samples. Differential methylation analysis revealed 67 differentially methylated CpG sites in NACT group and 33 differentially methylated CpG sites in treatment-naïve group (FDR<0.25) near promoter regions: +/- 10 kb from TSS (Figure 4C). Functional annotation of genes with differentially methylated CpG sites near promoter region did not indicate any biological processes observed in scRNAseq data. We also did not find methylation/demethylation of CpG sites in HLA class II or other regulators of antigen presentation or even tumor activity (Figure 4D). We did not find any valuable changes when we analyzed differentially methylated CpG sites in treatment-naïve vs. healthy control (Supplementary Figures S5A–D) and NAC-treated vs. healthy control (Supplementary Figures S5E–G). We concluded that chemotherapy-activated programs in monocytes were not epigenetically controlled.
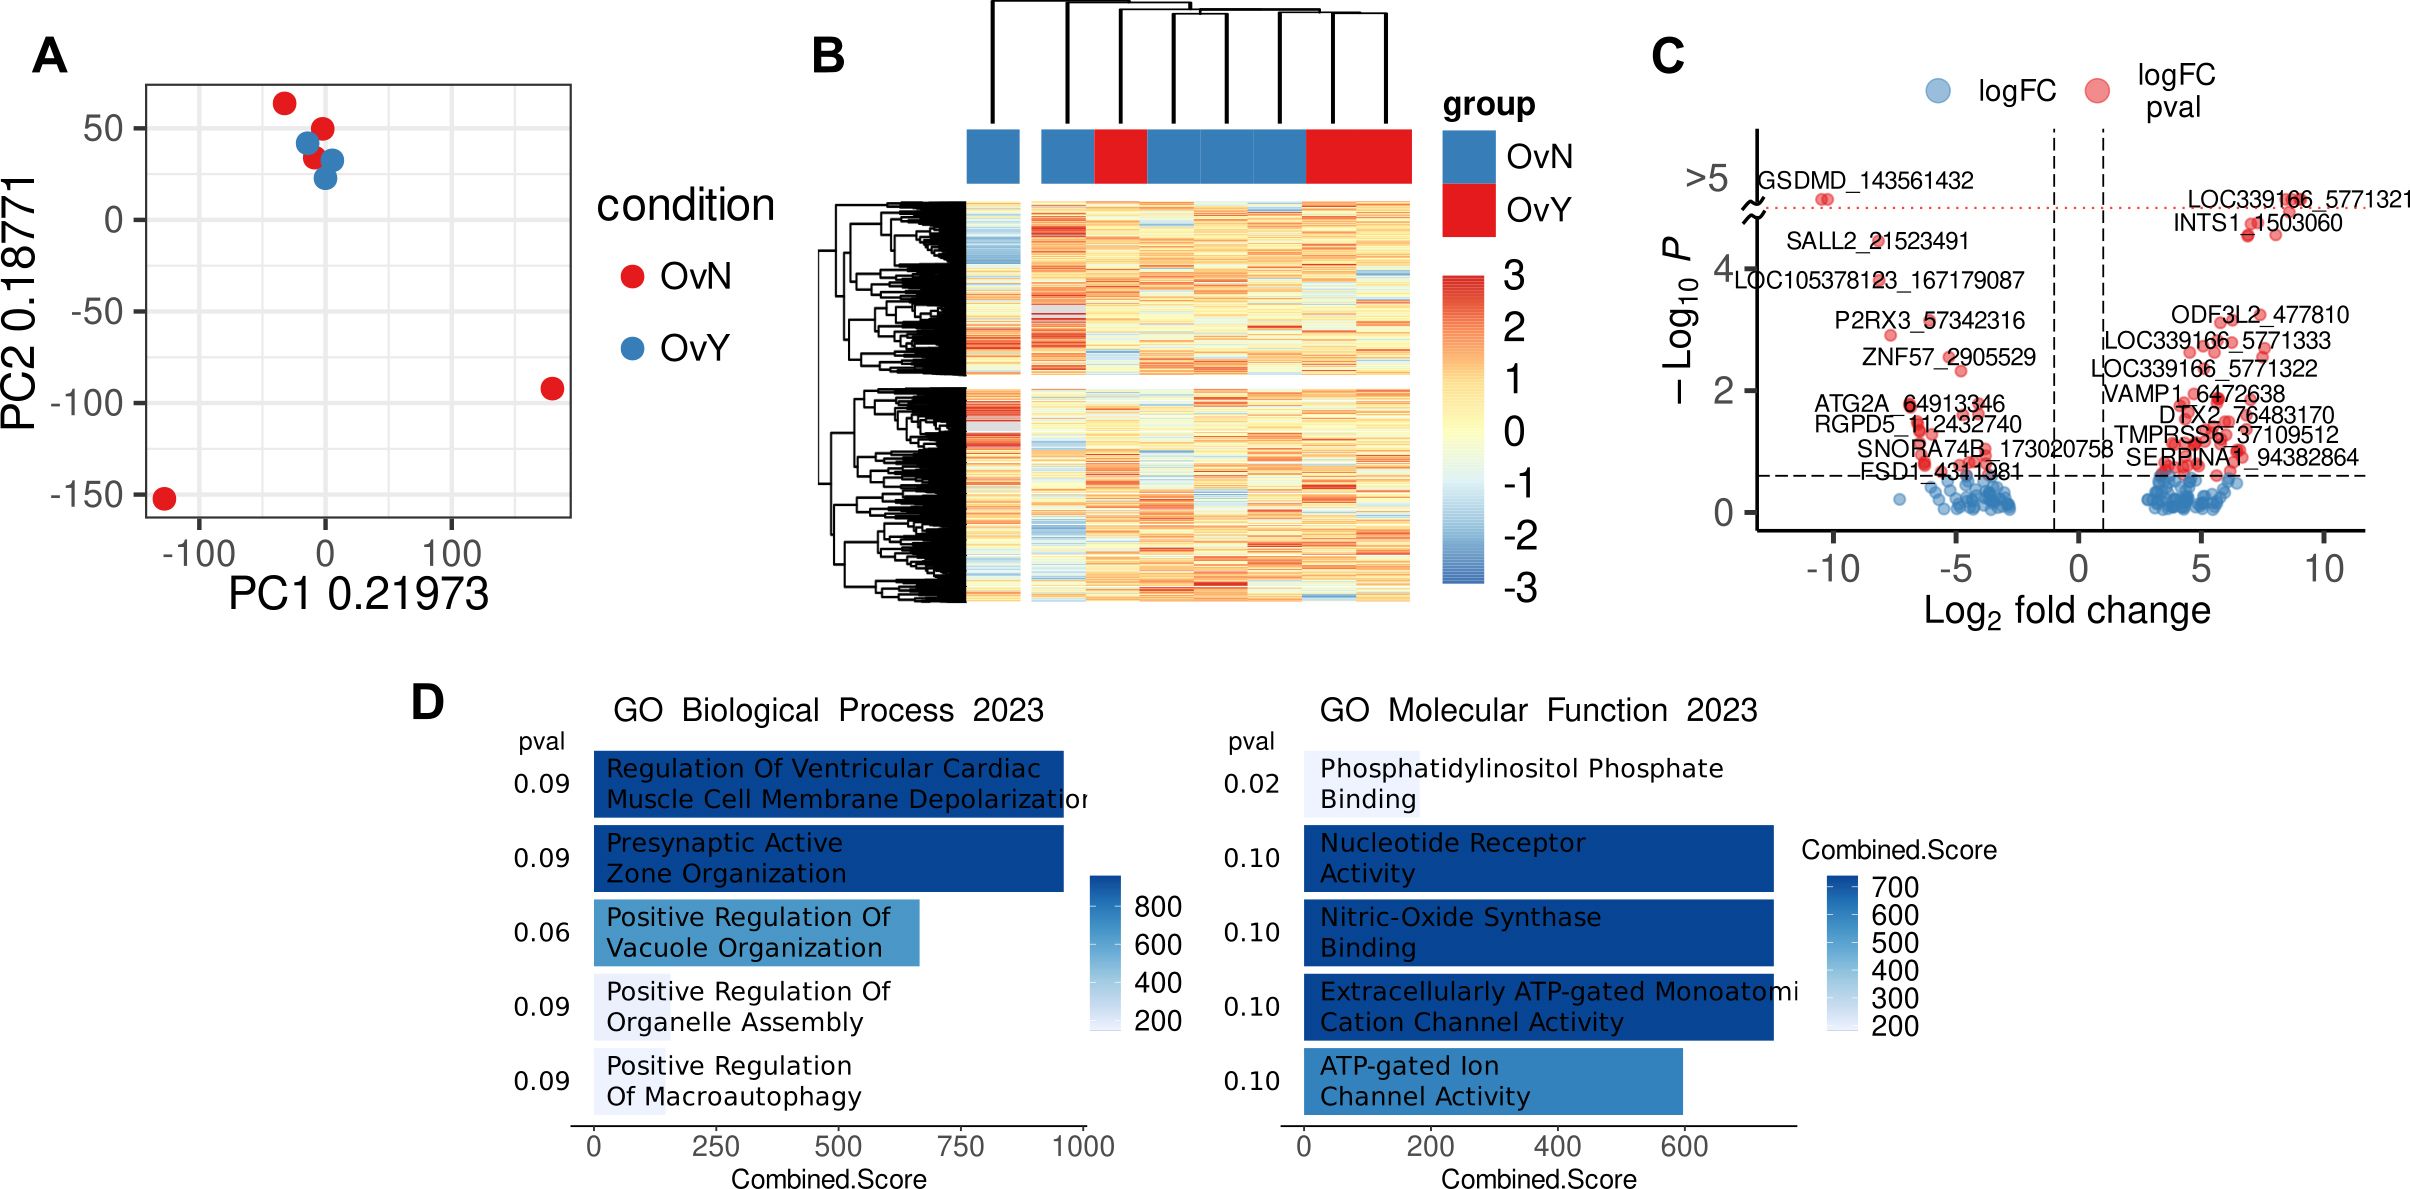
Figure 4. Methylation level in CpG sites in CD14+ monocytes of treated vs. untreated samples (A) PCA plot demonstrated analyzed samples (OvY – NAC-treated monocytes; OvN – treatment naive monocytes). (B) Heatmap with hierarchical clustering of OvY vs. OvN samples using top 10 000 variable CpG cites. (C) Volcano plot with differentially methylated CpG sites near promoter region (|L2FC|>1, FDR<0.25). (D) Functional annotation of genes with differentially methylated CpG sites near promoter region performed with Enrichr (FDR<0.1).
4 Discussion
The major aim of our study was to uncover cancer specific transcriptional and epigenetic changes in peripheral blood monocytes in patients with HGSOC. Another insistent point was to unravel how chemotherapy can re-program monocytes and how it can relate to changes in other immune subpopulations in blood. Monocytes are highly plastic innate immune cells that display significant heterogeneity during homeostasis, inflammation, and tumorigenesis (69). Re-education of circulating monocytes toward T-cell stimulatory macrophages upon their extravasation in the tumor may be introduced in addition to known immunotherapeutic strategies. Identifying mechanisms capable of “re-educating” circulating monocytes will likely represent a useful strategy to prevent relapse and metastasis development after or even during anti-cancer treatment (14). However, understanding a tumor-associated monocyte profile is complicated by the fact that phenotypes of human peripheral blood monocytes display considerable heterogeneity between individuals and depending on cancer type results in uncovering subsets with differential reprogramming (14). Data on monocyte profile alterations induced by ovarian cancer-derived microenvironment are limited and require detailed analysis. The most common feature of peripheral blood monocytes of cancer patients reported in several studies is the acquisition of immunosuppressive activity and the downregulation of the MHC class II surface protein HLA-DR, a key mediator of antigen presentation (14). In present study, we performed single-cell RNA sequencing of PBMCs in patients with ovarian cancer who underwent neoadjuvant chemotherapeutic treatment and in treatment-naïve patients. Monocyte cluster was significantly affected by tumor-derived factors as well as by chemotherapeutic impact. We revealed that, in general, cancer induces the suppression of antigen presentation and the immune-inflammatory state in monocytes, but the activation of interferon-dependent pathways and pro-tumor metabolism.
Circulating monocytes are a dynamic population of cells consisting of multiple subsets that differ in phenotype, size, morphology, and transcriptional profiles (49, 69). In humans, these subsets can be distinguished by the expression of CD14 and CD16 and divided into CD14+ CD16− classical, CD14+ CD16+ intermediate and CD14-CD16+ nonclassical monocytes (49). Bioinformatical analysis allowed us to reveal three distinct monocyte subpopulations within PBMCs based on feature gene expression – CD14.Mn.S100A8.9hi, CD14.Mn.MHC2hi and CD16.Mn subsets.
Interesting observation was made in our study for CD16 cluster. Cancer-specific changes that we observed were strongly indicative for S100A8.9hi and MHC2hi subsets, but in less extend for CD16 subset. It is known that CD14+ classical monocytes represent the majority of monocytes in blood and are recruited to tissues to replenish macrophages in homeostasis and disease, whereas CD14-negative monocytes are a minority (∼7%) of human blood monocytes (70). According to existing data, non-classical CD14lowCD16hi monocytes are involved in the patrolling and innate local surveillance, they clear dying endothelial cells and protect vessel health, but do not cross-present antigen to CD8+ T cells (49, 66, 67, 70). Using tool integrated LIANA and Tensor-cell2cell we found that CD16hi monocytes have two distinct modules that are not found in CD14-expressing subsets. These modules are characterized by some immune-regulatory functions and by the regulation of cell adhesion, that corresponds to existing data.
Bioinformatical analysis helped us to reveal distinct cancer-specific features in CD14.Mn.S100A8.9hi, CD14.Mn.MHC2hi and CD16.Mn subsets. We focused on two functionally attractive for monocyte/macrophage lineage cell genes – SIGLEC1 and MS4A4A. Herewith SIGLEC1 is specifically expressed in CD14.Mn.S100A8.9hi cluster, and MS4A4A was significantly indicative for CD14.Mn.MHC2hi cluster within whole PBMC population. Sialic acid binding Ig like lectin 1 (Siglec1) is adhesion molecule playing role in endocytosis (71, 72). However, little is known about Siglec1 on monocytes, but minor data demonstrated that higher expression of Siglec1 on tumor-associated macrophages correlated to worse prognosis in cancer patients (17). The tetraspan surface molecule MS4A4A is specific for monocyte-macrophage lineage cells and highly expressed in TAMs. It is known that MS4A4A can promote T cell exhaustion, and is associated with poor prognosis in several cancers (73, 74). Identifying specific profile alterations in peripheral blood monocytes can serve as diagnostic, predictive, and prognostic less invasive biomarkers as well as may correlate with the efficacy of antitumor therapy (14).
The most intriguing result was NACT-induced antigen presentation by MHC class II molecules in monocytes. Increased MHC class II gene expression was a feature observed across all three monocyte subpopulations after chemotherapy. Again, despite CD16hi subset undergoing both tumor-dependent and NACT-specific changes at a direction similar to classical monocytes (S100A8.9hi and MHC2hi), these changes are represented less extensively compared to CD14-expressing subsets.
Some chemotherapeutic agents, including platinum ones, are able to drive immunogenic cell death (ICD) that is based on the release of potential immunogenic signals, known as “damage-associated molecular patterns” (DAMPs), from dying cells to induce immune responses (75–77). Presentation of tumor-associated antigens via the major histocompatibility complex (MHC) class I and II is fundamental for building a robust immune response (78). It is known that MHC class I, expressed on many cells, are generally recognized by cytotoxic CD8+ T cells, while MHC class II that are expressed preferentially by professional APCs, activate CD4+ T cells, which play critical roles in supporting CD8+ T-cell activation and generation of memory T cells (54, 78).
In tumor murine model, it was demonstrated that MHC class IIhi tumor-associated macrophages (TAMs) accumulated at early stages and had tumor suppressive activity, in contrast, MHC class IIlow TAMs became more dominant in advanced tumor and supported tumor growth (79). Single-cell RNAseq data we obtained revealed that the expression of genes of MHC class II are suppressed in treatment-naïve tumor samples. But surprisingly, MHC class II expression was up-regulated after chemotherapy. Our results are in a line with the recent study where authors performed single cell RNAseq analysis using paired PBMC samples from ovarian cancer before and after NACT (80). In this study, treatment with NACT was associated with increased expression of HLA class II and antigen presentation genes on all monocyte subpopulations, although CD14++CD16– classical monocyte population was likely the major source of upregulated HLA class II within the monocyte cluster. Authors revealed increased numbers of memory T-cell receptor (TCR) clonotypes and increased central memory CD8+ and regulatory T cells after chemotherapy, however, in total NACT did not alter the composition of circulating T cells (80). Another scRNAseq analyses performed in PBMCs of one recurrent OC patient before and after NAC treatment demonstrated the tendency towards an exhaust state of CD8+ T cells under chemotherapy (81). In our study we also did not notice remarkable changes in CD4 naïve T, CD4 memory T, and Treg cells. Only in CD8 memory T cells there were decreased expression of some interleukin receptors and effector molecules that are responsible for thymic development, T cell maturation and T-cell immune response.
The success of immunotherapy, including immune checkpoint blockade (ICB) and immune cell–based immunotherapies, can depend on the effective antigen presentation to cytotoxic immune cells (54, 78). The impairments in the intercommunications between APCs and T cells can be a serious reason for the incomplete response to anti-cancer therapy (54, 55). Thus, it was shown that TAMs have the potential to phagocytose and process tumor-associated antigens, but fail to successfully support T cell activation (82). Using a fluorescent mouse model of spontaneous immunoevasive breast cancer authors identified a subset of myeloid cells that ingest tumor-derived proteins and present processed tumor antigens to reactive T cells, but do not support T cell activation or sustain cytolysis (82). Another study using lattice light sheet microscopy, demonstrated that TAMs and CD8+ T cells interact by shaping long-lasting, antigen-specific synaptic contact resulted in T cell exhaustion. Reciprocally, exhausted CD8+ T cell actively recruit monocytes to the TME and increase MHC class II expression in differentiated macrophages (62). The importance of T cell-macrophage interactions in the TME was demonstrated in one more study (83). Tumor-specific CD4 T cells instructed MHC class II-expressing monocytes to differentiate into anti-tumor macrophages (83). Furthermore, IFNγ signaling on antigen-presenting TAMs combined with cognate interaction with T cells is necessary for the most effective antitumor response (54, 84). MHC class II-expressing monocytes with high endocytic activity and IL-10 production after chemotherapy could initiate immunosuppression (85). Our data demonstrated that chemotherapy inhibited interferon-dependent signaling pathways, but activated some TGFb-related genes. According to above mentioned literature data it can be related to incomplete anti-tumor response.
All these facts demonstrate that the immune system must be equipped to detect and eliminate dying cells after chemotherapy. Ovarian cancer remains one of the few malignancies where immune checkpoint inhibitors exhibit only modest activity as monotherapy and currently has no FDA-approved indication (80, 86, 87). In recent years, ICB has been actively developing and a large number of clinical trials are underway (86–89). However, ICB often does not show a lasting positive response and, thus, has not entered routine use in clinical practice (90). It is hypothesized that OC may be somewhat resistant to ICB due to a low intrinsic tumor immunogenicity and high mutational burden, as well as excessive immunosuppressive mechanisms in the tumor microenvironment (91). Some clinical studies indicated that NACT may be a promising platform for building combinatorial immunotherapy strategies in ovarian cancer (48, 80). Moreover, search for NACT-mediated mechanisms can be crucial for choosing the ideal timing (“window” period) providing the best opportunity for immunotherapy combined with chemotherapy (92). We believe that our study can help unveil how we can re-educate monocytes toward T-cell-stimulatory macrophages upon extravasation in the tumor and how we can educate the tumor microenvironment in ovarian cancer to respond to mono- or combination chemo-/immunotherapy.
Data availability statement
The datasets generated during the current study are available as records in the NCBI GEO repository under the following accession numbers: GSE264489 (single-cell RNAseq) and GSE264488 (RRBS).
Ethics statement
The studies involving humans were approved by Local committee of Medical Ethics of Tomsk Cancer Research Institute (protocol number 5, dated 22 April 2021). The studies were conducted in accordance with the local legislation and institutional requirements. The participants provided their written informed consent to participate in this study.
Author contributions
IL: Conceptualization, Formal analysis, Funding acquisition, Investigation, Methodology, Project administration, Supervision, Writing – original draft, Writing – review & editing. PI: Formal analysis, Investigation, Methodology, Resources, Software, Validation, Visualization, Writing – original draft. AK: Investigation, Methodology, Writing – original draft. MR: Investigation, Methodology, Writing – review & editing. MM: Investigation, Methodology, Writing – review & editing. KE: Investigation, Methodology, Writing – review & editing. GR: Investigation, Methodology, Writing – review & editing. YS: Investigation, Methodology, Writing – review & editing. VP: Methodology, Writing – review & editing. AV: Resources, Validation, Writing – review & editing. LK: Resources, Validation, Writing – review & editing. JK: Funding acquisition, Methodology, Project administration, Supervision, Writing – original draft, Writing – review & editing.
Funding
The author(s) declare financial support was received for the research, authorship, and/or publication of this article. This work was supported by Russian Science Foundation, grant RSF 21-75-10021 (to IL), a state contract of the Ministry of Science and Higher Education of the Russian Federation “Genetic and epigenetic editing of tumor cells and microenvironment in order to block metastasis” no. 075-15-2021-1073 (to JK), and BSMU Strategic Academic Leadership Program PRIORITY-2030 (to VP).
Acknowledgments
Work was carried out on equipment of Tomsk regional common use center and The Core Facility «Medical genomics», Tomsk NRMC.
Conflict of interest
The authors declare that the research was conducted in the absence of any commercial or financial relationships that could be construed as a potential conflict of interest.
The author(s) declared that they were an editorial board member of Frontiers, at the time of submission. This had no impact on the peer review process and the final decision.
Publisher’s note
All claims expressed in this article are solely those of the authors and do not necessarily represent those of their affiliated organizations, or those of the publisher, the editors and the reviewers. Any product that may be evaluated in this article, or claim that may be made by its manufacturer, is not guaranteed or endorsed by the publisher.
Supplementary material
The Supplementary Material for this article can be found online at: https://www.frontiersin.org/articles/10.3389/fimmu.2024.1414716/full#supplementary-material
References
1. Feeney L, Harley IJ, McCluggage WG, Mullan PB, Beirne JP. Liquid biopsy in ovarian cancer: catching the silent killer before it strikes. World J Clin Oncol. (2020) 11:868–89. doi: 10.5306/wjco.v11.i11.868
2. observatory gc. Ovary (2022). Available online at: https://gco.iarc.who.int/media/globocan/factsheets/cancers/25-ovary-fact-sheet.pdf (Accessed April 9, 2024).
3. Frances Reid AB. The World Ovarian Cancer Coalition Atlas 2023: Global Trends in Incidence, Mortality, and Survival: World ovarian cancer coalition (2023). Available online at: https://worldovariancancercoalition.org/wp-content/uploads/2023/04/World-Ovarian-Cancer-Coalition-Atlas-2023-FINAL.pdf (Accessed April 9, 2024).
4. Rakina M, Kazakova A, Villert A, Kolomiets L, Larionova I. Spheroid formation and peritoneal metastasis in ovarian cancer: the role of stromal and immune components. Int J Mol Sci. (2022) 23(11):6215. doi: 10.3390/ijms23116215
5. Ali AT, Al-Ani O, Al-Ani F. Epidemiology and risk factors for ovarian cancer. Prz Menopauzalny. (2023) 22:93–104. doi: 10.5114/pm.2023.128661
6. Zhang Y, Cui Q, Xu M, Liu D, Yao S, Chen M. Current advances in pd-1/pd-L1 blockade in recurrent epithelial ovarian cancer. Front Immunol. (2022) 13:901772. doi: 10.3389/fimmu.2022.901772
7. Schoutrop E, Moyano-Galceran L, Lheureux S, Mattsson J, Lehti K, Dahlstrand H, et al. Molecular, cellular and systemic aspects of epithelial ovarian cancer and its tumor microenvironment. Semin Cancer Biol. (2022) 86:207–23. doi: 10.1016/j.semcancer.2022.03.027
8. Moschetta M, Boussios S, Rassy E, Samartzis EP, Funingana G, Uccello M. Neoadjuvant treatment for newly diagnosed advanced ovarian cancer: where do we stand and where are we going? Ann Transl Med. (2020) 8:1710. doi: 10.21037/atm-20-1683
9. Yang Y, Yang Y, Yang J, Zhao X, Wei X. Tumor microenvironment in ovarian cancer: function and therapeutic strategy. Front Cell Dev Biol. (2020) 8:758. doi: 10.3389/fcell.2020.00758
10. Jiang Y, Wang C, Zhou S. Targeting tumor microenvironment in ovarian cancer: premise and promise. Biochim Biophys Acta (BBA) - Rev Cancer. (2020) 1873:188361. doi: 10.1016/j.bbcan.2020.188361
11. Li ZH, Gu H, Xu X, Tian Y, Huang X, Du Y. Unveiling the novel immune and molecular signatures of ovarian cancer: insights and innovations from single-cell sequencing. Front Immunol. (2023) 14:1288027. doi: 10.3389/fimmu.2023.1288027
12. Larionova I, Tuguzbaeva G, Ponomaryova A, Stakheyeva M, Cherdyntseva N, Pavlov V, et al. Tumor-associated macrophages in human breast, colorectal, lung, ovarian and prostate cancers. Front Oncol. (2020) 10:566511. doi: 10.3389/fonc.2020.566511
13. Larionova I, Cherdyntseva N, Liu T, Patysheva M, Rakina M, Kzhyshkowska J. Interaction of tumor-associated macrophages and cancer chemotherapy. Oncoimmunology. (2019) 8:1596004. doi: 10.1080/2162402x.2019.1596004
14. Kiss M, Caro AA, Raes G, Laoui D. Systemic reprogramming of monocytes in cancer. Front Oncol. (2020) 10:1399. doi: 10.3389/fonc.2020.01399
15. Patysheva M, Frolova A, Larionova I, Afanas’ev S, Tarasova A, Cherdyntseva N, et al. Monocyte programming by cancer therapy. Front Immunol. (2022) 13:994319. doi: 10.3389/fimmu.2022.994319
16. Patysheva M, Larionova I, Stakheyeva M, Grigoryeva E, Iamshchikov P, Tarabanovskaya N, et al. Effect of early-stage human breast carcinoma on monocyte programming. Front Oncol. (2021) 11:800235. doi: 10.3389/fonc.2021.800235
17. Cassetta L, Fragkogianni S, Sims AH, Swierczak A, Forrester LM, Zhang H, et al. Human tumor-associated macrophage and monocyte transcriptional landscapes reveal cancer-specific reprogramming, biomarkers, and therapeutic targets. Cancer Cell. (2019) 35:588–602.e10. doi: 10.1016/j.ccell.2019.02.009
18. Alexander H, Hans P, Wouter Van D, Mario Di M, Mathias W, Estelle D, et al. Tumour-educated circulating monocytes are powerful candidate biomarkers for diagnosis and disease follow-up of colorectal cancer. Gut. (2016) 65:990. doi: 10.1136/gutjnl-2014-308988
19. Larionova I, Patysheva M, Iamshchikov P, Kazakova E, Kazakova A, Rakina M, et al. Pfkfb3 overexpression in monocytes of patients with colon but not rectal cancer programs pro-tumor macrophages and is indicative for higher risk of tumor relapse. Front Immunol. (2022) 13:1080501. doi: 10.3389/fimmu.2022.1080501
20. Chittezhath M, Dhillon Manprit K, Lim Jyue Y, Laoui D, Shalova Irina N, Teo YL, et al. Molecular profiling reveals a tumor-promoting phenotype of monocytes and macrophages in human cancer progression. Immunity. (2014) 41:815–29. doi: 10.1016/j.immuni.2014.09.014
21. Liu CZ, Liu XB, Sun J, Yu CQ, Yao JC, Liu Z, et al. Il-8-induced cxcr2 down-regulation in circulating monocytes in hepatocellular carcinoma is partially dependent on magl. BMC Cancer. (2023) 23:626. doi: 10.1186/s12885-023-11109-5
22. Zheng GX, Terry JM, Belgrader P, Ryvkin P, Bent ZW, Wilson R, et al. Massively parallel digital transcriptional profiling of single cells. Nat Commun. (2017) 8:14049. doi: 10.1038/ncomms14049
23. Hao Y, Stuart T, Kowalski MH, Choudhary S, Hoffman P, Hartman A, et al. Dictionary learning for integrative, multimodal and scalable single-cell analysis. Nat Biotechnol. (2024) 42:293–304. doi: 10.1038/s41587-023-01767-y
24. Germain PL, Lun A, Garcia Meixide C, Macnair W, Robinson MD. Doublet identification in single-cell sequencing data using scdblfinder. F1000Res. (2021) 10:979. doi: 10.12688/f1000research.73600.2
25. Aran D, Looney AP, Liu L, Wu E, Fong V, Hsu A, et al. Reference-based analysis of lung single-cell sequencing reveals a transitional profibrotic macrophage. Nat Immunol. (2019) 20:163–72. doi: 10.1038/s41590-018-0276-y
26. Monaco G, Lee B, Xu W, Mustafah S, Hwang YY, Carré C, et al. Rna-seq signatures normalized by mrna abundance allow absolute deconvolution of human immune cell types. Cell Rep. (2019) 26:1627–40.e7. doi: 10.1016/j.celrep.2019.01.041
27. Uhlen M, Karlsson MJ, Zhong W, Tebani A, Pou C, Mikes J, et al. A genome-wide transcriptomic analysis of protein-coding genes in human blood cells. Science. (2019) 366(6472):eaax9198. doi: 10.1126/science.aax9198
28. Squair JW, Gautier M, Kathe C, Anderson MA, James ND, Hutson TH, et al. Confronting false discoveries in single-cell differential expression. Nat Commun. (2021) 12:5692. doi: 10.1038/s41467-021-25960-2
29. Zhang Y, Parmigiani G, Johnson WE. Combat-seq: batch effect adjustment for rna-seq count data. NAR Genom Bioinform. (2020) 2:lqaa078. doi: 10.1093/nargab/lqaa078
30. Love MI, Huber W, Anders S. Moderated estimation of fold change and dispersion for rna-seq data with deseq2. Genome Biol. (2014) 15:550. doi: 10.1186/s13059-014-0550-8
31. Alexey AS. An algorithm for fast preranked gene set enrichment analysis using cumulative statistic calculation. bioRxiv. (2016), 060012. doi: 10.1101/060012
32. Skinnider MA, Squair JW, Kathe C, Anderson MA, Gautier M, Matson KJE, et al. Cell type prioritization in single-cell data. Nat Biotechnol. (2021) 39:30–4. doi: 10.1038/s41587-020-0605-1
33. Büttner M, Ostner J, Müller CL, Theis FJ, Schubert B. Sccoda is a bayesian model for compositional single-cell data analysis. Nat Commun. (2021) 12:6876. doi: 10.1038/s41467-021-27150-6
34. Andreatta M, Carmona SJ. Ucell: robust and scalable single-cell gene signature scoring. Comput Struct Biotechnol J. (2021) 19:3796–8. doi: 10.1016/j.csbj.2021.06.043
35. Dimitrov D, Türei D, Garrido-Rodriguez M, Burmedi PL, Nagai JS, Boys C, et al. Comparison of methods and resources for cell-cell communication inference from single-cell rna-seq data. Nat Commun. (2022) 13:3224. doi: 10.1038/s41467-022-30755-0
36. Morabito S, Reese F, Rahimzadeh N, Miyoshi E, Swarup V. Hdwgcna identifies co-expression networks in high-dimensional transcriptomics data. Cell Rep Methods. (2023) 3:100498. doi: 10.1016/j.crmeth.2023.100498
37. Marsh SE. scCustomize: Custom Visualizations & Functions for Streamlined Analyses of Single Cell Sequencing (2021). doi: 10.5281/zenodo.5706430 (Accessed April 9, 2024).
38. Enrique B-C. Generating publication ready visualizations for single cell transcriptomics using scpubr. bioRxiv. (2022). doi: 10.1101/2022.02.28.482303
39. Blighe K, Rana S, Lewis M. Enhancedvolcano: publication-ready volcano plots with enhanced colouring and labeling. R package version 1.22.0 (2024). Available online at: https://github.com/kevinblighe/EnhancedVolcano (Accessed April 9, 2024)
41. A quality control tool for high throughput sequence data [09.04.2024]. Available online at: http://www.bioinformatics.babraham.ac.uk/projects/fastqc (Accessed April 9, 2024).
42. Trim galore [09.04.2024] . Available online at: https://github.com/FelixKrueger/TrimGalore (Accessed April 9, 2024).
43. Krueger F, Andrews SR. Bismark: A flexible aligner and methylation caller for bisulfite-seq applications. Bioinformatics. (2011) 27:1571–2. doi: 10.1093/bioinformatics/btr167
44. Akalin A, Kormaksson M, Li S, Garrett-Bakelman FE, Figueroa ME, Melnick A, et al. Methylkit: A comprehensive R package for the analysis of genome-wide DNA methylation profiles. Genome Biol. (2012) 13:R87. doi: 10.1186/gb-2012-13-10-r87
45. Chen Y, Pal B, Visvader JE, Smyth GK. Differential methylation analysis of reduced representation bisulfite sequencing experiments using edger. F1000Res. (2017) 6:2055. doi: 10.12688/f1000research.13196.2
46. Chen EY, Tan CM, Kou Y, Duan Q, Wang Z, Meirelles GV, et al. Enrichr: interactive and collaborative html5 gene list enrichment analysis tool. BMC Bioinf. (2013) 14:128. doi: 10.1186/1471-2105-14-128
47. Liu Y, Ni M, Huang F, Gu Q, Xiao Y, Du X. Neoadjuvant chemotherapy in advanced epithelial ovarian cancer by histology: A seer based survival analysis. Med (Baltimore). (2023) 102:e32774. doi: 10.1097/md.0000000000032774
48. Konstantinopoulos PA, Cannistra SA. Immune checkpoint inhibitors in ovarian cancer: can we bridge the gap between imagynation and reality? J Clin Oncol. (2021) 39:1833–8. doi: 10.1200/jco.21.00571
49. Patel AA, Zhang Y, Fullerton JN, Boelen L, Rongvaux A, Maini AA, et al. The fate and lifespan of human monocyte subsets in steady state and systemic inflammation. J Exp Med. (2017) 214:1913–23. doi: 10.1084/jem.20170355
50. Chang X, Bian M, Liu L, Yang J, Yang Z, Wang Z, et al. Induction of immunogenic cell death by novel platinum-based anticancer agents. Pharmacol Res. (2023) 187:106556. doi: 10.1016/j.phrs.2022.106556
51. Sprooten J, Laureano RS, Vanmeerbeek I, Govaerts J, Naulaerts S, Borras DM, et al. Trial watch: chemotherapy-induced immunogenic cell death in oncology. OncoImmunology. (2023) 12:2219591. doi: 10.1080/2162402X.2023.2219591
52. Kallingal A, Olszewski M, Maciejewska N, Brankiewicz W, Baginski M. Cancer immune escape: the role of antigen presentation machinery. J Cancer Res Clin Oncol. (2023) 149:8131–41. doi: 10.1007/s00432-023-04737-8
53. Ji S, Shi Y, Yin B. Macrophage barrier in the tumor microenvironment and potential clinical applications. Cell Commun Signal. (2024) 22:74. doi: 10.1186/s12964-023-01424-6
54. Axelrod ML, Cook RS, Johnson DB, Balko JM. Biological consequences of mhc-ii expression by tumor cells in cancer. Clin Cancer Res. (2019) 25:2392–402. doi: 10.1158/1078-0432.Ccr-18-3200
55. Lee MY, Jeon JW, Sievers C, Allen CT. Antigen processing and presentation in cancer immunotherapy. J Immunother Cancer. (2020) 8(2):e001111. doi: 10.1136/jitc-2020-001111
56. Goplen NP, Saxena V, Knudson KM, Schrum AG, Gil D, Daniels MA, et al. Il-12 signals through the tcr to support cd8 innate immune responses. J Immunol. (2016) 197:2434–43. doi: 10.4049/jimmunol.1600037
57. Belarif L, Mary C, Jacquemont L, Mai HL, Danger R, Hervouet J, et al. Il-7 receptor blockade blunts antigen-specific memory T cell responses and chronic inflammation in primates. Nat Commun. (2018) 9:4483. doi: 10.1038/s41467-018-06804-y
58. Nian Y, Xiong Z, Zhan P, Wang Z, Xu Y, Wei J, et al. Il-21 receptor blockade shifts the follicular T cell balance and reduces de novo donor-specific antibody generation. Front Immunol. (2021) 12:661580. doi: 10.3389/fimmu.2021.661580
59. Ridley AJ. Rho proteins, pi 3-kinases, and monocyte/macrophage motility. FEBS Lett. (2001) 498:168–71. doi: 10.1016/S0014-5793(01)02481-4
60. Chi X, Wang S, Huang Y, Stamnes M, Chen JL. Roles of rho gtpases in intracellular transport and cellular transformation. Int J Mol Sci. (2013) 14:7089–108. doi: 10.3390/ijms14047089
61. Isaacs JD, Jackson GS, Altmann DM. The role of the cellular prion protein in the immune system. Clin Exp Immunol. (2006) 146:1–8. doi: 10.1111/j.1365-2249.2006.03194.x
62. Kersten K, Hu KH, Combes AJ, Samad B, Harwin T, Ray A, et al. Spatiotemporal co-dependency between macrophages and exhausted cd8(+) T cells in cancer. Cancer Cell. (2022) 40:624–38.e9. doi: 10.1016/j.ccell.2022.05.004
63. Freitas RF, Basto A, Almeida SCP, Santos RF, Gonçalves CM, Corria-Osorio J, et al. Modulation of cd4 T cell function via cd6-targeting. EBioMedicine. (2019) 47:427–35. doi: 10.1016/j.ebiom.2019.08.008
64. Tie Y, Tang F, Wei Y-Q, Wei X-W. Immunosuppressive cells in cancer: mechanisms and potential therapeutic targets. J Hematol Oncol. (2022) 15:61. doi: 10.1186/s13045-022-01282-8
65. Dmitry I, Gabrilovich AAH. Tumor-induced immune suppression: mechanisms and therapeutic reversal. 2 ed. New York, NY: Springer (2014).
66. Padgett LE, Marcovecchio PM, Olingy CE, Araujo DJ, Steel K, Dinh HQ, et al. Nonclassical monocytes potentiate anti-tumoral cd8+ T cell responses in the lungs. Front Immunol. (2023) 14:1101497. doi: 10.3389/fimmu.2023.1101497
67. Robinson A, Han CZ, Glass CK, Pollard JW. Monocyte regulation in homeostasis and Malignancy. Trends Immunol. (2021) 42:104–19. doi: 10.1016/j.it.2020.12.001
68. Brands X, Haak BW, Klarenbeek AM, Butler J, Uhel F, Qin W, et al. An epigenetic and transcriptomic signature of immune tolerance in human monocytes through multi-omics integration. Genome Med. (2021) 13:131. doi: 10.1186/s13073-021-00948-1
69. Chen X, Li Y, Xia H, Chen YH. Monocytes in tumorigenesis and tumor immunotherapy. Cells. (2023) 12(13):1673. doi: 10.3390/cells12131673
70. Cros J, Cagnard N, Woollard K, Patey N, Zhang SY, Senechal B, et al. Human cd14dim monocytes patrol and sense nucleic acids and viruses via tlr7 and tlr8 receptors. Immunity. (2010) 33:375–86. doi: 10.1016/j.immuni.2010.08.012
71. Delputte PL, Van Gorp H, Favoreel HW, Hoebeke I, Delrue I, Dewerchin H, et al. Porcine sialoadhesin (Cd169/siglec-1) is an endocytic receptor that allows targeted delivery of toxins and antigens to macrophages. PloS One. (2011) 6:e16827. doi: 10.1371/journal.pone.0016827
72. Crocker PR, Paulson JC, Varki A. Siglecs and their roles in the immune system. Nat Rev Immunol. (2007) 7:255–66. doi: 10.1038/nri2056
73. Yongsheng L, Zhiyong S, Zhen C, Yizhi Z, Yaowei Z, Zhengyu L, et al. Targeting ms4a4a on tumour-associated macrophages restores cd8+ T-cell-mediated antitumour immunity. Gut. (2023) 72:2307. doi: 10.1136/gutjnl-2022-329147
74. Mattiola I, Tomay F, De Pizzol M, Silva-Gomes R, Savino B, Gulic T, et al. The macrophage tetraspan ms4a4a enhances dectin-1-dependent nk cell–mediated resistance to metastasis. Nat Immunol. (2019) 20:1012–22. doi: 10.1038/s41590-019-0417-y
75. Lau TS, Chan LKY, Man GCW, Wong CH, Lee JHS, Yim SF, et al. Paclitaxel induces immunogenic cell death in ovarian cancer via tlr4/ikk2/snare-dependent exocytosis. Cancer Immunol Res. (2020) 8:1099–111. doi: 10.1158/2326-6066.Cir-19-0616
76. Vanmeerbeek I, Sprooten J, De Ruysscher D, Tejpar S, Vandenberghe P, Fucikova J, et al. Trial watch: chemotherapy-induced immunogenic cell death in immuno-oncology. Oncoimmunology. (2020) 9:1703449. doi: 10.1080/2162402x.2019.1703449
77. Li Y, Gan X, Li F, Hu L. The putative effects of neoadjuvant chemotherapy on the immune system of advanced epithelial ovarian carcinoma. Rev Immunol Invest. (2024) 53:91–114. doi: 10.1080/08820139.2023.2284885
78. Lee-Chang C, Lesniak MS. Next-generation antigen-presenting cell immune therapeutics for gliomas. J Clin Invest. (2023) 133(3):e163449. doi: 10.1172/jci163449
79. Wang B, Li Q, Qin L, Zhao S, Wang J, Chen X. Transition of tumor-associated macrophages from mhc class ii(Hi) to mhc class ii(Low) mediates tumor progression in mice. BMC Immunol. (2011) 12:43. doi: 10.1186/1471-2172-12-43
80. Liu M, Tayob N, Penter L, Sellars M, Tarren A, Chea V, et al. Improved T-cell immunity following neoadjuvant chemotherapy in ovarian cancer. Clin Cancer Res. (2022) 28:3356–66. doi: 10.1158/1078-0432.Ccr-21-2834
81. Ren Y, Li R, Feng H, Xie J, Gao L, Chu S, et al. Single-cell sequencing reveals effects of chemotherapy on the immune landscape and TCR/BCR clonal expansion in a relapsed ovarian cancer patient. Front Immunol. (2022) 13:985187. doi: 10.3389/fimmu.2022.985187
82. Engelhardt JJ, Boldajipour B, Beemiller P, Pandurangi P, Sorensen C, Werb Z, et al. Marginating dendritic cells of the tumor microenvironment cross-present tumor antigens and stably engage tumor-specific T cells. Cancer Cell. (2012) 21:402–17. doi: 10.1016/j.ccr.2012.01.008
83. Patterson MT, Burrack AL, Xu Y, Hickok GH, Schmiechen ZC, Becker S, et al. Tumor-specific cd4 T cells instruct monocyte fate in pancreatic ductal adenocarcinoma. Cell Rep. (2023) 42:112732. doi: 10.1016/j.celrep.2023.112732
84. Perez-Diez A, Liu X, Matzinger P. Neoantigen presentation and ifnγ Signaling on the same tumor-associated macrophage are necessary for cd4 T cell–mediated antitumor activity in mice. Cancer Res Commun. (2022) 2:316–29. doi: 10.1158/2767-9764.Crc-22-0052
85. Rivas-Fuentes S, Higuera-Iglesias A, García-Trejo A, Yair Chavarría-Castro D, Inclán-Figueroa N, Aguirre-Pérez T, et al. Restoration of peripheral intermediate and classical monocytes expressing hla-dr in patients with lung adenocarcinoma after platinum-based chemotherapy. Technol Cancer Res Treat. (2018) 17:1533033818764720. doi: 10.1177/1533033818764720
86. Uyar D, Michener CM, Bishop E, Hopp E, Simpson P, Zhang L, et al. Carboplatin, paclitaxel, and pembrolizumab followed by pembrolizumab maintenance for primary treatment of incompletely resected epithelial ovarian cancer. Front Oncol. (2024) 14:1291090. doi: 10.3389/fonc.2024.1291090
87. Park J, Lee JB, Lim MC, Kim BG, Kim JW, Kim S, et al. Phase ii study of durvalumab and tremelimumab with front-line neoadjuvant chemotherapy in patients with advanced-stage ovarian cancer: primary analysis in the original cohort of kgog3046/tru-D. J Immunother Cancer. (2023) 11(10):e007444. doi: 10.1136/jitc-2023-007444
88. Zamarin D, Burger RA, Sill MW, Powell DJ Jr., Lankes HA, Feldman MD, et al. Randomized phase ii trial of nivolumab versus nivolumab and ipilimumab for recurrent or persistent ovarian cancer: an nrg oncology study. J Clin Oncol. (2020) 38:1814–23. doi: 10.1200/jco.19.02059
89. Matulonis UA, Shapira-Frommer R, Santin AD, Lisyanskaya AS, Pignata S, Vergote I, et al. Antitumor activity and safety of pembrolizumab in patients with advanced recurrent ovarian cancer: results from the phase ii keynote-100 study. Ann Oncol. (2019) 30:1080–7. doi: 10.1093/annonc/mdz135
90. Colombo I, Karakasis K, Suku S, Oza AM. Chasing immune checkpoint inhibitors in ovarian cancer: novel combinations and biomarker discovery. Cancers (Basel). (2023) 15(12):3220. doi: 10.3390/cancers15123220
91. Kuznicki ML, Bennett C, Yao M, Joehlin-Price A, Rose PG, Mahdi H. Predictors of response to immune checkpoint inhibition in a real world gynecologic cancer population. Gynecol Oncol Rep. (2020) 34:100671. doi: 10.1016/j.gore.2020.100671
Keywords: monocyte, ovarian cancer, chemotherapy, single cell sequencing, transcriptome, methylation, antigen presentation
Citation: Larionova I, Iamshchikov P, Kazakova A, Rakina M, Menyalo M, Enikeeva K, Rafikova G, Sharifyanova Y, Pavlov V, Villert A, Kolomiets L and Kzhyshkowska J (2024) Platinum-based chemotherapy promotes antigen presenting potential in monocytes of patients with high-grade serous ovarian carcinoma. Front. Immunol. 15:1414716. doi: 10.3389/fimmu.2024.1414716
Received: 09 April 2024; Accepted: 20 August 2024;
Published: 09 September 2024.
Edited by:
Heather Medbury, The University of Sydney, AustraliaReviewed by:
Sergei Kusmartsev, University of Florida, United StatesPaola Allavena, University of Milan, Italy
Armando Rojas, Catholic University of the Maule, Chile
Copyright © 2024 Larionova, Iamshchikov, Kazakova, Rakina, Menyalo, Enikeeva, Rafikova, Sharifyanova, Pavlov, Villert, Kolomiets and Kzhyshkowska. This is an open-access article distributed under the terms of the Creative Commons Attribution License (CC BY). The use, distribution or reproduction in other forums is permitted, provided the original author(s) and the copyright owner(s) are credited and that the original publication in this journal is cited, in accordance with accepted academic practice. No use, distribution or reproduction is permitted which does not comply with these terms.
*Correspondence: Irina Larionova, bGFyaW9ub3ZhaXZAb25jby50bmltYy5ydQ==; Julia Kzhyshkowska, anVsaWEua3poeXNoa293c2thQG1lZG1hLnVuaS1oZWlkZWxiZXJnLmRl
†These authors have contributed equally to this work