 Lihua Wu
 Fei Liao
 Xiangli Guo
 Nainong Li
- 1Fujian Institute of Hematology, Fujian Provincial Key Laboratory on Hematology, Fujian Medical University Union Hospital, Fuzhou, China
- 2Translational Medicine Center on Hematology, Fujian Medical University, Fuzhou, China
- 3Department of General Surgery, Fujian Medical University Union Hospital, Fuzhou, China
Background: Extensive research has been conducted on the correlation between adipose tissue and the risk of malignant lymphoma. Despite numerous observational studies exploring this connection, uncertainty remains regarding a causal relationship between adipose tissue and malignant lymphoma.
Methods: The increase or decrease in adipose tissue was represented by the height of BMI. The BMI and malignant lymphoma genome-wide association studies (GWAS) used a summary dataset from the OPEN GWAS website. Single-nucleotide polymorphisms (SNPs) that met the criteria of P <5e–8 and LD of r2 = 0.001 in the BMI GWAS were chosen as genetic instrumental variants (IVs). Proxy SNPs with LD of r2 > 0.8 were identified, while palindromic and outlier SNPs were excluded. Mendelian randomization (MR) analysis used five methods, including inverse-variance weighted (IVW) model, weighted median (WM), MR-Egger, simple mode, and weighted mode. Sensitivity assessments included Cochran’s Q test, MR-Egger intercept test, and leave-one-out analysis. Participants randomly selected by the National Center for Health Statistics (NHANSE) and newly diagnosed HL patients at Fujian Medical University Union Hospital were used for external validation.
Results: The results of the MR analysis strongly supported the causal link between BMI and Hodgkin’s lymphoma (HL). The research demonstrated that individuals with lower BMI face a significantly increased risk of developing HL, with a 91.65% higher risk (ORIVW = 0.0835, 95% CI 0.0147 – 0.4733, P = 0.005). No signs of horizontal or directional pleiotropy were observed in the MR studies. The validation results aligned with the results from the MR analysis (OR = 0.871, 95% CI 0.826 – 0.918, P< 0.001). And there was no causal relationship between BMI and non-Hodgkin’s lymphoma (NHL).
Conclusions: The MR analysis study demonstrated a direct correlation between lower BMI and HL. This suggested that a decrease in adipose tissue increases the risk of developing HL. Nevertheless, further research is essential to grasp the underlying mechanism of this causal association comprehensively.
1 Introduction
Malignant lymphoma is a form of cancer that impacts the lymphatic system and is categorized by the type of cells involved and their level of maturity. The primary forms of lymphoma are Hodgkin’s lymphoma (HL), deriving from B cells, and non-Hodgkin’s lymphoma (NHL), which can originate from both B cells and T cells (1). HL is a unique form of blood cancer characterized by the presence of malignant Reed-Sternberg cells in an inflammatory setting. This condition commonly impacts individuals in their twenties and thirties, presenting with enlarged lymph nodes above the diaphragm and systemic B symptoms (2). The etiology of malignant lymphoma remains elusive, with no specific risk factors or causative agents identified. While familial history, viral exposure, and immune suppression have been implicated in the development of HL and NHL, the precise mechanisms underlying the disease are still unclear (3).
Adipose tissue plays a crucial role in Cancers, inflammation, and immunity by secretion of cytokines, hormones, and chemokines. These substances can both promote and reduce inflammation in the body, showcasing the active role of adipose tissue in regulating immune responses and inflammatory processes (4, 5). Excessive body weight, as indicated by body mass index (BMI), signifies an abnormal accumulation of fat in the body (6). A low BMI indicates a state of wasting or undernutrition. Hence, it is considered a valuable indicator for detecting obesity or wasting. Numerous studies have shown a link between a high BMI and an elevated risk of developing HL and NHL. This evidence indicates that obesity could be a potential risk factor for malignant lymphoma (7, 8). However, two significant studies have found that individuals who are obese or overweight have a more positive prognosis (9, 10). Therefore, the impact of BMI on malignant lymphoma remains controversial. Observational studies examining the relationship between BMI and malignant lymphoma may be influenced by biases like reverse causation and residual confounding, which can complicate our understanding of this association (11).
To address biases such as reverse causation and residual confounding, we employed Mendelian randomization (MR) to investigate the association between BMI and lymphoma. MR is a method that utilizes genetic variations as instrumental variables (IVs) to investigate whether a correlation between a risk factor and an outcome is indicative of a causal relationship (12). A two-sample MR estimates causal effects where data on the exposure and outcome have been measured in different samples (13). Currently, no previous studies have employed the MR method to examine the potential causal connection between BMI and susceptibility to malignant lymphoma. This research aims to address this gap by carrying out a two-sample MR analysis to ascertain whether there exists a causal relationship between BMI and the onset of malignant lymphoma.
2 Materials and methods
2.1 Data sources for BMI and lymphoma
We searched the MR Base database (http://www.mrbase.org/) (14), which houses a large collection of summary statistic data from hundreds of genome‐wide association studies (GWASs). We used the publicly available summary statistics data sets of GWAS meta‐analyses for BMI in individuals of European descent (n = 77482; Genetic Investigation of Anthropometric Traits consortium (GIANT consortium); https://gwas.mrcieu.ac.uk/datasets/ebi-a-GCST90095041/) (15) as the exposure. The genetic association studies databases for HL can be accessed on the FinnGen website (https://www.finngen.fi/en) (16). The genetic data for non-Hodgkin’s lymphoma (NHL) encompassed various subtypes, such as diffuse large B-cell lymphoma (DLBCL), follicular lymphoma (FL), mature T/NK-cell lymphomas, and other unspecified NHL types. This information has been rephrased for conciseness. These GWAS datasets are openly accessible and downloadable from the OPEN GWAS website (https://gwas.mrcieu.ac.uk/) (17). Table 1 presented the relevant information for the outcomes.
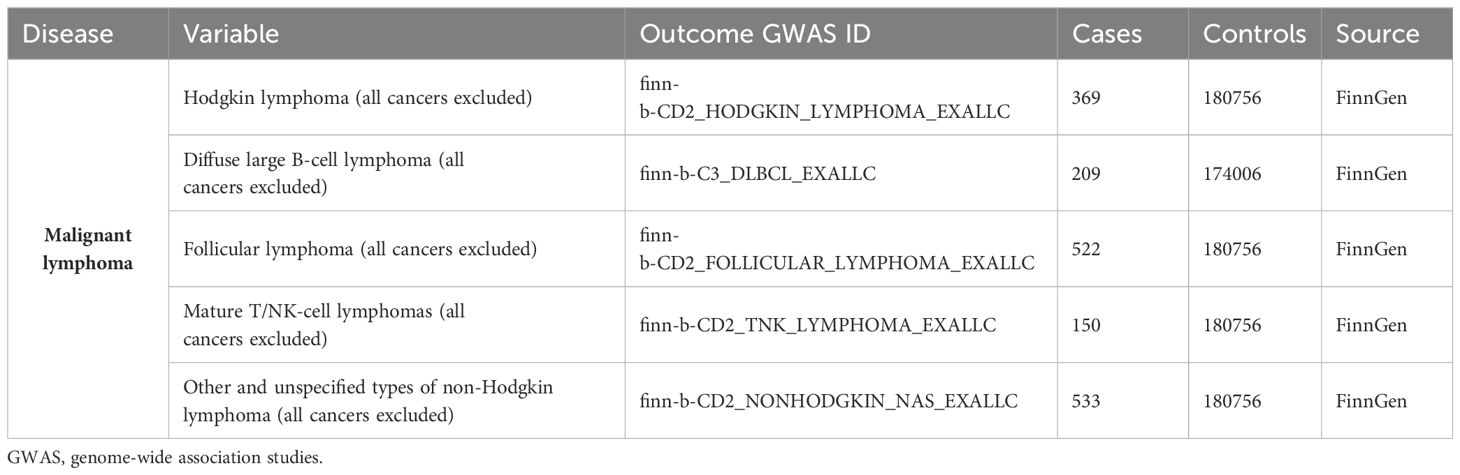
Table 1 Characteristics of outcome.
2.2 Genetic instrumental variant selection for BMI
In conducting MR studies, adherence to three fundamental assumptions is imperative: 1) a robust correlation between instrumental variants (IVs) and exposure variables exists; 2) the IVs are free from any influence of confounding factors about the exposure-outcome association; 3) genetic variants solely impact the outcome via the exposure route, excluding other pathways (18). The core assumptions depicted in Figure 1 were addressed by following a systematic approach. Initially, IVs with genome-wide significance (P <5e–8) were extracted from the BMI GWAS. Subsequently, linkage disequilibrium (LD) was considered with a threshold of r2 = 0.001 and a clumping distance of 10,000. Proxy single nucleotide polymorphisms (SNPs) with LD greater than 0.8 were then identified, while palindromic SNPs were excluded while harmonizing the BMI and HL GWAS datasets. Finally, the MR Pleiotropy RESidual Sum was employed to detect potential outlier SNPs and correct for any horizontal pleiotropy (19). The remaining SNPs were utilized for MR analysis in the subsequent stage. The F-statistic was calculated for each of the remaining SNPs to determine the strength of the genetic instruments. An F-statistic exceeding 10 signifies a robust genetic instrument essential for trustworthy MR analysis.
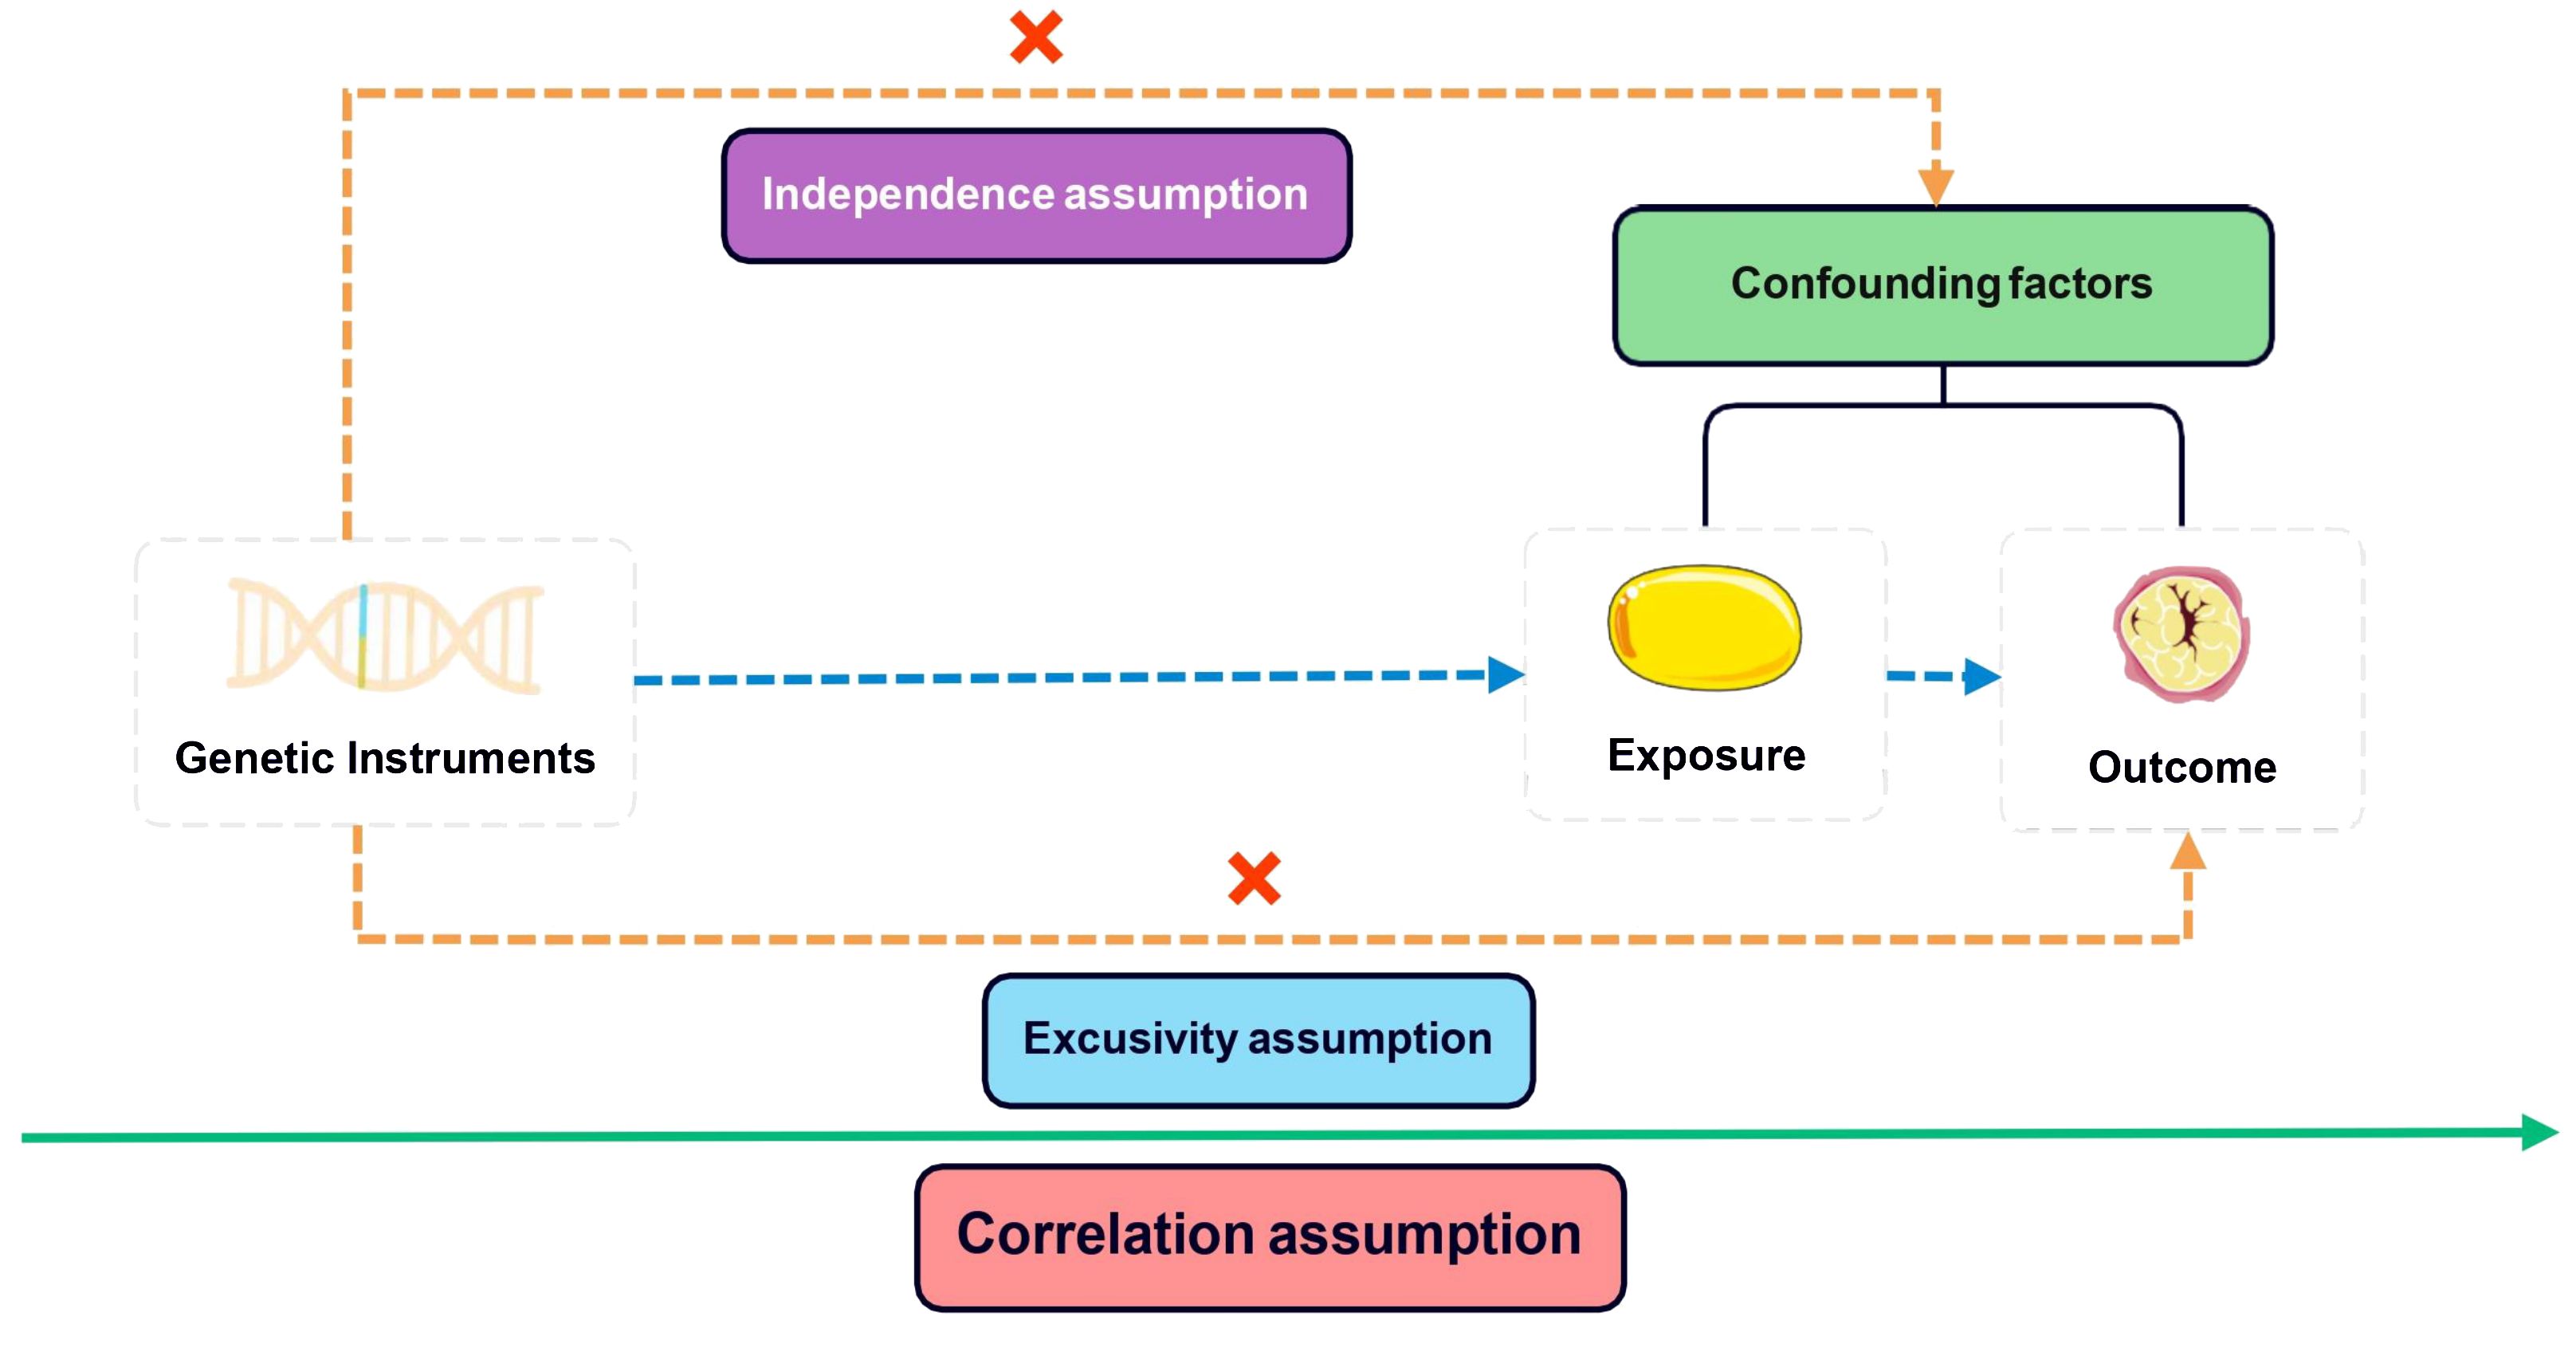
Figure 1 Three core assumptions of Mendelian randomization (MR) analysis.
2.3 MR analysis
We employed five methods to tackle the issue of horizontal pleiotropy. These methods consisted of the inverse-variance weighted (IVW) model, weighted median (WM), MR-Egger, simple mode, and weighted mode. The primary analyses in this study utilized the multiplicative random-effects IVW method, known for providing accurate estimates when all SNPs are considered valid instruments. The weighted median method can also generate consistent estimates if more than 50% of the weight comes from valid instrument variants (20). The MR-Egger regression model was represented by the following formula:
In this equation, the components represented the following meanings: βIV: Effect size estimate for the instrumental variable (IV); α: Intercept term represented the average pleiotropic effect across all genetic variants; β: Slope term represented the causal effect estimate; SE: Standard error of the exposure; ε: Error term accounting for residual pleiotropy. MR-Egger regression offered estimates while accounting for horizontal pleiotropy, albeit with slightly reduced precision (21). MR-Egger was considered to be supportive when the effect estimate was consistent with MR-IVW. Through the utilization of these various techniques, we were successful in identifying and addressing the potential effects of horizontal pleiotropy in our study. The β Value acted as the effect size for determining the direction of causality, where β > 0 signifies the exposure as a risk factor for the outcome. Statistical significance was indicated by P< 0.05. The heterogeneity among genetic IVs was evaluated using Cochran’s Q test. Sensitivity analysis predominantly utilized the leave-one-out method. The causal link between BMI and lymphoma remained robust even when systematically removing one SNP at a time. The MR-Egger intercept test was employed to detect directional pleiotropy, with a P< 0.05 indicating its presence. Funnel plots were employed to assess directional pleiotropy, similar to their role in meta-analysis for detecting publication bias. The MR analysis was carried out using R software (version 4.3.2) with the package “TwoSampleMR” (version 0.5.10). The study’s flowchart is illustrated in Figure 2.

Figure 2 The flow diagram of the Mendelian randomization (MR) study.
2.4 External verification
A retrospective study was conducted at Fujian Medical University Union Hospital from 2020 to 2021, involving 124 newly diagnosed HL patients [Diagnostic criteria reference Hodgkin lymphoma: 2023 update on diagnosis, risk-stratification, and management (3)]. The validation study protocol was approved by the ethics committee of Fujian Medical University Union Hospital (Research project ethics approval number: 2021KJCX053). Our study excluded any personally identifiable information, and utilized BMI data gathered during routine clinical procedures. Minimal risks were associated with the study, safeguarding the subjects’ rights and interests and eliminating the necessity for individual informed consent. Control group data was sourced from the National Center for Health Statistics (NHANSE). NHANES, conducted by the National Center for Health Statistics of the Centers for Disease Control, is a comprehensive survey that gathers health and nutrition data from a nationally representative sample of individuals in the United States. The survey employs a rigorous stratified and multi-stage probability cluster design to ensure accurate and reliable results. All participants in the survey have given their informed consent to participate. In this study, we analyzed publicly available data from NHANES collected between 2009 and 2010. We randomly selected 125 people to be included in the external verification control group. Data analysis was performed using R software (version 4.3.2), and the correlation between BMI and HL was confirmed through a Logistic regression analysis. Statistical significance was established at P< 0.05. The study’s methodology is delineated in Figure 3.

Figure 3 The flow diagram of the external verification.
3 Results
3.1 Instrumental variables for Mendelian randomization
We have selected 9 independent SNPs (rs10876528, rs1106529, rs1294409, rs1482852, rs224333, rs459193, rs7251505, rs7766106, rs979012) from GWASs on BMI as IVs (Table 2). For further details regarding these SNPs, researchers can refer to the National Center for Biotechnology Information (NCBI) Single Nucleotide Polymorphism Database (dbSNP: https://www.ncbi.nlm.nih.gov/snp/) (22).

Table 2 The baseline characteristics of the selected SNPs in the BMI GWAS.
3.2 The causal effect of BMI on HL
The relationship between BMI and HL has been confirmed through collective causal assessments (Table 3). Individuals with a higher BMI show a 91.65% reduced likelihood of developing HL (ORIVW = 0.084, 95% CI 0.015 – 0.473, P = 0.005). Other Mendelian Randomization models also support this causal effect (ORWM = 0.092, 95% CI 0.009 – 0.945, P = 0.045; ORMR-Egger = 0.011, 95% CI 0.001 – 749.53, P = 0.455; ORSimple-mode = 0.088, 95% CI 0.003 – 2.629, P = 0.198; ORWeighted-mode = 0.094, 95% CI 0.002 – 3.656, P = 0.241). The consistency in the causal direction shown by these methods is remarkable, even though not all analysis methods yielded statistically significant results. However, with the P-values of IVW and WM both below 0.05, we maintain confidence in the MR analysis confirming the association between BMI and HL. Graphical representations like forest plots (Figure 4) and scatter plots (Figure 5) further illustrate the increased risk of HL in individuals with lower BMI. These findings were based on SNPs from the BMI GWAS and causal estimates from MR models.
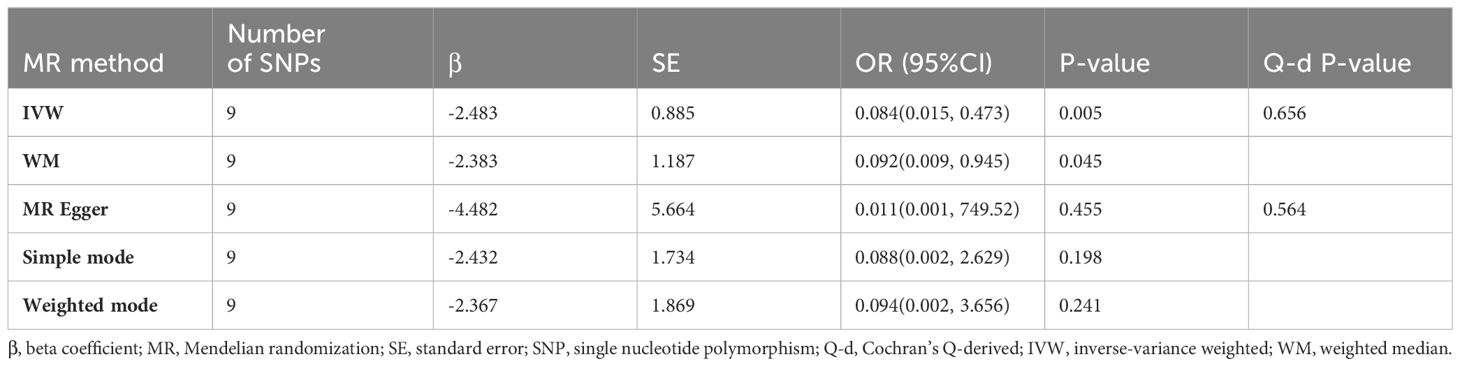
Table 3 MR estimates from each method of assessing the causal effect of BMI on the risk of HL.
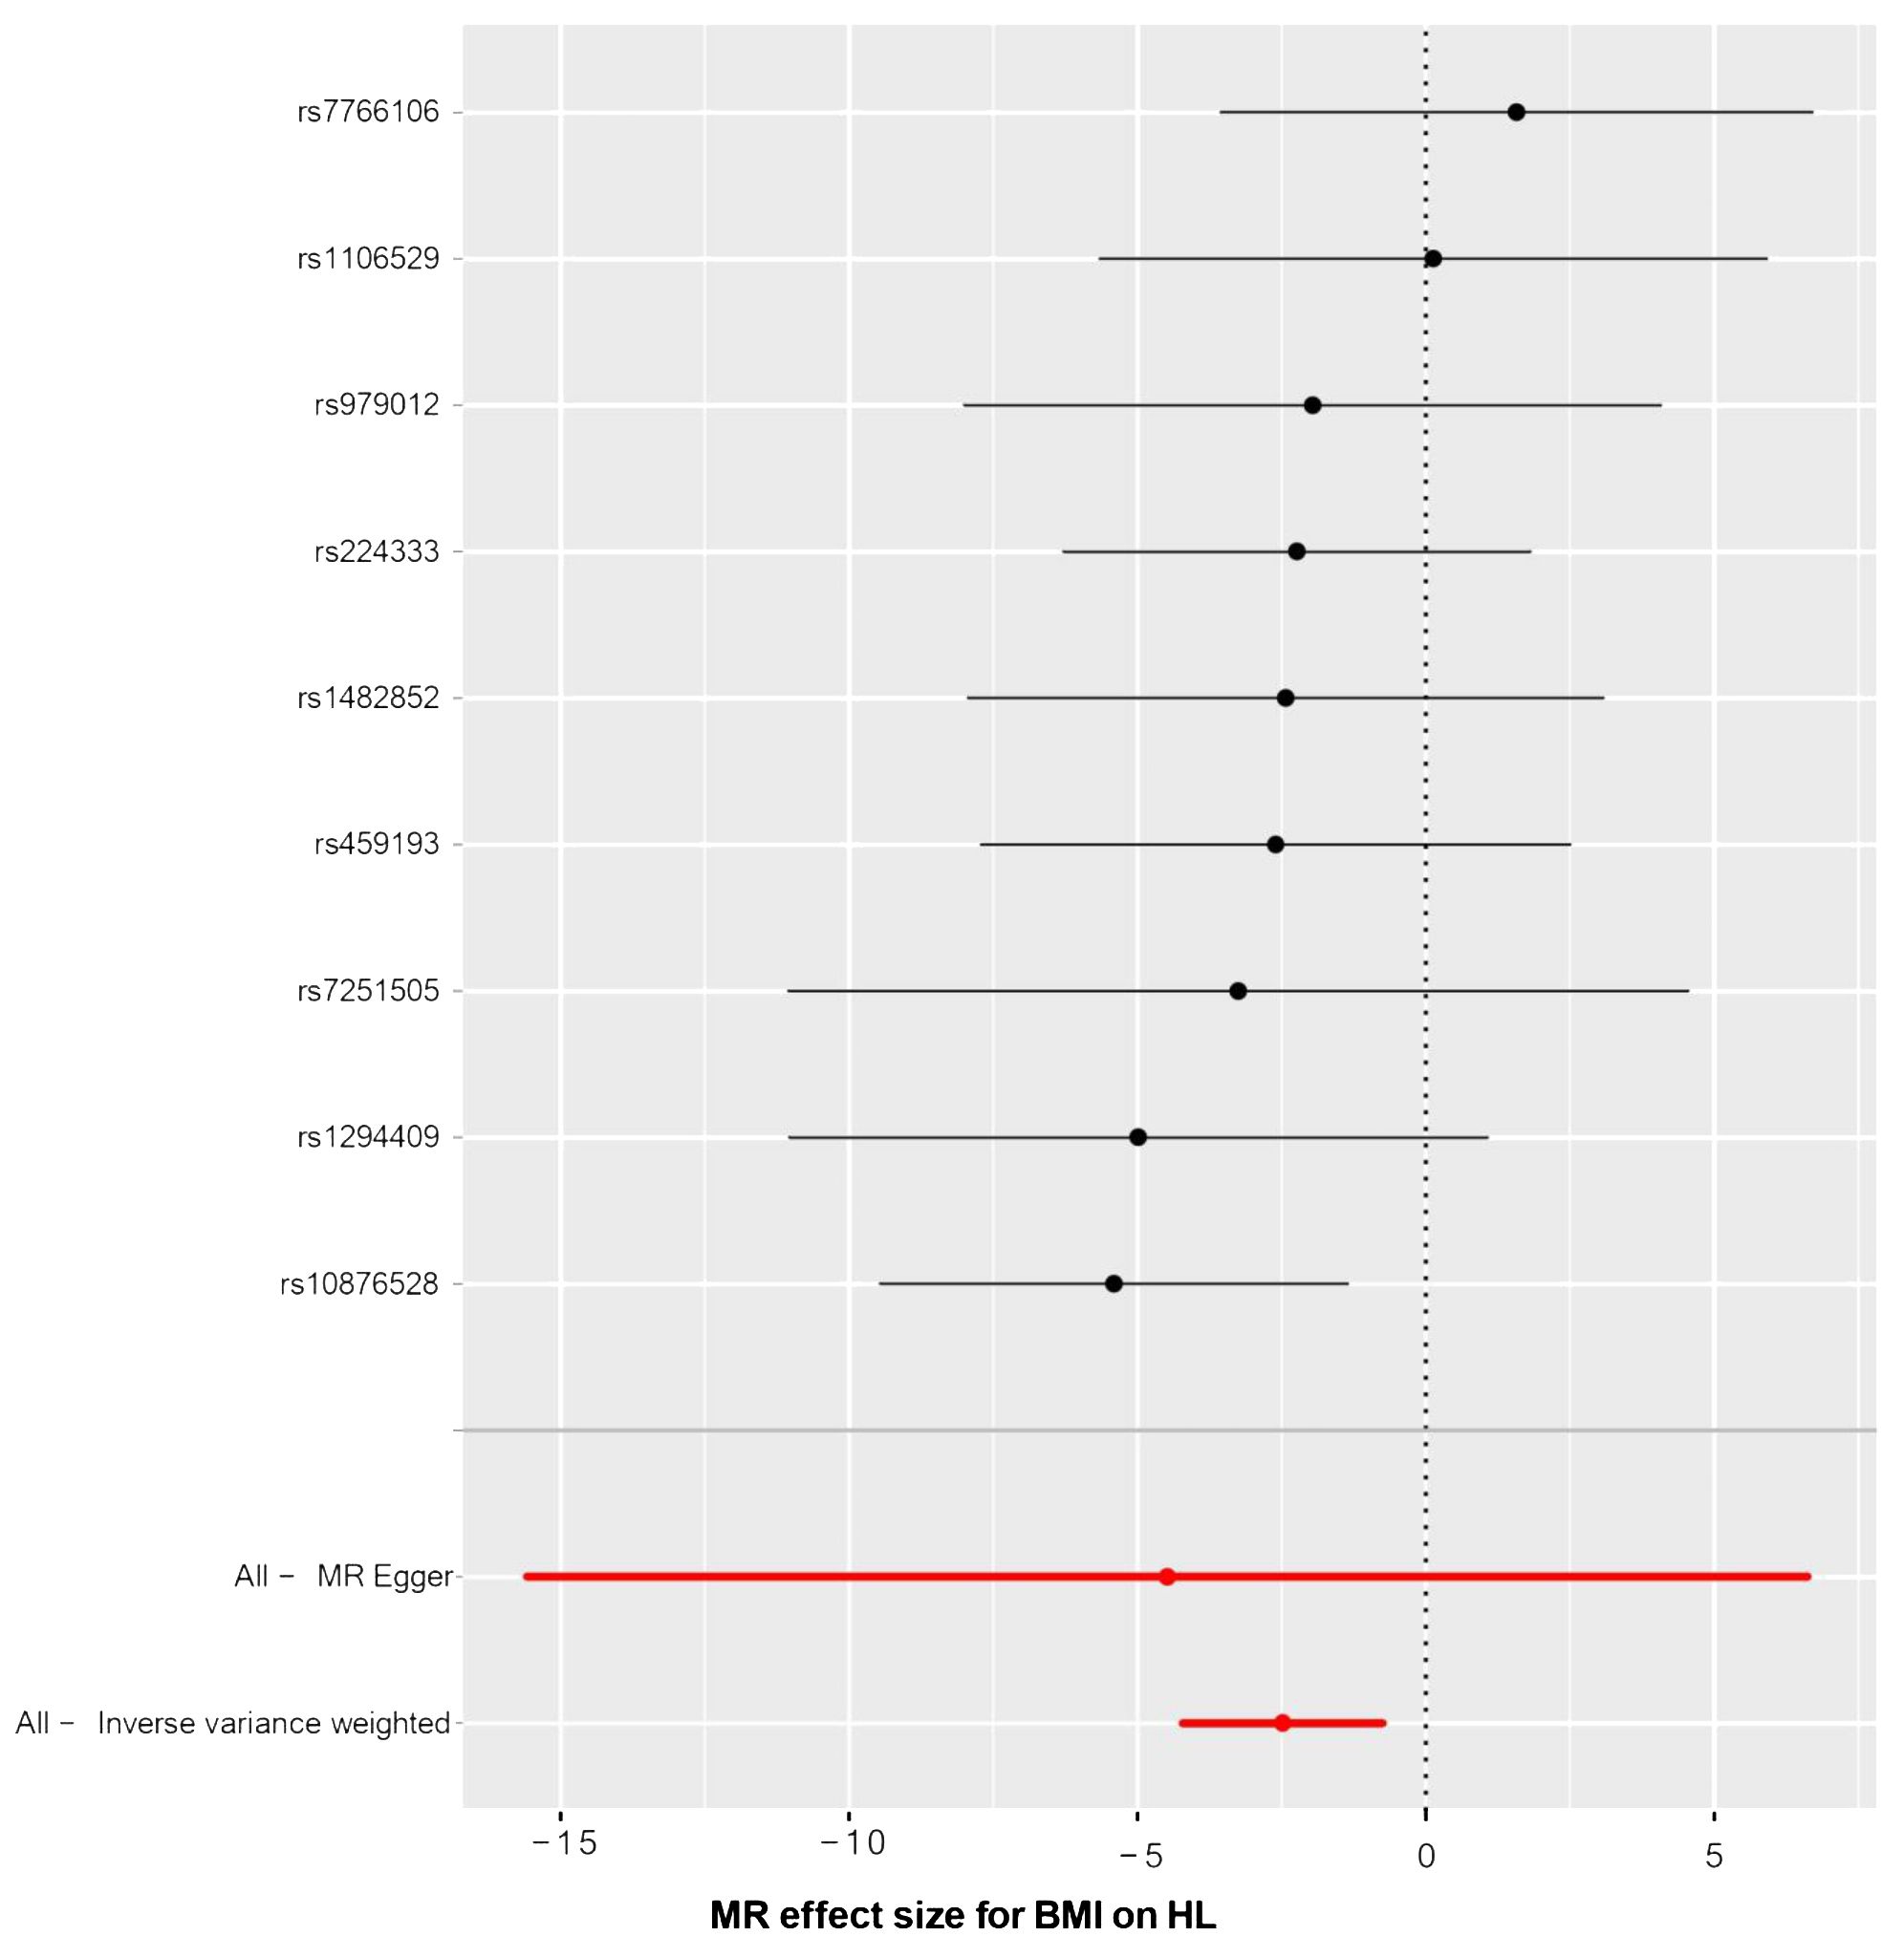
Figure 4 The forest plot of causality effect sizes of both single and merged single-nucleotide polymorphisms (SNPs) for BMI on HL. X-axis: β value.
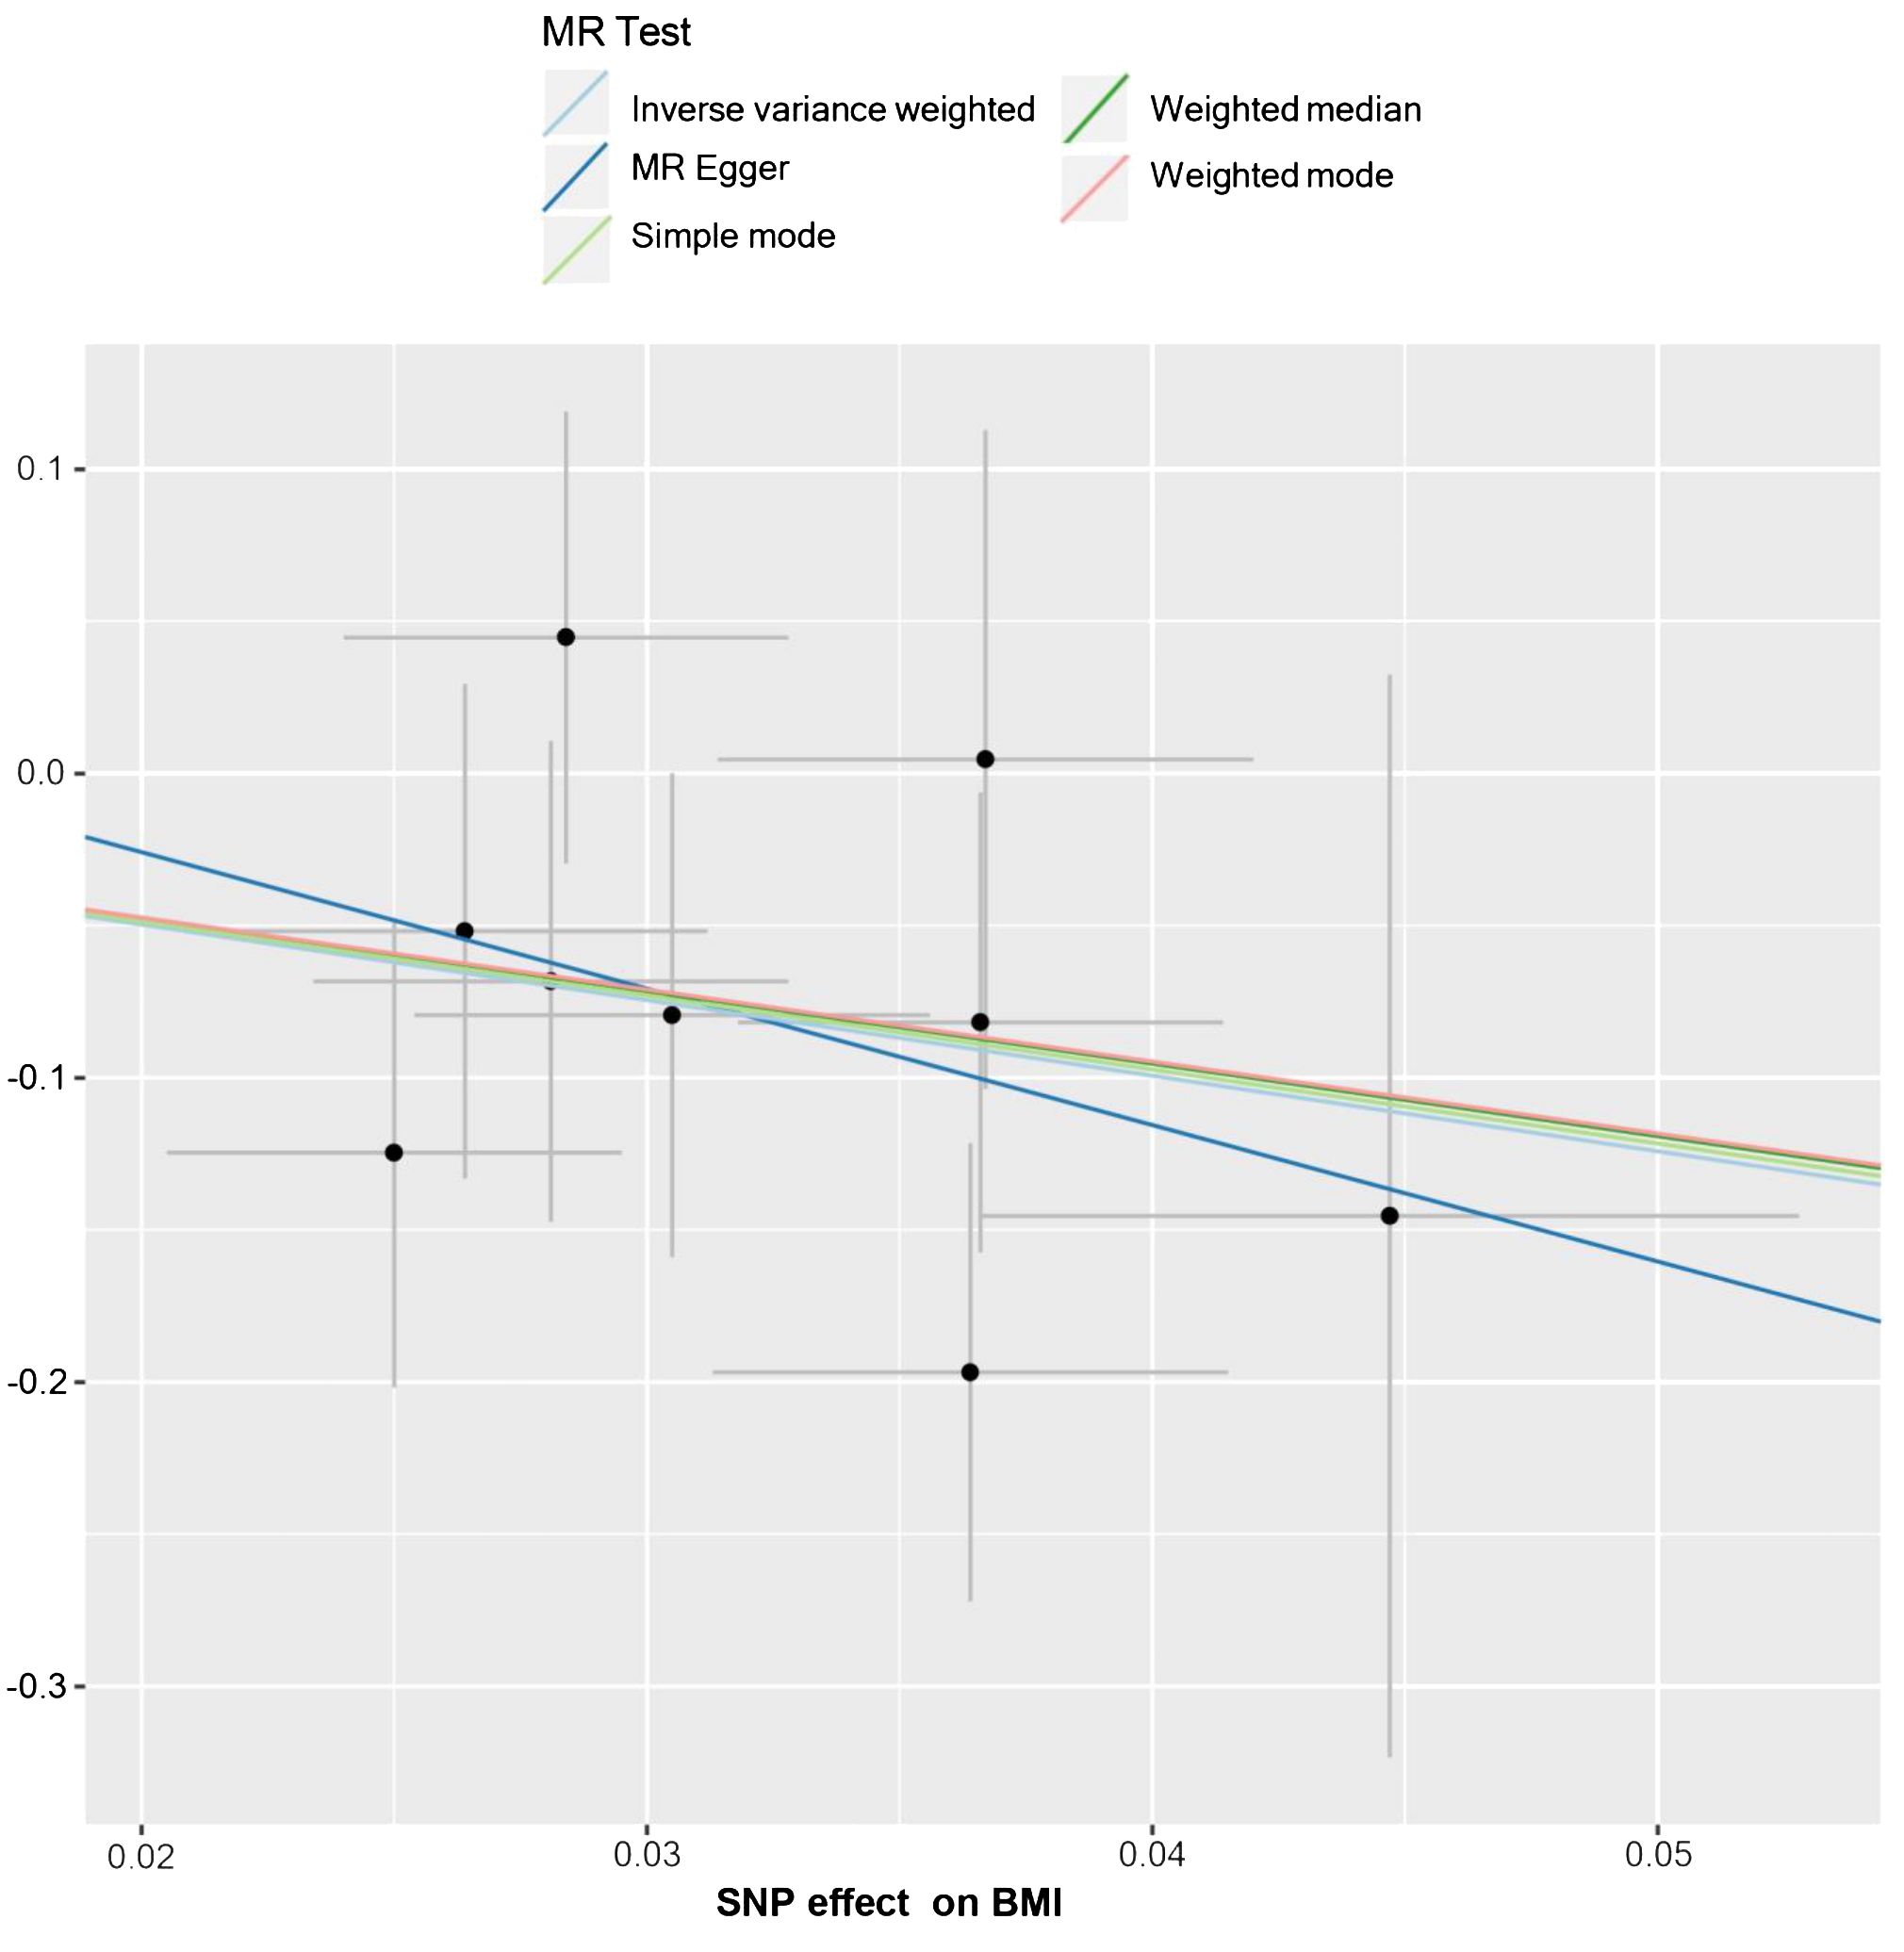
Figure 5 The scatter plot from genetically predicted BMI on HL. The X-axis represents the impact of SNPs on BMI, the Y-axis represents the impact of SNPs on HL. A negative slope less than 0 suggests that higher BMI is beneficial for the HL.
The results of the statistical analysis showed no significant heterogeneity in the study on MR, with P-values of 0.564 for PMR-Egger and 0.656 for PIVW. The MR-Egger intercept test indicated a p-value above 0.05, suggesting the absence of gene-directional pleiotropy. The sensitivity analysis, conducted through the leave-one-out method illustrated in Figure 6, consistently supported the conclusion on the causal relationship between BMI and HL, even when individual SNPs were excluded. Additionally, the symmetrical funnel plot in Figure 7 indicated the absence of directional pleiotropy.
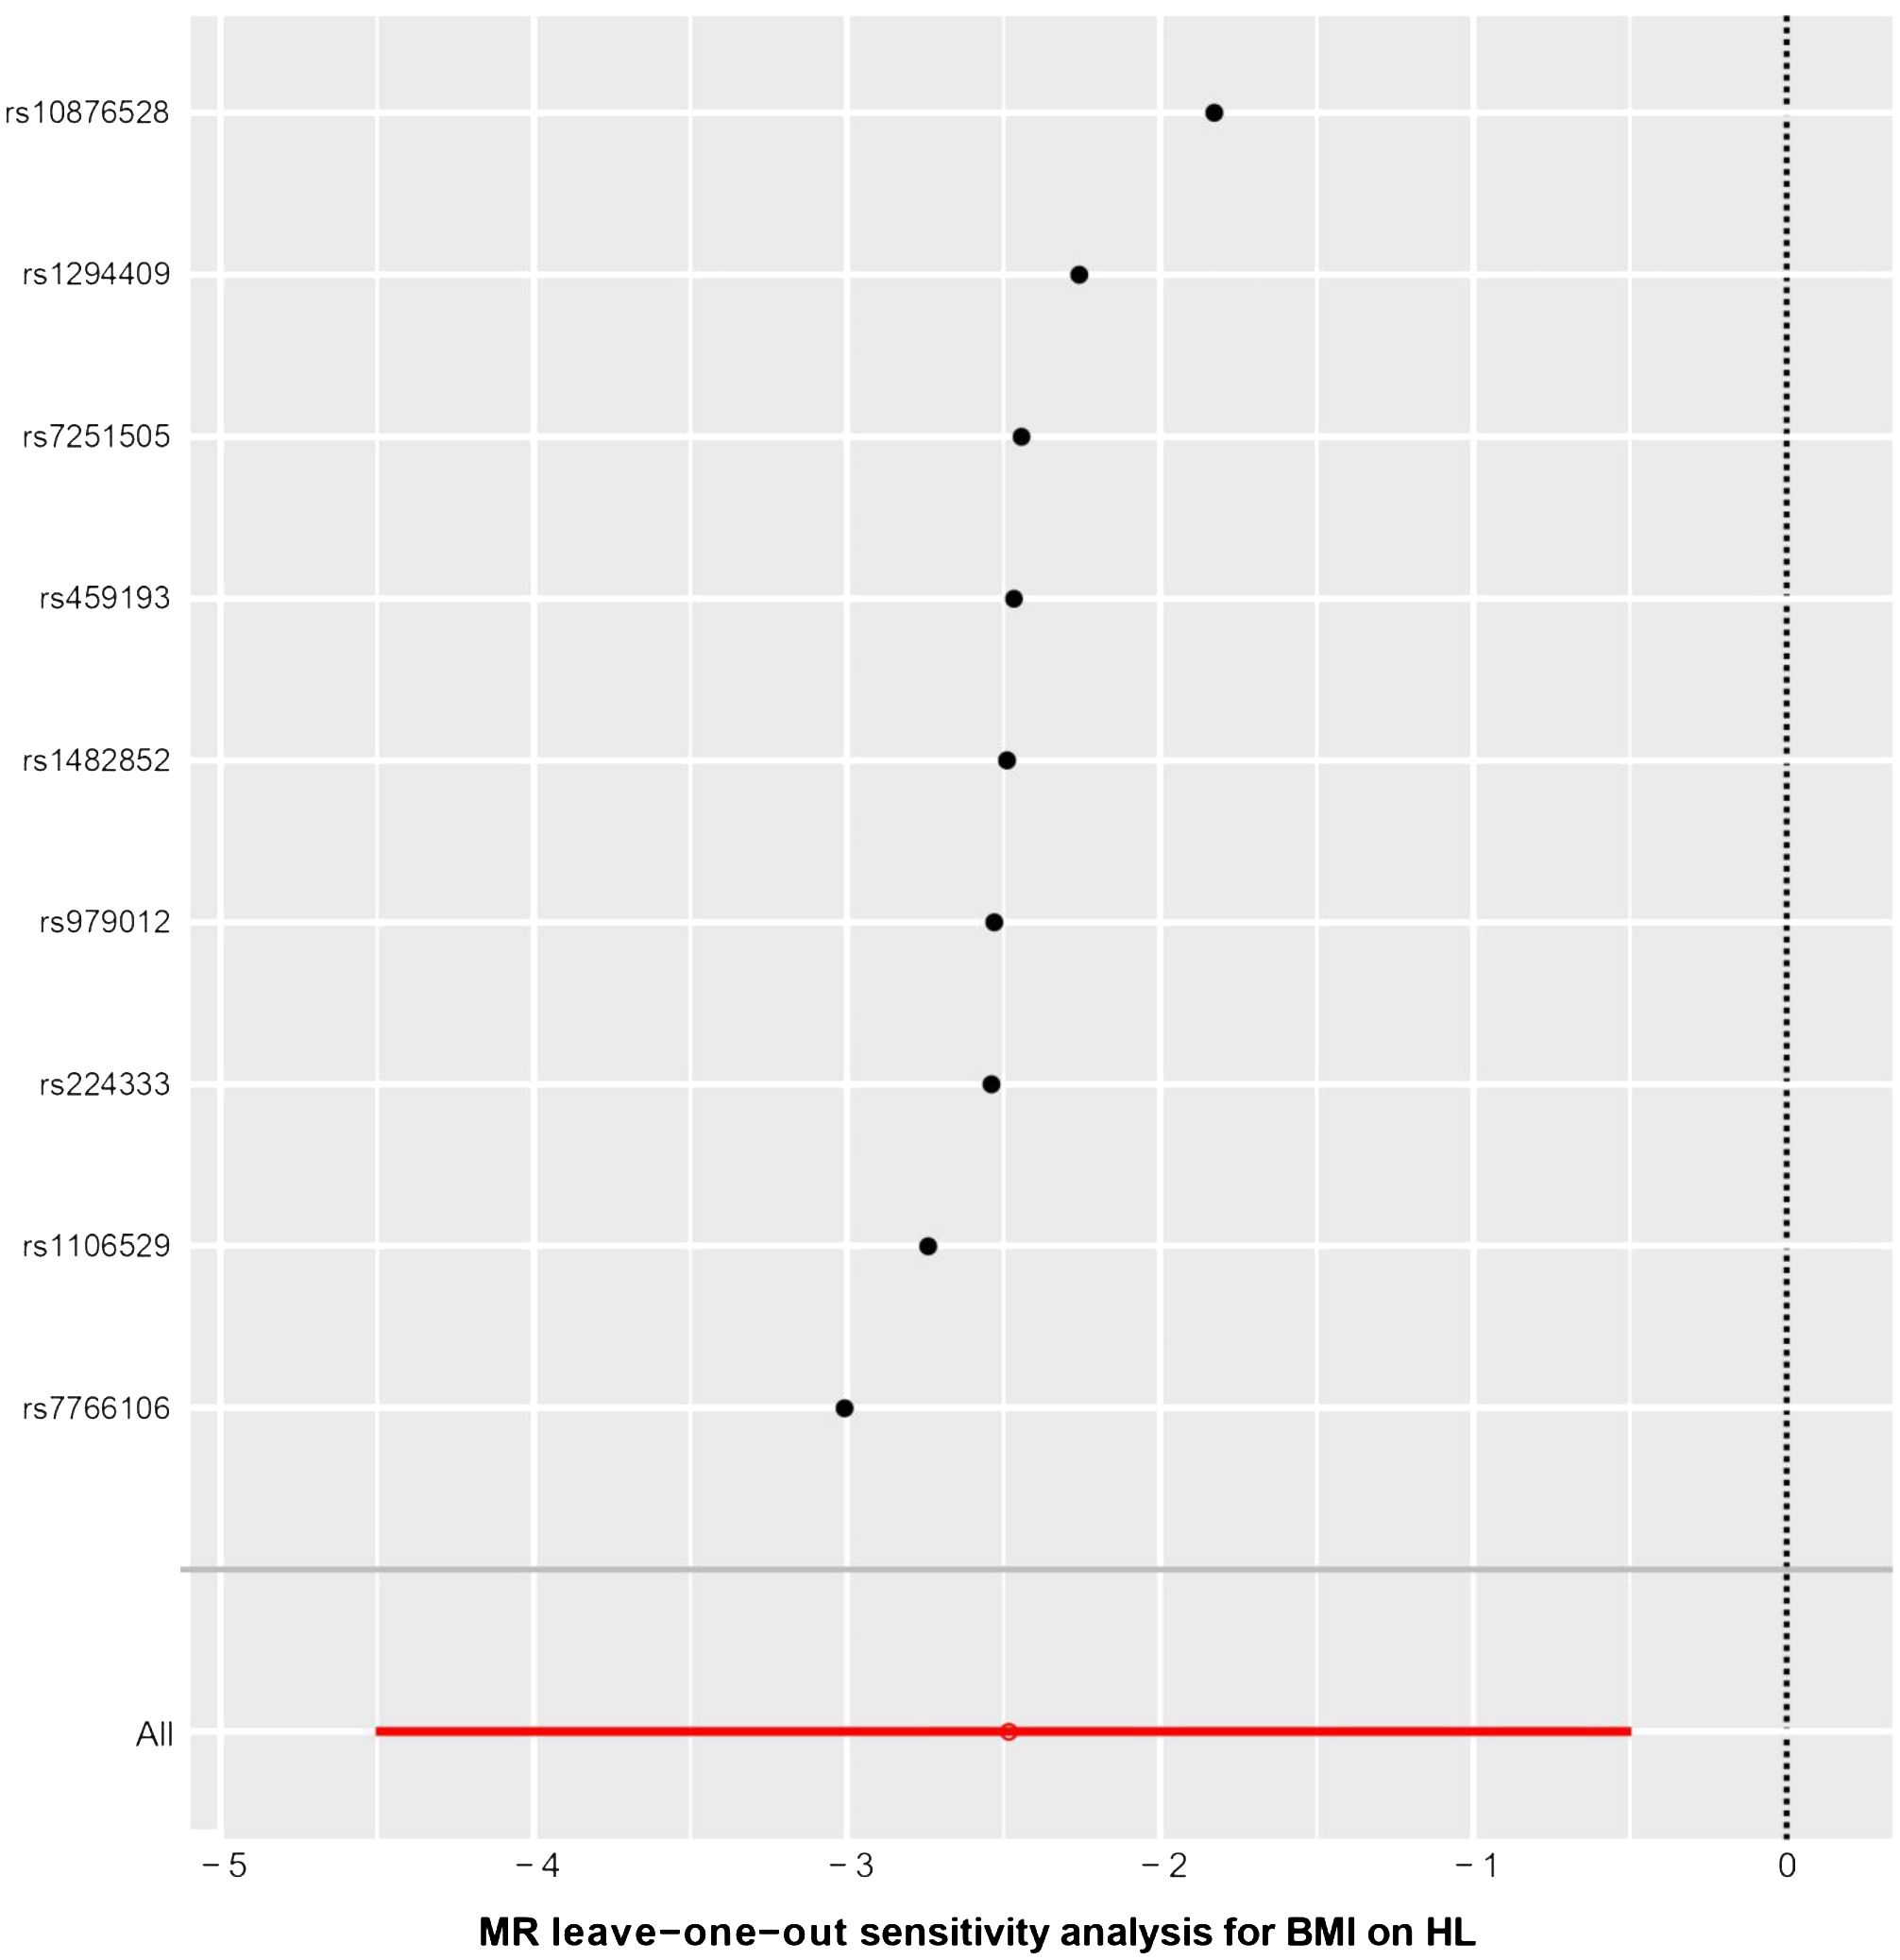
Figure 6 The results of leave-one-out methods for sensitivity analysis. X-axis: Estimated causal effects of the remaining SNPs after excluding one.
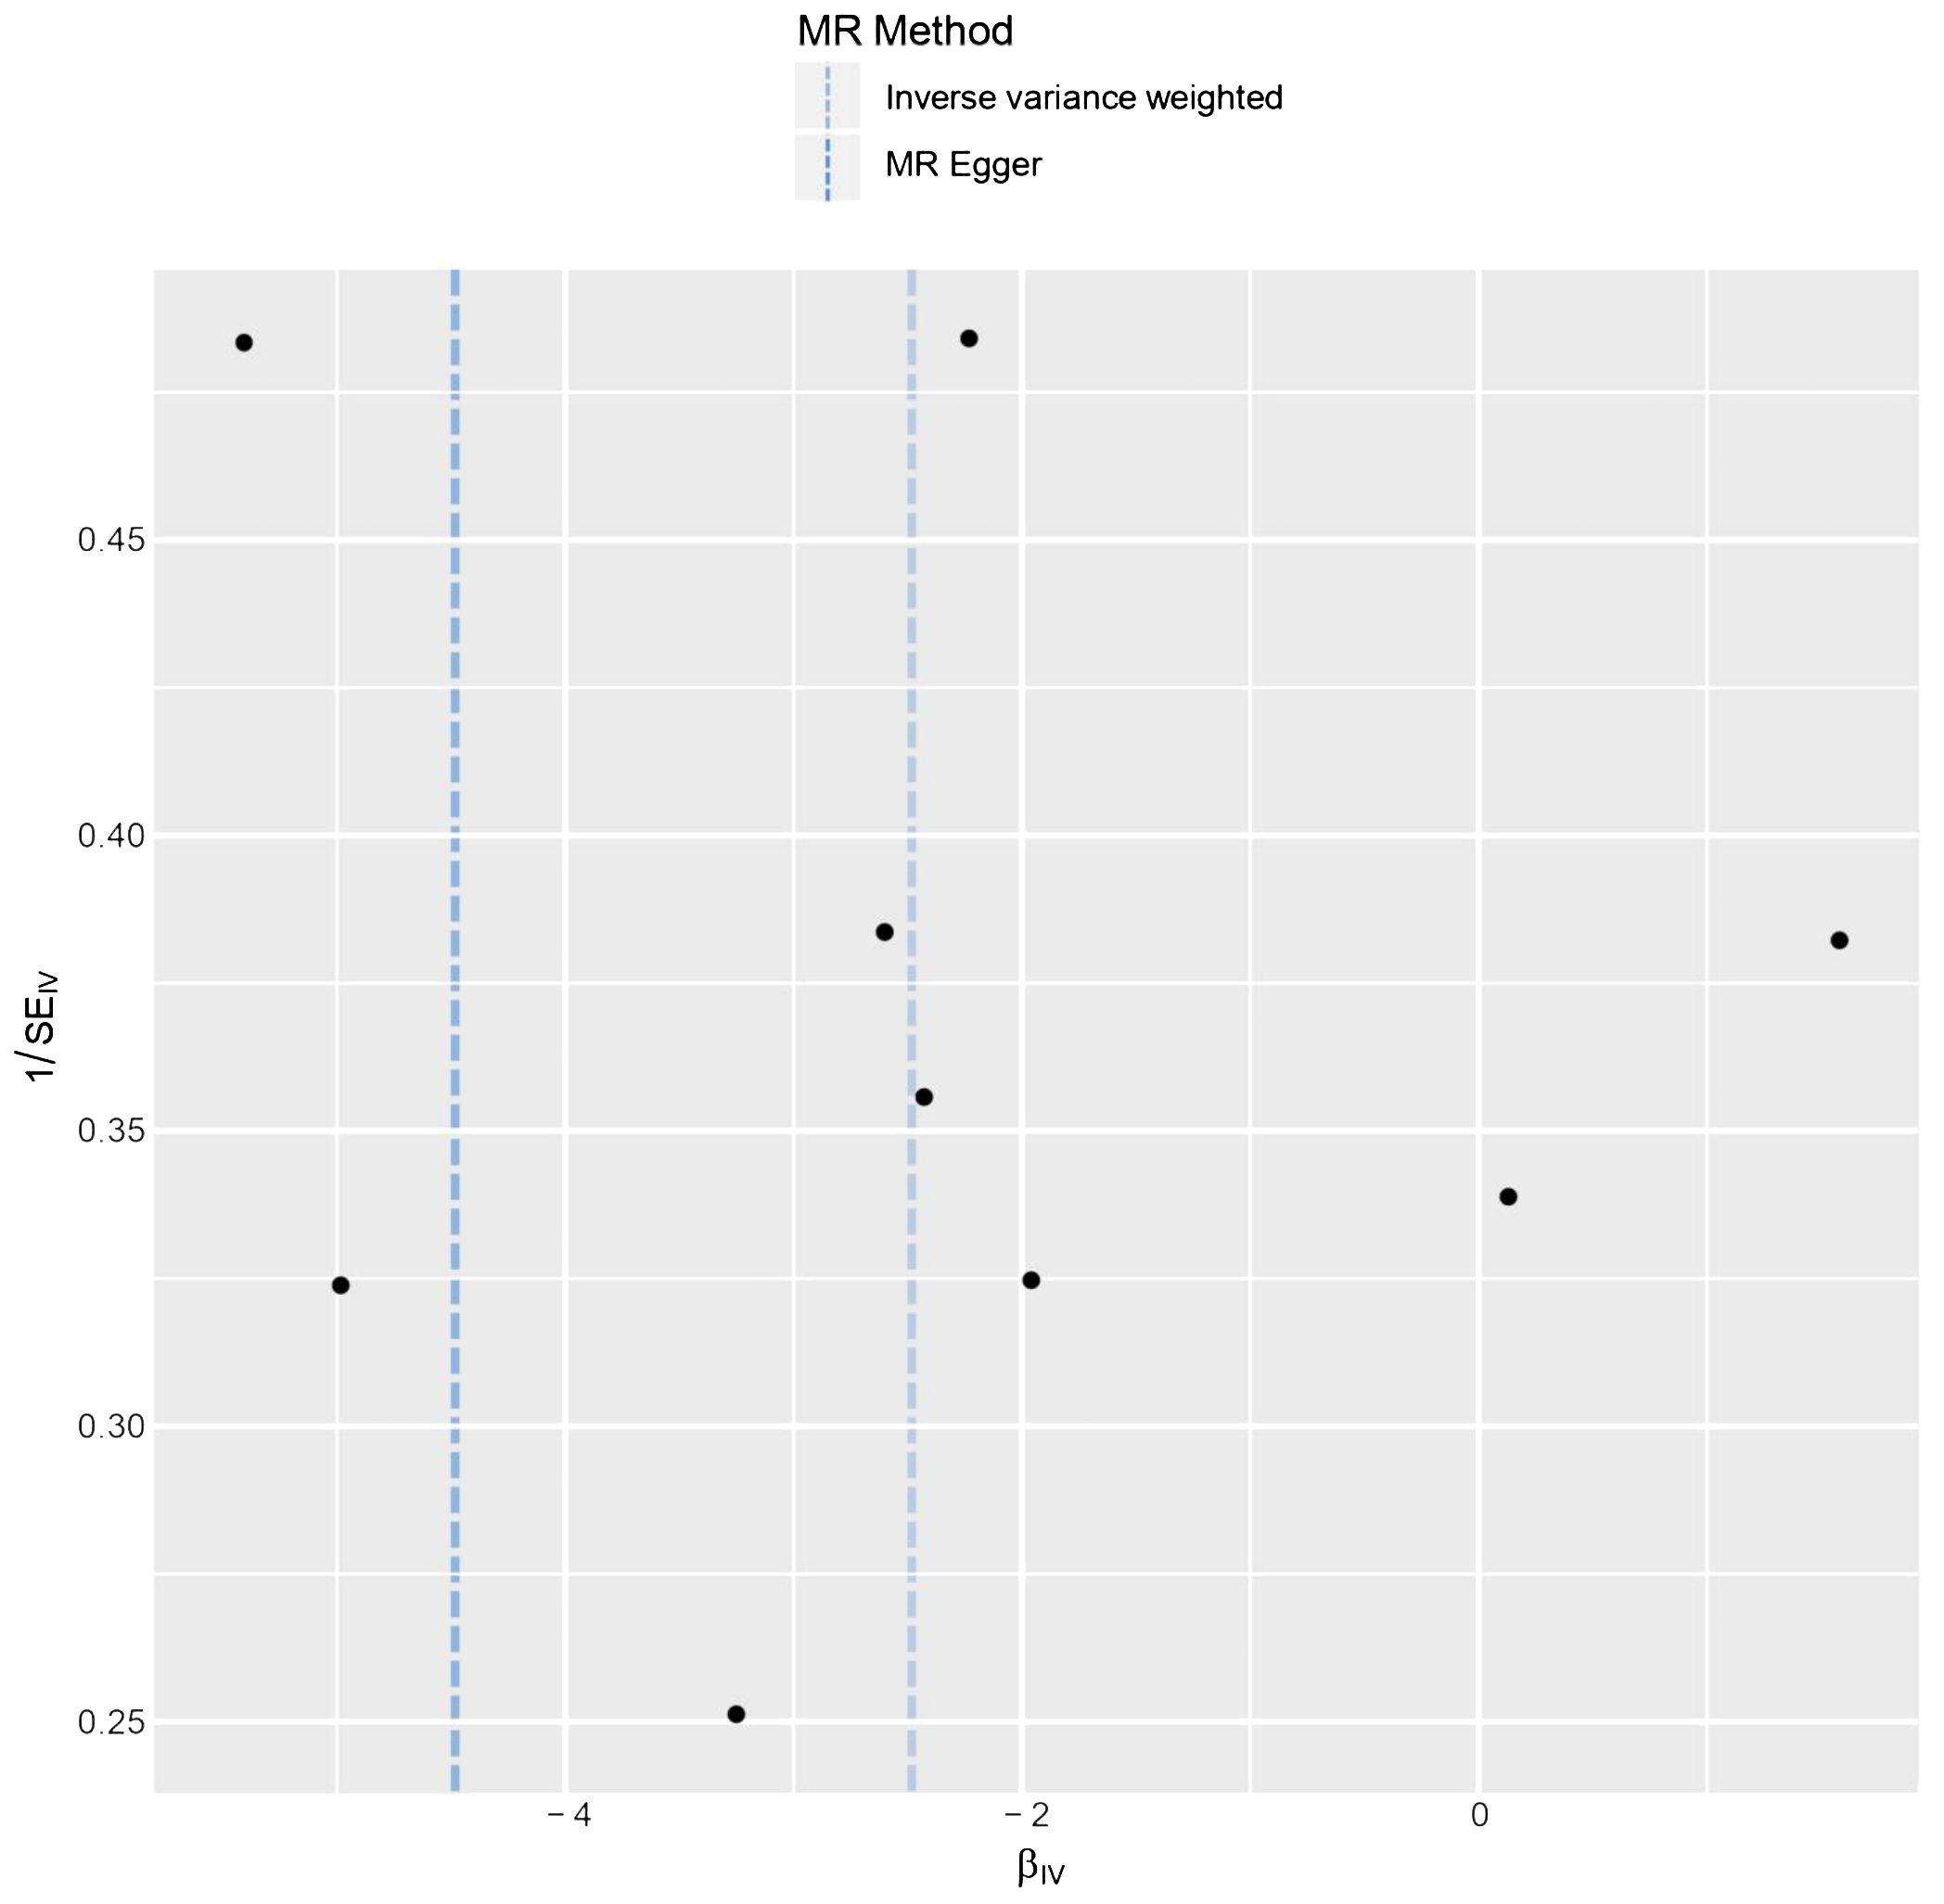
Figure 7 The funnel plot from genetically predicted BMI on HL.
3.3 The causal effect of BMI on NHL
Malignant lymphomas are a complex group of cancers that can be classified into Hodgkin’s lymphoma (HL) and non-Hodgkin’s lymphoma (NHL) based on histopathological characteristics. NHL in particular exhibits a wide range of pathological patterns, immunophenotypes, clinical presentations, and responses to treatment (23). The outcome GWASs were classified lymphomas into specific subtypes of HL and NHL. These subtypes included diffuse large B-cell lymphoma (DLBCL), follicular lymphoma (FL), mature T/NK-cell lymphoma, and other unspecified types of NHL.
Two-sample MR analysis results indicated that there is no causal relationship between BMI and NHL (Table 4).

Table 4 The causal effect of BMI on non-Hodgkin’s lymphoma.
3.4 External verification
External validation has confirmed a strong link between BMI and the onset of HL. Studies have indicated that individuals with a lower BMI face an increased risk of HL (OR = 0.871, 95% CI 0.8260 – 0.9180, P< 0.001) (Figure 8).
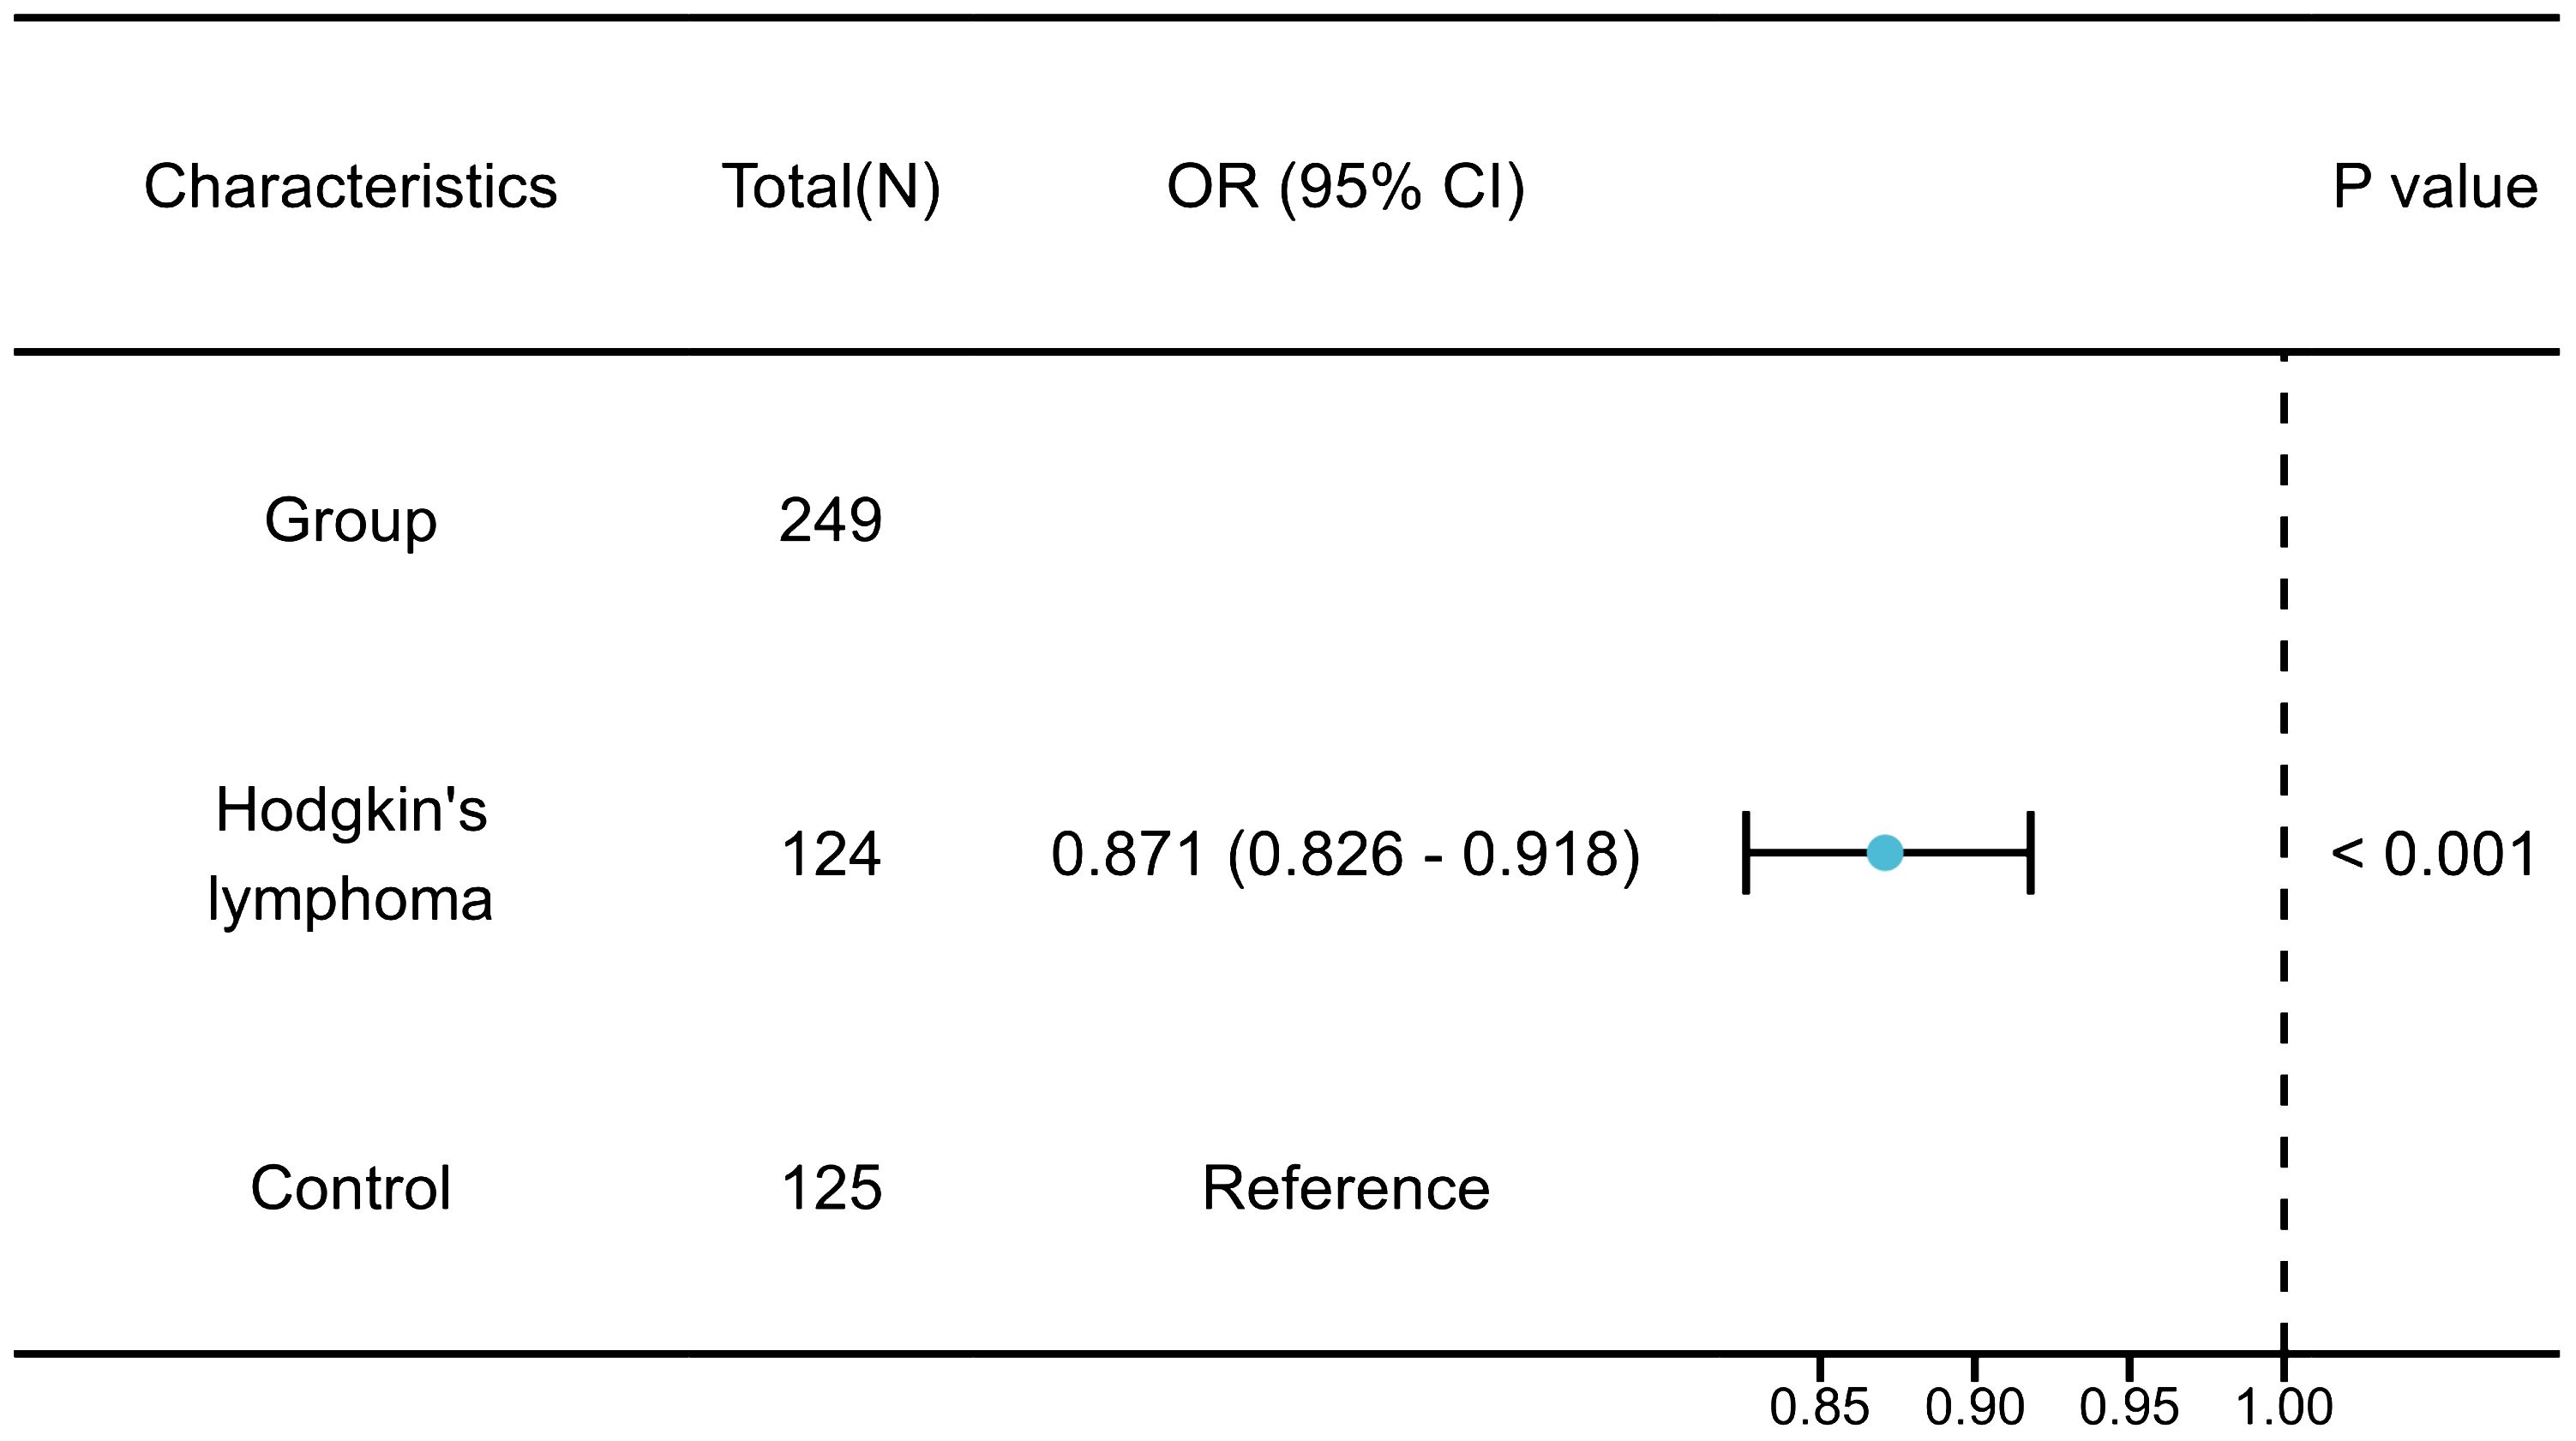
Figure 8 The forest plot of external validation.
4 Discussion
This study is the first to examine the potential link between BMI and malignant lymphoma through a two-sample Mendelian randomization approach. In our study, we employed five different methods for estimating causal relationships in MR analyses: the inverse-variance weighted method, the weighted median method, the MR-Egger regression, the Simple mode, and the Weighted mode. We identified 9 SNPs significantly associated with BMI in the analysis. Our findings indicate a higher risk of HL in individuals with a lower BMI. Interestingly, no direct causal relationship was found between BMI and NHL in the study.
In today’s understanding of human metabolism, adipocytes are no longer seen as passive cells but as active endocrine and paracrine organs (24). By releasing adipokines, such as growth factors, cytokines, chemokines, and hormones, adipocytes have a significant impact on tissue angiogenesis and tumor formation (25). Including IL-6, IL-8, leptin, adiponectin, TNF-α, vascular endothelial growth factor (VEGF), osteopontin (OPN), haptoglobin (Hp), and YKL-40, among others (26–28). These molecules play a crucial role in influencing key mechanisms in cancer cells such as proliferation, apoptosis, and migration (29, 30). Therefore, BMI is associated with the development of many cancers, including breast cancer, colon cancer, and endometrial cancer (31). However, the role of high BMI in the development of HL remains controversial.
HL is characterized by an inflammatory microenvironment at the tumor site in lymph nodes (32, 33). The secretion of cytokines and chemokines by both HRS cells and surrounding non-neoplastic cells is believed to play a role in the growth and progression of HL (34). Additionally, adipocytes within the bone marrow microenvironment are thought to influence the behavior of HRS cells (35, 36). These adipocytes are a significant source of these adipokines, including leptin and IL-6 (37, 38), which activate the JAK/STAT pathway that is crucial for HL malignant cells (39, 40). The impact of adipocytes on the survival and proliferation of HRS cells through the secretion of adipokines is an area that requires further investigation, including whether adipocytes behave differently in the presence of HL malignant cells. Our research has shown that individuals with a higher BMI may have a lower risk of developing HL. We have identified 9 specific SNPs that are linked to this finding. The genes in which these SNPs are located may affect the development of HL by affecting the secretion of adipocytes, which helps explain why some obese HL patients have better prognoses. Further research into these genes could provide valuable insights into the connection between adipocytes and HL.
The study provides evidence of a causal relationship between BML and HL, but there are limitations to be aware of. The study primarily concentrated on a European population, which may hinder the generalizability of the findings to other regions, although using populations in the Americas and Asia for external validation. Furthermore, the reliance on data from GWAS meta-analyses restricted the ability to perform stratified analyses based on various demographics.
While our study does have some limitations, it also has several advantages. The wealth of data at our disposal allowed for a comprehensive analysis of incident HL and facilitated a robust genome-wide association study GWAS to pinpoint genetic instruments for MR analyses. In addition, various challenges may hinder the accuracy of analyses in MR studies, such as the potential for multiple downstream effects from a single genetic variant and non-random associations between genetic variants. To overcome these challenges, our study utilized strict criteria for IV selection and evaluated causality using five MR methods (IVW, WM, MR-Egger, simple mode, and weighted mode). Additionally, we conducted leave-one-out analyses to assess result robustness by excluding individual variants, and employed various sensitivity analysis to address pleiotropic effects and non-random associations of genetic variants. As a result, the causal relationships identified in our study can be considered reliable and robust.
5 Conclusion
According to the results of this MR study, it is suggested that lower BMI could be a notable risk factor for HL. This conclusion seems to suggest that our adipose tissue protects us from HL. Additional research is required to completely comprehend the underlying mechanism of this cause-and-effect relationship. This study acts as a prompt for internists to be cautious of the potential link between BMI and malignant lymphoma during patient care.
Data availability statement
The original contributions presented in the study are included in the article/supplementary material. Further inquiries can be directed to the corresponding author.
Ethics statement
This study used publicly available data from studies on human experimentation that have been approved by their respective institutional review boards. The validation study protocol was approved by the ethics committee of Fujian Medical University Union Hospital (Research project ethics approval number: 2021KJCX053). HL Group of validation excluded any personally identifiable information, and utilized BMI data gathered during routine clinical procedures. Minimal risks were associated with the study, safeguarding the subjects’ rights and interests and eliminating the necessity for individual informed consent.
Author contributions
LW: Conceptualization, Data curation, Formal analysis, Investigation, Methodology, Software, Validation, Visualization, Writing – original draft, Writing – review & editing. FL: Conceptualization, Formal analysis, Investigation, Methodology, Software, Writing – original draft, Writing – review & editing. XG: Data curation, Investigation, Validation, Visualization, Writing – original draft, Writing – review & editing. NL: Conceptualization, Funding acquisition, Methodology, Project administration, Resources, Supervision, Writing – original draft, Writing – review & editing.
Funding
The author(s) declare financial support was received for the research, authorship, and/or publication of this article. This work was funded by Fujian Science and Technology major special projects (2022YZ034016); Fujian provincial health technology project (2021ZD01005); Joint Funds for the Innovation of Science and Technology, Fujian province (Grant number: 2021Y9050).
Acknowledgments
We want to acknowledge the MR Base website, FinnGen website, OPEN GWAS website, National Center for Health Statistics, the National Center for Biotechnology Information (NCBI), Genetic Investigation of Anthropometric Traits consortium (GIANT consortium), and SMART-Servier medical ART website. Tumor icon and adipocyte-7 icon in Figure 1 by Servier https://smart.servier.com/ is licensed under CC-BY 3.0 Unported https://creativecommons.org/licenses/by/3.0/. We would like to express our heartfelt thanks to Dr. Jinhua Chen of Fujian Medical University Union Hospital for the thorough statistical review of our study.
Conflict of interest
The authors declare that the research was conducted in the absence of any commercial or financial relationships that could be construed as a potential conflict of interest.
Publisher’s note
All claims expressed in this article are solely those of the authors 5and do not necessarily represent those of their affiliated organizations, or those of the publisher, the editors and the reviewers. Any product that may be evaluated in this article, or claim that may be made by its manufacturer, is not guaranteed or endorsed by the publisher.
References
1. Crombie JL, Armand P. Diffuse large B-cell lymphoma's new genomics: The bridge and the chasm. J Clin oncology: Off J Am Soc Clin Oncol. (2020) 38:3565–74. doi: 10.1200/JCO.20.01501
2. Shanbhag S, Ambinder RF. Hodgkin lymphoma: A review and update on recent progress. CA: Cancer J Clin. (2018) 68:116–32. doi: 10.3322/caac.21438
3. Ansell SM. Hodgkin lymphoma: 2023 update on diagnosis, risk-stratification, and management. Am J hematology. (2022) 97:1478–88. doi: 10.1002/ajh.26717
4. Fantuzzi G. Adipose tissue, adipokines, and inflammation. J Allergy Clin Immunol. (2005) 115:911–9. doi: 10.1016/j.jaci.2005.02.023
5. Argyrakopoulou G, Dalamaga M, Spyrou N, Kokkinos A. Gender differences in obesity-related cancers. Curr Obes Rep. (2021) 10:100–15. doi: 10.1007/s13679-021-00426-0
6. Ranasinghe C, Gamage P, Katulanda P, Andraweera N, Thilakarathne S, Tharanga P. Relationship between Body Mass Index (BMI) and body fat percentage, estimated by bioelectrical impedance, in a group of Sri Lankan adults: a cross sectional study. BMC Public Health. (2013) 13:797. doi: 10.1186/1471-2458-13-797
7. Larsson SC, Wolk A. Body mass index and risk of non-Hodgkin's and Hodgkin's lymphoma: a meta-analysis of prospective studies. Eur J Cancer (Oxford England: 1990). (2011) 47:2422–30. doi: 10.1016/j.ejca.2011.06.029
8. Murphy F, Kroll ME, Pirie K, Reeves G, Green J, Beral V. Body size in relation to incidence of subtypes of hematological Malignancy in the prospective Million Women Study. Br J cancer. (2013) 108:2390–8. doi: 10.1038/bjc.2013.159
9. Landgren O, Andrén H, Nilsson B, Ekbom A, Björkholm M. Risk profile and outcome in Hodgkin's lymphoma: is obesity beneficial? Ann oncology: Off J Eur Soc Med Oncol. (2005) 16:838–40. doi: 10.1093/annonc/mdi145
10. Hong F, Habermann TM, Gordon LI, Hochster H, Gascoyne RD, Morrison VA, et al. The role of body mass index in survival outcome for lymphoma patients: US intergroup experience. Ann oncology: Off J Eur Soc Med Oncol. (2014) 25:669–74. doi: 10.1093/annonc/mdt594
11. Pandis N. Bias in observational studies. Am J orthodontics dentofacial orthopedics: Off Publ Am Assoc Orthodontists its constituent societies Am Board Orthodontics. (2014) 145:542–3. doi: 10.1016/j.ajodo.2014.01.008
12. Burgess S, Daniel RM, Butterworth AS, Thompson SG. Network Mendelian randomization: using genetic variants as instrumental variables to investigate mediation in causal pathways. Int J Epidemiol. (2015) 44:484–95. doi: 10.1093/ije/dyu176
13. Lawlor DA. Commentary: Two-sample Mendelian randomization: opportunities and challenges. Int J Epidemiol. (2016) 45:908–15. doi: 10.1093/ije/dyw127
14. Hemani G, Zheng J, Elsworth B, Wade KH, Haberland V, Baird D, et al. The MR-Base platform supports systematic causal inference across the human phenome. eLife. (2018) 7. doi: 10.7554/eLife.34408
15. Locke AE, Kahali B, Berndt SI, Justice AE, Pers TH, Day FR, et al. Genetic studies of body mass index yield new insights for obesity biology. Nature. (2015) 518:197–206. doi: 10.1038/nature14177
16. Kurki MI, Karjalainen J, Palta P, Sipilä TP, Kristiansson K, Donner KM, et al. Author Correction: FinnGen provides genetic insights from a well-phenotyped isolated population. Nature. (2023) 615:E19. doi: 10.1038/s41586-023-05837-8
17. Beck T, Rowlands T, Shorter T, Brookes AJ. GWAS Central: an expanding resource for finding and visualizing genotype and phenotype data from genome-wide association studies. Nucleic Acids Res. (2023) 51:D986–d93. doi: 10.1093/nar/gkac1017
18. Burgess S, Scott RA, Timpson NJ, Davey Smith G, Thompson SG. Using published data in Mendelian randomization: a blueprint for efficient identification of causal risk factors. Eur J Epidemiol. (2015) 30:543–52. doi: 10.1007/s10654-015-0011-z
19. Rosoff DB, Clarke TK, Adams MJ, McIntosh AM, Davey Smith G, Jung J, et al. Educational attainment impacts drinking behaviors and risk for alcohol dependence: results from a two-sample Mendelian randomization study with ~780,000 participants. Mol Psychiatry. (2021) 26:1119–32. doi: 10.1038/s41380-019-0535-9
20. Yavorska OO, Burgess S. Mendelian Randomization: an R package for performing Mendelian randomization analyses using summarized data. Int J Epidemiol. (2017) 46:1734–9. doi: 10.1093/ije/dyx034
21. Burgess S, Thompson SG. Interpreting findings from Mendelian randomization using the MR-Egger method. Eur J Epidemiol. (2017) 32:377–89. doi: 10.1007/s10654-017-0255-x
22. Sayers EW, Bolton EE, Brister JR, Canese K, Chan J, Comeau DC, et al. Database resources of the national center for biotechnology information in 2023. Nucleic Acids Res. (2023) 51:D29–d38. doi: 10.1093/nar/gkac1032
23. Shankland KR, Armitage JO, Hancock BW. Non-hodgkin lymphoma. Lancet (London England). (2012) 380:848–57. doi: 10.1016/S0140-6736(12)60605-9
24. Frühbeck G, Gómez-Ambrosi J, Muruzábal FJ, Burrell MA. The adipocyte: a model for integration of endocrine and metabolic signaling in energy metabolism regulation. Am J Physiol Endocrinol Metab. (2001) 280:E827–47. doi: 10.1152/ajpendo.2001.280.6.E827
25. Housa D, Housová J, Vernerová Z, Haluzík M. Adipocytokines and cancer. Physiol Res. (2006) 55:233–44. doi: 10.33549/physiolres
26. Silha JV, Krsek M, Sucharda P, Murphy LJ. Angiogenic factors are elevated in overweight and obese individuals. Int J Obes (2005). (2005) 29:1308–14. doi: 10.1038/sj.ijo.0802987
27. Gómez-Ambrosi J, Catalán V, Ramírez B, Rodríguez A, Colina I, Silva C, et al. Plasma osteopontin levels and expression in adipose tissue are increased in obesity. J Clin Endocrinol Metab. (2007) 92:3719–27. doi: 10.1210/jc.2007-0349
28. Kern PA, Ranganathan S, Li C, Wood L, Ranganathan G. Adipose tissue tumor necrosis factor and interleukin-6 expression in human obesity and insulin resistance. Am J Physiol Endocrinol Metab. (2001) 280:E745–51. doi: 10.1152/ajpendo.2001.280.5.E745
29. Nieman KM, Romero IL, Van Houten B, Lengyel E. Adipose tissue and adipocytes support tumorigenesis and metastasis. Biochim Biophys Acta. (2013) 1831:1533–41. doi: 10.1016/j.bbalip.2013.02.010
30. Park J, Euhus DM, Scherer PE. Paracrine and endocrine effects of adipose tissue on cancer development and progression. Endocrine Rev. (2011) 32:550–70. doi: 10.1210/er.2010-0030
31. Wen H, Deng G, Shi X, Liu Z, Lin A, Cheng Q, et al. Body mass index, weight change, and cancer prognosis: a meta-analysis and systematic review of 73 cohort studies. ESMO Open. (2024) 9:102241. doi: 10.1016/j.esmoop.2024.102241
32. Aldinucci D, Gloghini A, Pinto A, De Filippi R, Carbone A. The classical Hodgkin's lymphoma microenvironment and its role in promoting tumor growth and immune escape. J pathology. (2010) 221:248–63. doi: 10.1002/path.2711
33. Küppers R. The biology of Hodgkin's lymphoma. Nat Rev Cancer. (2009) 9:15–27. doi: 10.1038/nrc2542
34. Liu Y, Sattarzadeh A, Diepstra A, Visser L, van den Berg A. The microenvironment in classical Hodgkin lymphoma: an actively shaped and essential tumor component. Semin Cancer Biol. (2014) 24:15–22. doi: 10.1016/j.semcancer.2013.07.002
35. Naveiras O, Nardi V, Wenzel PL, Hauschka PV, Fahey F, Daley GQ. Bone-marrow adipocytes as negative regulators of the hematopoietic microenvironment. Nature. (2009) 460:259–63. doi: 10.1038/nature08099
36. Okwan-Duodu D, Umpierrez GE, Brawley OW, Diaz R. Obesity-driven inflammation and cancer risk: role of myeloid derived suppressor cells and alternately activated macrophages. Am J Cancer Res. (2013) 3:21–33.
37. Laharrague P, Larrouy D, Fontanilles AM, Truel N, Campfield A, Tenenbaum R, et al. High expression of leptin by human bone marrow adipocytes in primary culture. FASEB journal: Off Publ Fed Am Societies Exp Biol. (1998) 12:747–52. doi: 10.1096/fasebj.12.9.747
38. Laharrague P, Fontanilles AM, Tkaczuk J, Corberand JX, Pénicaud L, Casteilla L. Inflammatory/hematopoietic cytokine production by human bone marrow adipocytes. Eur Cytokine network. (2000) 11:634–9.
39. Hao Y, Chapuy B, Monti S, Sun HH, Rodig SJ, Shipp MA. Selective JAK2 inhibition specifically decreases Hodgkin lymphoma and mediastinal large B-cell lymphoma growth in vitro and in vivo. Clin Cancer research: an Off J Am Assoc Cancer Res. (2014) 20:2674–83. doi: 10.1158/1078-0432.CCR-13-3007
Keywords: Hodgkin’s lymphoma (HL), non-Hodgkin’s lymphoma (NHL), adipose, body mass index (BMI), Mendelian randomization (MR)
Citation: Wu L, Liao F, Guo X and Li N (2024) The causal effect of adipose tissue on Hodgkin’s lymphoma: two-sample Mendelian randomization study and validation. Front. Immunol. 15:1400756. doi: 10.3389/fimmu.2024.1400756
Received: 14 March 2024; Accepted: 16 May 2024;
Published: 30 May 2024.
Edited by:
Chandrani Sarkar, University of South Alabama, United StatesReviewed by:
Sooraj Kakkat, University of South Alabama, United StatesShashi Anand, Mitchell Cancer Institute, United States
Paramahansa Pramanik, University of South Alabama, United States
Copyright © 2024 Wu, Liao, Guo and Li. This is an open-access article distributed under the terms of the Creative Commons Attribution License (CC BY). The use, distribution or reproduction in other forums is permitted, provided the original author(s) and the copyright owner(s) are credited and that the original publication in this journal is cited, in accordance with accepted academic practice. No use, distribution or reproduction is permitted which does not comply with these terms.
*Correspondence: Nainong Li, bmFpbmxpQGFsaXl1bi5jb20=
†These authors share first authorship