 Klaus Schughart1,2*
 Amber M. Smith2,3
 Ephraim L. Tsalik4
 Stephen C. Threlkeld5
 Subhashini Sellers6William A. Fischer II6Jens Schreiber7Eva Lücke7
 Markus Cornberg8,9,10,11Jennifer Debarry8,11
 Christopher W. Woods4,12Micah T. McClain4,12Mark Heise13,14
- 1Institute of Virology Münster, University of Münster, Münster, Germany
- 2Department of Microbiology, Immunology and Biochemistry, University of Tennessee Health Science Center, Memphis, TN, United States
- 3Department of Pediatrics, University of Tennessee Health Science Center, Memphis, TN, United States
- 4Division of Infectious Diseases, Department of Medicine, Duke University School of Medicine, Durham, NC, United States
- 5Baptist Memorial Hospital, Memphis, TN, United States
- 6Division of Pulmonary Diseases and Critical Care Medicine, Department of Medicine, University of North Carolina at Chapel Hill, Chapel Hill, NC, United States
- 7Clinic of Pneumology, Otto-von-Guerike University, Magdeburg, Germany
- 8Centre for Individualised Infection Medicine (CiiM), a Joint Initiative of the Helmholtz Centre for Infection Research (HZI) and Hannover Medical School (MHH), Hannover, Germany
- 9Department of Gastroenterology, Hepatology, Infectious Diseases and Endocrinology, Hannover Medical School (MHH), Hannover, Germany
- 10German Centre for Infection Research (DZIF), Partner Site Hannover-Braunschweig, Hannover, Germany
- 11TWINCORE Centre for Experimental and Clinical Infection Research, a Joint Venture Between the Helmholtz-Centre for Infection Research (HZI) and the Hannover Medical School (MHH), Hannover, Germany
- 12Center for Infectious Disease Diagnostics and Innovation, Department of Medicine, Duke University School of Medicine, Durham, NC, United States
- 13Department of Genetics, University of North Carolina at Chapel Hill, Chapel Hill, NC, United States
- 14Department of Microbiology and Immunology, University of North Carolina at Chapel Hill, Chapel Hill, NC, United States
Introduction: Influenza virus infections are a major global health problem. Influenza can result in mild/moderate disease or progress to more severe disease, leading to high morbidity and mortality. Severity is thought to be primarily driven by immunopathology, but predicting which individuals are at a higher risk of being hospitalized warrants investigation into host genetics and the molecular signatures of the host response during influenza infections.
Methods: Here, we performed transcriptome and genotype analysis in healthy controls and patients exhibiting mild/moderate or severe influenza (ICU patients). A unique aspect of our study was the genotyping of all participants, which allowed us to assign ethnicities based on genetic variation and assess whether the variation was correlated with expression levels.
Results: We identified 169 differentially expressed genes and related molecular pathways between patients in the ICU and those who were not in the ICU. The transcriptome/genotype association analysis identified 871 genes associated to a genetic variant and 39 genes distinct between African-Americans and Caucasians. We also investigated the effects of age and sex and found only a few discernible gene effects in our cohort.
Discussion: Together, our results highlight select risk factors that may contribute to an increased risk of ICU admission for influenza-infected patients. This should help to develop better diagnostic tools based on molecular signatures, in addition to a better understanding of the biological processes in the host response to influenza.
Introduction
Influenza virus infections represent a major global health problem. High morbidity and mortality are observed, with up to 500,000 deaths each year worldwide (1) and millions during past pandemics (2, 3). Influenza infections cause a range of disease phenotypes that range from asymptomatic to severe. Severity is influenced by a variety of viral and host factors, including influenza strain, age, sex, host genetics, and immune status (e.g. (4–8). Mortality in severe cases is primarily driven by a pathological immune response characterized by high levels of neutrophils, macrophages, and inflammatory cytokines (7, 9–13). In addition, ethnicity appears to affect the severity of influenza and SARS-CoV-2 infections in the US. During the 2009 H1N1 pandemic rates of hospitalization were highest in African-Americans, observed in a study in Wisconsin (14). During the SARS-CoV-2 pandemic, African-Americans exhibited higher severity than Caucasians (15, 16).
To advance the diagnosis and better predict the probability of progression to severe influenza and risk of ICU admission, it is pivotal to characterize host responses in-depth. While obtaining samples directly from pulmonary infection sites presents challenges, the analysis of blood samples has emerged as a practical means to comprehensively assess the molecular aspects of the disease across the entire system. In addition, exploring whole-blood gene expression provides a valuable avenue for developing clinical tests for point-of-care use, enabling a more personalized and effective approach to patient management. Several transcriptome studies on samples from influenza-infected patients have been performed, with most using gene expression arrays (17–33). Some of these studies distinguished mild/moderate infections from severe influenza disease. For example, Bermejo-Martin et al. (19) observed impaired expression of several genes participating in the T cell and B cell immune responses in patients with severe influenza (patients requiring mechanical ventilation) compared to patients with reduced severity. These included genes involved in antigen presentation, B cell development, T helper cell differentiation, CD28, granzyme B signaling, apoptosis, and protein ubiquitination. Patients with the poorest outcomes were characterized by proinflammatory hypercytokinemia. In contrast, Dunning at al. (30) found an inflammatory, activated neutrophil, and cell stress or cell death pattern in patients who needed mechanical ventilation. Similarly, Tang et al. (32) observed elevated gene expression related to neutrophil activation in severe patients as the most important difference when compared to patients with moderate disease.
Because some identified genes may be cohort-specific and potentially a consequence of age, sex, and/or ethnicity, we aimed to identify the differences in gene expression among influenza-infected patients by taking these factors into account. We collected blood samples from a large cohort of influenza-infected patients from different parts of the US and Germany with severe or mild/moderate disease and healthy controls. We performed RNAseq and genotyping analyses on these samples. To our knowledge, this is the only study so far that performed gene expression analysis and genotyping on the same patients. This approach allowed us to assign ethnicity based on genotyping rather than skin phenotype or questionnaires. In addition, we were able to examine correlations between genetic variation and gene expression changes. The results suggested that while many differentially expressed genes (DEGs) and related molecular pathways in influenza-infected individuals were distinct from healthy controls, much less distinguished those who required ICU admission from non-ICU patients and very few were different for age, sex, or ethnic background.
Materials and methods
Patient cohorts – sample collections
Patients with influenza infections and healthy controls were collected at five different sites (Data file 3, see Table 1 for availability of supplementary data and tables). Baptist Memorial Hospital (Memphis, TN USA): Patients with influenza virus infection confirmed by rapid-antigen assay/viral PCR performed on nasopharyngeal samples were recruited at admission to the hospital or from patients in the ICU at the time of consent (assigned as day 1). Blood samples from healthy controls were taken from hospital visitors and hospital patients with no respiratory infections. Otto-von-Gericke University (Magdeburg, Germany): Patients with influenza virus infection confirmed by rapid-antigen assay/viral PCR performed on nasopharyngeal samples were recruited at admission to the hospital. Blood samples were collected at admission (day 1). From ICU patients, samples were taken at the time of consent (the first sample taken was assigned as day 1). Blood samples from healthy controls were taken from hospital visitors, hospital patients with no respiratory or other infections or inflammatory disorders, and volunteers at the Helmholtz Centre for Infection Research, Braunschweig. Hannover Medical School (Hannover, Germany): Blood samples from healthy controls were taken from hospital patients without respiratory infections and volunteers at Hannover Medical School. University of North Carolina (Chapel Hill, NC USA): Patients with influenza virus infection confirmed by rapid-antigen assay or viral PCR performed on nasopharyngeal samples were recruited during hospital admission. Blood samples were collected at admission or from patients in the ICU at the time of consent (the first sample taken was assigned as day 1). Duke University (Durham, NC USA): Patients were enrolled by convenience sampling in the emergency department based on the presence of a suspected infection of less than 28 days duration. Participants were selected for inclusion in this study based on a diagnosis of influenza, which was based on PCR testing of nasopharyngeal swabs using the ResPlex V2.0 (Qiagen; Hilden, Germany), Respiratory Viral Panel (Luminex; Austin, TX), or Respiratory Pathogen Panel (Luminex; Austin, TX). Clinical adjudications were performed to confirm influenza was the microbiological etiology of illness, as previously described (28). See Data file 5 for information on collection sites. A few samples were taken from a repository (seasons 2008/2009 until 2013/2014, total of 5 samples, collected at the Otto-von-Gericke University Magdeburg, Germany). Most samples were collected during subsequent seasons 2014/2015 until 2020/2010 (total of 208 samples; Data file 4 for each season).
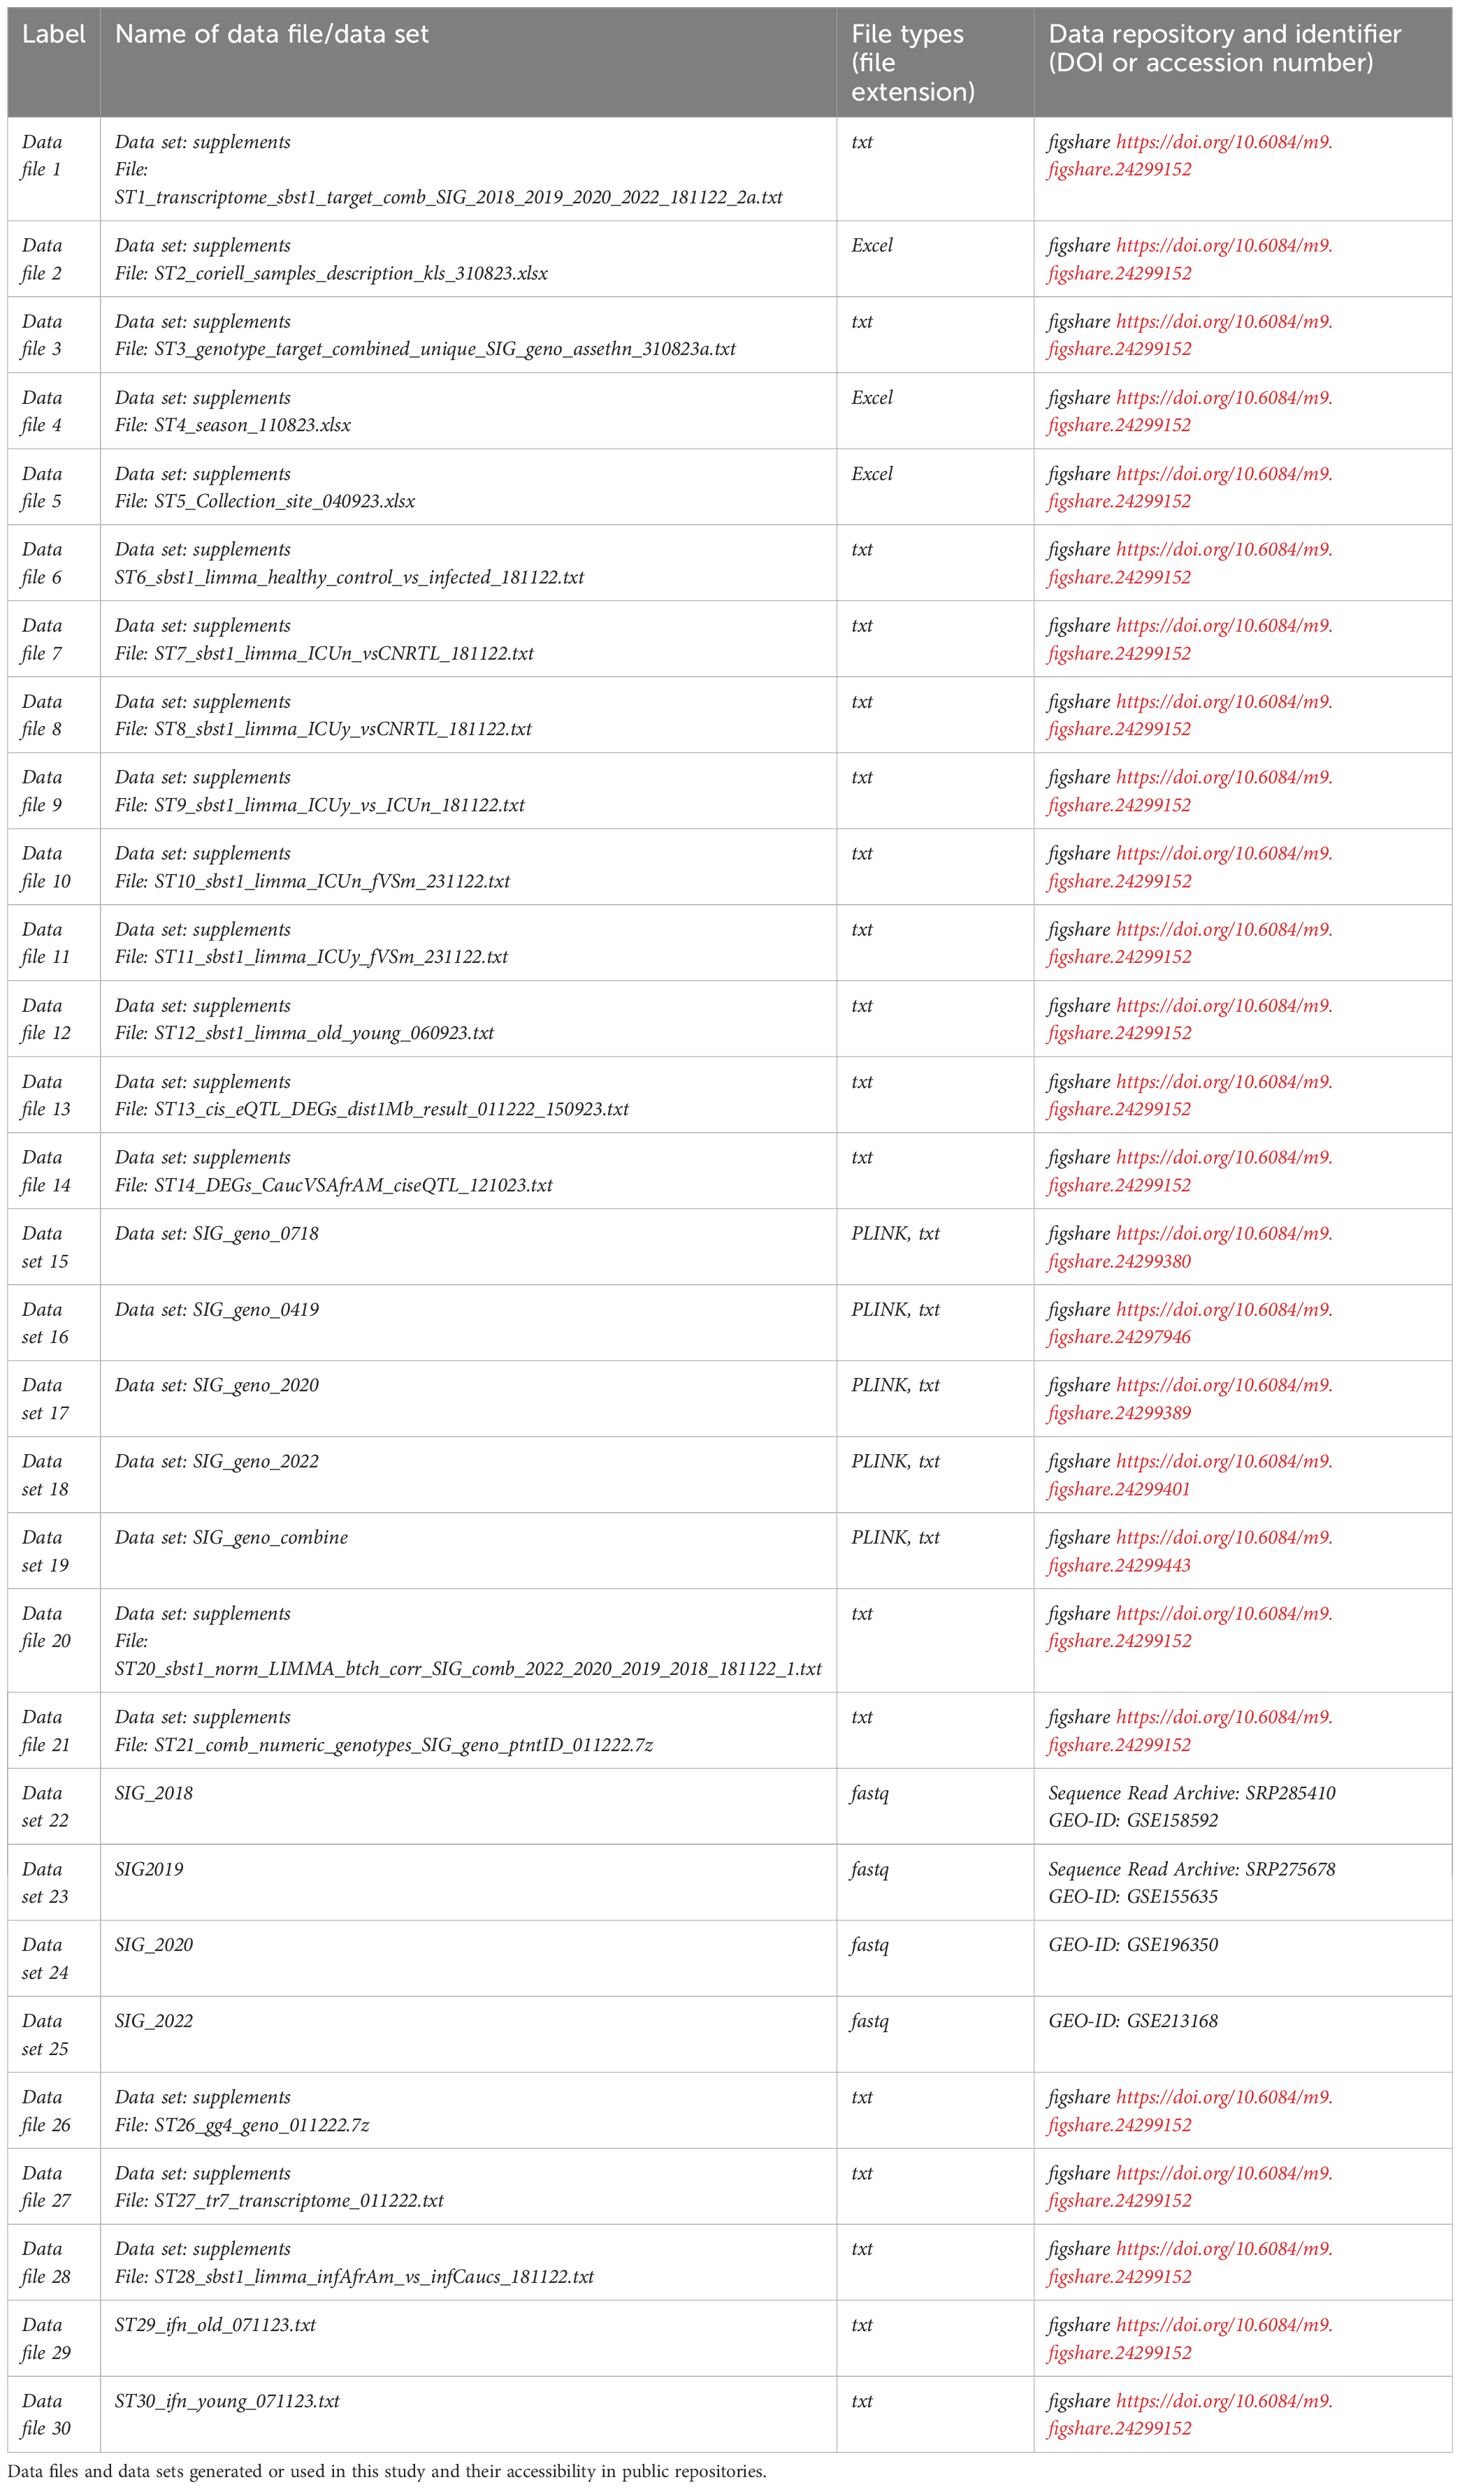
Table 1. Overview supplementary material at online repositories.
General aspects of sample analysis
The samples were analyzed in four different batches, although the preferred procedure would have been to process all samples in one batch. Analysis in different batches was mainly due to funding limitations. The grant support was provided in yearly parts, and therefore all samples from one season had to be analyzed within the corresponding fiscal year. Therefore, we provide the raw data from each batch, together with the combined data from all batches and the processed batch-corrected data files (see Table 1 for availability of supplementary data and tables). Some samples were analyzed in multiple batches. In addition, for some patients, samples at multiple time points were collected. The analysis of the data presented here was performed with a unique sample from each participant and only those collected on day 1, when patients presented at the hospital, or the first blood draw from ICU patients. Therefore, in addition to the analyses presented here, our data may also be used to study gene expression changes in a single patient over time.
Preparation of RNA and RNA sequencing
RNA was prepared from whole blood collected into PAXgene Blood RNA tubes (Qiagen) and then extracted as per the manufacturer’s protocol (QIAGEN PreAnalytiX – Blood RNA Kit). The quality and integrity of total RNA were controlled on an Agilent Technologies 2100 Bioanalyzer (Agilent Technologies; Waldbronn, Germany). Globin mRNA was depleted from total RNA using GLOBINclear Kit, human (ThermoFisher, Invitrogen). After globin mRNA depletion, the strand-specific RNA sequencing library was generated using the NEBNext Ultra II Directional RNA Library Prep Kit (New England Biolabs) according to the manufacturer’s protocols. The library was sequenced on Illumina HiSeq 4000 using the HiSeq 3000/4000 SBS Kit (300 cycles).
Bioinformatics of RNAseq data
Reads were quality checked with package FastQC (version 0.11.4) (34), then trimmed using Trimgalore (version 0.4.4, (35)) with default settings. Trimmed reads were mapped to human genome annotation GRCh38 (ENSMBL Homo_sapiens.GRCh38.91) using STAR (version 2.5.2b, (36)) with default settings. Mapped reads were counted using RsubRead (version 1.32.4, (37)). Analysis and visualization of expression data was performed using the R software package (version 4.2.1, (38) and RStudio (version 2022.07.2, (39)). Annotation of human genes was performed using package biomaRt (version 2.52.0, annotation GRCh38.p12, (40)). Raw counts were then normalized using DESeq2 (version 1.16.1, (41)). The four transcriptome batches were: SIG_2018 (Data set 22), SIG2019 (Data set 23), SIG_2020 (Data set 24), and SIG_2022 (Data set 25). The respective raw and normalized data are available at the GEO (GEO) public database (see Table 1 for availability of supplementary data and tables). The mean number of reads per batch were: 50 million, 45 million, 85 million, and 54 million, respectively. The normalized expression levels from all batches were then combined and batch-corrected using the Limma package (version 3.42.2; 42, 43)). The four batches contained overlapping samples analyzed in multiple batches. For subsequent analyses performed here, multiple samples from the same participant or reference were removed, and a unique dataset was generated (Data file 1 for sample description and Data file 20 for normalized batch corrected expression values, see Table 1 for availability of supplementary data and tables). For the identification of differentially expressed genes (DEGs), the Limma package (version 3.42.2, (42, 43)) was used. The model used for the identification of DEGs in Limma was: design <- model.matrix(~ 0 + group), including all groups in the model. DEGs were determined by contrasting the groups from the Limma result, based on an adjusted p-value of < 0.05 and exhibiting more than a 1.5-fold (log2 = 0.5849625) difference in expression levels. Multiple testing adjusted P values were calculated according to Benjamini and Hochberg (44). Volcano plots were generated with the package EnhancedVolcano, version 1.8.0 (45). VENN diagrams were generated with the function vennPlot (http://faculty.ucr.edu/~tgirke/Documents/R_BioCond/My_R_Scripts/overLapper.R). Functional analysis of DEGs was performed using the R software package clusterProfiler (version v3.14.3; (46). For beeswarm graphs of expression levels, package beeswarm (47) (version 0.2.3.) was used.
Preparation of DNA for genotyping
EDTA blood samples were collected from participants, cells were centrifuged, and supernatants and pellets were stored at -80 ° C. DNA was prepared from frozen cell pellets using the QIAamp DNA Blood Midi kit (Qiagen) according to the manufacturer’s protocol. For identification of ethnicity, DNA samples from the Coriell Institute HAPMAP collection were included as references. The biospecimens for the reference samples were donated by different populations (Population Descriptors, see Data file 2, see Table 1 for availability of supplementary data and tables) and obtained from the NHGRI Sample Repository for Human Genetic Research at the Coriell Institute for Medical Research (Repository IDs see Data file 2, see Table 1 for availability of supplementary data and tables). Here, we refer to the affiliation of a participant to their population as ethnicity (alternatively, race or genetic descent are used by others).
Genotyping of DNA by SNP microarrays
Per sample, 2.5 µg of DNA was prepared for microarray analysis on Illumina Global Screening Array-24 v2.0 (Illumina), and DNA array analysis was performed according to the manufacturer’s protocol (Illumina, Infinium HTS Assay Manual Workflow) at the Johns Hopkins University School of Medicine, Genetic Resources Core Facility (GRCF). After QC, signals showing obvious assay failures on the array were removed. SNP calling was done with GenomeStudio version 2011.1, Genotyping Module version 1.9.4, and GenTrain Version 1.0. In total, 665,608 SNPs were probed on the genotyping arrays. The four genotyping batches were: SIG_geno_0718 (Data set 15), SIG_geno_0419 (Data set 16), SIG_geno_2020 (Data set 17), and SIG_geno_2022 (Data set 18). These datasets contain internal duplicates, duplicates between batches, and reference genomes. Several samples were analyzed in multiple batches, these duplicates were removed and a unique sample dataset was generated (Data file 3 for description of the samples). The corresponding data are available as PLINK files (see Table 1 for availability of supplementary data and tables).
Bioinformatic analysis of genotype data
The combined genotype (SIG geno combined) data from all batches, a total of 365 samples (including all duplicates), were then analyzed by PLINK ( (48), see Data set 19 for PLINK and subjects). The respective PLINK file for the combined dataset (SIG_geno_combine) is provided in Data set 19 (see Table 1 for availability of supplementary data and tables). Participant’s ethnicity was identified by multidimensional scaling (MDS) with reference to samples from the Coriell Institute HAPMAP collection (see results below). Numeric genotype calls were extracted from the four individual GenomeStudio batch files using the software GenomeStudio (Version 2.0) (49) and then combined into a single dataset. Subsequently, multiple samples from the same participant or the reference samples were removed, and a unique dataset was generated (Data file 21 for the genotype data, Data file 3 for a description of this sample set, see Table 1 for availability of supplementary data and tables). Visualization and analyses of PLINK and GenomeStudio output files were performed using the R software package (50).
QTL analysis
Overlapping datasets from the same participants for genotypes (numeric allele call data) and transcriptomes were generated. The corresponding genotype table is provided in Data file 26, and the corresponding transcriptome table is in Data file 27 (see Table 1 for availability of supplementary data and tables). QTL analysis was then performed using the R package MatrixEQTL (version 2.3) (51). Manhattan plots were generated using package qqman_0.1.8 (version 0.1.8; (52).
Statistics
For the comparison of two groups, a two-way t-test (numeric data) or chi-square test (categorical data) was used and performed in R. P < 0.05 was considered significant. Multiple testing adjusted P values were calculated according to Benjamini and Hochberg (44).
Availability of data and materials
All data are available in public databases. Raw data for RNAseq analyses are available in the GEO expression database (53–55): IDs: SIG_2018: GSE158592; SIG2019: GSE155635; SIG_2020: GSE196350; SIG_2022: GSE213168. Genotype raw data files are available in PLINK format at the Figshare public database (56), see Table 1 for availability of supplementary data and tables. All other data files are available in Figshare (see Table 1 for availability of supplementary data and tables).
Results
Cohort demographics
An overview of the demographics of patients and the different groups can be found in Table 2. The total number of participants was 208, 81 were healthy controls and 127 were influenza-infected patients, of which 23 were admitted to the ICU (Table 2). The genotyping analysis (see below) showed that the samples were primarily Caucasian (153) followed by African-American (people of African ancestry in the US, 41), Mexican-American-Indian (4), Asian (2), and admixed (2) (Table 2). The number of females and males was significantly different between infected and healthy controls (Table 2), but it was not significant between females and males when stratified by ICU status. The median age was significantly different between infected and control samples, it was not significantly different between non-ICU and ICU samples (Table 2). For details on each participant, see Data file 1.
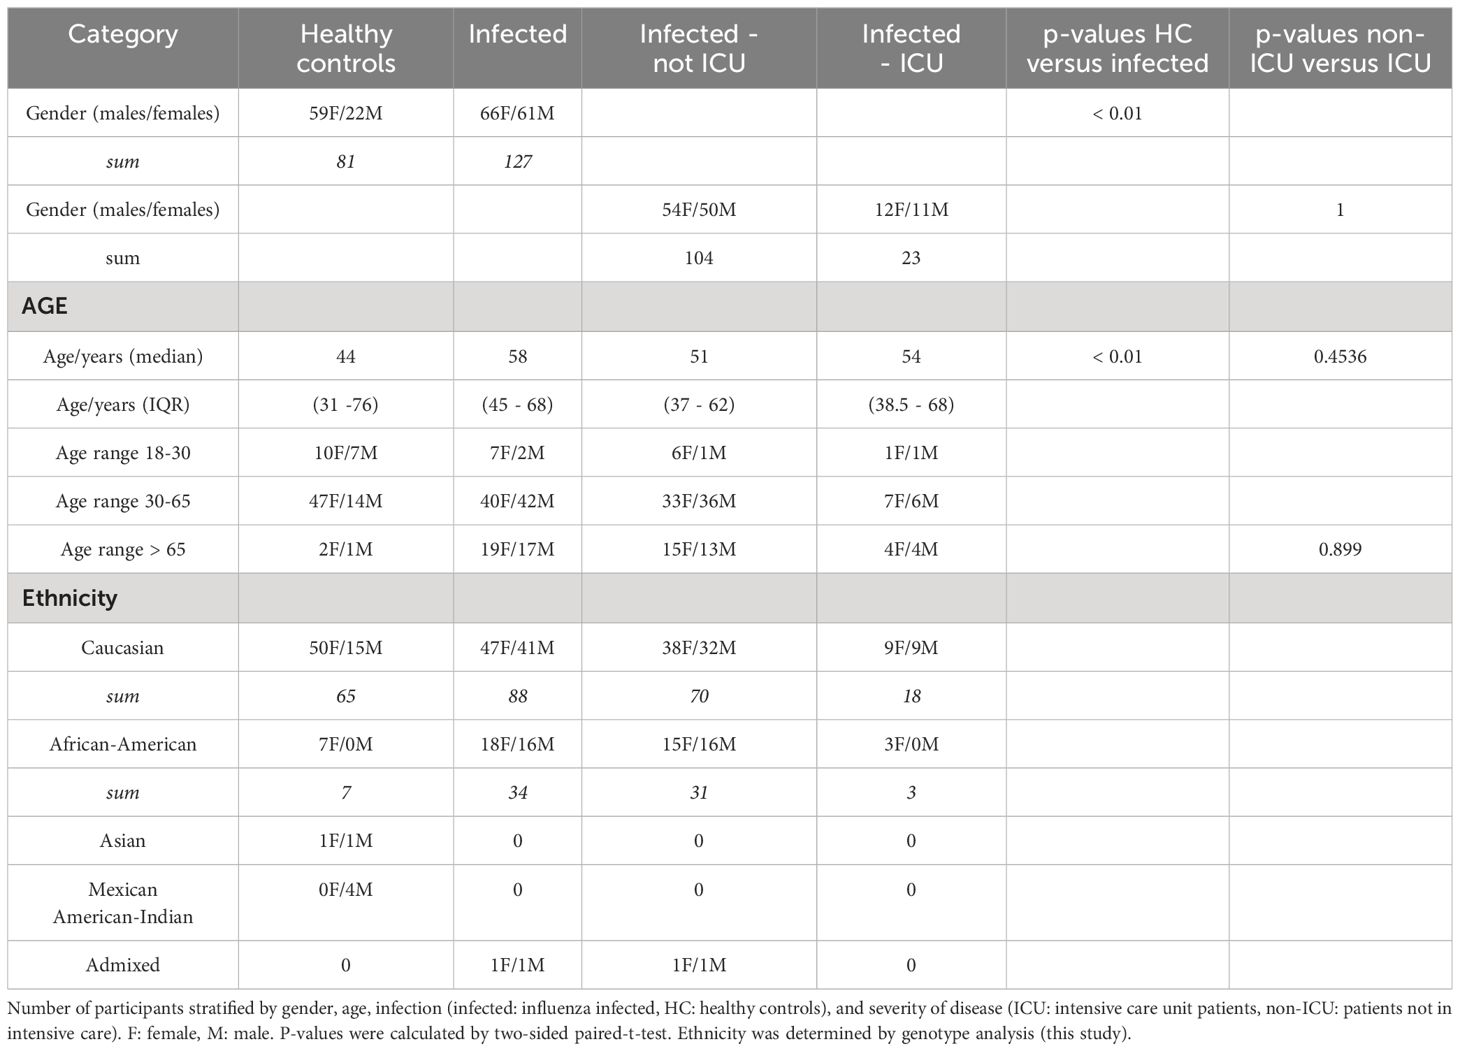
Table 2. Demographics of cohorts.
Transcriptome analysis of infected patients versus healthy controls
RNA was isolated from the blood cells of 127 influenza-infected patients and 81 healthy controls and submitted to RNA sequencing. The samples that were used here for the analyses below are described in detail in Data file 1 and their normalized expression values (unique per sample and patient, batch corrected) in Data file 20. Principal component analysis (PCA) demonstrated good separation between infected patients and healthy controls (Figure 1). Analysis of differentially expressed genes (DEGs) showed 701 upregulated and 367 downregulated genes when contrasting all infected patients versus healthy controls (Figure 2A; complete list of DEGs in Data file 6). The top 5 up- and down-regulated DEGs from this comparison and their known functions are listed in Table 3. Pathway analysis for DEGs between infected patients and healthy controls revealed that the top up-regulated genes were ‘Defense response to bacterium’, ‘Regulation of viral process’, ‘Response to virus’, ‘Response to biotic stimulus’, ‘Nuclear division’ (Figure 2B) and the top down-regulated genes were ‘B cell proliferation’, ‘Adaptive immune response’, ‘Lymphocyte differentiation’, and ‘Axonogenesis’ (Figure 2C).
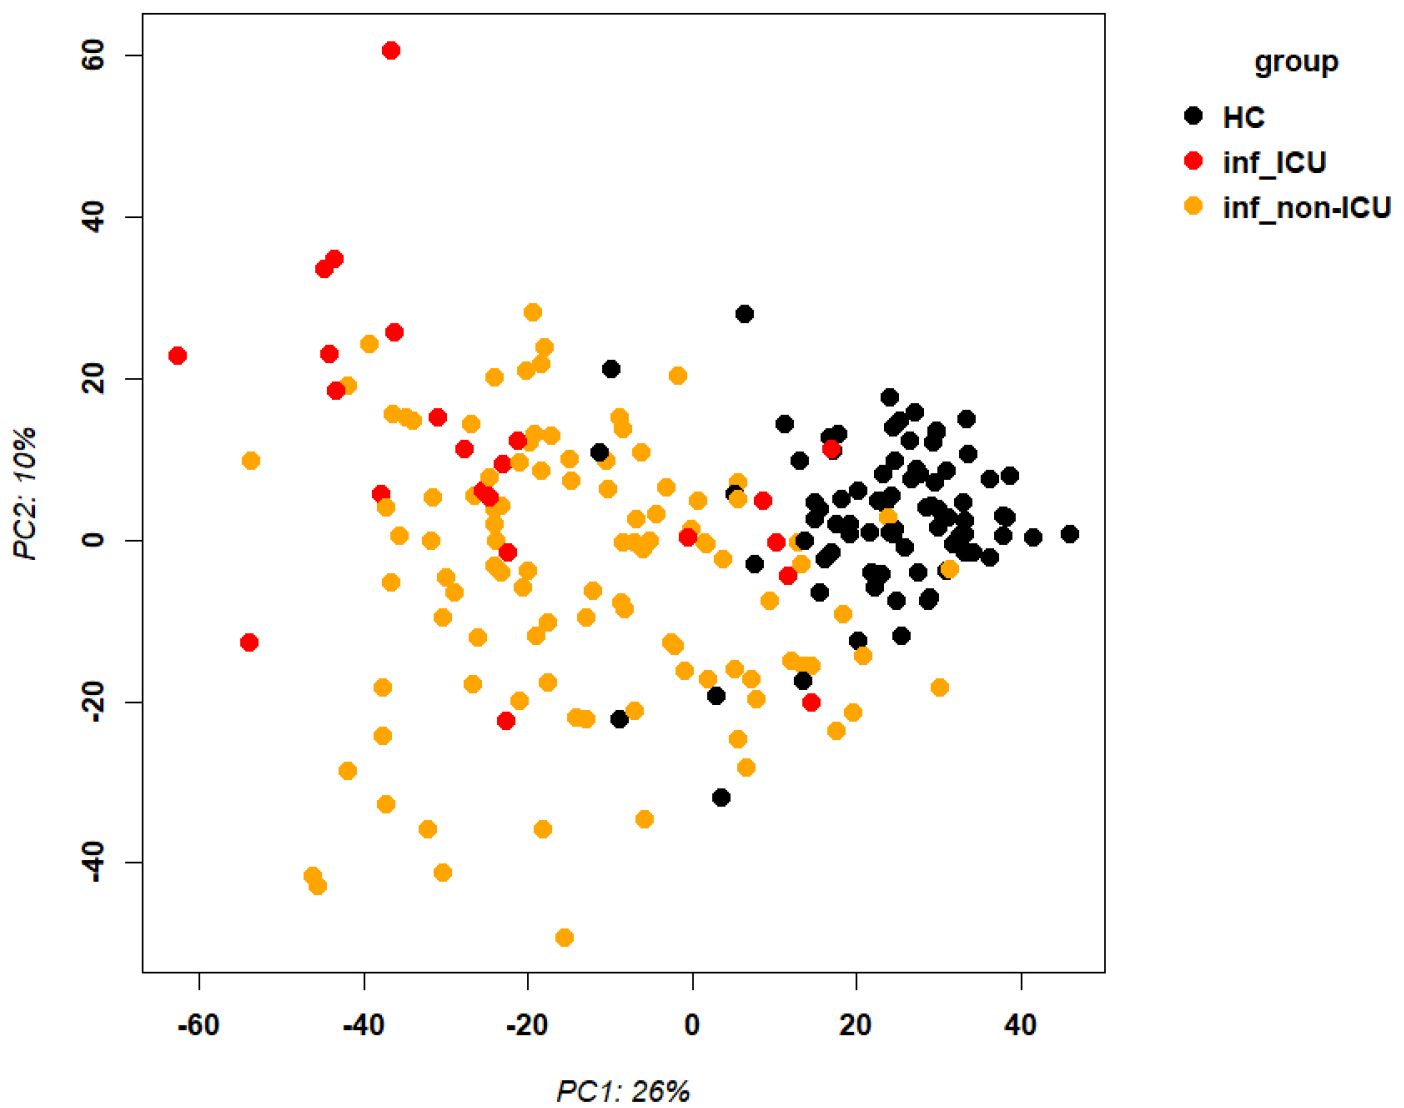
Figure 1. Principal component analysis of transcriptome expression. Principal component analysis plot for gene expression values of infected patients and healthy controls. Abbreviations: HC: healthy controls; inf_ICU infected patients at ICU; inf_non-ICU: infected patients not at ICU.
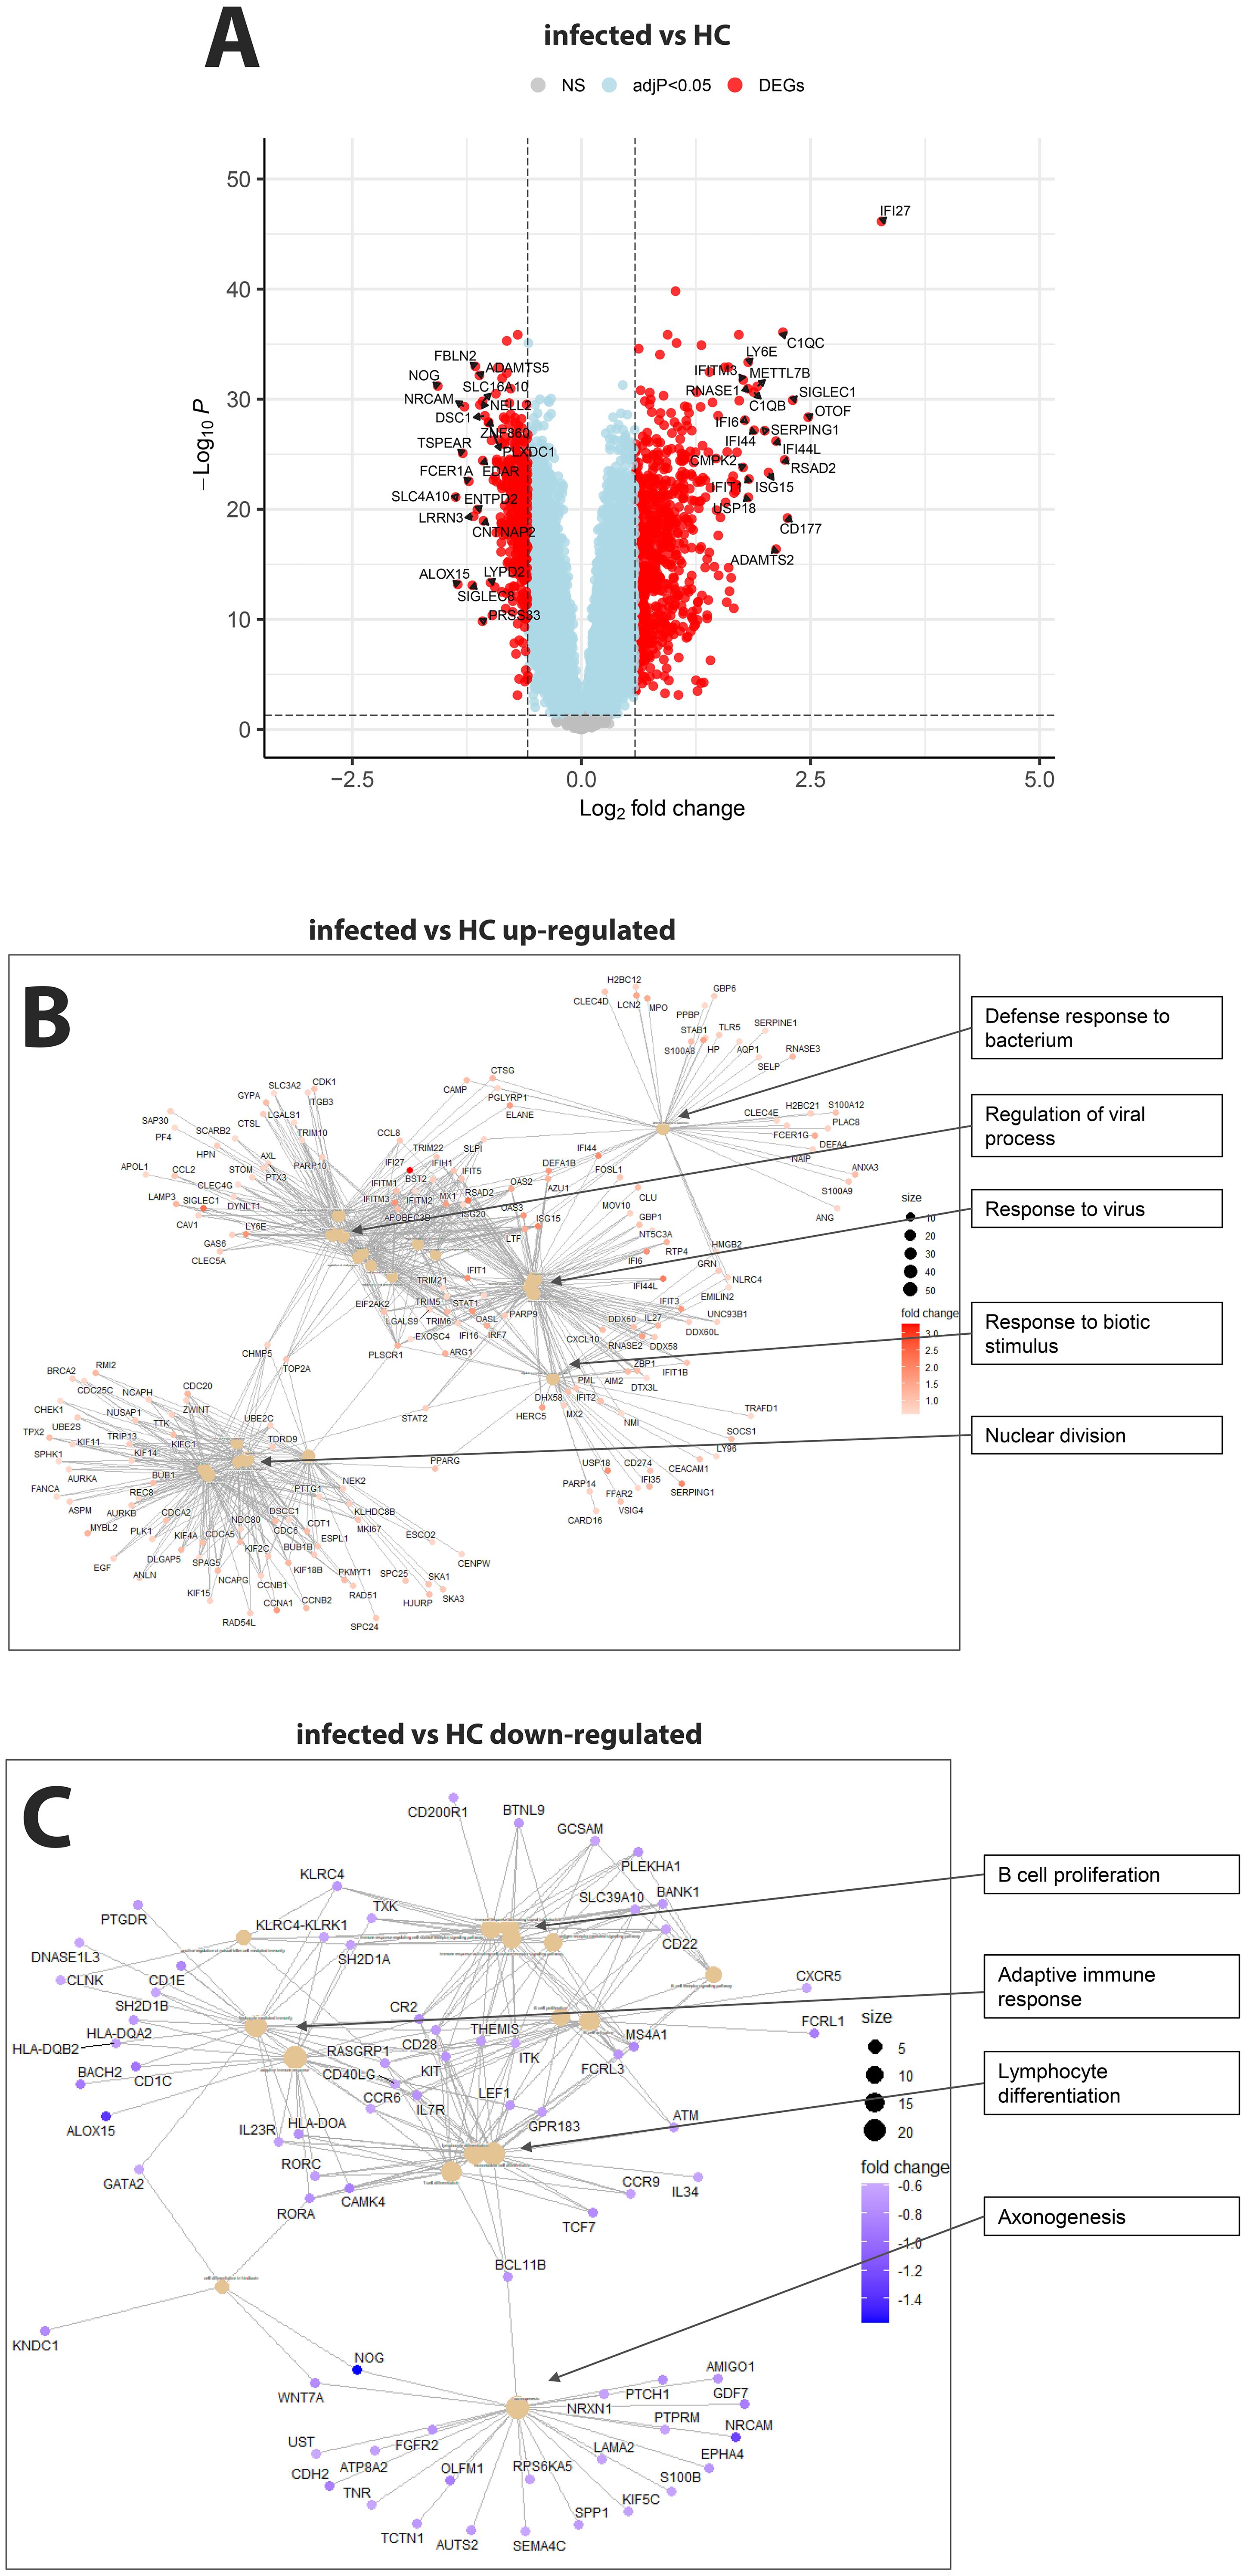
Figure 2. Comparison of infected patients versus healthy controls. (A) Volcano plot of infected patients versus healthy controls. y-axis: -log10 BH multiple testing adjusted p-values, x-axis: log2 fold change. DEGs are colored red, and the top 20 up- and down-regulated (by log-fold change) DEGs are labeled. Blue: not significant genes with an adjusted p-value < 0.05. Yellow: not significant genes with an absolute fold change of 1.5 (log2 = 0.5849625). Grey: NS, not significant. (B) Functional analysis using GO term enrichment for the up-regulated DEGs from the contrast of infected versus healthy controls. (C) Functional analysis using GO term enrichment for the down-regulated DEGs from the contrast of infected versus healthy controls.
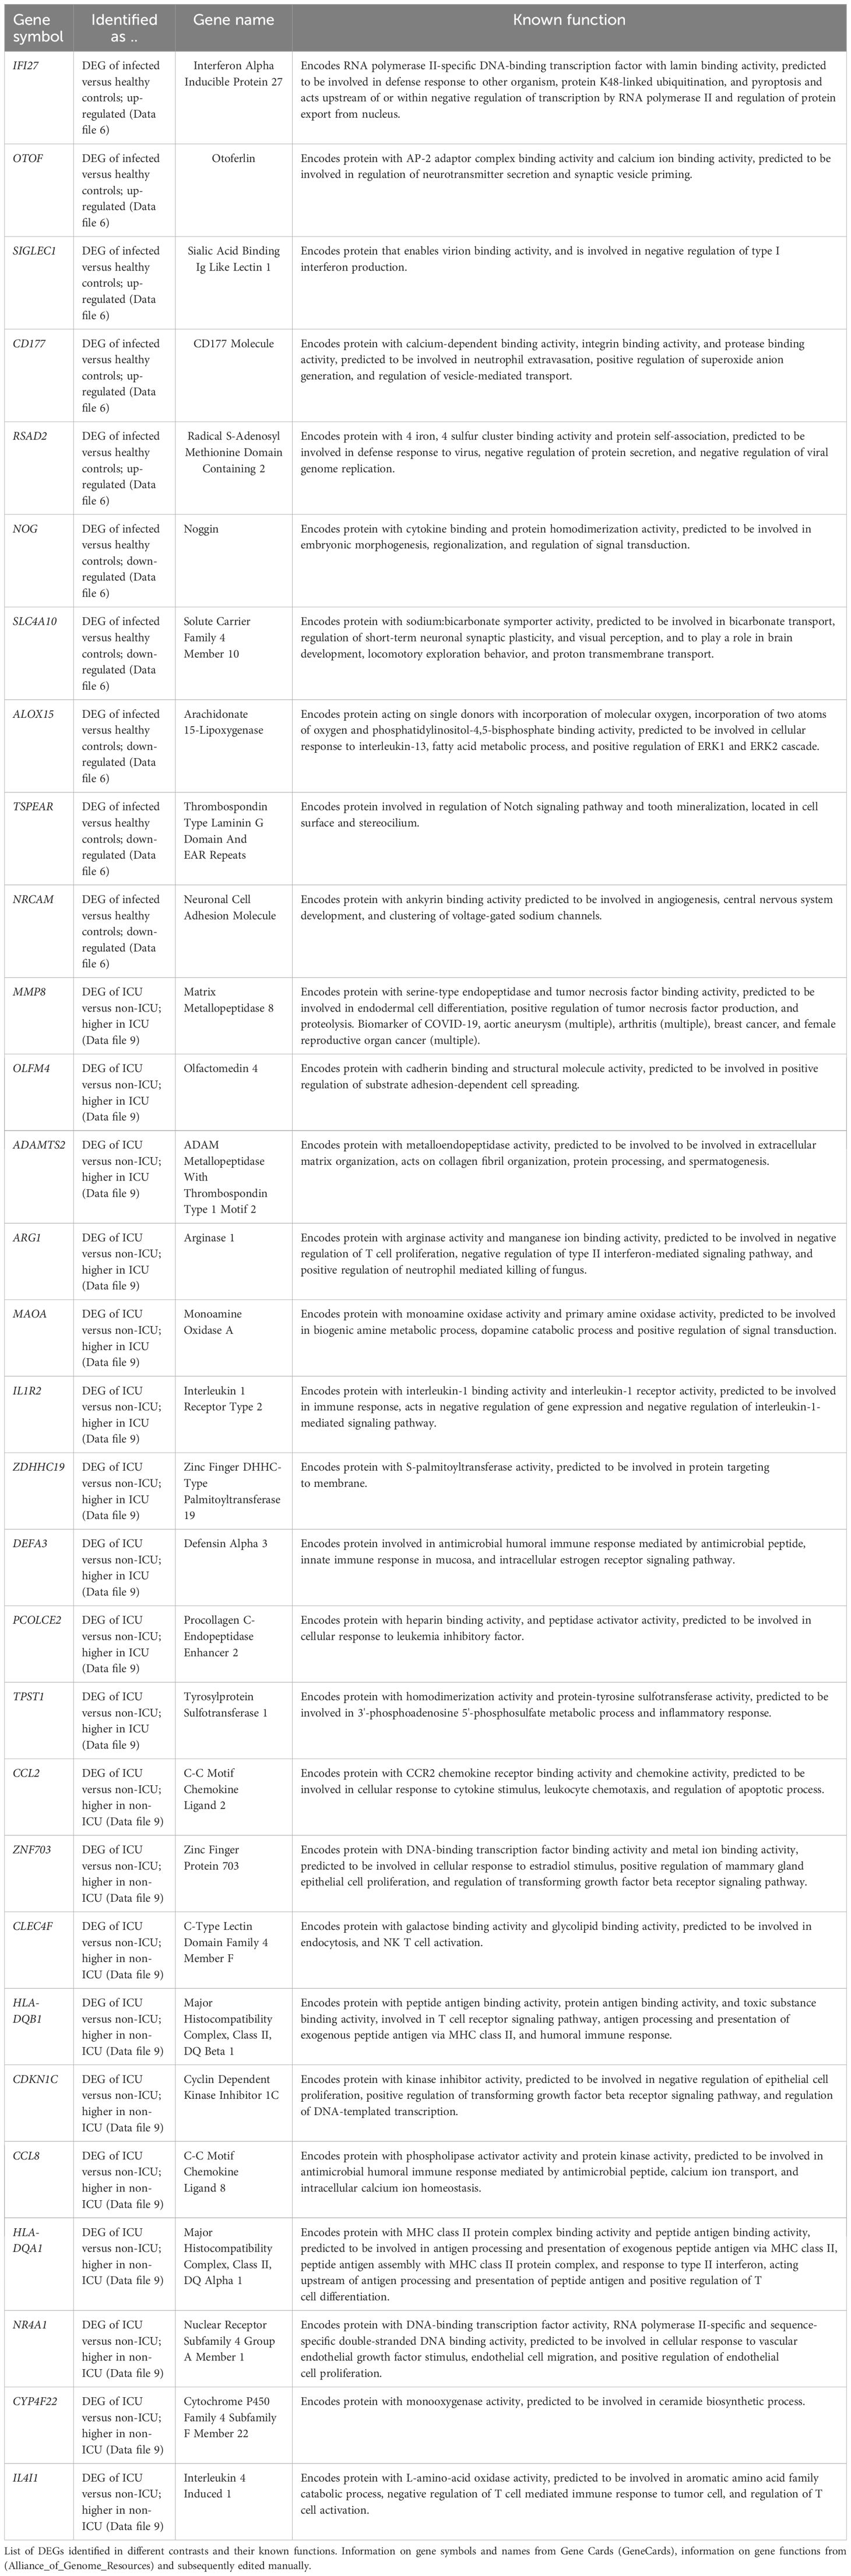
Table 3. DEGs and their known functions.
Transcriptomes analysis of infected ICU versus infected non-ICU patients and to healthy controls
Comparing non-ICU infected patients with health controls revealed 659 upregulated and 317 downregulated DEGs (Figure 3A) while ICU patients showed 1071 upregulated and 818 down-regulated DEGs when compared to healthy controls (Figure 3B). For the contrast of ICU patients and non-ICU patients, there were 132 up-regulated and 37 down-regulated DEGs (Figure 3C; complete lists of DEGs in Data files 7–9). Table 3 lists, as examples, the top 10 DEGs from this comparison and their known functions. Of note, there was significant overlap between these groups with 857 DEGS shared between ICU and non-ICU patients when compared to healthy controls, and 75 DEGs shared between all contrasts (Figure 3D). For the DEGs of non-ICU patients compared to healthy controls, pathways for ‘Defense response to bacterium’, ‘Regulation of viral process’, ‘Response to virus’, ‘Response to biotic stimulus’, and ‘Nuclear division’ were up-regulated genes (Figure 4A), and no pathway associations were detected for the down-regulated genes. For DEGs of ICU patients compared to healthy controls, pathways for ‘Chromosome segregation’, ‘Regulation of viral genome’, ‘Nuclear division’, ‘Response to LPS’, ‘Response to bacterium’, ‘Regulation of inflammatory response’ were up-regulated genes (Figure 4B) and ‘Activation of immune response’, ‘Lymphocyte differentiation’, ‘Adaptive immune response’, and ‘Leukocyte cell-cell adhesion’ were down-regulated genes (Figure 4C). The direct comparison of ICU versus non-ICU revealed pathways for ‘Defense response & neutrophil-mediated toxicity’, ‘Antimicrobial humoral response’, ‘Regulation of inflammatory response’, ‘Negative regulation of cytokine production’ that were higher in ICU patients (Figure 5A) and pathways for ‘IFNG production’, ‘Response to chemokine’, ‘Response to bacterium’, and ‘Response to LPS’ that were higher in non-ICU patients (Figure 5B).
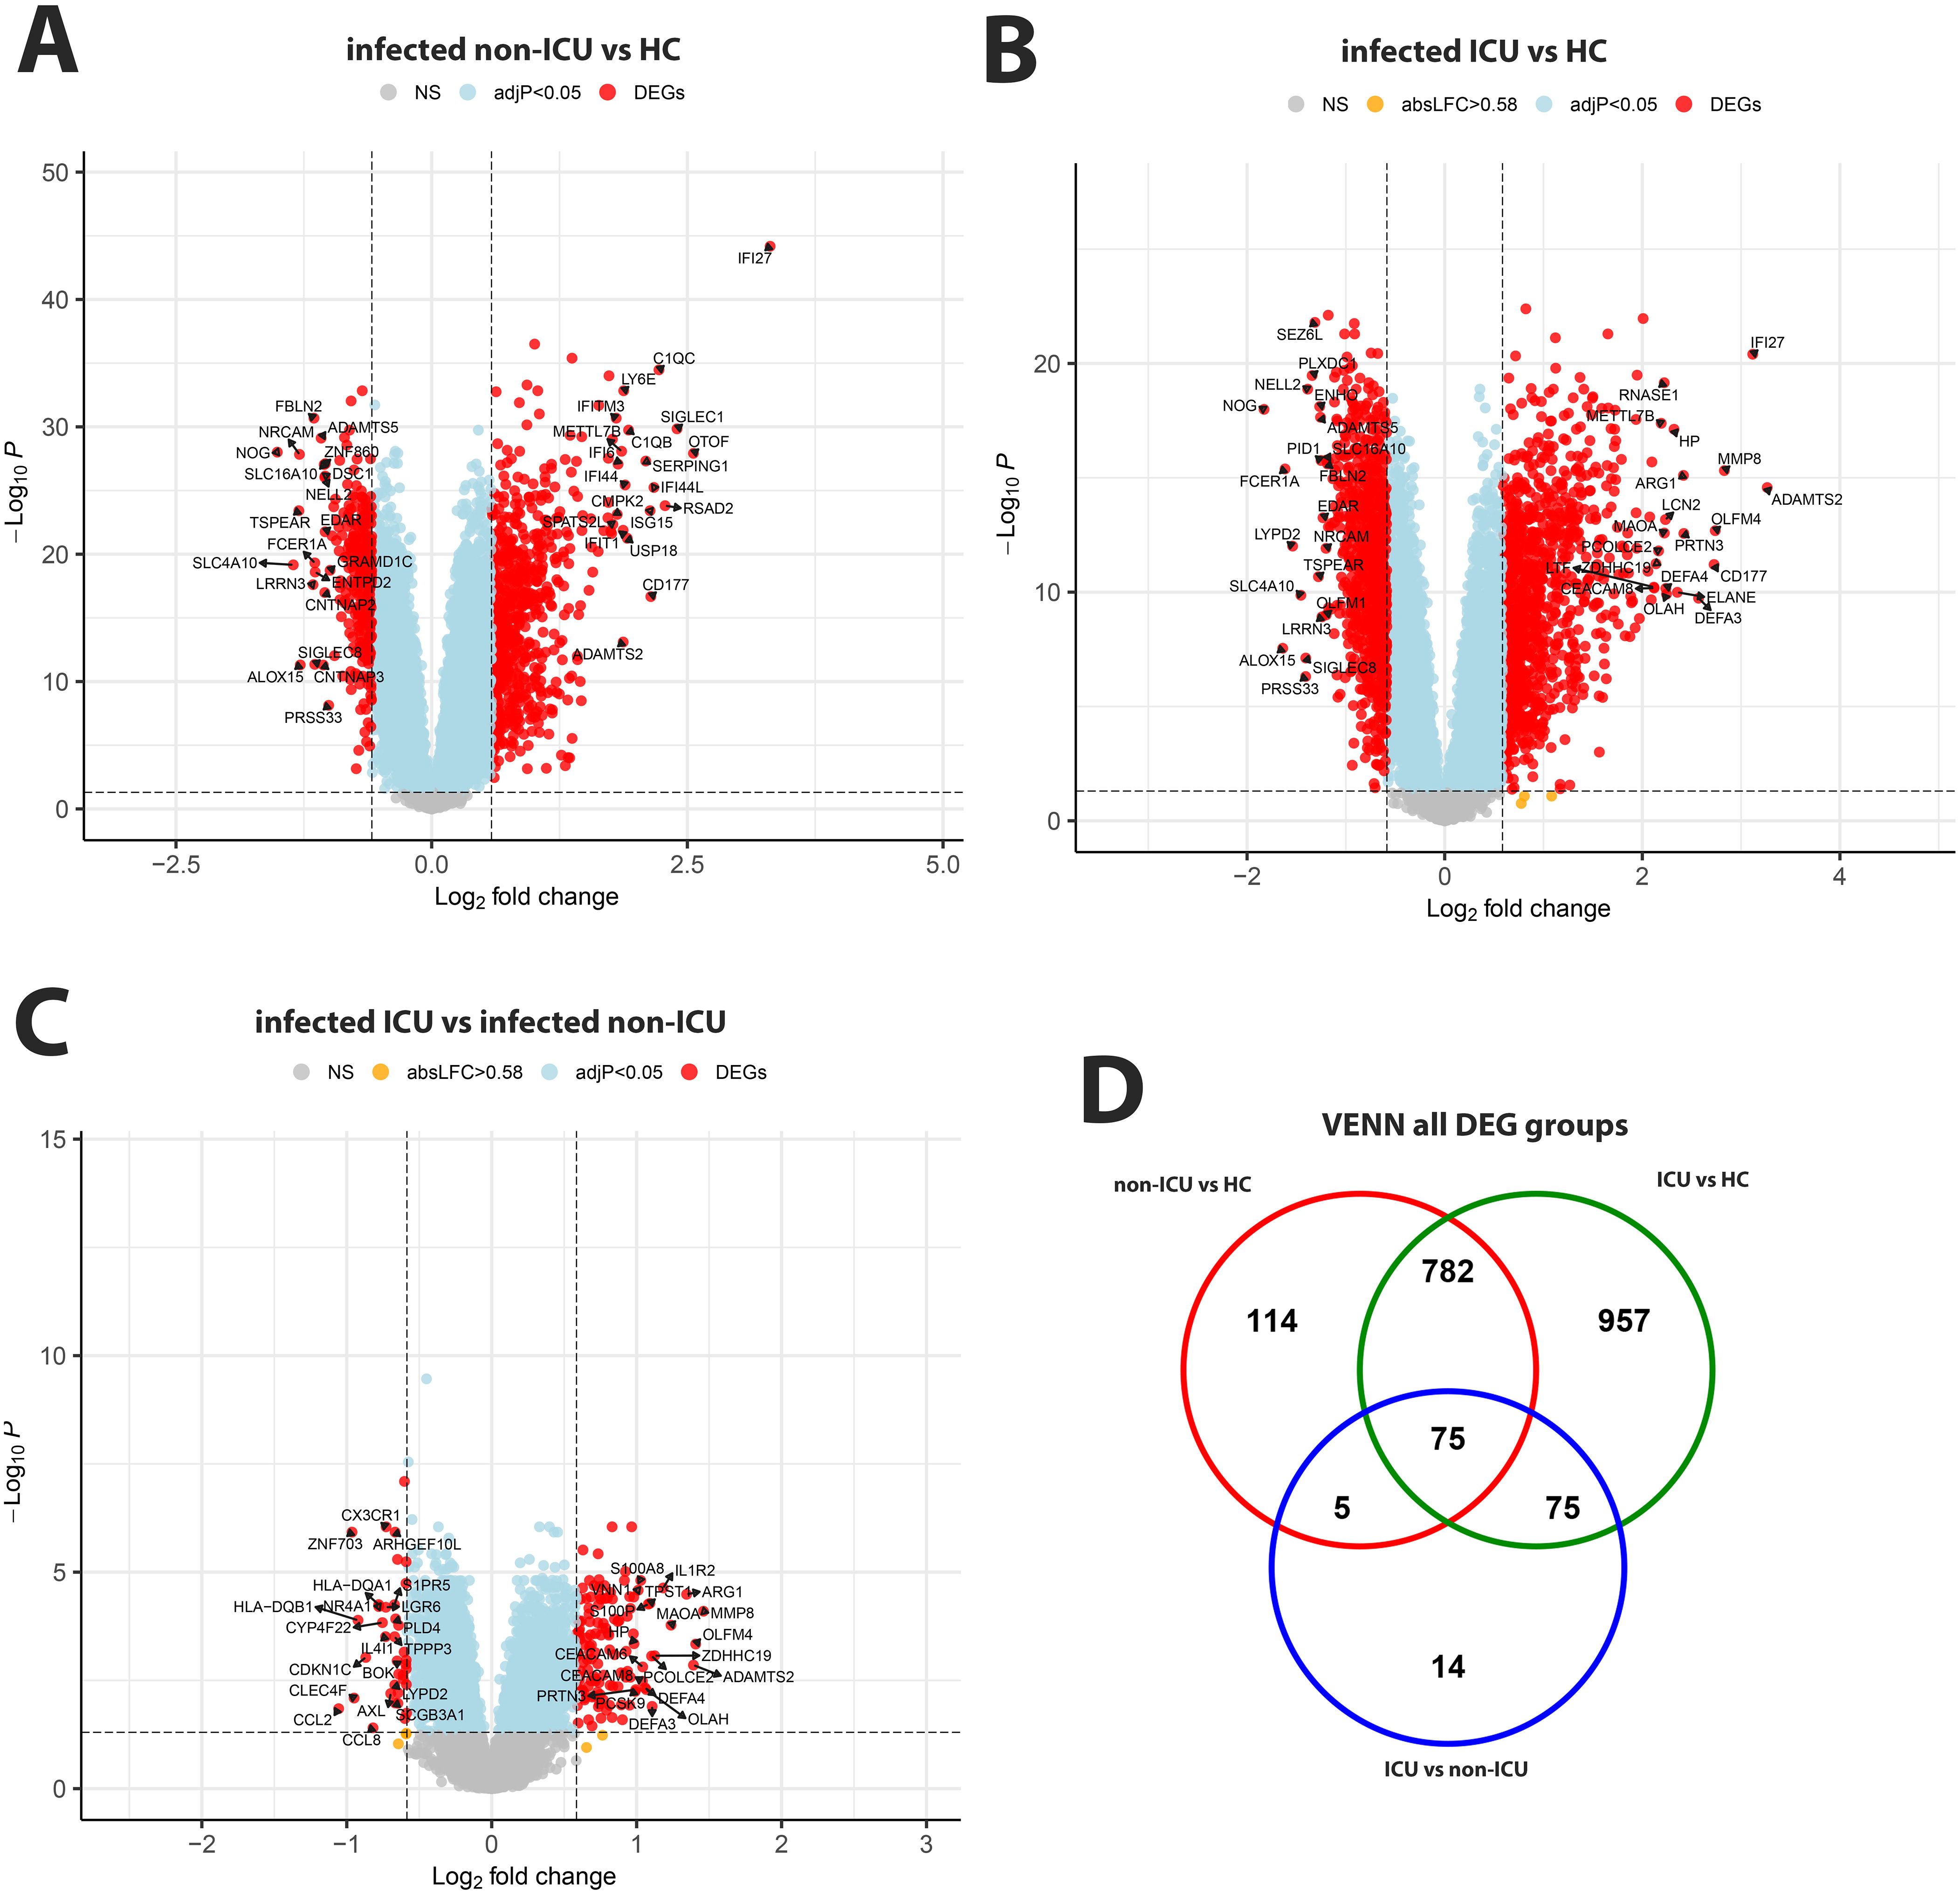
Figure 3. Comparison of infected non-ICU patients and ICU patients versus healthy controls, ICU versus non-ICU patients and corresponding VENN diagram. (A) Volcano plot of infected non-ICU patients versus healthy controls. (B) Volcano plot of infected ICU patients versus healthy controls. (C) Volcano plot of infected ICU patients versus infected non-ICU patients. See Figure 2 for more details on volcano plots. (D) Venn diagram illustrating the overlaps between the DEGs from contrasts of ICU and non-ICU patients versus healthy controls and between ICU and non-ICU patients. A total of 2,022 DEGs were identified in all three groups (all genes combined), and 75 DEGs were commonly shared between the three groups (central overlap.
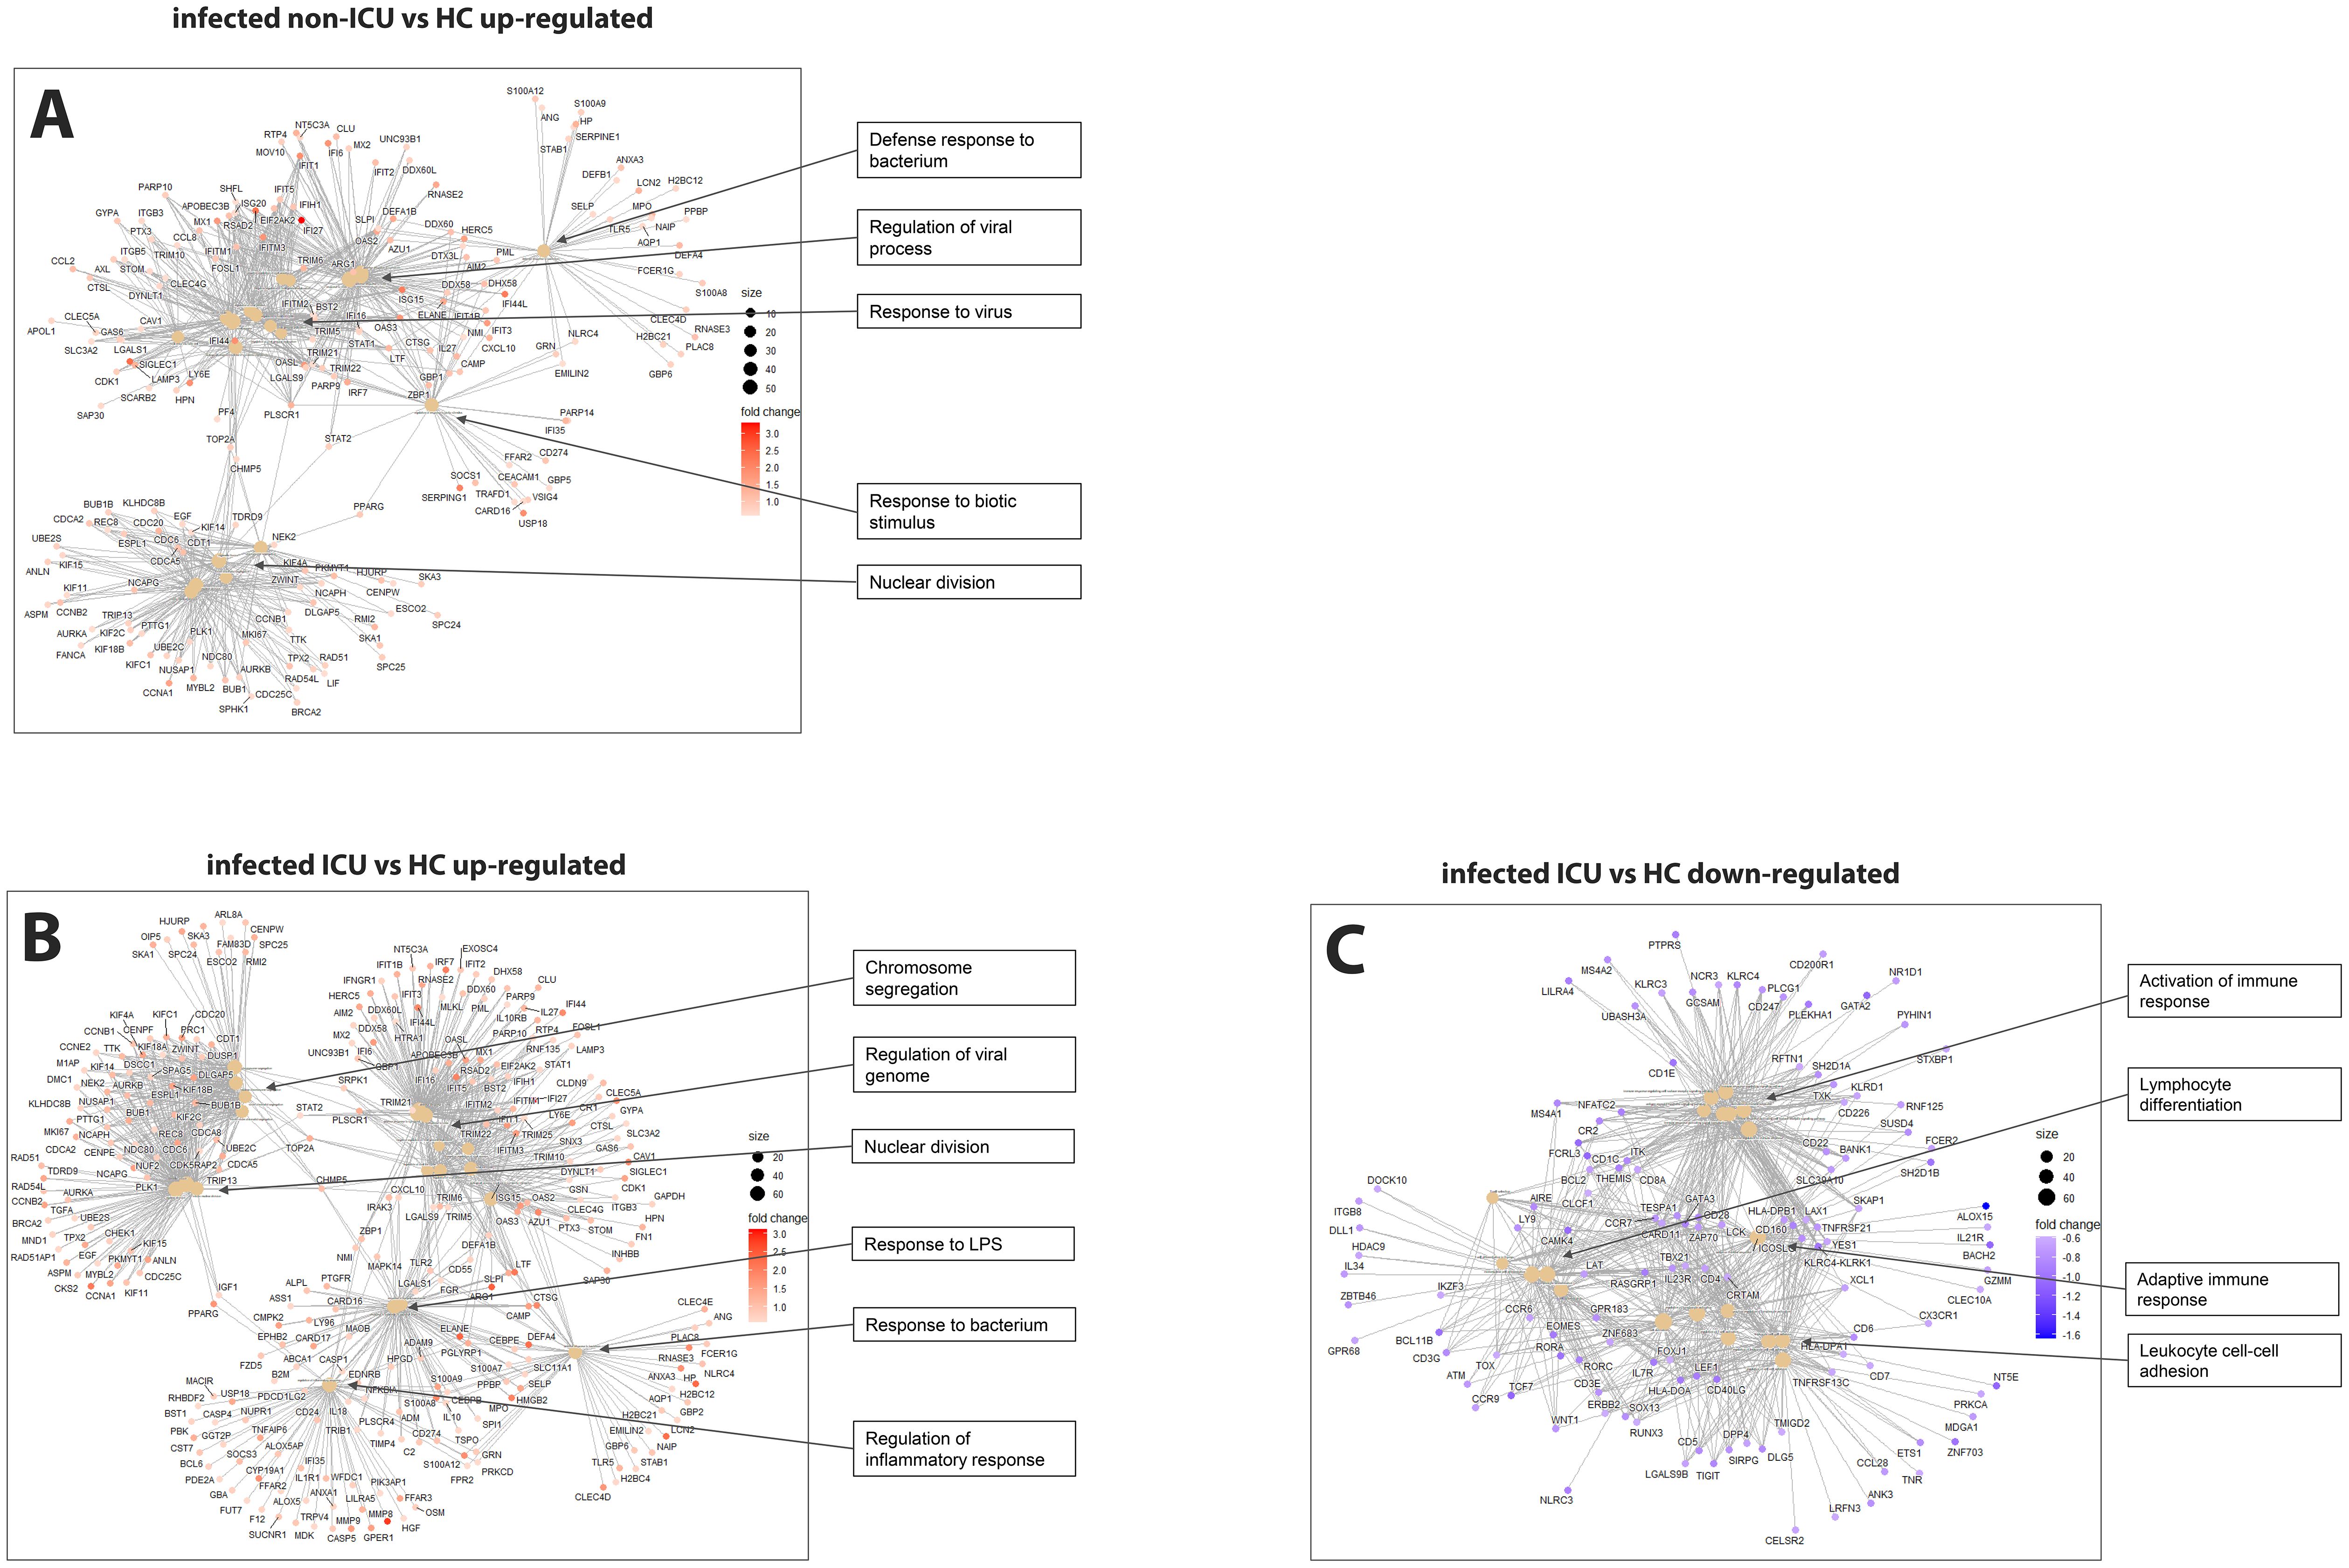
Figure 4. Pathway analysis of infected ICU and non-ICU patients versus healthy controls. (A) Functional analysis using GO term enrichment for the up-regulated DEGs from the contrast of infected non-ICU patients versus healthy controls. (B) Functional pathway analysis using GO term enrichment for the up-regulated DEGs from the contrast of infected ICU patients versus healthy controls. (C) Functional pathway analysis using GO term enrichment for the down-regulated DEGs from the contrast of infected ICU patients versus healthy controls.
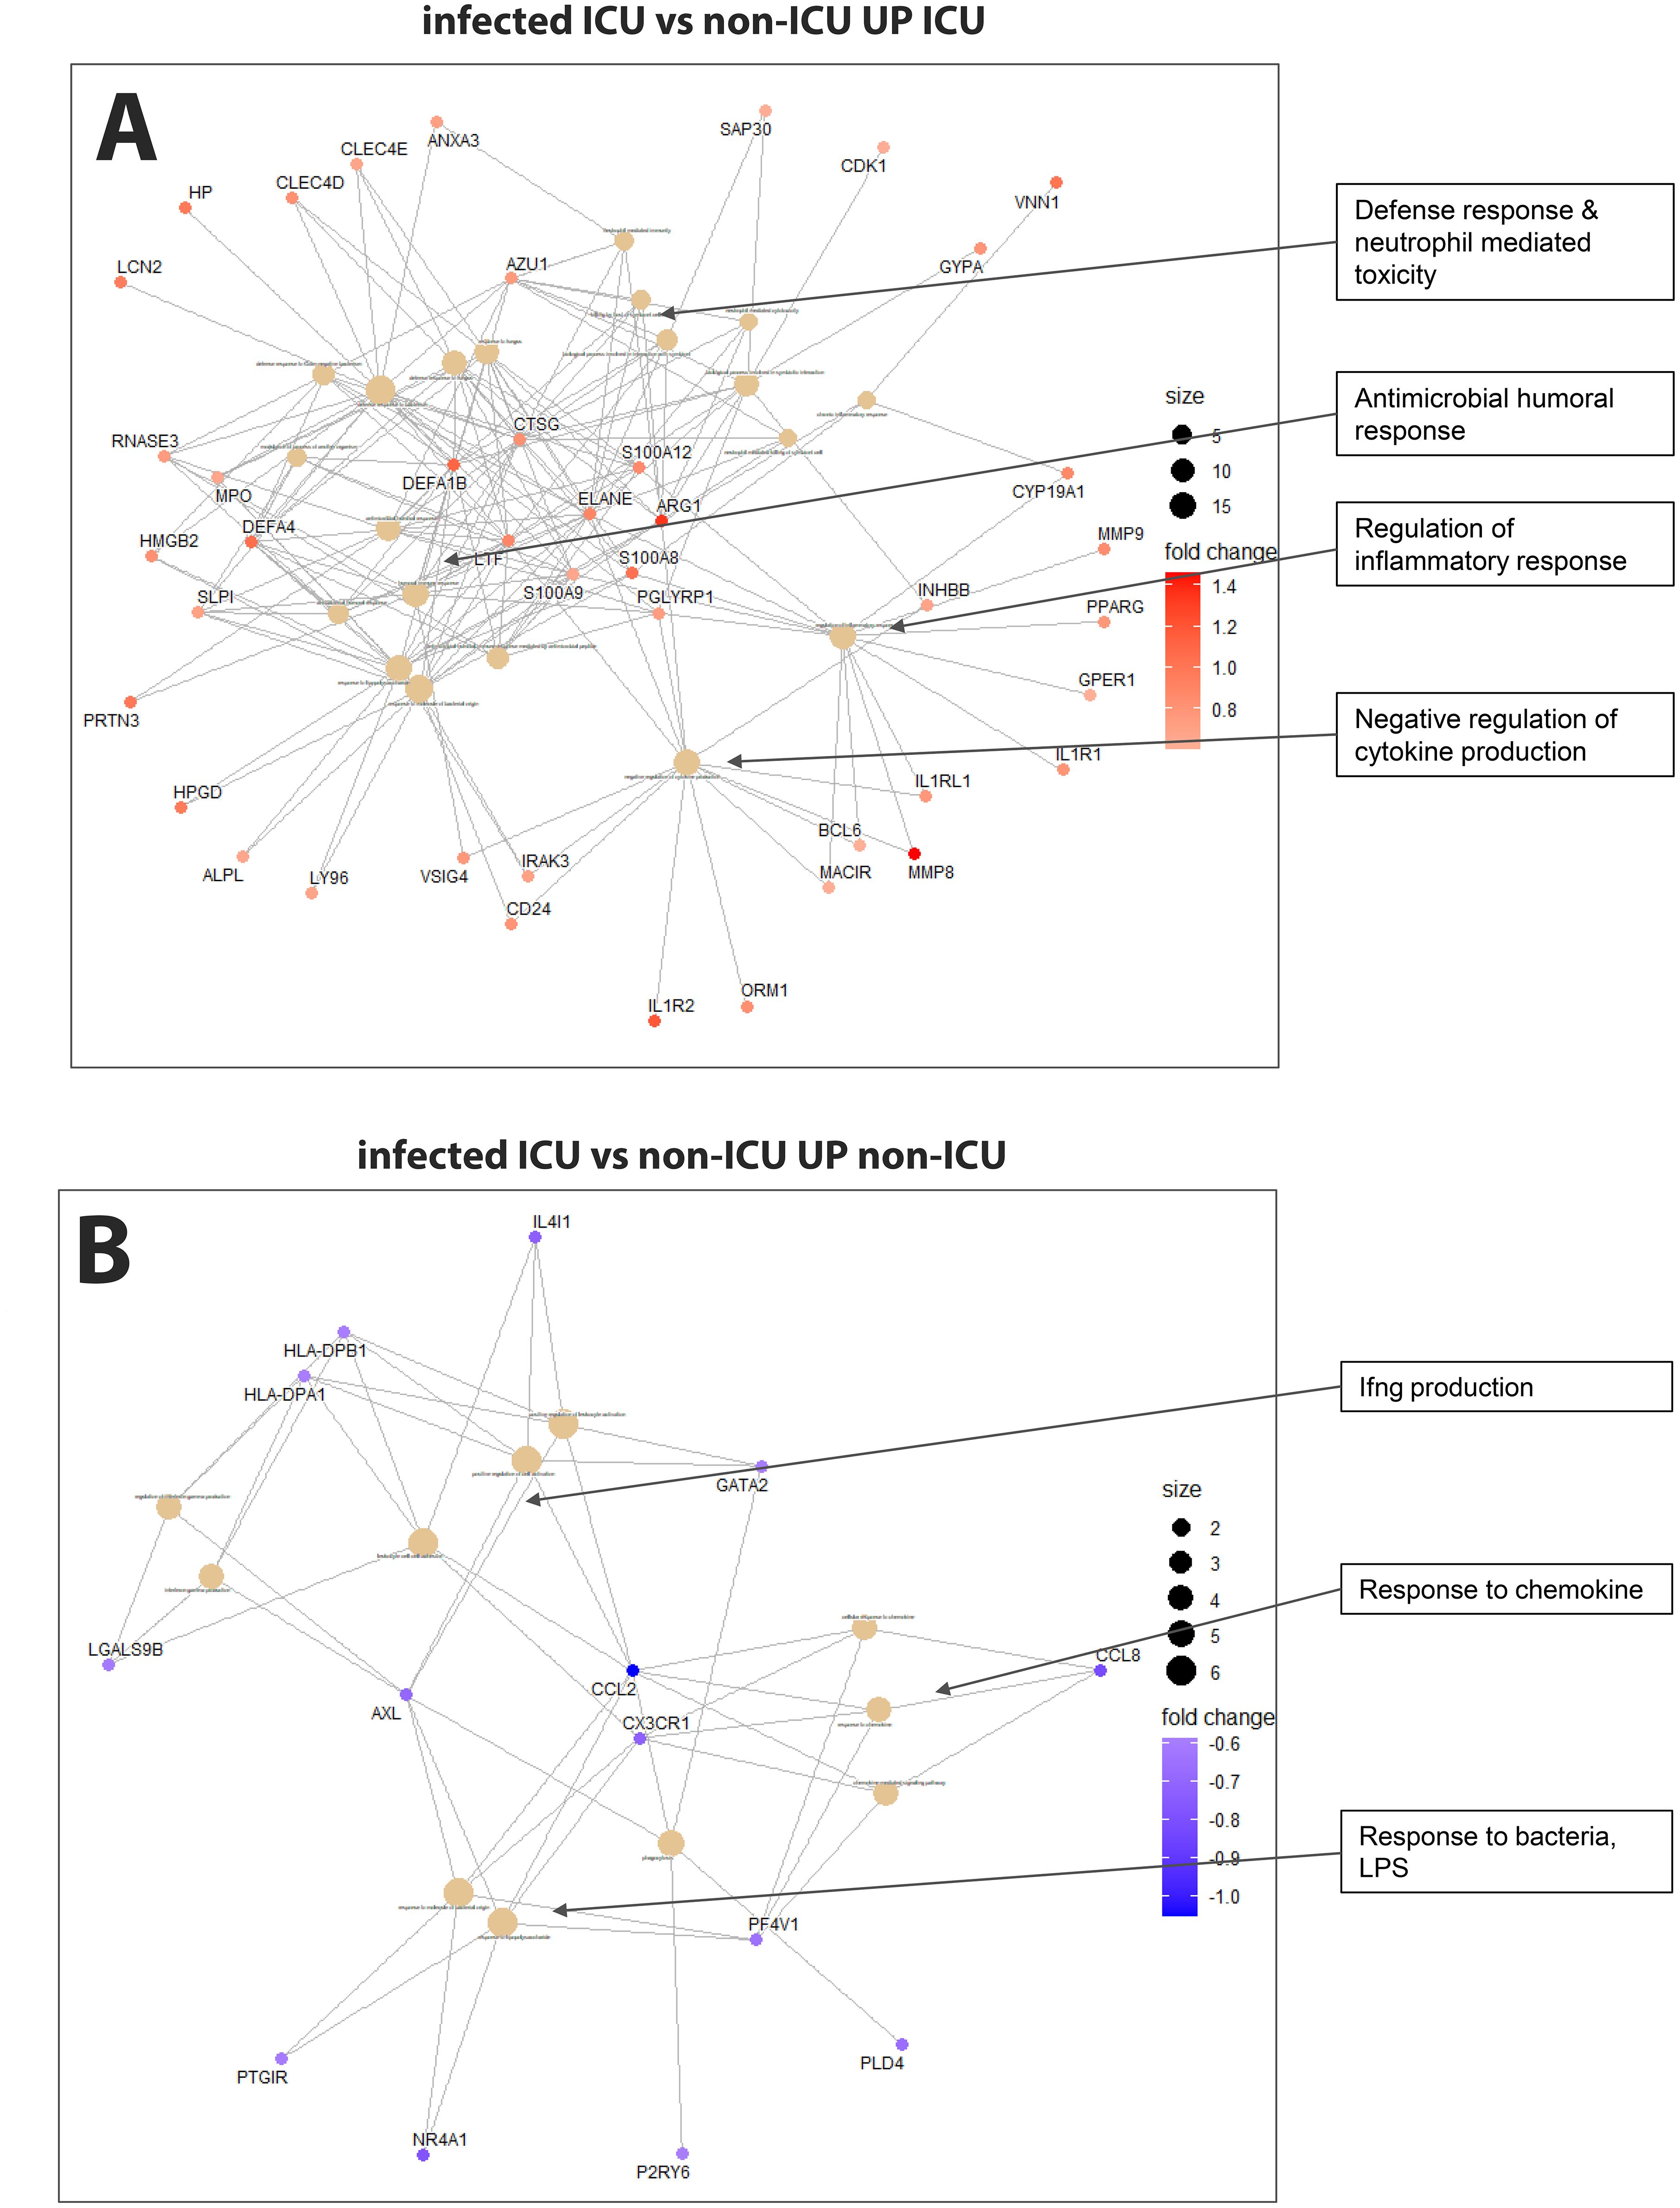
Figure 5. Pathway analysis of infected ICU versus non-ICU patients. (A) Functional analysis using GO term enrichment for the up-regulated DEGs (higher in ICU) from the contrast of infected ICU patients versus non-ICU patients. (B) Functional pathway analysis using GO term enrichment for the down-regulated DEGs (higher in non-ICU) from the contrast of infected ICU patients versus non-ICU patients.
Analysis of age and sex in driving transcriptome differences
In addition, we contrasted female versus male and young versus old patients, stratified by ICU and non-ICU. Only few DEGs were found in both comparisons. The results (Supplementary Figure S1) and discussion can be found in the supplementary material.
Genotyping of participants
Analysis of the genotype date after quality control revealed that the percent of missing SNPs per sample ranged from 2% to 6% (mean, 4%) with results differing somewhat between batches (means: SIG_geno_0718: mean = 2%; SIG_geno_0419: mean = 4%; SIG_geno_2020: mean = 5%; SIG_geno_2022: mean = 5%) (Supplementary Figure S2A). Only four SNPs were absent from all samples. The minor allele frequency ranged from 0 to 0.5 (Supplementary Figure S2B). These genotyping data and the inclusion of references to samples from the Coriell Institute HAPMAP collection allowed us to assign ethnicity to each patient from our cohort and to correlate genotype to gene expression data. The multidimensional scaling (MDS) plot of the reference genotypes showed a clear separation of ethnic groups (Figure 6A; colored for the ethnicity of the reference genomes). Based on the MDS components in Figure 6A, we assigned ethnicity to almost all participants from our cohort to four ancestral groups (Figure 6B): African-American (AfAm, n = 46), Asian (n = 2), Caucasian (Caucs, n = 169), Mexican American Indians (Mex_AmInd, n = 4). For some samples, no clear assignment was possible (referred to as admixed, n = 2).
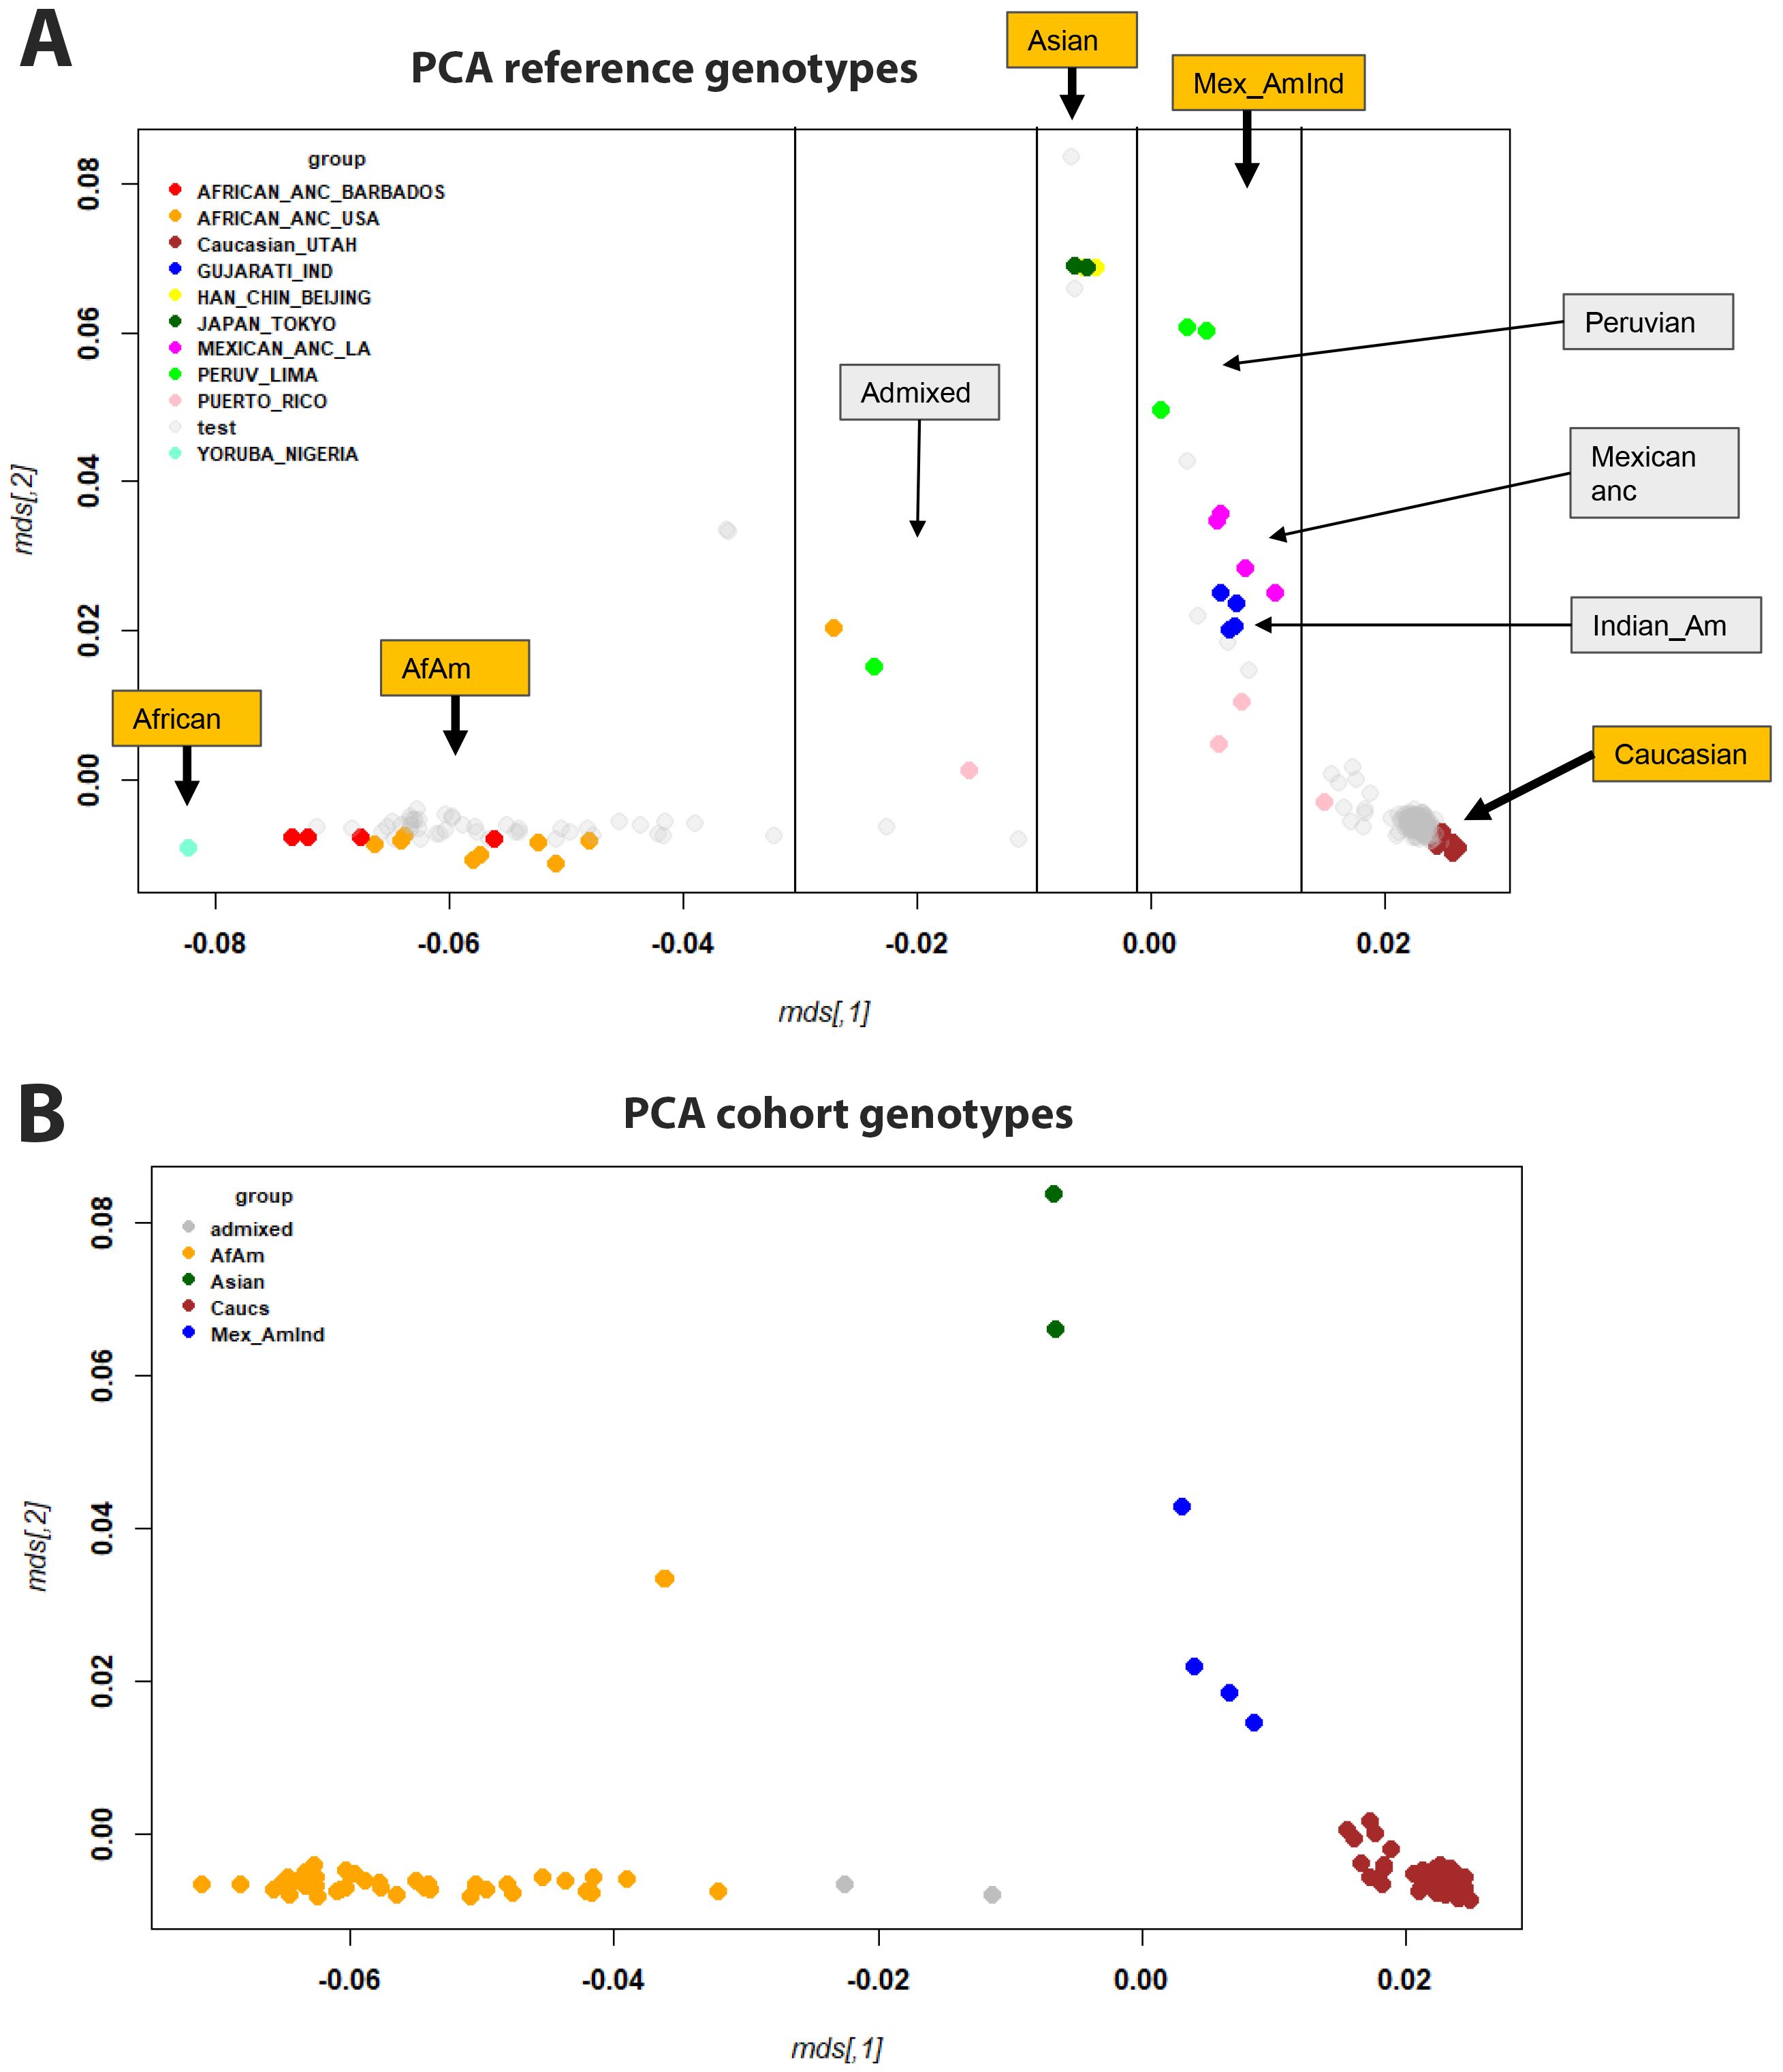
Figure 6. MDS plots of genotypes. (A) MDS plot showing all samples, with reference samples colored and participants in gray. (B) MDS plot of participants analyzed in this study (only a single representation for each participant, no reference genomes), colored for ethnicity. Abbreviations: African-American (AfAm), Mexican American Indians (Mex_AmInd), Mexican ancestry (Mexican anc), Indian American (Indian_Am).
Associations between transcriptome and genotype
After assigning ethnicity to every participant, we analyzed gene expression signals with respect to ethnicity (using Data file 20 and sample descriptions from Data file 1). The PCA for normalized gene expression for all participants suggests PC1 and PC2 did not obviously separate by ethnicity (Figure 7A). We then specifically looked for genes in infected patients that were differentially expressed between African-Americans and Caucasians. Fifteen genes were expressed at significantly higher levels in infected African-Americans, and 24 were significantly higher in Caucasians (Figure 7B; Data file 28). No pathways were found to be associated with these genes. Six of the 39 DEGs overlapped with DEGs from infected versus healthy controls (HP, MMP9, FBXO39, HES4, SMIM1, and FAP (Data file 6 and Data file 28), indicating regulation after infection. All other ethnic groups were too small for a reasonable analysis.
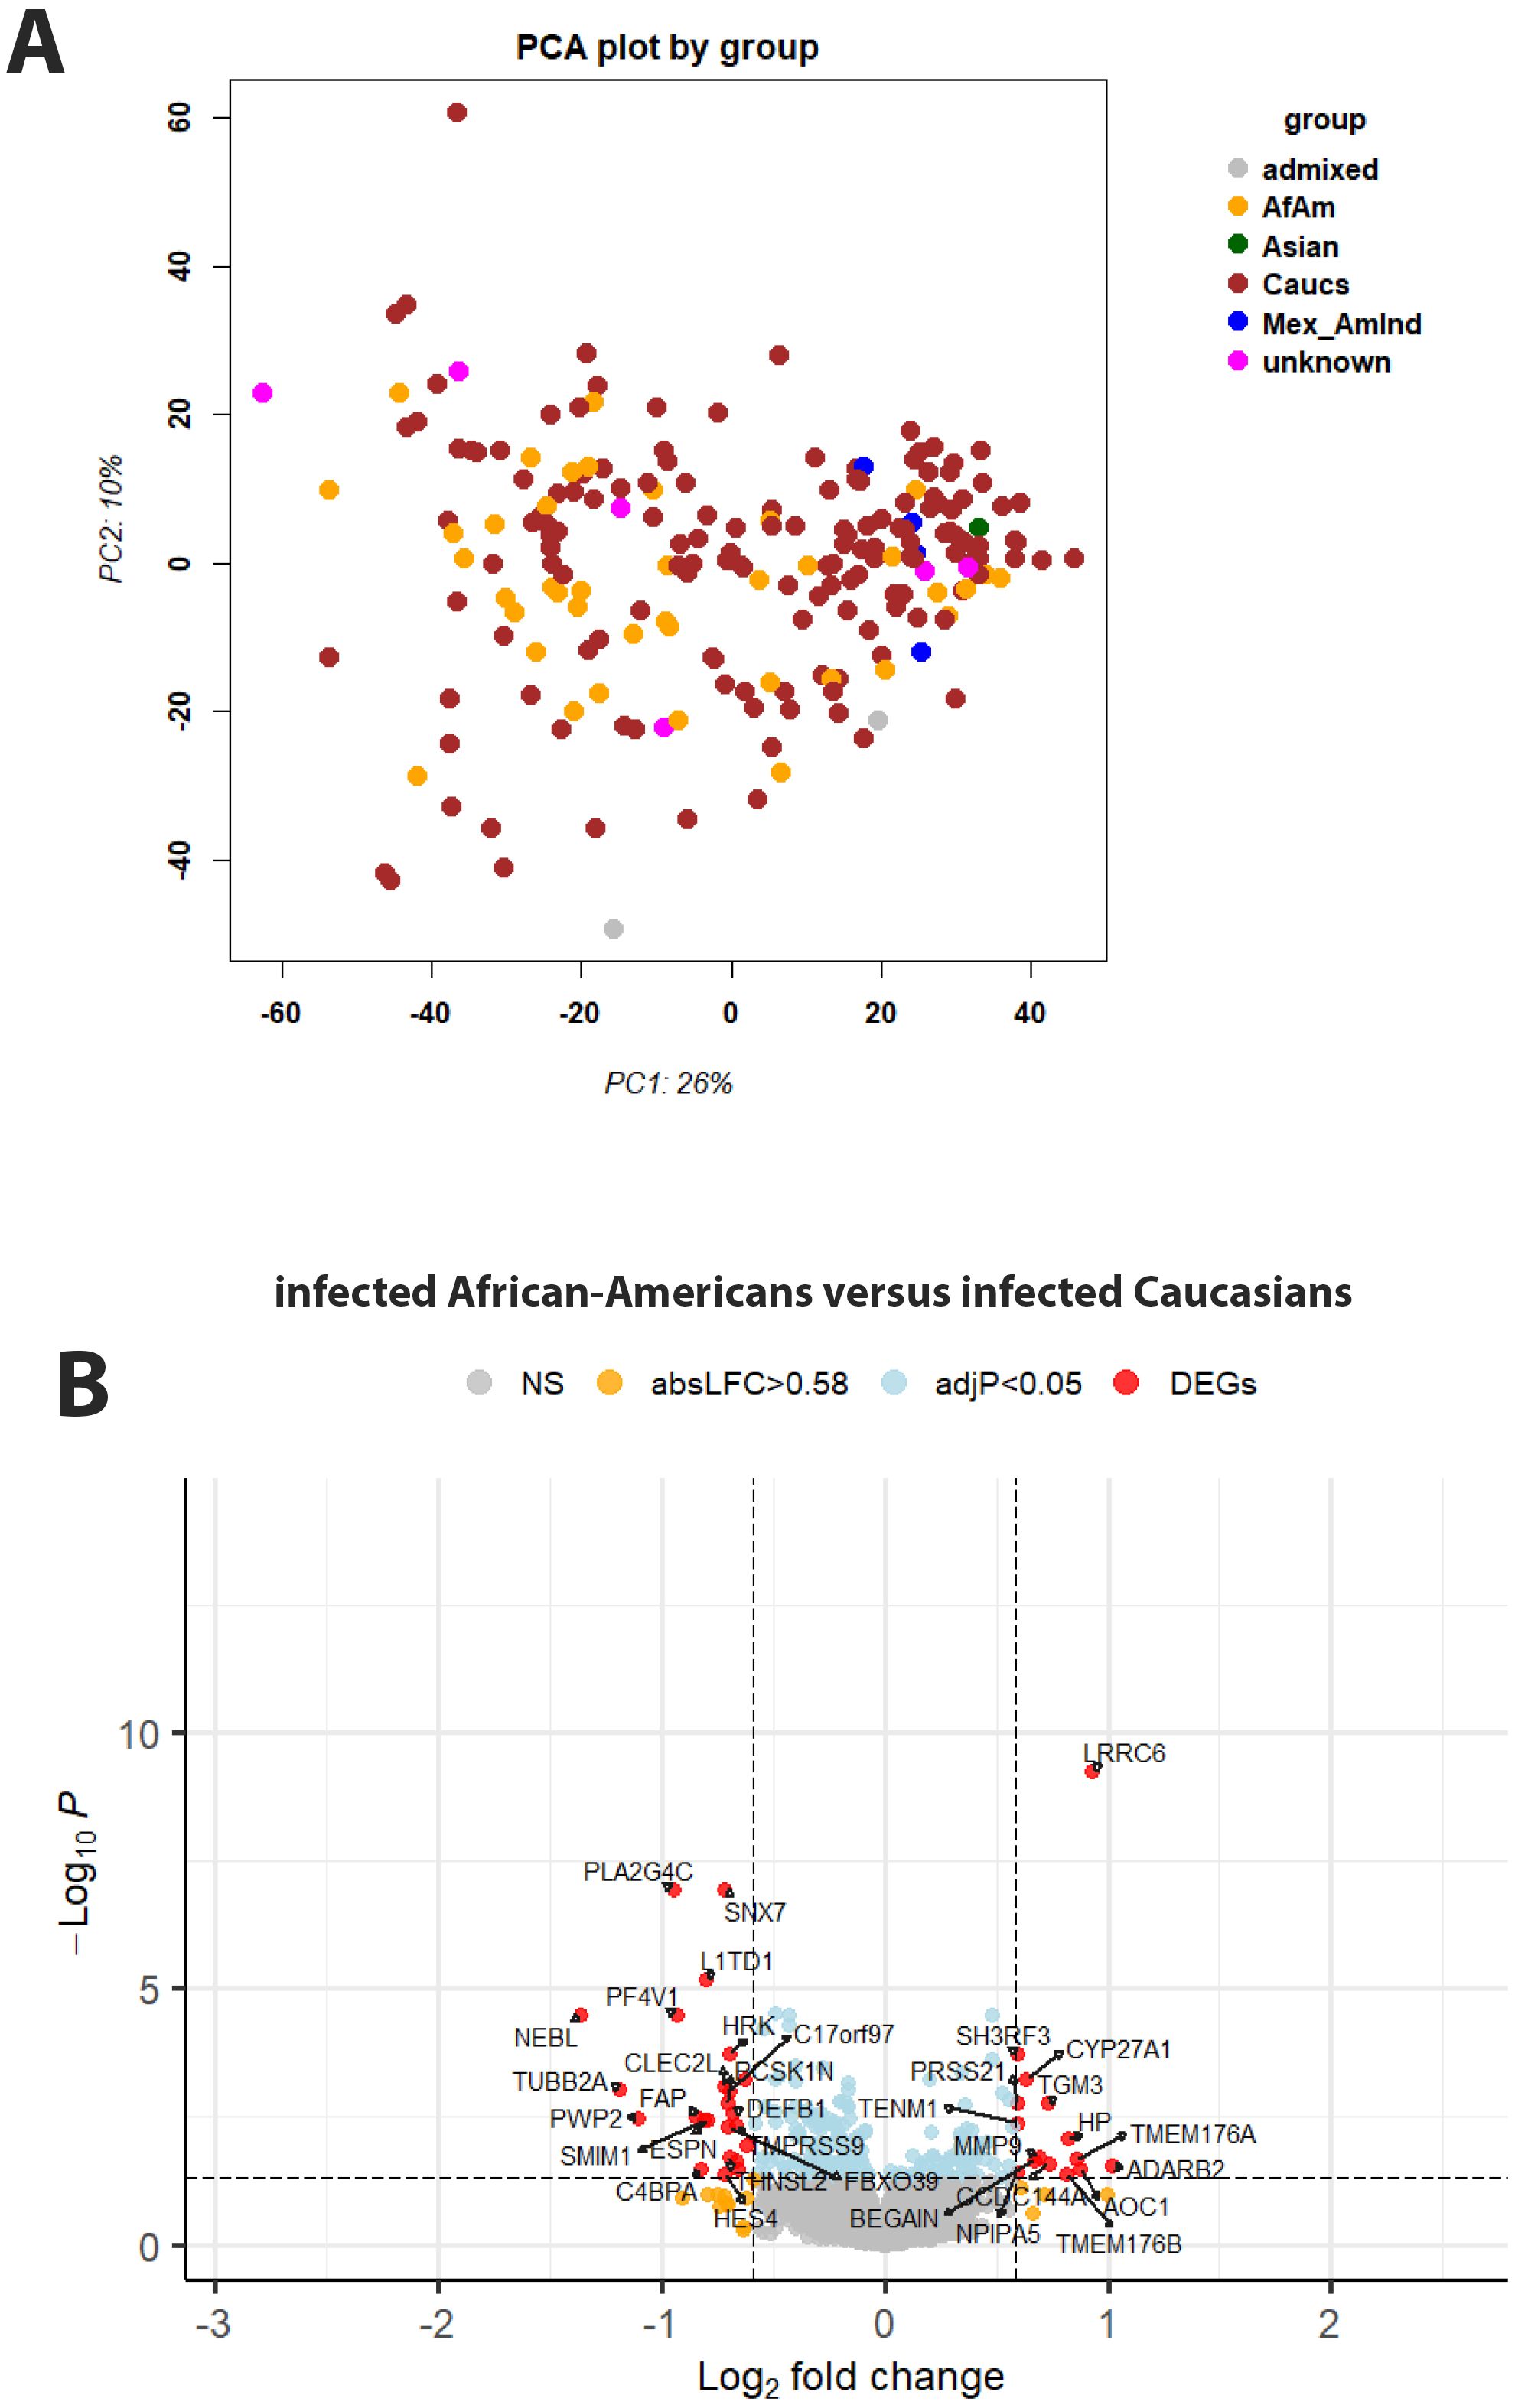
Figure 7. Principal component analysis and gene expression by genotype. (A) Principal component analysis plot for gene expression values of infected participants, colored by ethnicity. Abbreviations: African-American (AfAm), Caucasian (Caucs), Mexican American Indians (Mex_AmInd), Mexican ancestry (Mexican anc), Indian American (Indian_Am), no unambiguous assignment (admixed). (B) Volcano plot of DEGs for contrasts of infected Caucasian versus African-American patients. See Figure 2 for more details on volcano plots.
Also, our combined transcriptome and genotype data allowed us to identify genes for which the expression levels were correlated with genetic variations in or near the gene, so-called cis-eQTLs. Analyzing all DEGs combined (ICU versus healthy, non-ICU versus healthy, and ICU versus non-ICU), and including sex and ethnicity as covariates, showed that 871 DEGs were significantly correlated (adjusted P < 10-5, assuming an average of 100 SNPs per gene) with a genetic variant (Data file 13). The Manhattan plot showed the strongest cis-eQTLs on chromosome 6 (Figure 8) at the location of the HLA cluster. Sixty-one genes were mapped to chromosome 6, of which 16 were in the HLA region (30Mb – 34Mb). The top six most significant cis-eQTLs were HLA-DQB2, FADS2, HLA-DQB1, MDGA1, ICOSLG, and APOBEC3B; Data file 13). Figure 9 illustrates their expression levels, stratified by genotype at its locus. In almost all cases, genotypes were distributed across ethnicities. Of note, almost all African-American patients (except one) carried genotype BB for FADS2.
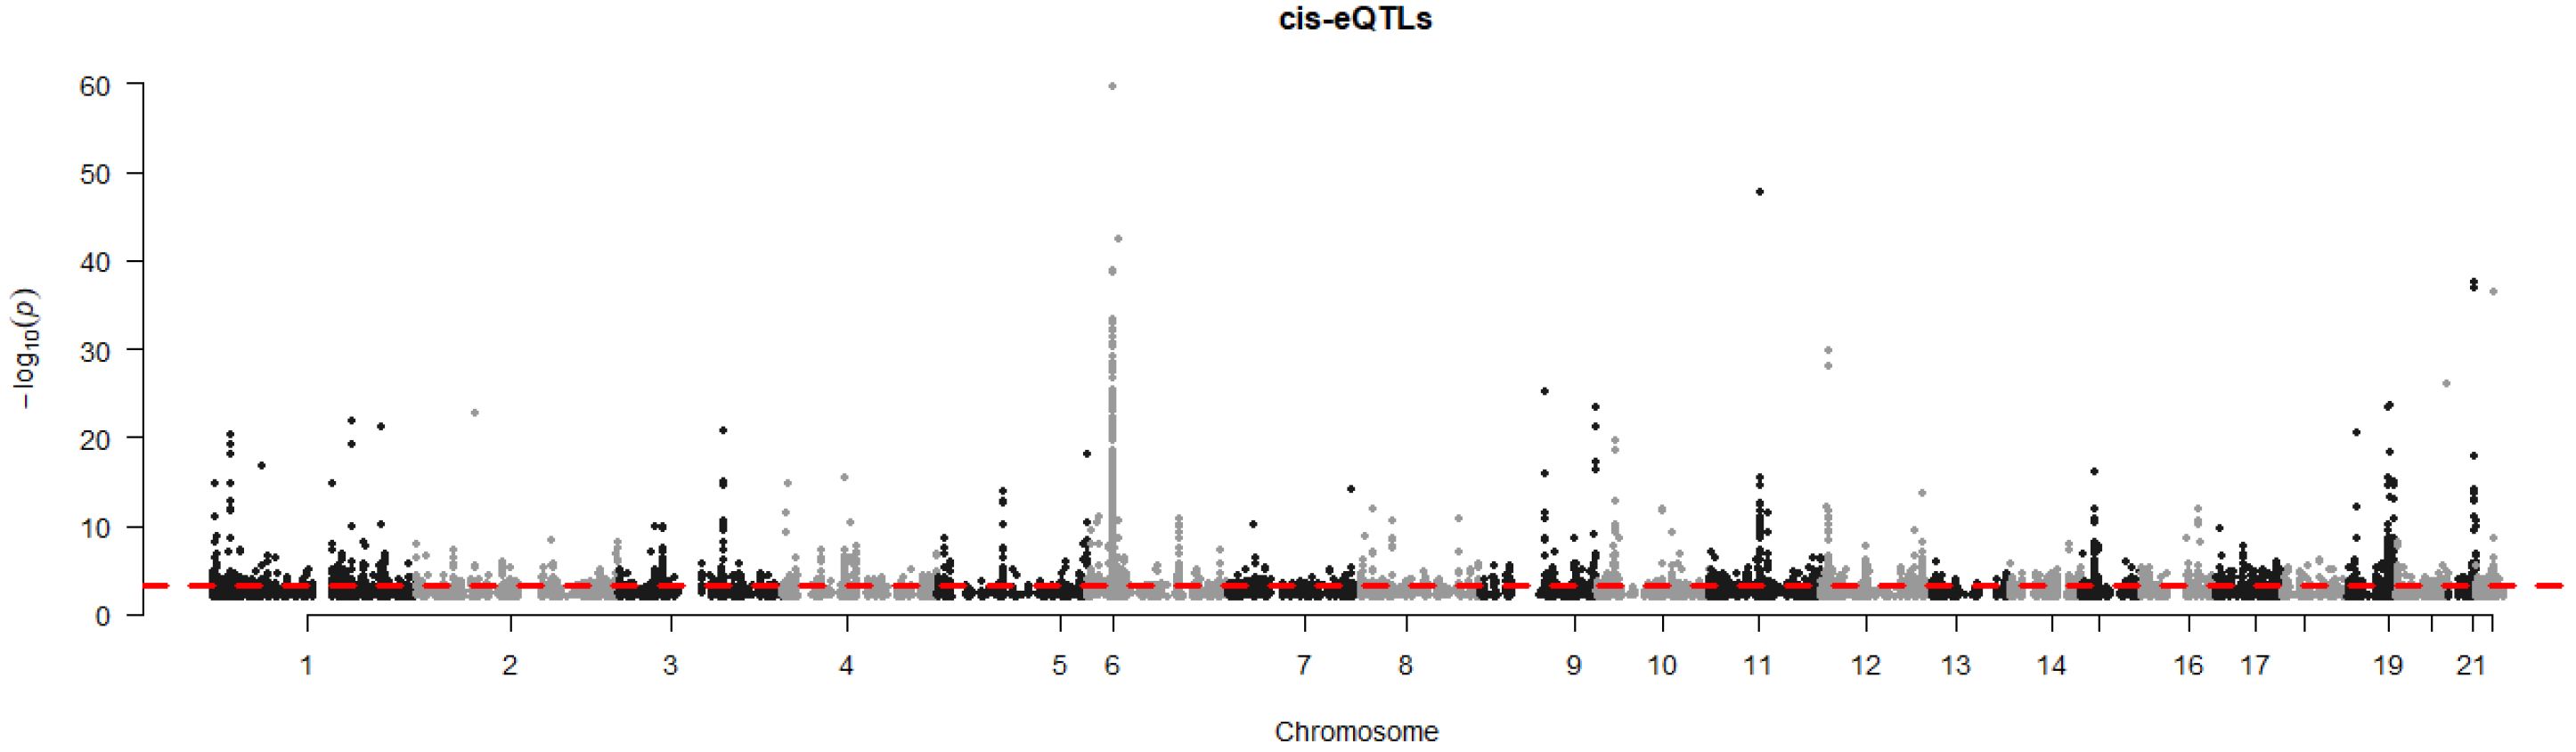
Figure 8. Manhattan plot of cis-eQTL analysis. Manhattan plot illustrating the results of cis-eQTL analysis for all 2,022 DEGs combined (DEGs from all comparisons presented in Figures 2, 3). y-axis: -log10 of p-value, x-axis: genome position per chromosome.
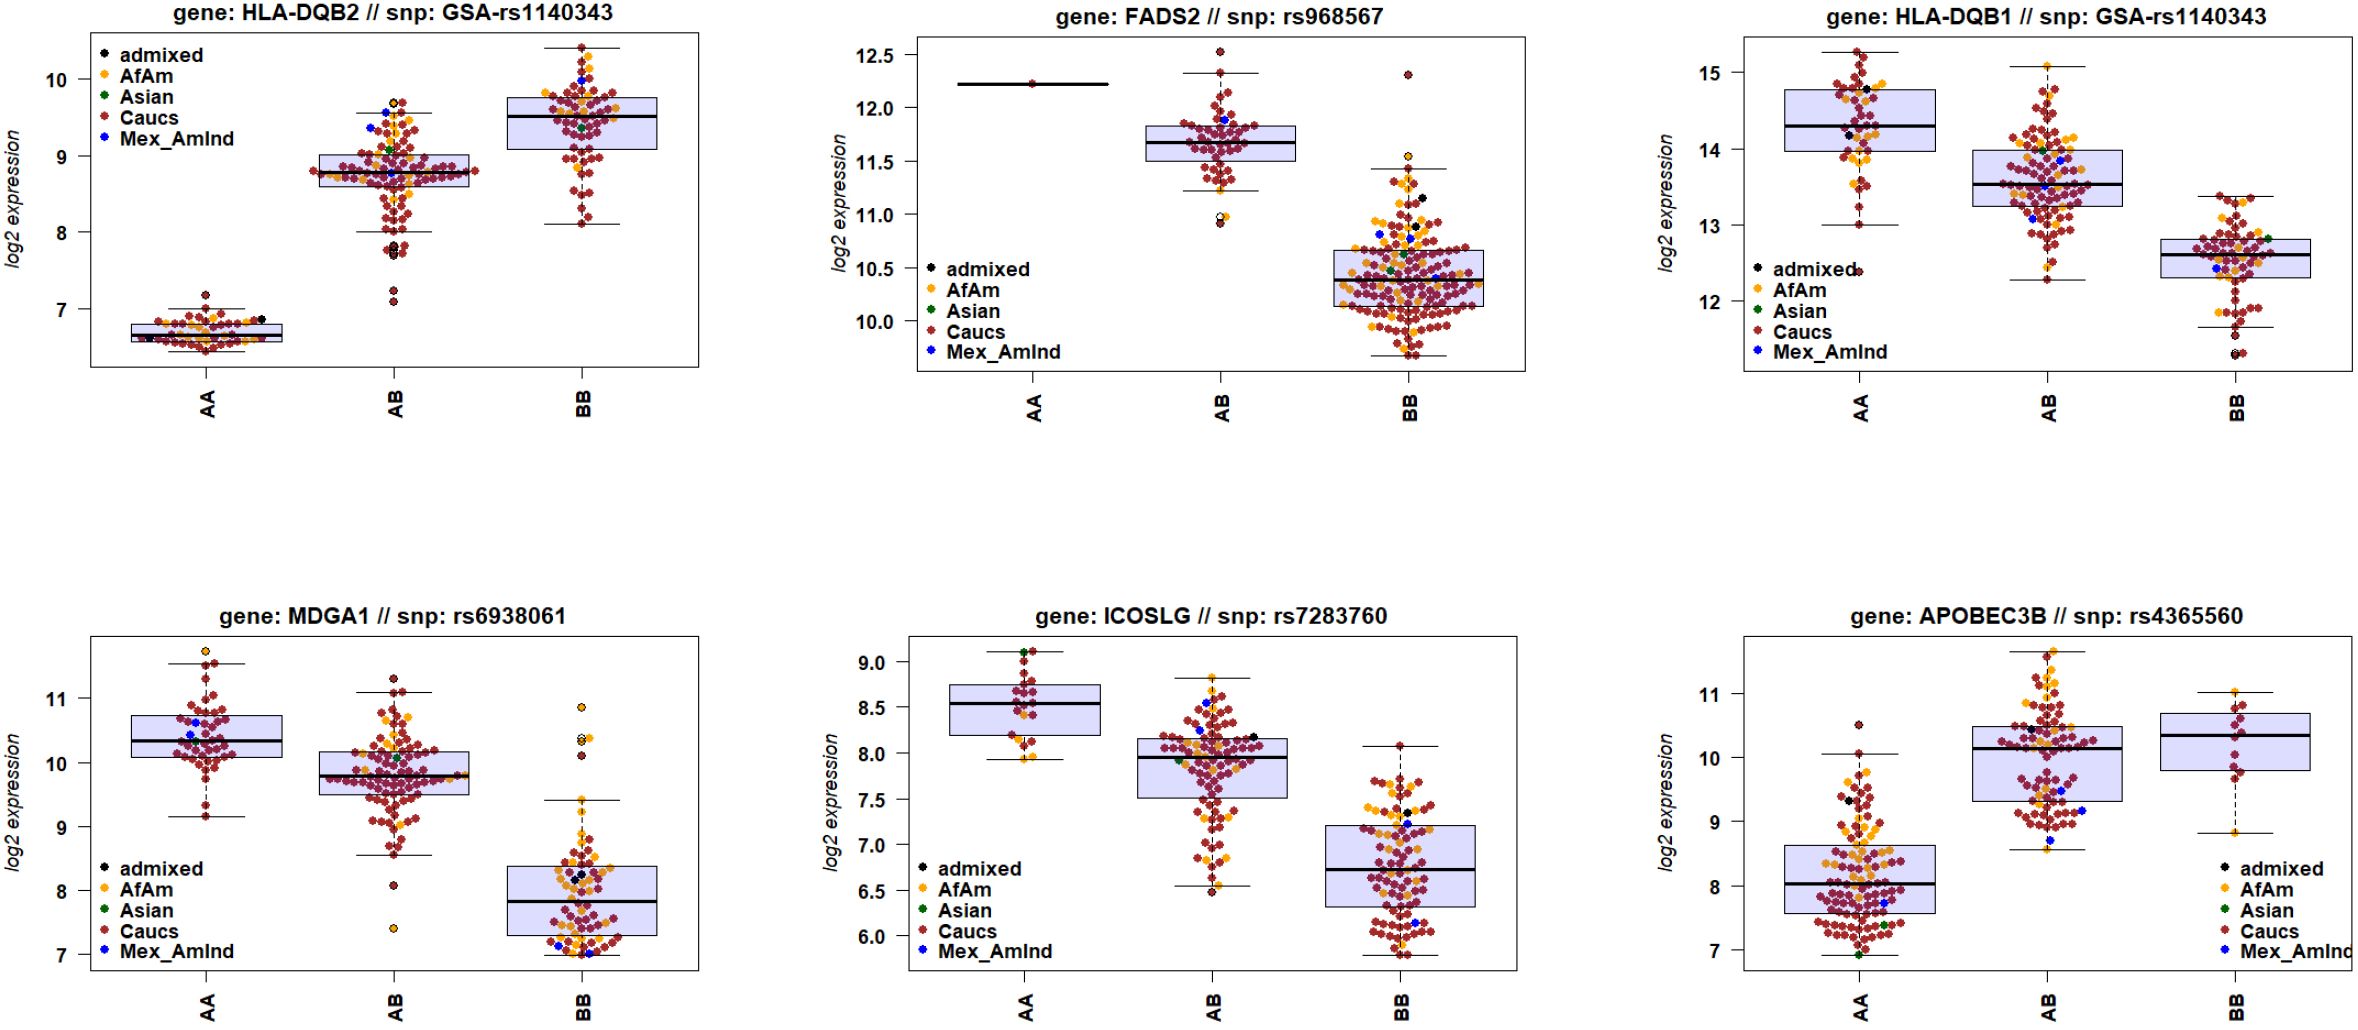
Figure 9. Gene expression levels of genes with a cis-eQTL. Boxplots of gene expression values of six top genes (by FDR) for e-QTL mapping, stratified by genotype. Box center line: median, box limits: upper and lower quartiles, whiskers: 1.5x interquartile range.
Of the six DEGs from the comparison of infected African-American versus Caucasian patients, four DEGs (SMIM1, FBXO39, HES4, and HP; Data file 28 and Data file 13) also exhibited a significant cis-eQTL (Supplementary Figure S3A) stratified by ethnicity; Supplementary Figure S3B stratified by genotype; Data file 14). Gene HP had the lowest significance for a cis-eQTL and did not show a clear separation. For gene FAP, participants’ genotypes were all homozygous (AA), except for one heterozygote (AB).
Discussion
Here, we analyzed the host response in human blood after infection with the influenza virus. This study is one of the largest cohorts to date using RNAseq technology and analyzing the influenza infection transcriptome response in humans (17–33, 57). Our study contained a total of 208 samples, where 127 were from infected patients, with 23 requiring intensive care. In addition, very unique to this study, we determined the genotype of participants, allowing us to correlate gene expression with ethnicity and genetic variation.
Pathway analysis for DEGs between infected patients and healthy controls agreed with other studies of influenza-infected patients regarding upregulation of common virus-host defense pathways (Figure 2; Data file 6) (17–33) and other respiratory virus infections (33). The main responses for up-regulated genes encompass interferon-stimulated genes and chemokine/cytokines. Down-regulated genes represent adaptive immune responses, most likely due to lymphopenia and suppression by up-regulated early inflammatory pathways, and most likely recruitment of adaptive immune cells into the lung.
Our results confirmed that IFI27 (Interferon Alpha Inducible Protein 27; Volcano plot in Figure 2A; and list of DEGs in Data file 6) showed the strongest increase in influenza-infected individuals compared to healthy controls. IFI27 is an interferon-induced gene involved in polymerase II-specific DNA-binding transcription factor binding activity and cellular apoptosis (29, 58) and is mainly expressed in dendritic cells (29). This study confirmed earlier observations describing its strong expression in the blood of infected influenza-infected patients (29, 59). In another study, we also observed top-level expression of IFI27 for human metapneumovirus infections but not for enterovirus/rhinovirus infections (33). IFI27 may, therefore, serve as a molecular biomarker in human blood to distinguish influenza and metapneumovirus from other respiratory infections. However, IFI27 was not a distinguishing factor for ICU admission. More studies with different respiratory and non-respiratory viral, bacterial, and fungal infections will be required to confirm IFI27 as robust diagnostic biomarker.
Pathways for inflammatory responses and neutrophil-mediated toxicity were higher in ICU patients, and pathways for IFNG production and response to chemokines were higher in non-ICU patients. These are similar observations as described in previous studies (25, 32, 59). The high activation of inflammatory responses, and especially the high activation of neutrophil responses, is the most likely cause of the observed immunopathology in ICU patients (25, 32). However, only some DEGs (169) were statistically significant in the direct contrast between ICU and non-ICU patients. This observation suggests that the magnitude of responses maybe different for many more genes but without being statistically significant (mostly higher in ICU patients).
It is worth noting that many of the DEGs from the comparison of ICU versus non-ICU patients (see Data file 9 for list of DEGs) exhibit known functions in macrophages, suggesting that dysregulation of macrophages may also contribute to severe influenza disease. CCL2 (C-C Motif Chemokine Ligand 2) was down-regulated in the ICU patients as was CX3CR1 (C-X3-C Motif Chemokine Receptor 1), which is associated with obesity, a risk factor for severe influenza disease (60). ARG1 (Arginase 1) was also up-regulated, and ARG1-expressing macrophages promote wound healing and dampen T cells (61–64). In addition, ADAMTS2 (ADAM Metallopeptidase With Thrombospondin Type 1 Motif 2) was upregulated. ADAMTS2 expression is associated with CD14 monocytes and alveolar macrophages, and it is known to function as a pro-collagen factor (65–67).
To our knowledge, this study is the first to use genotyping more precisely than using questionnaires and correlate ethnicity to gene expression differences. Genes influencing T cell signaling and co-stimulation (ICOSLG, HLA-DQB2, and HLA-DQB1) and type I interferon (FADS2, MDGA1, and APOBEC3B) were associated with genetic variation (Data file 13, Figure 9). ICOSLG (Inducible T Cell Costimulator Ligand) codes for a cell co-stimulator. Its loss leads to immunodeficiency (Roussel et al., 2018). HLA-DQB2 (Major Histocompatibility Complex, Class II, DQ Beta 2) encodes a TCR signaling receptor (GeneCards). FADS2 (Fatty Acid Desaturase 2) influences type I interferon response in CD4 cells (68). MDGA1 (MAM Domain Containing Glycosylphosphatidylinositol Anchor 1) affects type I IFN in epithelial cells (69). APOBEC3B (Apolipoprotein B MRNA Editing Enzyme Catalytic Subunit 3B) affects type I IFN and was associated with COVID severity in African-Americans (70, 71). However, our study did not find ethnicity as a distinguishing factor, although it had higher expression in individuals of any ethnicity with AA or BB genotypes.
Only a few DEGs were different between severity groups for influenza-infected African-Americans and Caucasians, suggesting only a minor role in the risk of progressing to severe influenza. Four genes showed different expression between these two ethnic groups and also exhibited genetic variations in cis (within or close to the transcribed region of the genes), suggesting that differences in expression level are caused by genetic differences (Supplementary Figure S3 and Data file 14). SMIM1 (Small Integral Membrane Protein 1 (Vel Blood Group) encodes a protein that is the antigen for the Vel blood group, which participates in red blood cell formation. These proteins are part of SCF complexes, acting as protein-ubiquitin ligases. It does not have any known function in the host response to infections (GeneCards). FBXO39 (F-Box Protein 39) is a member of the F-box protein family, containing an F-box motif. It is associated with Lymphogranuloma Venereum and Granuloma Inguinale disease. Thus, it may have a function in the host’s defense against infections (GeneCards). HES4 (Hes Family BHLH Transcription Factor 4) is predicted to be part of the chromatin and to enable DNA-binding transcription factor activity and RNA polymerase II sequence-specific DNA binding activity. It does not have any known function in the host response to infections (GeneCards). The function of these genes in the immune defense against infections is unknown, except for HP. Thus, it is more likely that the few numbers of DEGs and their functions do not explain the observed differences in the population and that the observed differences in clinical outcomes could be due to socioeconomic differences or differences in access to care rather than biological factors (72).
Our study has several limitations. Although the cohort was large compared with other studies in the field, it only detected small differences when groups were stratified by severity plus sex and age. Thus, even larger group sizes may be needed to detect significant differences between these groups. Transcriptome analyses and genotype analyses were performed in several batches, which required batch corrections. Such corrections may result in a lower power to detect more subtle differences. We did not include patients younger than 18 years in our study, and thus could not analyze responses in children and adolescents. We did not perform a time course analysis for differential gene expression, because the number of patients from whom we collected multiple time data was too limited. Furthermore, the samples here were collected on ‘day 1’ of a patient’s presentation at the hospital or the first blood draw from ICU patients. Thus, the time of infection or onset of symptoms was unknown, which did not allow us to analyze the kinetics of the host response over time. Both point-in-time deviations of gene signatures and their causal relationships are unclear but should be the subject of future studies (73). Our cohort was large enough for the detection of cis-eQTL, although higher numbers would be preferable for detecting more. However, our cohort size was too small for the identification of trans-eQTLs variants in genes that affect the regulation of other genes distantly located in the genome. Nevertheless, our data will allow future studies to include the cis-eQTLs genotype information in their analyses. While the genes identified here and elsewhere may serve as biomarkers for a better diagnosis and/or predictors of severe disease, they still need to be clinically validated. However, even if verified, it is unclear how they might be used early enough to alter the course of disease.
Data availability statement
The datasets presented in this study can be found in online repositories. The names of the repository/repositories and accession number(s) can be found in the article/Supplementary Material.
Ethics statement
The studies involving humans were approved by Baptist Memorial Hospital Memphis: Studies were approved by the IRB, approval 17/33: ‘Influenza Response Study’. Otto-von-Gericke University Magdeburg: Studies were approved by an internal ethics committee review board, approval 36/14 from 27.03.2018: ‘Biomarkeranalyse bei Patienten mit einer ambulant erworbenen Pneumonie’. Hannover Medical School: Studies were approved by an internal ethics committee, approval 8614_BO_S_2019 for the study “Wirksamkeit und Nutzen einer Influenza-Impfung bei Patientinnen mit Leberzirrhose” with the initial consent of 16.09.2019 and the consent to the amendment for the inclusion of the healthy controls from 23.04.2021. University of North Carolina at Chapel Hill (UNC): The study was approved by the UNC Institutional Review Board (IRB# 17-2122). Duke University (IRB# Pro00054849, ACESO/ARLG/Duke ED Acute Infection Study) and Durham VA Health Care System (IRB# 1596239, Acute Infectious Disease Study). Sample analysis at UTHSC: Processing of blood samples, transcriptome, and genotype studies, and data analysis were approved by the IRB at UTHSC, protocol number: 17-05506-XP; ‘The Host response to Influenza Virus Infection: immune responses, disease severity, genetic risk. Systems immunogenetics of biodefense and emerging pathogens in the collaborative cross-sample analyses. The studies were conducted in accordance with the local legislation and institutional requirements. The participants provided their written informed consent to participate in this study.
Author contributions
KS: Conceptualization, Data curation, Formal analysis, Funding acquisition, Investigation, Methodology, Project administration, Resources, Software, Supervision, Validation, Visualization, Writing – original draft, Writing – review & editing. AS: Writing – review & editing, Writing – original draft. ET: Conceptualization, Data curation, Investigation, Resources, Writing – original draft, Writing – review & editing. ST: Data curation, Investigation, Resources, Writing – review & editing. SS: Conceptualization, Investigation, Resources, Data curation, Writing – review & editing. WF: Investigation, Methodology, Resources, Writing – review & editing, Conceptualization. JS: Data curation, Investigation, Methodology, Resources, Writing – review & editing. EL: Investigation, Methodology, Resources, Writing – review & editing, Data curation. MC: Investigation, Methodology, Resources, Writing – review & editing. JD: Investigation, Methodology, Resources, Writing – review & editing, Data curation. CW: Funding acquisition, Writing – review & editing, Conceptualization. MM: Investigation, Methodology, Resources, Writing – review & editing. MH: Funding acquisition, Writing – review & editing, Conceptualization.
Funding
The author(s) declare financial support was received for the research, authorship, and/or publication of this article. This study was supported by intra-mural grants from the Helmholtz-Association (Program Infection and Immunity), a start-up grant from UTHSC, NIAID Research Grants 2-U19-AI100625-06 REVISED and 5U19A|100625-07 awarded to KS, and an NIAID grant R01 AI170115 awarded to AS.
Acknowledgments
We thank the MRC at the UTHSC for quality control of RNA. RNA sequencing was performed by Novogene, Sacramento, CA. We thank Roxann Ashworth, Johns Hopkins University School of Medicine; Genetic Resources Core Facility (GRCF) for array genotyping analysis. We thank the Coriell Institute HAPMAP collection for providing DNA reference samples for ethnicity identification. We thank all participants from this study for their willingness to provide blood samples. We acknowledge support from the Open Access Publication Fund of the University of Muenster.
Conflict of interest
During the conduct of this study, ET and CW were co-founders of Predigen, Inc. and held equity in Biomeme, Inc. ET is currently employed by and holds equity in Danaher Corp. ET and CW have patents pending or granted for Methods to Diagnose and Treat Acute Respiratory Infections; Gene Expression Signatures Useful to Predict or Diagnose Sepsis and Methods of Using the Same; Methods for Characterizing Infections and Methods for Developing Tests for the Same; and Systems and methods for determining status, type, severity, and/or risk of infection.
The remaining authors declare that the research was conducted in the absence of any commercial or financial relationships that could be constructed as a potential conflict of interest.
Publisher’s note
All claims expressed in this article are solely those of the authors and do not necessarily represent those of their affiliated organizations, or those of the publisher, the editors and the reviewers. Any product that may be evaluated in this article, or claim that may be made by its manufacturer, is not guaranteed or endorsed by the publisher.
Supplementary material
The Supplementary Material for this article can be found online at: https://www.frontiersin.org/articles/10.3389/fimmu.2024.1385362/full#supplementary-material
References
1. Iuliano AD, Roguski KM, Chang HH, Muscatello DJ, Palekar R, Tempia S, et al. Estimates of global seasonal influenza-associated respiratory mortality: a modelling study. Lancet. (2018) 391:1285–300. doi: 10.1016/S0140-6736(17)33293-2
2. Taubenberger JK, Morens DM. The pathology of influenza virus infections. Annu Rev Pathol. (2008) 3:499–522. doi: 10.1146/annurev.pathmechdis.3.121806.154316
3. Jackson ML, Starita L, Kiniry E, Phillips CH, Wellwood S, Cho S, et al. Incidence of medically attended acute respiratory illnesses due to respiratory viruses across the life course during the 2018/19 influenza season. Clin Infect Dis. (2021) 73:802–7. doi: 10.1093/cid/ciab131
4. Srivastava B, Blazejewska P, Hessmann M, Bruder D, Geffers R, Mauel S, et al. Host genetic background strongly influences the response to influenza a virus infections. PloS One. (2009) 4:e4857. doi: 10.1371/journal.pone.0004857
5. Fukuyama S, Kawaoka Y. The pathogenesis of influenza virus infections: the contributions of virus and host factors. Curr Opin Immunol. (2011) 23:481–6. doi: 10.1016/j.coi.2011.07.016
6. Kuiken T, Riteau B, Fouchier RA, Rimmelzwaan GF. Pathogenesis of influenza virus infections: the good, the bad and the ugly. Curr Opin Virol. (2012) 2:276–86. doi: 10.1016/j.coviro.2012.02.013
7. Betakova T, Kostrabova A, Lachova V, Turianova L. Cytokines induced during influenza virus infection. Curr Pharm Des. (2017) 23:2616–22. doi: 10.2174/1381612823666170316123736
8. Park JE, Ryu Y. Transmissibility and severity of influenza virus by subtype. Infect Genet Evol. (2018) 65:288–92. doi: 10.1016/j.meegid.2018.08.007
9. De Jong MD, Simmons CP, Thanh TT, Hien VM, Smith GJ, Chau TN, et al. Fatal outcome of human influenza A (H5N1) is associated with high viral load and hypercytokinemia. Nat Med. (2006) 12:1203–7. doi: 10.1038/nm1477
10. Kobasa D, Jones SM, Shinya K, Kash JC, Copps J, Ebihara H, et al. Aberrant innate immune response in lethal infection of macaques with the 1918 influenza virus. Nature. (2007) 445:319–23. doi: 10.1038/nature05495
11. La Gruta NL, Kedzierska K, Stambas J, Doherty PC. A question of self-preservation: immunopathology in influenza virus infection. Immunol Cell Biol. (2007) 85:85–92. doi: 10.1038/sj.icb.7100026
12. Short KR, Kroeze EJ, Fouchier RA, Kuiken T. Pathogenesis of influenza-induced acute respiratory distress syndrome. Lancet Infect Dis. (2014) 14:57–69. doi: 10.1016/S1473-3099(13)70286-X
13. Herold S, Becker C, Ridge KM, Budinger GR. Influenza virus-induced lung injury: pathogenesis and implications for treatment. Eur Respir J. (2015) 45:1463–78. doi: 10.1183/09031936.00186214
14. Chitnis AS, Truelove SA, Druckenmiller JK, Heffernan RT, Davis JP. Epidemiologic and clinical features among patients hospitalized in Wisconsin with 2009 H1N1 influenza A virus infections, April to August 2009. Wmj. (2010) 109:201–8.
15. Cyrus E, Clarke R, Hadley D, Bursac Z, Trepka MJ, Dévieux JG, et al. The impact of COVID-19 on african american communities in the United States. Health Equity. (2020) 4:476–83. doi: 10.1089/heq.2020.0030
16. Peek ME, Simons RA, Parker WF, Ansell DA, Rogers SO, Edmonds BT. COVID-19 among african americans: an action plan for mitigating disparities. Am J Public Health. (2021) 111:286–92. doi: 10.2105/AJPH.2020.305990
17. Ramilo O, Allman W, Chung W, Mejias A, Ardura M, Glaser C, et al. Gene expression patterns in blood leukocytes discriminate patients with acute infections. Blood. (2007) 109:2066–77. doi: 10.1182/blood-2006-02-002477
18. Zaas AK, Chen M, Varkey J, Veldman T, Hero AO 3rd, Lucas J, et al. Gene expression signatures diagnose influenza and other symptomatic respiratory viral infections in humans. Cell Host Microbe. (2009) 6:207–17. doi: 10.1016/j.chom.2009.07.006
19. Bermejo-Martin JF, Martin-Loeches I, Rello J, Anton A, Almansa R, Xu L, et al. Host adaptive immunity deficiency in severe pandemic influenza. Crit Care. (2010) 14:R167. doi: 10.1186/cc9259
20. Berdal JE, Mollnes TE, Waehre T, Olstad OK, Halvorsen B, Ueland T, et al. Excessive innate immune response and mutant D222G/N in severe A (H1N1) pandemic influenza. J Infect. (2011) 63:308–16. doi: 10.1016/j.jinf.2011.07.004
21. Ioannidis I, Mcnally B, Willette M, Peeples ME, Chaussabel D, Durbin JE, et al. Plasticity and virus specificity of the airway epithelial cell immune response during respiratory virus infection. J Virol. (2012) 86:5422–36. doi: 10.1128/JVI.06757-11
22. Parnell GP, Mclean AS, Booth DR, Armstrong NJ, Nalos M, Huang SJ, et al. A distinct influenza infection signature in the blood transcriptome of patients with severe community-acquired pneumonia. Crit Care. (2012) 16:R157. doi: 10.1186/cc11477
23. Herberg JA, Kaforou M, Gormley S, Sumner ER, Patel S, Jones KD, et al. Transcriptomic profiling in childhood H1N1/09 influenza reveals reduced expression of protein synthesis genes. J Infect Dis. (2013) 208:1664–8. doi: 10.1093/infdis/jit348
24. Woods CW, Mcclain MT, Chen M, Zaas AK, Nicholson BP, Varkey J, et al. A host transcriptional signature for presymptomatic detection of infection in humans exposed to influenza H1N1 or H3N2. PloS One. (2013) 8:e52198. doi: 10.1371/journal.pone.0052198
25. Davenport EE, Antrobus RD, Lillie PJ, Gilbert S, Knight JC. Transcriptomic profiling facilitates classification of response to influenza challenge. J Mol Med (Berl). (2015) 93:105–14. doi: 10.1007/s00109-014-1212-8
26. Zhai Y, Franco LM, Atmar RL, Quarles JM, Arden N, Bucasas KL, et al. Host transcriptional response to influenza and other acute respiratory viral infections–A prospective cohort study. PloS Pathog. (2015) 11:e1004869. doi: 10.1371/journal.ppat.1004869
27. Liu TY, Burke T, Park LP, Woods CW, Zaas AK, Ginsburg GS, et al. An individualized predictor of health and disease using paired reference and target samples. BMC Bioinf. (2016) 17:47. doi: 10.1186/s12859-016-0889-9
28. Tsalik EL, Henao R, Nichols M, Burke T, Ko ER, Mcclain MT, et al. Host gene expression classifiers diagnose acute respiratory illness etiology. Sci Transl Med. (2016) 8:322ra311. doi: 10.1126/scitranslmed.aad6873
29. Tang BM, Shojaei M, Parnell GP, Huang S, Nalos M, Teoh S, et al. A novel immune biomarker IFI27 discriminates between influenza and bacteria in patients with suspected respiratory infection. Eur Respir J. (2017) 49:1–7. doi: 10.1183/13993003.02098-2016
30. Dunning J, Blankley S, Hoang LT, Cox M, Graham CM, James PL, et al. Progression of whole-blood transcriptional signatures from interferon-induced to neutrophil-associated patterns in severe influenza. Nat Immunol. (2018) 19:625–35. doi: 10.1038/s41590-018-0111-5
31. Guan W, Yang Z, Wu NC, Lee HHY, Li Y, Jiang W, et al. Clinical correlations of transcriptional profile in patients infected with avian influenza H7N9 virus. J Infect Dis. (2018) 218:1238–48. doi: 10.1093/infdis/jiy317
32. Tang BM, Shojaei M, Teoh S, Meyers A, Ho J, Ball TB, et al. Neutrophils-related host factors associated with severe disease and fatality in patients with influenza infection. Nat Commun. (2019) 10:3422. doi: 10.1038/s41467-019-11249-y
33. Tsalik EL, Fiorino C, Aqeel A, Liu Y, Henao R, Ko ER, et al. The host response to viral infections reveals common and virus-specific signatures in the peripheral blood. Front Immunol. (2021) 12:741837. doi: 10.3389/fimmu.2021.741837
34. Fastqc package FastQC. Available online at: http://www.bioinformatics.babraham.ac.uk/projects/fastqc.
35. Trimgalore. Available online at: https://www.bioinformatics.babraham.ac.uk/projects/trim_galore/.
36. Dobin A, Gingeras TR. Mapping RNA-seq reads with STAR. Curr Protoc Bioinf. (2015) 51:11.14.11–19. doi: 10.1002/0471250953.bi1114s51
37. Liao Y, Smyth GK, Shi W. The R package Rsubread is easier, faster, cheaper and better for alignment and quantification of RNA sequencing reads. Nucleic Acids Res. (2019) 47:e47. doi: 10.1093/nar/gkz114
38. R_Core_Team. R: A language and environment for statistical computing. Vienna, Austria: R Foundation for Statistical Computing (2013). Available at: http://www.R-project.org/.
39. Rstudio. Available online at: https://www.rstudio.com/.
40. Durinck S, Moreau Y, Kasprzyk A, Davis S, De Moor B, Brazma A, et al. BioMart and Bioconductor: a powerful link between biological databases and microarray data analysis. Bioinformatics. (2005) 21:3439–40. doi: 10.1093/bioinformatics/bti525
41. Love MI, Huber W, Anders S. Moderated estimation of fold change and dispersion for RNA-seq data with DESeq2. Genome Biol. (2014) 15:550. doi: 10.1186/s13059-014-0550-8
42. Smyth GK. Linear models and empirical bayes methods for assessing differential expression in microarray experiments. Stat Appl Genet Mol Biol. (2004) 3:Article3. doi: 10.2202/1544-6115.1027
43. Ritchie ME, Phipson B, Wu D, Hu Y, Law CW, Shi W, et al. limma powers differential expression analyses for RNA-sequencing and microarray studies. Nucleic Acids Res. (2015) 43:e47. doi: 10.1093/nar/gkv007
44. Benjamini Y, Hochberg Y. Controlling the false discovery rate: A practical and powerful apporach to multiple testing. J R Stat Soc. (1995) 57:289–300. doi: 10.1111/j.2517-6161.1995.tb02031.x
45. Blighe K, Rana S, Lewis M. EnhancedVolcano: Publication-ready volcano plots with enhanced colouring and labeling. Available online at: https://github.com/kevinblighe/EnhancedVolcano.
46. Yu G, Wang LG, Han Y, He QY. clusterProfiler: an R package for comparing biological themes among gene clusters. Omics. (2012) 16:284–7. doi: 10.1089/omi.2011.0118
47. Eklund A. beeswarm: the beeSwarm plot, an alternative to stripchart (2016). Available online at: https://CRAN.R-project.org/package=beeswarm.
48. Plink_Software. PLINK software package. Available online at: https://zzz.bwh.harvard.edu/plink/.
49. Genomestudio. GenomeStudio software. Available online at: https://www.illumina.com/techniques/microarrays/array-data-analysis-experimental-design/genomestudio.html.
50. R_Core_Team. R: A language and environment for statistical computing. Vienna, Austria: R Foundation for Statistical Computing (2014). Available at: http://www.R-project.org/.
51. Matrixeqtl. MatrixEQTL R package. Available online at: http://www.bios.unc.edu/research/genomic_software/Matrix_eQTL/.
52. Turner. qqman: an R package for visualizing GWAS results using Q-Q and manhattan plots. J Open Source Software. (2018) 3:25. doi: 10.21105/joss.00731
53. Geo. GEO expression database. Available online at: https://www.ncbi.nlm.nih.gov/geo/.
54. Edgar R, Domrachev M, Lash AE. Gene Expression Omnibus: NCBI gene expression and hybridization array data repository. Nucleic Acids Res. (2002) 30:207–10. doi: 10.1093/nar/30.1.207
55. Barrett T, Wilhite SE, Ledoux P, Evangelista C, Kim IF, Tomashevsky M, et al. NCBI GEO: archive for functional genomics data sets–update. Nucleic Acids Res. (2013) 41:D991–995.
56. Figshare. Available online at: https://figshare.com/.
57. Gao J, Wei J, Qin S, Liu S, Mo S, Long Q, et al. Exploring the global immune landscape of peripheral blood mononuclear cells in H5N6-infected patient with single-cell transcriptomics. BMC Med Genomics. (2023) 16:249. doi: 10.1186/s12920-023-01693-7
58. Genecards. Available online at: https://www.genecards.org/.
59. Liu S, Huang Z, Deng X, Zou X, Li H, Mu S, et al. Identification of key candidate biomarkers for severe influenza infection by integrated bioinformatical analysis and initial clinical validation. J Cell Mol Med. (2021) 25:1725–38. doi: 10.1111/jcmm.16275
60. Dawson TC, Beck MA, Kuziel WA, Henderson F, Maeda N. Contrasting effects of CCR5 and CCR2 deficiency in the pulmonary inflammatory response to influenza A virus. Am J Pathol. (2000) 156:1951–9. doi: 10.1016/S0002-9440(10)65068-7
61. Rodriguez PC, Quiceno DG, Ochoa AC. L-arginine availability regulates T-lymphocyte cell-cycle progression. Blood. (2007) 109:1568–73. doi: 10.1182/blood-2006-06-031856
62. Pesce JT, Ramalingam TR, Mentink-Kane MM, Wilson MS, El Kasmi KC, Smith AM, et al. Arginase-1-expressing macrophages suppress Th2 cytokine-driven inflammation and fibrosis. PloS Pathog. (2009) 5:e1000371. doi: 10.1371/journal.ppat.1000371
63. Burrack KS, Morrison TE. The role of myeloid cell activation and arginine metabolism in the pathogenesis of virus-induced diseases. Front Immunol. (2014) 5:428. doi: 10.3389/fimmu.2014.00428
64. West EE, Merle NS, Kamiński MM, Palacios G, Kumar D, Wang L, et al. Loss of CD4(+) T cell-intrinsic arginase 1 accelerates Th1 response kinetics and reduces lung pathology during influenza infection. Immunity. (2023) 56:2036–2053.e2012. doi: 10.1016/j.immuni.2023.07.014
65. Hofer TP, Frankenberger M, Mages J, Lang R, Meyer P, Hoffmann R, et al. Tissue-specific induction of ADAMTS2 in monocytes and macrophages by glucocorticoids. J Mol Med (Berl). (2008) 86:323–32. doi: 10.1007/s00109-007-0284-0
66. Bekhouche M, Leduc C, Dupont L, Janssen L, Delolme F, Vadon-Le Goff S, et al. Determination of the substrate repertoire of ADAMTS2, 3, and 14 significantly broadens their functions and identifies extracellular matrix organization and TGF-β signaling as primary targets. FASEB J. (2016) 30:1741–56. doi: 10.1096/fj.15-279869
67. Etich J, Koch M, Wagener R, Zaucke F, Fabri M, Brachvogel B. Gene expression profiling of the extracellular matrix signature in macrophages of different activation status: relevance for skin wound healing. Int J Mol Sci. (2019) 20. doi: 10.3390/ijms20205086
68. Kanno T, Nakajima T, Yokoyama S, Asou HK, Sasamoto S, Kamii Y, et al. SCD2-mediated monounsaturated fatty acid metabolism regulates cGAS-STING-dependent type I IFN responses in CD4(+) T cells. Commun Biol. (2021) 4:820. doi: 10.1038/s42003-021-02310-y
69. Wang Y, Abe JI, Chau KM, Wang Y, Vu HT, Reddy Velatooru L, et al. MAGI1 inhibits interferon signaling to promote influenza A infection. Front Cardiovasc Med. (2022) 9:791143. doi: 10.3389/fcvm.2022.791143
70. Taura M, Frank JA, Takahashi T, Kong Y, Kudo E, Song E, et al. APOBEC3A regulates transcription from interferon-stimulated response elements. Proc Natl Acad Sci USA. (2022) 119:e2011665119. doi: 10.1073/pnas.2011665119
71. Zhang K, Chen F, Shen HY, Zhang PP, Gao H, Peng H, et al. Regulatory variants of APOBEC3 genes potentially associate with COVID-19 severity in populations with African ancestry. Sci Rep. (2023) 13:22435. doi: 10.1038/s41598-023-49791-x
72. Markovic S, Rodic A, Salom I, Milicevic O, Djordjevic M, Djordjevic M. COVID-19 severity determinants inferred through ecological and epidemiological modeling. One Health. (2021) 13:100355. doi: 10.1016/j.onehlt.2021.100355
Keywords: influenza, human, transcriptome, genotype, DEGs, QTLs
Citation: Schughart K, Smith AM, Tsalik EL, Threlkeld SC, Sellers S, Fischer WA II, Schreiber J, Lücke E, Cornberg M, Debarry J, Woods CW, McClain MT and Heise M (2024) Host response to influenza infections in human blood: association of influenza severity with host genetics and transcriptomic response. Front. Immunol. 15:1385362. doi: 10.3389/fimmu.2024.1385362
Received: 20 February 2024; Accepted: 24 July 2024;
Published: 13 August 2024.
Edited by:
Jagadeesh Bayry, Indian Institute of Technology Palakkad, IndiaReviewed by:
Mohan Maddur, Pfizer, United StatesKejun Guo, University of Colorado Anschutz Medical Campus, United States
Copyright © 2024 Schughart, Smith, Tsalik, Threlkeld, Sellers, Fischer, Schreiber, Lücke, Cornberg, Debarry, Woods, McClain and Heise. This is an open-access article distributed under the terms of the Creative Commons Attribution License (CC BY). The use, distribution or reproduction in other forums is permitted, provided the original author(s) and the copyright owner(s) are credited and that the original publication in this journal is cited, in accordance with accepted academic practice. No use, distribution or reproduction is permitted which does not comply with these terms.
*Correspondence: Klaus Schughart, bGFic2NodWdoYXJ0QG9ubGluZS5kZQ==