 Yunyan Ye
 Lei Dai2
 Zhangxing Xu
- 1Department of Ophthalmology, Li Huili Hospital Affiliated with Ningbo University, Ningbo, China
- 2Department of Hepato-Pancreato-Biliary Surgery, Li Huili Hospital Affiliated with Ningbo University, Ningbo, China
Purpose: This article explored the causal relationship between immune cells and diabetic retinopathy (DR) using single nucleotide polymorphisms (SNPs) as an instrumental variable and Mendelian randomization (MR).
Methods: Statistical data were collected from a publicly available genome-wide association study (GWAS), and SNPs that were significantly associated with immune cells were used as instrumental variables (IVs). Inverse variance weighted (IVW) and MR−Egger regression were used for MR analysis. A sensitivity analysis was used to test the heterogeneity, horizontal pleiotropy, and stability of the results.
Results: We investigated the causal relationship between 731 immune cells and DR risk. All the GWAS data were obtained from European populations and from men and women. The IVW analysis revealed that HLA DR on CD14+ CD16- monocytes, HLA DR on CD14+ monocytes, HLA DR on CD33-HLA DR+, HLA DR on CD33+ HLA DR+ CD14- on CD33+ HLA DR+ CD14dim, and HLA DR on myeloid dendritic cells may increase the risk of DR (P<0.05). HLA DR to CD14-CD16- cells, the monocytic myeloid-derived suppressor cell absolute count, the SSC-A count of CD4+ T cells, and terminally differentiated CD4+ T cells may be protective factors against DR (P<0.05). The sensitivity analysis indicated no heterogeneity or pleiotropy among the selected SNPs. Furthermore, gene annotation of the SNPs revealed significant associations with 10 genes related to the risk of developing PDR and potential connections with 12 other genes related to PDR.
Conclusion: Monocytes and T cells may serve as new biomarkers or therapeutic targets, leading to the development of new treatment options for managing DR.
1 Background
Diabetic retinopathy (DR) is one of the most common microvascular complications of diabetes and affects 30% to 50% of diabetic patients. DR can progress to proliferative diabetic retinopathy (PDR) when the severity of ischemia increases, leading to neovascularization, fibroplasia, and retinal detachment, which are the leading causes of blindness and visual impairment in diabetic individuals. Diabetes is expected to affect 415 million people worldwide by 2024, more than one-third of whom suffer from DR, making it a serious global health issue (1, 2). Current DR treatment mostly focuses on regulating blood sugar, blood pressure, and lipid levels to slow down the disease and lower the risk of DR; however, there is still a high number of diabetes patients who develop PDR (3, 4). Early detection and diagnosis of DR, as well as systematic therapy, can prevent persistent vision loss; however, diagnosis and treatment of DR are often delayed due to a lack of resources for early DR screening (5). As a result, identifying more precise and sensitive biomarkers is critical for facilitating early detection of DR and understanding its pathophysiology (6).
Immune cells play a crucial role in the onset and progression of DR. In DR, there is frequent and persistent white blood cell adhesion to the vascular wall, which may result in capillary occlusion and retinal ischemia (7). They also play an important role in the pathogenesis of late PDR and can contribute to neovascularization, vitreous hemorrhage, and traction retinal detachment (8). A recent prospective study demonstrated that the number of circulating neutrophils increases while the number of T cells decreases during the initial stages and progression of DR (9). However, previous research on the pathophysiology of DR mostly relies on association analysis of observational cohorts, which cannot achieve causal association inference. Furthermore, the causal relationships between various immune cells and DR have not been investigated; therefore, there is limited existing evidence regarding immune cell types related to DR and their causal associations.
Mendelian randomization (MR) is a popular causal inference method in which the genetic variation associated with exposure is employed as an instrumental variable (IV) for assessing the causal effect of exposure on outcomes. It remains unaffected by common complicating variables such as acquired environment, life behavior, and habits, allowing it to minimize the reverse causal effect while maintaining maximum validity (10). Compared to traditional randomized controlled trials and observational research, MR can significantly reduce expenses and shorten study periods. It is widely employed in studies investigating the causal association of complex disorders, and the genome-wide association study (GWAS) dataset is expanding rapidly. These findings also provide a solid foundation for further MR research. With the advent of big data, the growth of epidemiological methodologies, and the demand for precision medicine, the application of MR for etiology mining will emerge as a new area of future research (11).
At present, no studies have been conducted to properly investigate the causal relationship between immune cells and DR using MR. Further investigation and study are required for diabetes. In this study, MR analysis was performed to investigate the causal relationship between immune cells and DR.
2 Methods
2.1 Study design
We used MR analysis to evaluate the causal relationship between 731 immune cells and DR. In this study, immune cells were used as exposure factors and represented by X, whereas single nucleotide polymorphisms (SNPs) that were strongly linked with X were used as instrumental variables (IVs). The outcome variable was diabetic retinopathy. Figure 1 depicts a schematic view of the study design, as well as the three essential MR assumptions (12).
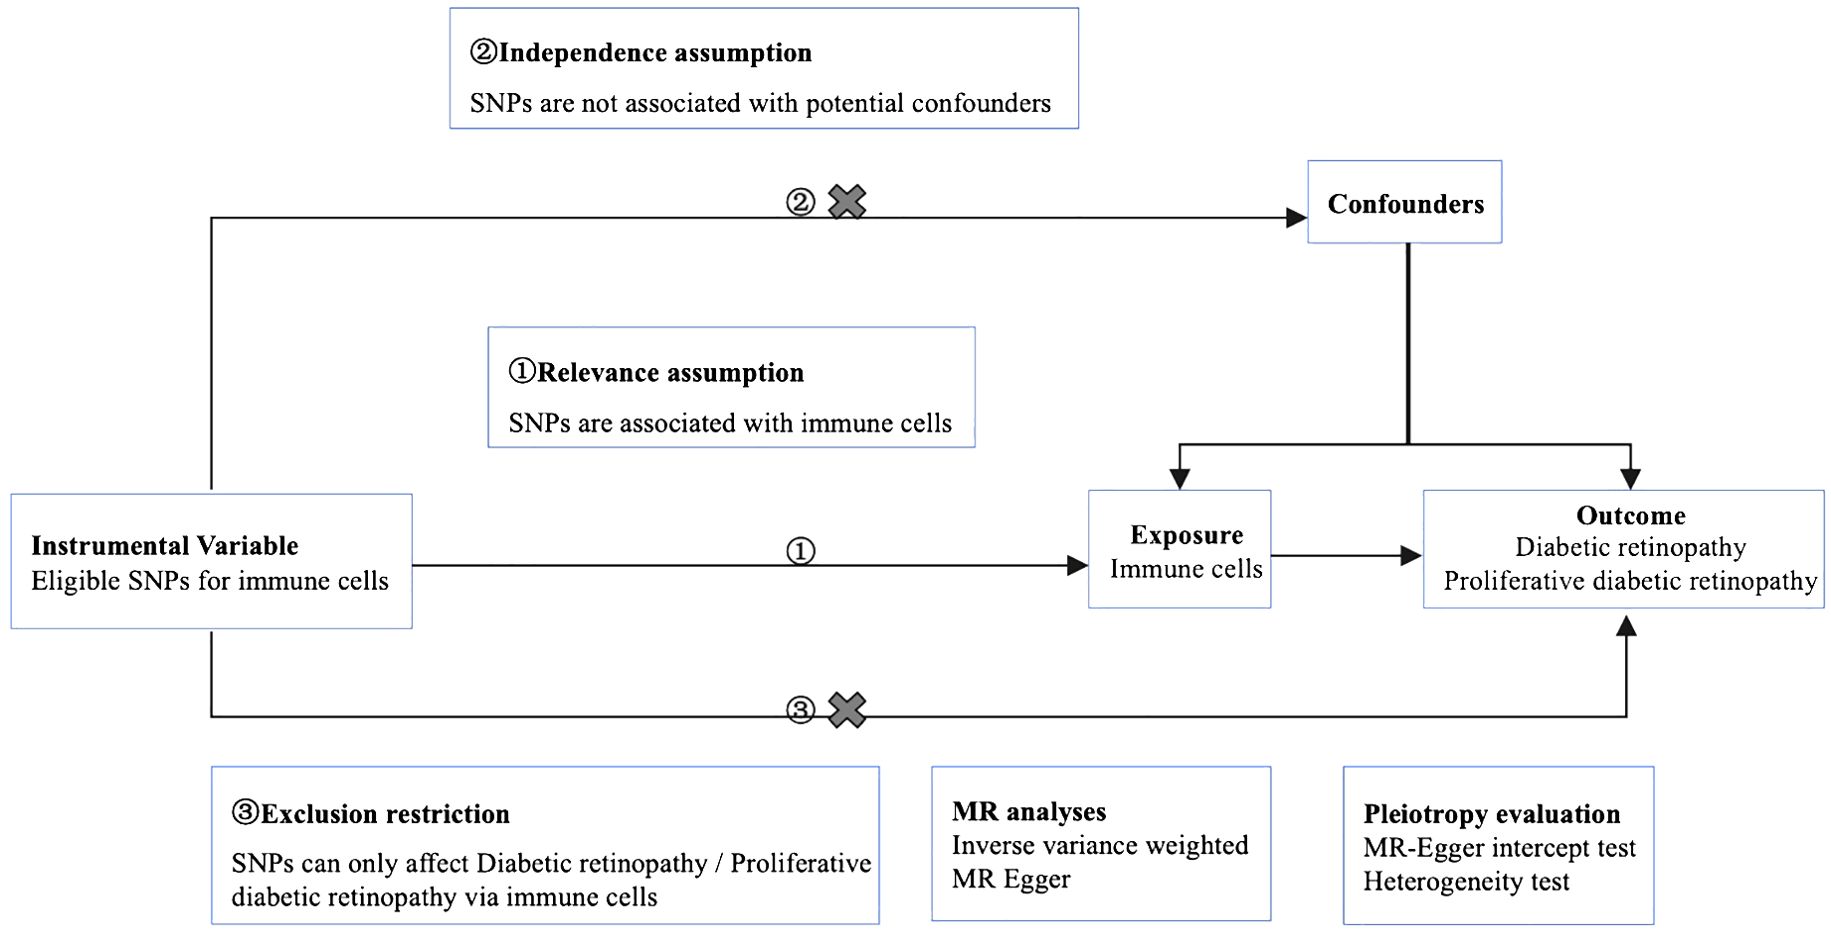
Figure 1. Mendelian randomization diagram of the association of immune cells with diabetic retinopathy. ① The genotype must be associated with the exposure to be studied. ② Genotypes must be independent of confounding factors. ③ Genotype is only associated with outcome by influencing the exposure factors to be studied.
2.2 Data source
The analysis was conducted using published summary statistics from the International Working Unit (IEU) Open GWAS project (https://gwas.mrcieu.ac.uk/), and it included 731 immune cells, two DR datasets (Finn-b-DM_RETINOPATHY and finn-b-H7_RETINOPATHYDIAB), and two PDR datasets (finn-b-DM_RETINA_PROLIF and finn-b-H7_RETINOPATHYDIAB_PROLIF). Validation was performed using the datasets finn-b-H7_RETINOPATHYDIAB and finn-b-H7_RETINOPATHYDIAB_PROLIF. The study was conducted on European individuals, including both men and women, and the summary data are provided in Table 1. The current analysis did not require ethics approval because all of the included GWASs received ethical review board approval and informed consent, as indicated in their individual original manuscripts.

Table 1. Detailed information of datasets.
2.3 Selection and validation of SNPs
The selected SNPs were related to immune cells at a genome-wide significance threshold of p < 1×10⁻⁵. Second, pairwise linkage disequilibrium was used to assess the independence of the selected SNPs. When r2 > 0.001 (clumping window of 10,000 kb) was reached, the SNP that correlated with more SNPs or had a higher P-value was removed (Figure 1, ①). Phenoscanner was used to minimize the impact of improper SNPs (Figures 1, ②③). The F-statistic was subsequently used to validate the strength of each SNP. When the F-statistic exceeded 10, SNPs were deemed powerful enough to minimize the effects of potential bias. Furthermore, the SNPs listed above were retrieved from the GWAS summary data of DR and PDR, with a minimum r2 > 0.8. The information from the datasets listed above was summarized (12).
2.4 Mendelian randomization analysis
The causal association study was conducted using inverse variance weighting (IVW) and MR−Egger regression. The discrepancy in intercept terms, as indicated by the intercept of the MR-Egger analysis, revealed horizontal pleiotropy in the study. Cochrane’s Q value and accompanying P-values were used to assess heterogeneity among the selected IVs, with P > 0.05 indicating no heterogeneity. In addition, a leave-one-out (LOO) analysis was performed to observe whether a particular SNP had a disproportionate effect on the overall estimations. Forest plots were used to visualize the MR analysis results, while scatter plots and funnel plots were utilized to assess the stability of the MR data (13, 14).
The statistical power was calculated using an online tool at: http://cnsgenomics.com/shiny/mRnd/ (15). We used the following formula to calculate R2: (2×EAF×(1−EAF)×beta2)/[(2×EAF×(1−EAF)×beta2)+(2×EAF×(1−EAF)×N×SE(beta)2) (16).
2.5 SNP annotation
The SNPs were annotated using online tools (https://biit.cs.ut.ee/gprofiler/snpense). g: SNPense maps a collection of human SNP rs-codes to gene names, along with chromosome positions and expected variant effects. Mapping was allowed only for variations that coincided with at least one protein coding Ensembl gene. All underlying data were extracted from Ensembl variation data.
2.6 Statistical methods
All the statistical analyses were conducted using R 4.1.0 software and R packages. IVW and MR−Egger analyses were performed using the TwoSample MR package (α= 0.05), meta-analysis using the meta package, and a statistically significant difference was indicated by P < 0.05. If the null hypothesis was rejected, random effects IVW was utilized rather than fixed effects IVW (17). Additionally, the Forest Plats package was used to generate forest plots.
3 Results
3.1 Selected SNPs
A total of 6,196 SNPs in the DR and 6,186 in the PDR MR analyses were used, respectively (Supplementary Table 2). We obtained the degree of phenotype overlap from the FinnGen database. Among diabetic retinopathy phenotypes, there is a 57.47% sample overlap between the DM_RETINOPATHY cohort and the H7_retinydiab cohort. In terms of the proliferative diabetic retinopathy phenotype, there is a 25.82% sample overlap between the DM_RETINA_PROLIF cohort and the H7_retinyDIAB_prolif cohort (Supplementary Table Overlap).
3.2 MR analysis results
MR analysis was performed to explore the causal effects of immune cells on DR, and the IVW method was used as the primary analysis. According to MR analysis using the finn-b-DM_RETINOPATHY dataset, IVW analysis revealed that 30 immune cells were significantly associated with DR. In total, 18 immune cells were found to increase the risk of DR; for example, HLA DR was found in CD33+ HLA DR+ CD14- (OR=1.229, 95% CI=1.178-1.283, P<0.001), and HLA DR was found in CD33+ HLA DR+ CD14dim (OR=1.323, 95% CI=1.239-1.413, P<0.001). Furthermore, 12 immune cells, such as HLA-DR on CD14-CD16+ cells (odds ratio (OR)=0.798, 95% CI=0.748-0.852, P<0.001) and on CD4+ T cells (OR=0.477, 95% CI=0.403-0.565, P<0.001), may decrease the risk of DR (Figure 2).
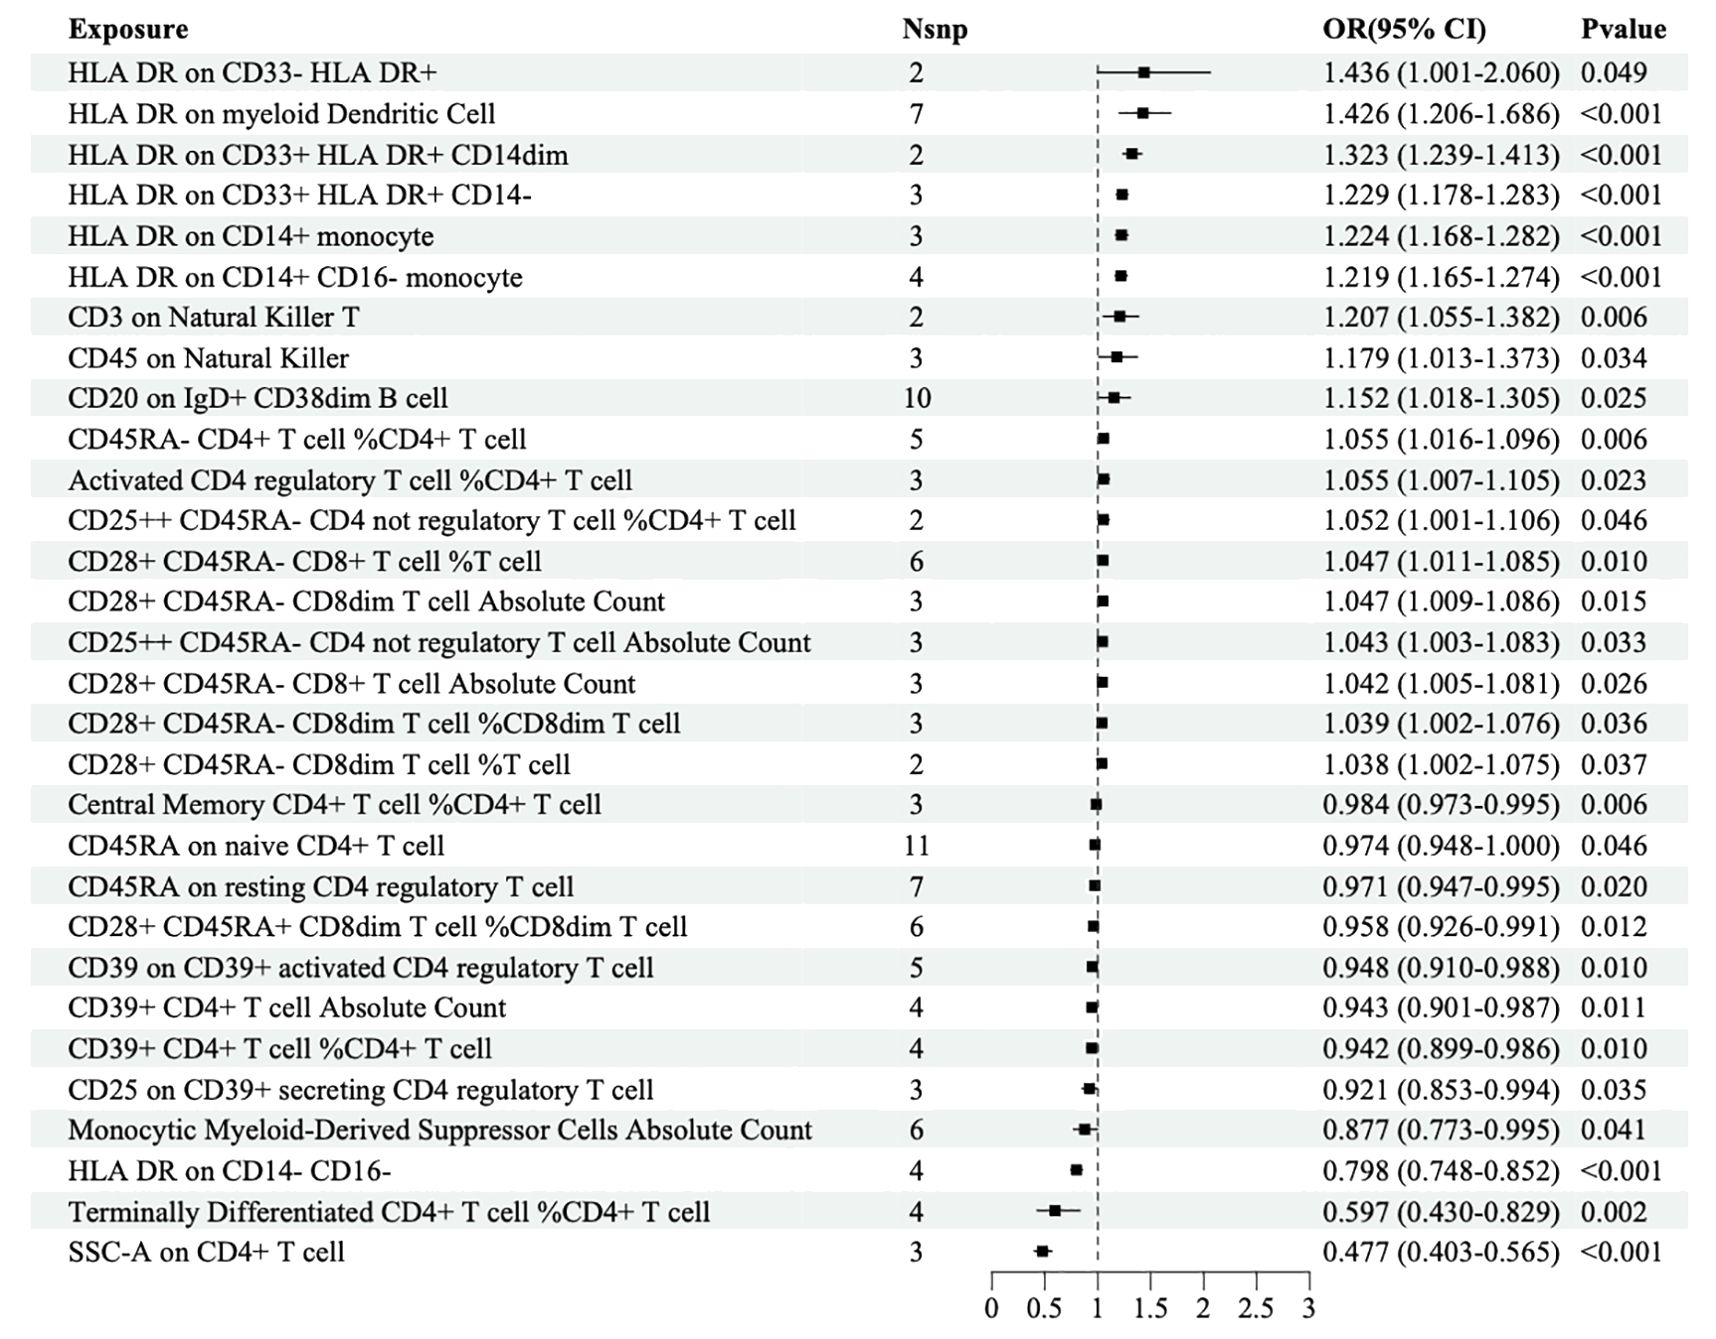
Figure 2. Forest map of MR causal effect between immune cells and DR (finn-b-DM_RETINOPATHY).
The IVW analysis based on the FinN-B-H7_RETINOPATHYDIAB dataset revealed that 36 immune cells were significantly associated with DR. Among these, HLA-DR among CD33+ HLA DR+ CD14- (OR=1.716, 95% CI=1.531-1.924, P<0.001) and HLA-DR among CD33+ HLA DR+ CD14dim (OR=2.240, 95% CI=1.968-2.550, P<0.001) were identified as two of the 15 immune cells that may increase the risk of DR. Additionally, HLA-DR among CD14- CD16- (OR=0.686, 95% CI=0.605-0.778, P<0.001) and SSC-A among CD4+ T cells (OR=0.196, 95% CI=0.136-0.282, P<0.001) were identified as two of the 21 immune cells that may decrease the risk of DR (Figure 3).
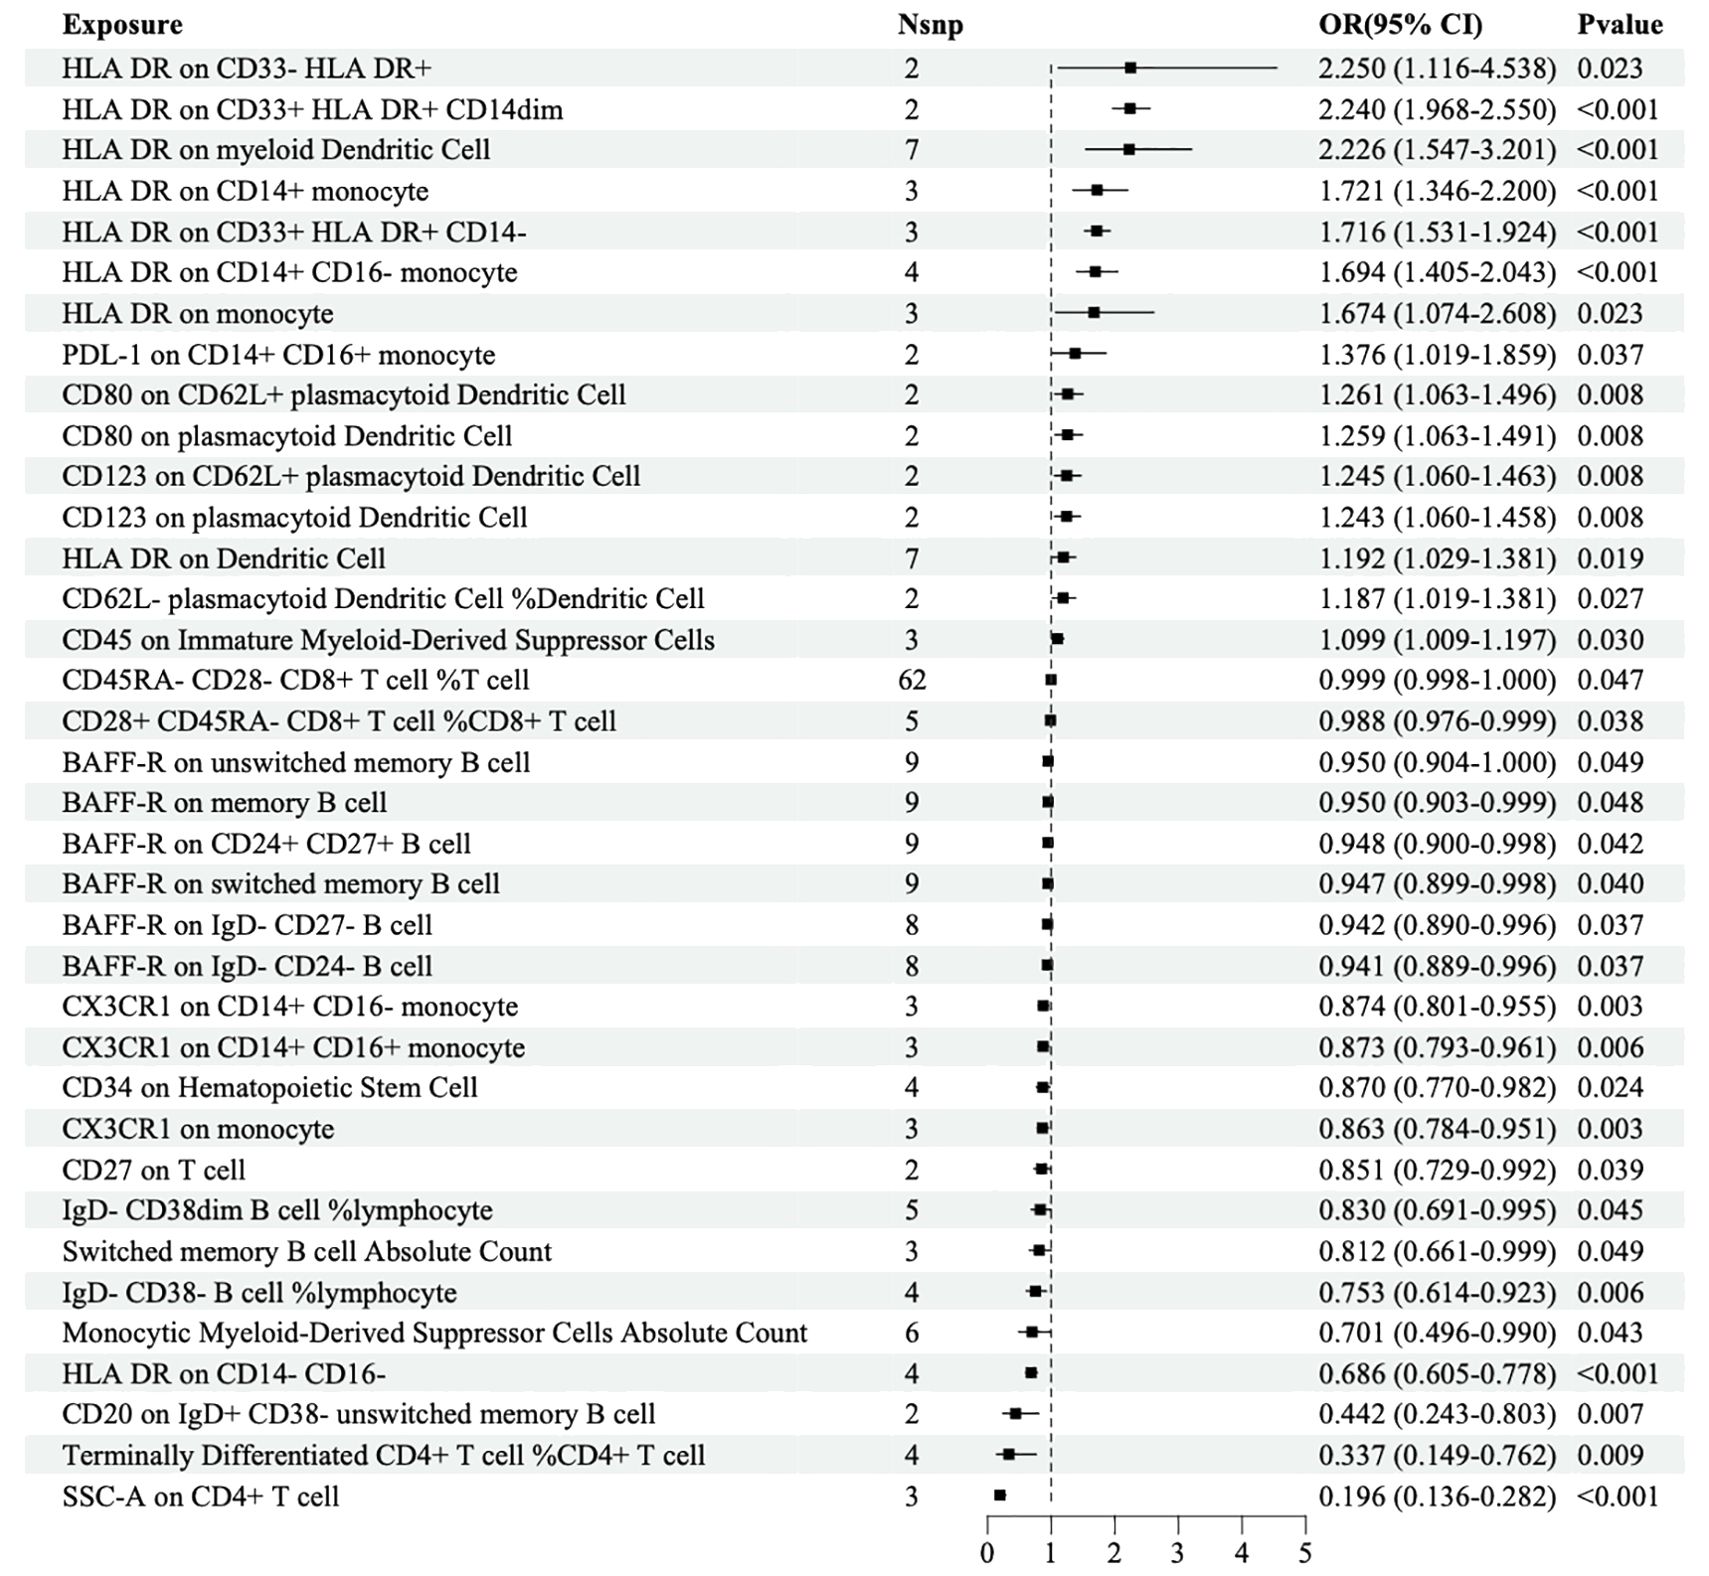
Figure 3. Forest map of MR causal effect between immune cells and DR (finn-b-H7_RETINOPATHYDIAB).
Merged MR analysis results from the FINN-B-H7_RETINYDIAB and FINN-b-DM_RETINOPATHY datasets revealed 10 immune cells. HLA-DR on myeloid dendritic cells, HLA-DR on CD14+ CD16- monocytes, HLA-DR on CD33+ HLA-DR+ CD14-, HLA-DR on CD14+ monocytes, HLA-DR on CD33- HLA-DR+, and HLA-DR on CD33+ HLA-DR+ CD14dim are six immune cells that may be risk factors for DR. Additionally, the following four immune cells may serve as protective factors for DR: monocytic myeloid-derived suppressor cell absolute count, terminally differentiated CD4+ T cell, HLA-DR on CD14- CD16-, and SSC-A on CD4+ T cells (Table 2A).
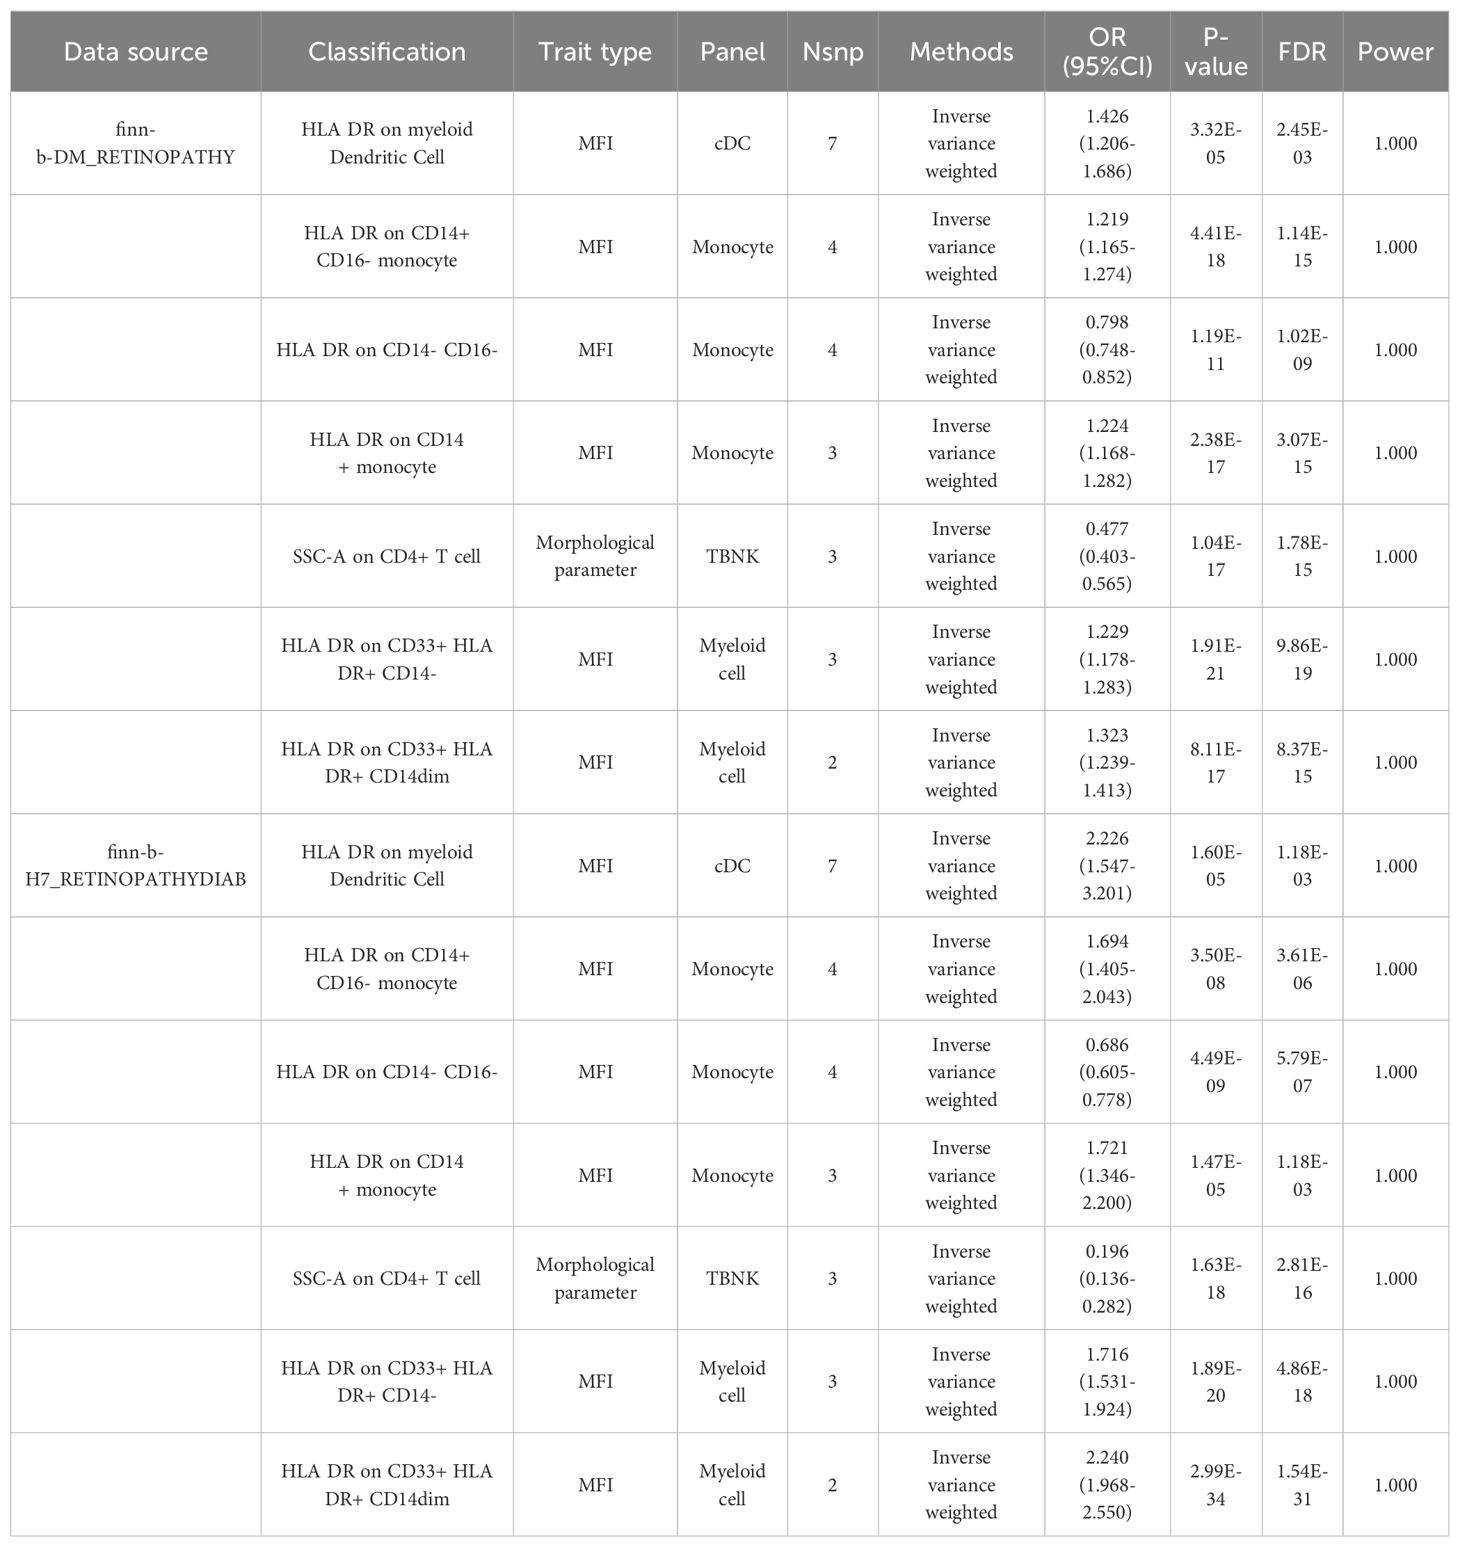
Table 2A. MR results of causal links.
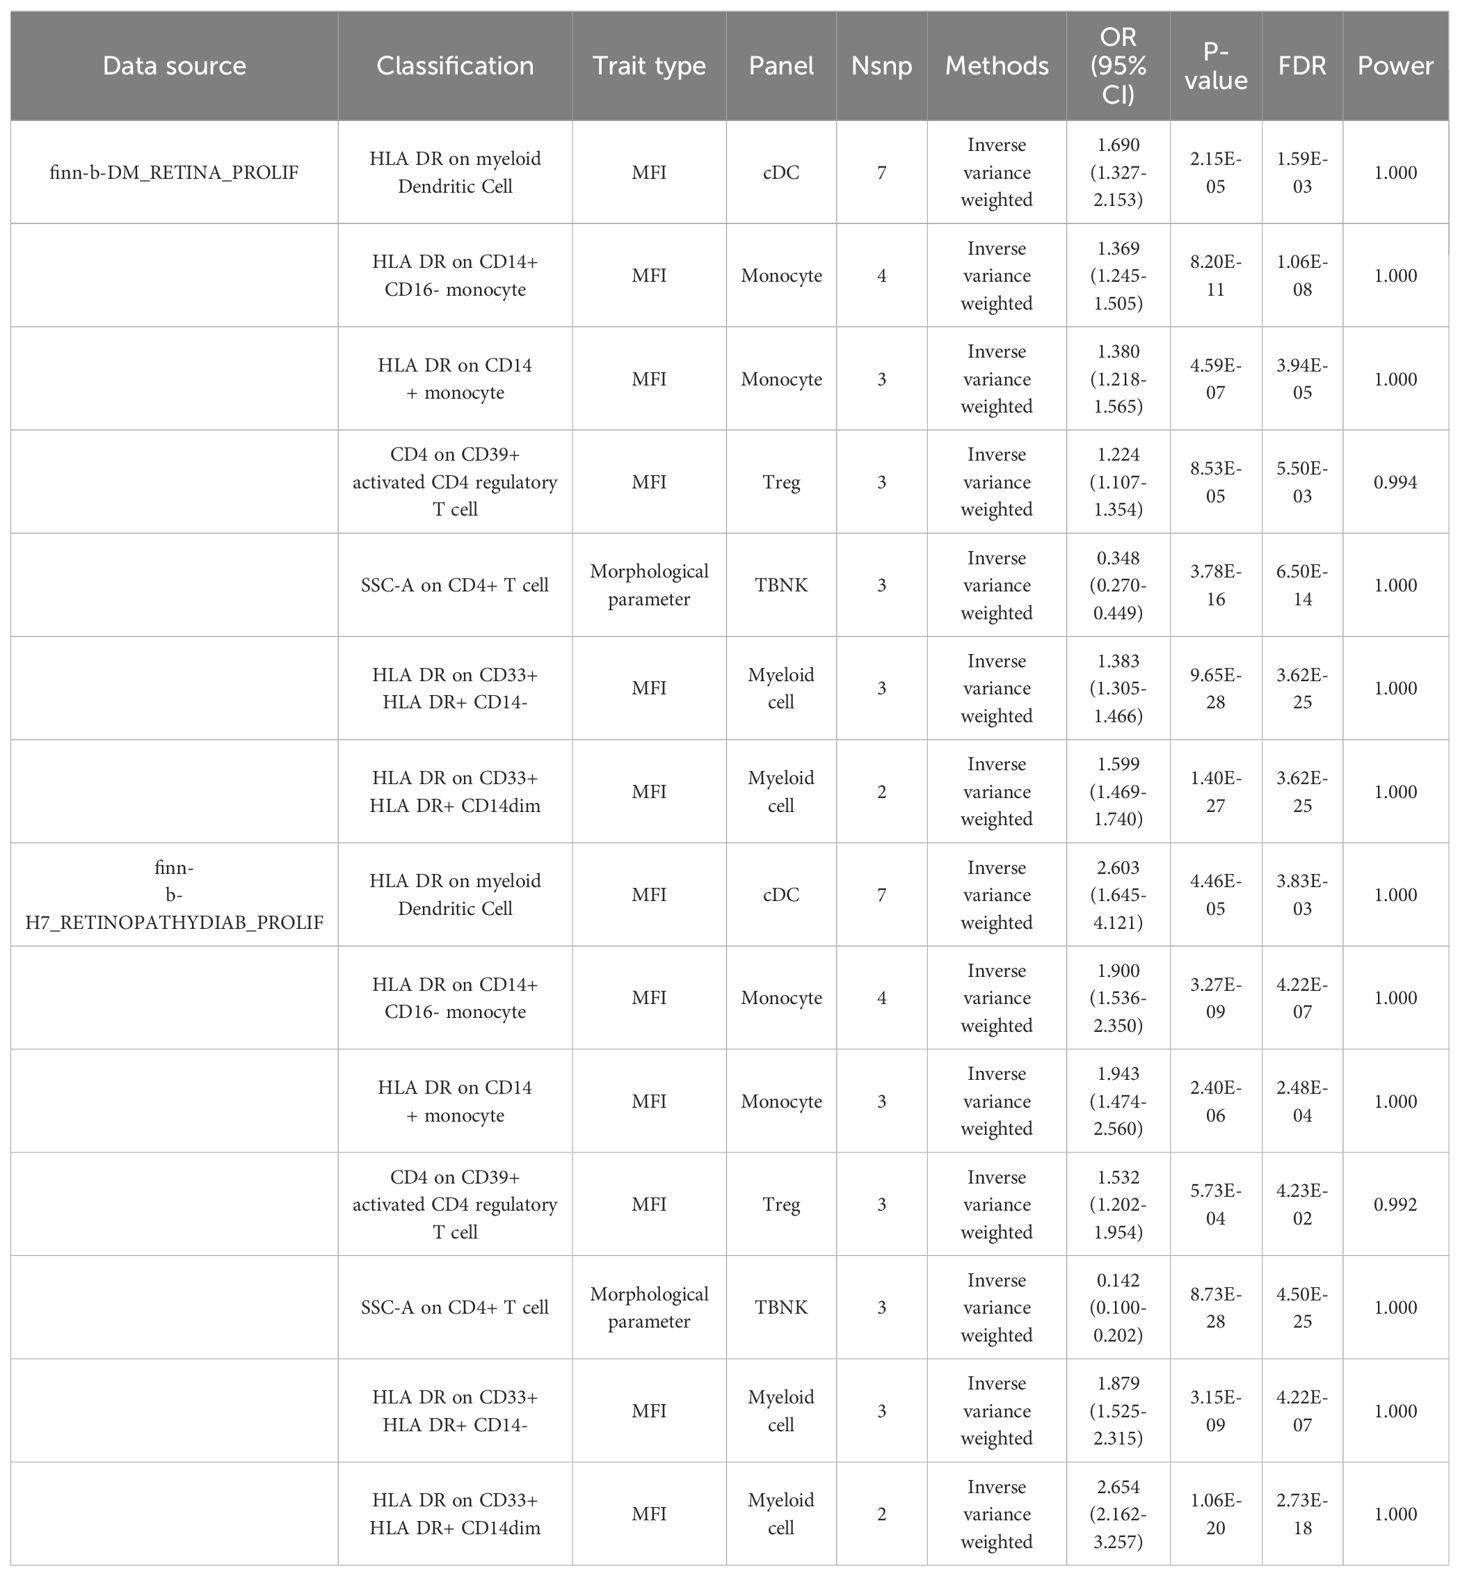
Table 2B. MR results of causal links.
After merging the MR analysis results from the finn-b-DM_RETINA_PROLIF and finn-b-H7_RETINOPATHYDIAB_PROLIF datasets, 10 immune cell types were obtained. These include HLA DR on dendritic cells, HLA DR on myeloid dendritic cells, HLA DR on CD14+ CD16- monocytes, HLA DR on CD33+ HLA DR+ CD14- cells, CD4 on CD39+ activated CD4 regulatory T cells, HLA DR on CD14+ monocytes, HLA DR on CD33+ HLA DR+ CD14dim, and HLA DR on CD33- HLA DR+. These eight immune cell types may be risk factors for DR. The other two immune cell types may act as protective factors for PDR: HLA DR on CD14- CD16- and SSC-A on CD4+ T cells (Table 2B).
3.3 Sensitivity analysis
According to the merging of the two DR datasets, Cochran’s Q P-value revealed no heterogeneity among SNPs in DR and immune cell HLA DR on CD14-CD16- or HLA DR on CD33+ HLA DR+ CD14- or DR (P > 0.05, Table 3A). Furthermore, the MR−Egger intercept ruled out the possibility of horizontal pleiotropy for these associations. The LOO sensitivity analysis revealed that no individual SNP disproportionately affected the overall estimates (Figure 4). Additionally, scatter plots and funnel plots also indicated the stability of the results (Figure 4).
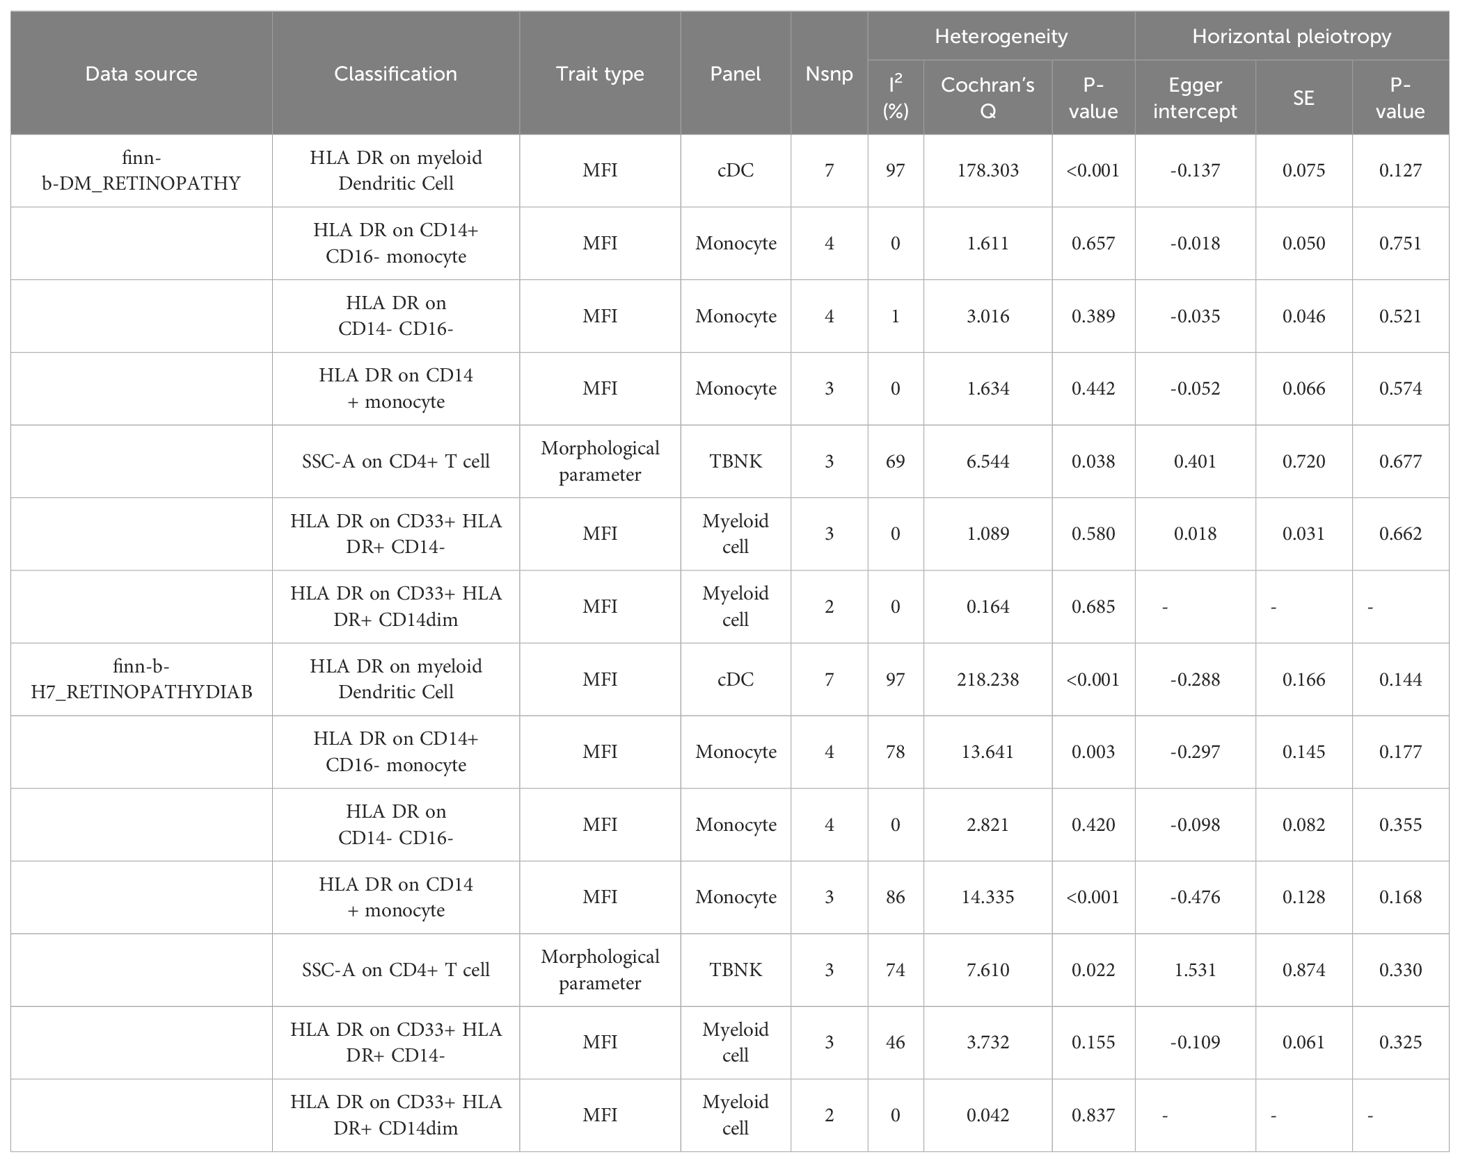
Table 3A. Evaluation of heterogeneity and pleiotropy.
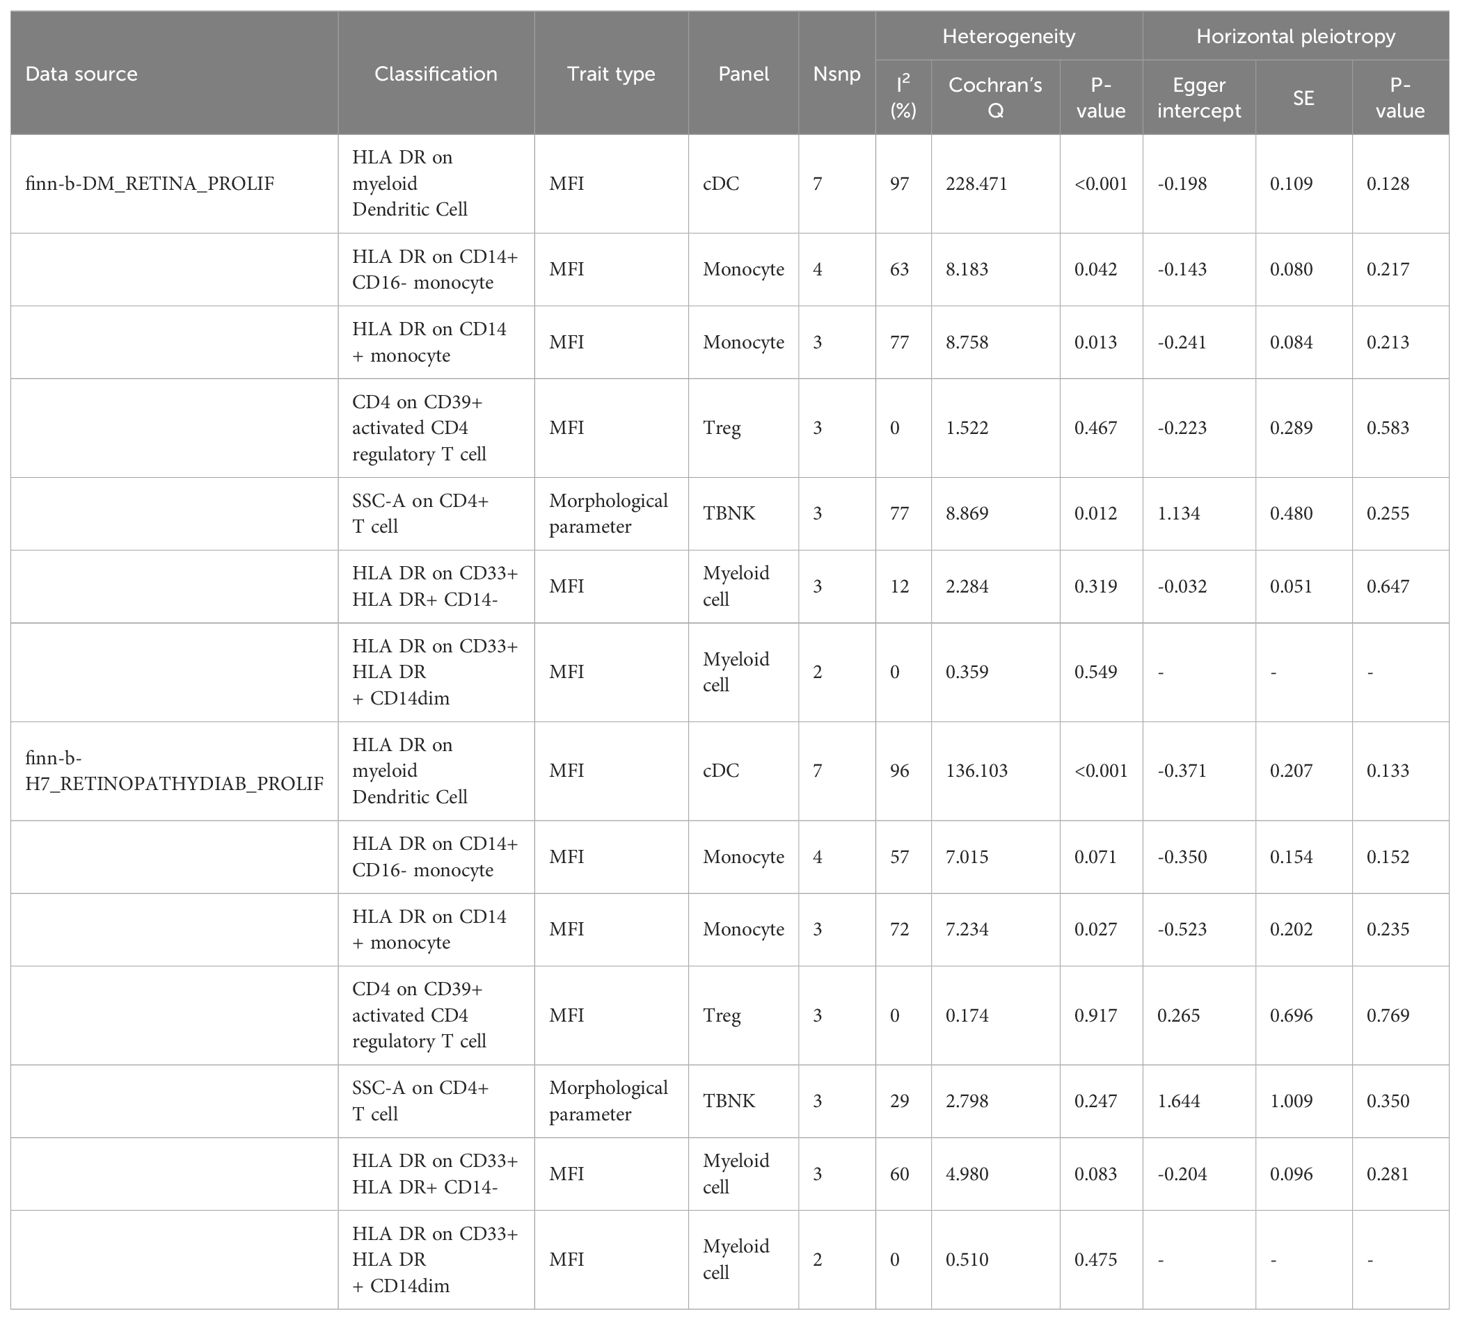
Table 3B. Evaluation of heterogeneity and pleiotropy.
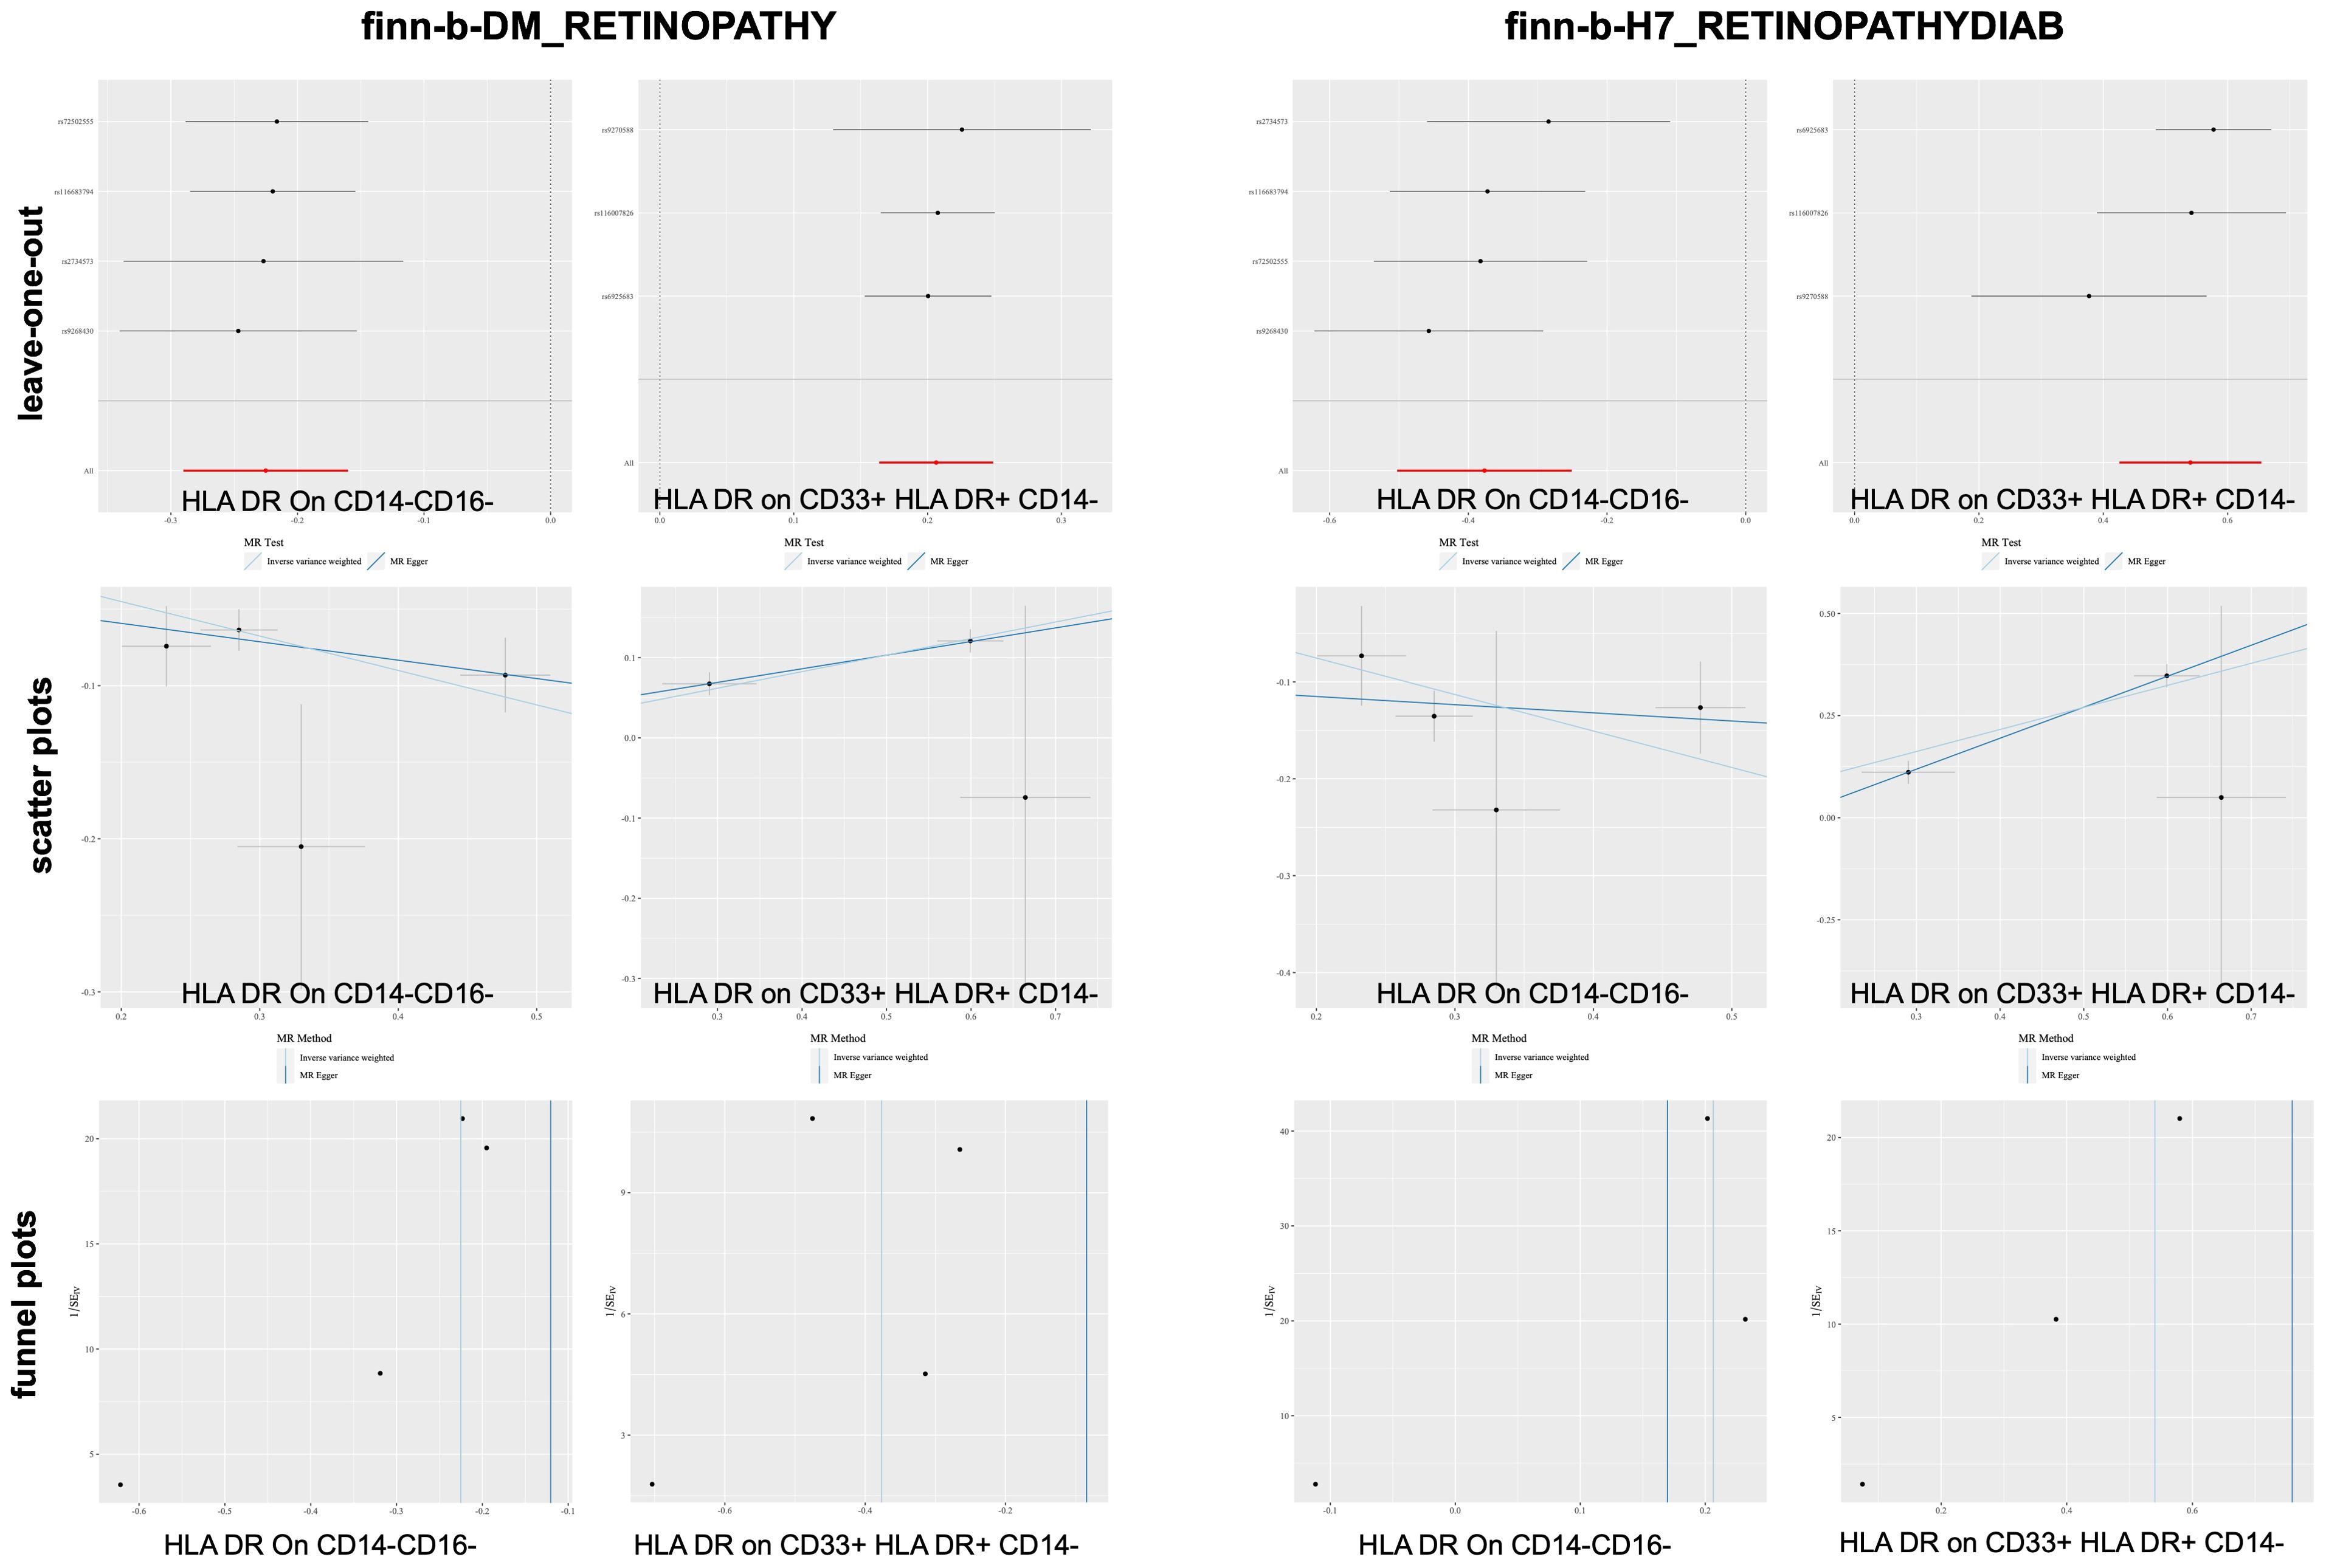
Figure 4. Sensitivity analysis for DR datasets.
After merging the two PDR datasets, we detected no heterogeneity in the Cochran’s Q P- value among the SNPs of PDR and immune CD4+ T cells among the CD39+ activated CD4+ regulatory T cells or HLA DR among the CD33+ HLA DR+ CD14- cells (P > 0.05, Table 3B). Furthermore, the MR−Egger intercept ruled out the possibility of horizontal pleiotropy for these associations. The LOO sensitivity analysis revealed that no individual SNP disproportionately affected the overall estimates (Figure 5). In addition, the scatter plots and funnel plots also indicated the stability of the results (Figure 5).
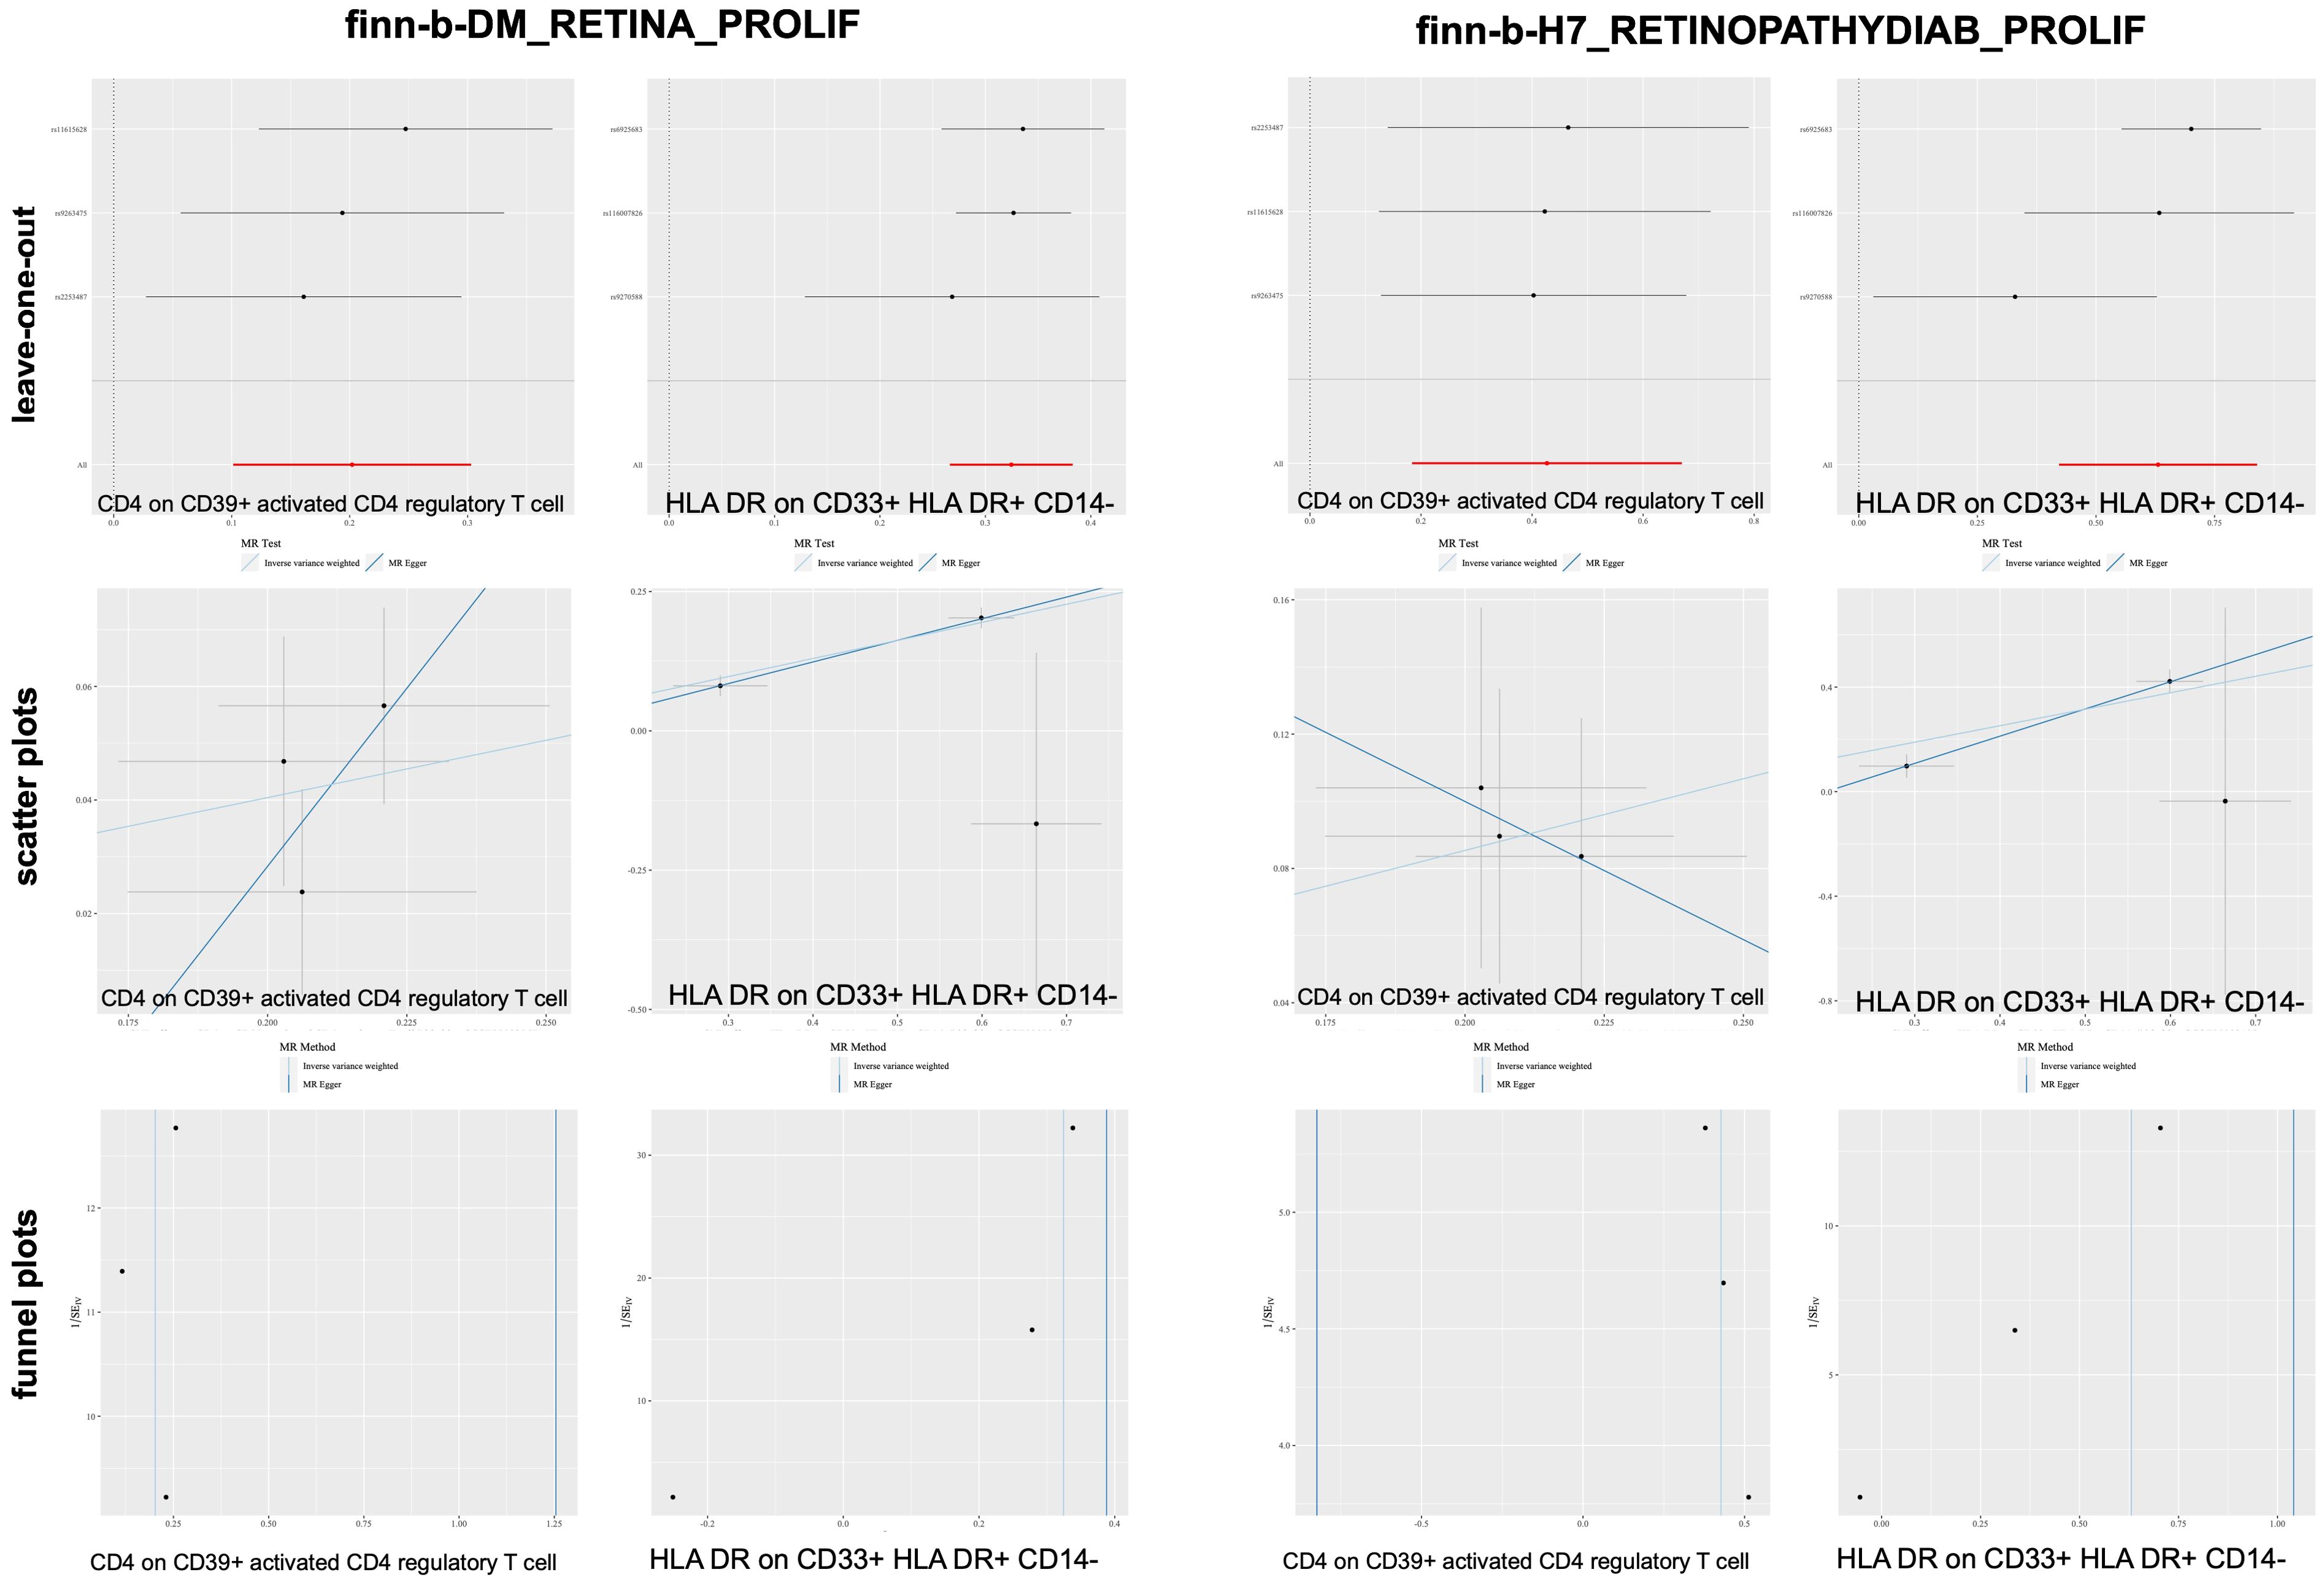
Figure 5. Sensitivity analysis for PDR datasets.
In this study, we obtained seven immune cell features that were causally related to DR and PDR from two datasets. In the power calculations, the power of all the above immune cell features was >0.99, indicating that this study has sufficient statistical power (Table 3; Supplementary Power-1; Supplementary Power-2).
3.4 Meta-analysis
The MR data for immune cells from two DR patient datasets were merged through meta-analysis. If Cochran’s Q P value was <0.05, the random effects model was adopted. We identified six immune cells that have a risk effect on DR, namely, HLA DR on CD14+ CD16- monocytes, HLA DR on CD14+ monocytes, HLA DR on CD33- HLA DR+, HLA DR on CD33+ HLA DR+ CD14-, HLA DR on CD33+ HLA DR+ CD14dim, and HLA DR on myeloid dendritic cells. Additionally, we found four immune cells that have a protective effect against DR including HLA-DR on CD14- CD16-, monocytic myeloid-derived suppressor cell absolute count, and SSC-A on CD4+ T cells and terminally differentiated CD4+ T cells (Supplementary DR-meta).
The MR data for immune cells from two PDR patient datasets were merged through meta-analysis. We identified a risk effect of eight immune cells on PDR, including CD4+ on CD39+ activated CD4 regulatory T cells, HLA DR on CD14+ CD16- monocytes, HLA DR on CD14+ monocytes, HLA DR on CD33- HLA DR+, HLA DR on CD33+ HLA DR+ CD14-, HLA DR on CD33+ HLA DR+ CD14dim, HLA DR on dendritic cells, and HLA DR on myeloid dendritic cells. Additionally, we discovered the protective effects of two immune cell types on DR, namely, HLA DR on CD14- CD16- T cells and SSC-A on CD4+ T cells (Supplementary PDR-meta).
The risk factors associated with the two phenotypes identified from the four datasets included six immune cell types: HLA-DR on CD14+ CD16 monocytes, HLA-DR on CD14+ monocytes, HLA-DR on CD33-HLA-DR+, HLA-DR on CD33+ HLA-DR+ CD14-, HLA-DR on CD33+ HLA-DR+ CD14dim, and HLA-DR on myeloid dendritic cells. Among the two phenotypes identified from the four datasets, HLA-DR to CD14-CD16- and SSC-A to CD4+ T cells were protective factors. Figure 6 shows the HLA-DR on CD33+ cells, HLA-DR+CD14- cells, and HLA-DR on CD14-CD16- cells.
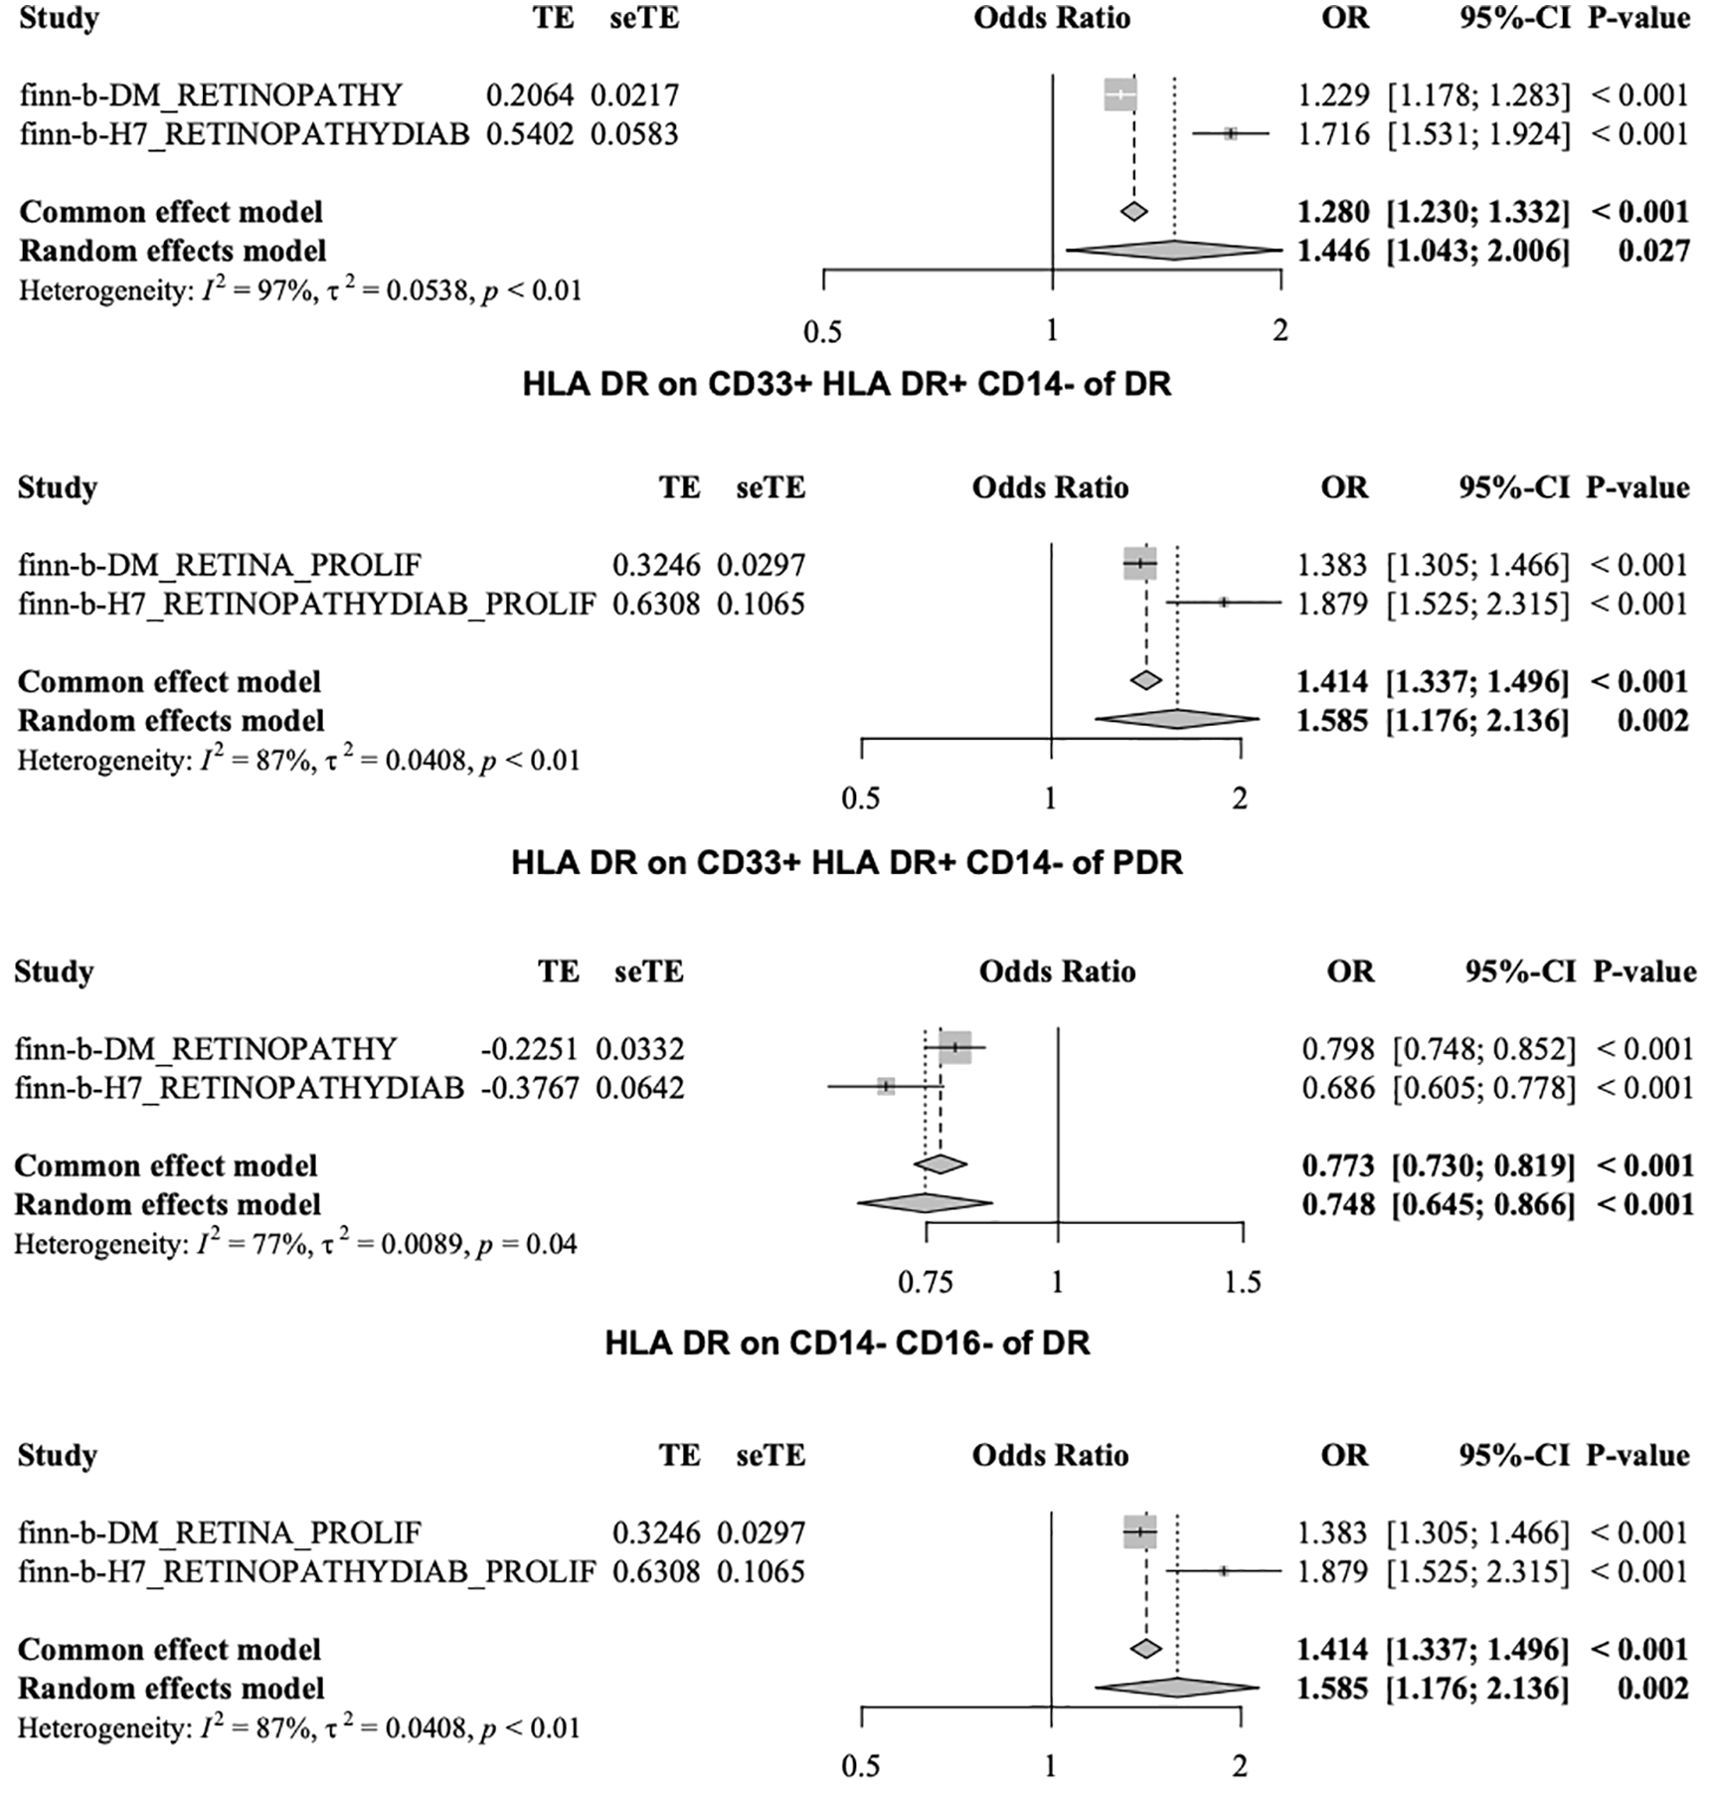
Figure 6. Results of meta-analysis.
3.5 SNP annotation
Immune cell SNPs strongly associated with DR were annotated, and 10 genes potentially connected with PDR were identified. HLA-DPA1, CD33, HLA-DOB, and NEK7 may serve as protective factors for DR, while TSBP1-AS1, LYZ, ENSG00000233183, MICB, GABBR1, and FCGR3A may act as risk factors for DR (Table 4A).
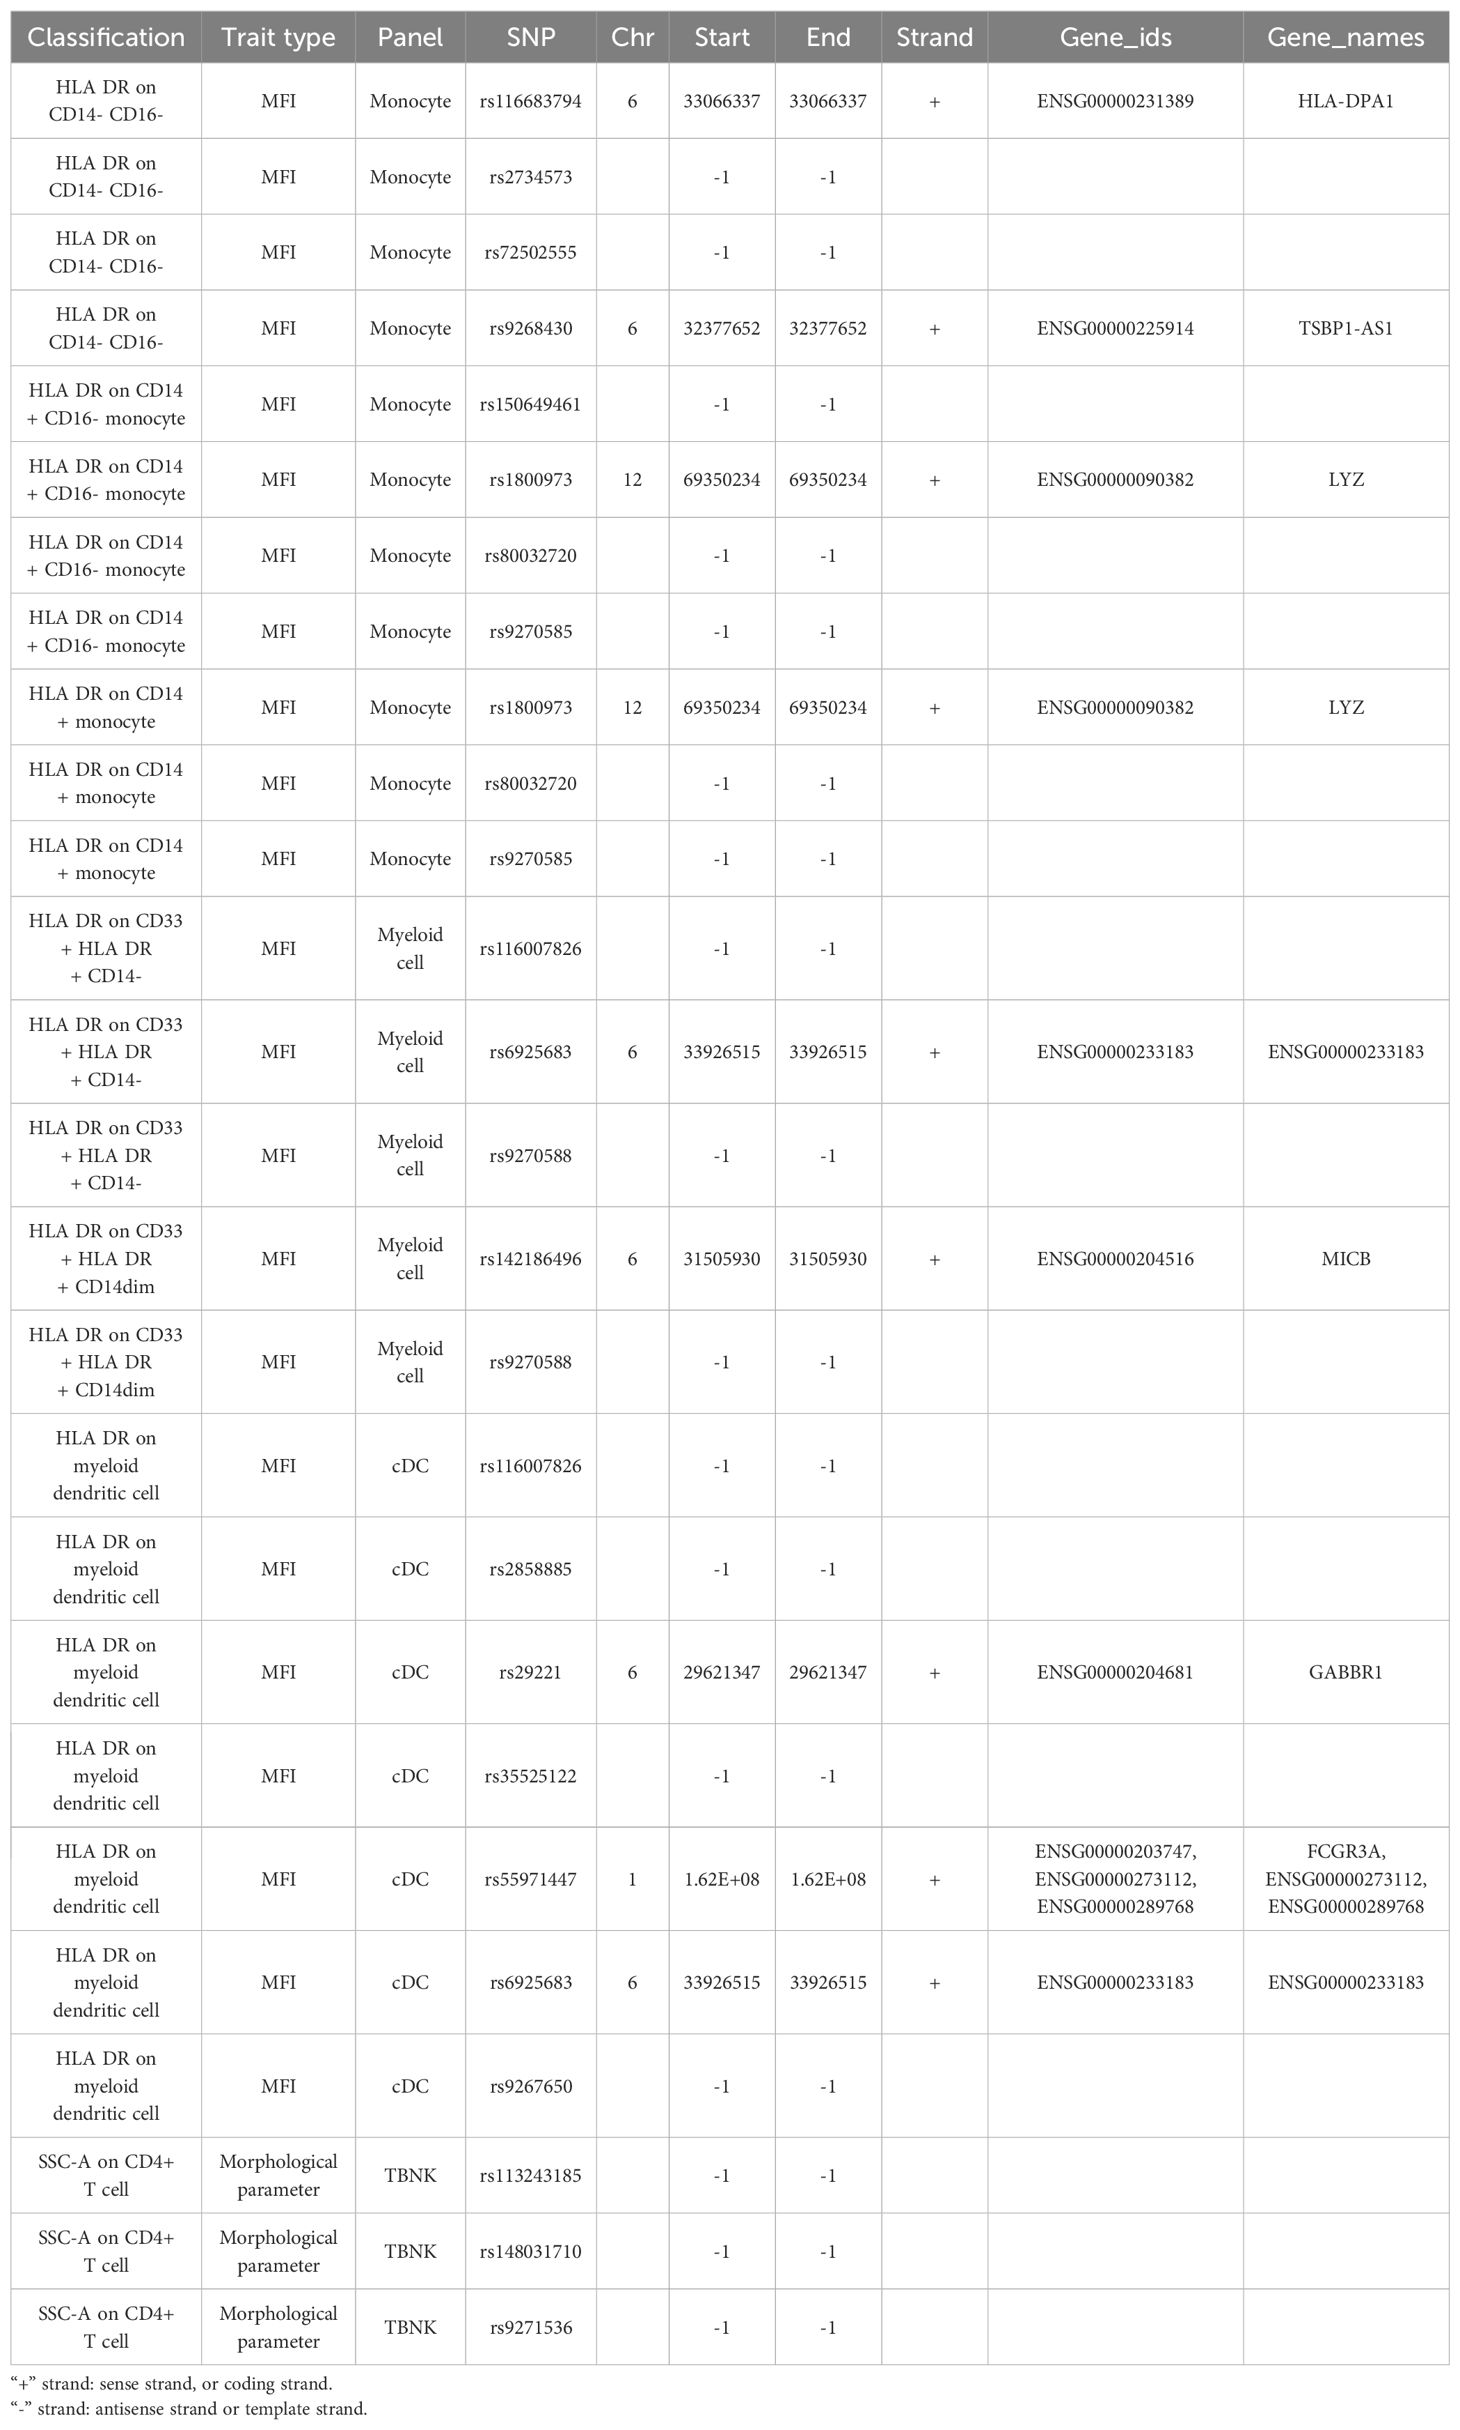
Table 4A. SNP annotation.
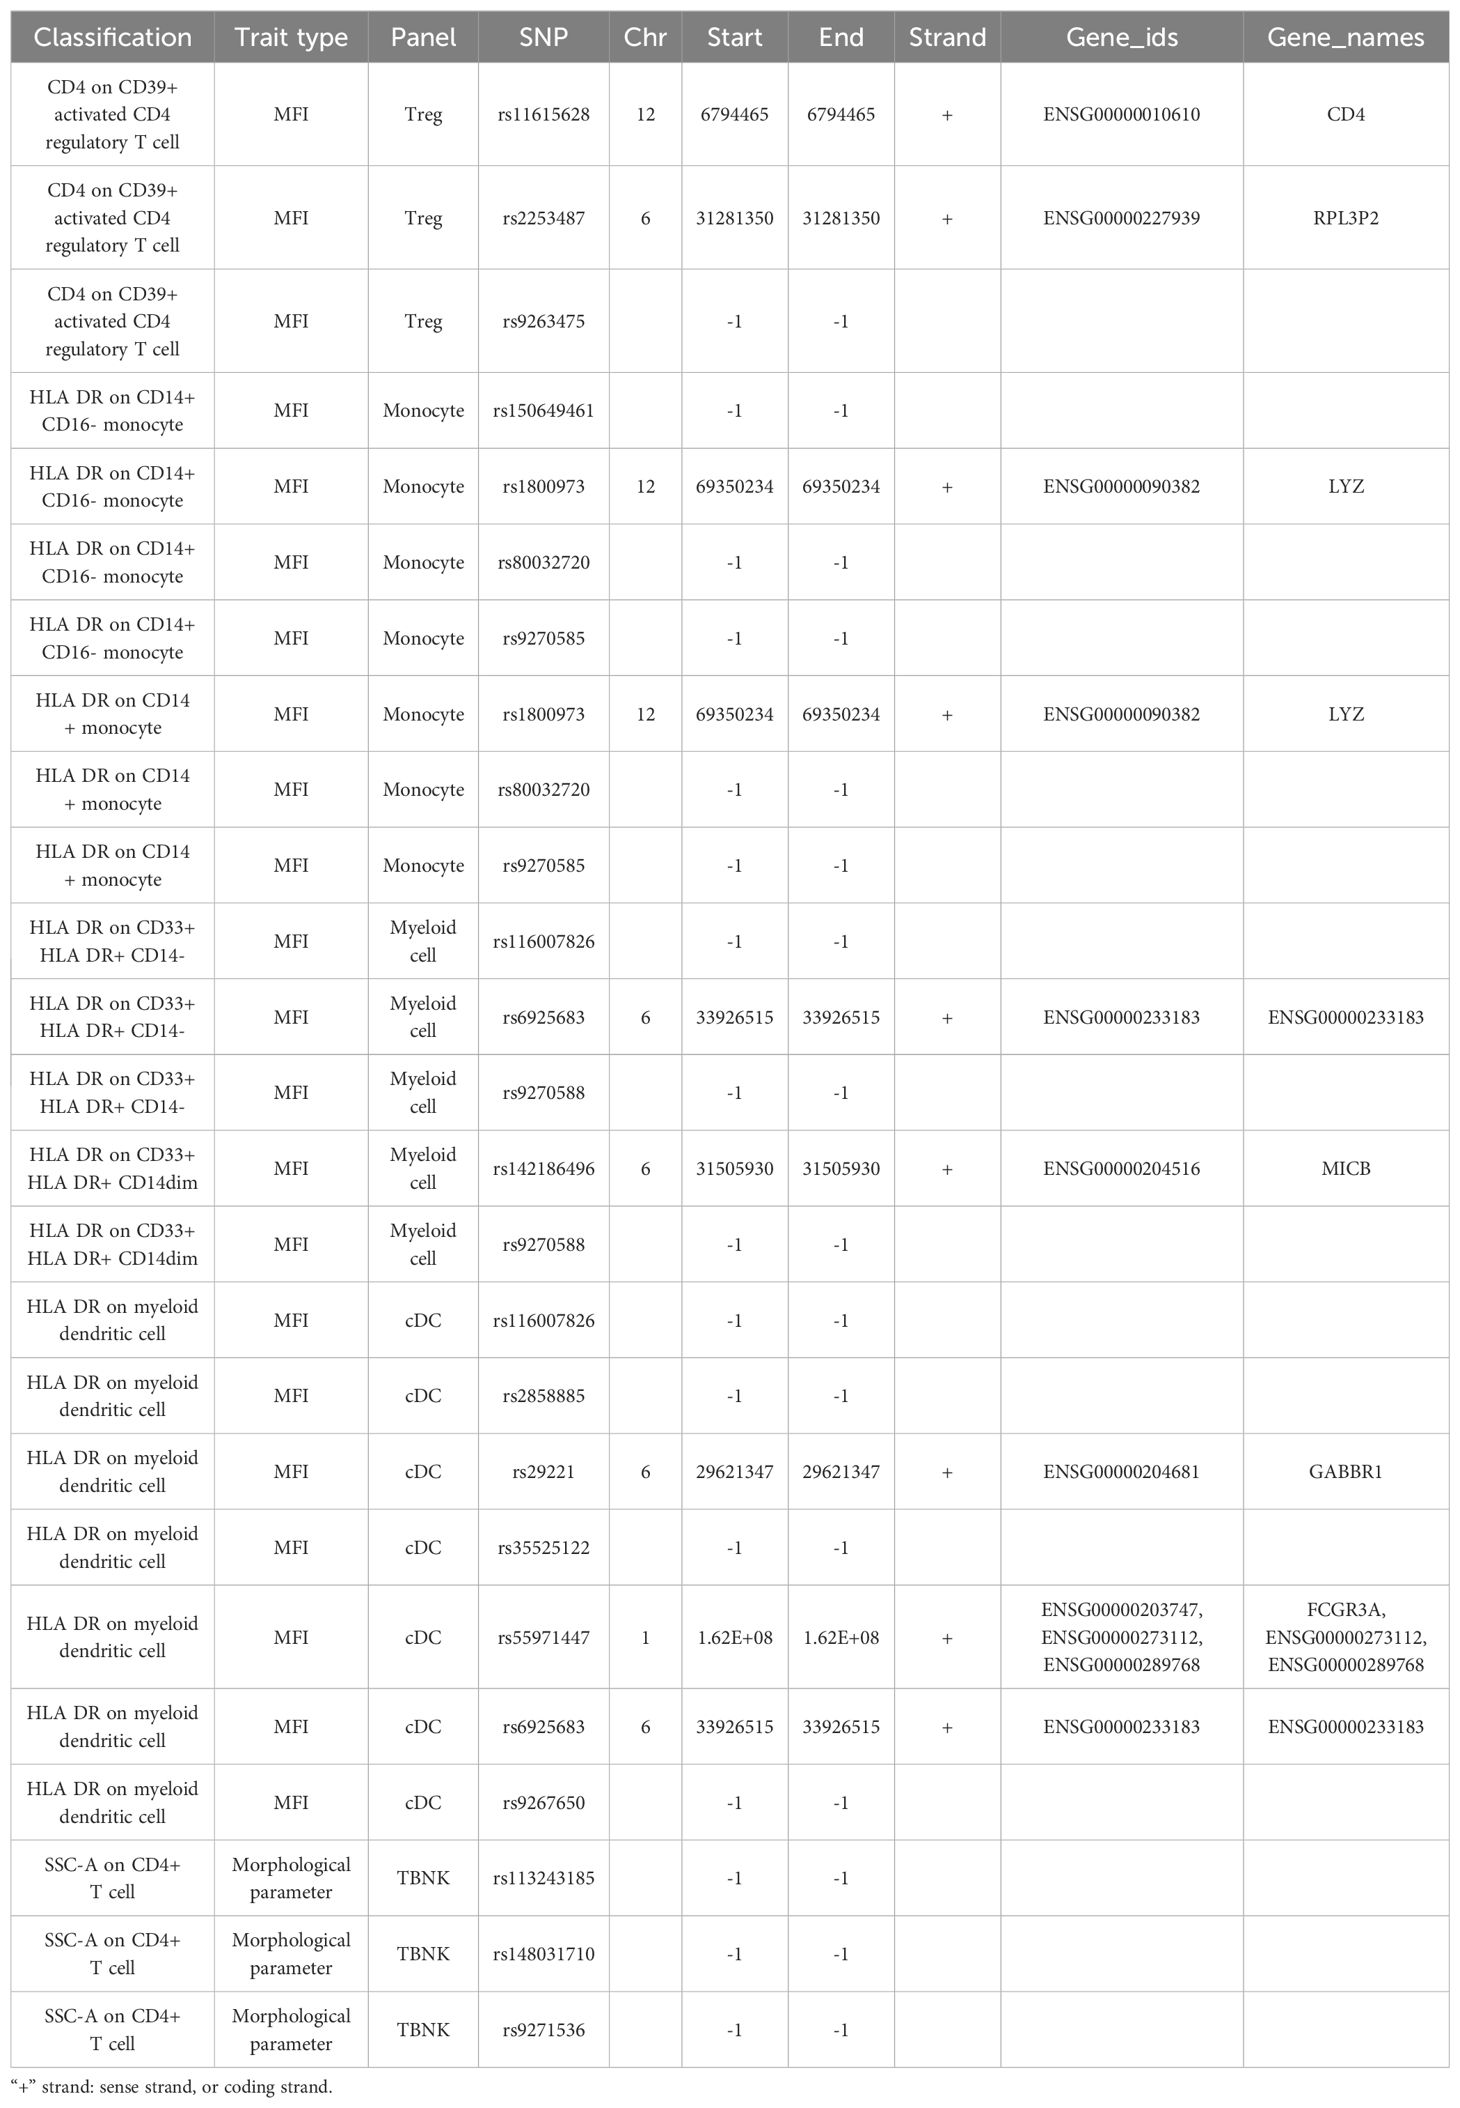
Table 4B. SNP annotation.
Immune cell SNPs strongly associated with PDR were annotated, revealing 12 genes potentially related to PDR. CD4, RPL3P2, LYZ, TSBP1-AS1, ENSG00000233183, MICB, TVP23A, GABBR1, FCGR3A, and CIITA may be risk factors for PDR, however, HLA-DPA1 and TSBP1-AS1 might provide protection against it (Table 4B).
4 Discussion
A previous study revealed that immune system disorders and inflammation play important roles in the pathogenesis of DR. Further research into the specific role of immune mechanisms in DR, as well as the identification of more specific and sensitive biomarkers, will provide a new foundation and strategies for the early clinical diagnosis and treatment of DR (18). This MR study adds to the evidence supporting a causal connection between immune cells and DR. In DR, immune cells HLA DR on CD33+ HLA DR+ CD14- and HLA DR on CD33+ HLA DR+ CD14dim may be risk factors, while immune cells HLA DR on CD14-CD16- may be protective. In PDR, CD4+ T cells on CD39+ active CD4 regulatory T cells, HLA DR cells on CD14+ monocytes, and HLA DR cells on CD33+ HLA DR+ CD14dim may be risk factors. Immune cells, specifically those harboring SSC-A on CD4+ T cells, may provide protection. The findings of this study indicate that immune cells HLA DR on CD33+ HLA DR+ CD14- and HLA DR+ CD14- have a causative influence in both the datasets of DR and PDR, which may increase the risk of developing DR. Both types express molecules known as human leukocyte antigen (HLA) -driven receptors that are important markers for antigen-presenting cells (APCs). However, CD33+ cells are primarily present in monocytes or macrophages where they play a role in innate immunity and inflammation by exhibiting phagocytic activity along with cytokine production at sites experiencing inflammation. However, lymphocytes more widely express another type called CD14-, which has stronger associations with adaptive immune responses potentially contributing to diseases or immune response regulation.
Numerous studies have demonstrated that regulatory T cells and monocytes play a significant role in the pathogenesis of DR. The activation of immunoinflammatory cells and proinflammatory substances in the retinal tissue of DR patients contributes to the occurrence and progression of DR (19–22). Leukocyte adhesion stasis; neutrophil increase; abnormal expression of T cells, B lymphocytes, mononuclear/macrophages, and other immune cells; elevated concentrations of inflammatory and proangiogenic factors; and increased levels of anti-pericytes and anti-endothelial cell antibodies were found in the serum, vitreous, and retinal tissues of DR animal models and patients (23–25). YUAN et al. used a gene expression microarray for immunoinfiltration analysis. They found that in DR samples, there was significant overexpression (P<0.05) of seven types of immune cells: original B cells, plasma cells, memory CD4+ T cells, regulatory T cells (Tregs), MO macrophages, M1 macrophages, and neutrophils (P<0.05). The activated memory CD4+ T-cell module had the highest correlation and differential expression (P< 0.001). Activated NK cells showed low expression among immune cells (P<0.05) (26). Our study also revealed an increased risk for DR associated with HLA DR on CD14+ CD16- monocytes, HLA DR on CD33+ HLA DR+ CD14- cells, HLA DR on CD14+ monocytes, and HLA DR on CD33+ HLA DR+ CD14dim (all belonging to the monocyte population). Additionally, PDR patients showed a significant increase in CD4+ T cells on CD39+ activated CD4+ regulatory T cells. Two immune-associated target genes in DR, DLGAP5 and AURKB, were found to be enriched in pathways relevant to memory CD4+ cells. These findings suggest that DR is closely related to the activation of regulatory T cells and monocytes.
Our research revealed a significant increase in HLA-DR on CD33+HLA-DR+CD14- cells in both DR and PDR, indicating a strong correlation between microangiopathy in DR and the activation of myeloid-derived suppressor cells (MDSCs). MDSCs are diverse cell types that can effectively suppress T cell responses. Under normal conditions, these cells develop into dendritic cells, macrophages, and granulocytes. However, in pathological conditions such as infection, inflammation, or cancer, the differentiation of these cells stops resulting in their accumulation (27–29). Initially classified as HLA-DR-CD33+ or CD14-CD11b+ cells, both of which are populations of cells with T cell inhibitory activity (30, 31), human MDSCs can be further subdivided into granulocytic CD14− and monocytic CD14+ MDSCs (32, 33). One study found that patients with type 1 diabetes mellitus (T1D) have significantly greater numbers of MDSCs in their peripheral blood with M-MDSCs (CD14+ CD33+ HLA-DR−) being the most prevalent subset of MDSCs. Compared to diabetic patients without kidney disease, diabetic patients with kidney disease had a substantial increase in the number of total MDSCs and a rise in the percentage of CD14- cells (34). An imbalance of immune active cells is directly linked to the development of DR, as evidenced by the aberrant activation and expression of immune cells in the ocular tissue of DR patients and the association with DR. There are many similarities between diabetic nephropathy (DN) and DR. DN and DR are both microvascular complications resulting from diabetes, which are complex illnesses with diverse manifestations (35). If immune cell activation is effectively inhibited, delays in the onset of DR disease can be expected.
Our study indicates that CD33 is implicated in DR. Additionally, these findings reveal a set of genetic variants associated with proangiogenic and inflammatory pathways that may contribute to the pathogenesis of DR. Further investigation into these variants is necessary and may lead to the development of novel biomarkers and new therapeutic targets for DR. Previous research has shown that genes associated with angiogenesis and inflammatory pathways play a crucial role in the onset of DR (36–39). The Diabetic Retinopathy Genomics (DRGen) study revealed the involvement of Kruppel Like Factor 17 (KLF17), Zinc Finger Protein 395 (ZNF395), Myeloid cell surface antigen (CD33), Pleckstrin Homology Domain-Containing Family G Member 5 (PLEKHG5), NK2 Homeobox 3 (NKX2.3), and Collagen Type XVIII Alpha 1 Chain (COL18A1) in the progression of DR. These genes have been shown to be involved in angiogenesis and inflammatory pathways (40).
In MR studies, genetic variations that are substantially associated with an exposure are used as IVs to investigate the potential causal relationship between an exposure and a specific outcome of interest. Since genetic variants are randomly assigned at conception, MR estimates are not influenced by confounding factors, reverse causality, or measurement error (41). Inference typically relies on SNPs identified as IVs in GWASs. The current study was conducted in a rather conservative manner and supported by a comprehensive sensitivity analysis due to the strong assumptions underlying MR research (42). To ensure the robustness of the results, several measures were taken. Firstly, to minimize any bias resulting from demographic variability, only European populations were included in the analysis. Secondly, considering that both disease risk factors and immune cells are complex polygenic phenotypes that can be influenced by various genetic and environmental factors simultaneously (pleiotropy), we assessed potential pleiotropic effects through LOO and examined the intercept of MR-Egger regression. These approaches consistently yielded results suggesting reliable causal estimations. Data from European populations were utilized in this study to select a representative sample. By using MR methodology, it is possible to minimize the impact of reverse causation and confounding variables on estimation accuracy while producing trustworthy causal effect estimates based on observational research findings. Furthermore, GWAS data with large sample sizes were employed for these studies which significantly enhanced test efficiency compared to small-sample models relying on individual data points.
This study has certain limitations. First, there will inevitably be batch differences across the various datasets analyzed in this study due to its use of a public database. There are issues with the cohesiveness of integrating multiple databases in this study, and further efforts are needed to improve the accuracy of causal inference. Second, the research was limited to individuals with European ancestry, making it challenging to generalize the findings to other demographic groups. Third, residual and unmeasured confounders may still exist as the study was unable to determine whether demographic stratification and other potential confounders had an impact on its findings.
5 Conclusion
This study’s findings emphasized the complex network of connections between the immune system and DR, as it demonstrated causal relationships between various immune cells and DR through MR analysis. HLA-DR on CD14+ CD16 monocytes, HLA-DR on CD14+ monocytes, HLA-DR on CD33-HLA-DR+, HLA-DR on CD33+ HLA-DR+ CD14-, HLA-DR on CD33+ HLA-DR+ CD14dim, and HLA-DR on myeloid dendritic cells may increase the risk of DR. Additionally, HLA-DR to CD14-CD16- and SSC-A to CD4+ T cells may be protective factors against DR. These findings could open new avenues for investigating the biological causes of DR and pave the way for research into earlier intervention and treatment.
Data availability statement
The original contributions presented in the study are included in the article/Supplementary Material. Further inquiries can be directed to the corresponding author.
Ethics statement
Ethical approval was not required for the study involving humans in accordance with the local legislation and institutional requirements. Written informed consent to participate in this study was not required from the participants or the participants’ legal guardians/next of kin in accordance with the national legislation and the institutional requirements.
Author contributions
YY: Writing – original draft, Methodology. LD: Writing – original draft, Formal analysis. HG: Writing – original draft, Validation. LY: Writing – original draft, Visualization. ZX: Writing – review & editing. ZGL: Writing – review & editing.
Funding
The author(s) declare that no financial support was received for the research, authorship, and/or publication of this article.
Conflict of interest
The authors declare that the research was conducted in the absence of any commercial or financial relationships that could be construed as a potential conflict of interest.
Publisher’s note
All claims expressed in this article are solely those of the authors and do not necessarily represent those of their affiliated organizations, or those of the publisher, the editors and the reviewers. Any product that may be evaluated in this article, or claim that may be made by its manufacturer, is not guaranteed or endorsed by the publisher.
Supplementary material
The Supplementary Material for this article can be found online at: https://www.frontiersin.org/articles/10.3389/fimmu.2024.1381002/full#supplementary-material
Abbreviations
DR, diabetic retinopathy; SNPs, single nucleotide polymorphisms; MR, Mendelian randomization; GWAS, genome-wide association study; IVSs, instrumental variables; IVW, Inverse variance weighted; PDR, proliferative diabetic retinopathy; LOO. leave one-out; MDSCs, myeloid-derived suppressor cells; T1D, type 1 diabetes mellitus; DN, diabetic nephropathy; DRGen, Diabetic Retinopathy Genomics.
References
1. Cheung N, Chee ML, Klein R, Klein BE, Shea S, Cotch MF, et al. Incidence and progression of diabetic retinopathy in a multi-ethnic US cohort: the Multi-Ethnic Study of Atherosclerosis. Br J Ophthalmol. (2022) 106:1264–8. doi: 10.1136/bjophthalmol-2021-318992
2. Sabanayagam C, Sultana R, Banu R, Rim T, Tham YC, Mohan S, et al. Association between body mass index and diabetic retinopathy in Asians: the Asian Eye Epidemiology Consortium (AEEC) study. Br J Ophthalmol. (2022) 106:980–6. doi: 10.1136/bjophthalmol-2020-318208
3. Nishi K, Nishitsuka K, Yamamoto T, Yamashita H. Factors correlated with visual outcomes at two and four years after vitreous surgery for proliferative diabetic retinopathy. PloS One. (2021) 16:e0244281. doi: 10.1371/journal.pone.0244281
4. Wang S, Pan X, Jia B, Chen S. Exploring the correlation between the systemic immune inflammation index (SII), systemic inflammatory response index (SIRI), and type 2 diabetic retinopathy. Diabet Metab Syndrome Obes. (2023) 16:3827–36. doi: 10.2147/DMSO.S437580
5. Malhotra NA, Muste J, Hom GL, Conti TF, Greenlee TE, Singh RP. Race and socioeconomic status in anti-VEGF treatment of diabetic macular edema. Ophthalmic Surgery Lasers Imaging Retina. (2021) 52:578–85. doi: 10.3928/23258160-20211018-01
6. Żuchnik M, Rybkowska A, Szczuraszek P, Szczuraszek H, Bętkowska P, Radulski J, et al. Olko, Type 2 diabetes-factors of occurrence and its complications. Qual Sport. (2023) 10:32–40. doi: 10.12775/QS.2023.10.01.003
7. Yang M, Wang X, Han Y, Li C, Wei L, Yang J, et al. Targeting the NLRP3 inflammasome in diabetic nephropathy. Curr Medicinal Chem. (2021) 28:8810–24. doi: 10.2174/0929867328666210705153109
8. Wei H, Gu Q. SOX4 promotes high-glucose-induced inflammation and angiogenesis of retinal endothelial cells by activating NF-κB signaling pathway. Open Life Sci. (2022) 17:393–400. doi: 10.1515/biol-2022-0045
9. Alchujyan N, Hovhannisyan M, Movsesyan N, Melkonyan A, Shaboyan V, Aghajanova Y, et al. Sexual dimorphism in alternative metabolic pathways of L-arginine in circulating leukocytes in young people with type 1 diabetes mellitus. Endocrine Res. (2021) 46:149–59. doi: 10.1080/07435800.2021.1920608
10. Yoshikawa M, Asaba K, Nakayama T. Causal effect of atrial fibrillation/flutter on chronic kidney disease: A bidirectional two-sample Mendelian randomization study. PloS One. (2021) 16:e0261020. doi: 10.1371/journal.pone.0261020
11. Lee K, Lim C-Y. Mendelian randomization analysis in observational epidemiology. J Lipid Atheroscl. (2019) 8:67–77. doi: 10.12997/jla.2019.8.2.67
12. Consortium GP. A global reference for human genetic variation. Nature. (2015) 526:68. doi: 10.1038/nature15393
13. Burgess S, Small DS, Thompson SG. A review of instrumental variable estimators for Mendelian randomization. Stat Methods Med Res. (2017) 26:2333–55. doi: 10.1177/0962280215597579
14. Wang C, Zhu D, Zhang D, Zuo X, Yao L, Liu T, et al. Causal role of immune cells in schizophrenia: Mendelian randomization (MR) study. BMC Psychiatry. (2023) 23:590. doi: 10.1186/s12888-023-05081-4
15. Brion M-JA, Shakhbazov K, Visscher PM. Calculating statistical power in Mendelian randomization studies. Int J Epidemiol. (2013) 42:1497–501. doi: 10.1093/ije/dyt179
16. Papadimitriou N, Dimou N, Tsilidis KK, Banbury B, Martin RM, Lewis SJ, et al. Physical activity and risks of breast and colorectal cancer: a Mendelian randomisation analysis. Nat Commun. (2020) 11:597. doi: 10.1038/s41467-020-14389-8
17. Burgess S, Thompson SG. Interpreting findings from Mendelian randomization using the MR-Egger method. Eur J Epidemiol. (2017) 32:377–89. doi: 10.1007/s10654-017-0255-x
18. Lechner J, O’Leary OE, Stitt AW. The pathology associated with diabetic retinopathy. Vision Res. (2017) 139:7–14. doi: 10.1016/j.visres.2017.04.003
19. Rangasamy S, McGuire PG, Franco Nitta C, Monickaraj F, Oruganti SR, Das A. Chemokine mediated monocyte trafficking into the retina: role of inflammation in alteration of the blood-retinal barrier in diabetic retinopathy. PloS One. (2014) 9:e108508. doi: 10.1371/journal.pone.0108508
20. Urbančič M, Štunf Š., MilutinovićŽivin A, Petrovič D. GlobočnikPetrovič, Epiretinal membrane inflammatory cell density might reflect the activity of proliferative diabetic retinopathy. Invest Ophthalmol Visual Sci. (2014) 55:8576–82. doi: 10.1167/iovs.13-13634
21. Takeuchi M, Sato T, Tanaka A, Muraoka T, Taguchi M, Sakurai Y, et al. Elevated levels of cytokines associated with Th2 and Th17 cells in vitreous fluid of proliferative diabetic retinopathy patients. PloS One. (2015) 10:e0137358. doi: 10.1371/journal.pone.0137358
22. Chernykh V, Varvarinsky E, Smirnov E, Chernykh D, Trunov AN. Proliferative and inflammatory factors in the vitreous of patients with proliferative diabetic retinopathy. Indian J Ophthalmol. (2015) 63:33. doi: 10.4103/0301-4738.151464
23. Sasongko M, Wong T, Jenkins A, Nguyen T, Shaw J, Wang J. Circulating markers of inflammation and endothelial function, and their relationship to diabetic retinopathy. Diabetic Med. (2015) 32:686–91. doi: 10.1111/dme.12640
24. Wang R-t, Zhang J-r, Li Y, Liu T, Yu K-j. Neutrophil–lymphocyte ratio is associated with arterial stiffness in diabetic retinopathy in type 2 diabetes. J Diabetes its Complicat. (2015) 29:245–9. doi: 10.1016/j.jdiacomp.2014.11.006
25. He J, Wang H, Liu Y, Li W, Kim D, Huang H. Blockade of vascular endothelial growth factor receptor 1 prevents inflammation and vascular leakage in diabetic retinopathy. J Ophthalmol. (2015) 2015. doi: 10.1155/2015/605946
26. L.-H. YUAN L.-J. ZHANG, X. LIU, Y.-Y. QI. Identification of key immune related genes in diabetes retinopathy based on weighted gene co-expression network. Int Eye Sci. (2023) 16:1343–51. doi: 10.3980/j.issn.1672-5123.2023.8.20
27. Filipazzi P, Huber V, Rivoltini L. Phenotype, function and clinical implications of myeloid-derived suppressor cells in cancer patients. Cancer Immunology Immunother. (2012) 61:255–63. doi: 10.1007/s00262-011-1161-9
28. Atretkhany K-SN, Drutskaya M. Myeloid-derived suppressor cells and proinflammatory cytokines as targets for cancer therapy. Biochem (Moscow). (2016) 81:1274–83. doi: 10.1134/S0006297916110055
29. Youn JI, Gabrilovich DI. The biology of myeloid-derived suppressor cells: the blessing and the curse of morphological and functional heterogeneity. Eur J Immunol. (2010) 40:2969–75. doi: 10.1002/eji.201040895
30. Gabrilovich DI, Nagaraj S. Myeloid-derived suppressor cells as regulators of the immune system. Nat Rev Immunol. (2009) 9:162–74. doi: 10.1038/nri2506
31. Talmadge JE, Gabrilovich DI. History of myeloid-derived suppressor cells. Nat Rev Cancer. (2013) 13:739–52. doi: 10.1038/nrc3581
32. Greten TF, Manns MP, Korangy F. Myeloid derived suppressor cells in human diseases. Int Immunopharmacol. (2011) 11:802–7. doi: 10.1016/j.intimp.2011.01.003
33. Ning G, She L, Lu L, Liu Y, Zeng Y, Yan Y, et al. Analysis of monocytic and granulocytic myeloid-derived suppressor cells subsets in patients with hepatitis C virus infection and their clinical significance. BioMed Res Int. (2015) 2015. doi: 10.1155/2015/385378
34. Hassan M, Raslan HM, Eldin HG, Mahmoud E, Alm-elhuda Abd Elwajed H. CD33+ HLA-DR–myeloid-derived suppressor cells are increased in frequency in the peripheral blood of type1 diabetes patients with predominance of CD14+ Subset. Open Access Macedonian J Med Sci. (2018) 6:303. doi: 10.3889/oamjms.2018.080
35. Krolewski AS, Skupien J, Rossing P, Warram JH. Fast renal decline to end-stage renal disease: an unrecognized feature of nephropathy in diabetes. Kidney Int. (2017) 91:1300–11. doi: 10.1016/j.kint.2016.10.046
36. Horikawa N, Abiko K, Matsumura N, Hamanishi J, Baba T, Yamaguchi K, et al. Expression of vascular endothelial growth factor in ovarian cancer inhibits tumor immunity through the accumulation of myeloid-derived suppressor cells. Clin Cancer Res. (2017) 23:587–99. doi: 10.1158/1078-0432.CCR-16-0387
37. Iwanicki MP, Brugge JS. Transcriptional regulation of metastatic [Id] entity by KLF17. Genome Biol. (2009) 10:1–3. doi: 10.1186/gb-2009-10-11-244
38. Maystadt I, Rezsöhazy R, Barkats M, Duque S, Vannuffel P, Remacle S, et al. The nuclear factor κB–activator gene PLEKHG5 is mutated in a form of autosomal recessive lower motor neuron disease with childhood onset. Am J Hum Genet. (2007) 81:67–76. doi: 10.1086/518900
39. Murat A, Migliavacca E, Hussain SF, Heimberger AB, Desbaillets I, Hamou M-F, et al. Modulation of angiogenic and inflammatory response in glioblastoma by hypoxia. PloS One. (2009) 4:e5947. doi: 10.1371/journal.pone.0005947
40. Cabrera AP, Mankad RN, Marek L, Das R, Rangasamy S, Monickaraj F, et al. Genotypes and phenotypes: a search for influential genes in diabetic retinopathy. Int J Mol Sci. (2020) 21:2712. doi: 10.3390/ijms21082712
41. Yavorska OO, Burgess S. MendelianRandomization: an R package for performing Mendelian randomization analyses using summarized data. Int J Epidemiol. (2017) 46:1734–9. doi: 10.1093/ije/dyx034
Keywords: Mendelian randomization, immune cells, diabetic retinopathy, proliferative diabetic retinopathy, causal effect
Citation: Ye Y, Dai L, Gu H, Yang L, Xu Z and Li Z (2024) The causal relationship between immune cells and diabetic retinopathy: a Mendelian randomization study. Front. Immunol. 15:1381002. doi: 10.3389/fimmu.2024.1381002
Received: 02 February 2024; Accepted: 18 July 2024;
Published: 02 September 2024.
Edited by:
Xu-jie Zhou, Peking University, ChinaReviewed by:
Chenglin Sun, Jilin University, ChinaXiaoyong Yu, Shaanxi Provincial Hospital of Traditional Chinese Medicine, China
Copyright © 2024 Ye, Dai, Gu, Yang, Xu and Li. This is an open-access article distributed under the terms of the Creative Commons Attribution License (CC BY). The use, distribution or reproduction in other forums is permitted, provided the original author(s) and the copyright owner(s) are credited and that the original publication in this journal is cited, in accordance with accepted academic practice. No use, distribution or reproduction is permitted which does not comply with these terms.
*Correspondence: Yunyan Ye, bGhseWV5dW55YW5AbmJ1LmVkdS5jbg==