
94% of researchers rate our articles as excellent or good
Learn more about the work of our research integrity team to safeguard the quality of each article we publish.
Find out more
ORIGINAL RESEARCH article
Front. Immunol., 04 June 2024
Sec. Autoimmune and Autoinflammatory Disorders : Autoimmune Disorders
Volume 15 - 2024 | https://doi.org/10.3389/fimmu.2024.1375508
This article is part of the Research TopicThymus Dysfunction As A Neglected Issue In Autoimmunity DisordersView all 5 articles
 Andrei Belean1
 Eden Xue2
 Benjamin Cisneros2
 Elisha D. O. Roberson1,2,3Michael A. Paley1,4*
 Tarin M. Bigley2,4,5*†
Introduction: Herpesviruses, including the roseoloviruses, have been linked to autoimmune disease. The ubiquitous and chronic nature of these infections have made it difficult to establish a causal relationship between acute infection and subsequent development of autoimmunity. We have shown that murine roseolovirus (MRV), which is highly related to human roseoloviruses, induces thymic atrophy and disruption of central tolerance after neonatal infection. Moreover, neonatal MRV infection results in development of autoimmunity in adult mice, long after resolution of acute infection. This suggests that MRV induces durable immune dysregulation.
Methods: In the current studies, we utilized single-cell RNA sequencing (scRNAseq) to study the tropism of MRV in the thymus and determine cellular processes in the thymus that were disrupted by neonatal MRV infection. We then utilized tropism data to establish a cell culture system.
Results: Herein, we describe how MRV alters the thymic transcriptome during acute neonatal infection. We found that MRV infection resulted in major shifts in inflammatory, differentiation and cell cycle pathways in the infected thymus. We also observed shifts in the relative number of specific cell populations. Moreover, utilizing expression of late viral transcripts as a proxy of viral replication, we identified the cellular tropism of MRV in the thymus. This approach demonstrated that double negative, double positive, and CD4 single positive thymocytes, as well as medullary thymic epithelial cells were infected by MRV in vivo. Finally, by applying pseudotime analysis to viral transcripts, which we refer to as “pseudokinetics,” we identified viral gene transcription patterns associated with specific cell types and infection status. We utilized this information to establish the first cell culture systems susceptible to MRV infection in vitro.
Conclusion: Our research provides the first complete picture of roseolovirus tropism in the thymus after neonatal infection. Additionally, we identified major transcriptomic alterations in cell populations in the thymus during acute neonatal MRV infection. These studies offer important insight into the early events that occur after neonatal MRV infection that disrupt central tolerance and promote autoimmune disease.
The herpesviruses have been hypothesized to promote development of autoimmune diseases, but only recently have investigators found causative evidence of herpesviruses inducing autoimmunity (1–3). For example, studies found that Epstein Barr virus has a causative role in development of multiple sclerosis, likely through molecular mimicry (3–7). Similarly, the human roseoloviruses, HHV-6 and -7, have been associated with autoimmune disease but studies have not identified a clear causal role due to the ubiquitous and chronic nature of roseolovirus infections that typically occur early in life, years before development of autoimmunity (8–14). Murine roseolovirus (MRV) is a natural murine pathogen closely related to the human roseoloviruses that has provided an opportunity to perform mechanistic, in vivo studies to understand roseolovirus pathogenesis (2, 15–17). Our studies demonstrated that neonatal MRV infection causes autoimmune disease manifested as autoimmune gastritis and broad autoantibody production (2). Interestingly, this appears to occur through disruption of processes involved in thymocyte survival and central tolerance. We observed that MRV induces depletion of CD4 single positive (CD4SP) and CD4+CD8+ double positive (DP) thymocytes, reduction in medullary thymic epithelial cell (mTEC) numbers, and disruption of tissue restricted antigen (TRA) and Aire expression (2). Our findings presented a unique paradigm of virus-induced autoimmunity in which early life viral infection of the thymus can produce durable immune dysregulation that leads to autoimmunity.
Indeed, multiple pathogens can infect the thymus (18, 19). While infection of the thymus by several different viruses has been shown to result in thymic atrophy, thymocyte depletion, altered expression of genes that contribute to thymic function, or direct infection of thymic stromal cells, only MRV has been shown to induce autoimmunity (2, 18–29). Human roseoloviruses have been shown to infect human thymus xenografts in SCID mice and induce thymic atrophy, resulting in a reduction in DP and CD4SP cells. These studies, however, did not evaluate for the subsequent development of autoimmunity after resolution of acute infection (30). The impact of human roseolovirus infection on the thymus in vivo in humans is largely understudied, although there exists some evidence that acute human roseolovirus infection occurs in patients receiving a thymus transplant (31, 32). A better understanding of how thymotropic viruses, including the roseoloviruses, impact thymic function and tolerance requires further evaluation of host-virus interactions at a molecular level as well as identification of viral tropism in the thymus.
Central tolerance is a complex process in which millions of dividing thymocyte progenitors must form a functional T cell receptor (TCR) and receive the appropriate signals to survive (33, 34). This begins at the stage of the early thymic progenitors (ETP) that arrive from the blood. Notch signaling and the activity of key T-cell transcription factors such as Tcf7, promote proliferation and differentiation of ETPs into double negative (DN) thymocytes that lack CD4 and CD8 expression (35–42). DN cells receive further stimulation through Notch and other signaling events that promote progression through four DN stages that include highly proliferative DN1 and DN2 stages, followed by a DN3 stage in which the TCRβ locus rearranges to form a pre-TCR (43–48). Signaling through the pre-TCR, Notch signaling, and activity of a host of transcription factors allows progression to the DN4 stage followed by maturation to the molecularly distinct immature single positive (ISP) stage in which CD8 is expressed (34, 38, 45, 49–52).
Following the ISP stage, cells upregulate expression of CD4 and CD8, and are called double positive cells (DP). Single-cell transcriptomics has identified that DP cell development is characterized by three distinct stages (43, 53). This includes the DPbla (blast) stage that occurs after the ISP stage and is characterized by rapid proliferation, the DPre (rearranging) stage in which the TCRα locus is rearranged and the mature TCR can receive signal for positive selection, and the DPsel (selection) stage when cells undergo positive selection (53). Positive selection is mediated by antigen presenting cells called cortical thymic epithelial cells (cTECs) that express self-MHC molecules for DP thymocytes to sample TCR binding for sufficient affinity to promote survival (54, 55). Upon completion of positive selection, DP thymocytes downregulate either CD4 or CD8 to become CD4SP or CD8 single positive (CD8SP) and migrate to the thymic medulla. Negative selection then occurs through a process of affinity-based selection in which MHC:self-antigen on mTECs and thymic dendritic cells is presented to CD4SP and CD8SP cells, although evidence exists suggesting that some negative selection can also occur at the DP stage in the cortex or corticomedullary junction (55–57). Expression of self-antigen (aka TRAs) is driven by key transcription regulators such as Aire and Fezf2 (58). Cells that survive positive and negative selection migrate out of the thymus. This process requires intricate and coordinated signaling and interactions that, if disrupted, can alter T cell development and lead to immune deficiency and/or autoimmunity (54, 58–61).
Like all herpesvirus infections, beta-herpesvirus infection features complex virus-host interactions in which cellular machinery is subverted to support viral replication and modulate the immune response. Many of the cellular processes that are important for thymocyte development are altered during beta-herpesvirus infections, although there are few studies assessing the impact of herpesvirus infections in the thymus at the molecular level (2, 15, 16, 62, 63). One important cellular process that is influenced by herpesviruses is the cell cycle. The beta-herpesviruses, which includes cytomegaloviruses and roseoloviruses, induce an arrest of the cell cycle at the G1/S interphase while also inducing activation of cell cycle machinery, DNA damage response, and apoptosis pathways necessary for viral DNA replication (64–68). The beta-herpesviruses modulate multiple aspects of the immune response including epigenetic silencing, interferon and cytokine signaling, proteasome and inflammasome response, and antigen presentation (66, 69–71). Host transcription and translation machinery are hijacked to promote viral gene and protein expression, while cellular metabolism is altered to support viral replication (72, 73). For example, lipid metabolism is reprogrammed during beta-herpesvirus infection and plays a role in cellular and viral membrane formation during infection (74). Herpesvirus infection can also impact cellular differentiation. For example, the beta-herpesviruses have been shown to alter neuronal and hematopoietic cell differentiation through direct infection and by altering the microenvironment and signaling such as the Notch signaling pathway (75–79). The complex interaction between herpesviruses and cellular processes illustrate potential molecular mechanisms by which direct infection and bystander effects could disrupt thymic functions such as thymocyte development and induction of tolerance.
Transcriptomics have been utilized to better understand herpesvirus-host interactions at a molecular level. Although the cellular tropism of the beta-herpesvirus is wide, single-cell transcriptomics studies have predominantly focused on infection of specific cell types in vitro or ex vivo (80–83). This has allowed for evaluation of infection kinetics and virus-host interactions in specific cell types. These studies have provided important insight into lytic and latent infection and cellular pathways altered by infection. Herpesvirus gene expression follows a kinetic pattern that is temporal and coordinated through three phases: immediate early (IE), then early (E), followed by late (L), although a set of genes are referred to as E/L (also called leaky late) that have mixed E and L kinetics (84). While initiation of infection is characterized by IE gene expression, productive viral genome replication is dependent on E genes, and robust expression of L genes that contribute to virion assembly is dependent on viral genome replication (84, 85). Bulk and single-cell transcriptomics have established patterns of expression in different cells and at different times post-infection, providing information about the expression pattern of uncharacterized viral genes (80, 82, 86, 87). Single-cell transcriptomics during acute, in vivo herpesvirus infection of an entire organ, such as the thymus, has not been performed to date but offers the opportunity to identify tropism of the virus and establish how infection disrupts normal cellular processes in infected and surrounding cells.
In this study, we examined the single-cell transcriptome of the entire thymus during acute MRV infection and compared these findings to an uninfected thymus on day of life (DOL) 6. We simultaneously assessed both host gene expression and viral gene expression patterns. We explored the tropism of MRV in the thymus, which includes thymocytes at the DN3, DN4, ISP, DP, and CD4SP. We also assessed the differential cellular gene expression patterns that defined the uninfected and infected thymus, including those that are important for thymocyte development and herpesvirus replication. Moreover, our studies evaluated MRV infection of mTECs and expression of genes that may impact interactions between antigen presenting cells (i.e. mTECs) and thymocytes. We used computational approaches to explore the kinetics of the viral transcriptome by cell type and infection status. Finally, we applied our in vivo tropism findings to establish cell culture systems that are susceptible to MRV replication. Our findings demonstrate the utility of single-cell transcriptomic approaches to study complex virus-host interactions as well as viral tropism within an entire organ in vivo.
BALB/c mice were purchased from Charles River Laboratories. Mice were bred in-house in specific pathogen free facilities. MRV infected mice were housed separately from uninfected mice to avoid horizontal transmission. We conducted our studies in accordance with the institutional ethical guidelines through institutional animal care and use committee (IACUC) protocol that was approved by the Animal Studies Committee of Washington University. Mice were infected with MRV as previously described using stock from in vivo passaging (15, 17, 63). Briefly, in day of life (DOL) 0, mice were injected with 1e8 viral genomes via intraperitoneal (i.p.) injection.
Analysis of non-stromal thymocytes at 3, 5 and 7 days post infection (dpi) was performed by dissecting the thymus and mincing into small pieces with scissors. Pipetting with a large bore pipette was used to liberate thymocytes. Cells were prepared for flow cytometry by staining in a fixable viability dye (eBioscience) and blocking the Fc receptor with 2.4G hybridoma supernatant (made in house). Surface staining was performed before fixation and permeabilization with Foxp3/Transcription Factor Staining Buffer Set (eBioscience). Florescent-labeled antibodies used in this study included: anti-CD4 (RM4–5) and anti-CD8α (53–6.7) from Fisher Scientific; anti-CD19 (6D5) and anti-NKp46 (29A1.4) from Biolegend; anti-CD45.2 (88) from eBioscience. Flow cytometry was performed using a FACSCanto (BD Biosciences) and analyzed using FlowJo v10 (TreeStar, Ashland, OR).
The thymus was dissected with care to remove non-thymic tissue using scissors. The thymus tissue was placed into 1ml of 0.25% trypsin EDTA (GIBCO) at 37°C. The tissue was incubated for 15 minutes. Dissociation and digestion were aided by vigorous pipetting using a large bore pipette every 5 minutes. Cells were filtered through a 100μm filter into 9ml of RPMI 10% FBS to neutralize trypsin activity. Cells were then centrifuged at 1500rpm for 3.5 minutes followed by incubation in RBC lysis buffer (made in house) for 3 min at room temperature. Cells were then centrifuged again and washed twice in 9ml of PBS 0.5% bovine serum albumin (BSA). Cells were counted via hemocytometer then resuspended at 1200 cells/μL in PBS 0.04% BSA. The cells were kept on ice until ready for scRNAseq analysis.
Single-cell 3’ gene expression cDNA libraries were generated per manufacture protocols using the 10X Genomic Chromium Single-Cell 3’ Library and Gel Bead Kit v1 and the 10x Chromium Controller (10x Genomics, Pleasanton, CA) platform for microdroplet-based, single-cell barcoding. This was performed by the Genome Technology Access Center at the McDonnell Genome Institute (GTAC@MGI, Washington University in St. Louis). Libraries were sequenced at the GTAC@MGI on the NovaSeq Sequencing System (Illumina, San Diego, CA).
Raw reads were processed with Cell Ranger (v3.1.0). The raw reads were initially mapped to the mouse genome. Any remaining unmapped raw reads were then mapped to the MRV genome. These formed two gene count matrices used for analysis. Docker containers were used for reproducibility, with two different containers being used for different parts of the analysis. Primarily, abelean/seurat_desctools:4.1.0 was used, and abelean/seurat_monocle:4.1.1 was used for all scripts that included Monocle3. Data were analyzed in R (desc: 4.1.0, m3: 4.2.1) using the Seurat package (desc: 4.9.9.9044, m3: 4.3.0) and Monocle3 (m3: 1.2.9), the latter of which was used for pseudotime analysis. Scripts were run on the Washington University in Saint Louis RIS Scientific Compute Platforms.
Dimensionality reduction was performed using SCT integration in Seurat, using Mock as a reference, with the FindIntegrationAnchors, IntegrateData, and RunUMAP functions on default settings. Unbiased clustering was performed with FindNeigbors and FindClusters. A resolution of 1.0 was used in FindClusters based on the separation of cell types using canonical gene expression (53, 89–97). The data was split into indicated cell types with the subset function. The subsetting was based on the annotations used for the clustering, which were produced by labeling the clusters from FindClusters with the AddMetaData function. The annotations were made based on Feature Plots of canonical gene expression. Specific cell types were subsetted and had dimensionality reduction repeated for downstream analysis.
With the dimensionality reduction of certain data subsets (TECs, DCs, etc.), SCT integration did not distinguish cell types with a small sample size. Instead, the Harmony (desc: 0.1.1) package was used, using the RunHarmony function, which allowed for the resolution of these distinct cell types. For identifying differentially expressed genes (DEGs), FindAllMarkers was used with the Idents function used to select the clustering, followed by heatmaps with DoHeatmap. We selected markers based on the following criteria: only positive, minimum percent expressed ≥ 0.25, logFC ≥ 0.25, and adjusted p-value < 0.05. The package EnrichR (desc: 3.0) was used to calculate pathway enrichment based on the DEGs, using the enrichr function. Bar plots were generated using the ggplot2 (desc: 3.4.2, 3.4.0) package. The hierarchical heat map was generated with the pheatmap (desc: 1.0.12) package.
The package nichenet (desc: 1.1.1) was used to calculate interactions between specific cell types. Nichenet utilizes selected receiver and sender(s) from metadata, for which we used cell type annotations. Next, the gene expression between receiver and sender(s) is run through a database of potential ligand-receptor interactions. We examined was the DP or SP cells as the receivers, and cTECs or mTECs/DCs as senders, respectively.
ORF Analysis: Criteria for “infected” cells and “replicating” cells were as follows: infected cells were defined as having expression of at least one of each of the following ORFs: ORF55, ORF83, and ORF103, and replicating cells were defined as having expression of least three copies of four out of five of the following ORFs: ORF45, ORF53, ORF69, ORF73, or ORF86. For dimensionality reduction based on ORFs, barcodes with 0 reads were excluded. For “pseudokinetics” analysis with Monocle3, the package SeuratWrappers (0.3.0) was used to convert Seurat objects into a cell dataset format using as.cell_data_set. Next, the object was run through Monocle3, with learn_graph and order_cells functions used to generate the pseudotime. With the nodes produced by learn_graph, the node corresponding to the earliest biological stage was selected, i.e., the infected stage in the “infected vs. replicating” analysis. For the pseudo kinetics, ORFs with 0 gene counts were converted to 0.1 values for visualization on a log scale.
Cells were all cultured under sterile conditions and incubated at 37°C. MOHITO cells are a non-adherent, CD4+CD8+ T cell lymphoblastic leukemia cell line derived from a sublethally irradiated female BALB/c mouse (98). MOHITO cells were propagated in Prigrow II media with 20% FBS, 10ng/ml of recombinant mouse IL-7, and 1% Penicillin/Streptomycin (Abm). Media was changed every 2–3 days with retention of 20% conditioned media and cells were maintained at 4–8e5 cells/mL. Thymocytes (non-adherent) were dissected from day of life 7 mice by dissecting the thymus and mincing with scissors. After dissociation of thymocytes by pipetting, stromal debris was allowed to settle, and supernatant was passed through a 70μm filter. Cells were propagated in RPMI 10% FBS, 2 mM L-glutamine, 1 mM sodium pyruvate, 100 mM non-essential amino acids, 5 mM HEPES free acid, 10 ml of 5.5 × 10⁻² 2-mercaptoethanol, and 100 U/ml Penicillin/Streptomycin (Gibco). Media was changed every 2–3 days with retention of 33% conditioned media and cells were maintained at 0.5–1e6 cells/mL. mTE4–14 cells are adherent, spontaneously immortalized cells derived from primary mTEC culture isolated from the thymi of neonatal C3H/J mice (99). mTE4–14 cells were grown in DMEM 10% FBS, 1% Penicillin/Streptomycin (Gibco). Cells were grown on tissue culture treated plates, split using trypsin when confluent and replated at ~70% confluency. Media was changed every 2–3 days. Primary mTECs were harvested from day of life 7 BALB/c mice as described previously by dissecting a thymus and mincing it with scissors, followed by several rounds of vortexing and removal of supernatant to reduce the number of thymocytes (100, 101). Stromal pieces were then plated and mTECs were allowed to migrate onto the plate for 3–4 days. Media was changed with care not to disrupt adherent cells and to leave thymus pieces while removing remaining thymocytes. Media was changed every 2–3 days and after 10 days, remaining thymic debris was removed. Cells were split using trypsin. Primary mTECs were propagated in cFAD media: DMEM/Ham’s F12 1:1 (Gibco), 5% FBS, Insulin 3μg/mL (Sigma), Cholera toxin 10ng/mL (Sigma), epidermal growth factor 20ng/mL (Sigma), hydrocortisone 0.5μg/mL (Sigma), adenine 24μg/mL (Sigma), 1% Penicillin/Streptomycin (Gibco). Flow cytometry was used to verify expression of expected cell surface markers for each cell type (MOHITO culture: CD4+CD8+; Thymocyte culture: CD4 and CD8 to identify DN, DP, and SP populations; mTE4–14 and primary mTEC culture: EPCAM+UEA1+Ly51-).
Cells were counted via a hemocytometer before infection and 2.5e5 cells were added per well. Cells were then infected with 1 genome/cell as determined by qPCR analysis of in vivo stocks prepared as described above (2). 24 hours post infection, cells were washed with PBS and media was replaced. Media was changed every 3–4 days. Cells were collected by centrifugations for non-adherent cells and by trypsin digestion for adherent cells. Cell counts were performed using a hemocytometer and recorded before storage of cells to ensure known cell counts per sample to calculate number of genomes per cell and for graphical representation as MRV genomes per 2.5e5 cells.
DNA was prepared from cell culture using the QIAAmp Kit (Qiagen). qPCR of DNA was performed in technical duplicate using Taqman Universal Master Mix II (Applied Biosystems) on a StepOnePlus or a QuantStudio 3 real-time PCR machine (Applied Biosystems). MRV ORF69 was quantified using a plasmid of known base pair number containing the ORF69 gene, which was used as a standard curved and to calculate number of genomes in the sample. Primers used included ORF69 (5′-CAAGTCTGATTGAGGATTCACTTTATG-3′, 5′-56-FAM/TCCAAATCC/ZEN/ACAATTCCCGTCTCTGT/3IABkFQ-3′, and 5′-CGTCGATAGTTGGCAAGAAGA-3′).
The data were analyzed for statistical significance using GraphPad Prism 10. We used multiple Student’s t-test for multiple comparison of 2 groups. Statistical significance was denoted as * for p < 0.05. Comparisons without significance are not marked except. Error bars represent standard deviation for all graphs.
All sequencing data is available on the NCBI Gene Expression Omnibus under accession GSE255738. Code will be available at https://github.com/abelean/MRV-R-analysis.
We utilized single-cell RNA sequencing (scRNAseq) to identify MRV tropism in the thymus. At 7dpi, there was prominent depletion of CD4+ single positive (CD4SP) and CD4+CD8+ double positive (DP) thymocytes, while at 3 and 5 dpi there was minimal or partial reduction in CD4SP and DP populations (Supplementary Figure 1A) (15, 17). At 6dpi, CD4SP and DP depletion is detected compared to mock infected mice, but there remained an adequate number of both populations for analysis (Figure 1A). We therefore performed scRNAseq of the entire thymus of BALB/c mice after mock or MRV intraperitoneal infection at DOL 0. At 6dpi the thymus was dissected from three individual mice, digested to single cell suspension, combined into a single sample, then submitted for scRNAseq (Figure 1A).
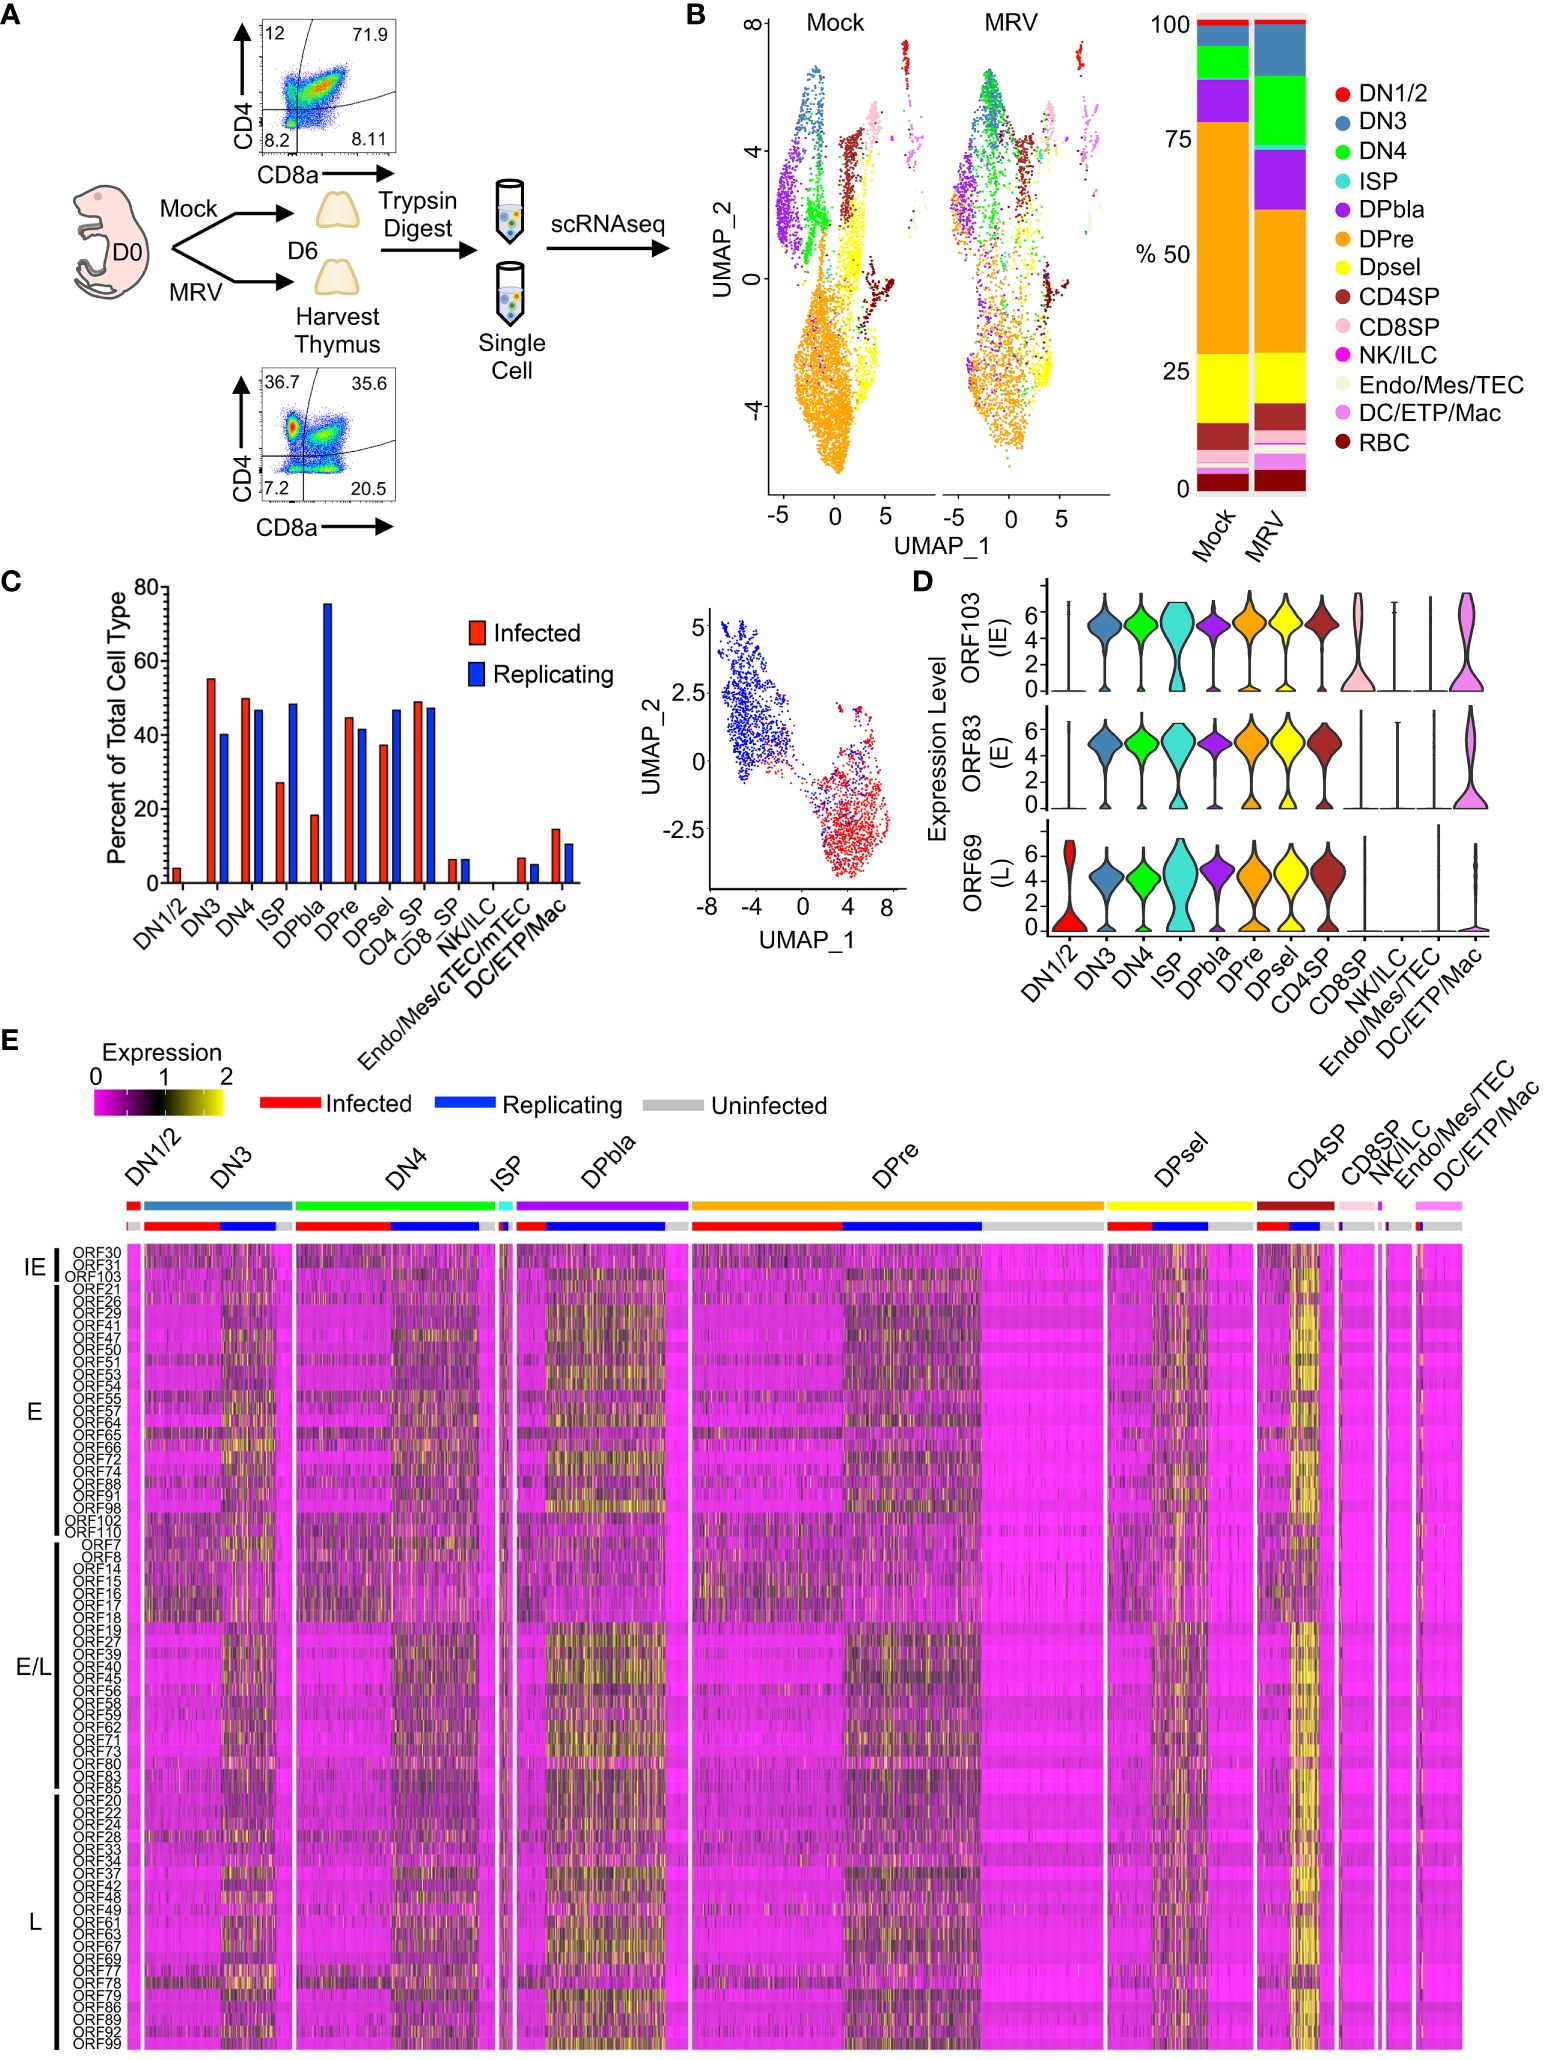
Figure 1 scRNAseq identified MRV tropism in the thymus after neonatal infection. (A) Overview of experimental setup: Mock or MRV infection was performed on day of life (DOL) 0. At 6 days post infection (dpi) the thymus was collected. Mock and MRV infected thymuses were processed in parallel. Flow cytometry was performed to demonstrate depletion of DP population on DOL 6. The thymus as digested with trypsin to obtain single-cell suspensions that were submitted for scRNAseq. (B) UMAP of thymocytes split by infection (Mock vs MRV, left panel), and proportions of identified cell types (right panel). (C) Proportion of “Infected” and “Replicating” cells within MRV-infected samples (see Methods for defining ORFs) (left panel). UMAP of infected and replicating cells defined by MRV ORF expression (right panel). (D) Violin plots of key canonical ORF expression by cell type. (E) Heat map of ORF expression, ordered by stages of thymic development and infection status (infected/replicating/uninfected). ORFs were ordered by putative kinetics based on homology to HHV-6 and HCMV: immediate early (IE), early (E), early/late (E/L), and late (L).
Unbiased clustering of mock vs MRV infected thymus demonstrated populations of cell types expected to be found in the thymus, including thymocytes at different stages of development, i.e. the double negative (DN), DP, and single positive (SP) stages, as well as natural killer cells or innate lymphocyte (NK/ILC), endothelial/mesenchymal cells, thymic epithelial cells (TEC), dendritic cells (DC), early thymic progenitors (ETP), and macrophages/monocytes (Figure 1B). We identified alterations in the percent and number of various populations after MRV infection, notably a relative reduction in the DP populations after MRV infection (Figure 1B). To differentiate cells that were uninfected, MRV infected, or infected and supporting MRV replication (referred to as “Uninfected,” “Infected,” and “Replicating” henceforth) we utilized known patterns of herpesvirus gene expression to establish a criterion to define tropism and the stage of viral replication cycle. Putative MRV ORF kinetics were assigned based on homology to HHV-6 and HCMV. Cells expressing at least one transcript of ORF55 (E), ORF83 (E), and ORF103 (IE), but not demonstrating robust expression of early/late or late genes were labeled as “Infected.” Cells with robust expression of all stages of ORF expression, which would suggest MRV replication, were labeled as “Replicating” [i.e., expressing at least three copies (unique molecular identifiers) of 4 out of 5 of the following ORFs: ORF45 (E/L), ORF53 (E), ORF69 (L), ORF73 (E/L), or ORF86 (L)] (82, 84). We then identified the percentage of cells that were MRV infected or replicating, and found that DN3, DN4, DP, immature single positive (ISP), and CD4SP all supported infection and replication in >25% of cells, while lower levels were observed in other cell populations (Figure 1C). UMAP dimensional reduction using viral ORF expression of cells designated as either infected vs replicating demonstrated two clear transcriptional clusters, supporting our approach to differentiating these stages of infection (Figure 1C).
Evaluation of representative viral ORF expression from IE [ORF103 (HCMV UL122/123 and HHV-6 U86 homologue)], E [ORF83 (HCMV UL97 and HHV-6 U69 homologue], and L [ORF69 (HCMV UL82/83 and HHV-6 U54 homologue)] stages in each cell type showed robust expression in cell types classified as replicating (Figure 1D). We next identified patterns of expression in each cell type, differentiated by uninfected, infected, or replicating. We found that cells designated as supporting MRV replication demonstrated robust expression of most MRV ORFs, with CD4SP showing the highest relative ORF expression (Figure 1E). In contrast, the relative expression of IE ORF30 and ORF31 (HCMV UL47 and UL38 respective homologues, HHV-6 U30 and U19 homologues), ORF14, 15, 16, 17, 18 (US-22-like), and ORF78 (HCMV UL93 and HHV-6 U64 homologue) were increased in cells classified as MRV infected compared to replicating (Figure 1E and Supplementary Figure 1B). These data establish the pattern of MRV thymic tropism after neonatal infection with DN3, DN4, DP, ISP, and CD4SP infected at a high percentage, while lower percentage of infection occurred in other cell types. Moreover, we identified distinct patterns of MRV ORF expression at different stages of infection.
Specific cell surface and transcriptional markers have been used to differentiate the DN stages (Figure 2B) (43). We found that at 6dpi, neonatal MRV infection resulted in a modest relative reduction in DN1/DN2 cell number and percentage, and an increase in the relative number of DN3 cells (Figure 2A). Evaluation of differentially expressed genes (DEGs) demonstrated considerable transcriptomic alterations after MRV infection. Genes that play important roles in DN cell development and signaling (i.e. Tcf7, Lat, Bcl11b, Notch1, Lck, Hes6, Rorc, Themis, Zap70 and Dock8), cell cycle (Cdk1), and TCR rearrangement (Rag1, Rag2) were downregulated by MRV infection. Genes involved in interferon signaling (i.e. Isg15, Irf7, Ifit1, Ifitm3, Stat1, Irf1 and Irf2) as well as tumor necrosis factor (TFN) signaling and apoptosis/autophagy (Bax, Tnfaip8, Bcl10, Atg5) were upregulated during MRV infection (Figure 2C).
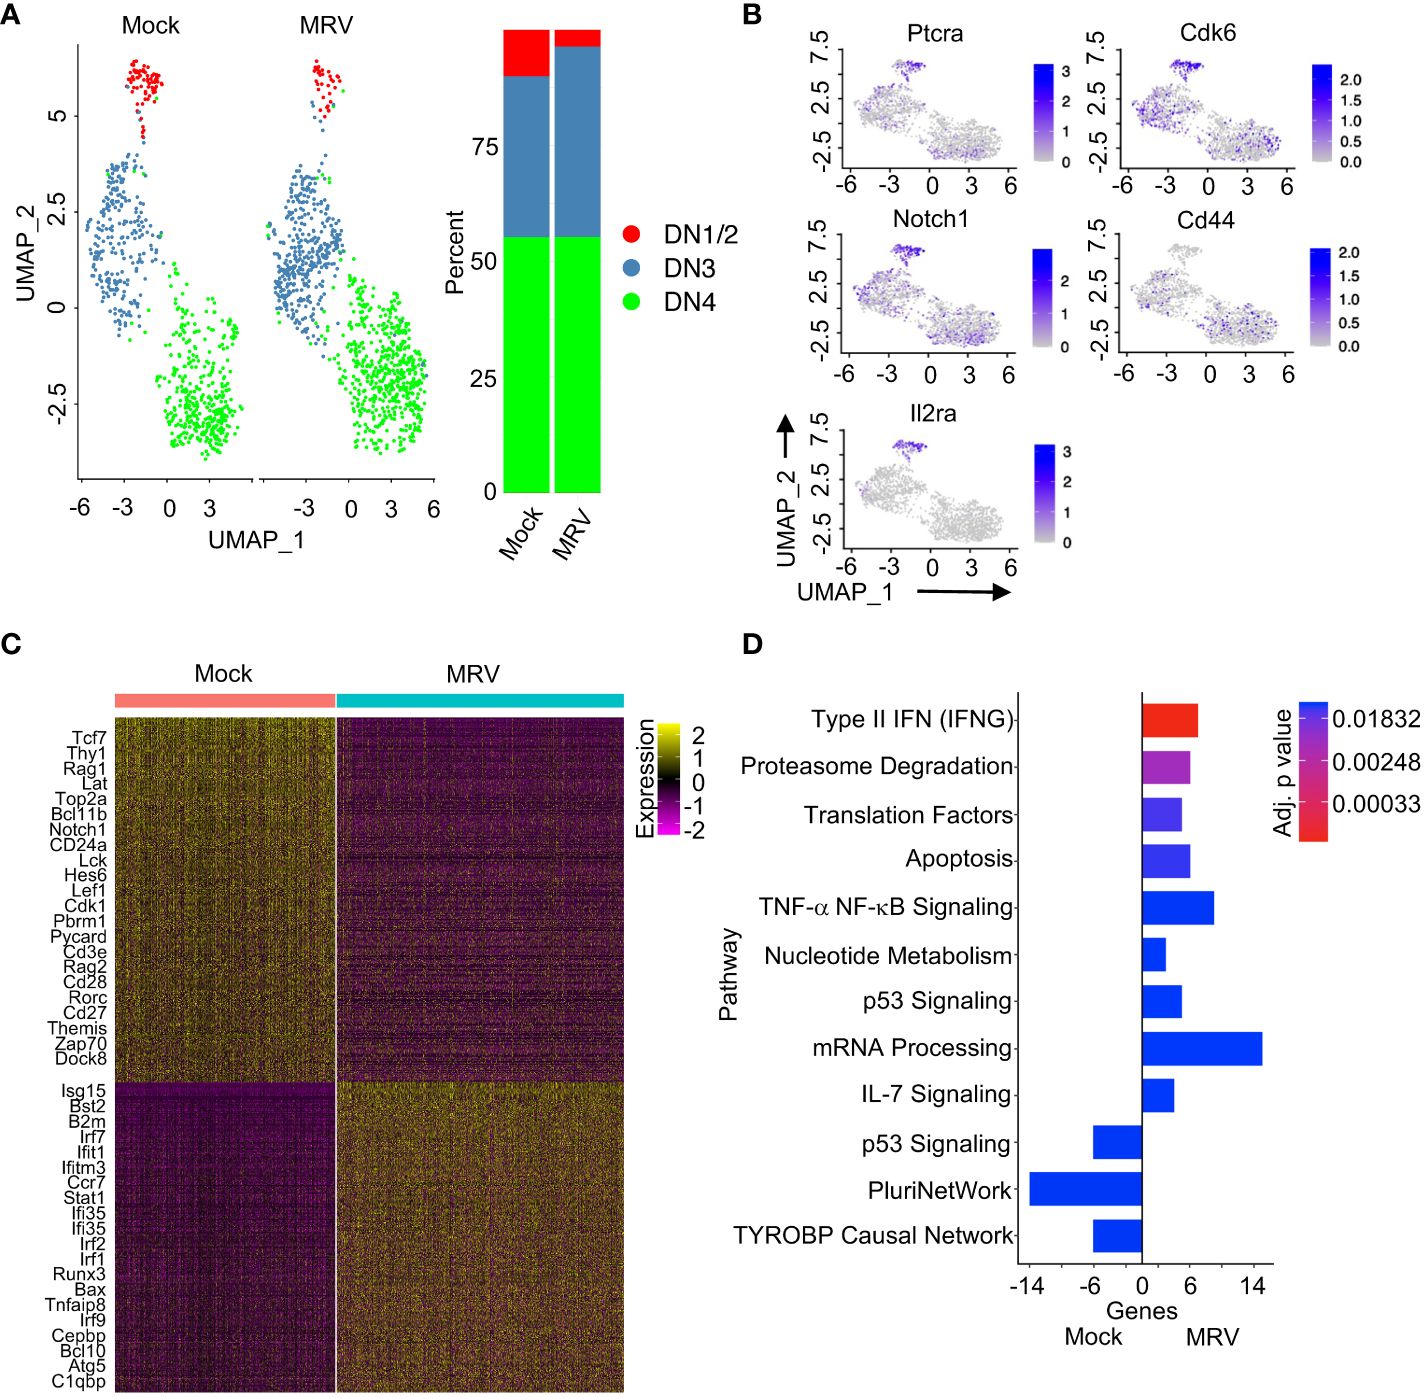
Figure 2 Neonatal MRV infection disrupts DN thymocyte transcription. (A) UMAP of the DN populations split by infection (left panel) and proportions of identified cell types (right panel) are shown. (B) Expression of indicated DN marker genes are shown on UMAP. (C) Heat map of DEGs for DN thymocytes between Mock vs. MRV. Relevant genes are displayed. (D) Enrichment of indicated pathways in DN thymocytes for Mock and MRV. + genes are upregulated in MRV and – genes are upregulated in Mock.
Pathway analysis confirmed that neonatal MRV infection induced upregulation of genes involved in type II IFN, proteasome degradation, translation, apoptosis, TNF signaling, mRNA processing, and IL-7 signaling pathways (Figure 2D). Of note, there were genes involved in p53 signaling pathways that were either up- or downregulated by infection (Figure 2D). Many of these pathways have been demonstrated to be manipulated by herpesvirus infections. Interestingly, neonatal MRV infection resulted in downregulation of genes involved in pluripotency (PluriNetWork) (102) and the TYROBP pathway that is associated inflammation (TYROBP causal network) (Figure 2D) (103). Pathway analysis of each DN population demonstrated relatively less transcriptomic alteration in DN1/DN2 cells compared to alterations induced by MRV in DN3 and DN4 which was characterized by type II IFN, proteasome degradation, cell cycle, and metabolic pathway dysregulation (Supplementary Figures 2A–C). The DN3 population demonstrated downregulation of Delta-Notch and pluripotent signaling pathway genes, both of which are involved in DN cell differentiation (Supplementary Figures 2A–C) (35, 45). These data provide insight into how MRV disrupts thymocyte development through alteration of expression of genes that contribute to DN cell differentiation, TCR formation, cell cycling, and inflammation.
We next evaluated the impact of MRV on the three DP stages of thymocyte maturations (DPbla, DPre, and DPsel) (53). We observed an increase in the relative number of DPbla and reduction in the relative number of DPre thymocytes after MRV infection (Figure 3A). Expression of Ki67 and CD2 has been used at a transcriptional and protein level to differentiate the DP stages (53). As has been previously demonstrated, we found the highest expression of Mki67 in DPbla cells and the highest expression of Cd2 in DPsel cells (Figure 3B). Expression of both markers was decreased by MRV infection (Figure 3B).
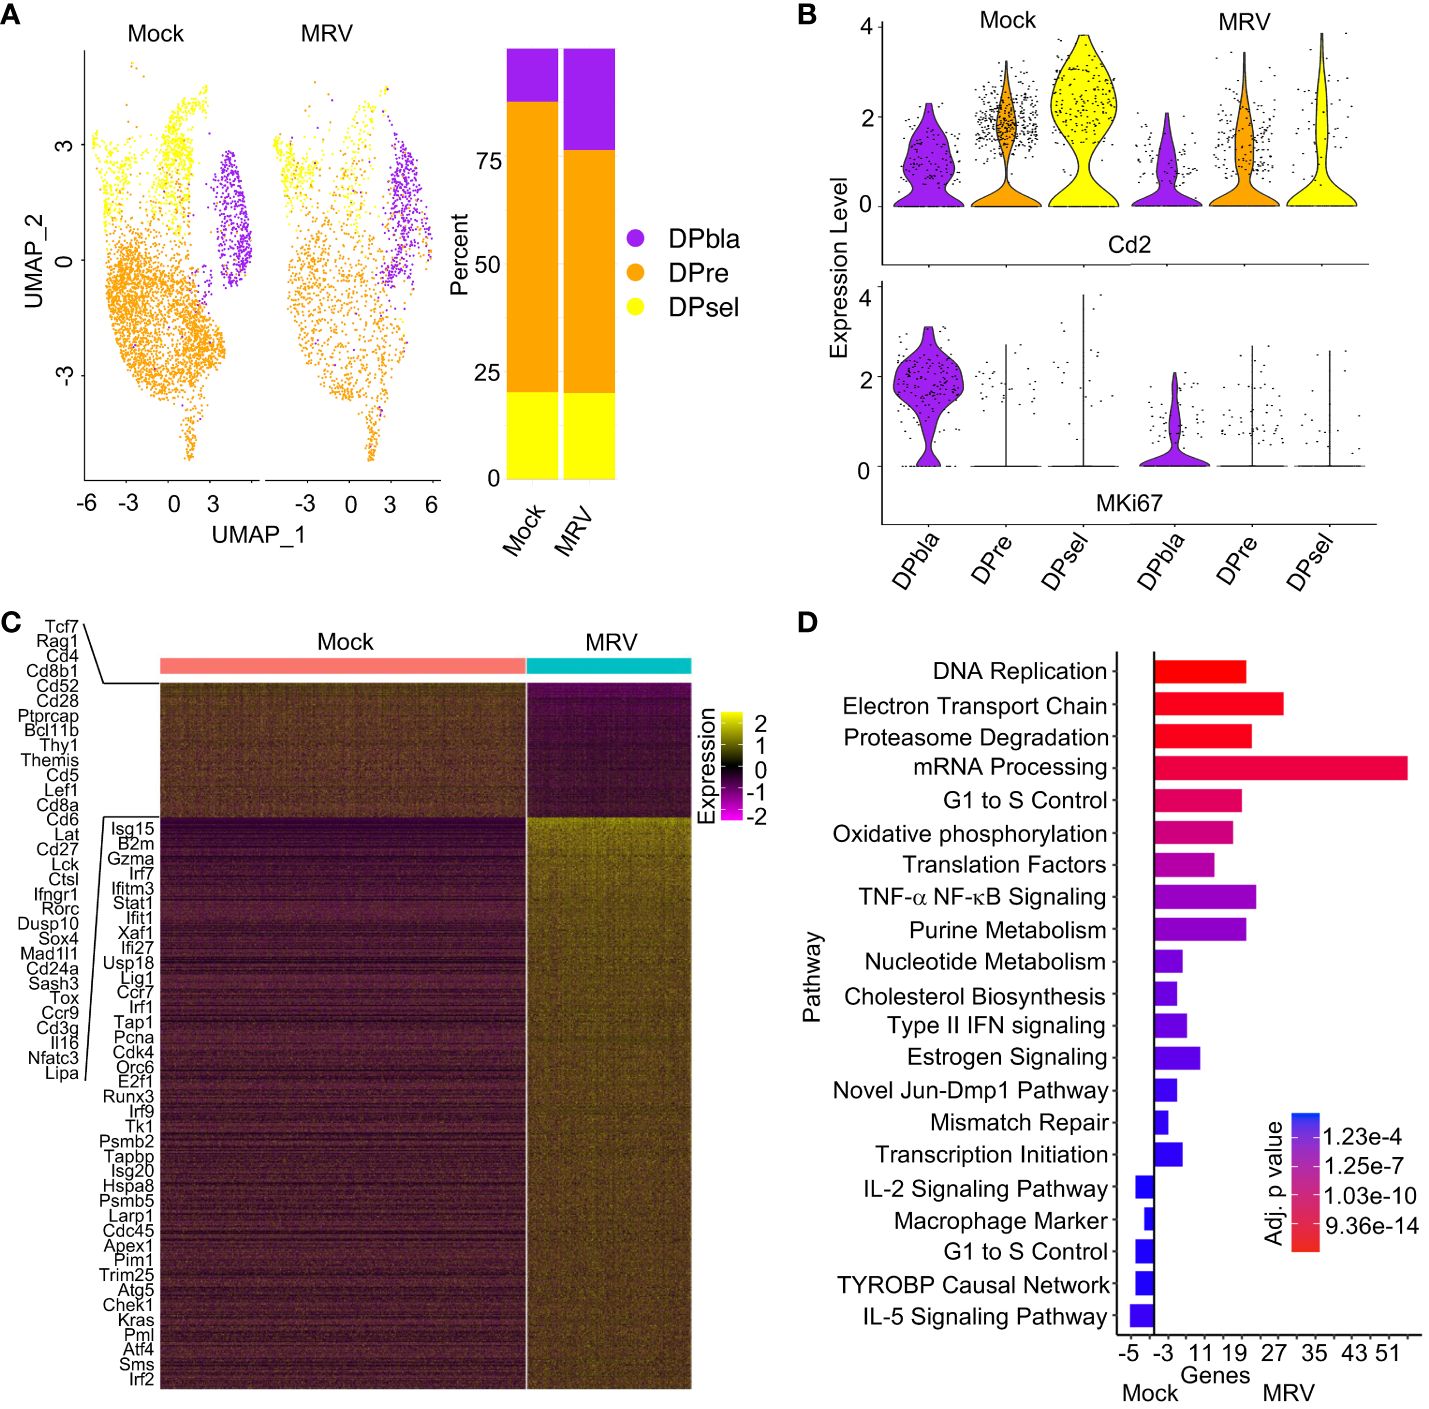
Figure 3 Neonatal MRV infection results in broad transcriptomic alteration in DP cells. (A) UMAP of the DP populations split by infection (left panel) and proportions of identified cell types (right panel). (B) Violin plots of Cd2 and Mki67 for each DP population split by infection. (C) Heat map of DP populations finding DEGs between Mock vs. MRV, representative genes are shown. (D) Enrichment of indicated pathway in DP thymocytes for Mock vs MRV.
As observed in DN cells, MRV infection resulted in downregulation of genes that contribute to thymocyte and TCR development including Tcf7, Rag1, Cd4, Cd8, Cd28, Bcl11b, Thy1, Themis, Cd5, Lat, Cd27, Tox, and Cd3g (Figure 3C). As expected, there was upregulation in genes involved in IFN signaling (Figure 3C). Pathway analysis of all DP cells demonstrated MRV-associated upregulation of pathways known to be manipulated by herpesvirus infections including DNA replication, proteasome degradation, mRNA processing, cell cycle, and cholesterol biosynthesis (Figure 3D) (66). TYROBP causal network genes were downregulated by MRV infection, as were IL-5 signaling pathway genes (Figure 3D). Despite DPbla displaying the highest percent of cells meeting cutoff for supporting MRV replication among the DP populations, there were the fewest observed DEGs and pathway alterations. The DPbla population demonstrated the greatest downregulation of cell cycle control and pluripotency genes after MRV infection (Supplementary Figure 2D). DPre and DPsel demonstrated similar DEG and pathway changes, which included altered expression of cell cycle and DNA replication, metabolism, IFN and cytokine (IL-2, IL-5), and pluripotency pathway genes (Supplementary Figures 2E, F).
A characteristic feature of neonatal MRV infection is thymic and peripheral CD4+ thymocyte and T cell depletion (2, 15–17). Indeed, CD4SP thymocytes demonstrated robust expression of IE, E and L genes and, likewise, broad transcription dysregulation (Figure 4A). Pathway analysis revealed upregulation of metabolic pathways (i.e. electron transport, oxidative phosphorylation, proteasome, estrogen signaling, one carbon, animo acid pathways), DNA replication and cell cycle pathways, mRNA and translational pathway, mismatch repair, type II IFN, and TNF-α pathway genes (Figure 4B). As in other thymocyte populations, MRV infection was associated with TYROBP signaling, but several other pathways were also downregulated after MRV infection in CD4SP thymocytes, including cell adhesion, glycolysis, chemokine and cytokine signaling (IL-3, IL-2, and IL-5), and cytoskeleton regulation pathway genes (Figure 4B). In contrast to CD4SP thymocytes, there were few CD8SP thymocytes demonstrating MRV transcripts to suggest infection or replication (Figure 1E). We did observe differential transcriptomic profiles in the CD8SP population when comparing mock vs MRV (Figure 4C). These transcriptome differences demonstrated activation of type II IFN and cytokine (IL-9, IL-2, IL-7, IL-6 and IL-5) pathways, while we did not observe differences in genes involved in cell cycle, metabolic, and nucleic acid pathways that were altered in MRV susceptible populations (Figure 4D).
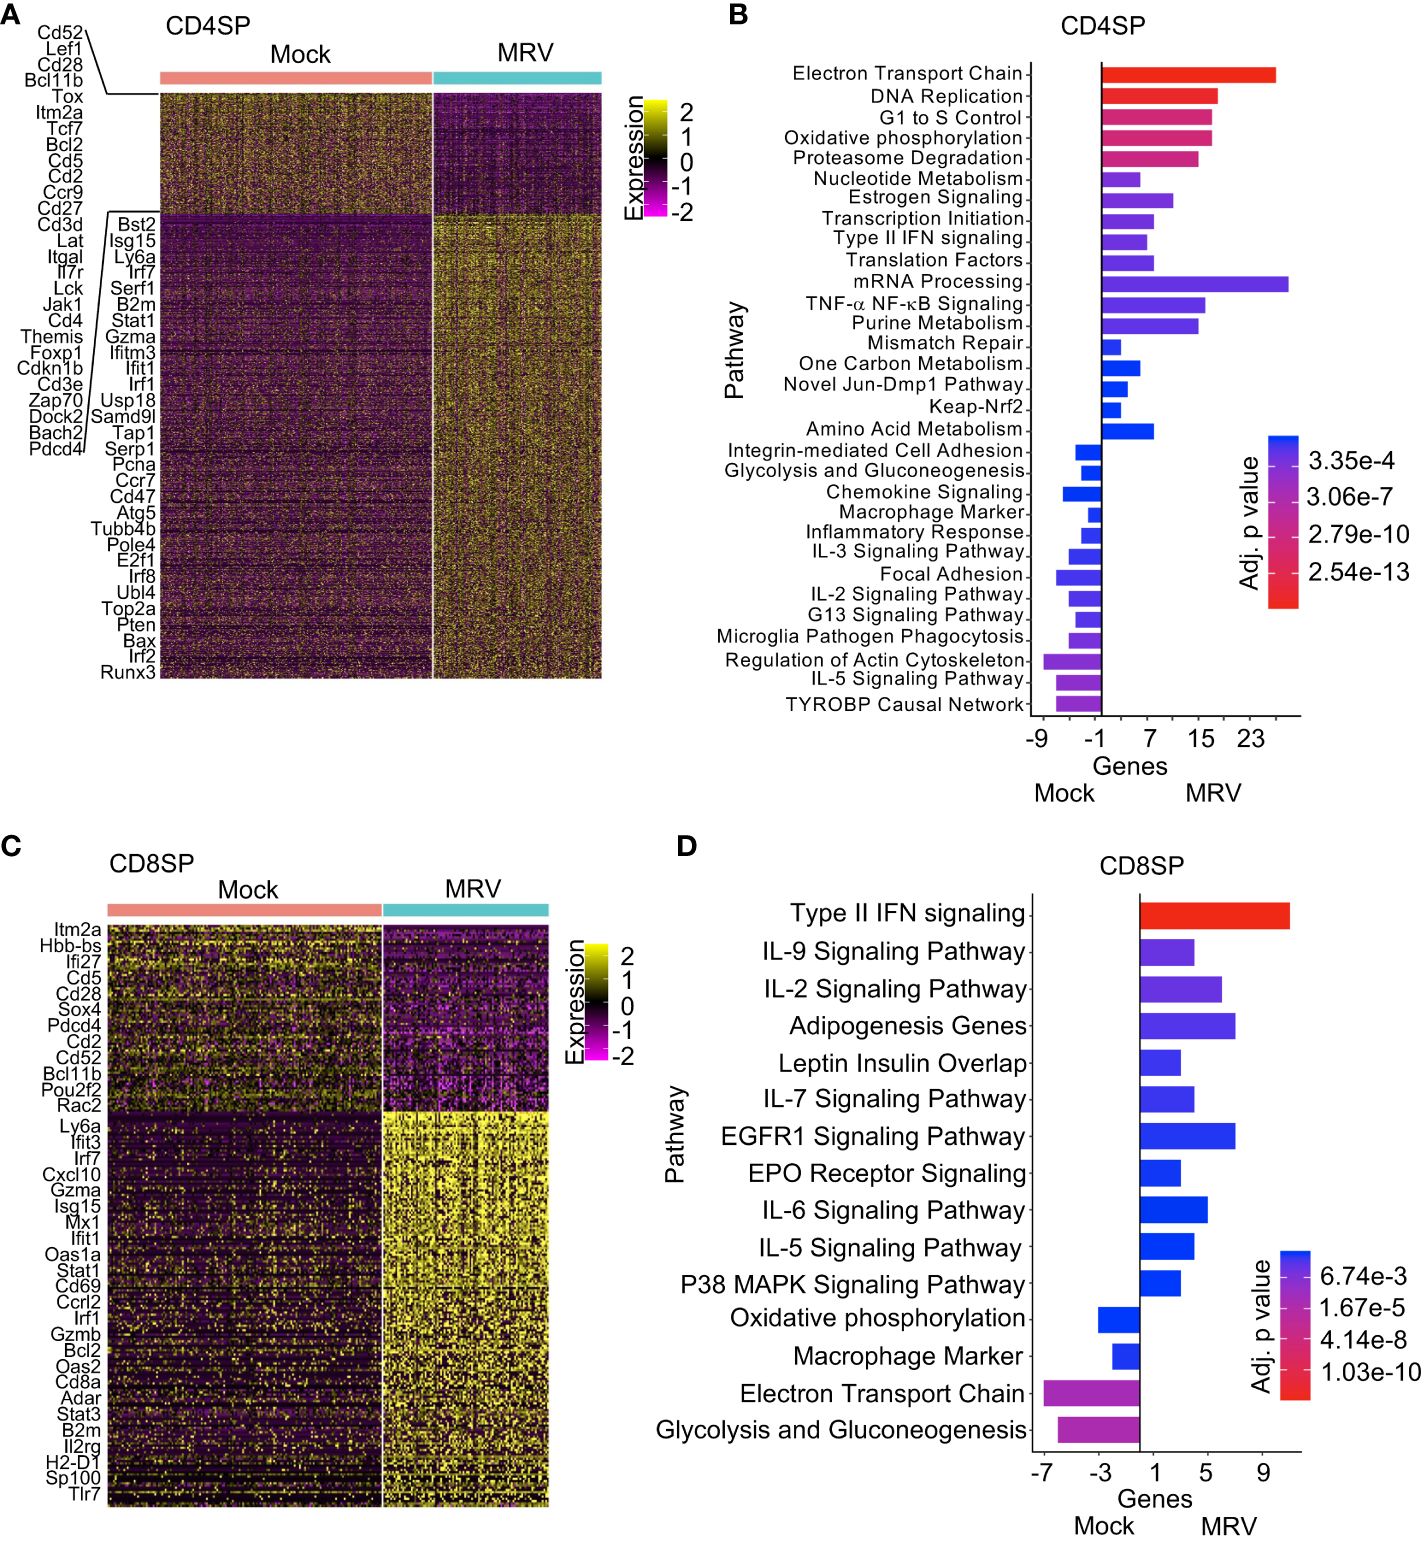
Figure 4 Pathway analysis of CD4SP and CD8SP identifies differential response to neonatal MRV infection. (A, C) Heat map analysis of DEGs of Mock vs. MRV with representative genes shown. (B, D) Enrichment of indicated pathways in SP thymocytes for Mock and MRV.
We then utilized Immune Response Enrichment Analysis to evaluate the cytokine signature of DN, DP, CD4SP and CD8SP cells, which is based on the data collected by Cui, et al. in which transcriptional responses to individual cytokine stimulation were measured (104). For all cell types, the dominant enrichment included IFN-α1, IL-36a, and IFN-β, although IFN-γ, IL-7, IL-18, IL-15, NP, IL-12, TL1a and IL-2 were also enriched (Supplementary Figure 3). For CD8SP, IFN-α1and IFN-β were considerably more represented compared to DN, DP and CD4SP. Finally, we evaluated expression of cytokine transcripts and found that the majority of Ifng expression occurred in NK/ILCs, Il18 expression in DCs, Endo/Mes cells, ETPs, and monocytic cells, and expression of Il7, Il15, and Tnfsf15 in mTECs. Overall, this data demonstrates the pattern of cytokine expression and response in the thymus after MRV infection.
The DPre, DPsel and CD4SP populations exhibited comparable numbers of cells that were MRV infected, replicating, or uninfected (Figure 5). We therefore sought to identify upregulated genes associated with the viral replication cycle that were shared across distinct cell types. We found 117 genes that were upregulated in cells assigned to the MRV replicating group in all three cell populations (Figure 5D). Pathway analysis showed that genes involved in DNA replication, cholesterol metabolism, cell cycle control, and nucleotide metabolism were upregulated (Figures 5E, F), demonstrating a cell-intrinsic effect of viral replication on the transcriptional regulation of these pathways. Importantly, pathways that are known to be affected by herpesvirus infections and are crucial to replication were represented in cells supporting MRV replication. Taken together, these data demonstrate a transcriptomic signature of MRV infection and replication characterized by virus-mediated disruption of pathways involved in cell cycle control, nucleotide metabolism and DNA replication, and cholesterol metabolism in DP and CD4SP thymocyte populations.
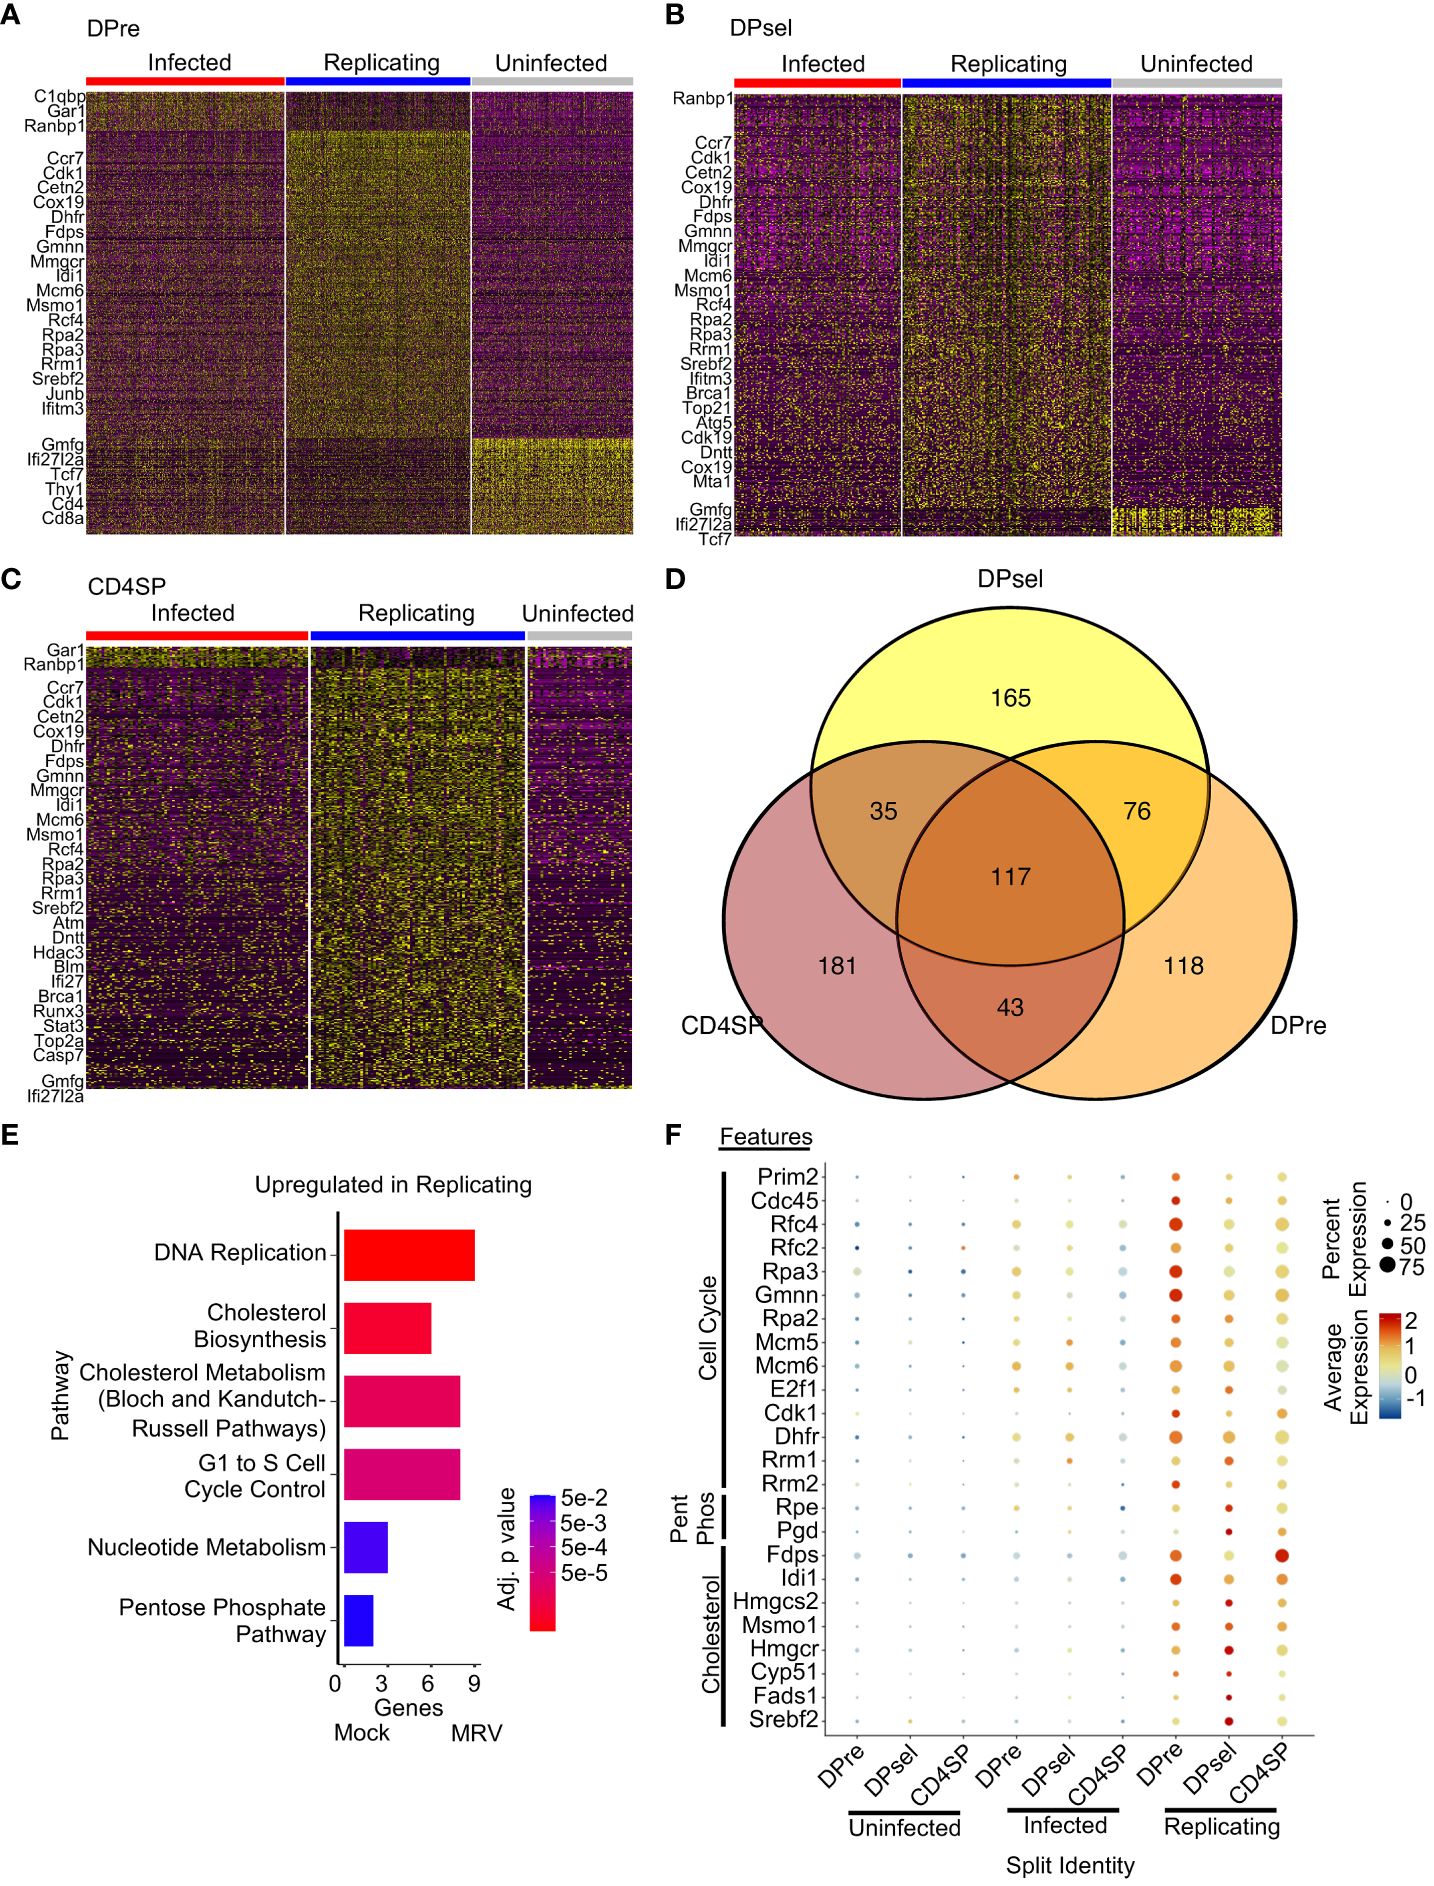
Figure 5 Overlap of transcription disruption after MRV infection by infection status reveals shared features of cells supporting MRV replication. Heatmaps of DEGs between infected, replicating, and uninfected cells for DPre (A), DPsel (B), and CD4SP (C). Representative genes for each group are shown. (D) Venn Diagram of DEGs from the replicating clusters were then compared. (E) Pathway analysis of replicating related DEGs that are present in at least 2 cell types. (F) Dot plot analysis of genes representing pathway changes by cell population and infection status (Pent Phos = Pentose Phosphate Pathway).
Thymocytes constitute most of the cells in the thymus, but other cell types play crucial roles in thymic function. Subsetting and clustering of these minority cell populations in our samples revealed the presence of cTECs, mTECs, DCs, endothelial and/or mesenchymal cells (Endo/Mes), ETPs, granulocytes, and monocytic cells (Figure 6A). We observed an increased percentage of ETP, granulocytes, and monocytes/macrophages after MRV infection (Figure 6A). Based on MRV gene expression, a minority of endo/mes, ETPs, and mTECs appear to support infection and replication, a minority of DCs appear to be infected without replication, and cTEC, granulocytes, and monocytes/macrophages do not support infection or replication (Figures 6B, C).
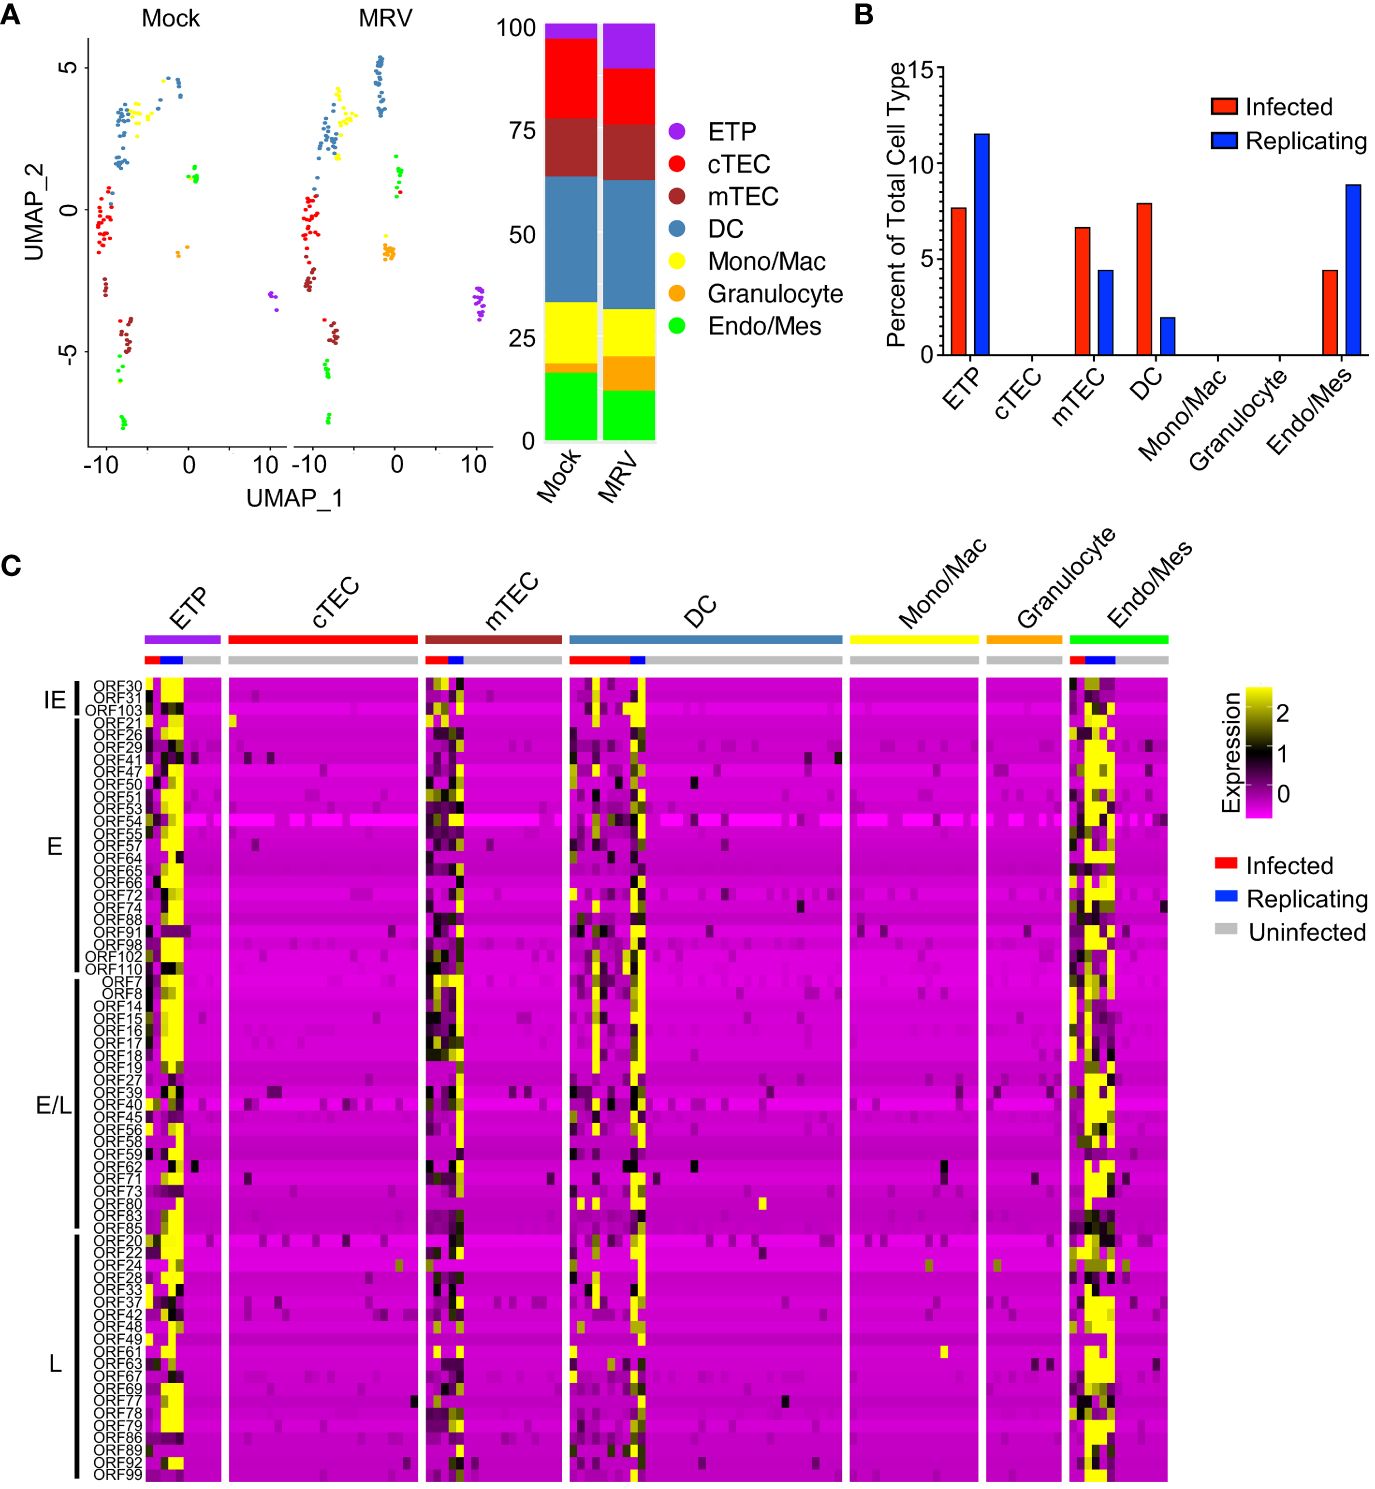
Figure 6 MRV infection of non-thymocyte cells includes mTECs, DCs, and ETPs. (A) UMAP and proportion graphs (left and right panel, respectively) of the non-thymocyte cells. (B) Percent of MRV cell types demonstrating MRV ORF expression suggestive of MRV infected or replicating. (C) Heat map of ORFs as in Figure 1E.
DEG analysis of DCs showed that MRV infection led to downregulation of Rpl23 and Rps27a, ribosomal proteins that have been shown to be involved in dendritic cell activation, antigen presentation and cytokine production (Figure 7A) (88, 105). A greater number of genes are upregulated in DCs after MRV infection, many of which are involved in the innate immune response (i.e. Ifit1, Ifit3, Mx1, Gbp2, Oasl1, Isg15, Ccr1, Ifitm2, Oaxl2, Casp1, Casp4) that would be predicted in response to a viral infection (Figure 7A). In mTECs, we observed an overall downregulation of genes involved in antigen presentation, Notch signaling/selection, and TRAs after MRV infection. Genes involved in negative regulation of type I IFN (Pdcd4, Tfdp2, Cdc37, Ifi27) were downregulated while genes involved in or reflective of increased IFN signaling were upregulated (Figure 7B). These data suggest that antigen presenting cells that contribute to central tolerance demonstrate transcriptomic dysregulation during neonatal MRV infection.
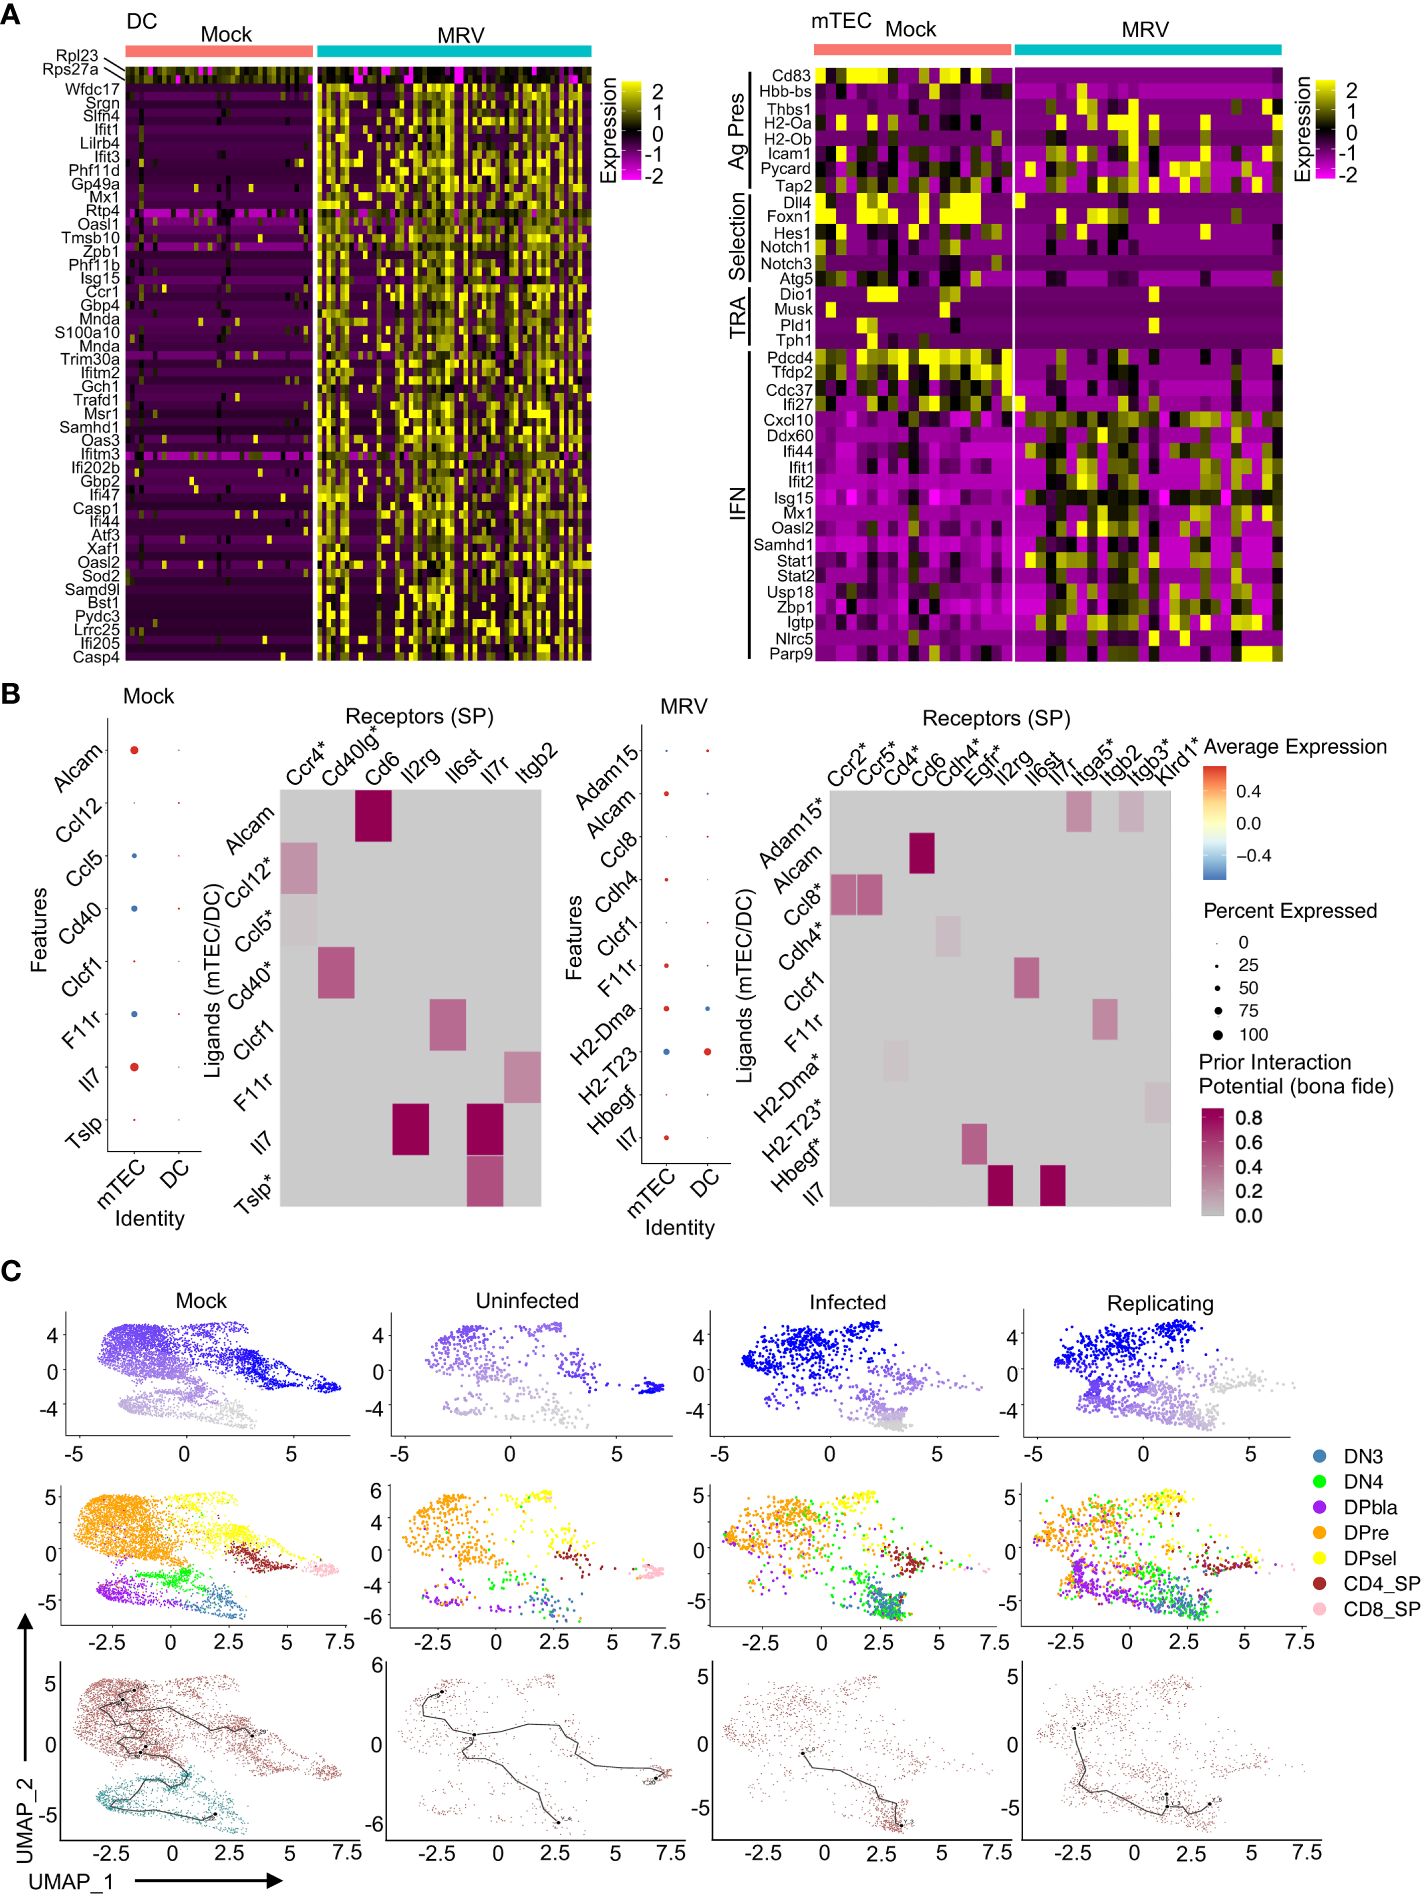
Figure 7 MRV infection results in transcriptional alterations in DC and mTECs that are associated with disruption of thymocyte development. (A) Heat maps of DEGs in DCs and mTECs for Mock vs. MRV. (B) Nichenet analysis of SP receivers and mTEC/DC senders. Dot plots show potential ligands split by cell type. Heat maps show the strength of potential ligand-receptor interactions. Ligands correspond to SP and receptors to mTECs/DCs. Asterisk represents interaction unique to mock or MRV. (C) Pseudotime analysis of developing thymocytes split by Mock or MRV uninfected, infected, or replicating. The first row is composed of pseudotime plots. The second row is UMAPs of cell types. The third row is the roots and nodes used to generate the pseudotime.
Our previous work established a potential link between neonatal disruption of central tolerance by MRV infection and development of autoimmunity later in life (2). As MRV infection induced transcriptional disruption in both thymocytes and the antigen presenting cells that mediate thymocyte selection, we utilized network analysis to identify interactions between DP and SP thymocytes and antigen presenting cells within the thymic environment (106). We found that mTECs demonstrated the strongest signal of interaction with SP cells in the mock and MRV infected thymus (Figure 7B). Interestingly, in SP thymocyte to mTEC/DC analysis, MRV infection resulted in a loss of the Ccl12/Ccl5:Ccr4 and Cd40:Cd40lg potential interaction and a gain of Adam15:Itga5/Itgb3, Ccl8:Ccr2/Ccr5, Cdh4:Cdh4, H2-Dma: Cd4, H2-T23:Klrd1, and Hbegf: Egfr potential interactions (Figure 7B). Similarly, MRV infection resulted in putative alteration in interactions between cTECs and DP cells that included a potential loss of the Ptn: Ptprz1 interaction and a gain of Cyr61:Itgam, Hbegf: Egfr, Lamb1:Itga6, Plau: Plaur, and Sema3f:Plxna3, among other interactions (Supplementary Figure 4). Moreover, pseudotime analysis of thymocytes suggested that MRV infection and replication resulted in disruption of the transition of DN to DP cells and DP to SP cells that was not observed in the mock infection or in uninfected cells from the MRV infection sample (Figure 7C). Taken together, these data demonstrate infection and transcriptomic dysregulation of DCs and mTECS, and altered DC and mTEC interactions with DP and SP thymocytes that results in disruption of normal thymocyte development.
MRV genes were assigned to a kinetic phase based on homology to HHV-6 and HCMV, although 55 genes had unknown kinetics due to unclear homology or homology to uncharacterized genes. We used pseudotime analysis of MRV ORFs to determine expression levels by thymocyte type or by infection status, which we termed “pseudokinetics.” The IE ORF31 was expressed in most thymocytes, but expression was highest in cells classified as infected (Figures 8A, B). This pattern was observed in all IE genes (Supplementary Figure 5A). A representative E and a representative L gene, ORF73 (major capsid protein) and ORF69, both demonstrated the highest expression in DP and CD4SP, as well as cells assigned as replicating compared to infected (Figures 8A, B). E/L gene, ORF83 appeared biphasic and was present in all cell types and infection status, comparable to what was observed for its HCMV homologue, UL97 (Figures 8A, B) (82). While the majority of E, E/L and L genes showed increased expression over the course of progression from infected to replicating, some genes demonstrated stable or decreasing expression (Supplementary Figures 5B, 6). Some of the MRV ORFs with unknown kinetics showed low or no expression. ORF2, 13, 108, 112, and 115 showed a trend of decreased expression in cells designated as replicating vs infected. Many of the other ORFs demonstrated pseudokinetics consistent with E, E/L or L kinetics in which expression increased upon progression from infected to replicating (Supplementary Figure 7). By establishing pseudokinetics based on ORF expression level by cell type and infection status, we identified patterns of expression that suggest the kinetic stage of expression.
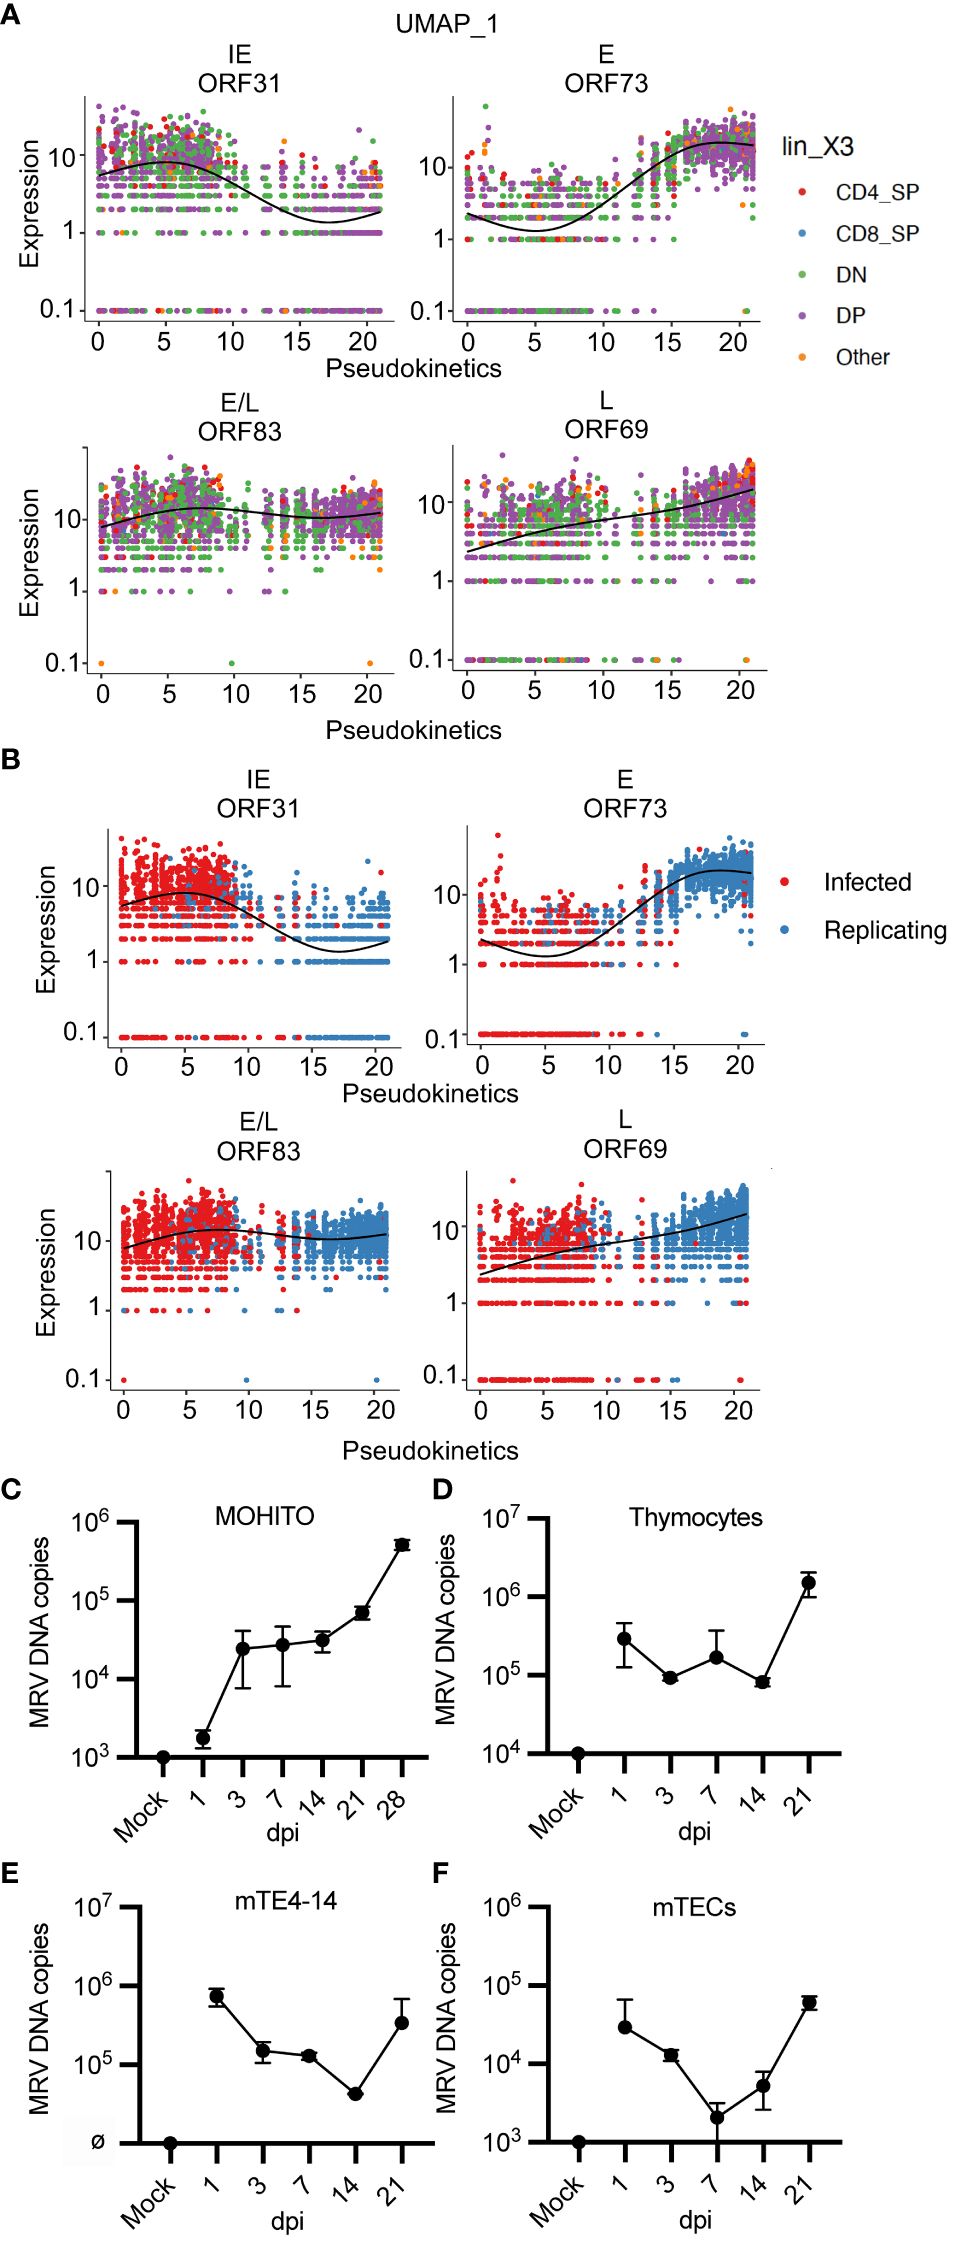
Figure 8 “Pseudokinetics” analysis demonstrates ORF kinetic patterns and MRV replicates in vitro in a T cell line, thymocytes, and mTECs. (A, B) Plots show expression of representative ORFs in each stage of infection, colored by (A) cell type and (B) infected vs. replicating status. (C-F) Cells were infected with MRV (1 genome/cell into 2.5e5 cells), performed in duplicate, and harvested at the stated time point as dpi compared to mock (uninfected at day 0) and input. Cells were washed after 24 hpi before collected of cells. MRV DNA was analyzed by qPCR and represented as MRV DNA (genome) copies per 2.5e5 cells for (C) MOHITO cells, (D) primary thymocytes, (E) mTE4–14 cells, and (F) primary mTECs. Error bars represent standard deviation.
We next evaluated MRV ORF expression by either infection or replicating status. We grouped ORFs by putative kinetics based on homology or as genes with unknown kinetics. There were 12 MRV ORFs that demonstrated increased relative expression in cells designated as infected compared to replicating (Supplementary Figures 1B, 6, 7). This included genes with predicted kinetics based on homology to HHV-6 and/or HCMV (ORF30, 31, 102, 110, 14–18 and 78) as well as genes with unknown kinetics (ORF2 and ORF108), suggesting that these ORFs have shared kinetics (Supplementary Figures 1B, 7). Most of the remaining genes with kinetics predicted by homology were expressed at higher levels in cell designated as MRV replicating, while some of the unknown genes also demonstrated increased expression in cells designated as replicating (ORF11–13, 35, 36, 38, 60, 68, 70, 75, 76, 81, 82, 101, 111, U25, U32) (Supplementary Figure 1B, 7). Finally, we performed hierarchical analysis of MRV ORFs which identified three distinct groups of cells with a differential pattern of ORF expression that were mostly aligned to infection status (Supplementary Figure 1C). Together, these approaches demonstrated features of MRV ORF expression that are useful in predicting the stage of infection of a given cell as well as expression kinetics of uncharacterized herpesvirus ORFs.
A cell culture system that supports MRV replication has yet to be established despite testing in a broad range of cell culture systems [(62), negative data from our studies]. Our scRNAseq studies suggested that thymocytes at the DN3, DN4, DP and CD4SP stages of development, as well as mTECs, are susceptible to MRV infection and replication (Figures 1C, 5B). We therefore cultured a DP T cell lymphoblastic leukemia cell line (MOHITO) (98), primary thymocytes, an immortalized mTEC cell line (mTE4–14) (99), and primary mTECs. Cells were infected with 1 genome per cell and viral DNA levels were measured over a time course to establish a growth curve. In all types tested, we observed an increase in viral DNA copies per cell starting between 7 and 21 dpi (Figures 8C–F). These results confirm patterns of tropism identified by our scRNAseq approach and establish primary thymocytes and mTECs, as well as related cell lines, as cell culture systems susceptible to MRV infection and replication.
In this study we have characterized the tropism of MRV in the thymus and identified the host transcriptome during acute, neonatal infection using scRNAseq. We utilized the pattern of MRV ORF expression, including robust expression of replication dependent L genes, to identify cells that appeared to be infected with MRV compared to cells that were supporting MRV replication (84). We found that thymocytes at the DN, DP, and SP stages were susceptible to MRV infection and replication, however DN1 and 2, and CD8SP appear only minimally susceptible to infection. This correlates with our previous work demonstrating that DP and CD4SP cells undergo a rapid decline in cell count between days 3 and 7 post infection (Supplementary Figure 1A) (2, 15, 16), although whether these cells are depleted due to direct infection, killing by antiviral CD8 T cells, or signaling induced apoptosis remains unknown. We found that ETPs and some non-thymocyte cells, including mTECs and DCs, appear to be susceptible to MRV infection and/or replication (Figure 6). We also identified patterns and kinetics of viral gene expression that are characteristic of the cell’s MRV infection status. By comparing cells at different stages of the viral replication cycle, we found broad transcriptional alterations in MRV-infected and uninfected bystander cells after neonatal MRV infection. The differential gene expression suggested that pathways typical of herpesvirus infection such as the inflammatory response, cell cycle control, and cholesterol biosynthesis were impacted by infection. Pathways necessary for thymocyte development were also affected, demonstrating a tissue-specific effect of MRV infection. Finally, our scRNAseq approach to identifying viral tropism facilitated the establishment of several cell culture systems that support MRV replication in vitro.
While there are several examples of single-cell transcriptomic approaches that have been utilized to identify viral tropism (107–109), identification of herpesvirus tropism during acute, in vivo infection of an entire organ has not yet been performed. Our study demonstrates that by using late gene expression and overall viral ORF expression patterns, tropism and infection status can be evaluated at a single-cell level. This approach to studying tropism is especially useful in the case of viruses in which there are limited molecular tools, as had been the case for MRV. The human roseoloviruses can infect a wide range of cell types in vivo and in vitro, including T cells (especially CD4+ T cells), T cell lines, thymocytes, B cells, macrophages/monocytes, epithelial cells, fibroblasts, and neuronal cells (30, 110–113). We similarly established that MRV infects thymocytes starting at the DN3 stage through the CD4SP stage, ETPs, and thymic epithelial cells. It is of interest that we did not observe MRV gene expression in cTECs, despite previous studies showing that cTEC numbers transiently decrease after neonatal infection, suggesting that cTECs survival or proliferation may be altered by the inflammatory response to MRV infection (2). Additionally, for dendritic cells, only two cells showed robust expression of most MRV genes. While this may represent phagocytosis of infected cells, the lack of viral genes identified in contemporaneous monocytes/macrophages argues against this possibility. Future studies that enrich for these minority cell types in the thymus could be pursued to examine this lower percentage susceptibility. Importantly, we validated the predicted tropism from our scRNAseq analysis with in vitro cell culture systems. We found that thymocytes, a T cell line, mTECs and an mTEC cell line were all susceptible to infection. These novel tools offer new opportunities to study viral kinetics, the host-virus relationship, and the molecular virology of MRV.
Our results suggest that there are shared and differential effects of MRV at each thymocyte stage. Thymocyte maturation is dependent on specific maturation signaling, TCR rearrangement and signaling, cytokine signaling, various cell surface molecules, metabolism, as well as modulation of the cell cycle and apoptosis machinery (33, 34). In DN, DP and CD4SP cells, MRV infection resulted in altered expression of genes involved in DNA replication, transcription, cell cycle, metabolism, type II IFN and TNF signaling, and DNA repair (Figures 2D, 3D, 4B, 5). While these pathways are commonly altered by herpesvirus infections and may be a result of direct infection, a portion of cells are uninfected and MRV-mediated changes in the microenvironment could also impact uninfected cells. For example, NF-κB, TLR, and type I IFN signaling have been shown to impact T cell maturation in the thymus (114–119). Regarding TNFα and NF-κB pathway stimulation, prior work has shown that HHV-6 infection of CD4+ T cells results in apoptosis of infected, and likely neighboring, uninfected cells, through a TNFα and NF-κB dependent process (120, 121). Evaluation of the cytokine signature based on the Immune Response Enrichment Analysis demonstrated a strong type I IFN response in all thymocyte stages (104). In DN and CD4SP, IL-7 response was also represented. It was of interest that all cells, but notably DN, DP, and CD4SP, featured a signature suggestive of IL-36a signaling. IL-36 is a member of the IL-1 superfamily that, along with IL-1 and IL-18, have been shown to mediate T cell activity (122, 123). While IL-36 has been shown to potentiate type I IFN signaling in response to herpes simplex virus-1, its role in beta-herpesvirus response or in the thymus remains poorly understood and could represent an important target in MRV-induced thymus dysfunction (124).
Other pathways necessary for thymocyte maturation were notably altered by MRV infection. For example, during the maturation of DN to DP, thymocytes undergo 6–8 divisions, something that would likely be impacted by the alterations in cell cycle (i.e. G1 to S cell cycle control) observed in MRV infected cells (125). Additionally, we observed upregulation of genes involved in cholesterol biosynthesis, a process known to be important for beta-herpesvirus replication and T cell function but less well studied for thymocyte development (74, 126). We also noted downregulation of genes known to be essential for maturation of DN and DP cells, including Cd4, Cd8, Rag1, Rag2, Tcf7, Themis, Lat, Rorc, Lck, Zap70, Cd5, Cd27, CD28, Bcl11b, Tox, and genes in the PluriNetwork pathway that are involved in pluripotency and cell fate (42, 50, 54, 102, 127–132). The thymocyte-expressed molecule involved in selection (Themis) has been well characterized as a major player in the maturation and selection of thymocytes (128). Themis interacts with Lck, Zap-70, and Lat to alter TCR and Lat signaling during positive and negative selection, both of which are impaired in Themis-/- mice (128, 133–135). These findings suggest that in addition to direct infection, disruption of pathways necessary for thymocyte survival and differentiation could contribute to thymocyte depletion and altered selection during MRV infection. Ongoing studies targeting the genes and pathways perturbed by MRV infection will provide additional data defining the specific mechanism of MRV mediated DP and CD4SP depletion as well as loss of central tolerance.
Thymocyte selection is mediated by antigen presenting cells such as thymic dendritic cells, cTECs and mTECs (58). Our prior studies demonstrated that neonatal MRV infection results in a transient a reduction in the number of each cell type and the reduced expression of the transcriptional regulator, Aire, as well as TRAs, suggesting a possible mechanism of negative selection disruption and escape of autoreactive T cells (2). It was thus interesting to find that MRV appears to directly infect mTECs (Figure 6). The impact of infection appears to be both direct and indirect since we observed transcriptional perturbations in infected and uninfected cells compared to mock infection (Figure 7B). For example, Dll4, Hes1, Foxn1, Notch1, and Notch2, which all have important roles in mTEC and/or thymocyte maturation, were downregulated by MRV infection (35, 45). We did not identify transcripts of TRAs specific to stomach antigens or TRA expression regulators (Aire, Fezf2). This is likely due to the overall low transcript level of these genes and because mTECs represent a minority population in our sample. We did observe reduced expression of several TRAs, and reduced expression of genes involved in antigen presentation, both of which are necessary for negative selection (60). Finally, there was an overall reduction in expression of genes that antagonize the type I IFN response and an increase in type I IFN responsive genes (Figure 7B). IFN signaling is suggested to impact mTEC function and survival (115, 116, 118, 119, 136). All these findings provide clues regarding how MRV disrupts central tolerance.
Using NicheNet evaluation, we identified expression of receptor-ligand pairs that suggest cell-cell interactions within the thymus microenvironment. It was interesting to note that that there were interactions that were unique to the mock and MRV samples. In fact, the differential interactions give potential evidence as to how MRV impacts mTEC and DC interactions with SP cells, and cTEC interactions with DP cells. Two interesting potential interactions were present in mock but not MRV infection: Ccl12/Ccl5:Ccr4 and CD40:CD40lg. CD40 and CD40L contribute to mTEC development and thymocyte development and tolerance (137, 138). In MRV infection, there was a potential gain in Ccl8:Ccr2/Ccr5 interaction. Chemokine signaling impacts thymocyte development and migration within the thymus and could offer insight into a mechanism by which MRV alters thymic function (139). Increased interaction between MHC H2-Dma and H2-T23 with CD4 and Klrd1 on CD4SP and CD8SP, respectively, could alter cell activation or selection. Regarding the potential EGF: EGFR interaction, EGF signaling plays a role in stromal cell regulation and T-cell differentiation, modulates fetal thymic growth and morphogenesis, and impacts the ability of TECs to sustain thymocyte differentiation in vitro (140). For the cTEC: DP evaluation, the Ptn (pleiotrophin)-Ptprz1 interaction is observed in mock but not MRV infection. Ptn is expressed during TEC development and it impacts hematopoietic cell proliferation, development, and adhesion (96, 141). Based on expression data, there were several potential interactions that were gained in the MRV samples. Sema3f, for example, when expressed on thymocytes and TECs inhibits thymocyte migration by blocking CXCL12 and spingosine-1-phosphate -induced migration (142). Altered Plau expression results in decreased thymic Treg development (143). Itga6 expression in TECs regulates expression of cell migration and immunologic synapse related genes (144). Cyr61 expression on TECs boosts progenitor homing (145), but how the differential interaction with Itgam would impact thymocyte development is less clear. The findings in our studies provide known and novel receptor-ligand targets to understand how MRV influences antigen presenting cell-thymocyte interactions.
Recent single-cell transcriptomic studies of HCMV infection of cell culture suggested that the IE, E, and L classification based on a simple cascade of viral gene expression may not be wholly representative of the complex nature of herpesvirus expression kinetics and that some genes may be regulated by independent modules (82). Although our studies were performed at a single time point, using pseudotime analysis we identified differences in expression levels based on infection status (infected vs replicating), which we have termed pseudokinetics. Our results show that expression of genes assigned to IE, E, E/L, and L, based on homology, showed similar pseudokinetic expression patterns as those described in transcriptomic studies of HCMV (80, 82, 86, 146). Analogous to findings in HCMV, some MRV ORFs display expression pseudokinetics that suggests potential independent modules that contribute to their expression pattern. In our analysis, there appears to be a clear transition of MRV gene expression during progression from MRV infection to MRV replication, which is characterized by downregulation of the IE genes ORF30 and 31, and upregulation of the majority of E, E/L and L genes.
One unexpected pattern of expression was the downregulation of several ORFs upon transition from infected to replicating. Most notable of these were ORFs 14–18, which appear to be US22 family whose homologues (U2 and U3 for HHV-6, UL23–25 for HCMV) have diverse roles in tegument-mediated transactivation, control of type I IFN response, and modulating cell cycle (147–150). This could suggest that these genes contribute to initiation of lytic infection in different cell types. Utilizing our studies, we can predict the kinetics of MRV genes that have no homology or are homologous to uncharacterized genes. Although we do not have a similar study in human roseoloviruses to compare our results, datasets from RNAseq to evaluate HHV6B gene expression in blood, tumors, and cell lines, as well as single-cell analysis CAR T cells and in a case report of DRESS could be analyzed in future studies to assess expression patterns using the techniques we employed in this study (81, 83, 151). Overall, our work provides a foundation to understand herpesvirus gene expression in vivo during acute infection at the transcriptional level, and provides insight into the dynamics of viral gene expression over the course of infection.
The results of this study establish an atlas of roseolovirus tropism, gene expression, host-virus interactions, and host transcriptome disruption during acute, neonatal infection. The data generated from this study provide a framework to understand how thymic infection by MRV, and perhaps the homologous human roseoloviruses, results in loss of central T cell tolerance and subsequent autoimmune disease. Applying our data to studies of roseolovirus infections in patients, such as those undergoing thymectomy early in life due to congenital heart disease or patients undergoing thymus transplant for thymic deficiency, could identify the role of roseoloviruses, and potentially other viruses, in altering thymus function. Taken together, our studies demonstrate unique patterns of roseolovirus gene expression, host-virus interactions, and disruption of pathways necessary for thymocyte survival and selection in the thymus during acute, neonatal infection that could be explored to identify the mechanism and therapeutic targets of roseolovirus-induced autoimmunity.
The data presented in the study are deposited in the NCBI Gene Expression Omnibus repository, accession number GSE255738.
The animal study was approved by The IACUC of Washington University in St. Louis. The study was conducted in accordance with the local legislation and institutional requirements.
AB: Writing – review & editing, Writing – original draft, Visualization, Validation, Software, Methodology, Investigation, Formal analysis, Data curation, Conceptualization. EX: Writing – review & editing, Methodology, Investigation. BC: Writing – review & editing, Methodology, Investigation. ER: Writing – review & editing, Software, Methodology, Investigation, Formal analysis. MP: Writing – review & editing, Writing – original draft, Visualization, Validation, Supervision, Software, Resources, Project administration, Methodology, Investigation, Funding acquisition, Formal analysis, Data curation, Conceptualization. TB: Writing – review & editing, Writing – original draft, Visualization, Validation, Supervision, Software, Resources, Project administration, Methodology, Investigation, Funding acquisition, Formal analysis, Data curation, Conceptualization.
The author(s) declare financial support was received for the research, authorship, and/or publication of this article. This work was supported by funding for TB through NIH grants T32AI106688–07 and T32AR007279–40, 1K08AI168495 (NIAID K08), the Rheumatology Research Foundation Scientist Development Award, and the Children’s Discovery Institute Scholar’s Award. Funding for MP was provided through K08AR079593 (NIAMS K08) and the Doris Duke Charitable Foundation. Analysis support was provided via the WUSTL RDRRC (P30-AR073752).
We thank Wayne Yokoyama for his support of this work by providing helpful discussion, guidance, and suggestions. We also thank MGI@GTAC for their technical support of this work. Finally, we thank members of the Bigley and Paley lab for helpful commentary and suggestions during this project.
MP received research support from Lilly paid to the institution and received consultant fees from AbbVie, UCB, and Priovant Therapeutics.
The remaining authors declare that the research was conducted in the absence of any commercial or financial relationships that could be construed as a potential conflict of interest.
All claims expressed in this article are solely those of the authors and do not necessarily represent those of their affiliated organizations, or those of the publisher, the editors and the reviewers. Any product that may be evaluated in this article, or claim that may be made by its manufacturer, is not guaranteed or endorsed by the publisher.
The Supplementary Material for this article can be found online at: https://www.frontiersin.org/articles/10.3389/fimmu.2024.1375508/full#supplementary-material
Supplementary Figure 1 | MRV-induced CD4+ thymocyte depletion and MRV ORF expression kinetics. (A) Mice were mock or MRV infected on DOL 0 and the thymus was harvested at the designated time point. Flow cytometry plots showing CD4 and CD8 at each time point with graphs of absolute number of CD4SP thymocytes at each time point. (B) Heat map of ORFs comparing expression between Infected and Replicating, ordered by putative kinetics. (C) Hierarchical heat map of MRV recreates uninfected/replicating/infected populations.
Supplementary Figure 2 | Transcriptional dysregulation of DN and DP populations after neonatal MRV infection. (A-F) Pathway enrichment for DN and DP subpopulations comparing Mock and MRV.
Supplementary Figure 3 | Thymocytes demonstrate upregulation of genes suggestive of type I IFN and IL-36 signaling. (A-D) Spiral plots of cytokine expression based on MRV DEGs for each thymocyte type. Figures were generated with the Immune Dictionary App. Coloration was based on p-values, and bar length represents the enrichment score.
Supplementary Figure 4 | MRV induces transcriptomic alterations that suggest altered interactions between DP thymocytes and cTECs. Nichenet analysis of DP receivers and cTEC senders. Dot plots show expression of potential ligands. Heat maps show the strength of potential ligand-receptor interactions. Ligands correspond to DP and receptors to cTECs. Asterisk represents interaction unique to mock or MRV.
Supplementary Figure 5 | “Pseudokinetics” plots for (A) Immediate Early and (B) Early, ORFs colored by cell type.
Supplementary Figure 6 | “Pseudokinetics” plots for (A) Early/Late and (B) Late, ORFs colored by cell type.
Supplementary Figure 7 | Pseudokinetic and expression analysis of genes with unknown or uncharacterized homology (A) “Pseudokinetics” plots for Unknown, ORFs colored by cell type. (B) Infected vs. replicating heat map of ORFs with unknown kinetics.
1. Sundaresan B, Shirafkan F, Ripperger K, Rattay K. The role of viral infections in the onset of autoimmune diseases. Viruses. (2023) 15:782. doi: 10.3390/v15030782
2. Bigley TM, Yang L, Kang LI, Saenz JB, Victorino F, Yokoyama WM. Disruption of thymic central tolerance by infection with murine roseolovirus induces autoimmune gastritis. J Exp Med. (2022) 219. doi: 10.1084/jem.20211403
3. Bjornevik K, Cortese M, Healy BC, Kuhle J, Mina MJ, Leng Y, et al. Longitudinal analysis reveals high prevalence of Epstein-Barr virus associated with multiple sclerosis. Science. (2022) 375:296–301. doi: 10.1126/science.abj8222
4. Munz C, Lunemann JD, Getts MT, Miller SD. Antiviral immune responses: triggers of or triggered by autoimmunity? Nat Rev Immunol. (2009) 9:246–58. doi: 10.1038/nri2527
5. Fujinami RS, von Herrath MG, Christen U, Whitton JL. Molecular mimicry, bystander activation, or viral persistence: infections and autoimmune disease. Clin Microbiol Rev. (2006) 19:80–94. doi: 10.1128/CMR.19.1.80-94.2006
6. Cusick MF, Libbey JE, Fujinami RS. Molecular mimicry as a mechanism of autoimmune disease. Clin Rev Allergy Immunol. (2012) 42:102–11. doi: 10.1007/s12016-011-8294-7
7. Lanz TV, Brewer RC, Ho PP, Moon JS, Jude KM, Fernandez D, et al. Clonally expanded B cells in multiple sclerosis bind EBV EBNA1 and GlialCAM. Nature. (2022) 603:321–7. doi: 10.1038/s41586-022-04432-7
8. Broccolo F, Drago F, Paolino S, Cassina G, Gatto F, Fusetti L, et al. Reactivation of human herpesvirus 6 (HHV-6) infection in patients with connective tissue diseases. J Clin Virol. (2009) 46:43–6. doi: 10.1016/j.jcv.2009.05.010
9. Broccolo F, Fusetti L, Ceccherini-Nelli L. Possible role of human herpesvirus 6 as a trigger of autoimmune disease. ScientificWorldJournal. (2013) 2013:867389. doi: 10.1155/2013/867389
10. Broccolo F, Drago F, Cassina G, Fava A, Fusetti L, Matteoli B, et al. Selective reactivation of human herpesvirus 6 in patients with autoimmune connective tissue diseases. J Med Virol. (2013) 85:1925–34. doi: 10.1002/jmv.23670
11. Caselli E, Zatelli MC, Rizzo R, Benedetti S, Martorelli D, Trasforini G, et al. Virologic and immunologic evidence supporting an association between HHV-6 and Hashimoto’s thyroiditis. PloS Pathog. (2012) 8:e1002951. doi: 10.1371/journal.ppat.1002951
12. Caselli E, D’Accolti M, Soffritti I, Zatelli MC, Rossi R, Degli Uberti E, et al. HHV-6A in vitro infection of thyrocytes and T cells alters the expression of miRNA associated to autoimmune thyroiditis. Virol J. (2017) 14:3. doi: 10.1186/s12985-016-0672-6
13. Caselli E, Soffritti I, D’Accolti M, Bortolotti D, Rizzo R, Sighinolfi G, et al. HHV-6A infection and systemic sclerosis: clues of a possible association. Microorganisms. (2019) 8:39. doi: 10.3390/microorganisms8010039
14. Denner J, Bigley TM, Phan TL, Zimmermann C, Zhou X, Kaufer BB. Comparative analysis of roseoloviruses in humans, pigs, mice, and other species. Viruses. (2019) 11:1108. doi: 10.3390/v11121108
15. Patel SJ, Zhao G, Penna VR, Park E, Lauron EJ, Harvey IB, et al. A murine herpesvirus closely related to ubiquitous human herpesviruses causes T-cell depletion. J Virol. (2017) 91. doi: 10.1128/JVI.02463-16
16. Patel SJ, Yokoyama WM. CD8(+) T cells prevent lethality from neonatal murine roseolovirus infection. J Immunol. (2017) 199:3212–21. doi: 10.4049/jimmunol.1700982
17. Bigley TM, Xiong M, Ali M, Chen Y, Wang C, Serrano JR, et al. Murine roseolovirus does not accelerate amyloid-beta pathology and human roseoloviruses are not over-represented in Alzheimer disease brains. Mol Neurodegener. (2022) 17:10. doi: 10.1186/s13024-021-00514-8
18. Savino W. The thymus is a common target organ in infectious diseases. PloS Pathog. (2006) 2:e62. doi: 10.1371/journal.ppat.0020062
19. Velardi E, Tsai JJ, van den Brink MRM. T cell regeneration after immunological injury. Nat Rev Immunol. (2020) 21(5):277–291. doi: 10.1038/s41577-020-00457-z
20. Price P, Olver SD, Gibbons AE, Teo HK, Shellam GR. Characterization of thymic involution induced by murine cytomegalovirus infection. Immunol Cell Biol. (1993) 71:155–65. doi: 10.1038/icb.1993.18
21. Majumdar S, Deobagkar-Lele M, Adiga V, Raghavan A, Wadhwa N, Ahmed SM, et al. Differential susceptibility and maturation of thymocyte subsets during Salmonella Typhimurium infection: insights on the roles of glucocorticoids and Interferon-gamma. Sci Rep. (2017) 7:40793. doi: 10.1038/srep40793
22. Autran B, Guiet P, Raphael M, Grandadam M, Agut H, Candotti D, et al. Thymocyte and thymic microenvironment alterations during a systemic HIV infection in a severe combined immunodeficient mouse model. AIDS. (1996) 10:717–27. doi: 10.1097/00002030-199606001-00005
23. Elsaesser HJ, Mohtashami M, Osokine I, Snell LM, Cunningham CR, Boukhaled GM, et al. Chronic virus infection drives CD8 T cell-mediated thymic destruction and impaired negative selection. Proc Natl Acad Sci U S A. (2020) 117:5420–9. doi: 10.1073/pnas.1913776117
24. Linhares-Lacerda L, Palu CC, Ribeiro-Alves M, Paredes BD, Morrot A, Garcia-Silva MR, et al. Differential Expression of microRNAs in Thymic Epithelial Cells from Trypanosoma cruzi Acutely Infected Mice: putative Role in Thymic Atrophy. Front Immunol. (2015) 6:428. doi: 10.3389/fimmu.2015.00428
25. Messias CV, Loss-Morais G, Carvalho JB, Gonzalez MN, Cunha DP, Vasconcelos Z, et al. Zika virus targets the human thymic epithelium. Sci Rep. (2020) 10:1378. doi: 10.1038/s41598-020-58135-y
26. Valentin H, Azocar O, Horvat B, Williems R, Garrone R, Evlashev A, et al. Measles virus infection induces terminal differentiation of human thymic epithelial cells. J Virol. (1999) 73:2212–21. doi: 10.1128/JVI.73.3.2212-2221.1999
27. Halouani A, Jmii H, Michaux H, Renard C, Martens H, Pirottin D, et al. Housekeeping gene expression in the fetal and neonatal murine thymus following coxsackievirus B4 infection. Genes (Basel). (2020) 11:279. doi: 10.3390/genes11030279
28. Halouani A, Michaux H, Jmii H, Trussart C, Chahbi A, Martens H, et al. Coxsackievirus B4 transplacental infection severely disturbs central tolerogenic mechanisms in the fetal thymus. Microorganisms. (2021) 9:1537. doi: 10.3390/microorganisms9071537
29. Alhazmi A, Nekoua MP, Michaux H, Sane F, Halouani A, Engelmann I, et al. Effect of coxsackievirus B4 infection on the thymus: elucidating its role in the pathogenesis of type 1 diabetes. Microorganisms. (2021) 9:1177. doi: 10.3390/microorganisms9061177
30. Gobbi A, Stoddart CA, Malnati MS, Locatelli G, Santoro F, Abbey NW, et al. Human herpesvirus 6 (HHV-6) causes severe thymocyte depletion in SCID-hu Thy/Liv mice. J Exp Med. (1999) 189:1953–60. doi: 10.1084/jem.189.12.1953
31. Markert ML, Devlin BH, McCarthy EA. Thymus transplantation. Clin Immunol. (2010) 135:236–46. doi: 10.1016/j.clim.2010.02.007
32. Davies EG, Cheung M, Gilmour K, Maimaris J, Curry J, Furmanski A, et al. Thymus transplantation for complete DiGeorge syndrome: European experience. J Allergy Clin Immunol. (2017) 140:1660–70 e16. doi: 10.1016/j.jaci.2017.03.020
33. Aifantis I, Mandal M, Sawai K, Ferrando A, Vilimas T. Regulation of T-cell progenitor survival and cell-cycle entry by the pre-T-cell receptor. Immunol Rev. (2006) 209:159–69. doi: 10.1111/j.0105-2896.2006.00343.x
34. Koch U, Radtke F. Mechanisms of T cell development and transformation. Annu Rev Cell Dev Biol. (2011) 27:539–62. doi: 10.1146/annurev-cellbio-092910-154008
35. Liu D, Kousa AI, O’Neill KE, Rouse P, Popis M, Farley AM, et al. Canonical Notch signaling controls the early thymic epithelial progenitor cell state and emergence of the medullary epithelial lineage in fetal thymus development. Development. (2020) 147. doi: 10.1242/dev.178582
36. Liu X, Yu J, Xu L, Umphred-Wilson K, Peng F, Ding Y, et al. Notch-induced endoplasmic reticulum-associated degradation governs mouse thymocyte beta-selection. Elife. (2021) 10. doi: 10.7554/eLife.69975
37. Laky K, Fleischacker C, Fowlkes BJ. TCR and Notch signaling in CD4 and CD8 T-cell development. Immunol Rev. (2006) 209:274–83. doi: 10.1111/j.0105-2896.2006.00358.x
38. Laky K, Fowlkes BJ. Notch signaling in CD4 and CD8 T cell development. Curr Opin Immunol. (2008) 20:197–202. doi: 10.1016/j.coi.2008.03.004
39. Barra MM, Richards DM, Hansson J, Hofer AC, Delacher M, Hettinger J, et al. Transcription factor 7 limits regulatory T cell generation in the thymus. J Immunol. (2015) 195:3058–70. doi: 10.4049/jimmunol.1500821
40. Hattori N, Kawamoto H, Fujimoto S, Kuno K, Katsura Y. Involvement of transcription factors TCF-1 and GATA-3 in the initiation of the earliest step of T cell development in the thymus. J Exp Med. (1996) 184:1137–47. doi: 10.1084/jem.184.3.1137
41. Schilham MW, Wilson A, Moerer P, Benaissa-Trouw BJ, Cumano A, Clevers HC. Critical involvement of Tcf-1 in expansion of thymocytes. J Immunol. (1998) 161:3984–91. doi: 10.4049/jimmunol.161.8.3984
42. Ma J, Wang R, Fang X, Sun Z. beta-catenin/TCF-1 pathway in T cell development and differentiation. J Neuroimmune Pharmacol. (2012) 7:750–62. doi: 10.1007/s11481-012-9367-y
43. Bao X, Qin Y, Lu L, Zheng M. Transcriptional regulation of early T-lymphocyte development in thymus. Front Immunol. (2022) 13:884569. doi: 10.3389/fimmu.2022.884569
44. Hernandez JB, Newton RH, Walsh CM. Life and death in the thymus–cell death signaling during T cell development. Curr Opin Cell Biol. (2010) 22:865–71. doi: 10.1016/j.ceb.2010.08.003
45. Brandstadter JD, Maillard I. Notch signalling in T cell homeostasis and differentiation. Open Biol. (2019) 9:190187. doi: 10.1098/rsob.190187
46. Schmitt TM, Ciofani M, Petrie HT, Zuniga-Pflucker JC. Maintenance of T cell specification and differentiation requires recurrent notch receptor-ligand interactions. J Exp Med. (2004) 200:469–79. doi: 10.1084/jem.20040394
47. Ciofani M, Schmitt TM, Ciofani A, Michie AM, Cuburu N, Aublin A, et al. Obligatory role for cooperative signaling by pre-TCR and Notch during thymocyte differentiation. J Immunol. (2004) 172:5230–9. doi: 10.4049/jimmunol.172.9.5230
48. Ciofani M, Zuniga-Pflucker JC. Notch promotes survival of pre-T cells at the beta-selection checkpoint by regulating cellular metabolism. Nat Immunol. (2005) 6:881–8. doi: 10.1038/ni1234
49. Gegonne A, Chen QR, Dey A, Etzensperger R, Tai X, Singer A, et al. Immature CD8 single-positive thymocytes are a molecularly distinct subpopulation, selectively dependent on BRD4 for their differentiation. Cell Rep. (2018) 24:117–29. doi: 10.1016/j.celrep.2018.06.007
50. Yu S, Xue HH. TCF-1 mediates repression of Notch pathway in T lineage-committed early thymocytes. Blood. (2013) 121:4008–9. doi: 10.1182/blood-2013-01-477349
51. Garbe AI, Krueger A, Gounari F, Zuniga-Pflucker JC, von Boehmer H. Differential synergy of Notch and T cell receptor signaling determines alphabeta versus gammadelta lineage fate. J Exp Med. (2006) 203:1579–90. doi: 10.1084/jem.20060474
52. Xiong J, Armato MA, Yankee TM. Immature single-positive CD8+ thymocytes represent the transition from Notch-dependent to Notch-independent T-cell development. Int Immunol. (2011) 23:55–64. doi: 10.1093/intimm/dxq457
53. Li Y, Li K, Zhu L, Li B, Zong D, Cai P, et al. Development of double-positive thymocytes at single-cell resolution. Genome Med. (2021) 13:49. doi: 10.1186/s13073-021-00861-7
54. Adu-Berchie K, Obuseh FO, Mooney DJ. T cell development and function. Rejuvenation Res. (2023) 26:126–38. doi: 10.1089/rej.2023.0015
55. Sousa LG, Rodrigues PM, Alves NL. T-cell selection in the thymus: New routes toward the identification of the self-peptide ligandome presented by thymic epithelial cells. Eur J Immunol. (2023) 53:e2250202. doi: 10.1002/eji.202250202
56. Klein L, Kyewski B, Allen PM, Hogquist KA. Positive and negative selection of the T cell repertoire: what thymocytes see (and don’t see). Nat Rev Immunol. (2014) 14:377–91. doi: 10.1038/nri3667
57. McCaughtry TM, Baldwin TA, Wilken MS, Hogquist KA. Clonal deletion of thymocytes can occur in the cortex with no involvement of the medulla. J Exp Med. (2008) 205:2575–84. doi: 10.1084/jem.20080866
58. Takaba H, Takayanagi H. The mechanisms of T cell selection in the thymus. Trends Immunol. (2017) 38:805–16. doi: 10.1016/j.it.2017.07.010
59. Zhao B, Chang L, Fu H, Sun G, Yang W. The role of autoimmune regulator (AIRE) in peripheral tolerance. J Immunol Res. (2018) 2018:3930750. doi: 10.1155/2018/3930750
60. Passos GA, Speck-Hernandez CA, Assis AF, Mendes-da-Cruz DA. Update on Aire and thymic negative selection. Immunology. (2018) 153:10–20. doi: 10.1111/imm.12831
61. Cheng M, Anderson MS. Thymic tolerance as a key brake on autoimmunity. Nat Immunol. (2018) 19:659–64. doi: 10.1038/s41590-018-0128-9
62. Morse SS. Mouse thymic virus (MTLV; murid herpesvirus 3) infection in athymic nude mice: evidence for a T lymphocyte requirement. Virology. (1988) 163:255–8. doi: 10.1016/0042-6822(88)90262-0
63. Morse SS, Sakaguchi N, Sakaguchi S. Virus and autoimmunity: induction of autoimmune disease in mice by mouse T lymphotropic virus (MTLV) destroying CD4+ T cells. J Immunol. (1999) 162:5309–16. doi: 10.4049/jimmunol.162.9.5309
64. Flemington EK. Herpesvirus lytic replication and the cell cycle: arresting new developments. J Virol. (2001) 75:4475–81. doi: 10.1128/JVI.75.10.4475-4481.2001
65. Li L, Gu B, Zhou F, Chi J, Feng D, Xie F, et al. Cell cycle perturbations induced by human herpesvirus 6 infection and their effect on virus replication. Arch Virol. (2014) 159:365–70. doi: 10.1007/s00705-013-1826-0
66. Adler B, Sattler C, Adler H. Herpesviruses and their host cells: A successful liaison. Trends Microbiol. (2017) 25:229–41. doi: 10.1016/j.tim.2016.11.009
67. Fan Y, Sanyal S, Bruzzone R. Breaking bad: how viruses subvert the cell cycle. Front Cell Infect Microbiol. (2018) 8:396. doi: 10.3389/fcimb.2018.00396
68. Brown JC. The role of DNA repair in herpesvirus pathogenesis. Genomics. (2014) 104:287–94. doi: 10.1016/j.ygeno.2014.08.005
69. Knipe DM. Nuclear sensing of viral DNA, epigenetic regulation of herpes simplex virus infection, and innate immunity. Virology. (2015) 479–80:153–9. doi: 10.1016/j.virol.2015.02.009
70. O’Connor CM, Sen GC. Innate immune responses to herpesvirus infection. Cells. (2021) 10:2122. doi: 10.3390/cells10082122
71. Griffin BD, Verweij MC, Wiertz EJ. Herpesviruses and immunity: the art of evasion. Vet Microbiol. (2010) 143:89–100. doi: 10.1016/j.vetmic.2010.02.017
72. Glaunsinger BA. Modulation of the translational landscape during herpesvirus infection. Annu Rev Virol. (2015) 2:311–33. doi: 10.1146/annurev-virology-100114-054839
73. Boldogkoi Z, Tombacz D, Balazs Z. Interactions between the transcription and replication machineries regulate the RNA and DNA synthesis in the herpesviruses. Virus Genes. (2019) 55:274–9. doi: 10.1007/s11262-019-01643-5
74. Lange PT, Lagunoff M, Tarakanova VL. Chewing the fat: the conserved ability of DNA viruses to hijack cellular lipid metabolism. Viruses. (2019) 11:119. doi: 10.3390/v11020119
75. Bigley TM, McGivern JV, Ebert AD, Terhune SS. Impact of a cytomegalovirus kinase inhibitor on infection and neuronal progenitor cell differentiation. Antiviral Res. (2016) 129:67–73. doi: 10.1016/j.antiviral.2016.02.007
76. Ivana T, Robert P, Pavel S, Lenka T, Irena K. Cytomegalovirus and other herpesviruses after hematopoietic cell and solid organ transplantation: From antiviral drugs to virus-specific T cells. Transpl Immunol. (2022) 71:101539. doi: 10.1016/j.trim.2022.101539
77. Luo MH, Hannemann H, Kulkarni AS, Schwartz PH, O’Dowd JM, Fortunato EA. Human cytomegalovirus infection causes premature and abnormal differentiation of human neural progenitor cells. J Virol. (2010) 84:3528–41. doi: 10.1128/JVI.02161-09
78. Li XJ, Liu XJ, Yang B, Fu YR, Zhao F, Shen ZZ, et al. Human cytomegalovirus infection dysregulates the localization and stability of NICD1 and jag1 in neural progenitor cells. J Virol. (2015) 89:6792–804. doi: 10.1128/JVI.00351-15
79. Liu XJ, Yang B, Huang SN, Wu CC, Li XJ, Cheng S, et al. Human cytomegalovirus IE1 downregulates Hes1 in neural progenitor cells as a potential E3 ubiquitin ligase. PloS Pathog. (2017) 13:e1006542. doi: 10.1371/journal.ppat.1006542
80. Shnayder M, Nachshon A, Krishna B, Poole E, Boshkov A, Binyamin A, et al. Defining the transcriptional landscape during cytomegalovirus latency with single-cell RNA sequencing. mBio. (2018) 9. doi: 10.1128/mBio.00013-18
81. Lareau CA, Yin Y, Maurer K, Sandor KD, Daniel B, Yagnik G, et al. Latent human herpesvirus 6 is reactivated in CAR T cells. Nature. (2023) 623:608–15. doi: 10.1038/s41586-023-06704-2
82. Rozman B, Nachshon A, Levi Samia R, Lavi M, Schwartz M, Stern-Ginossar N. Temporal dynamics of HCMV gene expression in lytic and latent infections. Cell Rep. (2022) 39:110653. doi: 10.1016/j.celrep.2022.110653
83. Kim D, Kobayashi T, Voisin B, Jo JH, Sakamoto K, Jin SP, et al. Targeted therapy guided by single-cell transcriptomic analysis in drug-induced hypersensitivity syndrome: a case report. Nat Med. (2020) 26:236–43. doi: 10.1038/s41591-019-0733-7
84. Mocarski ES, Shenk T, Griffiths PD, Pass RF. Cytomegaloviruses: Wolters Kluwer Health Adis (ESP). (2013).
85. Gruffat H, Marchione R, Manet E. Herpesvirus late gene expression: a viral-specific pre-initiation complex is key. Front Microbiol. (2016) 7:869. doi: 10.3389/fmicb.2016.00869
86. Stern-Ginossar N, Weisburd B, Michalski A, Le VT, Hein MY, Huang SX, et al. Decoding human cytomegalovirus. Science. (2012) 338:1088–93. doi: 10.1126/science.1227919
87. Hein MY, Weissman JS. Functional single-cell genomics of human cytomegalovirus infection. Nat Biotechnol. (2022) 40:391–401. doi: 10.1038/s41587-021-01059-3
88. Hillen MR, Pandit A, Blokland SLM, Hartgring SAY, Bekker CPJ, van der Heijden EHM, et al. Plasmacytoid DCs from patients with sjogren’s syndrome are transcriptionally primed for enhanced pro-inflammatory cytokine production. Front Immunol. (2019) 10:2096. doi: 10.3389/fimmu.2019.02096
89. Kernfeld EM, Genga RMJ, Neherin K, Magaletta ME, Xu P, Maehr R. A single-cell transcriptomic atlas of thymus organogenesis resolves cell types and developmental maturation. Immunity. (2018) 48:1258–70 e6. doi: 10.1016/j.immuni.2018.04.015
90. Bacon WA, Hamilton RS, Yu Z, Kieckbusch J, Hawkes D, Krzak AM, et al. Single-cell analysis identifies thymic maturation delay in growth-restricted neonatal mice. Front Immunol. (2018) 9:2523. doi: 10.3389/fimmu.2018.02523
91. Park JE, Botting RA, Dominguez Conde C, Popescu DM, Lavaert M, Kunz DJ, et al. A cell atlas of human thymic development defines T cell repertoire formation. Science. (2020) 367. doi: 10.1126/science.aay3224
92. Bautista JL, Cramer NT, Miller CN, Chavez J, Berrios DI, Byrnes LE, et al. Single-cell transcriptional profiling of human thymic stroma uncovers novel cellular heterogeneity in the thymic medulla. Nat Commun. (2021) 12:1096. doi: 10.1038/s41467-021-21346-6
93. Cordes M, Cante-Barrett K, van den Akker EB, Moretti FA, Kielbasa SM, Vloemans SA, et al. Single-cell immune profiling reveals thymus-seeding populations, T cell commitment, and multilineage development in the human thymus. Sci Immunol. (2022) 7:eade0182. doi: 10.1126/sciimmunol.ade0182
94. Morgana F, Opstelten R, Slot MC, Scott AM, van Lier RAW, Blom B, et al. Single-cell transcriptomics reveals discrete steps in regulatory T cell development in the human thymus. J Immunol. (2022) 208:384–95. doi: 10.4049/jimmunol.2100506
95. Sanchez Sanchez G, Papadopoulou M, Azouz A, Tafesse Y, Mishra A, Chan JKY, et al. Identification of distinct functional thymic programming of fetal and pediatric human gammadelta thymocytes via single-cell analysis. Nat Commun. (2022) 13:5842. doi: 10.1038/s41467-022-33488-2
96. Farley AM, Chengrui A, Palmer S, Liu D, Kousa AI, Rouse P, et al. Thymic epithelial cell fate and potency in early organogenesis assessed by single cell transcriptional and functional analysis. Front Immunol. (2023) 14:1202163. doi: 10.3389/fimmu.2023.1202163
97. Steier Z, Aylard DA, McIntyre LL, Baldwin I, Kim EJY, Lutes LK, et al. Single-cell multiomic analysis of thymocyte development reveals drivers of CD4(+) T cell and CD8(+) T cell lineage commitment. Nat Immunol. (2023) 24:1579–90. doi: 10.1038/s41590-023-01584-0
98. Kleppe M, Mentens N, Tousseyn T, Wlodarska I, Cools J. MOHITO, a novel mouse cytokine-dependent T-cell line, enables studies of oncogenic signaling in the T-cell context. Haematologica. (2011) 96:779–83. doi: 10.3324/haematol.2010.035931
99. Lepesant H, Pierres M, Naquet P. Deficient antigen presentation by thymic epithelial cells reveals differential induction of T cell clone effector functions by CD28-mediated costimulation. Cell Immunol. (1995) 161:279–87. doi: 10.1006/cimm.1995.1037
100. Villegas JA, Gradolatto A, Truffault F, Roussin R, Berrih-Aknin S, Le Panse R, et al. Cultured human thymic-derived cells display medullary thymic epithelial cell phenotype and functionality. Front Immunol. (2018) 9:1663. doi: 10.3389/fimmu.2018.01663
102. Som A, Harder C, Greber B, Siatkowski M, Paudel Y, Warsow G, et al. The PluriNetWork: an electronic representation of the network underlying pluripotency in mouse, and its applications. PloS One. (2010) 5:e15165. doi: 10.1371/journal.pone.0015165
103. Zhang B, Gaiteri C, Bodea LG, Wang Z, McElwee J, Podtelezhnikov AA, et al. Integrated systems approach identifies genetic nodes and networks in late-onset Alzheimer’s disease. Cell. (2013) 153:707–20. doi: 10.1016/j.cell.2013.03.030
104. Cui A, Huang T, Li S, Ma A, Perez JL, Sander C, et al. Dictionary of immune responses to cytokines at single-cell resolution. Nature. (2023) 625(7994):377 384. doi: 10.1038/s41586-023-06816-9
105. Ceppi M, Clavarino G, Gatti E, Schmidt EK, de Gassart A, Blankenship D, et al. Ribosomal protein mRNAs are translationally-regulated during human dendritic cells activation by LPS. Immunome Res. (2009) 5:5. doi: 10.1186/1745-7580-5-5
106. Browaeys R, Saelens W, Saeys Y. NicheNet: modeling intercellular communication by linking ligands to target genes. Nat Methods. (2020) 17:159–62. doi: 10.1038/s41592-019-0667-5
107. Zanini F, Robinson ML, Croote D, Sahoo MK, Sanz AM, Ortiz-Lasso E, et al. Virus-inclusive single-cell RNA sequencing reveals the molecular signature of progression to severe dengue. Proc Natl Acad Sci U S A. (2018) 115:E12363–E9. doi: 10.1073/pnas.1813819115
108. Popova G, Retallack H, Kim CN, Wang A, Shin D, DeRisi JL, et al. Rubella virus tropism and single-cell responses in human primary tissue and microglia-containing organoids. Elife. (2023) 12. doi: 10.7554/eLife.87696.3
109. Rybak-Wolf A, Wyler E, Pentimalli TM, Legnini I, Oliveras Martinez A, Glazar P, et al. Modelling viral encephalitis caused by herpes simplex virus 1 infection in cerebral organoids. Nat Microbiol. (2023) 8:1252–66. doi: 10.1038/s41564-023-01405-y
110. Ablashi DV, Salahuddin SZ, Josephs SF, Imam F, Lusso P, Gallo RC, et al. HBLV (or HHV-6) in human cell lines. Nature. (1987) 329:207. doi: 10.1038/329207a0
111. Cermelli C, Concari M, Carubbi F, Fabio G, Sabbatini AM, Pecorari M, et al. Growth of human herpesvirus 6 in HEPG2 cells. Virus Res. (1996) 45:75–85. doi: 10.1016/S0168-1702(96)01364-0
112. Chen M, Popescu N, Woodworth C, Berneman Z, Corbellino M, Lusso P, et al. Human herpesvirus 6 infects cervical epithelial cells and transactivates human papillomavirus gene expression. J Virol. (1994) 68:1173–8. doi: 10.1128/jvi.68.2.1173-1178.1994
113. He J, McCarthy M, Zhou Y, Chandran B, Wood C. Infection of primary human fetal astrocytes by human herpesvirus 6. J Virol. (1996) 70:1296–300. doi: 10.1128/jvi.70.2.1296-1300.1996
114. Baron ML, Gauchat D, La Motte-Mohs R, Kettaf N, Abdallah A, Michiels T, et al. TLR ligand-induced type I IFNs affect thymopoiesis. J Immunol. (2008) 180:7134–46. doi: 10.4049/jimmunol.180.11.7134
115. Demoulins T, Baron ML, Gauchat D, Kettaf N, Reed SJ, Charpentier T, et al. Induction of thymic atrophy and loss of thymic output by type-I interferons during chronic viral infection. Virology. (2022) 567:77–86. doi: 10.1016/j.virol.2021.12.007
116. Otero DC, Baker DP, David M. IRF7-dependent IFN-beta production in response to RANKL promotes medullary thymic epithelial cell development. J Immunol. (2013) 190:3289–98. doi: 10.4049/jimmunol.1203086
117. Metidji A, Rieder SA, Glass DD, Cremer I, Punkosdy GA, Shevach EM. IFN-alpha/beta receptor signaling promotes regulatory T cell development and function under stress conditions. J Immunol. (2015) 194:4265–76. doi: 10.4049/jimmunol.1500036
118. Xing Y, Wang X, Jameson SC, Hogquist KA. Late stages of T cell maturation in the thymus involve NF-kappaB and tonic type I interferon signaling. Nat Immunol. (2016) 17:565–73. doi: 10.1038/ni.3419
119. Martinez RJ, Hogquist KA. The role of interferon in the thymus. Curr Opin Immunol. (2023) 84:102389. doi: 10.1016/j.coi.2023.102389
120. Inoue Y, Yasukawa M, Fujita S. Induction of T-cell apoptosis by human herpesvirus 6. J Virol. (1997) 71:3751–9. doi: 10.1128/jvi.71.5.3751-3759.1997
121. Yasukawa M, Inoue Y, Ohminami H, Terada K, Fujita S. Apoptosis of CD4+ T lymphocytes in human herpesvirus-6 infection. J Gen Virol. (1998) 79:143–7. doi: 10.1099/0022-1317-79-1-143
122. Yuan ZC, Xu WD, Liu XY, Liu XY, Huang AF, Su LC. Biology of IL-36 signaling and its role in systemic inflammatory diseases. Front Immunol. (2019) 10:2532. doi: 10.3389/fimmu.2019.02532
123. Van Den Eeckhout B, Tavernier J, Gerlo S. Interleukin-1 as innate mediator of T cell immunity. Front Immunol. (2020) 11:621931. doi: 10.3389/fimmu.2020.621931
124. Wang P, Gamero AM, Jensen LE. IL-36 promotes anti-viral immunity by boosting sensitivity to IFN-alpha/beta in IRF1 dependent and independent manners. Nat Commun. (2019) 10:4700. doi: 10.1038/s41467-019-12318-y
125. Taghon T, Yui MA, Pant R, Diamond RA, Rothenberg EV. Developmental and molecular characterization of emerging beta- and gammadelta-selected pre-T cells in the adult mouse thymus. Immunity. (2006) 24:53–64. doi: 10.1016/j.immuni.2005.11.012
126. Bietz A, Zhu H, Xue M, Xu C. Cholesterol metabolism in T cells. Front Immunol. (2017) 8:1664. doi: 10.3389/fimmu.2017.01664
127. Deharven E. Virus particles in the thymus of conventional and germ-free mice. J Exp Med. (1964) 120:857–68. doi: 10.1084/jem.120.5.857
128. Melique S, Yang C, Lesourne R. Negative times negative equals positive, THEMIS sets the rule on thymic selection and peripheral T cell responses. BioMed J. (2022) 45:334–46. doi: 10.1016/j.bj.2022.03.008
129. Gascoigne NR, Rybakin V, Acuto O, Brzostek J. TCR signal strength and T cell development. Annu Rev Cell Dev Biol. (2016) 32:327–48. doi: 10.1146/annurev-cellbio-111315-125324
130. Yannoutsos N, Wilson P, Yu W, Chen HT, Nussenzweig A, Petrie H, et al. The role of recombination activating gene (RAG) reinduction in thymocyte development in vivo. J Exp Med. (2001) 194:471–80. doi: 10.1084/jem.194.4.471
131. Li L, Leid M, Rothenberg EV. An early T cell lineage commitment checkpoint dependent on the transcription factor Bcl11b. Science. (2010) 329:89–93. doi: 10.1126/science.1188989
132. He YW, Beers C, Deftos ML, Ojala EW, Forbush KA, Bevan MJ. Down-regulation of the orphan nuclear receptor ROR gamma t is essential for T lymphocyte maturation. J Immunol. (2000) 164:5668–74. doi: 10.4049/jimmunol.164.11.5668
133. Fu G, Vallee S, Rybakin V, McGuire MV, Ampudia J, Brockmeyer C, et al. Themis controls thymocyte selection through regulation of T cell antigen receptor-mediated signaling. Nat Immunol. (2009) 10:848–56. doi: 10.1038/ni.1766
134. Johnson AL, Aravind L, Shulzhenko N, Morgun A, Choi SY, Crockford TL, et al. Themis is a member of a new metazoan gene family and is required for the completion of thymocyte positive selection. Nat Immunol. (2009) 10:831–9. doi: 10.1038/ni.1769
135. Lesourne R, Uehara S, Lee J, Song KD, Li L, Pinkhasov J, et al. Themis, a T cell-specific protein important for late thymocyte development. Nat Immunol. (2009) 10:840–7. doi: 10.1038/ni.1768
136. Cufi P, Dragin N, Ruhlmann N, Weiss JM, Fadel E, Serraf A, et al. Central role of interferon-beta in thymic events leading to myasthenia gravis. J Autoimmun. (2014) 52:44–52. doi: 10.1016/j.jaut.2013.12.016
137. Akiyama T, Shimo Y, Yanai H, Qin J, Ohshima D, Maruyama Y, et al. The tumor necrosis factor family receptors RANK and CD40 cooperatively establish the thymic medullary microenvironment and self-tolerance. Immunity. (2008) 29:423–37. doi: 10.1016/j.immuni.2008.06.015
138. Williams JA, Zhang J, Jeon H, Nitta T, Ohigashi I, Klug D, et al. Thymic medullary epithelium and thymocyte self-tolerance require cooperation between CD28-CD80/86 and CD40-CD40L costimulatory pathways. J Immunol. (2014) 192:630–40. doi: 10.4049/jimmunol.1302550
139. Lancaster JN, Li Y, Ehrlich LIR. Chemokine-mediated choreography of thymocyte development and selection. Trends Immunol. (2018) 39:86–98. doi: 10.1016/j.it.2017.10.007
140. Maroder M, Bellavia D, Vacca A, Felli MP, Screpanti I. The thymus at the crossroad of neuroimmune interactions. Ann N Y Acad Sci. (2000) 917:741–7. doi: 10.1111/j.1749-6632.2000.tb05438.x
141. Xia Z, Ouyang D, Li Q, Li M, Zou Q, Li L, et al. The expression, functions, interactions and prognostic values of PTPRZ1: A review and bioinformatic analysis. J Cancer. (2019) 10:1663–74. doi: 10.7150/jca.28231
142. Mendes-da-Cruz DA, Brignier AC, Asnafi V, Baleydier F, Messias CV, Lepelletier Y, et al. Semaphorin 3F and neuropilin-2 control the migration of human T-cell precursors. PloS One. (2014) 9:e103405. doi: 10.1371/journal.pone.0103405
143. He F, Chen H, Probst-Kepper M, Geffers R, Eifes S, Del Sol A, et al. PLAU inferred from a correlation network is critical for suppressor function of regulatory T cells. Mol Syst Biol. (2012) 8:624. doi: 10.1038/msb.2012.56
144. Golbert DCF, Santana-Van-Vliet E, Ribeiro-Alves M, Fonseca M, Lepletier A, Mendes-da-Cruz DA, et al. Small interference ITGA6 gene targeting in the human thymic epithelium differentially regulates the expression of immunological synapse-related genes. Cell Adh Migr. (2018) 12:152–67. doi: 10.1080/19336918.2017.1327513
145. Emre Y, Irla M, Dunand-Sauthier I, Ballet R, Meguenani M, Jemelin S, et al. Thymic epithelial cell expansion through matricellular protein CYR61 boosts progenitor homing and T-cell output. Nat Commun. (2013) 4:2842. doi: 10.1038/ncomms3842
146. Cheng S, Caviness K, Buehler J, Smithey M, Nikolich-Zugich J, Goodrum F. Transcriptome-wide characterization of human cytomegalovirus in natural infection and experimental latency. Proc Natl Acad Sci U S A. (2017) 114:E10586–E95. doi: 10.1073/pnas.1710522114
147. Feng L, Li W, Wu X, Li X, Yang X, Ran Y, et al. Human cytomegalovirus UL23 attenuates signal transducer and activator of transcription 1 phosphorylation and type I interferon response. Front Microbiol. (2021) 12:692515. doi: 10.3389/fmicb.2021.692515
148. Adair R, Douglas ER, Maclean JB, Graham SY, Aitken JD, Jamieson FE, et al. The products of human cytomegalovirus genes UL23, UL24, UL43 and US22 are tegument components. J Gen Virol. (2002) 83:1315–24. doi: 10.1099/0022-1317-83-6-1315
149. Nascimento R, Dias JD, Parkhouse RM. The conserved UL24 family of human alpha, beta and gamma herpesviruses induces cell cycle arrest and inactivation of the cyclinB/cdc2 complex. Arch Virol. (2009) 154:1143–9. doi: 10.1007/s00705-009-0420-y
150. Ruan P, Wang M, Cheng A, Zhao X, Yang Q, Wu Y, et al. Mechanism of herpesvirus UL24 protein regulating viral immune escape and virulence. Front Microbiol. (2023) 14:1268429. doi: 10.3389/fmicb.2023.1268429
Keywords: roseolovirus, thymus, central tolerance, transcriptomics, thymocytes, medullary thymic epithelial cells (mTECs), tropism
Citation: Belean A, Xue E, Cisneros B, Roberson EDO, Paley MA and Bigley TM (2024) Transcriptomic profiling of thymic dysregulation and viral tropism after neonatal roseolovirus infection. Front. Immunol. 15:1375508. doi: 10.3389/fimmu.2024.1375508
Received: 23 January 2024; Accepted: 10 May 2024;
Published: 04 June 2024.
Edited by:
Hela Jaïdane, University of Monastir, TunisiaReviewed by:
Geraldo Aleixo Passos, University of São Paulo, BrazilCopyright © 2024 Belean, Xue, Cisneros, Roberson, Paley and Bigley. This is an open-access article distributed under the terms of the Creative Commons Attribution License (CC BY). The use, distribution or reproduction in other forums is permitted, provided the original author(s) and the copyright owner(s) are credited and that the original publication in this journal is cited, in accordance with accepted academic practice. No use, distribution or reproduction is permitted which does not comply with these terms.
*Correspondence: Tarin M. Bigley, YmlnbGV5QHd1c3RsLmVkdQ==; Michael A. Paley, cGFsZXltQHd1c3RsLmVkdQ==
†Lead Contact
Disclaimer: All claims expressed in this article are solely those of the authors and do not necessarily represent those of their affiliated organizations, or those of the publisher, the editors and the reviewers. Any product that may be evaluated in this article or claim that may be made by its manufacturer is not guaranteed or endorsed by the publisher.
Research integrity at Frontiers
Learn more about the work of our research integrity team to safeguard the quality of each article we publish.