
94% of researchers rate our articles as excellent or good
Learn more about the work of our research integrity team to safeguard the quality of each article we publish.
Find out more
ORIGINAL RESEARCH article
Front. Immunol. , 15 April 2024
Sec. Inflammation
Volume 15 - 2024 | https://doi.org/10.3389/fimmu.2024.1372959
This article is part of the Research Topic Immunity and Pulmonary Vascular Diseases: Challenges, Advances and Future Perspectives View all 8 articles
 Sushil Kumar1*
 Claudia Mickael2
 Rahul Kumar3,4
 Ram Raj Prasad1Nzali V. Campbell1
 Hui Zhang1Min Li1
 B. Alexandre McKeon1Thaddeus E. Allen2
 Brian B. Graham3,4
 Yen-Rei A. Yu2*†
 Kurt R. Stenmark1†
Introduction: Hypoxia is a common pathological driver contributing to various forms of pulmonary vascular diseases leading to pulmonary hypertension (PH). Pulmonary interstitial macrophages (IMs) play pivotal roles in immune and vascular dysfunction, leading to inflammation, abnormal remodeling, and fibrosis in PH. However, IMs’ response to hypoxia and their role in PH progression remain largely unknown. We utilized a murine model of hypoxia-induced PH to investigate the repertoire and functional profiles of IMs in response to acute and prolonged hypoxia, aiming to elucidate their contributions to PH development.
Methods: We conducted single-cell transcriptomic analyses to characterize the repertoire and functional profiles of murine pulmonary IMs following exposure to hypobaric hypoxia for varying durations (0, 1, 3, 7, and 21 days). Hallmark pathways from the mouse Molecular Signatures Database were utilized to characterize the molecular function of the IM subpopulation in response to hypoxia.
Results: Our analysis revealed an early acute inflammatory phase during acute hypoxia exposure (Days 1-3), which was resolved by Day 7, followed by a pro-remodeling phase during prolonged hypoxia (Days 7-21). These phases were marked by distinct subpopulations of IMs: MHCIIhiCCR2+EAR2+ cells characterized the acute inflammatory phase, while TLF+VCAM1hi cells dominated the pro-remodeling phase. The acute inflammatory phase exhibited enrichment in interferon-gamma, IL-2, and IL-6 pathways, while the pro-remodeling phase showed dysregulated chemokine production, hemoglobin clearance, and tissue repair profiles, along with activation of distinct complement pathways.
Discussion: Our findings demonstrate the existence of distinct populations of pulmonary interstitial macrophages corresponding to acute and prolonged hypoxia exposure, pivotal in regulating the inflammatory and remodeling phases of PH pathogenesis. This understanding offers potential avenues for targeted interventions, tailored to specific populations and distinct phases of the disease. Moreover, further identification of triggers for pro-remodeling IMs holds promise in unveiling novel therapeutic strategies for pulmonary hypertension.
Pulmonary hypertension (PH) is a heterogeneous group of diseases characterized by elevated pulmonary arterial pressures as a result of pulmonary vascular inflammation and remodeling, eventually leading to right heart failure and death (1–4). In PH, hypoxia and immune dysfunction are central contributors to disease pathogenesis (5–10). The mechanisms through which hypoxia and immune dysfunction contribute to PH have been examined in animal models, including hypoxia-induced PH (11, 12). Myeloid leukocytes, especially macrophages, are thought to be the primary effectors of inflammation and remodeling in the PH vessel wall (1, 5). However, the transcriptional repertoire and functional profiles of pulmonary interstitial macrophage (IM) in response to hypoxia that regulate abnormal pulmonary vascular remodeling remain largely unknown.
Under normal homeostatic conditions, pulmonary IMs comprise a heterogeneous population of cells that can arise from embryonic origins with local self-renewing capacities or are recruited from circulating monocytes (13–15). Depending on the stimuli and microenvironment, IMs’ repertoire and functional profiles in disease are altered. Systemic and tissue hypoxia can shape the immune landscape and macrophage function to regulate lung injury and repair. In animal models of PH, prolonged hypoxia causes a marked accumulation of monocytes and macrophages, especially in the perivascular regions of the lung’s blood vessels, leading to vascular thickening and elevation of pulmonary pressures (5, 16–19). Prior studies using bulk transcriptomic analyses of pulmonary macrophages in a hypoxia-induced PH model showed dynamic time- and compartment-specific changes in IMs in response to hypoxia exposure (17). Studies have also demonstrated that pulmonary IMs are central to the development of PH (17, 20). Thus, hypoxia contributes to PH, at least in part, via its effects on pulmonary IMs. However, an understanding of when and how hypoxia affects pulmonary IM population gene expression and function has previously been hindered by significant marker overlaps among the subsets. The advent of single-cell RNA sequencing (scRNAseq) allows for identifying and characterizing pulmonary macrophages under homeostatic and in response to injuries and environmental stimuli (13, 15).
This study aims to elucidate the effects of hypoxia on pulmonary IM repertoire and their functional states using a murine model of hypoxic PH. We employed scRNAseq to examine dynamic temporal changes in IM populations and gene expression patterns. Understanding how the transcriptional profiles of interstitial macrophages evolve in response to hypoxia or disease progression is crucial for decoding their roles in maintaining tissue function or contributing to PH. This information is invaluable for elucidating the contributions of interstitial macrophages to disease pathogenesis. It can potentially guide the development of targeted therapeutic strategies to modulate the functions of distinct macrophage subpopulations.
Animal procedures adhered to protocols approved by the University of Colorado Institutional Animal Care and Use Committee. Cx3cr1+/GFP reporter mice [B6.129P2(Cg)-Cx3cr1tm1Litt/J, Jackson Labs Stock No.: 005582] were bred with C57BL/6J (Jackson Stock No. 000664) and were raised at an altitude of 1,609 meters (Denver altitude). We have previously noted mild changes in pulmonary interstitial macrophage transcriptomic profiles in animals at Denver altitude compared to sea level (Supplementary Figures S1A–F). To avoid potential confounders of adaptation due to residence in reduced oxygen at altitude, Cx3cr1+/GFP animals were placed in sea level (~21% fraction of inspired oxygen (FiO2)) chamber at 5 weeks of age for 4 weeks to allow acclimation to sea level condition. Subsequently, animals were maintained at sea level (Day 0) or exposed to hypoxia conditions (simulated altitude of 5,486 meters, in the hypobaric chamber; ~10% FiO2) for 1, 3, 7, or 21 days.
For each time point, the lungs of a pair of age and sex-matched mice (1 male and 1 female) were harvested for subsequent analyses as previously described (21). Briefly, animals were anesthetized using a ketamine and xylazine mixture at final concentrations of 100 mg/kg and 20 mg/kg, respectively. To distinguish between interstitial and circulating cells, mice were administered a retro-orbital injection of an anti-CD45 antibody (1 µg/mouse) 5 minutes before euthanasia to label intravascular leukocytes. Afterward, the lungs were perfused via the right ventricle with PBS. The PBS-flushed lungs were then collected and individually subjected to digestion. Briefly, perfused lung tissues underwent enzymatic digestion using liberase (Roche, Germany) dissolved in RPMI medium (Mediatech, Corning, NY) at a concentration of 1 mg/ml, for 30 minutes at 37°C. The tissue underwent further mechanical disruption by passing through 16-gauge and 18-gauge needles five times each. Afterward, the cells were filtered through a 100 μm cell strainer (Fisher Scientific) and centrifuged for 5 minutes at 400x g. Red blood cells (RBCs) were lysed using 1 ml of ACK lysis buffer (Gibco). Following RBC lysis, the cells were resuspended and washed in RPMI to neutralize the lysis buffer. As previously described, pulmonary interstitial macrophages were sorted by flow cytometry (22). Briefly, singlet cells were gated as CD45+ and Lin- (excluding T cells, B cells, natural killer cells, and neutrophils). Intravascular cells were excluded by negative gating for intravenous anti-CD45. Subsequently, cells were gated based on GFPhi expression, followed by CD64+ and CD11b+ expression for IMs, while AMs were gated as GFPlo CD64+ CD11c+. Flow sorting was conducted using an Astrios EQ cell sorter (Beckman Coulter Life Sciences) at the CUAMC Cancer Center Flow Cytometry Shared Resource. Post-sorting, isolated cells were collected in a specialized medium (HBSS-Gibco with 2.5% FBS), centrifuged, accurately counted, and prepared for subsequent sequencing analysis. In each experimental group, IMs were sorted from one male and one female mouse, pooled, and utilized for library preparation and sequencing using the 10x Genomics platform according to standard protocols described below.Single-cell RNA sequencing
For each time point, sorted pulmonary interstitial macrophages from at least two animals (male and female) were combined for single-cell RNA sequencing. The CUAMC Genomics Core conducted the sequencing process, wherein the suspension of sorted IMs was loaded onto the Chromium Single Cell Controller (10x Genomics) using the Single-Cell 3′ Library and Gel Bead Kit V3.1 (10x Genomics, 1000268) alongside the Chromium Single Cell G Chip Kit (10x Genomics, 1000120) to generate single-cell gel beads in the emulsion as per the manufacturer’s protocol. In brief, single cells were suspended in phosphate-buffered saline containing 0.04% bovine serum albumin. Approximately 10,000 cells were introduced into each channel, aiming to recover an estimated 5,000 cells. Captured cells were then lysed, releasing RNA, which was barcoded through reverse transcription within individual Gel Bead-In Emulsions (GEMs). Reverse transcription was carried out on an S1000TM Touch Thermal Cycler (Bio-Rad) at 53°C for 45 minutes, followed by 85°C for 5 minutes, and then held at 4°C. The resulting cDNA was amplified, and its quality was assessed using an Agilent 4200 system. ScRNAseq libraries were constructed following the manufacturer’s instructions using the Single Cell 3′ Library and Gel Bead Kit V3.1. Finally, the libraries were sequenced on an Illumina NovaSeq 6000 sequencer with a sequencing depth of at least 100,000 reads per cell using the paired-end 150 bp strategy.
We aligned sequence reads to the Mus musculus GRCm39 reference genome using Cell Ranger v6 (10x Genomics). The raw read counts from all time points were aggregated and subjected to downstream analysis using Seurat (v4.3.0) (23). Low-quality cells, doublets, and damaged cells defined as having unique feature count < 300 (low quality) or >5,000 (doublets), and >20% mitochondria content (damaged/stressed cells) were excluded from the dataset using Seurat and DoubletFinder (v2.0.3) (24) The dot plot and bar plot visualizations were produced using ggplot2 (v3.4.3), while the heatmap visualization for average gene expression and pathways was created using the ComplexHeatmap (v2.14.0) library in R (v4.2.2).
Filtered gene expression measurements were normalized using the LogNormalize method with scale.factor = 10000, followed by selecting the top 2000 highly variable genes with ‘vst’ selection method. Thereafter, data was scaled using the ScaleData method with regression of unwanted sources of variation such as mitochondria content, feature count, and cell cycle phage. The scaled data was used to analyze the initial 100 dimensions of PCA. Subsequently, the significant dimensions (1 to 18) were utilized for neighbor identification and cluster analysis, employing Uniform Manifold Approximation and Projection (UMAP) with the ‘umap-learn’ method (23).
Data integration was performed using the ‘IntegrateData’ function and the reciprocal principal component analysis (rPCA) method with ‘k.anchor=5’ of the Seurat library to integrate data of all timepoint and remove batch effects. The integrated data underwent reclustering with the indicated parameter (20).
We employed the SingleR (v1.6.1) (https://github.com/dviraran/SingleR) to annotate cell types in our scRNAseq data by comparing individual cell gene expression profiles with ImmGen (Immunological Genome Project) datasets for cell type assignment (Supplementary Figures S2A, B). Of the identified cells, less than 6% were non-macrophage cells, including monocytes, dendritic cells, T-cells, B-cells, NKT cells, and endothelial cells. Non-macrophages were subsequently excluded from downstream analysis. Clustering using shared nearest neighbors (SNN) with the k-means 2 and 18 was applied to identify the IM subpopulations. Temporal clusters were merged based on a similar cell proportion pattern.
For cluster-specific gene identification, the ‘FindAllMarkers’ function, while for conserved cluster-specific genes identification, the ‘FindConservedMarkers’ function was employed. To identify differentially expressed genes (DEGs) for each time point compared to day 0 within each cluster, the ‘FindMarkers’ function was used, followed by the identification of positive and negative (differentially expressed gene) DEGs using a nonparametric Wilcoxon rank-sum test with a significance threshold (q value) < 0.05. GSVA (v1.46.0) (25) and the FGSEA (v1.18.0) (26) library in R were employed to perform gene set variation analysis (GSVA) and gene set enrichment analysis (GSEA). Hallmark pathways from the mouse Molecular Signatures Database (MSigDB) were utilized for GSVA analysis of the IM subpopulation and GSEA analysis to understand the response at different time points of hypoxia. Adjusted p-value < 0.05 and positive normalized enrichment score (NES) are considered enriched pathways.
Murine lung tissues were perfused with phosphate-buffered-saline (PBS) solution, inflated with 4% paraformaldehyde (PFA) (Sigma Aldrich, St. Louise, MO), and fixed for 2 hours. Fixed tissues were washed with PBS solution and treated with 30% sucrose solution. Treated tissues were embedded in Optimal Cutting Temperature compound (OCT). Frozen tissue sections of 6-8µm were prepared. Immunofluorescence staining was performed using rat anti-mouse CD64 (AT152-9; Bio-Rad, Hercules, CA), mouse anti-α-smooth muscle actin-FITC (SMA-FITC)(1A4; Sigma Aldrich), and rabbit anti-mouse VCAM1 (SA05-04; Thermo Fisher Scientific). 4’,6’-diamidino-2-phenylindole (DAPI) was used for nuclear staining. CD64, VCAM1, and SMA-FITC staining were performed using tyramide amplification (Akoya Bioscience TSA Plus kits). Small pulmonary arteries of similar sizes were selected blindly across treatment or animal groups for imaging. Confocal images were obtained with a Olympus FV1000 laser scanning confocal microscope using 10x objective (Zeiss, Cambridge, UK). The confocal images underwent processing and quantification of VCAM1hi macrophage using FIJI ImageJ (National Institute of Health).
After conducting quality control and excluding non-macrophages, 2521 pulmonary interstitial macrophages were identified in the sea level (Day 0) sample. Similar to previously described, clustering analyses revealed three transcriptionally distinct populations: TLF+ (Timd4, Lyve1, and Folr2), MHCIIhi, and CCR2+ (Figure 1A) (15). The TLF cluster expresses Timd4, Lyve1, and Folr2 genes (Figure 1B, Supplementary Figures S3A, B) (15). Ccr2 expression was highest in the CCR2+ cluster. H2-Eb1, which encodes for histocompatibility class II antigen (MHCII), was expressed in the MHCIIhi and CCR2+ clusters (Figures 1C, D). Ccr2 expression was highest in the CCR2+ cluster. H2-Eb1, which encodes for histocompatibility class II antigen (MHCII), was expressed in the MHCIIhi and CCR2+ clusters (Figures 1C, D). MHCIIhi and TLF+ clusters comprised the majority of IM examined (46.1% and 41.1%, respectively), and the CCR2+ cluster represented the smallest cluster (12.8%) (Figure 1E). To exclude sex as a potential confounder in the data analyses, we distinguished IMs derived from male vs. female mice using Y-chromosome-associated gene transcripts and X-inactive specific transcripts (Xist) RNA. There were no significant differences in IM distribution between the sexes within this dataset that may confound the findings (Supplementary Figure S3C).
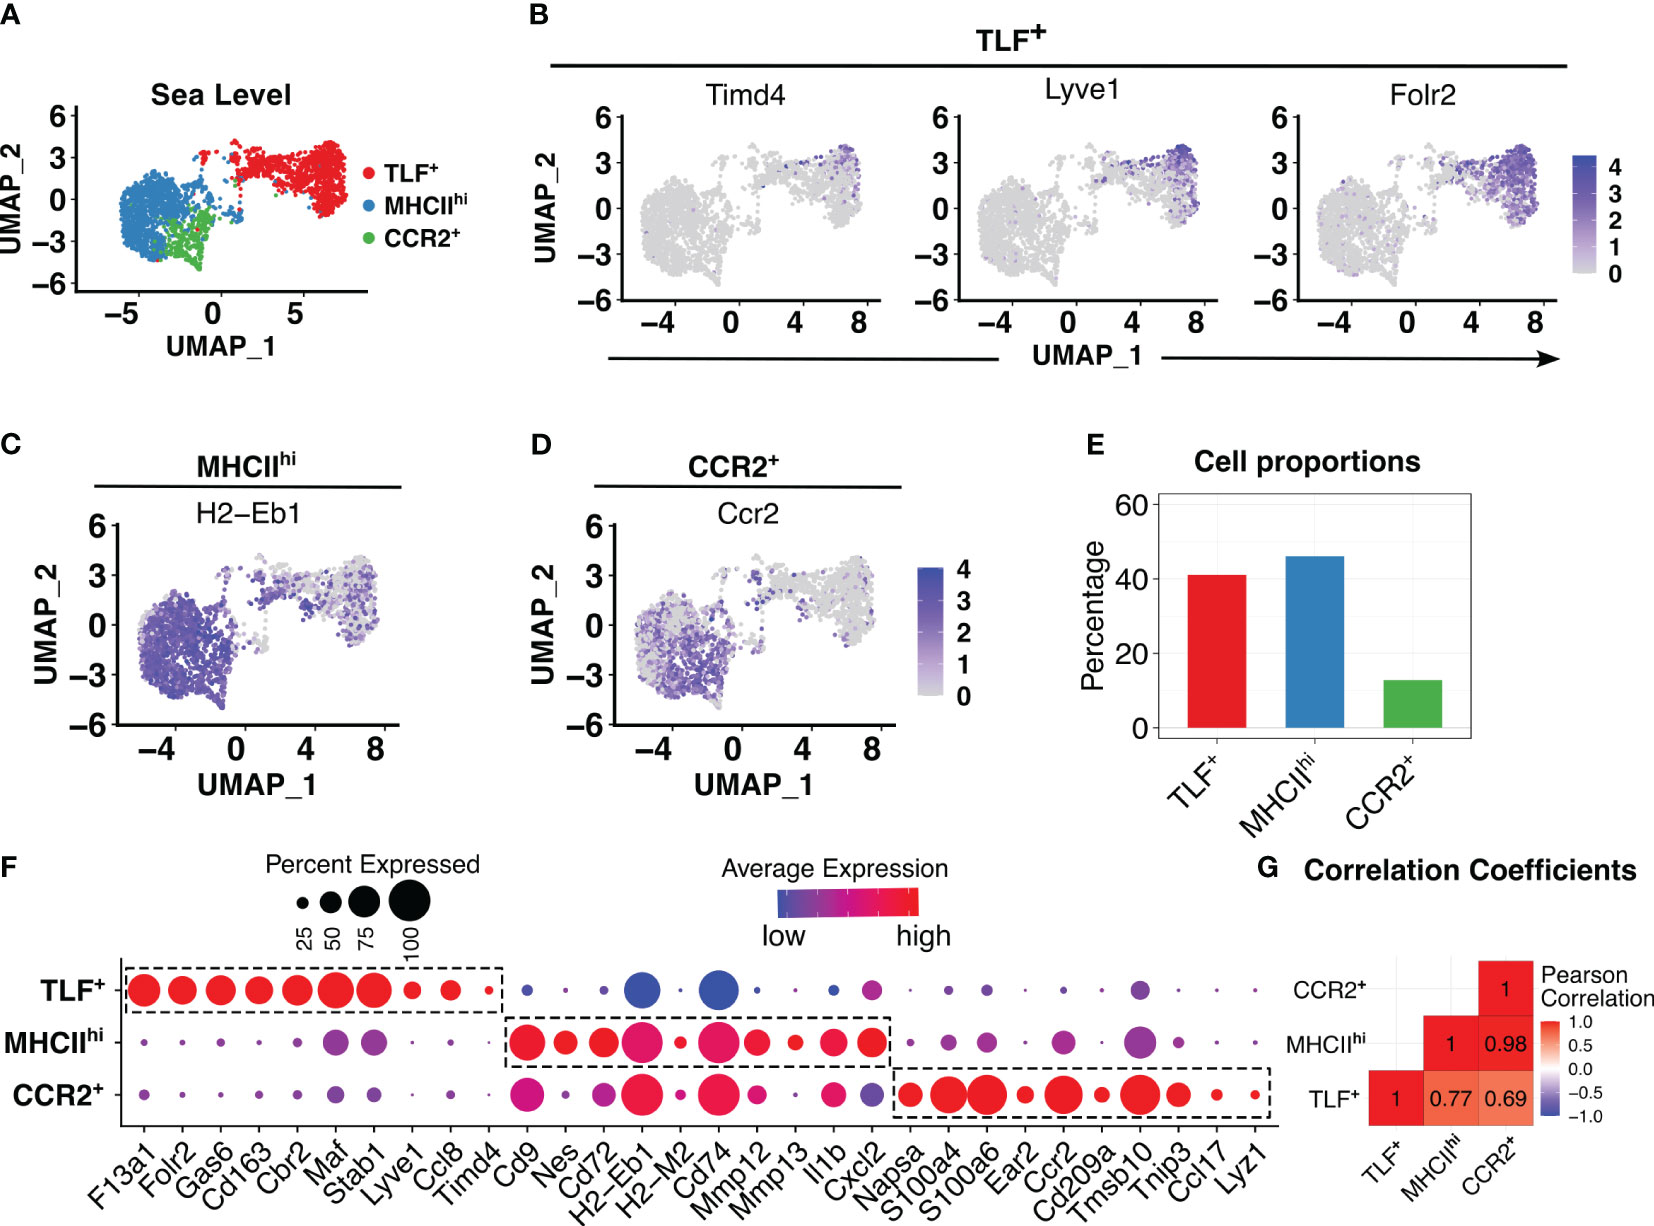
Figure 1 In animals acclimated to sea level, three distinct interstitial macrophage (IM) subpopulations were observed. (A) PCA plot showed three distinct IM subpopulations. (B-D) Feature plots showing expression of cluster-defining markers: TLF+ (Timd4, Lyve1, and Folr2), MHCIIhi (H2-Eb1), and CCR2+ (Ccr2). (E) Bar plots depicting percentages of each subpopulation as a proportion of IMs. (F) Dot plot showing average and percentage expression of top 10 cluster defining genes for each of three subpopulations. (G) Pearson correlation analysis highlights a transcriptional difference in the TLF+ subpopulation from MHCIIhi and CCR2+, but shared gene profiles between MHCIIhi and CCR2+ subpopulations.
While cluster-defining marker analyses revealed three transcriptionally distinct populations as previously described, there were significant overlapping gene expression patterns between the MHCIIhi and CCR2+ subpopulations (Figure 1F, Supplementary Figures S3A, B) suggesting MHCIIhi and CCR2+ subpopulations are highly related. Pearson method for correlation coefficient analysis of IM subpopulations confirms this observation: while the TLF+ subpopulation exhibited a significant transcriptional distinction from both the MHCIIhi (correlation coefficient 0.77) and CCR2+ (correlation coefficient 0.69) subpopulations, there was a high correlation coefficient of 0.98 between MHCIIhi and CCR2+ (Figure 1G). Thus, MHCIIhi and CCR2+ populations are highly related.
To evaluate potential hypoxia-induced responses, we integrated cells from various time points, encompassing sea level (day 0) and days 1, 3, 7, and 21 of hypoxic exposure. Initial sub-clustering analyses identified two large clusters reflecting TLF+ and MHCIIhiCCR2+ populations (Figure 2A) but did not capture the dynamic accumulation of a distinct population of inflammatory macrophages in response hypoxia exposure previously described by flow cytometry (8, 27). A sub-clustering approach was applied to examine potential dynamic cellular changes, identifying 18 subclusters (Figure 2B). Four patterns of temporal cellular dynamics in the subclusters were identified (Figure 2C). Group 1 (subclusters 1, 2, 3, and 4; MHCIIhiCCR2+ (a)) derived from MHCIIhiCCR2+ cluster showing an increase in cell proportions at day 1, reaching their highest levels at day 3, followed by a decrease in cell proportion at day 7, and ultimately approaching the cell proportions observed at day 21 to sea level (Figure 2C). Group 2 (subclusters 5, 6, and 7; TLF+ (a)) derived from the TLF+ cluster showed a decrease in cell proportions at day 1 of hypoxia exposure, reaching their lowest levels at day 3 hypoxia, followed by an increase in cell numbers at day 7 hypoxia, and ultimately accumulated at significantly higher cell proportions compared to sea level by day 21 (Figure 2C). Group 3 (subclusters 8-16 derived from MHCIIhiCCR2+ cluster; MHCIIhiCCR2+ (b)) and Group 4 (subclusters 17 and 18 arise from TLF+ cluster; TLF+ (b)) remained largely consistent in their cellular dynamics in response to hypoxia except cluster 18 showed decreased cell proportion at day 3 and day 7 (Figure 2C). Cluster stability analyses showed a general increase in the stability of aggregated clusters compared to individual subclusters, confirming the reliability of the aggregated groupings (Supplementary Figure S4). Thus, the aggregation of subclusters resulted in four distinct stable clusters reflecting temporal changes in IM populations in response to hypoxia exposure: MHCIIhiCCR2+ (a), TLF+ (a), MHCIIhiCCR2+ (b), and TLF+ (b) (Figure 2C).
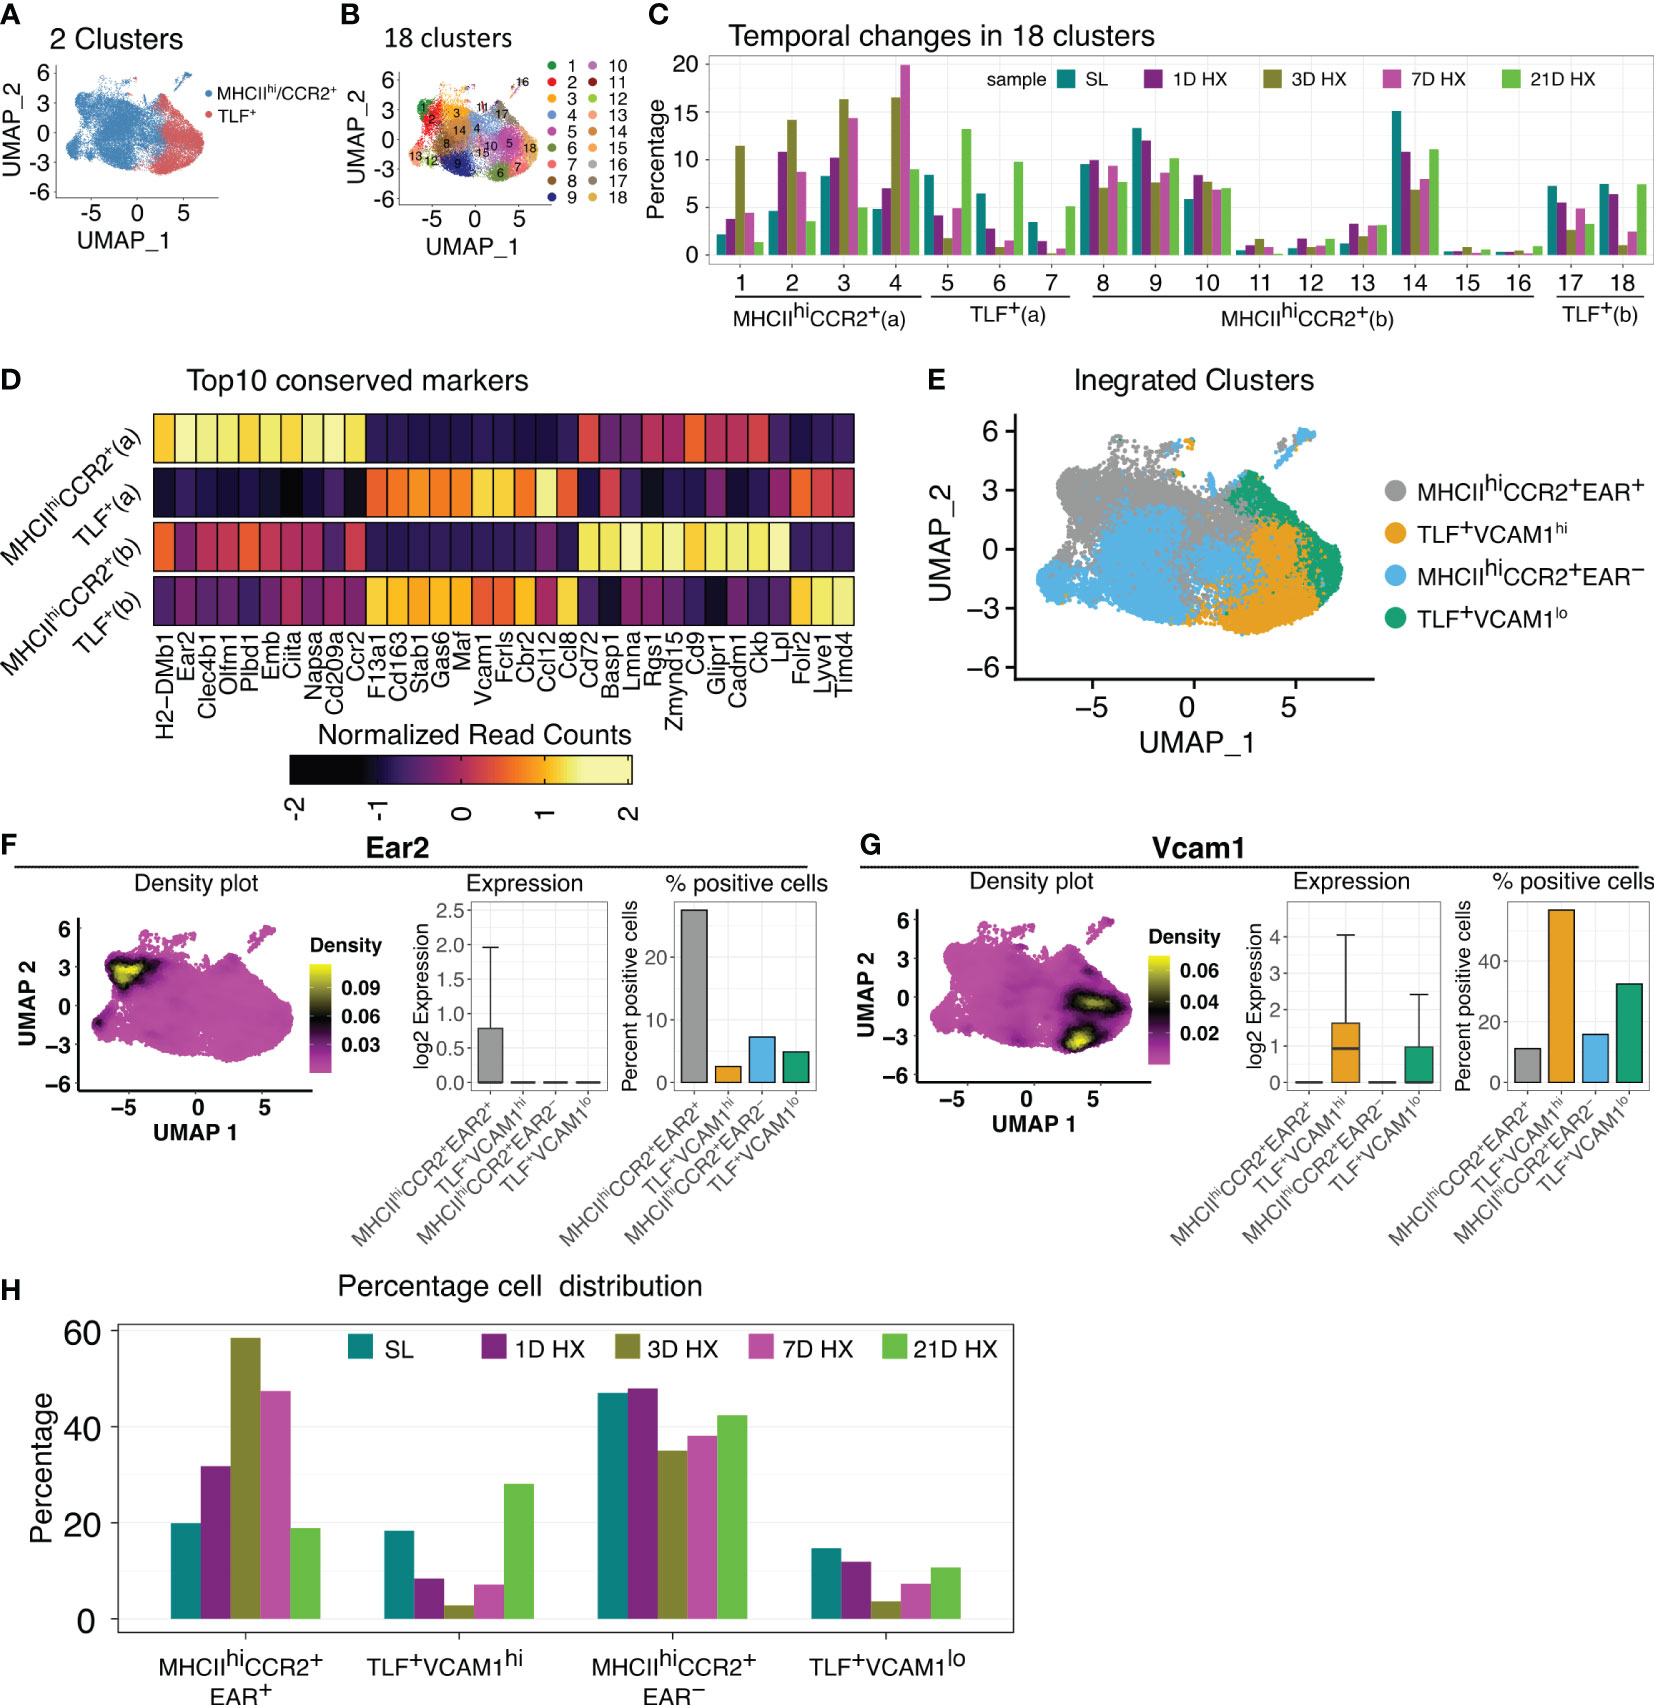
Figure 2 Dynamic IM population changes in response to hypoxia. (A, B) UMAP visualization of integrated data (SL, Days 1, 3, 7, and 21 of hypoxia exposure) representing 2 clusters and 18 clusters. (C) Bar graph depicting the 4 patterns of cell proportion changes throughout the course of hypoxia exposure among 18 subclusters: MHCIIhiCCR2+(a), MHCIIhiCCR2+(b), TLF+(a), and TLF+(b). (D) Heatmap showing the expression of the top 10 conserved markers for each temporal subcluster. (E) UMAP visualization of the four distinct temporal cell populations. (F) The density plot illustrates that Ear2 expression is predominantly localized within the MHCIIhiCCR2+EAR2+ cluster. Bar graphs depicting the level and percent of Ear2 expression level in each subcluster. (G) The density plot illustrates that Vcam1 expression is predominantly localized within the TLF+VCAM1hi cluster. Bar graphs depicting the level and percent of Vcam1 expression level in each subcluster. (H) Bar graph showing the distribution of cell percentage of four clusters over the course of hypoxia exposure.
Conserved marker analyses revealed that MHCIIhiCCR2+ (a) uniquely expresses Ear2, and DEG analysis showed an exclusively high level of Ear2 expression in the MHCIIhiCCR2+ (a) population (Figures 2D–F). Consequently, we labeled MHCIIhiCCR2+ (a) as MHCIIhiCCR2+EAR2+ and MHCIIhiCCR2+ (b) as MHCIIhiCCR2+EAR2- (Figures 2D–F). Similarly, we noticed that TLF+ (a) exhibited increased Vcam1 positivity, with the other clusters showing low Vcam1 expression (Figures 2D, E, G). We designated TLF+ (a) as TLF+VCAM1hi and TLF+ (b) as TLF+VCAM1lo (Figures 2D, E, G). The characteristics of the MHCIIhiCCR2+EAR2- and TLF+VCAM1lo clusters are shown by dot plots and density plots (Supplementary Figures 5SA–D). The sub-clustering approach captured dynamic IM changes and resulted in four molecularly distinct populations of IMs (Figure 2H).
These newly defined clusters detailed the dynamic IM population changes in response to hypoxia exposure. Proportions of cells in MHCIIhiCCR2+EAR2- and TLF+VCAM1lo decreased on day 3 of hypoxia, but subsequently, both subpopulations began to increase on days 7; and by day 21, they approach that of sea level proportions (Figure 2H). The proportion of MHCIIhiCCR2+EAR2+ cells stood at 19.9% at sea level. Following one day of acute hypoxic exposure, this percentage increased to 31.8%. It reached its zenith at 58.5% after three days of acute hypoxia exposure. Subsequently, it declined to 47.4% after seven days of hypoxia exposure and eventually settled at 18.9% after 21 days, which was close to the initial sea level percentage of 19.9% (Figure 2H).
In contrast, the proportion of the TLF+VCAM1hi subpopulation decreased in response to acute hypoxia exposure (from ~18% at level to 10% on day 1). The cell proportions continued to decline, reaching a minimum of 5% on day 3 of hypoxia. Then, the cell proportion begins to increase on day 7. By day 21 of hypoxia exposure, the TLF+VCAM1hi proportion exceeded that of sea level (from ~18% at sea level to ~28% on Day 21) (Figure 2H). These findings demonstrate that dynamic and distinct IM populations emerge in response to acute vs. prolonged hypoxia.
With dynamic temporal and cellular changes in four groups of IMs suggesting distinct roles in regulating vascular remodeling processes and the development of PH, we conducted gene set variation analysis (GSVA) to identify Hallmark pathways for each subpopulation based on absolute expression levels. MHCIIhiCCR2+EAR2- enriched in Myc Targets V1 and V2, E2F Targets, G2M Checkpoint, and mTORC1 Signaling, and TLF+VCAM1lo population exhibited enrichment in Heme Metabolism and Mitotic Spindle pathways (Figure 3A) suggestive for these two populations having a role in regulating homeostatic functions. Corresponding to their significant increase in cell number in response to acute hypoxia exposure (Day 1-3), the MHCIIhiCCR2+EAR2+ population was highly enriched for pathways related to acute hypoxia and type 1 acute inflammatory activation (i.e., Inflammatory Response, IL2 STAT5 Signaling, IL6 Jak Signaling, Interferon Gamma Response, Complement, and hypoxia) (Figure 3A). On the other hand, the TLF+VCAM1hi population showed enrichment in TNFα Signaling via NFκB, Hedgehog Signaling, and Notch Signaling, which are known pathways associated with vascular development and remodeling (28–30). These findings reflect waves of IMs with distinct functional roles contributing to the development of hypoxia-induced PH.
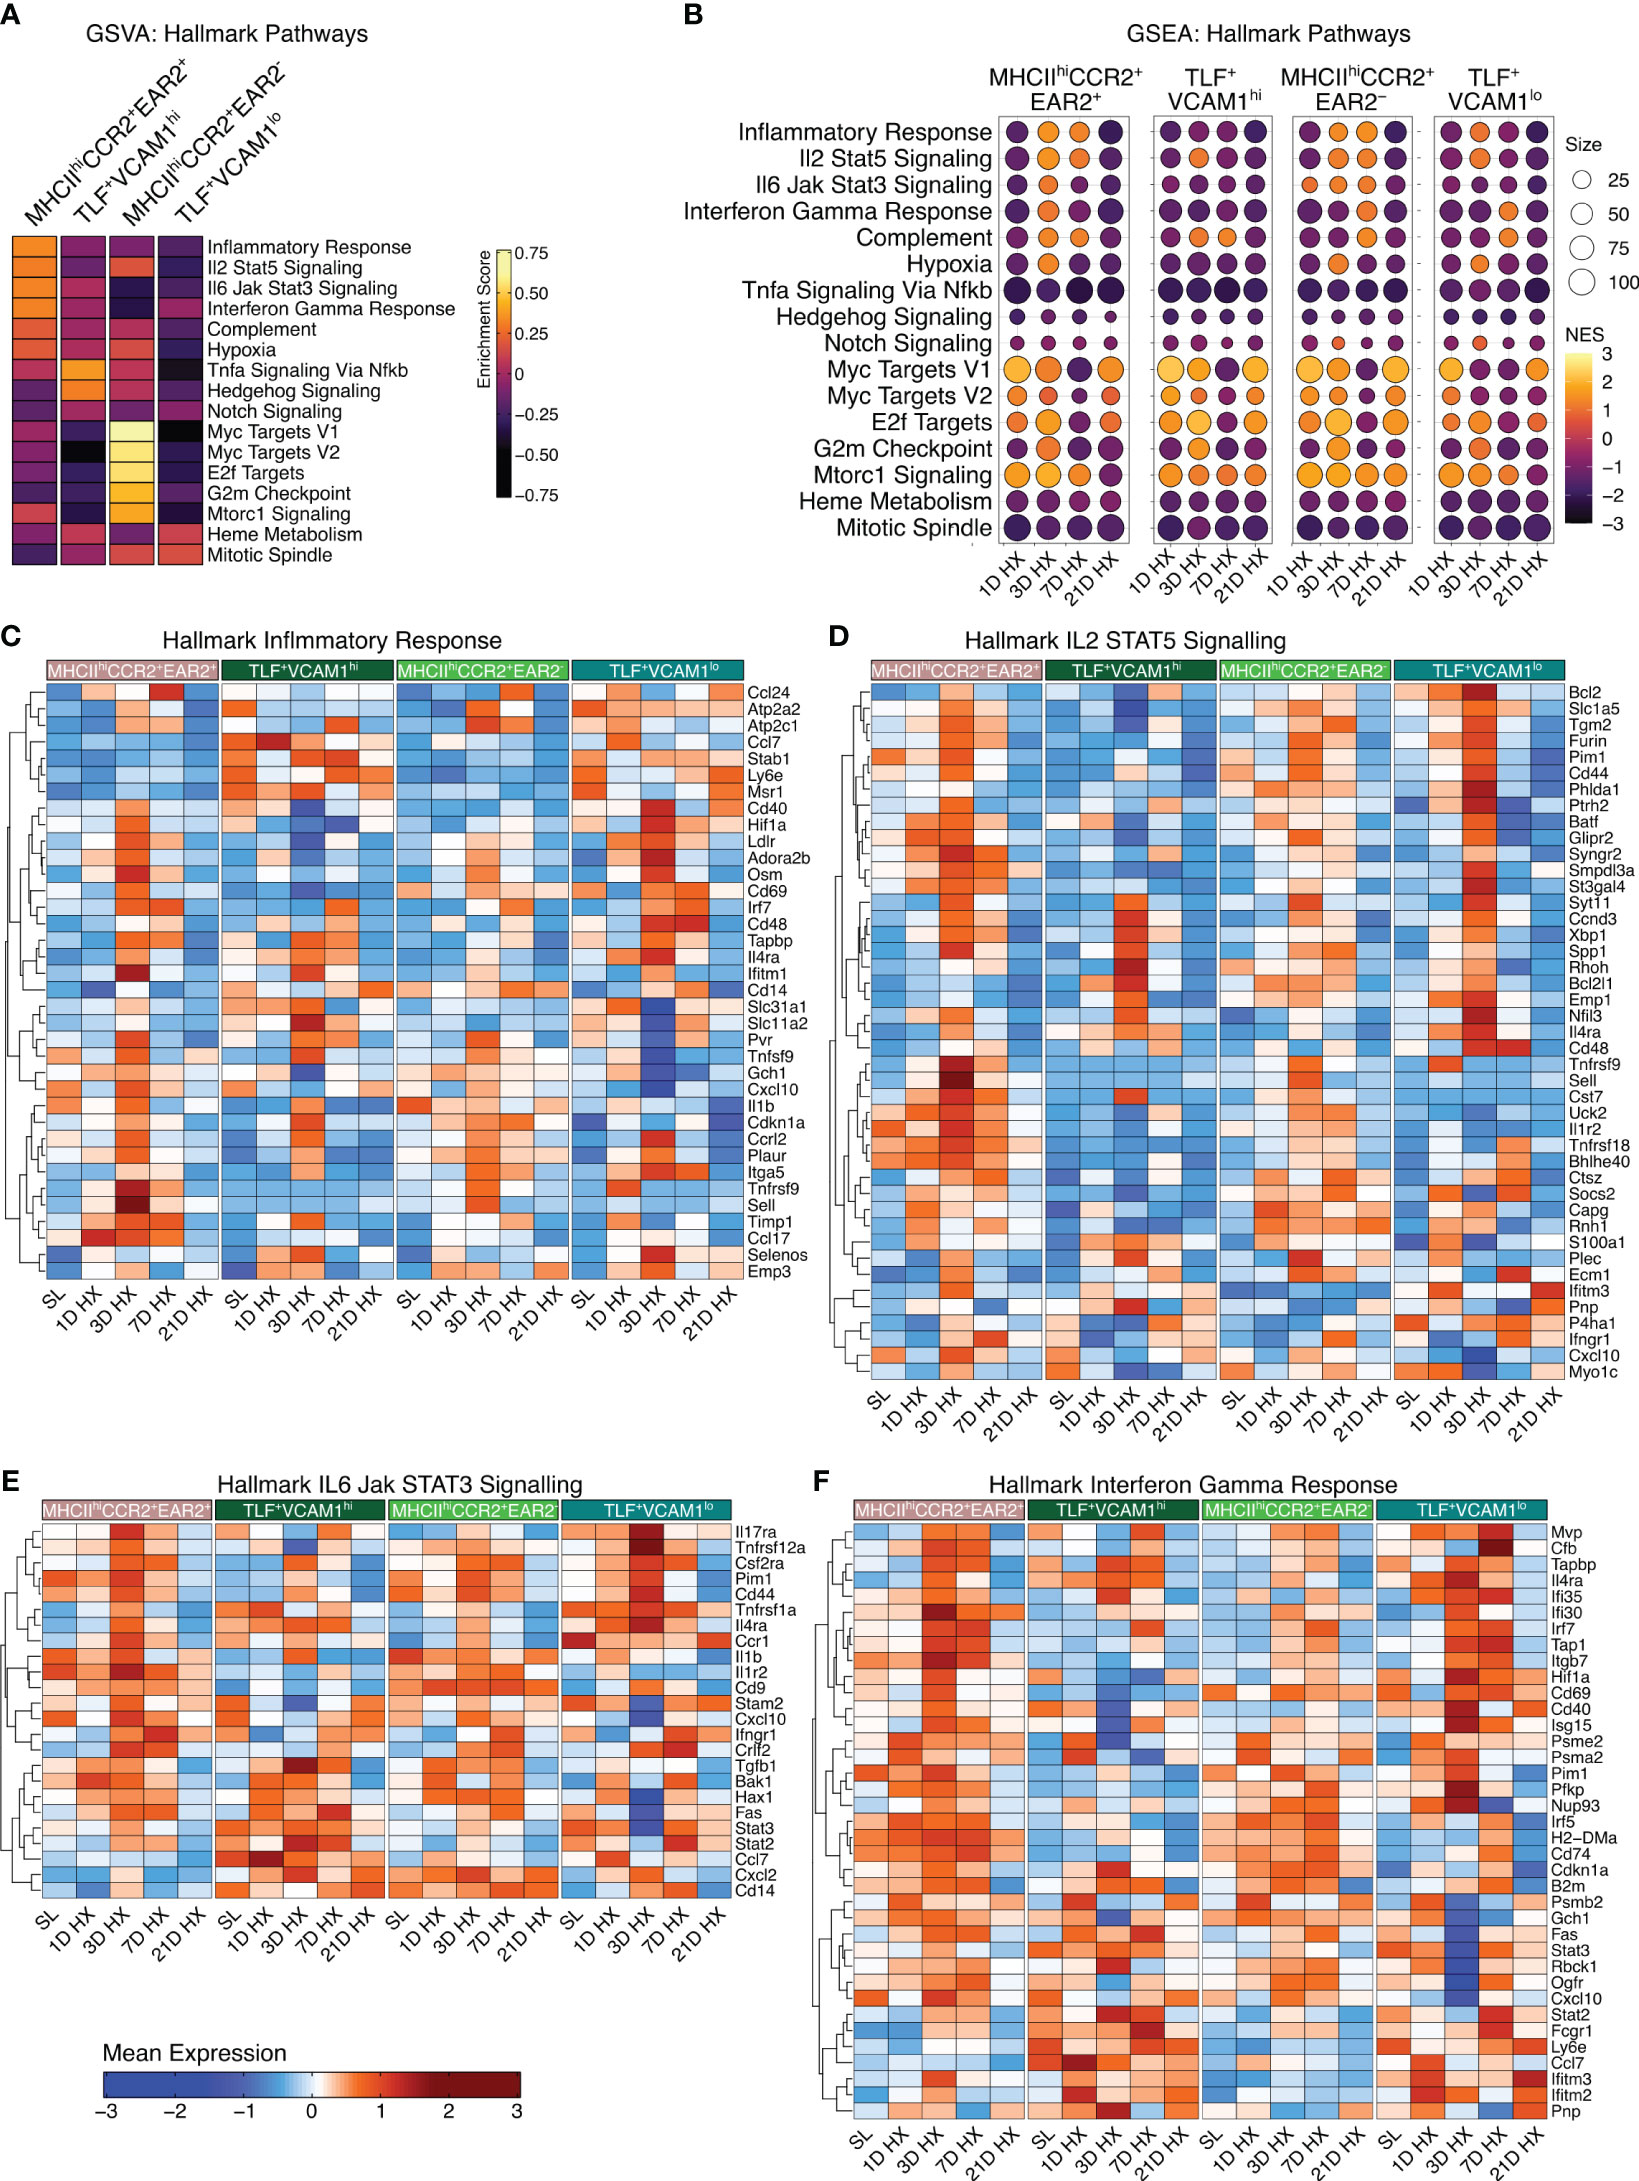
Figure 3 Enrichment of hallmark inflammatory response-associated pathways. (A) Gene Set Variation Analysis (GSVA) demonstrates cluster-specific hallmark pathway activation. (B) The dot plots visually depict Gene Set Enrichment Analysis (GSEA), demonstrating pathway enrichment at each time point compared to sea level. Dot size corresponds to the number of genes matched with Hallmark pathways. The dot color indicates the normalized enrichment score (NES). (C–F) Heatmaps depict gene expression profiles for significantly enriched inflammation-associated pathways, including Hallmark Inflammatory Response, Hallmark IL2 STAT5 Signaling, Hallmark IL6 Jak STAT3 Signaling, and Hallmark Interferon Gamma Response.
MHCIIhiCCR2+EAR2+ exhibited the highest enrichment in cellular proportion and upregulation of pathways associated with inflammatory responses to acute hypoxia exposure (Day 1-3), but these inflammatory responses began to wean by day 7. By day 21, inflammatory signals and gene expressions largely resemble that of sea level (Figure 3B). While the inflammatory signals were most pronounced in the MHCIIhiCCR2+EAR2+, MHCIIhiCCR2+EAR2- and TLF+VCAM1lo populations similarly upregulate Type 1 inflammatory associated pathways between day 1 and 3 (i.e., Inflammatory response, IL2 STAT5 signaling, IL6 Jak Stat3 signaling, Interferon Gamma responses, Complement, and Hypoxia) (Figure 3B). These pathways associated with acute hypoxia and inflammation were down-regulated (day 7) and returned to sea level by day 21 (Figures 3B–F). These findings are consistent with IM populations mounting acute Type 1 inflammatory response to acute hypoxic stress followed by resolution of acute inflammation despite continued hypoxic exposure.
Contrasting the acute inflammatory and hypoxia responses observed in MHCIIhiCCR2+EAR2+, MHCIIhiCCR2+EAR2-, and TLF+VCAM1lo populations, the TLF+VCAM1hi population exhibited more limited acute type 1 inflammatory and hypoxia reactions to acute hypoxia exposure (Figures 3B-F, 4A, B). As described above, TLF+VCAM1hi IMs were enriched for pathways associated with regulating vascular development and remodeling, suggesting that they have a significant role in regulating the vascular microenvironment (Figure 3A). At sea level, TLF+VCAM1hi IMs express high levels of Ccl2, Ccl7, Ccl8, Ccl12, Cxcl1 which are ligands for CCR1, CCR2, CCR5, and CXCL2 chemokine receptors that can regulate vast arrays of parenchymal and immune cell trafficking, migration, and functions central to immunosurveillance and vascular health (Figure 4A). They also express high levels of CD163, a receptor central to macrophage-mediate clearance of hemoglobin/haptoglobin complexes that would otherwise cause vasoconstriction and vascular injury (Figure 4A) (31). Together with high levels of Cd206/Mrc1, Il10, and Il33 expression, the TLF+VCAM1hi transcriptomic profile is consistent with their central immunomodulatory role in balancing vascular inflammation vs. repair to maintain homeostasis (Figure 4A) (32). However, by day 21 of prolonged hypoxia exposure, Ccl2, Ccl7, Ccl8, Ccl12, and Cxcl1 chemokine expressions in TLF+VCAM1hi IMs were down-regulated (Figure 4C). Similarly, compared to sea level, Cd163, Cd206/Mrc1, Il33, and Il10 expressions also decreased at day 21 (Figure 4C). To examine whether VCAM1-expressing macrophages are detected around pulmonary arterioles, we performed immunofluorescent staining of lung tissues derived from sea level and 21 days of hypoxia exposure (Figure 5). We observed increased accumulation of macrophages (CD64+) expressing VCAM1 accumulated around remodeled pulmonary arterioles, further suggesting a role for TLF+VCAM1hi macrophages in regulating pulmonary vascular remodeling (Figure 5). Together, these findings are consistent with the emergence of a dysregulated TLF+VCAM1hi population coordinating the development of pulmonary vascular remodeling.
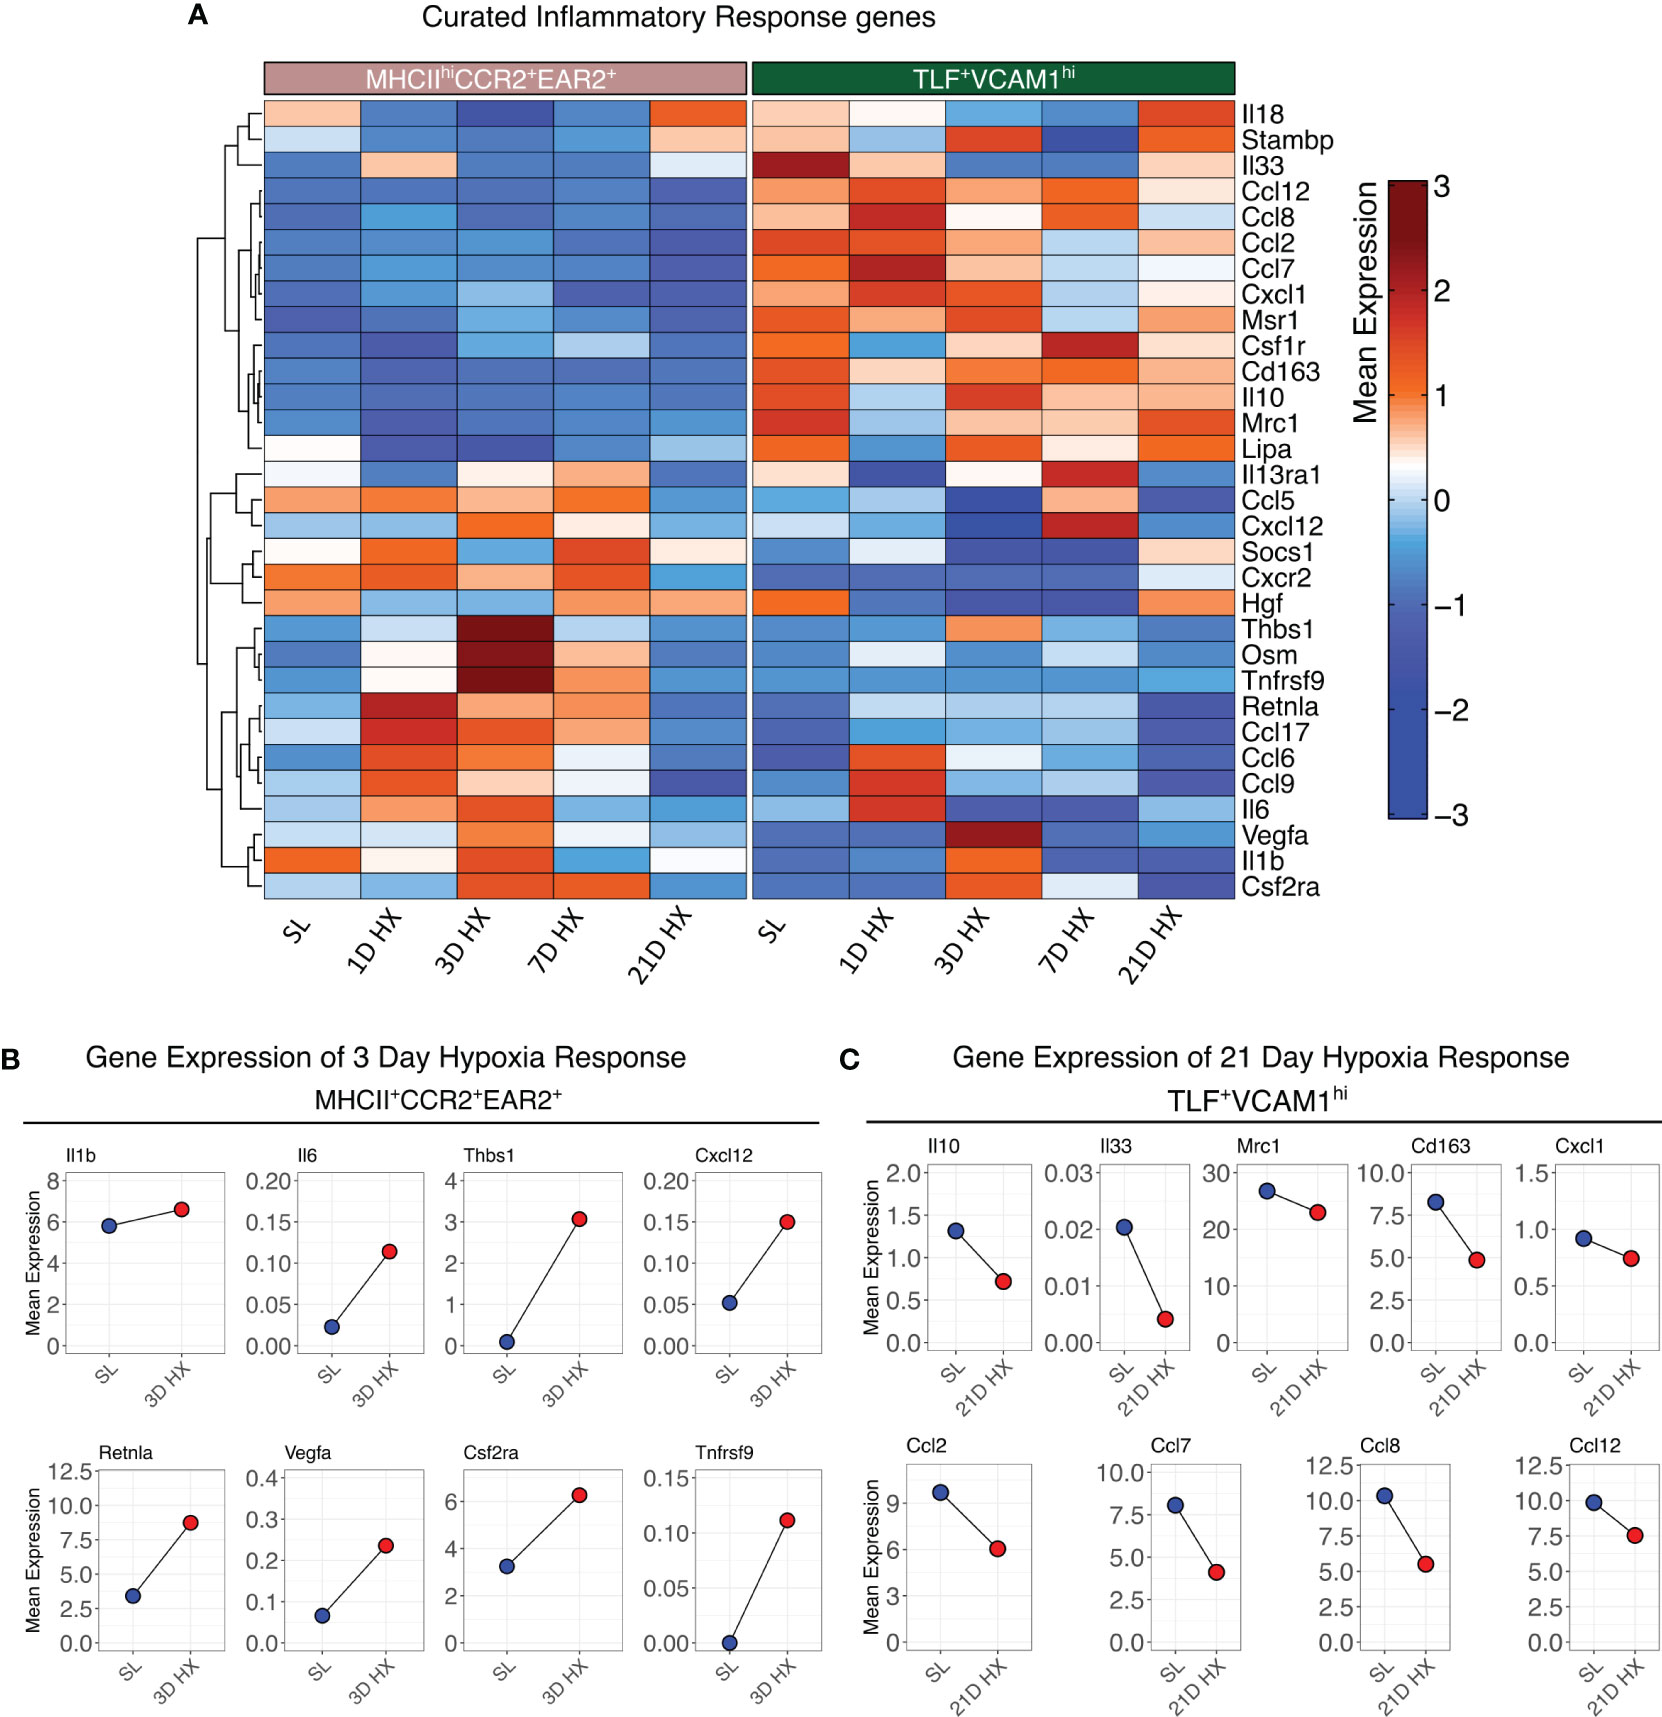
Figure 4 Distinct functional profiles between MHCIIhiCCR2+EAR2+ and TLF+VCAM1hi populations. (A) Heatmaps depicting the gene expression profiles of curated inflammatory response genes. (B) Dot plots illustrate the absolute mean expression of key genes in the SL and 3D hypoxia of the MHCIIhiCCR2+EAR2+ subpopulation. (C) Dot plot illustrating the absolute mean expression of key genes in the SL and 21D hypoxia of TLF+VCAM1hi subpopulation.
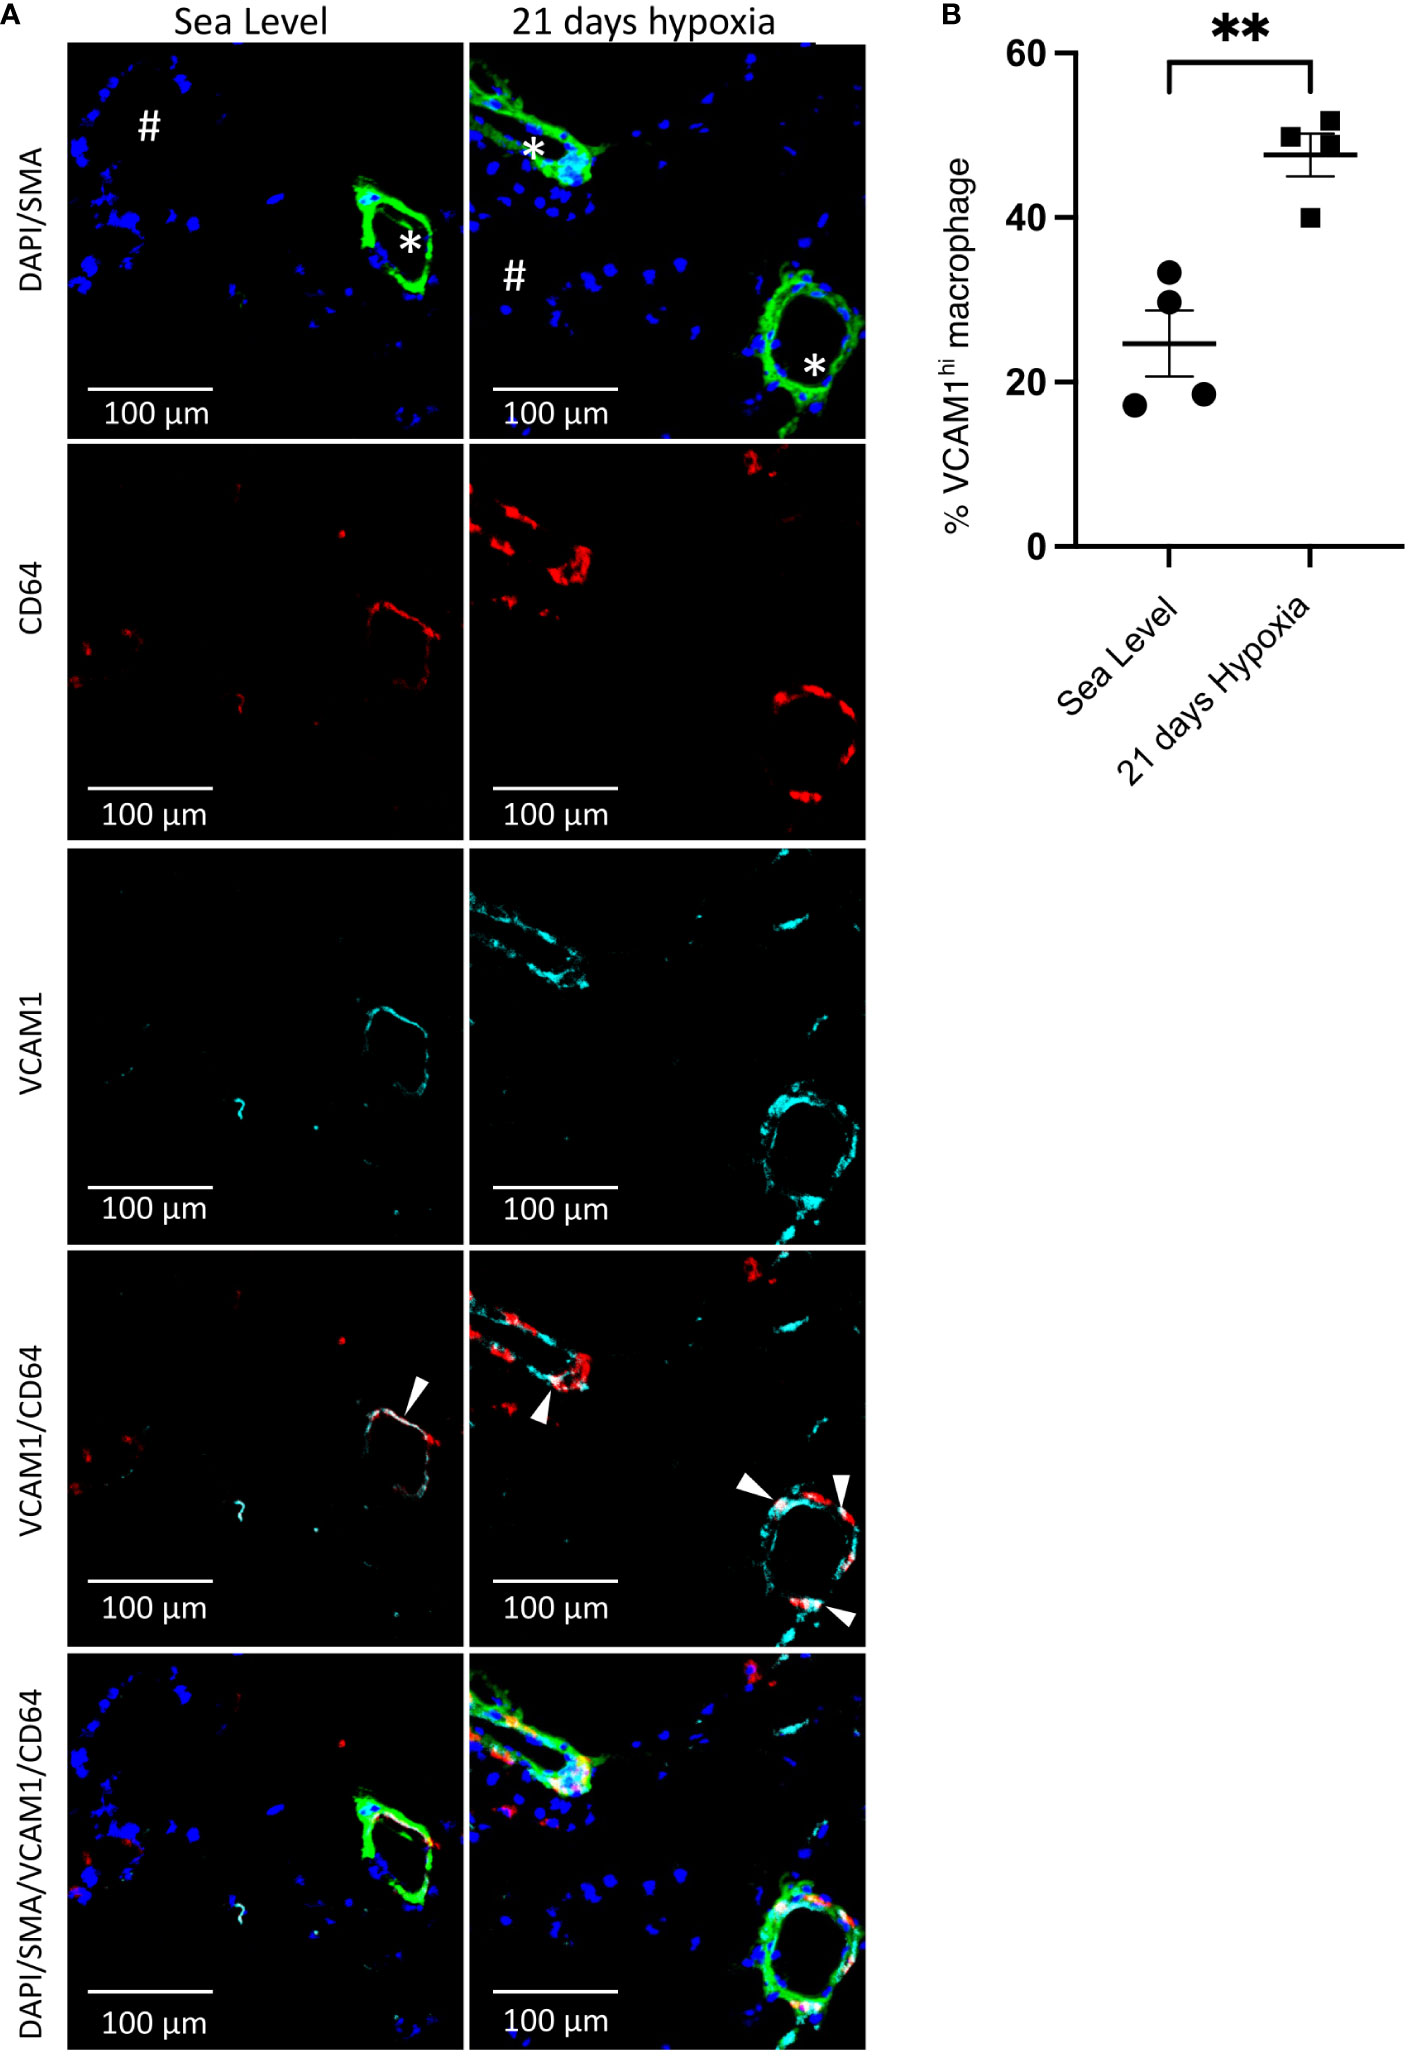
Figure 5 Accumulation of perivascular VCAM1-expressing macrophages after 21 days of hypoxia exposure. (A) Representative immunofluorescence illustration of mouse lung tissue. First row: The merged immunostaining image of DAPI (blue) and SMA (green) illustrates the artery. Second and third rows: Illustrating CD64 (red) and VCAM1 (cyan), emphasizing the presence of perivascular CD64+VCAM1-expressing macrophages in the lungs of wild-type mice at sea level and following 21 days of hypoxia exposure. Fourth row: The merged image for CD64 (red) and VCAM1 (cyan) demonstrates overlapping regions, as indicated by the white arrowheads, confirming the presence of VCAM1-expressing macrophages in the artery. Fifth row: Demonstrates the merge of all images together. (B) Quantitative assessment of VCAM1-expressing macrophages within the perivascular region of the artery. Unpaired t test with Welch’s correction was used for comparison between Sea Level and 21 days hypoxia. Scale bars indicate 100 μm. # = airway; * = pulmonary artery; SMA, Smooth Muscle Actin; **p-value < 0.01. Images are representative of n=4/group of animals analyzed.
We have previously described complement deposition and activation as associated with the development of hypoxia-induced PH (33). Specifically, activation of the complement alternative pathway is a key mechanism initiating pro-inflammatory processes in the early stage of experimental hypoxic PH (33). Consistent with this observation, the MHCIIhiCCR2+EAR2+ population arising during days 1-3 of acute hypoxia exposure exhibited the strongest acute pro-inflammatory signals, also upregulated Cfb expression, a key activator of the alternative complement pathway (Figures 6A, B, Supplementary Figure S6). These findings suggest MHCIIhiCCR2+EAR2+ IMs are a cell population that can regulate complement alternative pathway activation and augment pro-inflammatory processes in the early stage of hypoxia-induced PH.
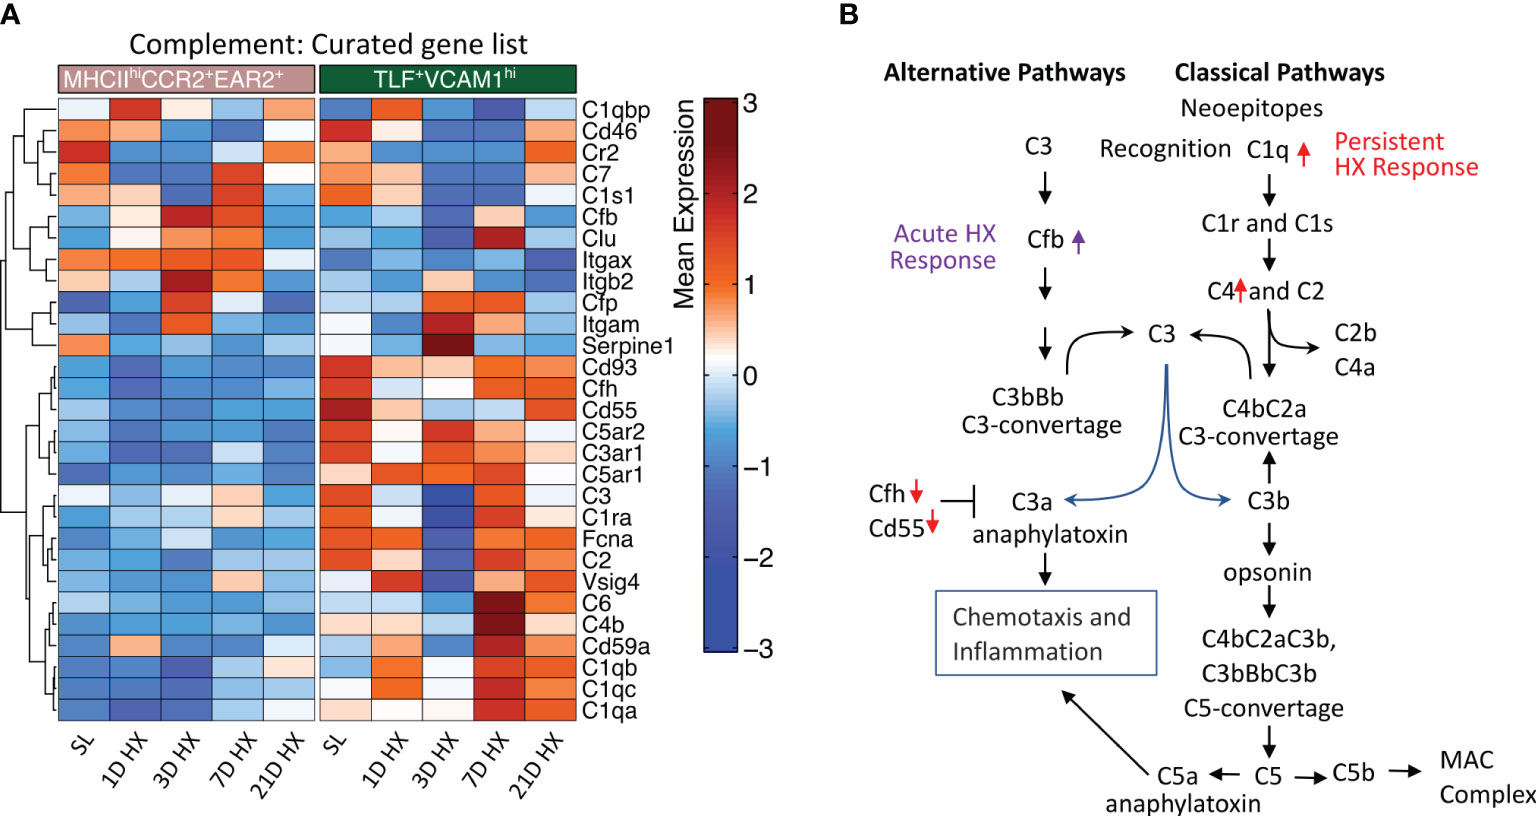
Figure 6 Distinct activation of complement pathways between MHCIIhiCCR2+EAR2+ and TLF+VCAM1hi populations. (A) Heatmaps show differentially expressed genes associated with complement pathways in the MHCIIhiCCR2+EAR2+ and TLF+VCAM1hi populations. (B) Schema showing genes associated with key regulators of complement pathways in MHCIIhiCCR2+EAR2+ and TLF+VCAM1hi population in response to acute and prolonged hypoxia exposure.
Contrasting MHCIIhiCCR2+EAR2+ cells, expression of genes associated with classical complement pathway activation (i.e., C1qa, C1qb, C1qc, and C4) were upregulated and inhibitors (i.e., Cfh and Cd55) were down-regulated in dysregulated TLF+VCAM1hi population at Day 7 and 21 linking classical complement pathway activations to vascular remodeling cell profile and prolonged hypoxic microenvironment (Figures 6A, B).
Hypoxia is one of the key driving factors in pulmonary vascular disease leading to pulmonary hypertension through its’ immunomodulatory effects on immune cells, including pulmonary macrophages. We and others have demonstrated a central role of pulmonary IMs in the development and progression of PH (8, 17, 20). However, how hypoxia shapes pulmonary IM transcriptional and functional profiles leading to PH development has not been extensively examined. Using a murine model of hypoxia-induced PH and single-cell transcriptomic analyses, we defined the pulmonary IM transcriptional and functional profiles over a period of 21 days of hypoxia exposure. We observed type 1 acute inflammatory activation in most subpopulations of IMs (i.e., MHCIIhiCCR2+EAR2+, MCHII+CCR2+EAR2-, TLF+VCAM1lo) that peaked around Day 3 and resolved almost entirely by Day 7 of acute hypoxia exposure. Large numbers of MHCIIhiCCR2+EAR2+ cells, demonstrating the highest pro-inflammatory potential and activation of the alternative complement pathways, accumulate between Days 1 and 3. Thus, their presence and type 1 pro-inflammatory profiles characterize the IM response to acute hypoxia exposure. With prolonged hypoxia exposure, we observed the emergence of a novel IM population (TLF+VCAM1hi) that upregulated Vcam1 expression and enriched in vascular development and remodeling pathways (Figure 3A). By day 21 of hypoxia exposure, this population exhibited reduced expression of genes in maintaining pulmonary vascular microenvironment (e.g., chemokines, Cd163, Mrc1/Cd206, Il33, and Il10) but showed activation of the classical complement pathways that can contribute to vascular dysfunction and vascular remodeling (34). Consistent with a pro-vascular remodeling functional profile, VCAM1-expressing macrophages were detected around the remodeled pulmonary arterioles after 21 days of exposure (Figure 5). These findings demonstrated a dynamic change in pulmonary IM transcriptional and functional profiles in hypoxia-induced PH and identified a novel population of dysregulated pro-vascular remodeling macrophages that may drive PH disease progression.
Accumulation of IMs in response to hypoxia in animal models and human PH lungs was described previously (8, 17, 20, 27). Most accumulated IMs are thought to arise from circulating monocytes (8, 20). Consistent with these observations, we did not detect a population of IMs enriched for proliferation pathways, suggesting the recruitment of circulating monocytes as the primary source of IM expansion in response to hypoxia. Both classical (CCR2+Ly6Chi) and non-classical (CX3CR1hiLy6Clo) monocytes have been examined in the murine model of hypoxia-induced PH. Classical monocytes are reported to contribute to PH via the production of thrombospondin-1; on the other hand, specific deletion of hypoxia-inducible factor-1 in non-classical monocytes ameliorates the severity of PH (20, 21). However, how each monocyte population regulates pulmonary vascular inflammation and remodeling was unknown. Our findings suggest that these cell types may constitute different waves of cellular infiltration and have distinct roles in regulating pulmonary vascular diseases. In response to acute hypoxia exposure, the proportion of MHCIIhiCCR2+EAR2+ increases significantly. This population expresses the highest level of Ccr2 among the IMs and upregulates Retnla and Ear2, which have been described to be markers for recently recruited and differentiating monocytes (35), suggesting recruitment of CCR2+Ly6Chi classical monocytes that promote acute type I inflammation in response to acute hypoxia. On the other hand, non-classical monocyte-derived macrophages have been shown to regulate vascular remodeling via chemokine secretion, classical complement activation, and TNF pathways (20). Non-classical monocytes and derived macrophages are increased in patients with altitude-induced PH and end-stage human pulmonary arterial hypertension (PAH) lung tissues (8, 36). These characteristics are consistent with TLF+VCAM1hi populations that emerge with prolonged hypoxia exposure. While lineage tracing studies, using adoptive transfer, bone marrow chimera, or parabiotic system of CCR2/RFP (red fluorescent protein) and Cx3cr1creER/RosaGFP (green fluorescent protein) reporters with wild-type animals, are needed to establish classical and non-classical monocytes as precursors to MHCIIhiCCR2+EAR2+ and TLF+VCAM1hi directly, our findings suggest that non-classical monocytes are precursors to the TLF+VCAM1hi pro-remodeling IMs. Thus, distinct waves of monocytes are recruited during acute and prolonged hypoxia exposure and have unique roles in regulating acute inflammation vs. pulmonary vascular remodeling in PH.
The early acute inflammatory response has been described in various models of PH, including our recent work in Schistosoma (20). While hypoxia induces a Type 1 inflammatory phenotype in IMs, Schistosoma induces a Type 2 inflammatory phenotype. These findings suggest divergent early IM inflammatory response types can initiate PH development. However, the acute inflammatory phase in IM largely resolves shortly after initial insults. In this study, we describe the emergence of a novel dysregulated pro-vascular modeling macrophage population with prolonged hypoxia exposure that may mediate PH disease progression after the resolution of acute inflammation in IM.
Pro-vascular remodeling macrophages have been proposed previously, but their identity and functional profiles were unknown (37). In this study, we defined a population of pro-vascular remodeling IMs by transcriptional signature and demonstrated VCAM1-expressing macrophages accumulated around the remodeled pulmonary arterioles. VCAM1 is a well-established marker for endothelial cells. However, VCAM1 expression can be upregulated in macrophages and many other cell types in inflammatory states, such as rheumatoid arthritis, cancer, transplant rejection, asthma, and atherosclerosis (38–43). Thus, future studies to isolate the TLF+VCAM1hi population and define its functions will be essential to understanding how IM contributes to PH progression. Additionally, examining whether divergent early inflammatory responses lead to the emergence of a common dysregulated pro-vascular remodeling cell type will be essential in defining potential IM-targeted approaches to reverse abnormal vascular remodeling in PH. For example, the two distinct IM populations (MHCIIhiCCR2+EAR2+ vs. TLF+VCAM1hi) exhibited differential activation of alternative vs. classical complement pathways (Figure 6, Supplementary Figure S6). As activation of the alternative pathway has been described in the early inflammatory phase of PH pathogenesis, it raises the possibility that MHCIIhiCCR2+EAR2+ is a cell population that regulates the inflammatory response via its role in regulating alternative complement pathway activation (33). On the other hand, the TLF+VCAM1hi population activates classical complement pathways and contributes to abnormal vascular remodeling. Thus, our studies suggest that distinct components of the complement system have different roles in regulating early inflammatory response and pulmonary vascular remodeling, which can be potentially targeted to modulate different phases of PH pathogenesis.
In conclusion, our study revealed dynamic shifts in IM repertoire and functional profiles in response to acute and prolonged hypoxia exposure. We identified two populations of IMs corresponding to the acute inflammatory and pro-vascular remodeling phases of the PH pathogenesis, exhibiting distinct enrichment in the inflammatory response and complement activation pathways that can be potentially targeted to modulate disease development and progression. We acknowledge limitations in this study, including those findings in the murine model system will need to be validated in human samples, the dataset is limited to IMs and does not allow analyses of how IMs may be interacting with other cells in the microenvironment, direct lineage tracing examination needed to establish distinct monocyte populations as precursors and additional animal numbers will be required to truly define pulmonary IM difference between sexes. Our findings suggest that classical and non-classical monocytes are recruited and regulate different stages of pathogenesis: early acute inflammatory responses vs. pulmonary vascular remodeling. We also defined a population of pro-vascular remodeling macrophages with upregulated classical complement pathways that can potentially be targeted to reverse the abnormal vascular remodeling in PH.
The datasets presented in this study can be found in online repositories. The names of the repository/repositories and accession number(s) can be found below: GSE254606 (GEO).
The animal study was approved by University of Colorado, Anschutz Medical Campus IACUC. The study was conducted in accordance with the local legislation and institutional requirements.
SK: Writing – review & editing, Writing – original draft, Visualization, Validation, Software, Methodology, Investigation, Formal analysis, Data curation, Conceptualization, Project administration. CM: Writing – review & editing, Methodology, Formal analysis, Data curation, Conceptualization. RK: Writing – review & editing. RP: Writing – review & editing. NC: Writing – review & editing. HZ: Writing – review & editing. ML: Writing – review & editing. BM: Writing – review & editing, Data curation. TA: Writing – review & editing, Methodology, Data curation. BG: Writing – review & editing. Y-RY: Writing – review & editing, Writing – original draft, Visualization, Validation, Supervision, Software, Resources, Project administration, Methodology, Investigation, Funding acquisition, Formal analysis, Data curation, Conceptualization. KS: Writing – review & editing, Writing – original draft, Visualization, Validation, Supervision, Software, Resources, Project administration, Methodology, Investigation, Funding acquisition, Formal analysis, Data curation, Conceptualization.
The author(s) declare that financial support was received for the research, authorship, and/or publication of this article. The authors appreciate funding support provided by the National Institutes of Health P01HL152961 (to KS and BG), K08-HL121185 (to Y-RY), R03-HL158640 (to Y-RY), and institutional support by the University of Colorado, Division of Pulmonary and Critical Care Sciences (to CM, TA, and Y-RY). Additionally, the authors acknowledge funding support from the U.S. Department of Defense, with grant numbers W81XWH1910259 and W81XWH2010249 (to KS). Furthermore, the authors acknowledge funding support from American Heart Association Grant 19CDA34730030 (to RK), ATS Foundation/Pulmonary Hypertension Association Research Fellowship (to RK), and United Therapeutics Jenesis Innovative Research Award (to RK); NIH grants R01HL135872 (to BG).
The authors thank the University of Colorado Cardiopulmonary Laboratory (CVP) for supporting hyperbaric exposure. We appreciate the support of the University of Colorado Genomic Sequencing Core for generating single-cell sequencing data. The authors would like to thank Andy Poczobutt for his contributions to server and data management.
The authors declare that the research was conducted in the absence of any commercial or financial relationships that could be construed as a potential conflict of interest.
All claims expressed in this article are solely those of the authors and do not necessarily represent those of their affiliated organizations, or those of the publisher, the editors and the reviewers. Any product that may be evaluated in this article, or claim that may be made by its manufacturer, is not guaranteed or endorsed by the publisher.
The Supplementary Material for this article can be found online at: https://www.frontiersin.org/articles/10.3389/fimmu.2024.1372959/full#supplementary-material
1. Rubin LJ. Primary pulmonary hypertension. N Engl J Med. (1997) 336:111–7. doi: 10.1056/NEJM199701093360207
2. Humbert M, Kovacs G, Hoeper MM, Badagliacca R, Berger RMF, Brida M, et al. 2022 ESC/ERS Guidelines for the diagnosis and treatment of pulmonary hypertension. Eur Heart J. (2022) 43:3618–731. doi: 10.1183/13993003.00879-2022
3. Simonneau G, Montani D, Celermajer DS, Denton CP, Gatzoulis MA, Krowka M, et al. Haemodynamic definitions and updated clinical classification of pulmonary hypertension. Eur Respir J. (2019) 53. doi: 10.1183/13993003.01913-2018
4. Reed SE, Craig JW, Tyrrell DAJ. Four compounds active against rhinovirus: comparison in vitro and in volunteers. J Infect Dis. (1976) 133 Suppl:A128–35. doi: 10.1093/infdis/133.Supplement_2.A128
5. Rabinovitch M, Guignabert C, Humbert M, Nicolls MR. Inflammation and immunity in the pathogenesis of pulmonary arterial hypertension. Circ Res. (2014) 115:165–75. doi: 10.1161/CIRCRESAHA.113.301141
6. Huertas A, Tu L, Humbert M, Guignabert C. Chronic inflammation within the vascular wall in pulmonary arterial hypertension: more than a spectator. Cardiovasc Res. (2020) 116:885–93. doi: 10.1093/cvr/cvz308
7. Fonn S, De Beer M, Kgamphe S, McIntyre J, Cameron N, Padayachee GN, et al. “Birth to ten” - Pilot studies to test the feasibility of a birth cohort study investigating the effects of urbanisation in South Africa. South Afr Med J. (1991) 79:449–54.
8. Florentin J, Coppin E, Vasamsetti SB, Zhao J, Tai YY, Tang Y, et al. Inflammatory macrophage expansion in pulmonary hypertension depends upon mobilization of blood-borne monocytes. J Immunol. (2018) 200:3612–25. doi: 10.4049/jimmunol.1701287
9. Hou S, Li X, Feng XZ. Method to improve DNA condensation efficiency by alkali treatment. Nucleosides Nucleotides Nucleic Acids. (2009) 28:725–35. doi: 10.1080/15257770903155493
10. Fletcher AE. Adverse treatment effects in the trial of the European Working Party on High Blood Pressure in the Elderly. Am J Med. (1991) 90:42S–44S. doi: 10.1016/0002-9343(91)90435-Z
11. Ye Y, Xu Q, Wuren T. Inflammation and immunity in the pathogenesis of hypoxic pulmonary hypertension. Front Immunol. (2023) 14. doi: 10.3389/fimmu.2023.1162556
12. Frid MG, Brunetti JA, Burke DL, Carpenter TC, Davie NJ, Reeves JT, et al. Hypoxia-induced pulmonary vascular remodeling requires recruitment of circulating mesenchymal precursors of a monocyte/macrophage lineage. Am J Pathol. (2006) 168:659–69. doi: 10.2353/ajpath.2006.050599
13. Chakarov S, Lim HY, Tan L, Lim SY, See P, Lum J, et al. Two distinct interstitial macrophage populations coexist across tissues in specific subtissular niches. Science. (2019) 363. doi: 10.1126/science.aau0964
14. Moore PK, Anderson KC, McManus SA, Tu TH, King EM, Mould KJ, et al. Single-cell RNA sequencing reveals unique monocyte-derived interstitial macrophage subsets during lipopolysaccharide-induced acute lung inflammation. Am J Physiol Lung Cell Mol Physiol. (2023) 324:L536–49. doi: 10.1152/ajplung.00223.2022
15. Dick SA, Wong A, Hamidzada H, Nejat S, Nechanitzky R, Vohra S, et al. Three tissue resident macrophage subsets coexist across organs with conserved origins and life cycles. Sci Immunol. (2022) 7. doi: 10.1126/sciimmunol.abf7777
16. Florentin J, Dutta P. Origin and production of inflammatory perivascular macrophages in pulmonary hypertension. Cytokine. (2017) 100:11–5. doi: 10.1016/j.cyto.2017.08.015
17. Pugliese SC, Kumar S, Janssen WJ, Graham BB, Frid MG, Riddle SR, et al. A time- and compartment-specific activation of lung macrophages in hypoxic pulmonary hypertension. J Immunol. (2017) 198:4802–12. doi: 10.4049/jimmunol.1601692
18. Burke DL, Frid MG, Kunrath CL, Karoor V, Anwar A, Wagner BD, et al. Sustained hypoxia promotes the development of a pulmonary artery-specific chronic inflammatory microenvironment. Am J Physiol Lung Cell Mol Physiol. (2009) 297:238–40. doi: 10.1152/ajplung.90591.2008
19. Vergadi E, Chang MS, Lee C, Liang OD, Liu X, Fernandez-Gonzalez A, et al. Early macrophage recruitment and alternative activation are critical for the later development of hypoxia-induced pulmonary hypertension. Circulation. (2011) 123:1986–95. doi: 10.1161/CIRCULATIONAHA.110.978627
20. Yu YRA, Malakhau Y, Yu CHA, Phelan SLJ, Cumming RI, Kan MJ, et al. Non-classical monocytes sense hypoxia, regulate pulmonary vascular remodeling, and promote pulmonary hypertension. J Immunol. (2020) 204:1474–85. doi: 10.4049/jimmunol.1900239
21. Kumar R, Mickael C, Kassa B, Sanders L, Hernandez-Saavedra D, Koyanagi DE, et al. Interstitial macrophage-derived thrombospondin-1 contributes to hypoxia-induced pulmonary hypertension. Cardiovasc Res. (2020) 116:2021–30. doi: 10.1093/cvr/cvz304
22. Campbell NV, Mickael C, Kumar S, Zhang H, Campbell IL, Gillen AE, et al. Single-cell RNA sequencing and binary hierarchical clustering define lung interstitial macrophage heterogeneity in response to hypoxia. Am J Physiol Lung Cell Mol Physiol. (2022) 323:L58–68. doi: 10.1152/ajplung.00104.2022
23. Hao Y, Hao S, Andersen-Nissen E, Mauck WM, Zheng S, Butler A, et al. Integrated analysis of multimodal single-cell data. Cell. (2021) 184:3573–3587.e29. doi: 10.1016/j.cell.2021.04.048
24. McGinnis CS, Murrow LM, Gartner ZJ. DoubletFinder: doublet detection in single-cell RNA sequencing data using artificial nearest neighbors. Cell Syst. (2019) 8:329–37. doi: 10.1016/j.cels.2019.03.003
25. Hänzelmann S, Castelo R, Guinney J. GSVA: gene set variation analysis for microarray and RNA-seq data. BMC Bioinf. (2013) 14. doi: 10.1186/1471-2105-14-7
26. Korotkevich G, Sukhov V, Budin N, Shpak B, Artyomov MN, Sergushichev A. Fast gene set enrichment analysis. bioRxiv. (2021), 060012. doi: 10.1101/060012v3
27. Yu YRA, Mao L, Piantadosi CA, Gunn MD. CCR2 deficiency, dysregulation of Notch signaling, and spontaneous pulmonary arterial hypertension. Am J Respir Cell Mol Biol. (2013) 48:647–54. doi: 10.1165/rcmb.2012-0182OC
28. Morris HE, Neves KB, Montezano AC, MacLean MR, Touyz RM. Notch3 signalling and vascular remodelling in pulmonary arterial hypertension. Clin Sci (Lond). (2019) 133:2481–98. doi: 10.1042/CS20190835
29. Chapouly C, Guimbal S, Hollier PL, Renault MA. Role of hedgehog signaling in vasculature development, differentiation, and maintenance. Int J Mol Sci. (2019) 20. doi: 10.3390/ijms20123076
30. Shi H, Zhao Y, Li S, Wu H, Ma D, Wan C. TNF-α and IL-8 levels are positively correlated with hypobaric hypoxic pulmonary hypertension and pulmonary vascular remodeling in rats. Open Life Sci. (2023) 18. doi: 10.1515/biol-2022-0650
31. Etzerodt A, Moestrup SK. CD163 and inflammation: biological, diagnostic, and therapeutic aspects. Antioxid Redox Signal. (2013) 18:2352–63. doi: 10.1089/ars.2012.4834
32. Graney PL, Ben-Shaul S, Landau S, Bajpai A, Singh B, Eager J, et al. Macrophages of diverse phenotypes drive vascularization of engineered tissues. Sci Adv. (2020) 6. doi: 10.1126/sciadv.aay6391
33. Frid MG, Alexandre McKeon B, Thurman JM, Maron BA, Li M, Zhang H, et al. Immunoglobulin-driven complement activation regulates pro-inflammatory remodeling in pulmonary hypertension. Am J Respir Crit Care Med. (2020) 201:224–39. doi: 10.1164/rccm.201903-0591OC
34. Wenzel UO, Kemper C, Bode M. The role of complement in arterial hypertension and hypertensive end organ damage. Br J Pharmacol. (2021) 178:2849–62. doi: 10.1111/bph.15171
35. Sanin DE, Ge Y, Marinkovic E, Kabat AM, Castoldi A, Caputa G, et al. A common framework of monocyte-derived macrophage activation. Sci Immunol. (2022) 7. doi: 10.1126/sciimmunol.abl7482
36. Wu XH, He YY, Chen ZR, He ZY, Yan Y, He Y, et al. Single-cell analysis of peripheral blood from high-altitude pulmonary hypertension patients identifies a distinct monocyte phenotype. Nat Commun. (2023) 14. doi: 10.1038/s41467-023-37527-4
37. Liu H, Wang Y, Zhang Q, Liu C, Ma Y, Huang P, et al. Macrophage-derived inflammation promotes pulmonary vascular remodeling in hypoxia-induced pulmonary arterial hypertension mice. Immunol Lett. (2023) 263:113–22. doi: 10.1016/j.imlet.2023.10.005
38. Wang X, Feuerstein GZ, Gu JL, Lysko PG, Yue TL. Interleukin-1 beta induces expression of adhesion molecules in human vascular smooth muscle cells and enhances adhesion of leukocytes to smooth muscle cells. Atherosclerosis. (1995) 115:89–98. doi: 10.1016/0021-9150(94)05503-B
39. Iwamiya T, Segard BD, Matsuoka Y, Imamura T. Human cardiac fibroblasts expressing VCAM1 improve heart function in postinfarct heart failure rat models by stimulating lymphangiogenesis. PloS One. (2020) 15. doi: 10.1371/journal.pone.0237810
40. Chen Q, Zhang XHF, Massagué J. Macrophage binding to receptor VCAM-1 transmits survival signals in breast cancer cells that invade the lungs. Cancer Cell. (2011) 20:538–49. doi: 10.1016/j.ccr.2011.08.025
41. Li D, Xue W, Li M, Dong M, Wang J, Wang X, et al. VCAM-1+ macrophages guide the homing of HSPCs to a vascular niche. Nature. (2018) 564:119–24. doi: 10.1038/s41586-018-0709-7
42. Bobryshev YV, Lord RSA, Rainer SP, Munro VF. VCAM-1 expression and network of VCAM-1 positive vascular dendritic cells in advanced atherosclerotic lesions of carotid arteries and aortas. Acta Histochem. (1996) 98:185–94. doi: 10.1016/S0065-1281(96)80037-7
Keywords: interstitial macrophages, vascular remodeling, pulmonary hypertension, hypoxia, complement, inflammation
Citation: Kumar S, Mickael C, Kumar R, Prasad RR, Campbell NV, Zhang H, Li M, McKeon BA, Allen TE, Graham BB, Yu Y-RA and Stenmark KR (2024) Single cell transcriptomic analyses reveal diverse and dynamic changes of distinct populations of lung interstitial macrophages in hypoxia-induced pulmonary hypertension. Front. Immunol. 15:1372959. doi: 10.3389/fimmu.2024.1372959
Received: 18 January 2024; Accepted: 01 April 2024;
Published: 15 April 2024.
Edited by:
Qi Jin, Fudan University, ChinaReviewed by:
Adil Bhat, University of California, Los Angeles, United StatesCopyright © 2024 Kumar, Mickael, Kumar, Prasad, Campbell, Zhang, Li, McKeon, Allen, Graham, Yu and Stenmark. This is an open-access article distributed under the terms of the Creative Commons Attribution License (CC BY). The use, distribution or reproduction in other forums is permitted, provided the original author(s) and the copyright owner(s) are credited and that the original publication in this journal is cited, in accordance with accepted academic practice. No use, distribution or reproduction is permitted which does not comply with these terms.
*Correspondence: Yen-Rei A. Yu, eWVuLXJlaS55dUBjdWFuc2NodXR6LmVkdQ==; Sushil Kumar, U3VzaGlsLkt1bWFyQGN1YW5zY2h1dHouZWR1
†These authors share senior authorship
Disclaimer: All claims expressed in this article are solely those of the authors and do not necessarily represent those of their affiliated organizations, or those of the publisher, the editors and the reviewers. Any product that may be evaluated in this article or claim that may be made by its manufacturer is not guaranteed or endorsed by the publisher.
Research integrity at Frontiers
Learn more about the work of our research integrity team to safeguard the quality of each article we publish.