 Wan Zhang
94% of researchers rate our articles as excellent or good
Learn more about the work of our research integrity team to safeguard the quality of each article we publish.
Find out more
ORIGINAL RESEARCH article
Front. Immunol. , 26 February 2024
Sec. Cancer Immunity and Immunotherapy
Volume 15 - 2024 | https://doi.org/10.3389/fimmu.2024.1356833
This article is part of the Research Topic Gliomas microenvironment: new drug entities, mechanisms of action, molecular biomarkers and drug delivery strategies View all 11 articles
Background: TGFB-induced factor homeobox 2 (TGIF2), a member of the Three-Amino-acid-Loop-Extension (TALE) superfamily, has been implicated in various malignant tumors. However, its prognostic significance in glioma, impact on tumor immune infiltration, and underlying mechanisms in glioma development remain elusive.
Methods: The expression of TGIF2 in various human normal tissues, normal brain tissues, and gliomas was investigated using HPA, TCGA, GTEx, and GEO databases. The study employed several approaches, including Kaplan-Meier analysis, ROC analysis, logistic regression, Cox regression, GO analysis, KEGG analysis, and GSEA, to explore the relationship between TGIF2 expression and clinicopathologic features, prognostic value, and potential biological functions in glioma patients. The impact of TGIF2 on tumor immune infiltration was assessed through Estimate, ssGSEA, and Spearman analysis. Genes coexpressed with TGIF2 were identified, and the protein-protein interaction (PPI) network of these coexpressed genes were constructed using the STRING database and Cytoscape software. Hub genes were identified using CytoHubba plugin, and their clinical predictive value was explored. Furthermore, in vitro experiments were performed by knocking down and knocking out TGIF2 using siRNA and CRISPR/Cas9 gene editing, and the role of TGIF2 in glioma cell invasion and migration was analyzed using transwell assay, scratch wound-healing assay, RT-qPCR, and Western blot.
Results: TGIF2 mRNA was found to be upregulated in 21 cancers, including glioma. High expression of TGIF2 was associated with malignant phenotypes and poor prognosis in glioma patients, indicating its potential as an independent prognostic factor. Furthermore, elevated TGIF2 expression positively correlated with cell cycle regulation, DNA synthesis and repair, extracellular matrix (ECM) components, immune response, and several signaling pathways that promote tumor progression. TGIF2 showed correlations with Th2 cells, macrophages, and various immunoregulatory genes. The hub genes coexpressed with TGIF2 demonstrated significant predictive value. Additionally, in vitro experiments revealed that knockdown and knockout of TGIF2 inhibited glioma cell invasion, migration and suppressed the epithelial-mesenchymal transition (EMT) phenotype.
Conclusion: TGIF2 emerges as a potential biomarker for glioma, possibly linked to tumor immune infiltration and EMT.
Glioma is the most prevalent primary brain tumor, accounting for approximately 80% of malignant primary brain tumors in adults (1). The World Health Organization (WHO) classifies gliomas into Grade II to IV based on malignancy, with Grade II representing low-grade gliomas and Grades III and IV representing high-grade gliomas. Low-grade gliomas have the potential to progress to high-grade gliomas (2, 3). Gliomas exhibit high invasiveness, heterogeneity, and poor marginal restriction, rendering them susceptible to recurrence. Consequently, controlling invasive lesions poses a significant challenge in glioma treatment. Despite the implementation of diverse treatment modalities, such as surgery, radiotherapy, chemotherapy, and immunotherapy, the overall prognosis for glioma patients remains bleak, with a median survival of only 15 months for the most malignant glioblastoma multiforme (Grade IV glioma) (4). Given these challenges, the identification of more sensitive molecular targets as biomarkers for glioma diagnosis, treatment, and prognosis assessment is imperative.
TGF-β-induced factor homeobox 2 (TGIF2) belongs to the three-amino-acid-loop extension (TALE) superfamily of homeodomain proteins (5). Operating as a transcriptional repressor, TGIF2 regulates the BMP/TGF-β pathway or directly binds to DNA (6–8). TGIF2 has been implicated in the development and progression of various cancers. For instance, in cervical cancer, TGIF2 downregulates FCMR by binding directly to its promoter, thereby promoting cervical cancer metastasis (9). In lung cancer, TGIF2 has been found to mediate the EGFR-RAS-ERK signaling pathway, enhancing the stemness of lung adenocarcinoma cells and facilitating LUAD progression and metastasis (10). MicroRNA-148a was found to inhibit ovarian cancer cell proliferation and invasion by suppressing TGIF2 (11). Additionally, TGIF2 is associated with the epithelial-mesenchymal transition (EMT) phenotype in various diseases, including lung adenocarcinoma (12), primary biliary cholangitis (13), chronic obstructive pulmonary disease (14), colon cancer (15), prostate cancer (16), hepatocellular carcinoma (17) etc. Notably, as a downstream target of multiple non-coding RNAs, TGIF2 regulates the progression of glioma (18–21). Previous in vitro experiments have suggested that TGIF2 promotes the EMT phenotype and migration in U87MG and A172 glioma cells (21), indicating the potential involvement of TGIF2 in regulating glioma cell invasion and tumor metastasis. However, whether TGIF2 can serve as a biomarker for tumor progression, diagnosis, and prognosis in glioma remains unclear.
In this study, we systematically analyzed transcriptomic data and clinicopathologic information of gliomas sourced from online databases. Our results revealed a significant overexpression of TGIF2 in gliomas compared to normal human brain tissues. Moreover, elevated TGIF2 expression correlated with malignant phenotypes and poor prognosis in glioma patients, establishing it as a potential independent prognostic indicator. Differentially expressed genes enrichment analysis uncovered positive associations between high TGIF2 expression and crucial biological processes, including cell cycle regulation, DNA synthesis and repair, extracellular matrix, immune response, and various signaling pathways implicated in tumor progression. Immune infiltration analysis revealed the association of TGIF2 with the infiltration status of multiple immune cells, including Th2 cells and macrophages. Furthermore, a comprehensive analysis of the TGIF2 coexpression gene network in glioma was conducted, shedding light on the expression patterns of genes interacting with TGIF2 and the potential clinical relevance of hub genes. Finally, knockdown and knockout of TGIF2 inhibited invasion, migration and EMT of U251 cells in vitro, suggesting its potential function in glioma invasion and migration. These findings collectively position TGIF2 as a promising candidate for a diagnostic and prognostic biomarker in glioma offering valuable insights into its multifaceted role in the regulation of glioma progression.
The RNA-seq data for the 33 cancers and normal tissue in this study were obtained from The Cancer Genome Atlas (TCGA) database (https://portal.gdc.cancer.gov/) and Genotype-Tissue Expression (GTEx) database (https://gtexportal.org/), in which contained 1152 normal human brain tissue and 706 glioma samples. Clinicopathologic information of glioma patients were acquired from TCGA database (comprising 699 tumor samples). The raw data were normalized with the transcripts per million (TPM) and subsequent analyses were performed using log2 (TPM+1). Expression profiling microarray data of GSE14805 were downloaded from the Gene Expression Omnibus (GEO) database (http://www.ncbi.nlm.nih.gov/projects/geo/) (containing 34 tumor samples and 4 normal samples) and statistically analyzed by Xiantao database (https://www.xiantaozi.com/), an online bioinformatic analysis tool based on R software.
The mRNA expression data of TGIF2 in normal tissues and subcellular localization of TGIF2 protein in SH-SY5Y cell line were sourced from Human Protein Atlas (HPA) database (http://www.proteinatlas.org/). Statistical analysis of TGIF2 expression in normal, tumor, and various clinicopathologic characteristic groups was performed and visualized by Xiantao tool (“stats”, “car” and “ggplot2” packages).
Glioma patients were categorized into two groups based on the median expression of TGIF2 mRNA (low-expression group: 0%-50%; high-expression group: 50%-100%). Kaplan-Meier analysis and Cox regression analysis were employed for survival analysis. Overall survival (OS), disease-specific survival (DSS), and progression-free interval (PFI) were compared between the high and low TGIF2 expression groups by Xiantao tool (“Survival” package). Additionally, OS, DSS and PFI were compared in different clinicopathologic characteristic subgroups of glioma patients. Kaplan-Meier plots were generated by Xiantao tool (“Survminer” and “ggplot2” packages).
Receiver Operator Characteristic (ROC) curves were utilized to assess the diagnostic value of TGIF2 and previously reported prognostic genes (IDH1, IDH2, EGFR, TP53, CDC6, CDC14B, and CHD5) in glioma. ROC analysis and visualized with Xiantao tool (“pROC”, “timeROC” and “ggplot2” packages). The closer the area under the ROC curve (AUC) is to “1”, the higher the diagnostic value of the gene.
Univariate logistic regression analysis was performed using Xiantao tool (“stats” package). Glioma patients were divided into two groups according to the median mRNA expression of TGIF2, with the low-expression group serving as the control. Logistic regression models were constructed to assess the predictive effects of TGIF2 expression on different clinicopathologic characteristics. P value < 0.05 was considered statistically significant.
Proportional hazards hypothesis testing was conducted using Xiantao tool (“survival” package), followed by univariate and multivariate Cox regression analyses to ascertain the independent prognostic significance of high TGIF2 expression and different clinicopathologic characteristics in the OS of glioma patients. Clinicopathologic factors with p value < 0.1 in the univariate Cox regression analysis were incorporated into the multivariate Cox regression analysis to further delineate their autonomous prognostic value. P value < 0.05 was considered as of statistical significance. Forest plots, risk score curve and point of survival chart were drawn using Xiantao tool (“ggplot2” package).
Utilizing the independent prognostic factors identified post multivariate Cox regression analysis, Xiantao tool (“rms” package) was employed to construct nomogram model predicting 1-, 3-, and 5-year OS in glioma patients. Calibration analysis and visualization were carried out using Xiantao tool (“rms” package), depicting the differences between the predicted and actual probabilities corresponding to the model at different time points.
For TCGA RNA-seq data, glioma patients were categorized into two groups (low-expression group: 0%-50%; high-expression group: 50%-100%) based on the median expression of TGIF2 mRNA. Differentially Expressed Genes (DEGs) of TCGA RNA-seq data and GSE14805 dataset statistically analyzed using Xiantao tool (“DEseq2” and “limma” packages respectively). Genes with an absolute log2 fold change (FC) > 1 and adjusted p value < 0.05 were considered DEGs and used for subsequent analysis. Volcano plots were generated by Xiantao tool (“ggplot2” package).
To determine the differences in biological functions and signaling pathways between high and low TGIF2 expression groups, the identified DEGs were analyzed for Gene Ontology (GO) and Kyoto Encyclopedia of Genes and Genomes (KEGG) enrichment using Xiantao tool (“clusterProfiler” package). Items with adjusted p value < 0.05 were considered as significant enrichment. The gene set “c2.cp.all.v2022.1.Hs.symbols.gmt [All Canonical Pathways]” in Molecular Signatures Database (MSigDB) was chosen as the reference gene set for Gene Set Enrichment Analysis (GSEA), and the items with false discovery rate (FDR) < 0.25 and adjusted p value < 0.05 were considered significantly enriched. Results of GO, KEGG and GSEA enrichment analyses were used Xiantao tool (“ggplot2” package) for visualization.
The “Estimate” package in R software (v 4.2.1) was applied to assess the stromal score, immune score, and estimate score in the glioma microenvironment grouped by high and low TGIF2 expression. Single sample Gene Set Enrichment Analysis (ssGSEA) was used to analyze the immune infiltration of 24 immune cells in glioma by calculating the enrichment score of each immune cell in the tumor samples according to the marker genes of the immune cells by Xiantao tool (“GSVA” package). Wilcoxon rank-sum test compared immune cell enrichment scores between high and low TGIF2 expression groups. Correlation between TGIF2 and various immune cells and immunoregulatory genes was implemented by Spearman analysis (22, 23). Visualization was performed using Xiantao tool (“ggplot2” package).
Spearman’s correlation test was employed to analyze the correlation of each gene with TGIF2. Genes with adjusted p value < 0.05 were sorted by the correlation coefficient, and the top 50 genes positively or negatively correlated with TGIF2 were selected for subsequent analysis. The coexpression heatmap of the top 15 genes positively or negatively correlated with TGIF2 were visualized using Xiantao tool (“ggplot2” package).
To investigate the interaction relationships among coexpression genes correlated with TGIF2, the STRING database (https://string-db.org/) was used to establish a Protein-Protein Interaction (PPI) network based on default parameters. Subsequently, the network was visualized by the Cytoscape software, and the top 10 hub genes were identified using the CytoHubba plugin. Kaplan-Meier plots and ROC plots of these 10 hub genes were generated as previously described.
U251 and 293T cells were cultured in DMEM (Cellmax, CGM102.05) medium supplemented with 10% FBS (Gibco, 2437694). To knockdown TGIF2, U251 cells were transfected with siRNA of TGIF2 (Sigma, SASI_Hs01_00107440) using Lipofectamine 3000 (Invitrogen, L3000015) at a final concentration of 100 pmol according to the manufacturer’s instructions when the cells reached approximately 50% confluence. For TGIF2 knockout, guide RNAs (gRNAs) targeting exon 2 of TGIF2 were designed using the http://crispor.tefor.net/website. The double-stranded DNA formed after annealing gRNA33 and gRNA140 were inserted into the PX459 V2.0 plasmid. We transfected 293T cells with the cloned vectors, extracted genomic DNA and performed Sanger sequencing to determine the knockout efficiency of the vectors. The screened gRNA was transfected into U251 cells, and the monoclones that successfully knocked out TGIF2 were selected for expansion culture for subsequent experiments. The primer sequences for synthesizing gRNA were as follows: gRNA33, Forward: 5′- CACCGACCTAGATCACTGTCCGACA -3′;Reverse: 5′-AAACTGTCGGACAGTGATCTAGGTC -3′. gRNA140, Forward: 5′- CACCGCGGTGAAGATCCTCCGGGAC -3′;Reverse: 5′- AAACGTCCCGGAGGATCTTCACCGC -3′. The primer sequences for verifying knockout efficiency of gRNA were as follows: Forward: 5′- CATCCCCTGTGTCCCTTGTC -3′;Reverse: 5′- ACTTGCAGCACTGACAGGTT -3′.
Total RNA was extracted with TsingZol total RNA extraction reagent (TSINGKE, TSP401) and cDNA was synthesized using 5× All-In-One RT Master Mix (Applied Biological Materials, G490) following the manufacturer’s protocol. RT-qPCR was performed using PowerUp™ SYBR™ Green Master Mix (Applied Biosystems™, A25742) and PIKOREAL 96 Real-Time PCR System (ThermoFisher). GAPDH served as internal control for quantifying relative gene expression levels using the 2 –ΔΔCT method. The primer sequences were as follows: TGIF2, Forward: 5′- CTTCAACACGCCACCACCCACACC-3′; Reverse: 5′- CCTCTGTAGCGCCACCTCCACCAG -3′.CDH2, Forward: 5′- CCTCCAGAGTTTACTGCCATGAC -3′; Reverse: 5′- GTAGGATCTCCGCCACTGATTC -3′. TWIST1, Forward: 5′- GCCAGGTACATCGACTTCCTCT -3′; Reverse: 5′- TCCATCCTCCAGACCGAGAAGG -3′. TWIST2, Forward: 5′- GCAAGATCCAGACGCTCAAGCT -3′; Reverse: 5′- ACACGGAGAAGGCGTAGCTGAG -3′. GAPDH, Forward: 5′- GGAGTCCACTGGCGTCTTCA -3′; Reverse: 5′- GTCATGAGTCCTTCCACGATACC -3′.
For transwell assay, 5x10⁴ cells were inoculated in transwell (Millicell, PI8P01250) upper chamber containing serum-free DMEM, and the lower chamber was layered with DMEM containing 10% FBS. After 24 h of incubation at 37°C, non-invasive cells on the upper surface of the membrane were wiped off with a cotton swab. Subsequently, invasive cells into the lower surface of the membrane were fixed with 4% paraformaldehyde and stained with 0.1% crystalline violet (Solarbio, G1063), observed under the microscope and selected random fields were photographed. For scratch wound-healing assay, cells were plated into 12-well plates and cultured until 90% confluence, scratched using a 10 μL pipette tip, and washed with PBS to remove dropped cells. The cells migration distance was observed at 0 h and 24 h of scratching and photographed.
Cells were lysed with RIPA lysis buffer (Beyotime, P0013B) supplemented with 1 mM of the protease inhibitor phenylmethylsulfonyl fluoride (Beyotime, ST506) for 20 min on ice. After centrifugation at 12,000 rpm, the supernatant was collected, loaded onto a 10% polyacrylamide SDS gel, and subsequently transferred to a PVDF membrane (Millipore, IPVH00010). Membranes were blocked with TBST containing 5% skimmed milk (BD Pharmingen™, 232100) for 1 h at room temperature, followed by overnight incubation at 4°C with primary antibodies. After 5 washes with TBST, the membranes were incubated with secondary antibody at room temperature for 2 h. The membranes were then scanned and analyzed using the ChemiDoc™ system (Bio-Rad). The following antibodies were used: TGIF2 (11522-1-AP, Proteintech); GAPDH (EPR16891, Abcam); N-Cadherin (22018-1-AP, Proteintech); secondary antibody (AB0101, Abways).
Bioinformatics analysis was performed with Wilcoxon rank sum test to detect statistical significance between the two groups. The relationship between TGIF2 expression and baseline clinicopathologic characteristics of patients was evaluated using the chi-square test by Xiantao tool (“stats” package). Spearman’s correlation coefficient assessed the correlation of TGIF2 expression with various immune cells and other genes. Statistical analysis of in vitro experiments were performed with GraphPad Prism 7.0 and comparisons between two conditions were applied by Student’s t-test and the data were presented as mean ± standard deviation (SD). P value < 0.05 was considered statistically significant.
We explored the basal expression levels of TGIF2 across various tissues. Analysis of HPA database revealed higher TGIF2 mRNA expression in breast and female reproductive system, bone marrow, lymphoid, and muscle tissues, while lower expression was observed in brain tissues (Figure 1A). Subsequently, TGIF2 expression was assessed in 33 tumors from TCGA and GTEx databases. Notably, TGIF2 expression levels in 21 tumor tissues were significantly higher than in corresponding normal tissues (Figure 1B). Specifically, elevated TGIF2 expression was observed in low-grade glioma (LGG) and glioblastoma (GBM) compared to normal brain tissues (Figure 1B). Subcellular localization of TGIF2 protein is predominantly in the nucleus in the human glioma cell line SH-SY5Y (Figure 1C). Furthermore, in the GSE14805 dataset, we identified 2954 DEGs, including 1369 upregulated and 1585 downregulated genes, with TGIF2 significantly upregulated in the tumor group (Figure 1D). The ROC analysis indicated similar diagnostic ability for TGIF2 (AUC = 0.971) with established glioma prognostic genes (IDH1, IDH2, EGFR, TP53, CDC6, CDC14B, CHD5) (24–30) (Figure 1E). Kaplan-Meyer analysis demonstrated that glioma patients with high TGIF2 expression exhibited poor OS, DSS and PFI (Figures 1F–H). These findings suggest that TGIF2 expression is elevated in glioma and associated with worse prognosis, warranting further investigation.
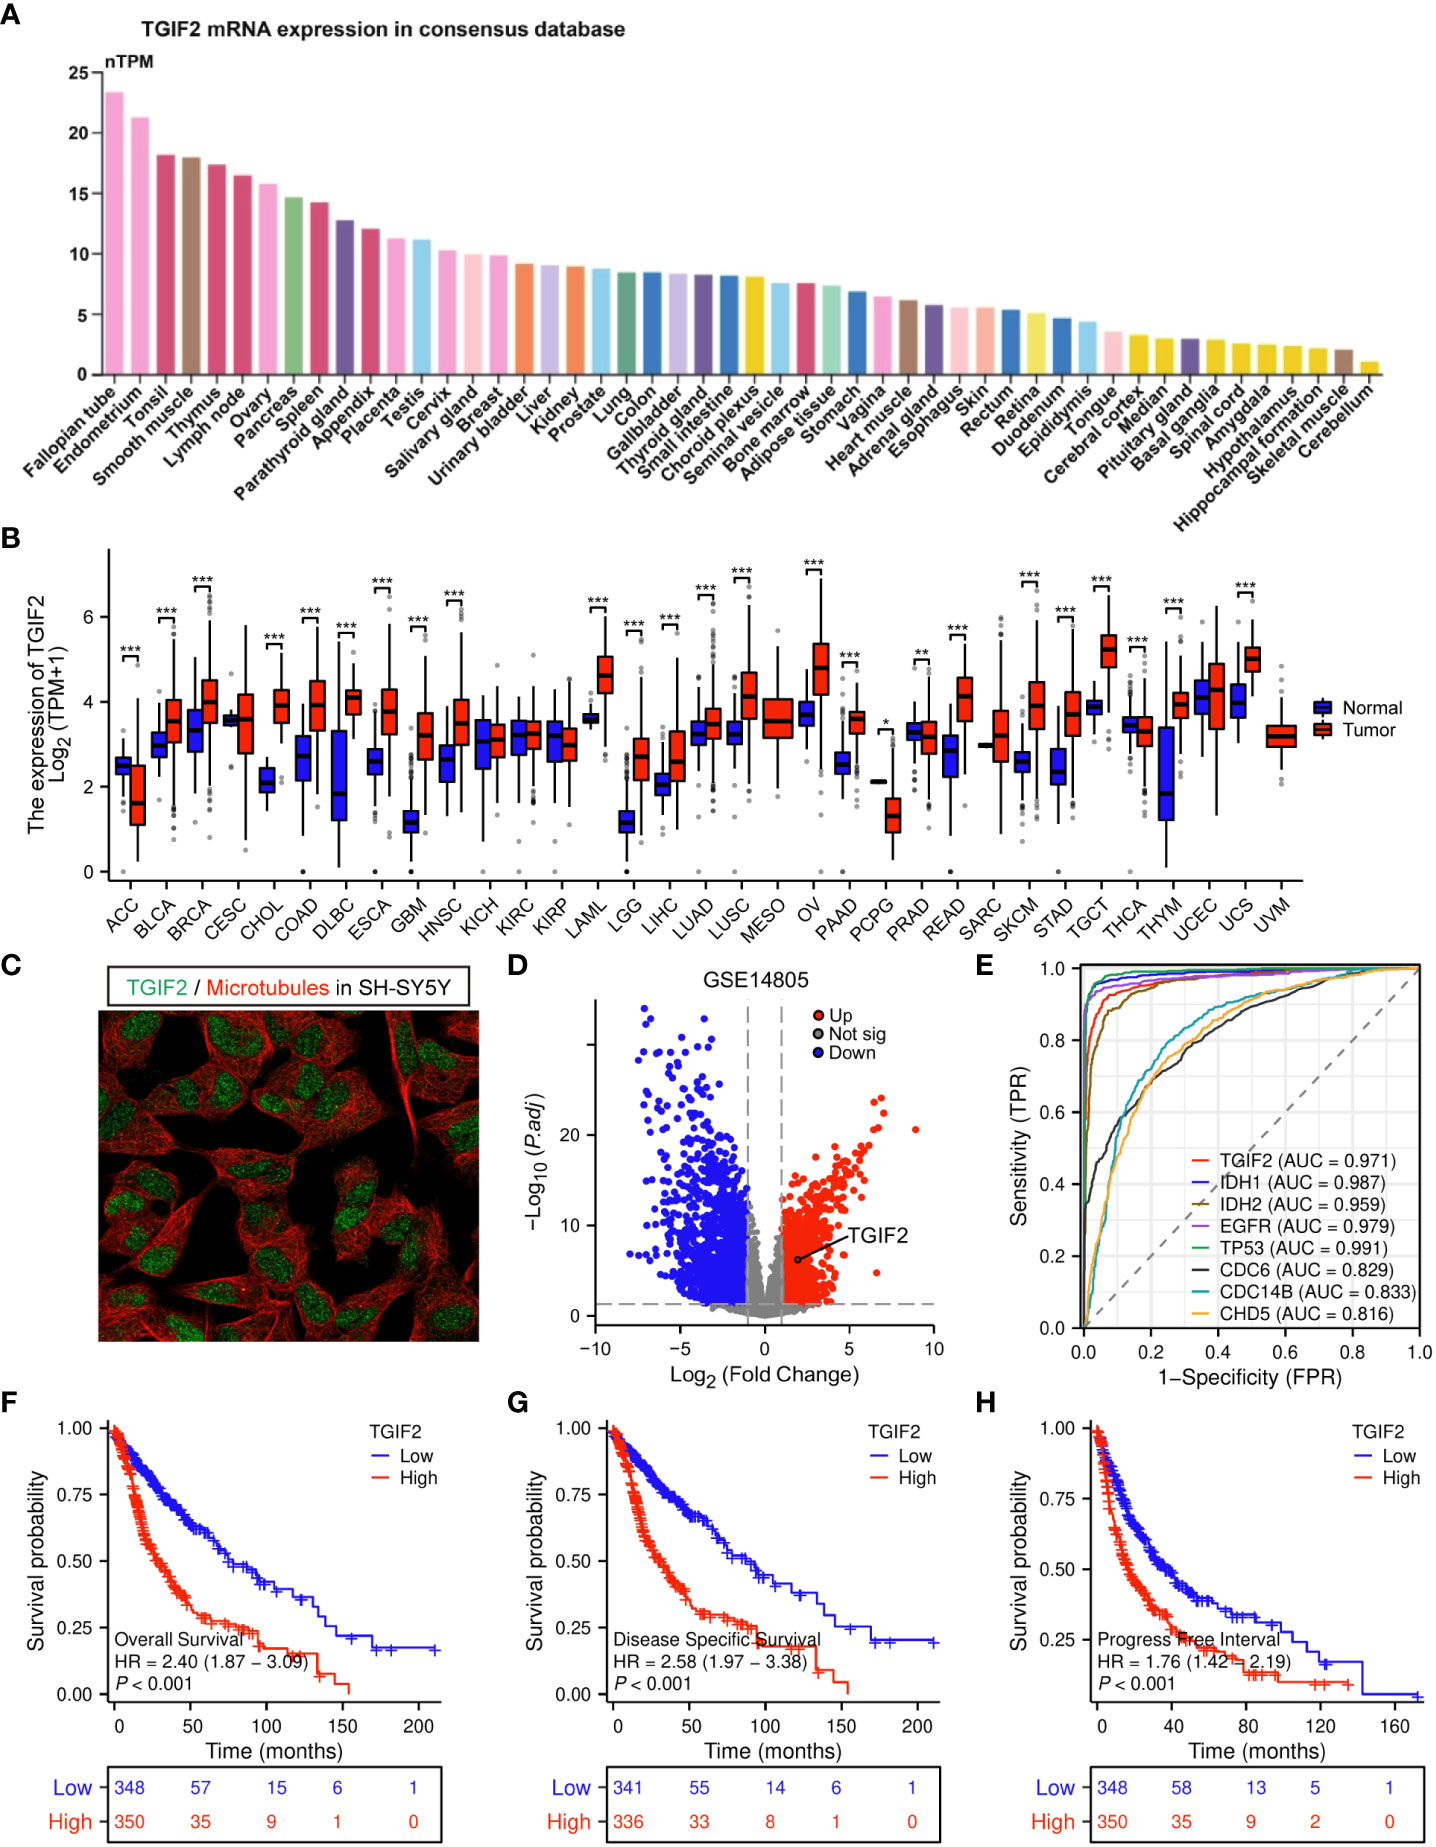
Figure 1 The expression level of TGIF2 in different human cancers and its relationship to glioma prognosis. (A) TGIF2 mRNA expression across various human organs and tissues based on consensus dataset in HPA database. (B) Comparison of TGIF2 expression between normal and tumor tissues across 33 cancers in TCGA and the GTEx database. (C) Subcellular localization of TGIF2 in SH-SY5Y cells from HPA datasets. (D) The volcano plot of DEGs in GSE14805. Red points represent upregulated, blue points represents downregulated genes. (E) ROC curve of TGIF2 and other established prognostic genes (IDH1, IDH2, EGFR, TP53, CDC6, CDC14B, CHD5) in glioma. (F–H) Survival curves for OS (F), DSS (G) and PFI (H) in gliomas using TCGA database. ∗p < 0.05, ∗∗p < 0.01, ∗∗∗p < 0.001.
We investigated the association between TGIF2 expression and various clinicopathologic characteristics of glioma patients in the TCGA database. A total of 699 patients’ clinicopathologic information was included in the statistics, and the chi-square test revealed that TGIF2 expression was significantly correlated with age, WHO grade, IDH status, 1p/19q codeletion, histological type, OS event, DSS event and PFI event in glioma patients (Table 1). Logistic regression analysis further confirmed significant associations between TGIF2 and age, WHO grade, IDH status, 1p/19q codeletion and histological type (Table 2). TGIF2 expression patterns in different clinicopathologic characteristics showed elevation in age > 60 years, IDH-wild type, 1p/19q non-codeletion, progressive disease and stable disease (PD&SD), OS events, DSS events, and PFI events subgroups (Figures 2A–G). TGIF2 expression increased with WHO grade classification, peaking in G4 glioma (Figure 2H). For histological type, glioblastoma exhibited significantly higher TGIF2 expression compared to other glioma types (Figure 2I). However, no statistically significant differences were observed among glioma patients of different genders and races (Figures 2J, K). These results suggest that high TGIF2 expression may be associated with malignant phenotypes of glioma and worsening clinical outcomes.
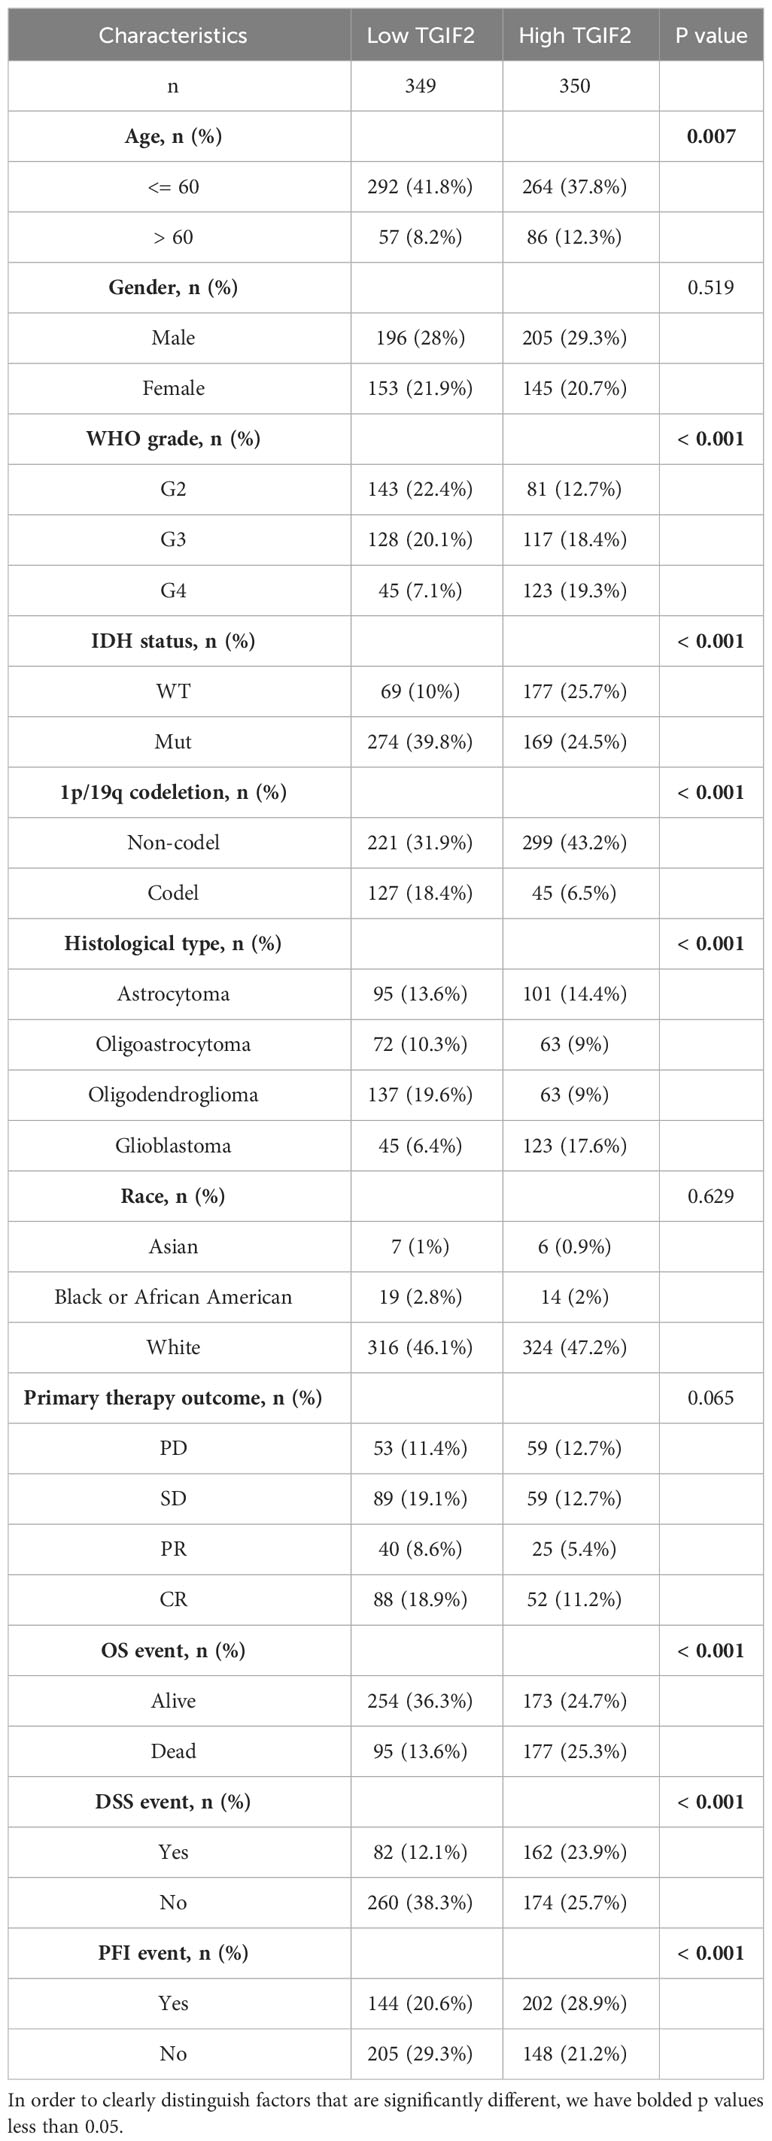
Table 1 Clinical characteristics of glioma patients.
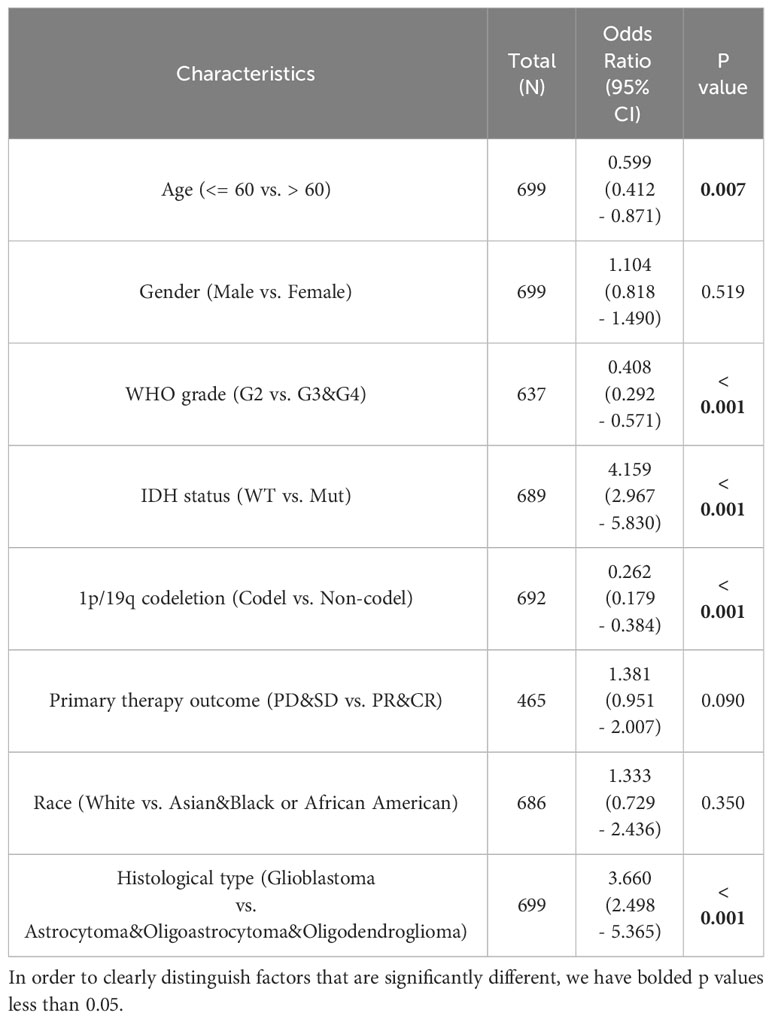
Table 2 Logistic analysis of the association between TGIF2 expression and clinical characteristics.
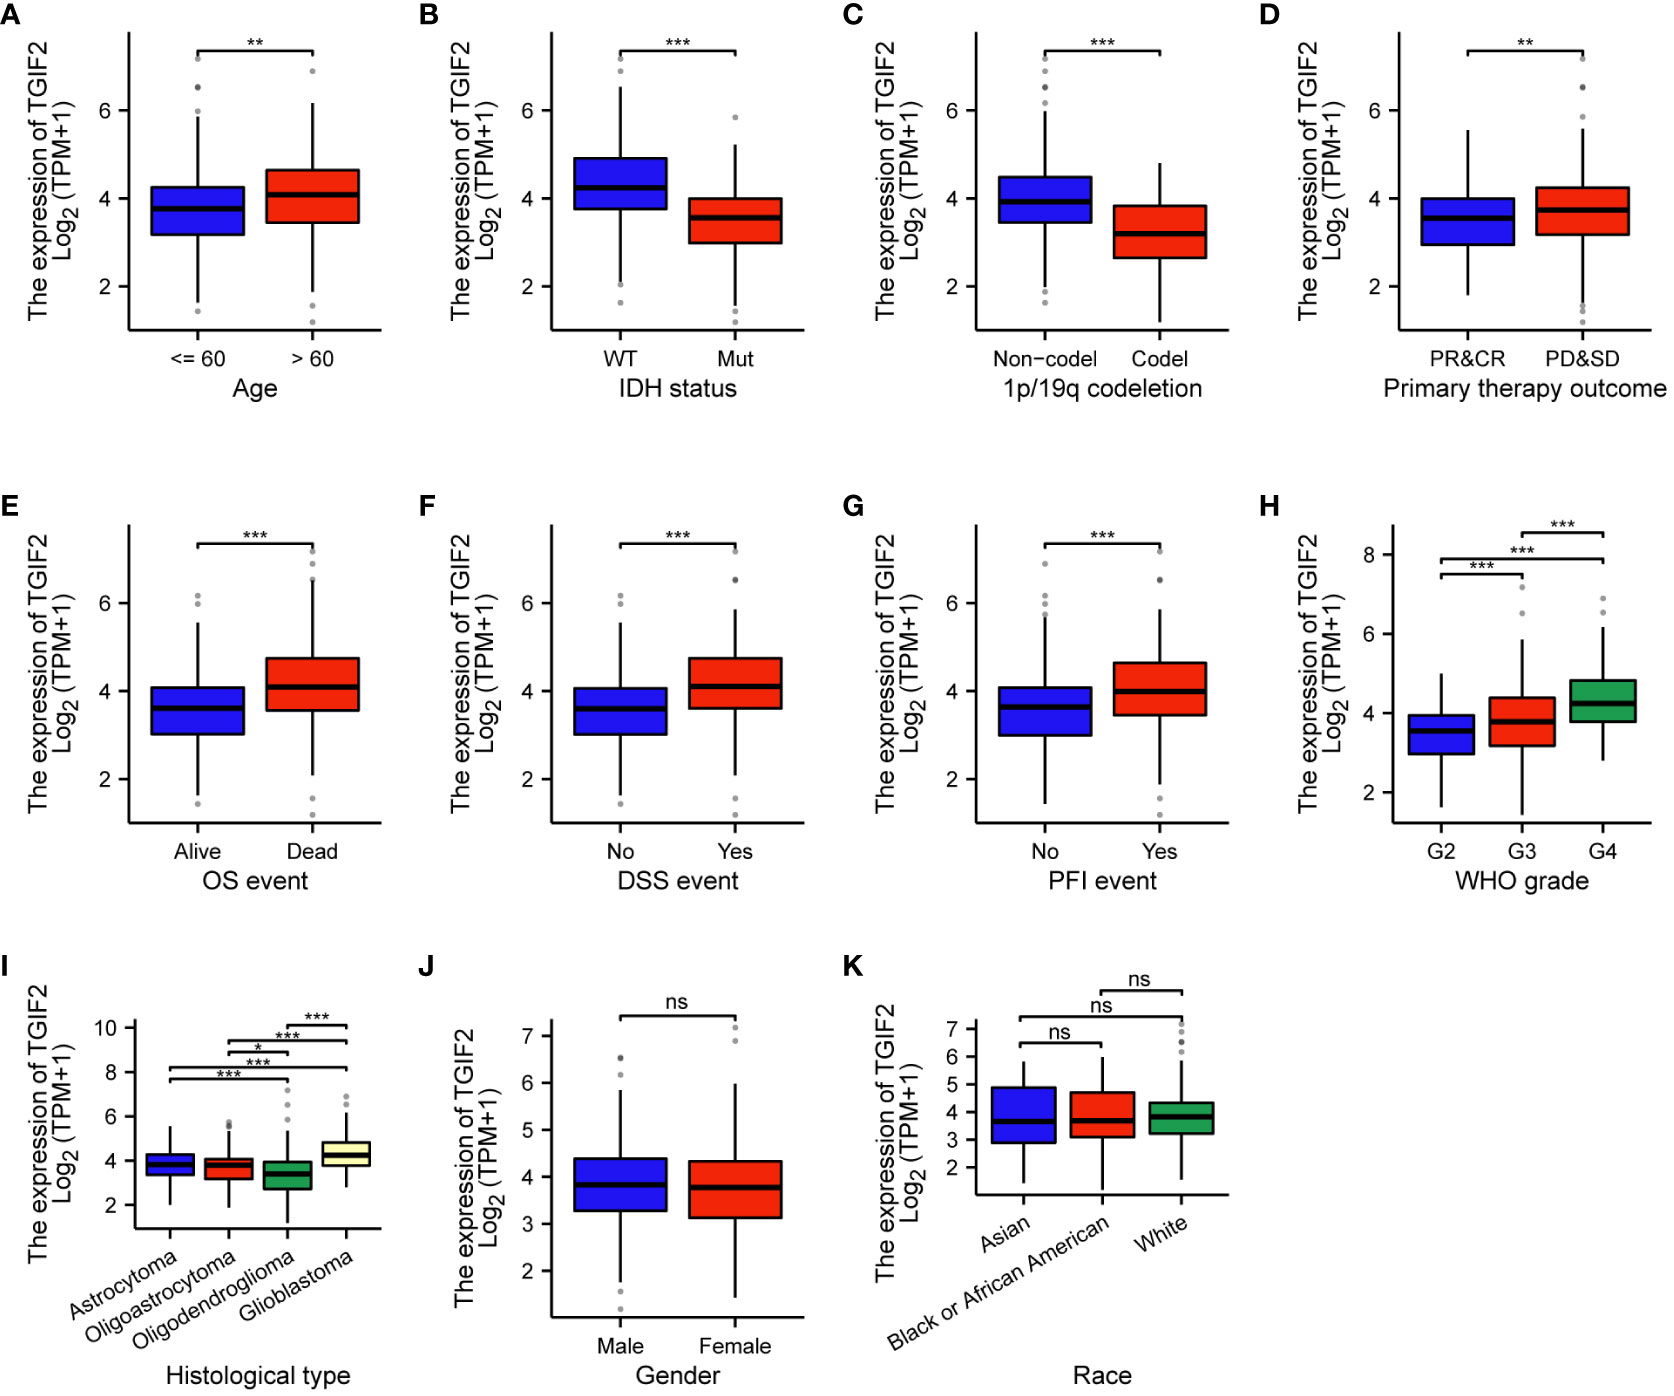
Figure 2 Associations between TGIF2 expression and various clinicopathologic characteristics in glioma. (A) Age. (B) IDH status. (C) 1p/19q codeletion status. (D) Primary therapy outcome. (E) OS events. (F) DSS events. (G) PFI events. (H) WHO grade. (I) Histological type. (J) Gender. (K) Race. ∗p < 0.05, ∗∗p < 0.01, ∗∗∗p < 0.001, ns, not significant.
We assessed the prognostic value of TGIF2 expression for glioma patients in the TCGA database. Firstly, analysis of TGIF2 expression distribution, survival status, and risk scores indicated that higher TGIF2 expression in the high-risk group correlated with increased mortality rates compared to the low-risk group (Figure 3A). Time-dependent ROC analysis demonstrated favorable predictive efficacy of TGIF2 expression for OS at 1-year (AUC = 0.653), 3-years (AUC = 0.715), and 5-years (AUC = 0.690) (Figure 3B). Univariate Cox regression analysis revealed an association between high TGIF2 expression and poorer OS (HR, 2.401; 95% confidence interval [CI], 1.867-3.089; p < 0.001) (Table 3). Multivariate Cox regression analysis, after confounding with other clinicopathologic variables, identified TGIF2 as an independent prognostic risk factor for glioma patients (HR, 2.366; 95% CI, 1.620-3.455; p < 0.001). Other clinicopathologic parameters, including age (HR, 5.203; 95% CI, 3.291-8.224; p < 0.001), 1p/19q codeletion (HR, 0.490; 95% CI, 0.298-0.807; p = 0.005), histological type (HR, 4.885; 95% CI, 1.709-13.959; p = 0.003), and primary therapy outcome (HR, 0.215; 95% CI, 1.620 -3.455; p < 0.001), also emerged as independent prognostic factors (Table 3; Figure 3C). A prognostic nomogram model, incorporating TGIF2 expression and other independent prognostic factors analyzed by Cox regression, was constructed for predicting OS at 1, 3, and 5 years (Figure 3D). Calibration curves assessed the predictive efficiency of the nomogram (Figure 3E).
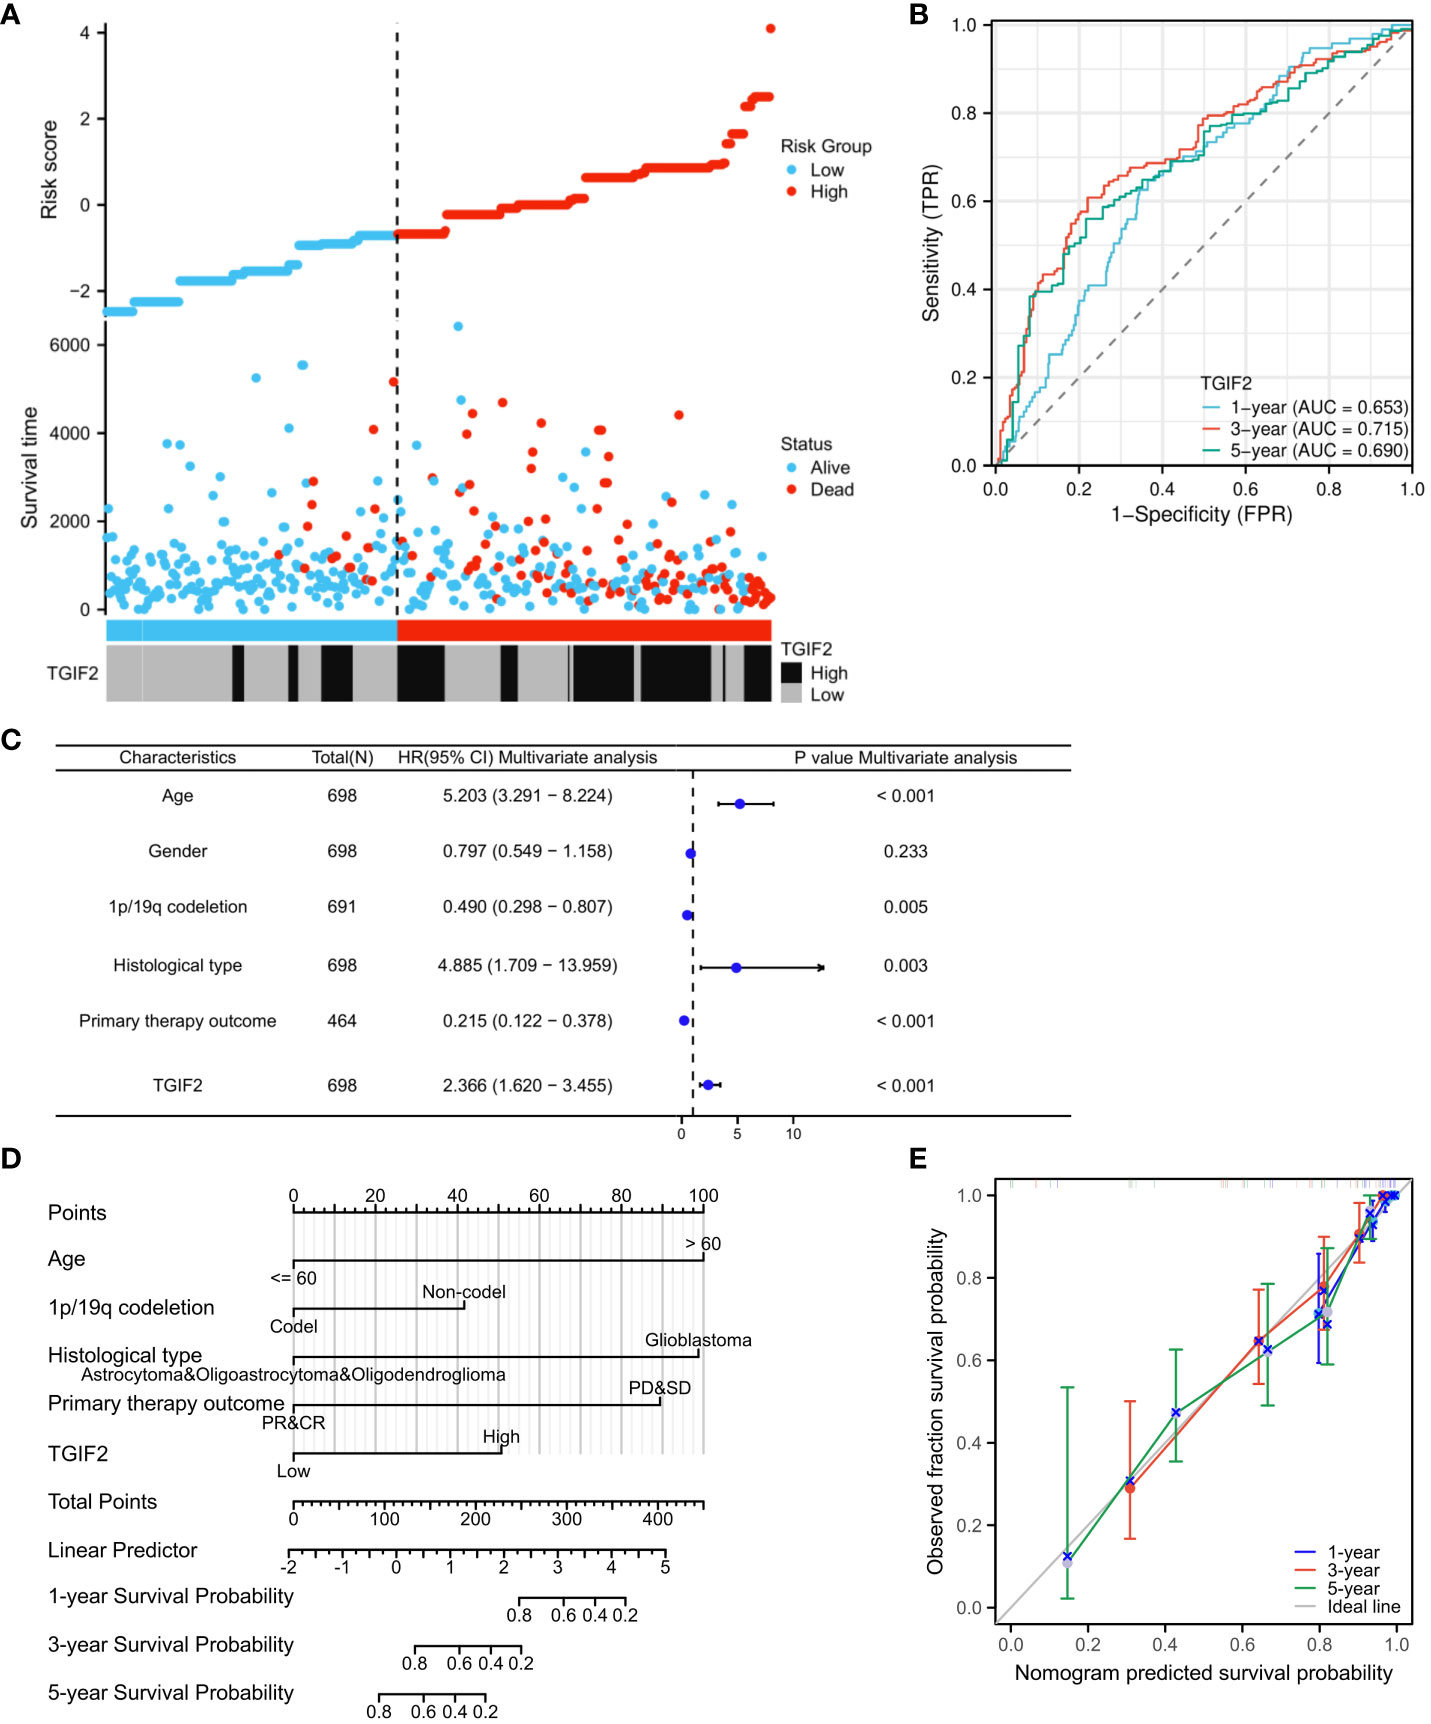
Figure 3 Prognostic value of TGIF2 expression level in glioma. (A) TGIF2 expression distribution and survival status. (B) Time-dependent ROC curves for TGIF2 expression in glioma. (C) Forest plot of OS by multivariate Cox regression analysis in glioma from TCGA database. (D) The nomogram for predicting 1-, 3-, or 5-year OS rates in patients with glioma. (E) The calibration curves for the nomogram.
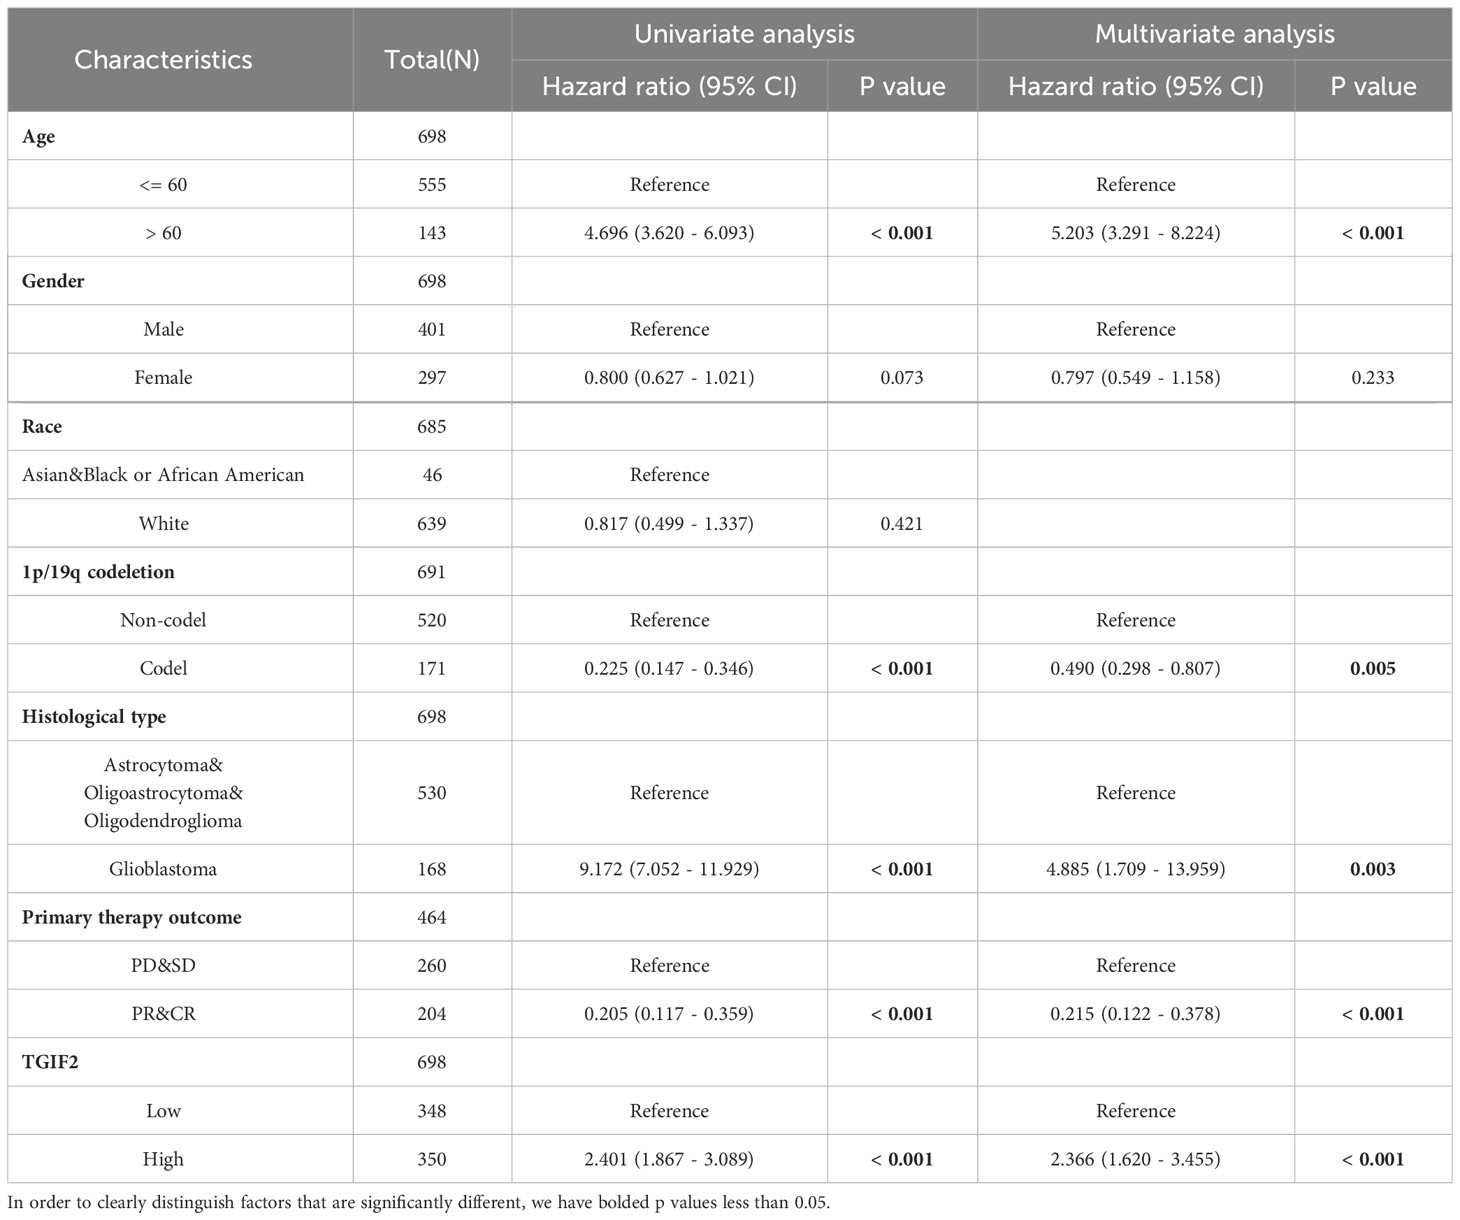
Table 3 Univariate and multivariate cox regression analyses of clinical characteristics associated with overall survival.
Next, we explored the relationship between TGIF2 and prognosis (OS, DSS, and PFI) across different clinicopathologic subgroups of glioma. Kaplan-Meyer analysis revealed that higher TGIF2 expression associated with worse OS in subgroups including age >60, age ≤60, male, female, Race (White), WHO grade (G3), 1p/19q codeletion status (non-codel), histological type (astrocytoma), and primary therapy outcome (PD) (Figures 4A–I). For DSS, patients with higher TGIF2 expression had worse DSS in subgroups such as age >60, age ≤60, male, female, race (White), WHO grade (G3), 1p/19q codeletion status (non-codel), histological type (astrocytoma), primary therapy outcome (PD) and primary therapy outcome (SD) (Supplementary Figures S1A–J). For PFI, higher TGIF2 expression was associated with worse PFI in subgroups including age >60, age ≤60, male, female, race (White), WHO grade (G3), 1p/19q codeletion status (non-codel) (Supplementary Figures S2A–G).
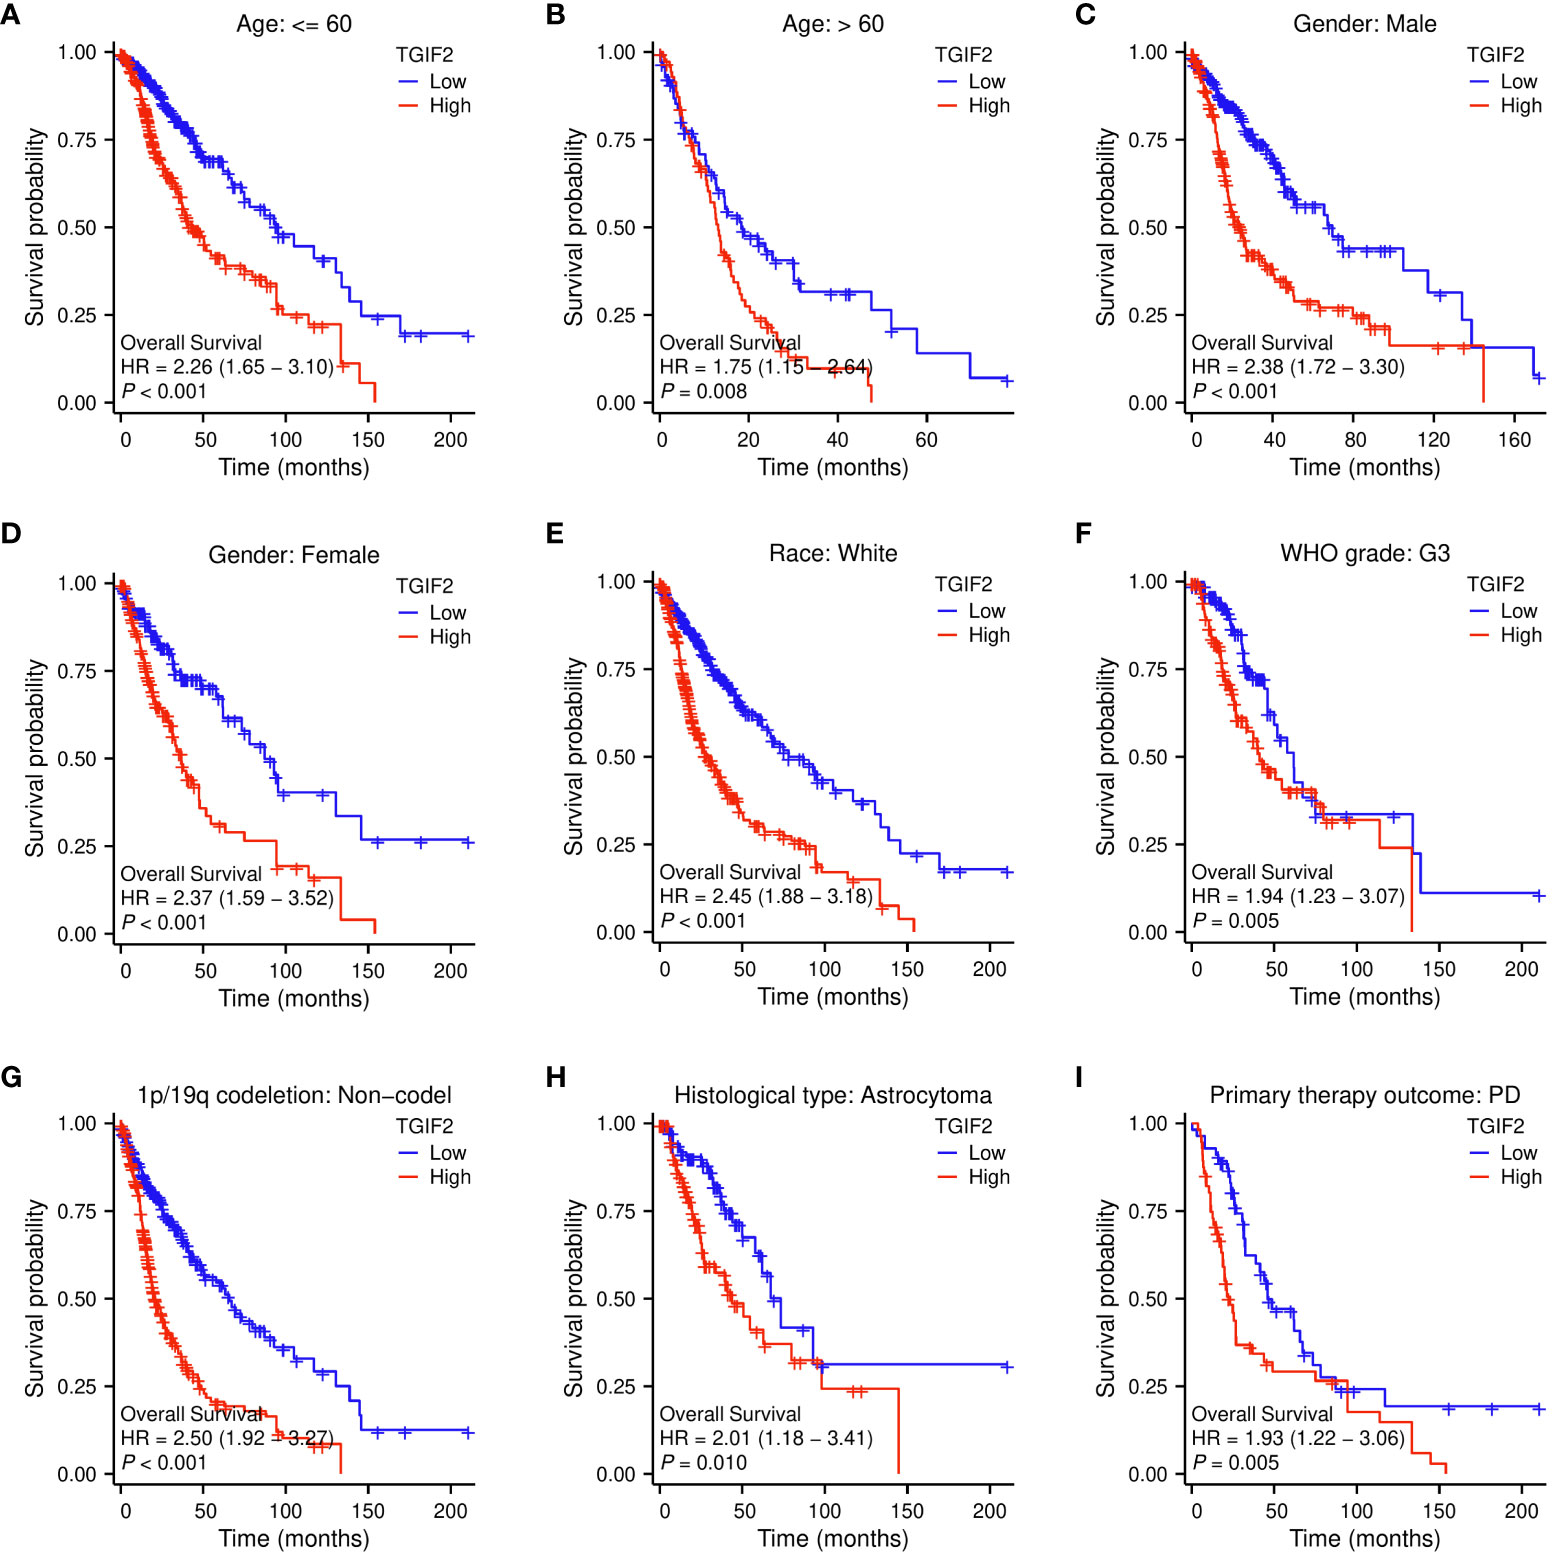
Figure 4 Correlations between TGIF2 expression level and OS in different clinicopathologic subgroups of glioma by Kaplan-Meier survival curve analysis. (A) Age ≤ 60. (B) Age > 60. (C) Gender: Male. (D) Gender: Female. (E) Race: White. (F) WHO grade: G3. (G) 1p/19q codeletion: non-codeletion. (H) Histological type: Astrocytoma. (I) Primary therapy outcome: PD.
We analyzed DEGs between TGIF2 high and low expression groups based on the median TGIF2 expression level. A total of 2696 DEGs were identified, comprising 1353 upregulated and 1343 downregulated genes (Figure 5A). In GO enrichment analysis, the biological process (BP) mainly contained embryonic organ development, regulation of membrane potential, extracellular matrix organization, calcium-mediated signaling and chemokine-mediated signaling pathway. The cellular component (CC) was enriched in ion channel complex, collagen-containing extracellular matrix, glutamatergic synapse, T cell receptor complex and voltage-gated potassium channel complex. The molecular function (MF) was mainly involved in DNA-binding transcription activator activity, extracellular matrix structural constituent, voltage-gated potassium channel activity, cytokine activity and chemokine activity. KEGG pathway enrichment analysis indicated that TGIF2 potential participation in the regulation of neuroactive ligand-receptor interaction, calcium signaling pathway, cAMP signaling pathway, glutamatergic synapse and ECM-receptor interaction (Figure 5B).
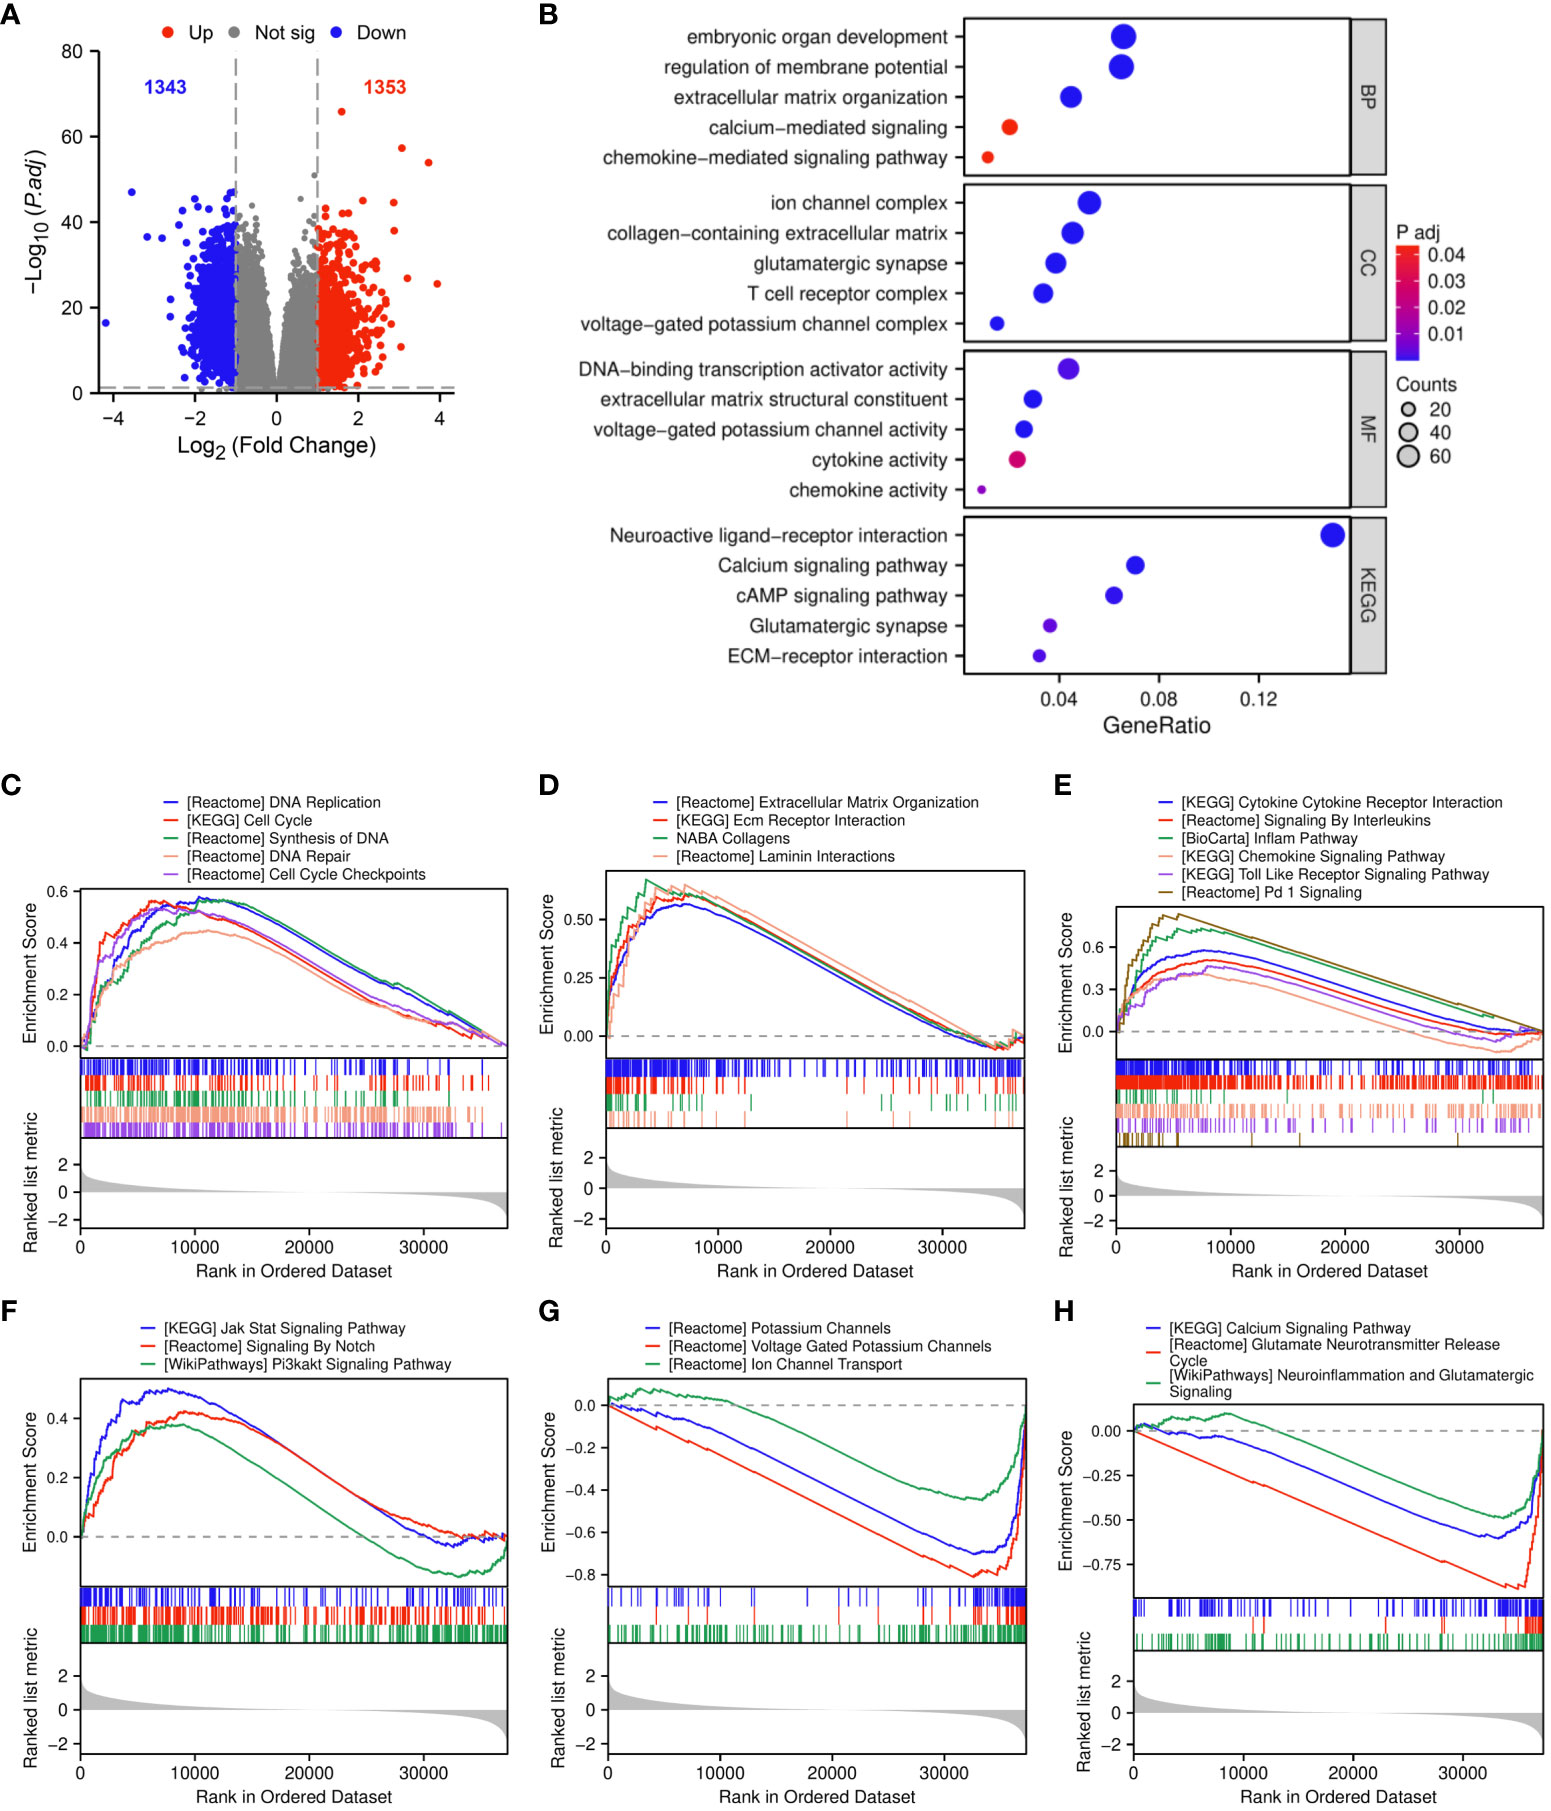
Figure 5 Functional enrichment analysis of DEGs between TGIF2 high and low expression groups. (A) The volcano plot of DEGs. Red represents upregulated, blue represents downregulated genes. (B) GO and KEGG pathway enrichment analysis of DEGs. (C–H) GSEA functional enrichment analysis.
GSEA was applied to further investigate the biological functions of TGIF2. Upregulation of TGIF2 expression correlated with cell cycle and DNA replication pathways, including DNA replication, cell cycle, synthesis of DNA, DNA repair, and cell cycle checkpoints (Figure 5C). ECM-related functions, such as extracellular matrix organization, ECM receptor interaction, and collagens and laminin interactions, were enriched in the TGIF2 high-expression phenotype, suggesting involvement in ECM formation in glioma (Figure 5D). TGIF2 also impacted pathways related to tumor immunity, including cytokine cytokine receptor interaction, signaling by interleukins, inflam pathway, chemokine signaling pathway, toll-like receptor signaling pathway, and Pd-1 signaling (Figure 5E). Additionally, pathways related to tumor progression, such as Jak Stat signaling pathway, signaling by Notch, and Pi3kakt signaling pathway, were enriched (Figure 5F). Ion channel and glutamate signaling are facilitators of glioma cell invasion and migration (31, 32), yet they were negatively correlated with high TGIF2 expression (Figures 5G, H), which may be related to glioma grading (33, 34). These findings suggest that TGIF2 may play a role in glioma cell proliferation, invasion and migration, and tumor immunity, making it a promising target for glioma treatment.
To unravel the intricate relationship between TGIF2 expression and the tumor immune response in glioma, we meticulously analyzed the disparities in the glioma immune microenvironment between high and low TGIF2 expression groups. The outcomes unveiled a significant elevation in stromal scores (Figure 6A), immunity scores (Figure 6B), and estimated scores (Figure 6C) in glioma patients with high TGIF2 expression. Furthermore, multiple immune cell subtypes were significantly enriched in the TGIF2 high-expression group, including aDC, cytotoxic cells, eosinophils, iDC, macrophages, neutrophils, NK CD56dim cells, NK cells, T cells, T helper cells, Th17 cells, and Th2 cells (Figure 6D). In contrast, the TGIF2 low-expression group exhibited higher enrichment of DC, mast cells, NK CD56bright cells, pDC, TFH, TReg, and Tcm (Figure 6E). Subsequently, we further delved into the association between TGIF2 expression levels and the infiltration levels of different immune cells in gliomas. The results demonstrated a positive correlation between TGIF2 expression and the infiltration levels of Th2 cells, macrophages, eosinophils and neutrophils, etc. Nevertheless, there was a negative correlation with infiltration levels of mast cells, NK CD56bright cells, pDC and TFH, etc. (Figures 6F–N). In addition, we investigated the correlation between TGIF2 and various immunoregulatory molecules to further understand its immune modulating function. These immunoregulatory genes include antigen presentation, cell adhesion, co-inhibitory, co-stimulatory, ligand, receptor, and other according to the classification of Thorsson et al. (23). The findings indicated a positive correlation between TGIF2 expression and most immunoregulatory genes, implying a potential role for TGIF2 in regulating glioma immune infiltration (Supplementary Figure S3).
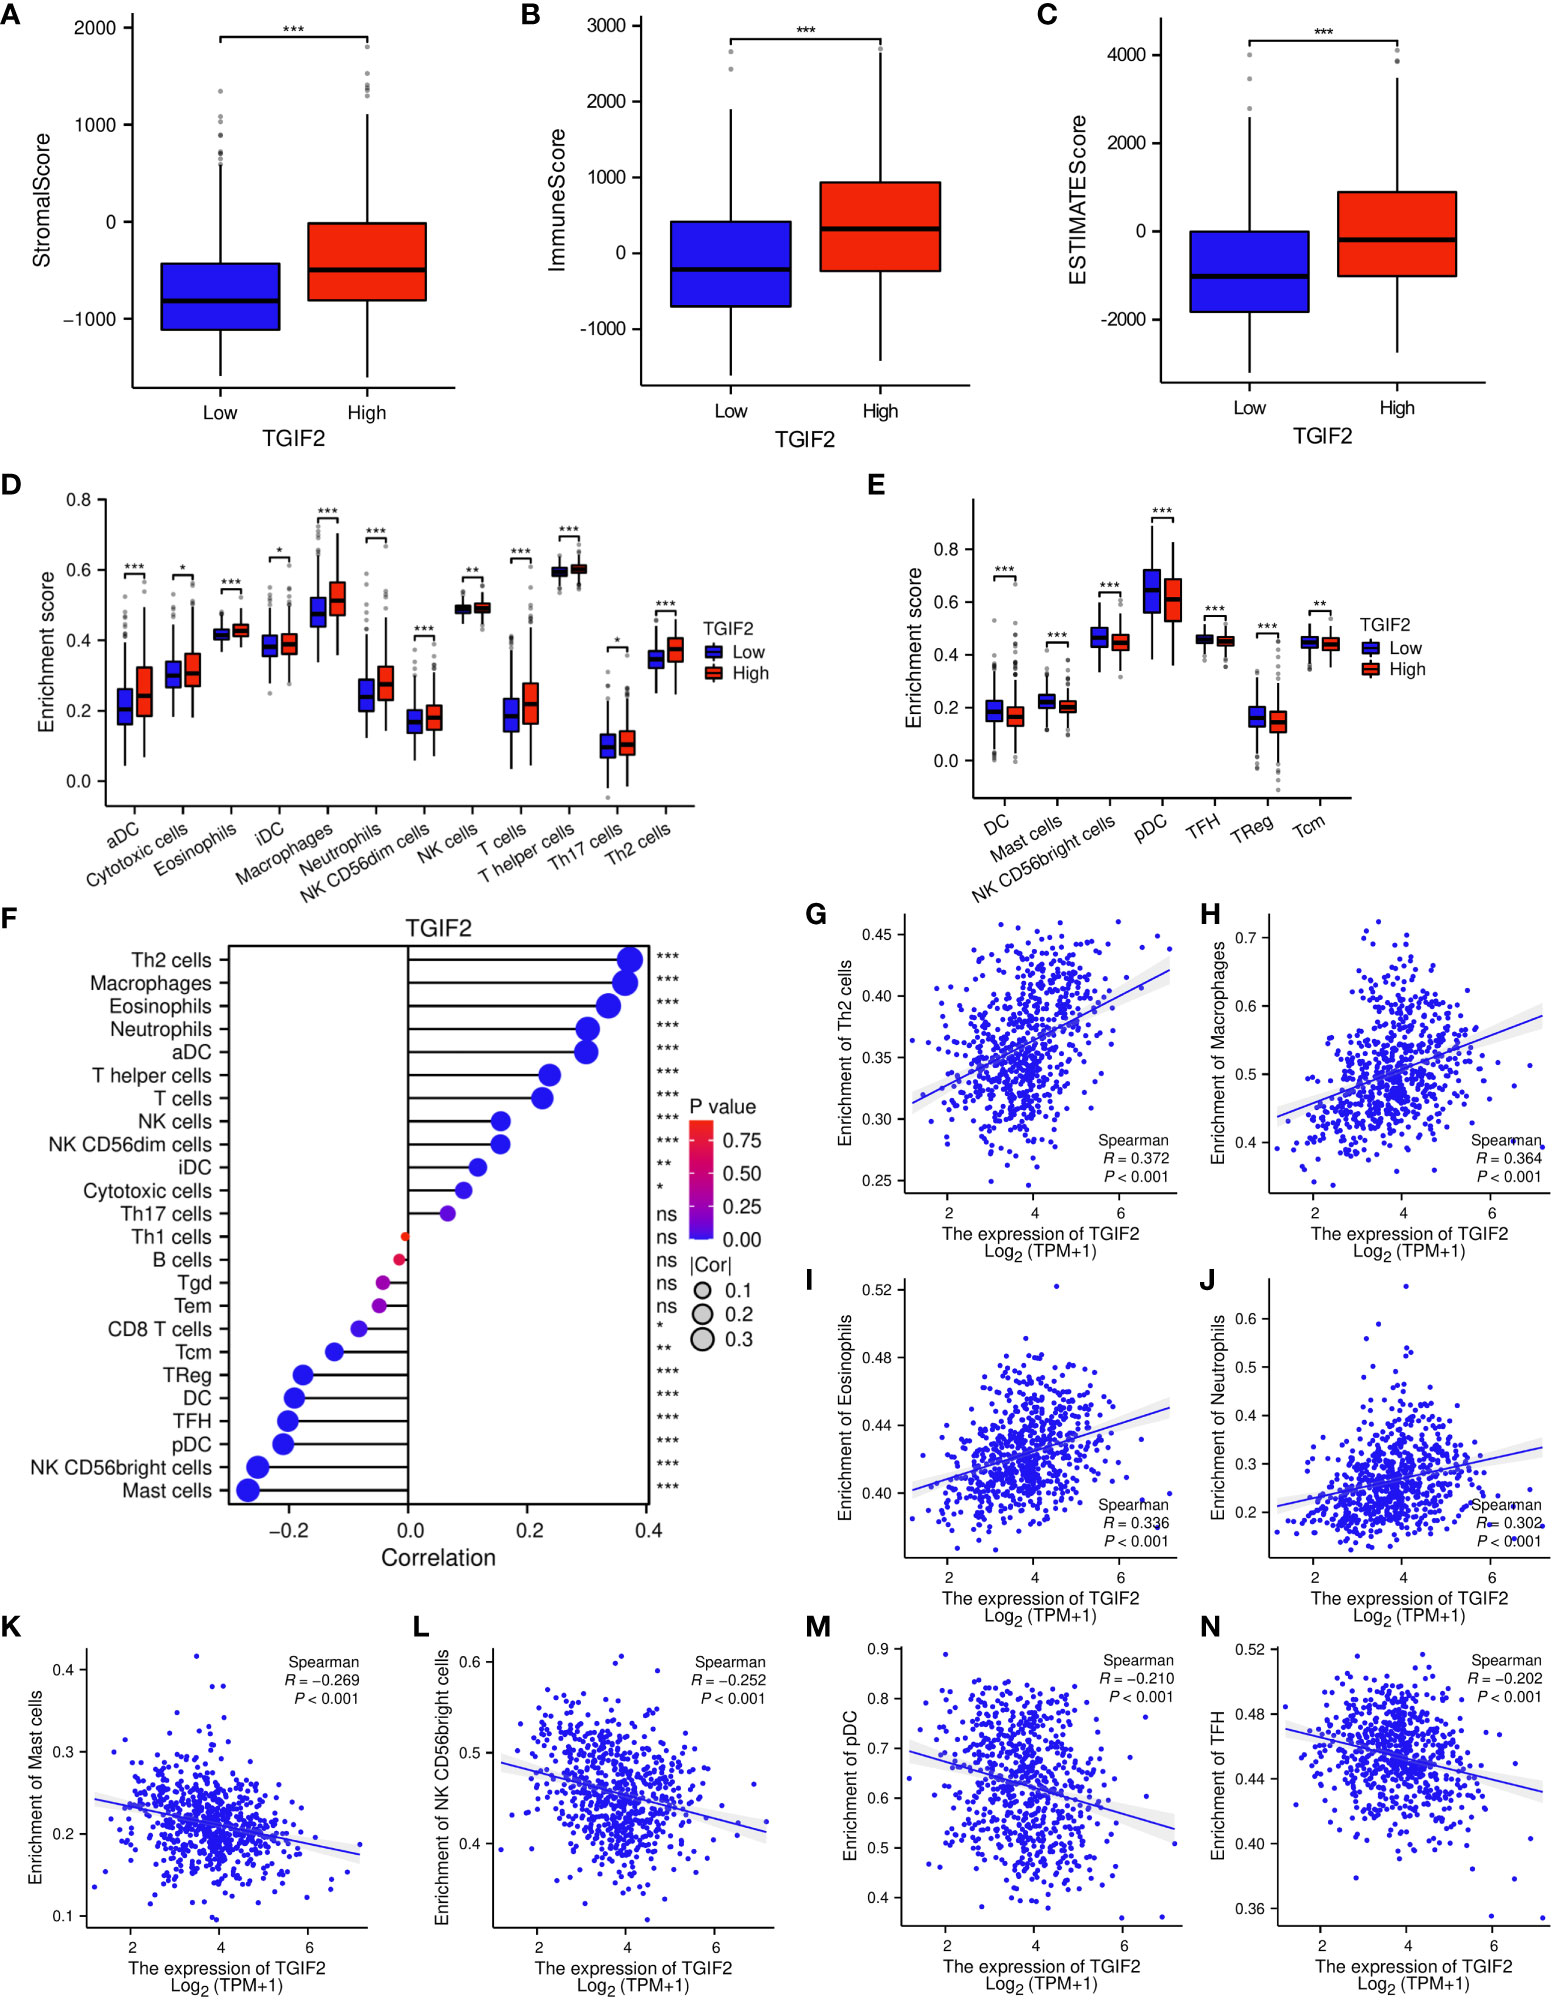
Figure 6 Correlations between TGIF2 expression and immune cell infiltration in glioma. (A–C) Comparison of StromalScore, ImmuneScore, and EstimateScore between TGIF2 high and low expression groups. (D, E) Comparison of immune cell enrichment scores in high and low TGIF2 expression groups. (F) The lollipop chart showing the correlations between the relative abundances of 24 immune cells and TGIF2 expression levels. (G–N) Scatterplots demonstrating the positive correlation of TGIF2 expression with Th2 cells, macrophages, eosinophils, and neutrophils, and the negative correlation with mast cells, NK CD56bright cells, pDC cells, and TFH cells. ∗p < 0.05, ∗∗p < 0.01, ∗∗∗p < 0.001, ns, not significant.
The analysis of genes coexpressed with TGIF2 in glioma provided valuable insights into potential regulatory networks and prognostic markers. The coexpression heatmap demonstrated the top 15 genes that were positively and negatively correlated with TGIF2 (Figure 7A). We performed PPI network analysis of the top 50 protein-coding genes positively and negatively correlated with TGIF2 using the STRING database and Cytoscape (Figure 7B) and identified the top 10 hub genes using the CytoHubba plugin (HDAC1, CASP3, REST, HMG20B, FZD7, GNAI3, FZD1, EPHB4, KCNJ9, SCRT1) (Table 4, Figure 7C). The top 10 hub genes highlighted potential central regulators in the context of TGIF2-associated glioma biology. Among these 10 genes HDAC1, CASP3, REST, HMG20B, FZD7,GNAI3, FZD1 and EPHB4 had elevated expression in tumor group compared to the normal group, while KCNJ9 and SCRT1 were decreased (Figure 7D). Kaplan-Meyer analysis showed that high expression of HDAC1, CASP3, REST, HMG20B, FZD7,GNAI3, FZD1 and EPHB4 was associated with worse OS, DSS and PFI, whereas high expression of KCNJ9 and SCRT1 suggested better OS, DSS and PFI (Figures 8A–J; Supplementary Figures S3A–J, S4A–J). ROC analysis further validated the good diagnostic capabilities of these 10 hub genes in glioma (Figures 9A–J). In summary, this comprehensive analysis not only revealed potential regulatory networks with TGIF2 in glioma but also highlighted a promising gene cluster for prognostic assessment. Integrating these hub genes with TGIF2 may enhance the accuracy of prognostic predictions in glioma patients.
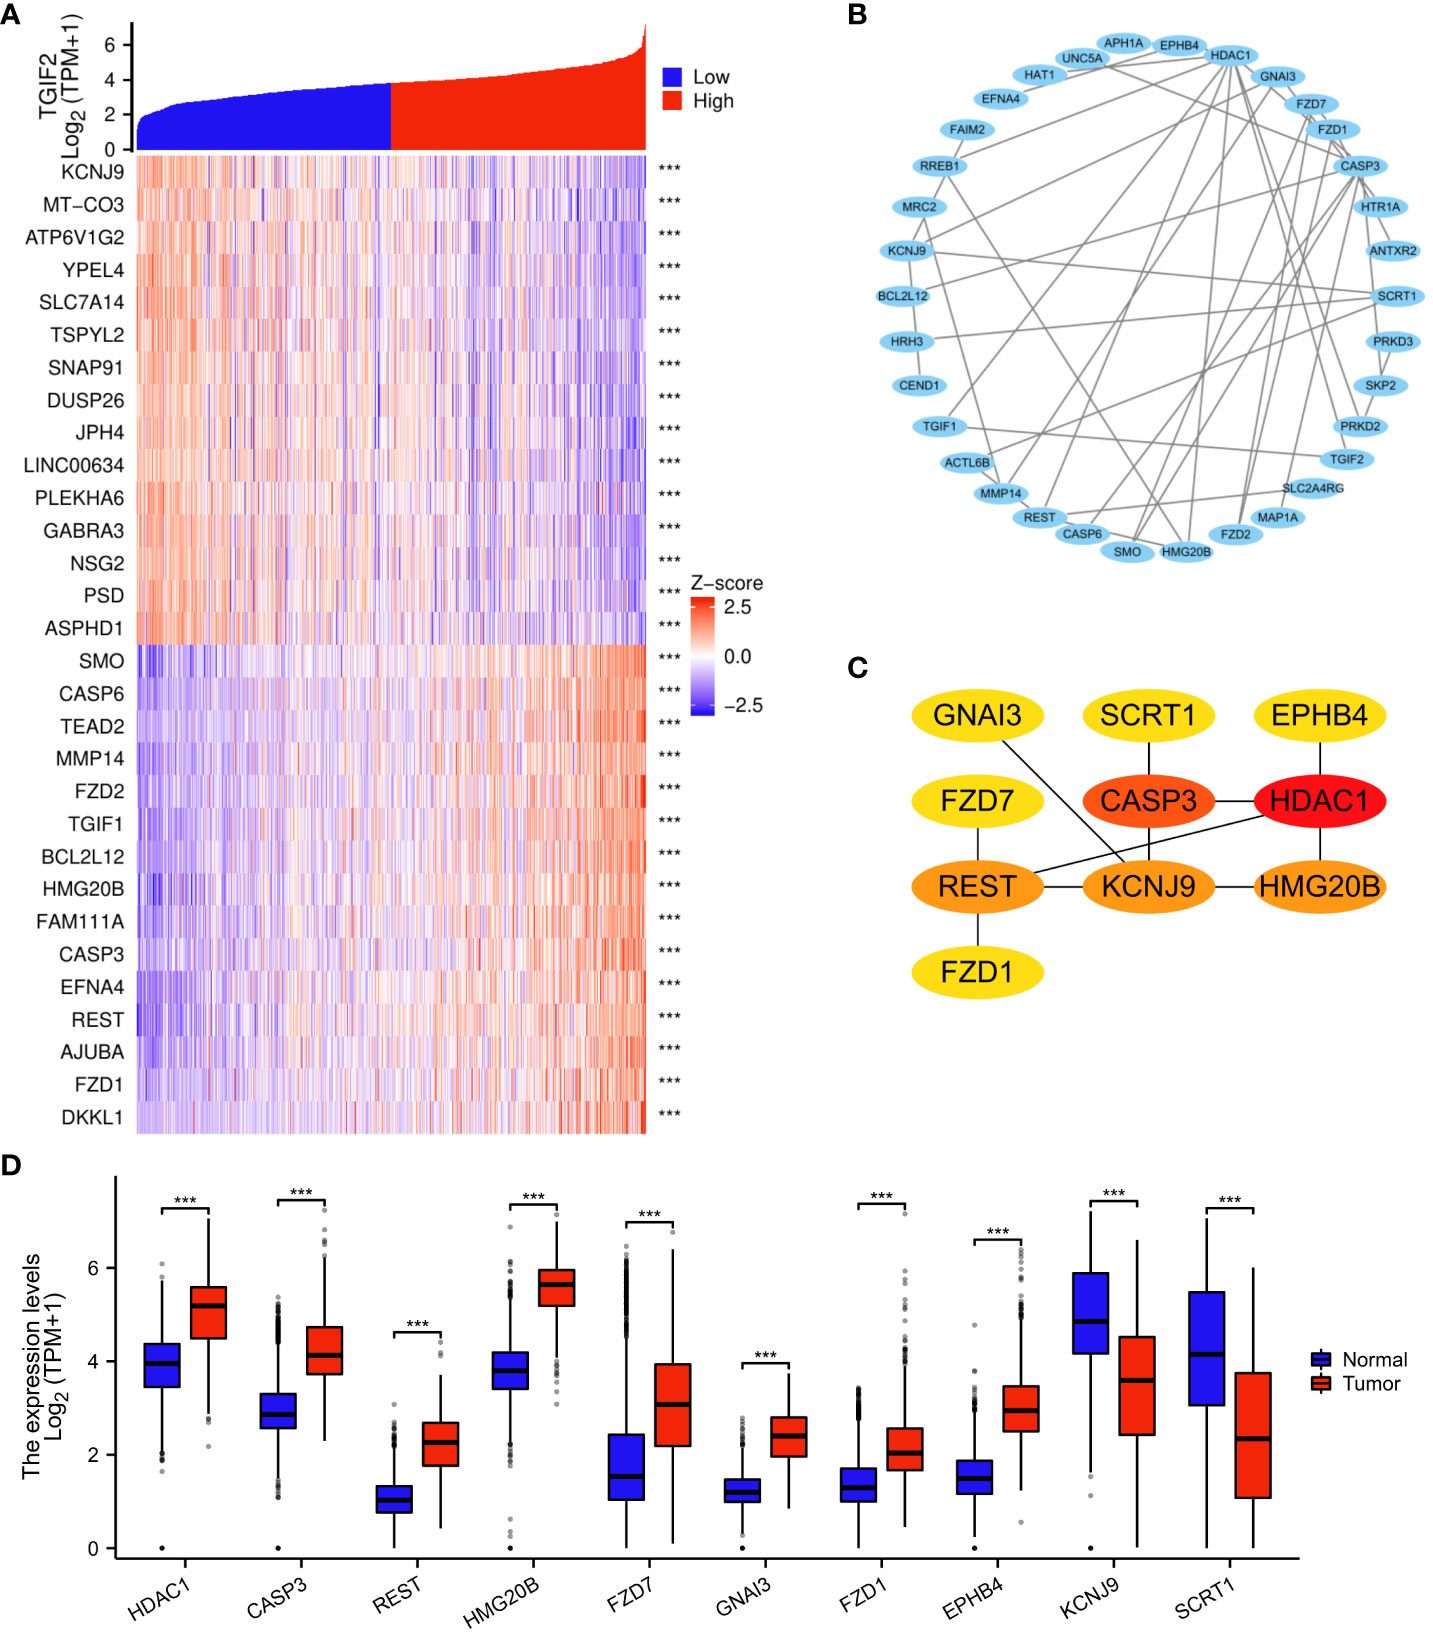
Figure 7 Analysis of genes coexpressed with TGIF2 in glioma. (A) Heatmap showing the 30 genes in glioma that were 15 positively and 15 negatively related to TGIF2. (B) PPI network of top 50 protein-coding genes positively and negatively correlated with TGIF2. (C) The top 10 hub genes of the PPI network in (B). (D) The expression levels of the top 10 hub genes in normal and glioma tissues in TCGA and GTEx database. ∗∗∗p < 0.001.
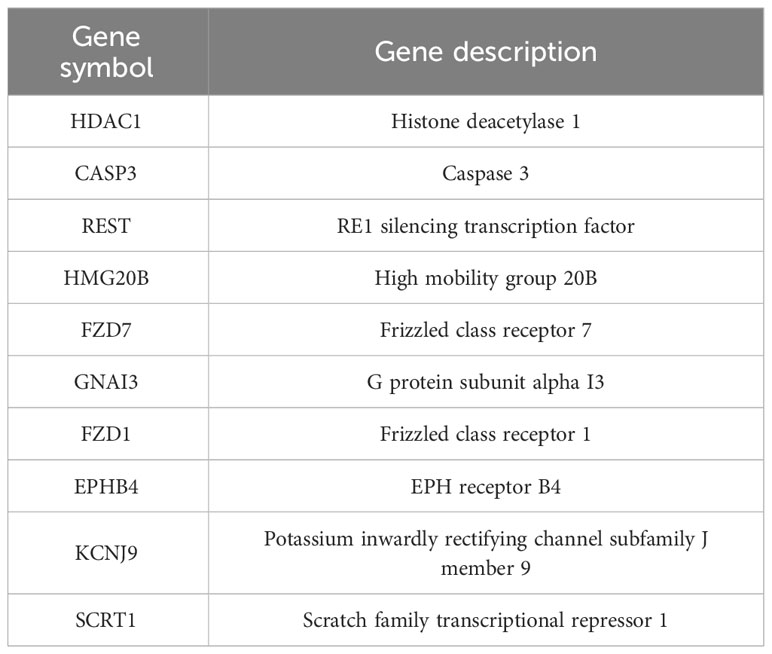
Table 4 The top 10 hub genes identified in the PPI network.
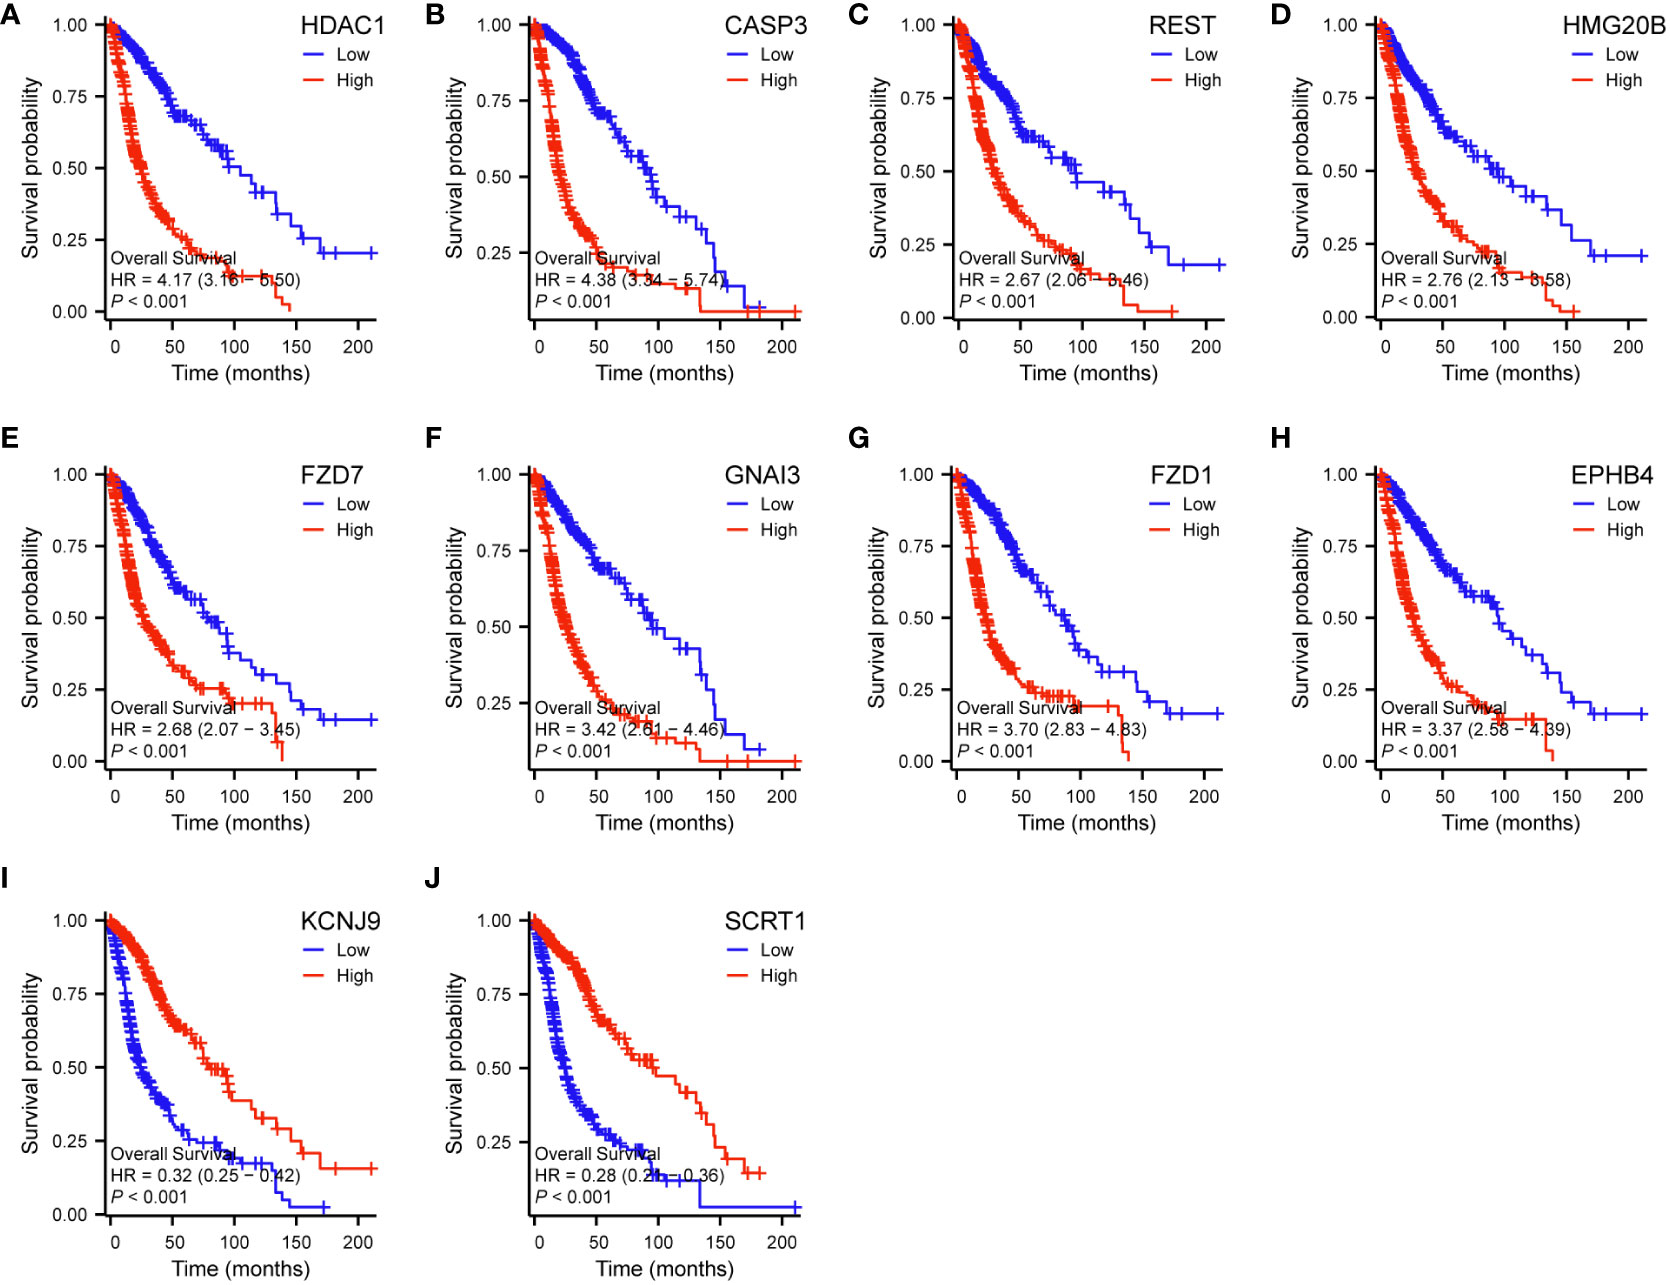
Figure 8 Correlations between the top 10 hub genes and OS of glioma patients in TCGA database by Kaplan-Meier survival curve analysis. (A) HDAC1. (B) CASP3. (C) REST. (D) HMG20B. (E) FZD7. (F) GNAI3. (G) FZD1. (H) EPHB4. (I) KCNJ9. (J) SCRT1.
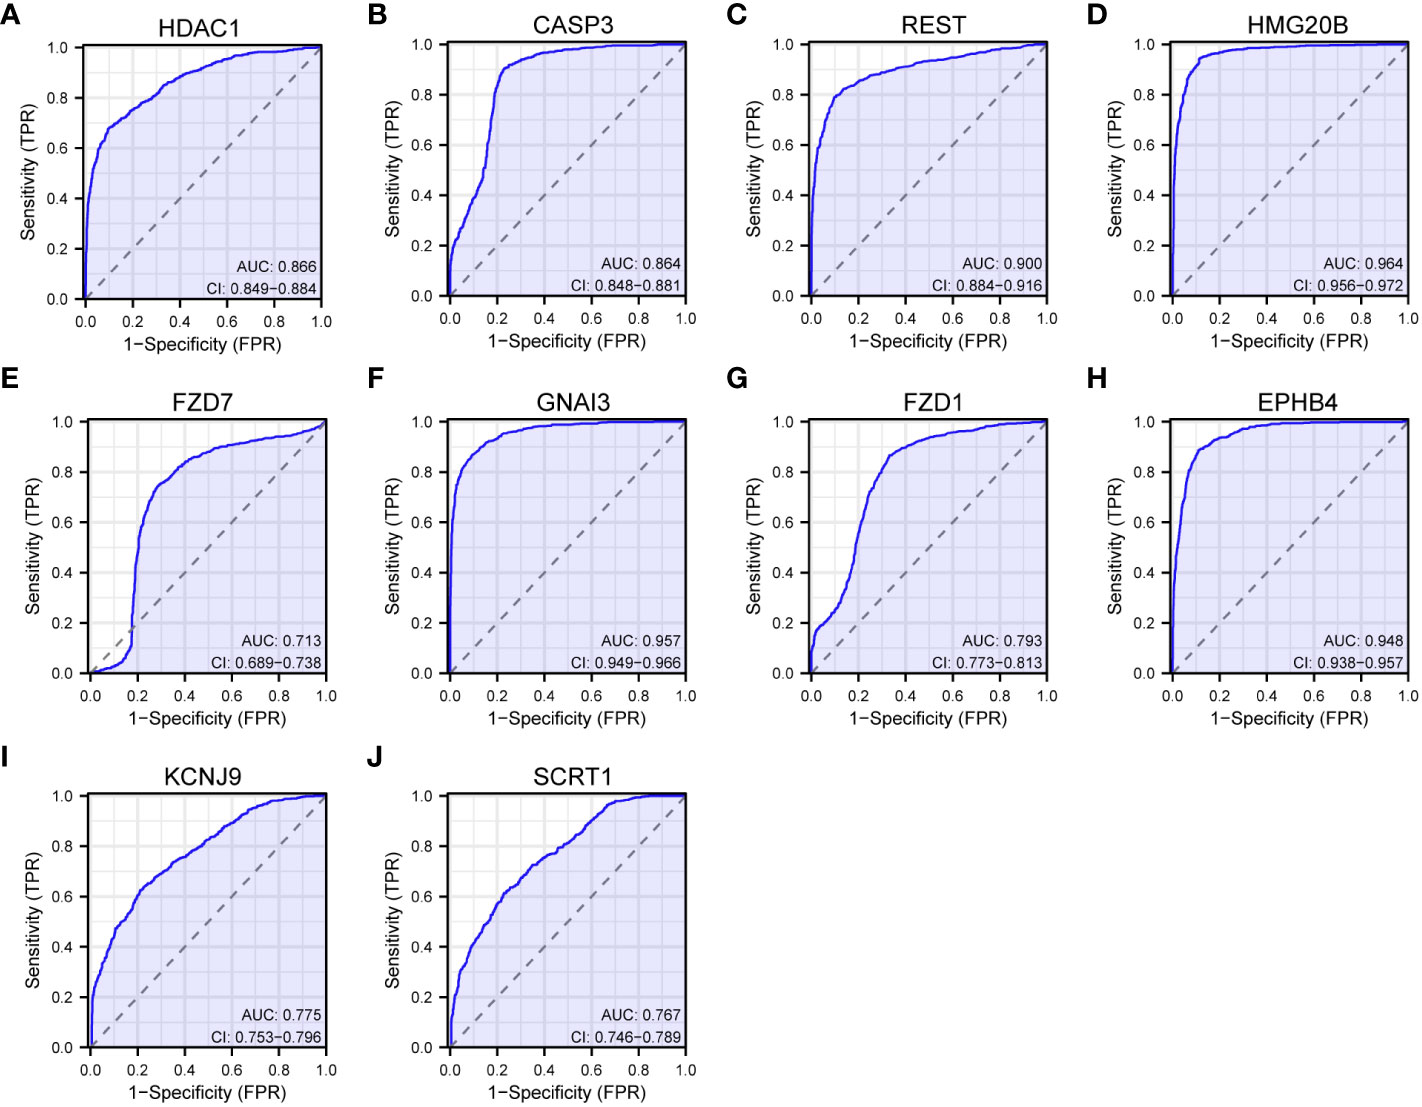
Figure 9 ROC curves of the top 10 hub genes. (A) HDAC1. (B) CASP3. (C) REST. (D) HMG20B. (E) FZD7. (F) GNAI3. (G) FZD1. (H) EPHB4. (I) KCNJ9. (J) SCRT1.
We explored the function of TGIF2 in vitro. Initially, we employed siRNA to knock down TGIF2 expression in the U251 glioma cell line. Both RT-qPCR and Western blot analyses confirmed the efficacy of TGIF2 knockdown, ensuring the reliability of subsequent experiments (Figures 10A, B). Subsequent transwell assays and scratch wound-healing assays revealed that TGIF2 inhibition suppressed the invasion and migration of U251 cells (Figures 10C, D). Furthermore, our investigations revealed a downregulation of N-Cadherin, a well-established marker of EMT, in the TGIF2-inhibited group (Figure 10B). This observation suggests that TGIF2 may play a role in promoting the EMT phenotype, thereby influencing glioma cell invasion and migration through the regulation of N-Cadherin expression. We used CRISPR/Cas9 gene editing to further validate the function of TGIF2. We designed gRNA sequences gRNA33 and gRNA140 targeting exon 2 of TGIF2, cloned them into the CRISPER Cas9 plasmid PX459 and verified the editing efficiency on TGIF2 (Figure 11A). Next, we transfected the PX459-gRNA33 plasmid, which was effective in editing TGIF2, into glioma U251 cells, and screened for TGIF2 knockout cell lines using Sanger sequencing (Figures 11B, C). Western blot analyses verified the knockout efficiency for TGIF2 of the PX459-gRNA33 plasmid in U251 cells (Figure 11D). Subsequently, transwell assays and scratch wound-healing assays showed that knockout of TGIF2 inhibited invasion and migration of U251 cells (Figures 11E, F). In addition, the expression of the signature genes of EMT (CDH2, TWIST1 and TWIST2) were also suppressed in the TGIF2-knockout group (Supplementary Figure S6). These results strengthen the evidence that TGIF2 promotes glioma cell invasion, migration and EMT.
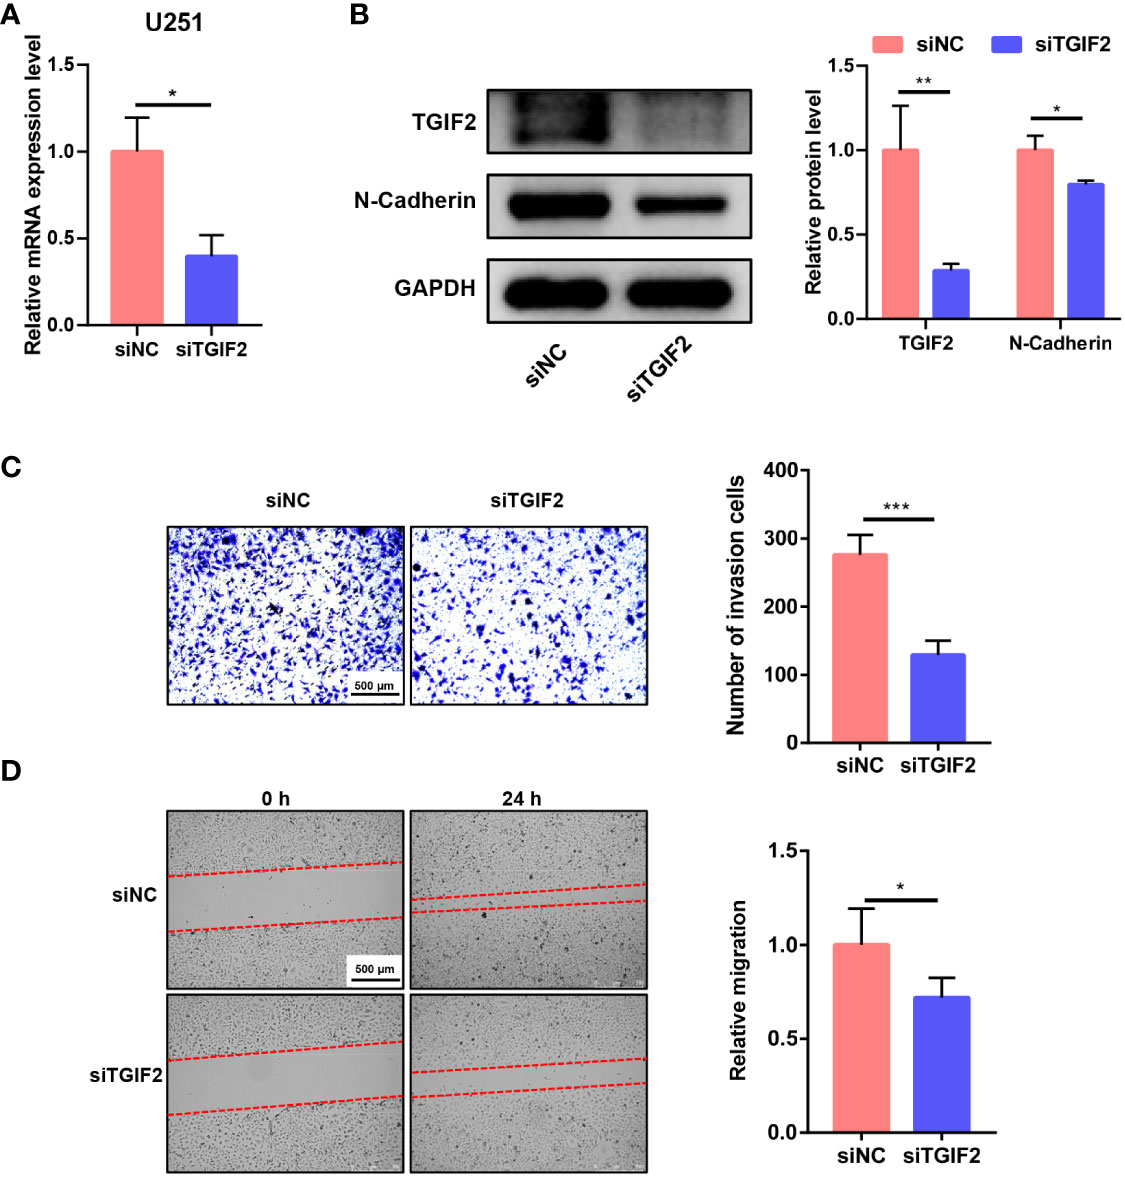
Figure 10 Knockdown of TGIF2 inhibits glioma cell invasion, migration and EMT in vitro. (A) Bar graph demonstrating the efficiency of siRNA knockdown of TGIF2 mRNA in U251 cells by RT-qPCR. (B) Western blot assay showing that siRNA effectively knocked down TGIF2 protein, and siTGIF2 downregulated N-cadherin protein expression in U251 cells. (C) Transwell assay demonstrating changes in the number of cells invaded after knockdown of TGIF2. Scale bar, 500 μm. (D) Scratch wound-healing assays were utilized to compare the distance of cell migration between TGIF2-inhibited group and control group at 0h and 24h after scratching. Scale bar, 500 μm. ∗p < 0.05, ∗∗p < 0.01, ∗∗∗p < 0.001.

Figure 11 Knockout of TGIF2 suppresses glioma cell invasion, migration and EMT. (A) The gRNA sequences designed targeting exon 2 of TGIF2. (B) The editing efficiency of gRNA33 and gRNA140 on TGIF2 was verified in 293T cells utilizing Sanger sequencing. (C) TGIF2-gRNA33 in the UCSC browser. (D) Western blot assay showing the knockout efficiency of TGIF2 protein. WT, Wild type; KO, Knockout. (E) Transwell assays showing changes in the number of cells invaded after knockout of TGIF2. Scale bar, 500 μm. (F) Scratch wound-healing assays were utilized to compare the distance of cell migration between TGIF2-knockout group and control group at 0h and 24h after scratching. Scale bar, 250 μm. ∗p < 0.05.
Glioma, recognized as the most lethal adult intracranial primary tumor with low overall survival rates (1), continues to pose formidable challenges despite advancements in treatment modalities (35). There is an imperative need for novel early diagnostic and prognostic targets to address the pressing need for glioma treatment. Numerous studies have been devoted to exploring biomarkers in order to open new avenues for glioma treatment (28–30, 36, 37). The 1p/19q codeletion and IDH mutation emerged as the initial biomarkers, widely employed in clinical glioma diagnosis and have been associated with a variety of prognostic factors to establish effective clinical prediction model (38–40). In this study, we focus on the transcription factor TGIF2 and propose for the first time its potential as a promising diagnostic and prognostic target for glioma. Our investigation demonstrated that TGIF2 expression significantly surpasses normal tissue levels in gliomas and correlates with adverse prognosis and malignant phenotypes. We established high TGIF2 expression as an independent risk factor for OS in glioma patients, as validated by multivariate Cox regression analysis. Moreover, we constructed a prognostic nomogram model of TGIF2 versus age, 1p/19q codeletion, histological type, and primary therapy outcome, enhancing the accuracy of predicting glioma risk factors for future clinical applications. Survival analysis across various clinicopathologic subgroups consistently demonstrated the significant association of TGIF2 with poor OS, DSS and PFI, underscoring its effective prognostic value. These findings collectively advocate TGIF2 as a promising biomarker for both diagnosing and predicting outcomes in glioma patients, offering potential avenues for improved therapeutic strategies and patient care.
To further elucidate the biological function of TGIF2 in glioma development, we divided glioma patients into high and low expression groups based on the median TGIF2 expression, analyzed the differentially expressed genes in the two groups, and performed functional enrichment analysis. Cell hyperproliferation is a common characteristic of the vast majority of tumors, and consistently, we observed multiple items related to cell cycle and DNA synthesis and repair associated with high TGIF2 expression. In addition, our attention was drawn to several ECM-related items. Elevated expression of ECM components creates an impermeable microenvironment for glioma to evade drug and immune attacks, and contributes to tumor cell migration and invasion (41). The positive correlation between the high expression of ECM and TGIF2 suggests that TGIF2 may be involved in the formation of the ECM and thus promote the migration and invasion of glioma cells. In addition, signaling pathways closely related to tumorigenesis, such as Jak Stat signaling pathway (42), Notch signaling pathway (43), and Pi3k akt signaling pathway (44) were associated with increased expression of TGIF2. Notably, NOTCH signaling was reported to be associated with EMT, and the promotion of EMT in glioma cell by TGIF2 has been reported in glioma (21, 45), speculating a potential regulatory crosstalk between TGIF2 and NOTCH signaling. These findings suggest that TGIF2 may play a multifaceted role in glioma progression, influencing processes such as cell cycle regulation, ECM formation, and engagement with key signaling pathways. These insights contribute to a deeper understanding of TGIF2’s impact on glioma development and progression.
The tumor immune microenvironment plays a crucial role in glioma progression and therapy response (46). Immune infiltration is intricately linked to the immune escape of tumor cells and exerts regulatory control over the remodeling of the tumor microenvironment. Immunotherapy, which removes tumor cells by altering or modulating the autoimmune system, has emerged as a powerful anticancer strategy compared to conventional therapies such as surgery, radiotherapy and chemotherapy. Several immunotherapeutic approaches have shown promise in glioma, including immune checkpoint inhibitors (ICIs), cancer vaccines, adoptive cell transfer (ACT), CAR-T cell therapy, and more (47). Additionally, the integration of nanomaterials, such as dendrimers, multifunctional nano-adjuvants, and nanoprobes, has expanded the possibilities in cancer immunotherapy (48–50). Approaches like near-infrared photoimmunotherapy have even progressed to the clinical study stage (51). Despite these advancements, each immunotherapeutic strategy has its limitations, and there is a continued need to explore and understand the intricate regulation of the glioma immune microenvironment. In this study, functional enrichment analysis showed that high TGIF2 expression was positively correlated with immune-related pathways such as chemokines, cytokines, interleukins, inflammation, toll like receptor and Pd 1. Notably, PD-L1 expression in glioma has been associated with WHO classification, positioning it as a potential biomarker (52, 53). The enrichment of the Pd-1 signaling pathway suggested a potential involvement of TGIF2 in the regulation of the PD-1/PD-L1 axis. This signaling axis is a critical component of immune checkpoint regulation and can influence the immune response against tumors. To further explore the relationship between TGIF2 and tumor immunity, we analyzed the infiltration level of immune cells in the microenvironment of glioma tumors. Our results showed that TGIF2 was positively correlated with Th2, macrophages, eosinophils and neutrophils, etc., while displaying a negative correlation with mast cells, NK CD56bright cells, pDC, and TFH, etc. The balance of Th1/Th2 is an important mechanism leading to immune evasion of tumors (54, 55), therefore, TGIF2-mediated Th2 enrichment may be one of the potential factors for tumor cells to evade immune surveillance. On the contrary, TFH cells were associated with anti-tumor immunity (56), and the negative correlation observed between TGIF2 and TFH cells suggests a potential contribution of TGIF2 to tumor immune escape. The implications of these findings underscore the potential importance of TGIF2 in shaping the glioma immune microenvironment. However, the precise role and underlying mechanisms necessitate further elucidation through dedicated biological experiments.
We constructed a PPI network of the top 50 genes positively and negatively correlated with TGIF2 respectively and identified 10 hub genes (HDAC1, CASP3, REST, HMG20B, FZD7, GNAI3, FZD1, EPHB4, KCNJ9, SCRT1) which have good diagnostic ability in glioma. Among them, high expression of HDAC1, CASP3, REST, HMG20B, FZD7, GNAI3, FZD1 and EPHB4 were associated with worse OS, DSS and PFI, while high expression of KCNJ9 and SCRT1 suggested better OS, DSS and PFI. Consistent with our results, high expression of HDAC1, CASP3, REST, GNAI3, FZD1, EPHB4 was found to correlate with poor prognosis of glioma, and inhibitors of HDAC1 inhibited the EMT process in glioma cells thereby affecting cell migration and invasion (57–62). FZD7, linked to glioma cell motility and invasiveness, aligns with our observation of TGIF2 promoting glioma cell migration (63). Collectively, these results suggest a potential co-regulation of migration and invasion in glioma by TGIF2 and these identified hub genes.
Although this study demonstrated an association between TGIF2 and glioma, there are still some limitations and shortcomings of this study. Since we utilized transcriptome sequencing data included in public databases and patients’ clinicopathologic information for bioinformatics analysis, there were certain biases caused by confounding factors, and future prospective studies will be helpful in this regard. Meanwhile, our study needs more clinical samples to validate the aberrant expression of TGIF2 to improve reliability. In addition, combined with previous studies, our in vitro experiments have provided a preliminary exploration of the role of TGIF2 in glioma migration, invasion and EMT, and the specific mechanisms and more functions in glioma need to be further investigated.
In conclusion, our results suggest that TGIF2 can be used as a promising new indicator for predicting the malignant phenotypes and clinical prognosis of glioma patients, and correlates with immune infiltration and EMT phenotype.
The datasets presented in this study can be found in online repositories. The names of the repository/repositories and accession number(s) can be found in the article/Supplementary Material.
Ethical approval was not required for the studies on humans in accordance with the local legislation and institutional requirements because only commercially available established cell lines were used.
WZ: Writing – original draft, Conceptualization, Data curation, Investigation, Methodology, Project administration, Software, Visualization, Writing – review & editing. LZ: Writing – review & editing, Data curation, Supervision, Funding acquisition. HD: Writing – review & editing, Investigation, Methodology, Validation. HP: Conceptualization, Supervision, Validation, Visualization, Writing – original draft, Writing – review & editing, Project administration.
The author(s) declare financial support was received for the research, authorship, and/or publication of this article. This study was supported by the Fundamental Research Funds for the Central Universities (xzy012022114).
We thank Mr. An Yan for his contributions to some of the R code writing work.
The authors declare that the research was conducted in the absence of any commercial or financial relationships that could be construed as a potential conflict of interest.
All claims expressed in this article are solely those of the authors and do not necessarily represent those of their affiliated organizations, or those of the publisher, the editors and the reviewers. Any product that may be evaluated in this article, or claim that may be made by its manufacturer, is not guaranteed or endorsed by the publisher.
The Supplementary Material for this article can be found online at: https://www.frontiersin.org/articles/10.3389/fimmu.2024.1356833/full#supplementary-material
1. Saunders CN, Cornish AJ, Kinnersley B, Law PJ, Claus EB, Il'yasova D, et al. Lack of association between modifiable exposures and glioma risk: A mendelian randomization analysis. Neuro Oncol. (2020) 22:207–15. doi: 10.1093/neuonc/noz209
2. Lapointe S, Perry A, Butowski NA. Primary brain tumours in adults. Lancet. (2018) 392:432–46. doi: 10.1016/S0140-6736(18)30990-5
3. Zhang Y, Ni S, Huang B, Wang L, Zhang X, Li X, et al. Overexpression of sclip promotes growth and motility in glioblastoma cells. Cancer Biol Ther. (2015) 16:97–105. doi: 10.4161/15384047.2014.987037
4. Liu J, Guo S, Li Q, Yang L, Xia Z, Zhang L, et al. Phosphoglycerate dehydrogenase induces glioma cells proliferation and invasion by stabilizing forkhead box M1. J Neurooncol. (2013) 111:245–55. doi: 10.1007/s11060-012-1018-x
5. Hu Y, Yu H, Shaw G, Renfree MB, Pask AJ. Differential roles of tgif family genes in mammalian reproduction. BMC Dev Biol. (2011) 11:58. doi: 10.1186/1471-213X-11-58
6. Spagnoli FM, Brivanlou AH. The gata5 target, tgif2, defines the pancreatic region by modulating bmp signals within the endoderm. Development. (2008) 135:451–61. doi: 10.1242/dev.008458
7. Melhuish TA, Gallo CM, Wotton D. Tgif2 interacts with histone deacetylase 1 and represses transcription. J Biol Chem. (2001) 276:32109–14. doi: 10.1074/jbc.M103377200
8. Cerda-Esteban N, Naumann H, Ruzittu S, Mah N, Pongrac IM, Cozzitorto C, et al. Stepwise reprogramming of liver cells to a pancreas progenitor state by the transcriptional regulator tgif2. Nat Commun. (2017) 8:14127. doi: 10.1038/ncomms14127
9. Jiang J, Wu RH, Zhou HL, Li ZM, Kou D, Deng Z, et al. Tgif2 promotes cervical cancer metastasis by negatively regulating fcmr. Eur Rev Med Pharmacol Sci. (2020) 24:5953–62. doi: 10.26355/eurrev_202006_21488
10. Du R, Shen W, Liu Y, Gao W, Zhou W, Li J, et al. Tgif2 promotes the progression of lung adenocarcinoma by bridging egfr/ras/erk signaling to cancer cell stemness. Signal Transduct Target Ther. (2019) 4:60. doi: 10.1038/s41392-019-0098-x
11. Zhao M, Su Z, Zhang S, Zhuang L, Xie Y, Li X. Suppressive role of microrna-148a in cell proliferation and invasion in ovarian cancer through targeting transforming growth factor-beta-induced 2. Oncol Res. (2016) 24:353–60. doi: 10.3727/096504016X14685034103275
12. Du R, Wang C, Liu J, Wang K, Dai L, Shen W. Phosphorylation of tgif2 represents a therapeutic target that drives emt and metastasis of lung adenocarcinoma. BMC Cancer. (2023) 23:52. doi: 10.1186/s12885-023-10535-9
13. Pan Y, Wang J, He L, Zhang F. Microrna-34a promotes emt and liver fibrosis in primary biliary cholangitis by regulating tgf-beta1/smad pathway. J Immunol Res. (2021) 2021:6890423. doi: 10.1155/2021/6890423
14. Li D, Shen C, Liu L, Hu J, Qin J, Dai L, et al. Pkm2 regulates cigarette smoke-induced airway inflammation and epithelial-to-mesenchymal transition via modulating pink1/parkin-mediated mitophagy. Toxicology. (2022) 477:153251. doi: 10.1016/j.tox.2022.153251
15. Hamabe A, Konno M, Tanuma N, Shima H, Tsunekuni K, Kawamoto K, et al. Role of pyruvate kinase M2 in transcriptional regulation leading to epithelial-mesenchymal transition. Proc Natl Acad Sci U.S.A. (2014) 111:15526–31. doi: 10.1073/pnas.1407717111
16. Zhiping C, Shijun T, Linhui W, Yapei W, Lianxi Q, Qiang D. Mir-181a promotes epithelial to mesenchymal transition of prostate cancer cells by targeting tgif2. Eur Rev Med Pharmacol Sci. (2017) 21:4835–43.
17. Yang Y, Ren P, Liu X, Sun X, Zhang C, Du X, et al. Ppp1r26 drives hepatocellular carcinoma progression by controlling glycolysis and epithelial-mesenchymal transition. J Exp Clin Cancer Res. (2022) 41:101. doi: 10.1186/s13046-022-02302-8
18. Diao Y, Jin B, Huang L, Zhou W. Mir-129-5p inhibits glioma cell progression in vitro and in vivo by targeting tgif2. J Cell Mol Med. (2018) 22:2357–67. doi: 10.1111/jcmm.13529
19. Xu W, Xue R, Xia R, Liu WW, Zheng JW, Tang L, et al. Sevoflurane impedes the progression of glioma through modulating the circular rna has_Circ_0012129/mir-761/tgif2 axis. Eur Rev Med Pharmacol Sci. (2020) 24:5534–48. doi: 10.26355/eurrev_202005_21339
20. Zhang K, Wang Q, Zhao D, Liu Z. Circular rna circmmp1 contributes to the progression of glioma through regulating tgif2 expression by sponging mir-195-5p. Biochem Genet. (2022) 60:770–89. doi: 10.1007/s10528-021-10119-x
21. Vinchure OS, Sharma V, Tabasum S, Ghosh S, Singh RP, Sarkar C, et al. Polycomb complex mediated epigenetic reprogramming alters tgf-beta signaling via a novel ezh2/mir-490/tgif2 axis thereby inducing migration and emt potential in glioblastomas. Int J Cancer. (2019) 145:1254–69. doi: 10.1002/ijc.32360
22. Bindea G, Mlecnik B, Tosolini M, Kirilovsky A, Waldner M, Obenauf AC, et al. Spatiotemporal dynamics of intratumoral immune cells reveal the immune landscape in human cancer. Immunity. (2013) 39:782–95. doi: 10.1016/j.immuni.2013.10.003
23. Thorsson V, Gibbs DL, Brown SD, Wolf D, Bortone DS, Ou Yang TH, et al. The immune landscape of cancer. Immunity. (2018) 48:812–30 e14. doi: 10.1016/j.immuni.2018.03.023
24. Chang K, Bai HX, Zhou H, Su C, Bi WL, Agbodza E, et al. Residual convolutional neural network for the determination of idh status in low- and high-grade gliomas from mr imaging. Clin Cancer Res. (2018) 24:1073–81. doi: 10.1158/1078-0432.CCR-17-2236
25. Yan H, Parsons DW, Jin G, McLendon R, Rasheed BA, Yuan W, et al. Idh1 and idh2 mutations in gliomas. N Engl J Med. (2009) 360:765–73. doi: 10.1056/NEJMoa0808710
26. Saadeh FS, Mahfouz R, Assi HI. Egfr as a clinical marker in glioblastomas and other gliomas. Int J Biol Markers. (2018) 33:22–32. doi: 10.5301/ijbm.5000301
27. Cho SY, Park C, Na D, Han JY, Lee J, Park OK, et al. High prevalence of tp53 mutations is associated with poor survival and an emt signature in gliosarcoma patients. Exp Mol Med. (2017) 49:e317. doi: 10.1038/emm.2017.9
28. Wang F, Zhao F, Zhang L, Xiong L, Mao Q, Liu Y, et al. Cdc6 is a prognostic biomarker and correlated with immune infiltrates in glioma. Mol Cancer. (2022) 21:153. doi: 10.1186/s12943-022-01623-8
29. Zhu C, Zhao Y, Zheng W. Cdc14b is a favorable biomarker for recurrence and prognosis of gbm. Clin Neurol Neurosurg. (2023) 227:107665. doi: 10.1016/j.clineuro.2023.107665
30. Xu L, Shao F, Luo T, Li Q, Tan D, Tan Y. Pan-cancer analysis identifies chd5 as a potential biomarker for glioma. Int J Mol Sci. (2022) 23. doi: 10.3390/ijms23158489
31. Pei Z, Lee KC, Khan A, Erisnor G, Wang HY. Pathway analysis of glutamate-mediated, calcium-related signaling in glioma progression. Biochem Pharmacol. (2020) 176:113814. doi: 10.1016/j.bcp.2020.113814
32. Griffin M, Khan R, Basu S, Smith S. Ion channels as therapeutic targets in high grade gliomas. Cancers (Basel). (2020) 12. doi: 10.3390/cancers12103068
33. Arvind S, Arivazhagan A, Santosh V, Chandramouli BA. Differential expression of a novel voltage gated potassium channel–kv 1.5 in astrocytomas and its impact on prognosis in glioblastoma. Br J Neurosurg. (2012) 26:16–20. doi: 10.3109/02688697.2011.583365
34. Wang R, Gurguis CI, Gu W, Ko EA, Lim I, Bang H, et al. Ion channel gene expression predicts survival in glioma patients. Sci Rep. (2015) 5:11593. doi: 10.1038/srep11593
35. Cheng Z, Li Z, Ma K, Li X, Tian N, Duan J, et al. Long non-coding rna xist promotes glioma tumorigenicity and angiogenesis by acting as a molecular sponge of mir-429. J Cancer. (2017) 8:4106–16. doi: 10.7150/jca.21024
36. Qu S, Huang C, Zhu T, Wang K, Zhang H, Wang L, et al. Olfml3, as a potential predictor of prognosis and therapeutic target for glioma, is closely related to immune cell infiltration. VIEW. (2023) 4:20220052. doi: 10.1002/VIW.20220
37. Liu Y, Yao R, Shi Y, Liu Y, Liu H, Liu J, et al. Identification of cd101 in glioma: A novel prognostic indicator expressed on M2 macrophages. Front Immunol. (2022) 13:845223. doi: 10.3389/fimmu.2022.845223
38. Qu S, Qiu O, Hu Z. The prognostic factors and nomogram for patients with high-grade gliomas. Fundam Res. (2021) 1:824–8. doi: 10.1016/j.fmre.2021.07.005
39. Ostrom QT, Gittleman H, Truitt G, Boscia A, Kruchko C, Barnholtz-Sloan JS. Cbtrus statistical report: primary brain and other central nervous system tumors diagnosed in the United States in 2011-2015. Neuro Oncol. (2018) 20:iv1–iv86. doi: 10.1093/neuonc/noy131
40. Wesseling P, Capper D. Who 2016 classification of gliomas. Neuropathol Appl Neurobiol. (2018) 44:139–50. doi: 10.1111/nan.12432
41. Mohiuddin E, Wakimoto H. Extracellular matrix in glioblastoma: opportunities for emerging therapeutic approaches. Am J Cancer Res. (2021) 11:3742–54.
42. Swiatek-MaChado K, Kaminska B. Stat signaling in glioma cells. Adv Exp Med Biol. (2020) 1202:203–22. doi: 10.1007/978-3-030-30651-9_10
43. Stockhausen MT, Kristoffersen K, Poulsen HS. Notch signaling and brain tumors. Adv Exp Med Biol. (2012) 727:289–304. doi: 10.1007/978-1-4614-0899-4_22
44. Shahcheraghi SH, Tchokonte-Nana V, Lotfi M, Lotfi M, Ghorbani A, Sadeghnia HR. Wnt/beta-catenin and pi3k/akt/mtor signaling pathways in glioblastoma: two main targets for drug design: A review. Curr Pharm Des. (2020) 26:1729–41. doi: 10.2174/1381612826666200131100630
45. Wang Z, Li Y, Kong D, Sarkar FH. The role of notch signaling pathway in epithelial-mesenchymal transition (Emt) during development and tumor aggressiveness. Curr Drug Targets. (2010) 11:745–51. doi: 10.2174/138945010791170860
46. Yang K, Wu Z, Zhang H, Zhang N, Wu W, Wang Z, et al. Glioma targeted therapy: insight into future of molecular approaches. Mol Cancer. (2022) 21:39. doi: 10.1186/s12943-022-01513-z
47. Rui R, Zhou L, He S. Cancer immunotherapies: advances and bottlenecks. Front Immunol. (2023) 14:1212476. doi: 10.3389/fimmu.2023.1212476
48. Gao Y, Shen M, Shi X. Interaction of dendrimers with the immune system: an insight into cancer nanotheranostics. VIEW. (2021) 2:20200120. doi: 10.1002/VIW.20200120
49. Zhu H, Yang C, Yan A, Qiang W, Ruan R, Ma K, et al. Tumor-targeted nano-adjuvants to synergize photomediated immunotherapy enhanced antitumor immunity. VIEW. (2023) 4:20220067. doi: 10.1002/VIW.20220067
50. Bian Y, Wang Y, Chen X, Zhang Y, Xiong S, Su D. Image-guided diagnosis and treatment of glioblastoma. VIEW. (2023) 4:20220069. doi: 10.1002/VIW.20220069
51. Monaco H, Yokomizo S, Choi HS, Kashiwagi S. Quickly evolving near-infrared photoimmunotherapy provides multifaceted approach to modern cancer treatment. VIEW. (2022) 3:20200110. doi: 10.1002/VIW.20200110
52. Chen RQ, Liu F, Qiu XY, Chen XQ. The prognostic and therapeutic value of pd-L1 in glioma. Front Pharmacol. (2018) 9:1503. doi: 10.3389/fphar.2018.01503
53. Wang Z, Zhang C, Liu X, Wang Z, Sun L, Li G, et al. Molecular and clinical characterization of pd-L1 expression at transcriptional level via 976 samples of brain glioma. Oncoimmunology. (2016) 5:e1196310. doi: 10.1080/2162402X.2016.1196310
54. Murakami H, Ogawara H, Hiroshi H. Th1/th2 cells in patients with multiple myeloma. Hematology. (2004) 9:41–5. doi: 10.1080/10245330310001652437
55. Zhao X, Liu J, Ge S, Chen C, Li S, Wu X, et al. Saikosaponin a inhibits breast cancer by regulating th1/th2 balance. Front Pharmacol. (2019) 10:624. doi: 10.3389/fphar.2019.00624
56. Cicalese MP, Salek-Ardakani S, Fousteri G. Editorial: follicular helper T cells in immunity and autoimmunity. Front Immunol. (2020) 11:1042. doi: 10.3389/fimmu.2020.01042
57. Cheng Z, Li S, Yuan J, Li Y, Cheng S, Huang S, et al. Hdac1 mediates epithelial-mesenchymal transition and promotes cancer cell invasion in glioblastoma. Pathol Res Pract. (2023) 246:154481. doi: 10.1016/j.prp.2023.154481
58. Chao B, Jiang F, Bai H, Meng P, Wang L, Wang F. Predicting the prognosis of glioma by pyroptosis-related signature. J Cell Mol Med. (2022) 26:133–43. doi: 10.1111/jcmm.17061
59. Li C, Wang Z, Tang X, Zeng L, Fan X, Li Z. Molecular mechanisms and potential prognostic effects of rest and rest4 in glioma (Review). Mol Med Rep. (2017) 16:3707–12. doi: 10.3892/mmr.2017.7071
60. Raza A, Yen MC, Anuraga G, Shahzadi I, Mazhar MW, Ta HDK, et al. Comparative analysis of the gnai family genes in glioblastoma through transcriptomics and single-cell technologies. Cancers (Basel). (2023) 15. doi: 10.3390/cancers15205112
61. Huang K, Xu H, Han L, Xu R, Xu Z, Xie Y. Identification of therapeutic targets and prognostic biomarkers among frizzled family genes in glioma. Front Mol Biosci. (2022) 9:1054614. doi: 10.3389/fmolb.2022.1054614
62. Tu Y, He S, Fu J, Li G, Xu R, Lu H, et al. Expression of ephrinb2 and ephb4 in glioma tissues correlated to the progression of glioma and the prognosis of glioblastoma patients. Clin Transl Oncol. (2012) 14:214–20. doi: 10.1007/s12094-012-0786-2
Keywords: TGIF2, biomarker, glioma, immune infiltration, EMT
Citation: Zhang W, Zhang L, Dong H and Peng H (2024) TGIF2 is a potential biomarker for diagnosis and prognosis of glioma. Front. Immunol. 15:1356833. doi: 10.3389/fimmu.2024.1356833
Received: 16 December 2023; Accepted: 09 February 2024;
Published: 26 February 2024.
Edited by:
Mariana Magalhães, University of Coimbra, PortugalReviewed by:
Shanqiang Qu, Southern Medical University, ChinaCopyright © 2024 Zhang, Zhang, Dong and Peng. This is an open-access article distributed under the terms of the Creative Commons Attribution License (CC BY). The use, distribution or reproduction in other forums is permitted, provided the original author(s) and the copyright owner(s) are credited and that the original publication in this journal is cited, in accordance with accepted academic practice. No use, distribution or reproduction is permitted which does not comply with these terms.
*Correspondence: Hang Peng, aGFuZ3BlbmcyMUAxMjYuY29t; Long Zhang, bG9uZ3poYW5nQHhqdHUuZWR1LmNu
Disclaimer: All claims expressed in this article are solely those of the authors and do not necessarily represent those of their affiliated organizations, or those of the publisher, the editors and the reviewers. Any product that may be evaluated in this article or claim that may be made by its manufacturer is not guaranteed or endorsed by the publisher.
Research integrity at Frontiers
Learn more about the work of our research integrity team to safeguard the quality of each article we publish.