 Chao Tang
 Xiaoyang Lei
 Yaqi Ding
 Yayu Ma
 Dian He
- Department of Neurology, Affiliated Hospital of Guizhou Medical University, Guiyang, Guizhou, China
Background: There is increasing evidence that the types of immune cells are associated with various neurodegenerative diseases. However, it is currently unclear whether these associations reflect causal relationships.
Objective: To elucidate the causal relationship between immune cells and neurodegenerative diseases, we conducted a two-sample Mendelian randomization (MR) analysis.
Materials and methods: The exposure and outcome GWAS data used in this study were obtained from an open-access database (https://gwas.mrcieu.ac.uk/), the study employed two-sample MR analysis to assess the causal relationship between 731 immune cell features and four neurodegenerative diseases, including Alzheimer’s disease (AD), Parkinson’s disease (PD), amyotrophic lateral sclerosis (ALS) and multiple sclerosis (MS). All immune cell data was obtained from Multiple MR methods were used to minimize bias and obtain reliable estimates of the causal relationship between the variables of interest and the outcomes. Instrumental variable selection criteria were restricted to ensure the accuracy and effectiveness of the causal relationship between species of immune cells and the risk of these neurodegenerative diseases.
Results: The study identified potential causal relationships between various immune cells and different neurodegenerative diseases. Specifically, we found that 8 different types of immune cells have potential causal relationships with AD, 1 type of immune cells has potential causal relationships with PD, 6 different types of immune cells have potential causal relationships with ALS, and 6 different types of immune cells have potential causal relationships with MS.
Conclusion: Our study, through genetic means, demonstrates close causal associations between the specific types of immune cells and AD, PD, ALS and MS, providing useful guidance for future clinical researches.
1 Introduction
Neurodegenerative diseases (NDs) are a heterogeneous group of complex diseases characterized by neuronal loss and progressive degeneration of different areas of the nervous system, with an increasing incidence rate (1). These diseases result in a range of clinical neurological impairments, mainly including motor dysfunction and declining cognitive abilities. Alzheimer’s disease (AD), Parkinson’s disease (PD), and amyotrophic lateral sclerosis (ALS) are three of the major NDs (2). Multiple sclerosis (MS) is a chronic autoimmune and inflammatory disease that affects the central nervous system (CNS). Nowadays, MS is also identified to be a neurodegenerative disease (3).
The exact causes of NDs are not entirely clear, but genetic, environmental, and lifestyle factors may all play a role in their onset. Recent research suggests that the immune response in the CNS plays a crucial role in the development of these diseases (4). It was previously believed that the CNS was excluded from immune cell activity, forming the concept of “immune privilege,” but it is now recognized that there is indeed an immune response within the CNS (5). In the pathological states of various NDs, the dysfunction of immune cells is closely associated with disease progression (6). For example, the reduction of Treg cells persistently induces a pro-inflammatory environment, while the substantial infiltration of CD4+ lymphocytes is linked to the neurodegenerative process (7). Additionally, the increase in double-negative (IgG+IgD-CD27-) B cells is also associated with inflammatory responses, and B cells may be involved in the pathological processes of NDs through multiple pathways. For instance, they not only trigger inflammatory responses in the CNS and further affect the function of neurons and synapses, but also produce disease-related autoantibodies (8, 9). These findings have significantly contributed to a better understanding of the pathogenesis of NDs, providing important clues for future treatments and prevention. However, to date, research results on the association between immune cells and NDs have still been inconsistent, possibly due to limited sample sizes, flawed study designs, and confounding factors beyond the scope of existing research.
Mendelian randomization (MR) is an emerging analytical method used to explore causal relationships between exposures and outcomes (10). Typically, genetic variants closely associated with the level of exposure are used as instrumental variables (IVs) in MR to estimate these causal relationships. Unlike traditional randomized controlled trials, MR can identify potential causal factors for diseases (11), provide more information about whether specific factors are causes or outcomes of diseases, and determine whether modifying specific factors would be beneficial (12). MR has been widely applied in the studies of neurological diseases and has identified many pathogenic factors for different neurological diseases (13, 14).
In the current study, we will conduct a two-sample MR analysis to detect potential causal relationships between different types of immune cells and the risk of four NDs (including AD, PD, ALS and MS), with an aim to provide new possibilities for future treatment strategies. The dataset we analyzed was obtained from the assessment of various immune cell types in the European population using flow cytometry. The analyses involved absolute cell counts, median fluorescence intensity of surface antigens, and morphological parameters. These immune cell characteristics encompass a range of cell types, such as T cells, B cells, natural killer cells, dendritic cells, and monocytes (15).
2 Materials and methods
2.1 Study design
We conducted a two-sample MR analysis to assess the causal relationship between 731 immune cell characteristics (categorized into 7 groups) and four NDs. MR utilizes genetic variations as proxies for risk factors, and therefore, effective IVs must satisfy three key assumptions for causal inference: (1) genetic variation is directly associated with the exposure; (2) genetic variation is unrelated to potential confounders between the exposure and the outcome; (3) genetic variation does not influence the outcome through pathways other than the exposure (16).
In the study design, we employed various MR methods to minimize bias and obtain reliable estimates of the modifiable exposures of interest and their relationship with the outcomes. The experimental workflow is illustrated in Figure 1.
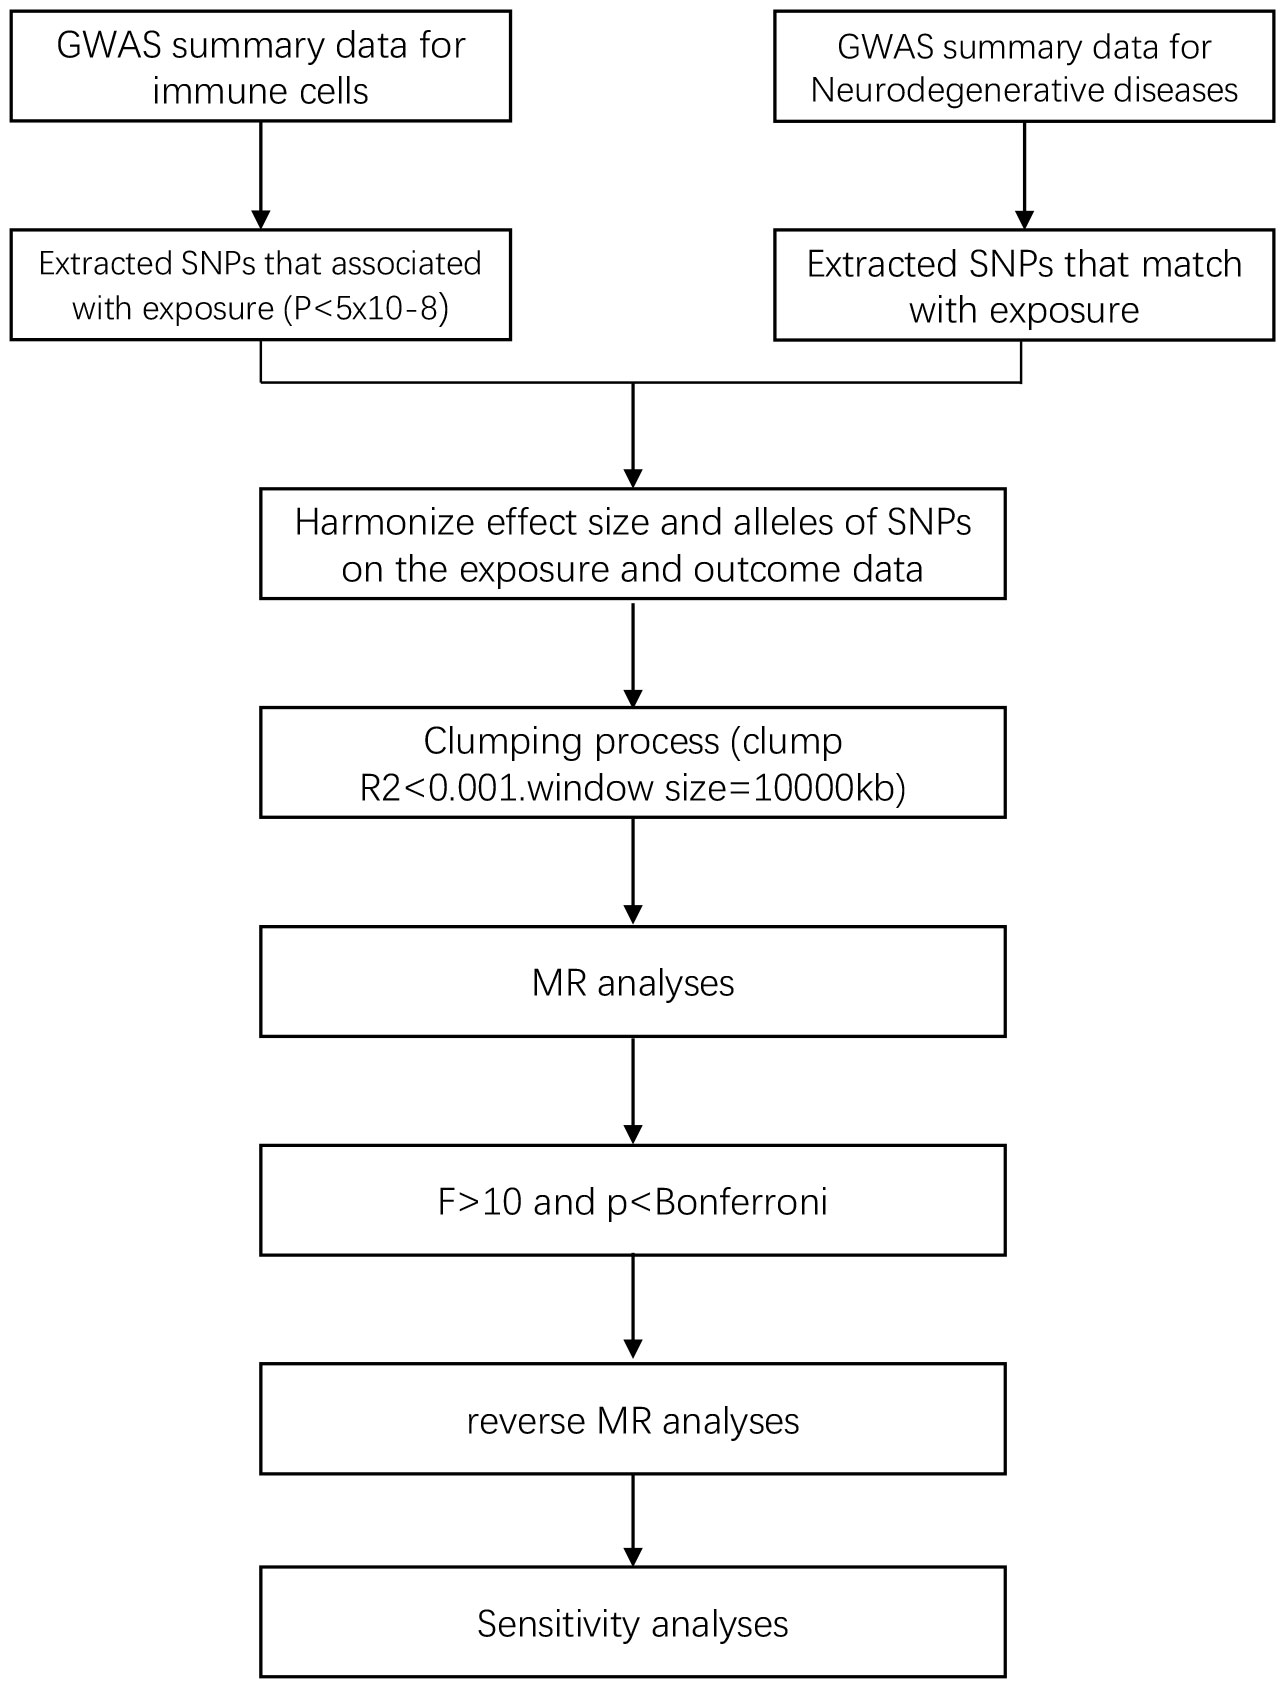
Figure 1 Flow chart of this study.
2.2 Data sources
2.2.1 Source of immune cell data
The immune cell GWAS data was derived from a study on genetic characteristics of immune cells. In this study, researchers conducted analyses of a large number of genetic variations to identify those associated with immune cell characteristics and further understand the impact of these variations on immune system function. The study involved 539 independent tests. Through these tests, the researchers tried to identify genetic variations associated with immune cell characteristics and further investigate the functionality and effects of these variations. By using flow cytometry for measurement, 731 immune cell phenotypes were grouped into four categories, including absolute cell counts (AC) (n = 118), median fluorescence intensity reflecting surface antigen levels (MFI) (n = 389), morphological parameters (MP) (n = 32), and relative cell counts (RC) (n = 192). Specifically, the 7 immune cell types studied in our research include T cells, B cells, dendritic cells (DCs), monocytes, other myeloid cells, natural killer cells, and Treg cells (15, 17).
2.2.2 Source of neurodegenerative disease data
The targeted NDs include AD, PD, MS, and ALS. The AD data was obtained from the first phase of the International Genomics of Alzheimer’s Project (IGAP), which conducted a meta-analysis study on new AD loci for 74,046 European participants. The first phase of the study involved a meta-analysis of new AD loci for 54,162 samples and 7,055,882 single nucleotide polymorphisms (SNP) (18). PD data was derived from the International Parkinson’s Disease Genomics Consortium, which conducted the largest and most recent Parkinson’s disease GWAS involving 482,730 European participants, comprising 482730 samples and 17,891,936 SNPs (19). ALS data was acquired from an association analysis of common and rare genetic variations in ALS, comprising 138,086 samples and 10,426,600 SNPs (20). MS data was gotten from the International Multiple Sclerosis Genetics Consortium’s study on immune-related loci for multiple sclerosis, comprising 38,589 samples and 156,632 SNPs (21). Detailed information of GWAS can be found in Table 1.
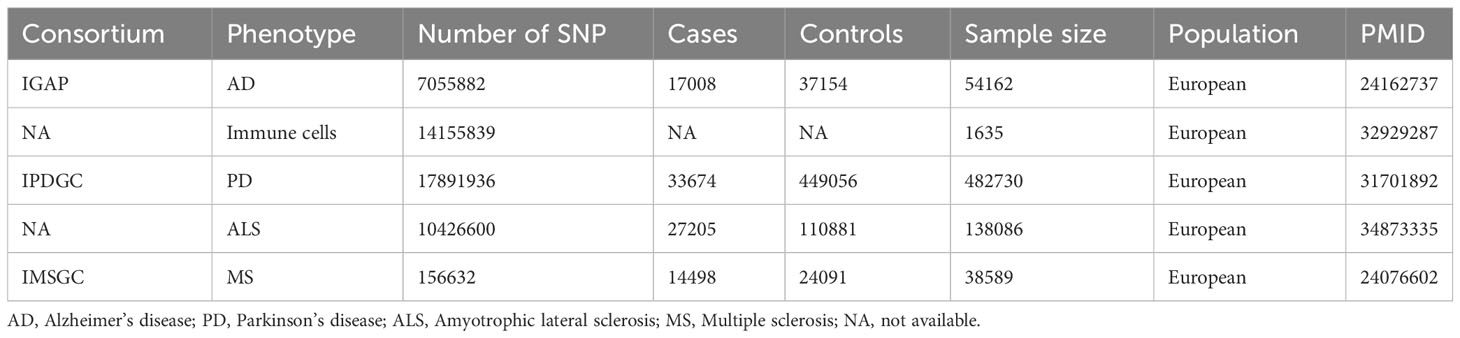
Table 1 Information fundamental for the inclusion of exposure and outcome data in GWAS.
2.3 Selection of IVs
We restricted the inclusion criteria for IVs to ensure the accuracy and effectiveness of the causal relationship between immune cells and the risk of NDs. Firstly, only SNPs with a P-value <5e-08 were included as exposure and outcome IVs in the MR study. Secondly, the Two Sample MR R package was used with the settings of r² = 0.001 and kb = 10000 to ensure the independence of the selected IVs and minimize violation of the random allele distribution resulted from linkage disequilibrium effects, only SNPs that meet the p-value criteria and have been cleared of linkage disequilibrium are eligible to match with exposure. In addition, to avoid bias from weak instrumental variables, we used the F-statistic to assess the statistical strength of the correlation between each SNP and the exposures. IVs with an F-statistic > 10 were considered strong instruments, while those with F < 10 were deemed to have a weak correlation between SNPs and the exposures. During each analysis, SNPs with palindromic structures were automatically excluded. The F-statistic was calculated using the formula F = R²/(1 - R²) * (N - K - 1)/K, where N represents the sample size of the exposure GWAS, K is the number of SNPs, R² is the proportion of variance explained by the SNPs in the exposure database, MAF is the minor allele frequency, which can be equivalent to the frequency of the effect allele, and β is the effect size of the allele (22).
We excluded SNPs with an F-statistic value less than 10, as an F-statistic value greater than 10 indicates sufficient strength to ensure the validity of the SNPs.
2.4 Statistical analysis
Mendelian Randomization (MR) is a method that uses genetic instruments to study causal relationships between modifiable exposures and outcomes. We employed five different MR methods for analyses. The Inverse Variance Weighted (IVW) method is one of the most effective causal effect estimation methods, especially suitable for situations where multiple genetic variants are used as IVs. It utilizes the associations between genetic variants and exposure and outcome to estimate causal effects, which can be obtained by performing a weighted average of the ratio estimates for each genetic variant (23). The weighted mode method is similar to IVW method but allows for consideration of correlation between genetic instruments and is used when employing a set of conservative genetic instruments (24). The weighted median method is a robust approach in MR and used to estimate the causal effect by calculating the median of the ratio estimates of genetic variants, and it is robust to outliers (25). The MR-Egger method estimates causal effects by performing a weighted regression of the ratio estimates for genetic variants and estimating the average pleiotropic effect by fitting a line. This method allows for all genetic variants to have pleiotropic effects, but requires that the pleiotropic effects are independent of the variant-exposure association (26). The Wald ratio test is used for samples with only one SNP (27). The statistics of the above five methods include p-values and OR values. When the p-value of the MR result is less than 0.05, it indicates an association between the exposure and the outcome. When the OR value is greater than 1, it signifies a positive association between the exposure and the outcome, meaning that an increase in the exposure factor leads to an increase in the risk factor of the outcome, and suggesting that the exposure may be a risk factor for the outcome. When the OR value is less than 1, it indicates a negative association between the exposure and the outcome, meaning that an increase in the exposure factor leads to a decrease in the risk factor of the outcome, and suggesting that the exposure may be a protective factor for the outcome. By employing the above five MR methods, we aimed to minimize bias and obtain reliable estimates of the causal relationship between the exposure of interest and the outcome.
For sensitivity analyses, heterogeneity was measured using the Cochran Q method (28). In cases of significant heterogeneity (p < 0.05), MR-Egger regression analysis was used to assess the potential pleiotropic inheritance of the SNPs used as IVs. In MR-Egger regression, the intercept term indicates directed horizontal pleiotropy at p < 0.05 (29). Leave-one-out analysis was performed by removing a genetic variant from the analysis and re-estimating the causal effect to assess the degree of dependence of the results on a specific variant. We also used the Bonferroni method for correction, and only results with p-values < the Bonferroni value was included in the final analysis. The Bonferroni correction formula is 0.05/(number of exposures included in the study * number of outcomes included in the study) (30). Finally, to explore whether a certain ND has any causal relationship with established important immune cells, we also conducted reverse MR analysis using SNPs related to NDs as IVs (i.e., using NDs as exposure and established immune cells as outcomes).
All statistical analyses in this study were conducted using the R software package (v4.2.1) in the R language application. The primary R package utilized was TwoSampleMR, with key functions including mr_egger_regression, mr_ivw, mr_weighted_median, and mr_wald_ratio, among others.
3 Results
3.1 Selection of IVs
After initial screening, there were 8 different types of immune cells with potential causal relationships with AD, 4 different types with PD, 8 different types with ALS, and 5 different types with MS. The F-statistic for all IVs was largely >10, indicating no evidence of weak instrument bias. After Bonferroni correction, the p-values were all below the Bonferroni threshold.
3.2 Causal effects of immune cells on AD
Our research results indicate that 8 types of immune cells show potential causal relationships with AD. Among them, both the abundance of CD33 on CD33dim HLA DR- and the surface expression of CD33 on immature myeloid-derived suppressor cells show a positive association with AD, indicating that an increase in the abundance of CD33 expression in these two different cell types would lead to an increased risk of AD. The other types of immune cells show a negative correlation. The IVW analysis results for all immune cells are as follows: CD33- HLA DR+ Absolute Count (p= 2.8E-06; OR 95%CI= 0.85 (0.80,0.91)), CD33 on CD33dim HLA DR- (p= 5.27E-05; OR 95%CI= 1.07 (1.04,1.11)), CD33 on Immature Myeloid-Derived Suppressor Cells (p= 7.68E-05; OR 95%CI= 1.07 (1.03,1.10)), HLA DR on CD14- CD16- (p= 1.13E-05; OR 95%CI= 0.86 (0.80,0.92)), CD45 on CD33- HLA DR+ (p= 6.80E-09; OR 95%CI= 0.79 (0.73,0.86)), HLA DR on plasmacytoid Dendritic Cell (p= 1.13E-05; OR 95%CI= 0.86 (0.80,0.92)), HLA DR on CD14- CD16- (p= 1.64E-05; OR 95%CI= 0.92 (0.89,0.96)), HLA DR on Dendritic Cell (p= 7.83E-05; OR 95%CI= 0.92 (0.88,0.96)), HLA DR on CD33- HLA DR+ (p=3.72E-05; OR 95%CI= 0.90 (0.85,0.94)). In the reverse MR results of immune cells and AD, all MR analysis p-values are greater than 0.05, indicating that AD has no effect on the included immune cells. The final result shows potential causal relationships between 8 types of immune cells and AD, as depicted in Figure 2.
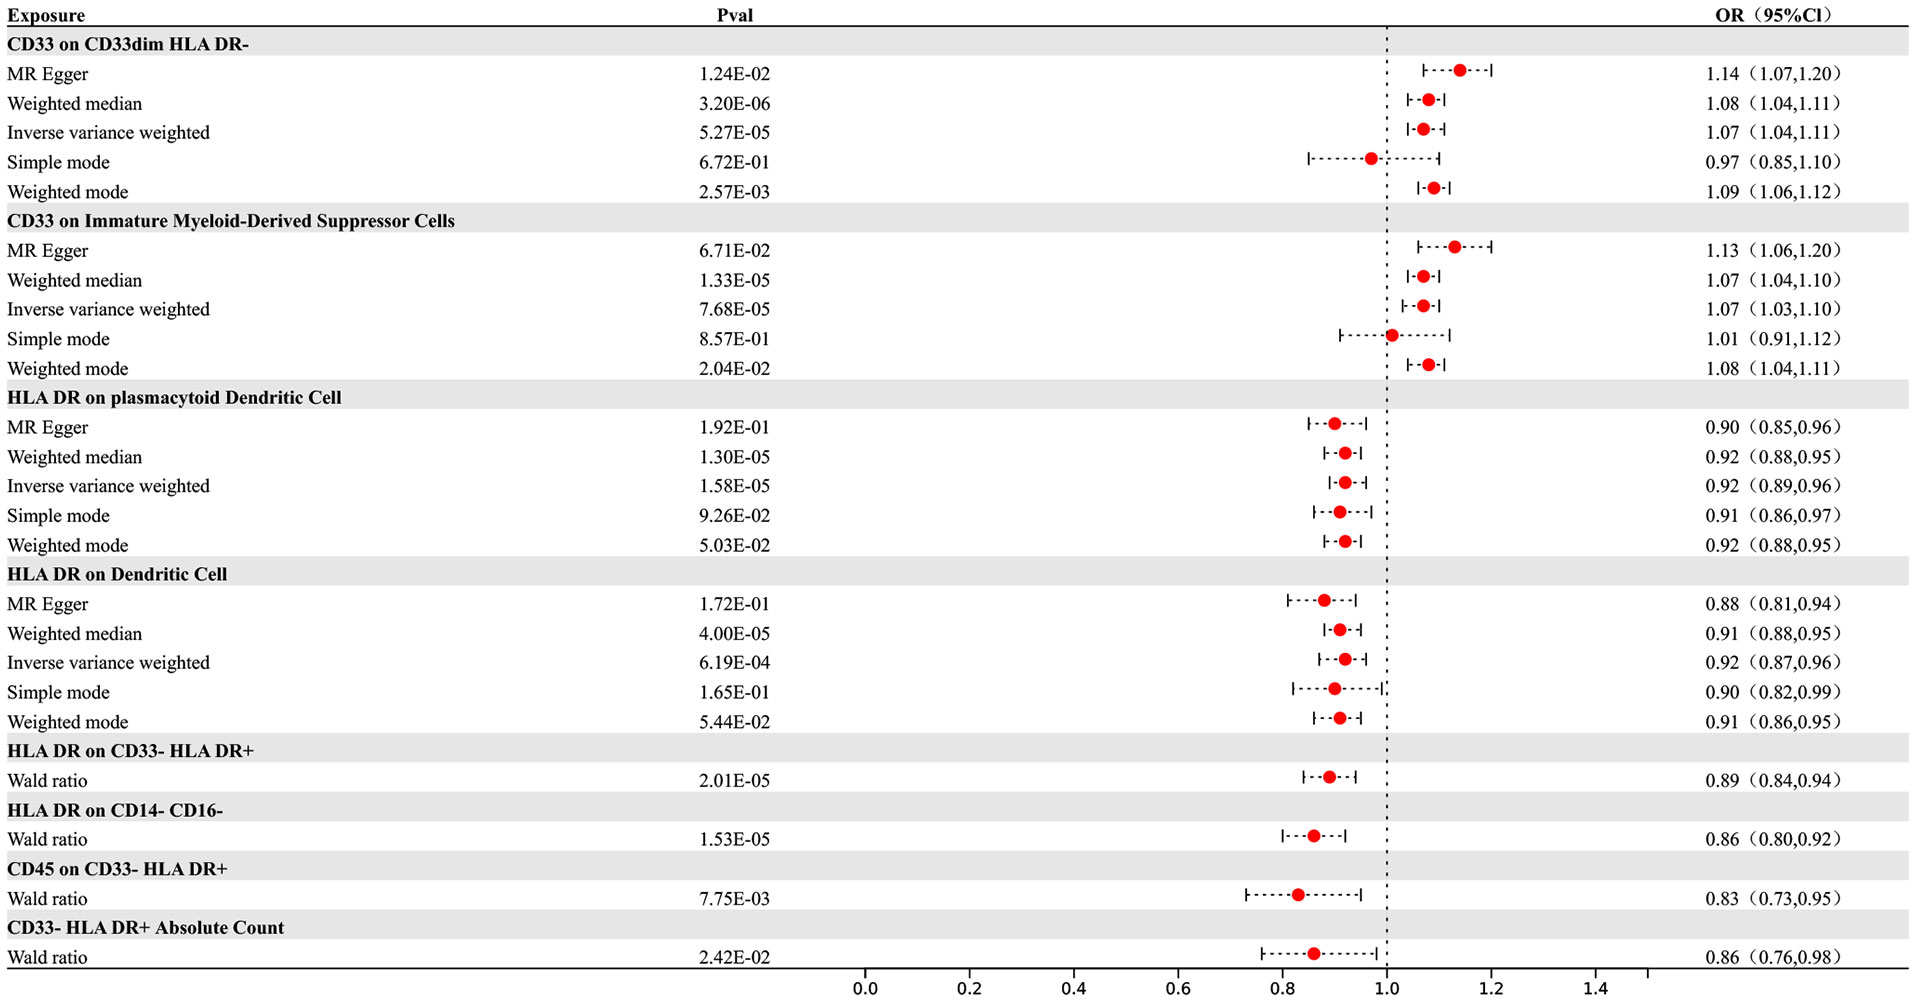
Figure 2 Forest map of MR results of Immune cells and AD, the forest plot shows the significant causal associations with P value < Bonferroni and the estimated OR with 95% confidence intervals (CI).
3.3 Causal effects of immune cells on PD
Our research findings indicate that there are 4 types of immune cells showing potential causal relationships with PD, among which CD11c on monocytes exhibits a positive association with PD. This result suggests that an increase in the abundance of CD11c on monocytes may lead to an increased risk of PD, while the others show negative correlations. The IVW analysis results for all types of immune cells are as follows: CX3CR1 on monocyte (p= 9.06E-07; OR 95%CI= 0.85 (0.79,0.91)), CX3CR1 on CD14+ CD16+ monocyte (p= 1.15E-06; OR 95%CI= 0.85 (0.80,0.91)), CX3CR1 on CD14+ CD16- monocyte (p= 8.66E-07; OR 95%CI= 0.86 (0.81,0.91)), CD11c on monocyte (p= 4.39E-05; OR 95%CI= 1.29 (1.14,1.46)). In the reverse MR results of immune cells and PD, PD shows causal relationships with three types of immune cells. They are the expression levels of CX3CR1 on monocytes, the expression levels of CX3CR1 on CD14+ CD16+ monocytes, and the expression levels of CX3CR1 on CD14+ CD16- monocytes. Their IVW results are as follows: CX3CR1 on monocyte (p= 3.38E-02; OR 95%CI= 0.90 (0.82,0.99)), CX3CR1 on CD14+ CD16+ monocyte (p= 2.67E-02; OR 95%CI= 0.91 (0.83,0.99)), CX3CR1 on CD14+ CD16- monocyte (p= 3.87E-02; OR 95%CI= 0.90 (0.81,0.99)). To rigorously control for confounding factors and avoid potential influence of PD on immune cells, we did not include immune cells with a causal relationship in the reverse MR for PD.
In the end, we found one type of immune cells that may have causal relationships with PD, as shown in Figure 3.
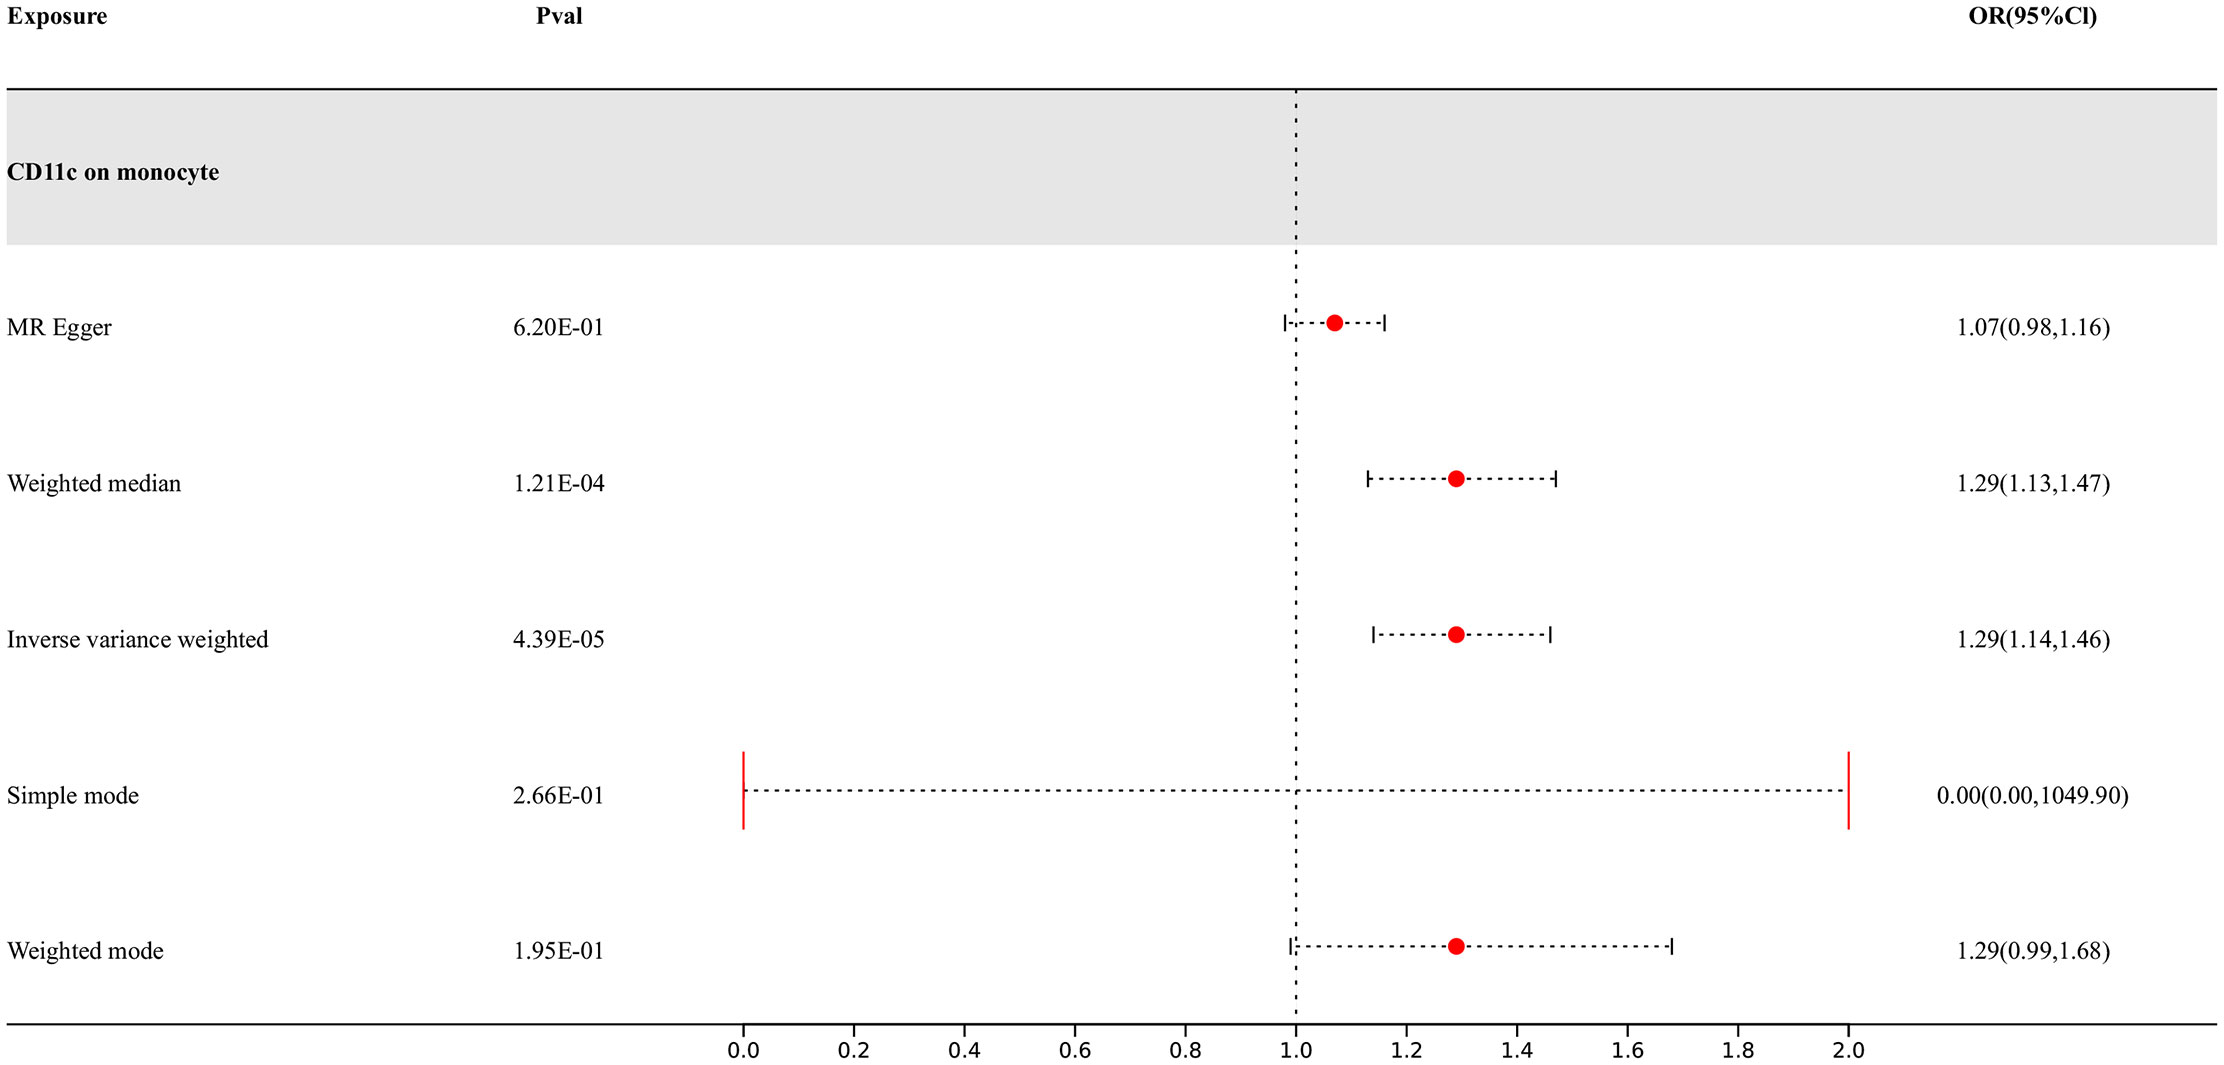
Figure 3 Forest map of MR results of Immune cells and PD, the forest plot shows the significant causal associations with P value < Bonferroni and the estimated OR with 95% confidence intervals (CI).
3.4 Causal effects of immune cells on ALS
Our study findings suggest that 8 types of immune cells have potential causal relationships with ALS. All types of immune cells included in our results demonstrate negative correlations with ALS, indicating that an increase in the abundance of surface markers expressed by these immune cells would reduce the risk of developing ALS. The IVW analysis results for all immune cells are as follows: CD3 on Effector Memory CD8+ T cell (p= 7.23E-06; OR 95%CI= 0.88 (0.84,0.93)), CD3 on Central Memory CD4+ T cell (p= 7.50E-07; OR 95%CI= 0.91 (0.88,0.95)), CD3 on CD45RA- CD4+ T cell (p= 2.08E-06; OR 95%CI= 0.91 (0.87,0.94)), CD3 on Central Memory CD8+ T cell (p= 8.55E-07; OR 95%CI= 0.88 (0.84,0.93)), CD3 on HLA DR+ CD4+ T cell (p= 1.99E-06; OR 95%CI= 0.89 (0.85,0.93)), CD3 on CD39+ secreting CD4 regulatory T cell (p= 1.90E-06; OR 95%CI= 0.91 (0.88,0.95)), CD3 on CD28- CD8+ T cell (p= 2.83E-05; OR 95%CI= 0.84 (0.78,0.91)), CD3 on CD4+ T cell (p= 3.17E-06; OR 95%CI= 0.89 (0.85,0.94)). In the reverse MR results of immune cells with ALS, there are causal relationships between ALS and two types of immune cells including the expression levels of CD3 on Effector Memory CD8+ T cells and the expression levels of CD3 on CD4+ T cells, with IVW results of the former (p= 3.79E-02; OR 95%CI= 0.78 (0.62,0.99)) and the latter (p= 3.77E-02; OR 95%CI= 0.81 (0.67,0.99)) correspondingly. Other results are detailed in the Supplementary Materials. To rigorously control for confounding factors and avoid potential influence of ALS on immune cells, we did not include immune cells with a causal relationship in the reverse MR for ALS. In the end, we have identified 6 types of immune cells having potential causal relationships with ALS. The results are presented in Figure 4.
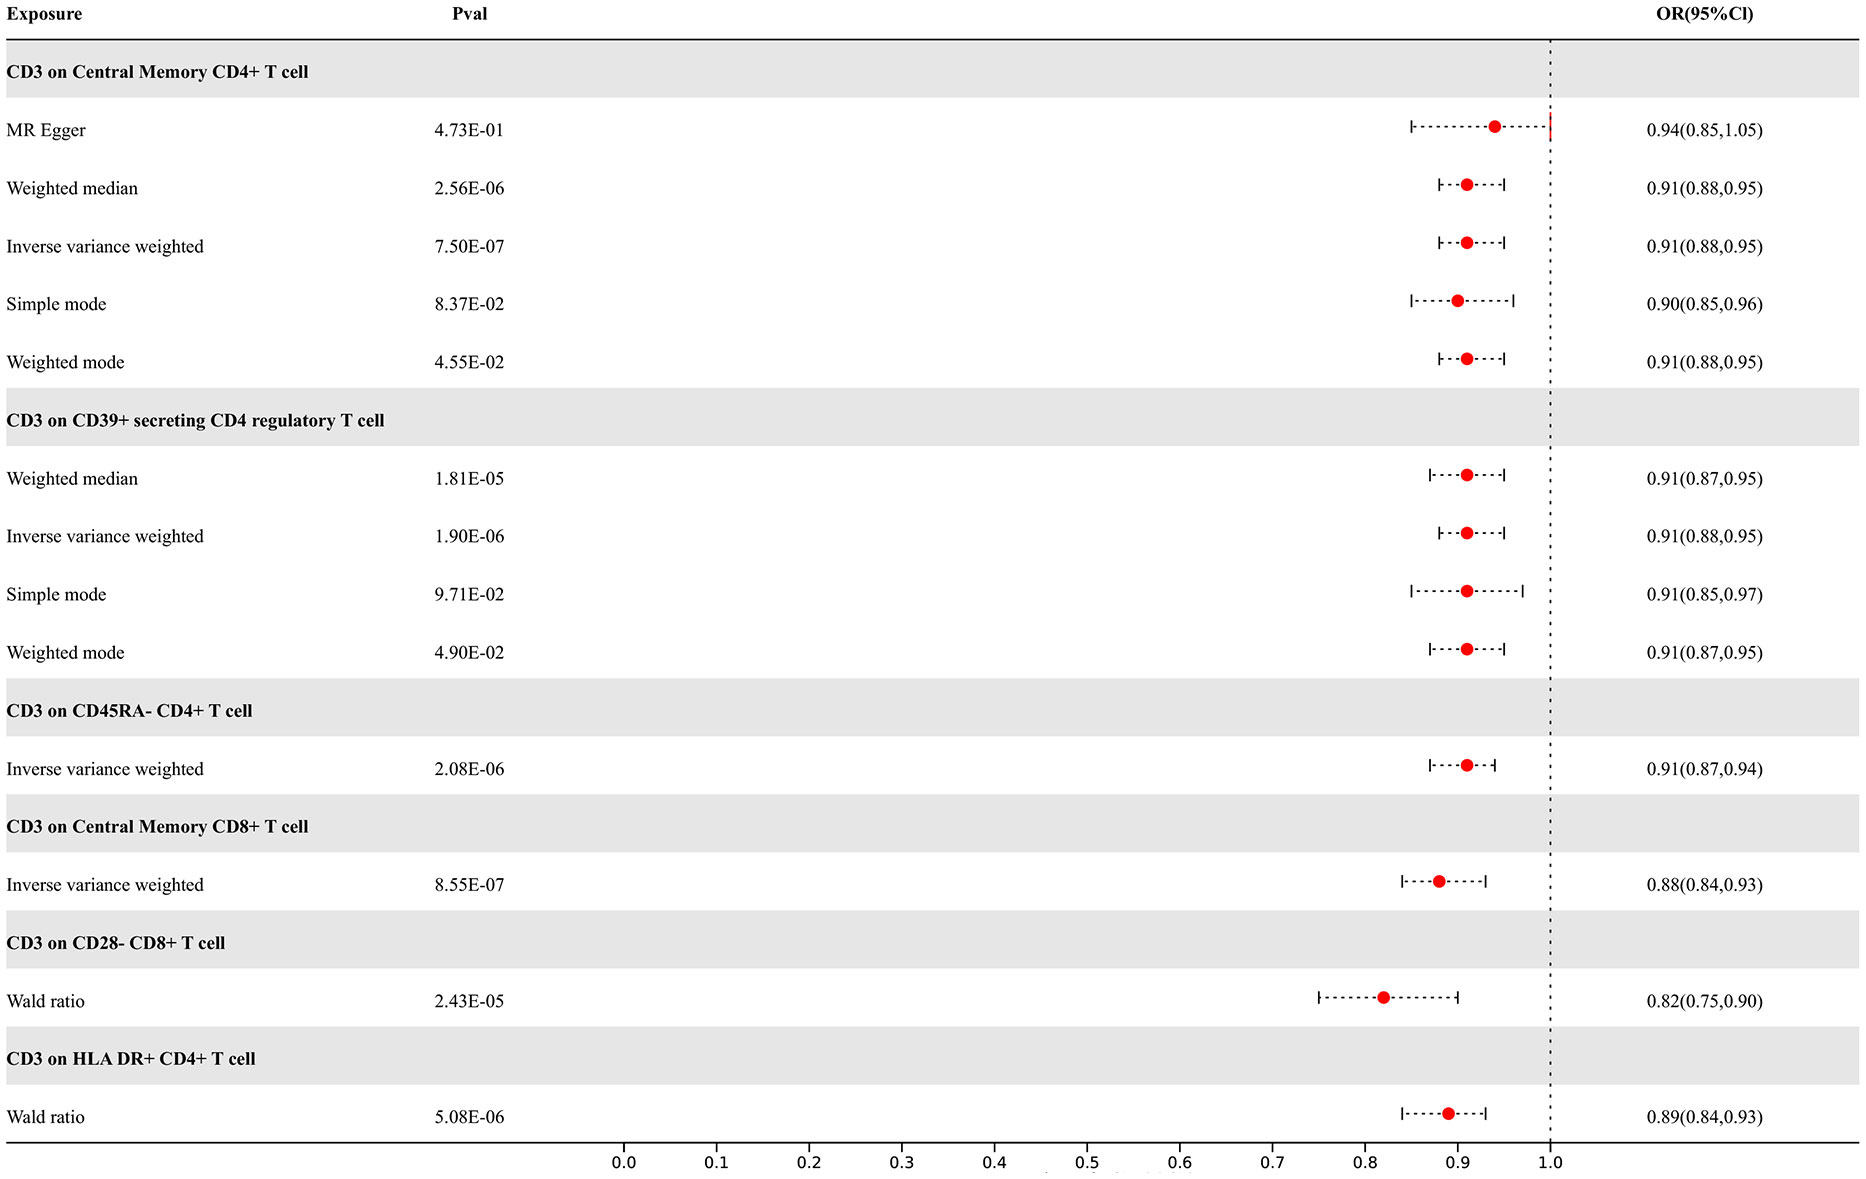
Figure 4 Forest map of MR results of Immune cells and ALS, the forest plot shows the significant causal associations with P value < Bonferroni and the estimated OR with 95% confidence intervals (CI).
3.5 Causal effects of immune cells on MS
Our study results indicate that 7 types of immune cells show potential causal relationships with MS. One is the CD25++ CD45RA- CD4 not regulatory T cell %CD4+ T cell type, which represents the percentage of CD25++ CD45RA- cells within CD4+ T cells. It exhibits a negative correlation with MS, indicating that an increase in the percentage of this specific type of activated T cell would reduce the risk of MS, while the others show positive associations. The IVW analysis results for all immune cells are as follows: CD25++ CD45RA- CD4 not regulatory T cell %CD4+ T cell (p= 3.71E-04; OR 95%CI= 0.89 (0.83,0.95)), CD27 on CD24+ CD27+ B cell (p= 1.11E-05; OR 95%CI= 1.05(1.05,1.18)), CD28 on secreting CD4 regulatory T cell (p= 1.71E-06; OR 95%CI= 1.26(1.14,1.38)), CD28 on CD45RA+ CD4+ T cell (p= 2.27E-10; OR 95%CI= 1.28(1.19,1.39)). In the reverse MR results of immune cells with MS, there are causal relationships between MS and one immune cell. The immunophenotype of this immune cell is the expression level of CD28 on CD45RA+ CD4+ T cells, with a positive IVW result (p=3.76E-02; OR 95%CI= 1.07(1.01,1.15)). Other results are detailed in the Supplementary Materials. To rigorously control for confounding factors and avoid potential influence of MS on immune cells, we did not include immune cells with a causal relationship in the reverse MR for MS. In the end, we have identified 6 types of immune cells having potential causal relationships with MS. The results are presented in Figure 5.
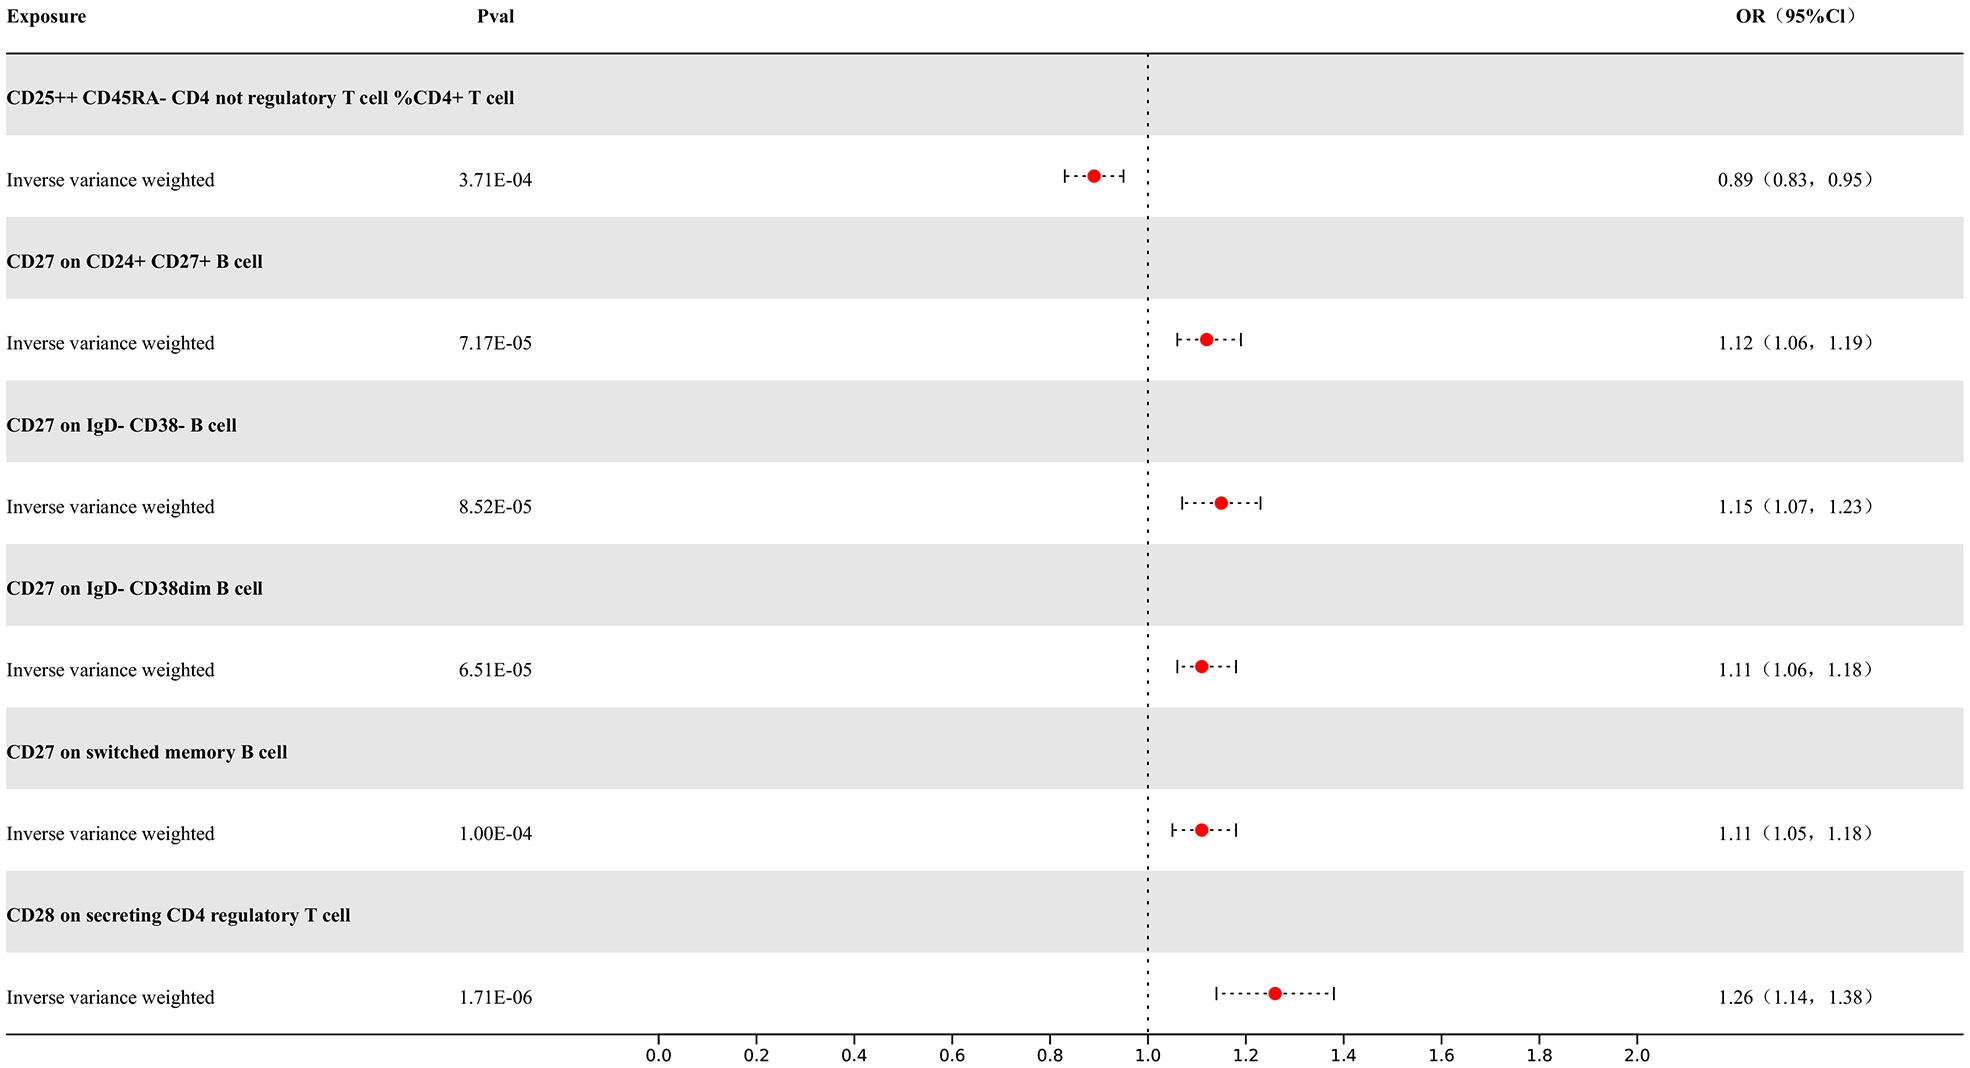
Figure 5 Forest map of MR results of Immune cells and MS, the forest plot shows the significant causal associations with P value < Bonferroni and the estimated OR with 95% confidence intervals (CI).
In sensitivity analysis, we conducted heterogeneity and pleiotropy analyses for the types of immune cells included in our study and the corresponding NDs. Our results all yielded p-values greater than 0.05, indicating the absence of heterogeneity and pleiotropy SNPs. Additionally, we performed leave-one-out analysis, which also demonstrated a stability of our results. The leave-one-out plot is available in the Supplementary Materials. The heterogeneity results are presented in Table 2 and the pleiotropy analysis results in Table 3.
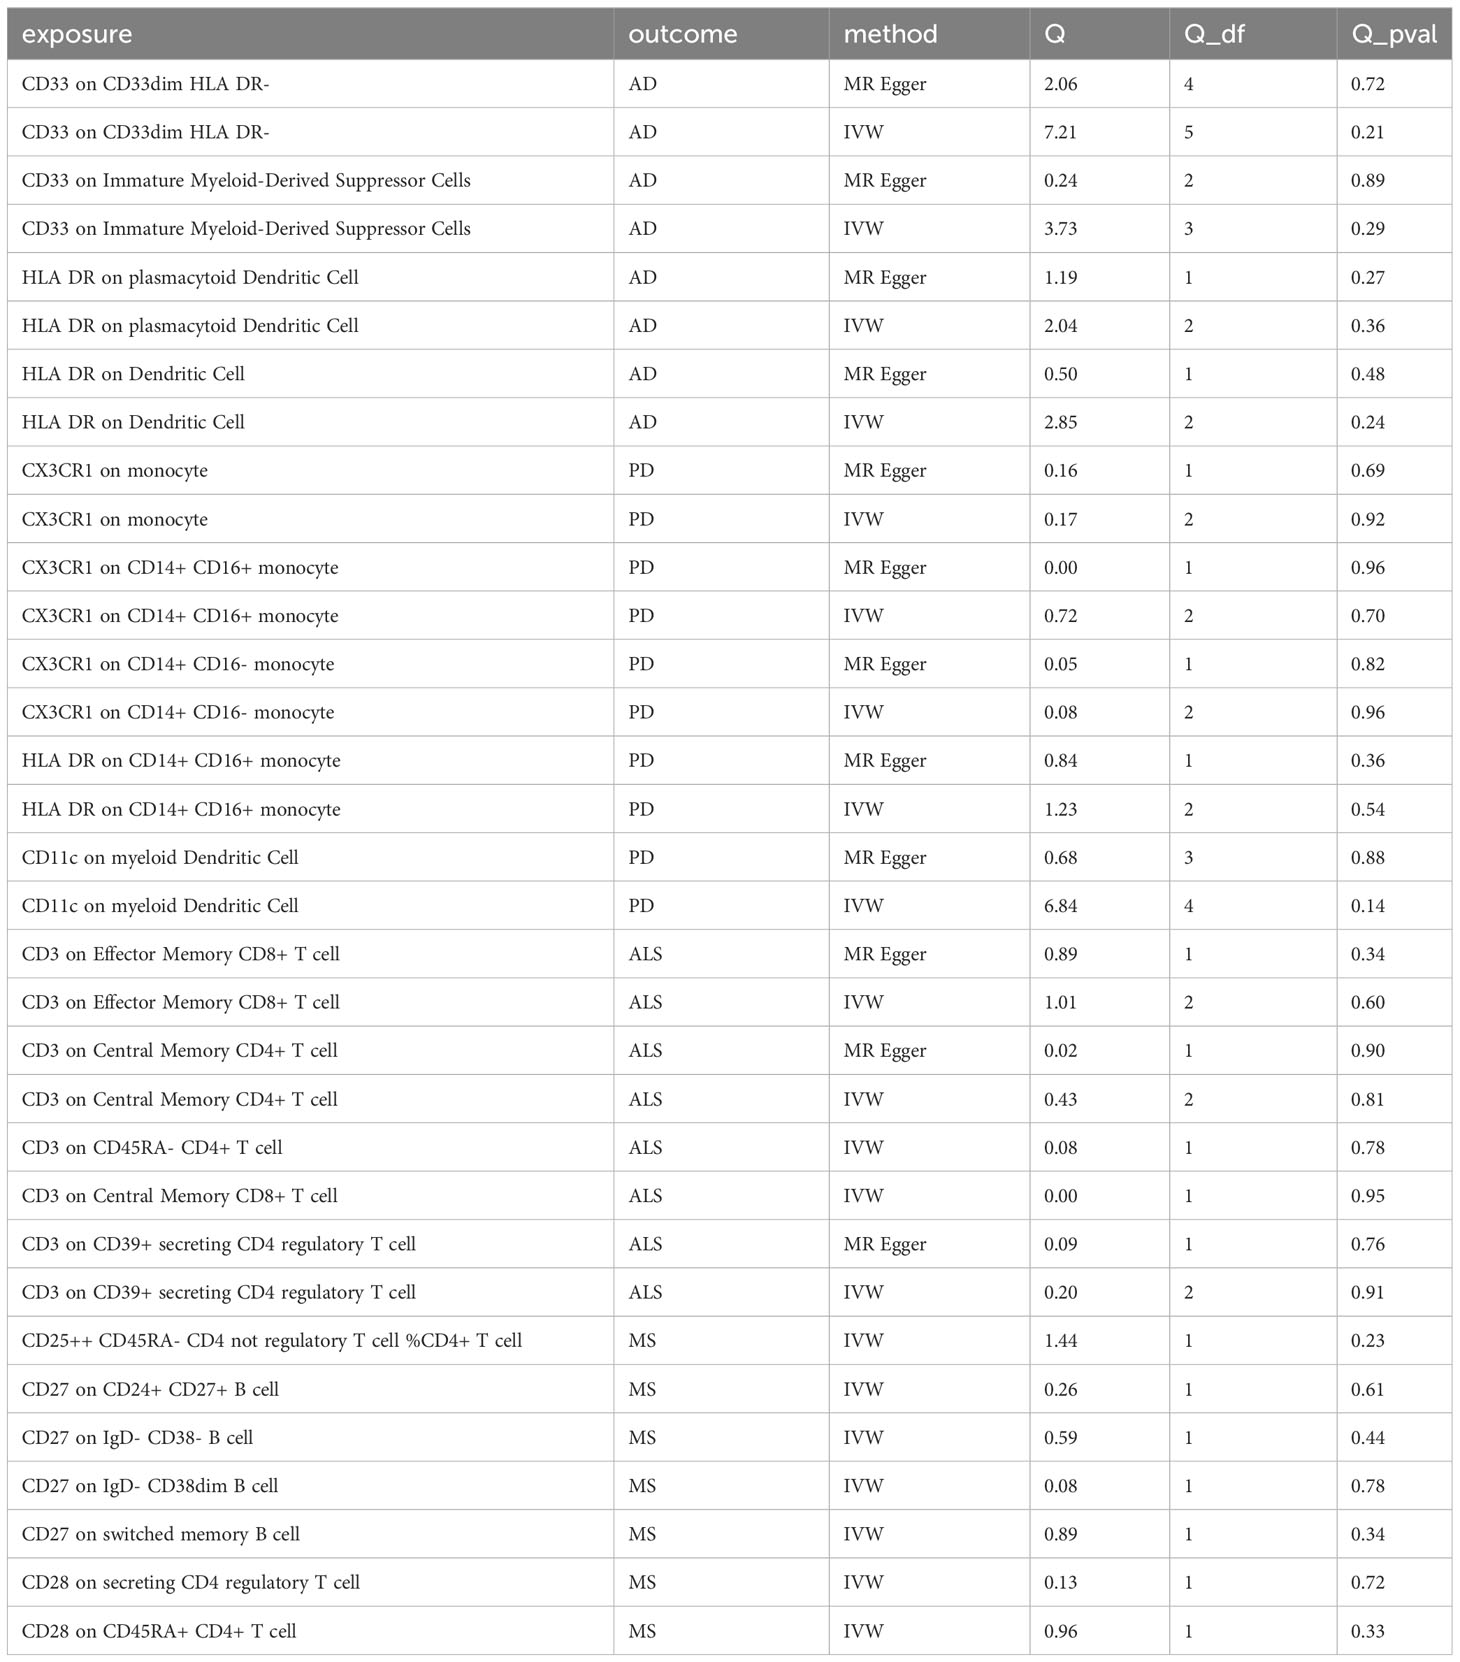
Table 2 The heterogeneity test of immune cells and neurodegenerative diseases in this study.
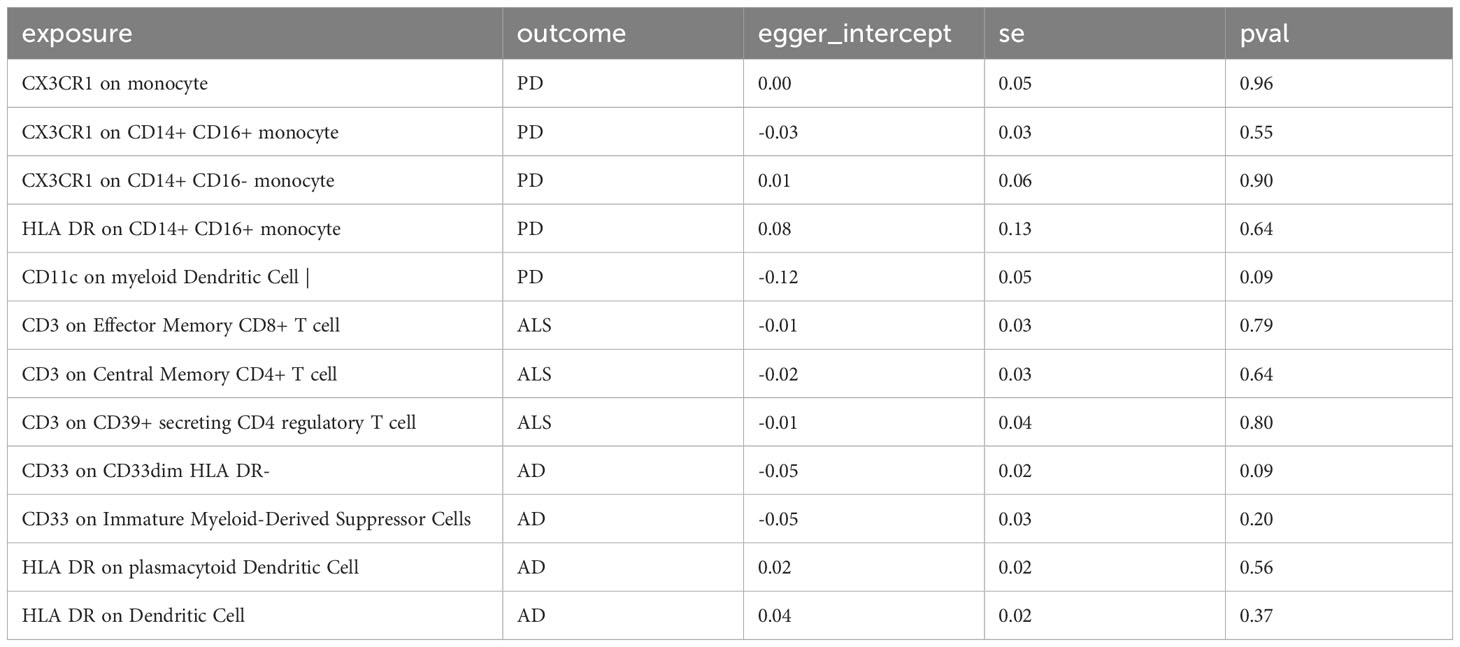
Table 3 The pleiotropy test of immune cells and neurodegenerative diseases in this study could not be conducted for some immune cells due to insufficient SNPs being included.
4 Discussion
Based on a large amount of publicly available genetic data, our study explored the causal relationships between 731 immune cell phenotypes and four NDs. To our knowledge, this is the first MR analysis to investigate the causal relationships between multiple immune phenotypes and NDs. Following stringent inclusion criteria and sensitivity analysis, we ultimately identified potential causal relationships between 8 different types of immune cells and AD, 1 different type of immune cells and PD, 6 different types of immune cells and ALS, and 6 different types of immune cells and MS.
In our study, we found a close association between CD33-related immune cell subtypes and AD. CD33 is a receptor belonging to the sialic acid-binding immunoglobulin-like lectin (Ig) family, primarily expressed by myeloid cells and microglia, participating in the adhesion of human primitive immune cells and mediating cell-cell interactions (31). Researches indicate that the expression of CD33 in the brains of AD patients is associated with a protective allele of a SNP (32, 33), which is related to the reduction of insoluble amyloid-beta 42 (Aβ42) levels. Additionally, in the peripheral blood of AD patients, mRNA levels of CD33 also undergo changes, which may be related to Aβ clearance and neuroinflammation (34). Furthermore, CD33 is also associated with the endogenous accumulation of phosphorylated tau protein in neurons. Therefore, CD33 is considered to potentially play a role in the pathogenesis and pathophysiology of AD by influencing the function of microglial cells, particularly in the clearance of amyloid plaques (35).
Microglia play a crucial role in the brain by clearing abnormal proteins from neurons. However, overactivated microglia may trigger an inflammatory response, exacerbating the development of NDs (36). CD33, as a gene related to immune response, plays an important role in immune regulation in AD. Studies have shown that the expression of CD33 in the brains of AD patients increases and is associated with the risk of AD (37, 38). Specifically, the expression levels of CD33 are related to the deposition of Aβ42 and cognitive decline. Furthermore, CD33 inhibits the uptake and clearance of Aβ42 by microglia, leading to increased Aβ deposition (39). This indicates that CD33 plays a negative role in regulating the ability of microglia to clear Aβ (40). In another study, it is also shown that the functional expression levels of CD33 were reduced, which can enhance the phagocytic activity of microglial cells and the uptake of Aβ42. Therefore, inhibiting CD33 to promote the clearance of β-amyloid may represent a novel therapeutic approach for the prevention and treatment of AD (41). Overall, there exists a complex relationship between CD33 and AD, and its role may involve multiple mechanisms, including influencing the function of microglial cells and the clearance ability of amyloid plaques.
In addition, our MR research has revealed a close association between CD33 and HLA-DR with AD. HLA-DR, a molecule within the human leukocyte antigen (HLA) family, is classified under the MHC class II molecules (42). It is predominantly expressed on antigen-presenting cells. Studies have indicated an increase in HLA-DR expression in AD, suggesting heightened activation of immune cells (43). This may be attributed to the participation of microglial cells in immune-related responses when the central nervous system is damaged or infected, such as promoting antigen presentation and activation of immune cells (44, 45). Consequently, HLA-DR is commonly utilized as a marker for activated microglial cells (46). Based on the evidence on the role of CD33 in regulating microglial cells (47, 48), our research underscores the significant role of HLA-DR in the process of regulating microglial cells by CD33. The interaction between these molecules may play a crucial role in immune regulation and inflammation control, and further research is required to elucidate the specific interaction mechanisms.
Monocytes are a critical class of immune cells that play a key role in the body’s immune response and inflammatory processes (49, 50). In patients with PD, abnormal activity of monocytes is associated with the development of the disease and neuroinflammation (51). Studies comparing monocytes in PD patients with those in healthy individuals have found abnormalities in the function and composition of monocytes in PD patients. Additionally, monocytes from PD patients exhibit pathologically high activity in response to lipopolysaccharide stimulation (52, 53), which correlates with disease severity. Further research suggests that monocytes in PD patients may exhibit an abnormal inflammatory response, leading to the development of neuroinflammation. This inflammatory response may be related to abnormal activation of monocytes and aberrant secretion of cytokines, adversely affecting neurons in the brain, while the phagocytic function of monocytes in PD patients may be impaired (54). Some studies indicate that there may be a deficiency in the phagocytic function of monocytes in PD patients, which could lead to a reduced capacity to clear abnormal proteins from neurons. This could result in the accumulation of abnormal proteins in the brain (54, 55), thereby exacerbating the condition of PD. Our research has found that CD11c+ cells may play an important role in the process by which monocytes contribute to PD. The latest study shows that CD11c+ cells in the brains and ileums of PD model mice contain aggregates of α-Synuclein (α-Syn). These CD11c+ cells exhibit an activated state in both the brain and ileum, and they appear to spread α-Syn between these two organs. Subsequently, by reducing CD11c+ cells, it has been found that the extent of α-Syn in the ileum reduces in PD model mice, suggesting that CD11c+ cells could be a useful target for intervention in the spread of α-Syn and the progression of PD (56).
In our MR study, CD3 molecule is found to be widely expressed on CD4+ and CD8+ T cells. CD3, as a subunit of the T cell receptor (TCR) complex, together with TCR, participates in regulating the development, selection and function of T cells (57). CD3 helps ensure normal development of T cells in the thymus and influences the strength and direction of the immune response by regulating T cell activation, proliferation and cytokine secretion (58, 59). Our research reveals a negative correlation between the CD3 molecule and ALS. This is possibly due to the regulatory role of CD3 in Treg cell function. Some studies have shown that the suppressive capacity of Treg cells is reduced in ALS patients, and the decrease of such function is associated with disease progression (60). Treg cells have a protective effect by inhibiting the neurotoxic overactivation of microglial cells and suppressing the release of reactive oxygen species. They also promote the secretion of glial cell line-derived neurotrophic factor (GDNF) and brain-derived neurotrophic factor (BDNF) (61, 62), which increases the survival rate of ALS model mice. Since CD3 binding to TCR promotes T cell recognition of antigens and signal transduction, it has been demonstrated in numerous studies that CD3 can participate in regulating the activity of Treg cells, influencing the development of neuroinflammation (63), and may have a protective effect in ALS.
Additionally, our study results indicate that the expression of the CD3 molecule on CD4+ and CD8+ T cells is closely related to ALS. CD4+ T cells may play a neuroprotective role in ALS patients. A study involving 81 ALS patients revealed a reduced number of CD4+ lymphocytes (64).This negative correlation is consistent with the findings of our study. The protective effect of CD4+ T cells may relate to their roles in the modulation of central nervous system inflammation by regulating microglial cells (65), further influencing the survival of motor neurons and the course of ALS. Of note, some studies have indicated that specific types of CD4+ T cells, such as Foxp3+ regulatory T cells, may play specific neuroprotective roles in ALS (66). Regarding the role of CD8+ T cells in ALS, the research is relatively limited. The elimination of CD8+ T cells has been shown to increase the survival of motor neurons in an ALS model mouse (67). In vitro studies also show that CD8+ lymphocytes expressing mutant superoxide dismutase-1 (SOD-1) can recognize and selectively kill motor neurons, suggesting a potential autoimmune origin of ALS (68). Overall, CD8+ T cells appear to play an important role in the pathogenesis of ALS. but further research is warranted to clarify the specific mechanisms.
Neurodegeneration is one of core pathological processes in MS, we found both CD27 and CD28 are closely related to MS. CD27 and CD28 are co-stimulatory molecules on the surface of T cells (69), and they play a crucial role in the immune system. Firstly, CD27 and CD28 are key molecules for T cell activation and proliferation (70). They promote T cell activation and proliferation by binding to ligands on the surface of antigen-presenting cells, thus triggering an immune response (71). In MS, the immune system’s attack on the CNS and inflammatory response are closely related to abnormal activation and dysfunction of T cells. Secondly, the expression levels of CD27 and CD28 are associated with the clinical manifestations and disease activity of MS (72). Some studies have found that the expression levels of CD27 and CD28 in the peripheral blood and the cerebrospinal fluid of MS patients significantly increase, especially during active periods of the disease. This suggests that the abnormal expressions of CD27 and CD28 may be closely related to disease activity and inflammatory response in MS (73). In addition, some studies suggest that the regulation in the signaling pathways of CD27 and CD28 may have an impact on the treatment and prognosis of MS (74). Therefore, we can conclude that CD27 and CD28 play a crucial role in the pathogenesis, disease activity, treatment response, and prognosis of MS.
This study conducted a two-sample MR analysis based on the published large GWAS datasets, thus having high statistical efficiency. The conclusions of this study are based on genetic instrumental variables, and causal inference was performed using multiple MR analysis methods. The results are robust and not affected by horizontal pleiotropy and other factors. However, the study has several limitations. Firstly, although most participants in the GWAS summary data used in our study are of European descent, this may partly affect our estimates, and therefore, the conclusions cannot be extended to other racial groups, limiting the generalizability of our results. Secondly, due to the lack of individual information, we could not conduct further stratified analysis of the population.
5 Conclusion
Based on the results of this study, we have identified potential causal relationships between various immune cells and different NDs. These findings provide important clues for the pathogenesis of NDs and offer new possibilities for future treatments and prevention. However, the study also has some limitations, such as sample restrictions and ethnic differences. Therefore, further research is needed to validate these findings and extend them to other populations.
Data availability statement
The original contributions presented in the study are included in the article/Supplementary Material. Further inquiries can be directed to the corresponding author.
Author contributions
CT: Methodology, Writing – original draft. XL: Data curation, Writing – original draft. YD: Writing – original draft. SY: Writing – original draft. YM: Writing – original draft. DH: Funding acquisition, Supervision, Validation, Writing – review & editing.
Funding
The author(s) declare financial support was received for the research, authorship, and/or publication of this article. This work was supported by the STI2023-Major Projects (2021ZD0201801).
Conflict of interest
The authors declare that the research was conducted in the absence of any commercial or financial relationships that could be construed as a potential conflict of interest.
Publisher’s note
All claims expressed in this article are solely those of the authors and do not necessarily represent those of their affiliated organizations, or those of the publisher, the editors and the reviewers. Any product that may be evaluated in this article, or claim that may be made by its manufacturer, is not guaranteed or endorsed by the publisher.
Supplementary material
The Supplementary Material for this article can be found online at: https://www.frontiersin.org/articles/10.3389/fimmu.2024.1339649/full#supplementary-material
References
1. Agnello L, Ciaccio M. Neurodegenerative diseases: from molecular basis to therapy. Int J Mol Sci (2022) 23(21):12854. doi: 10.3390/ijms232112854
3. Rodríguez Murúa S, Farez MF, Quintana FJ. The immune response in multiple sclerosis. Annu Rev Pathol (2022) 17:121–39. doi: 10.1146/annurev-pathol-052920-040318
4. Chen X, Holtzman DM. Emerging roles of innate and adaptive immunity in Alzheimer’s disease. Immunity (2022) 55(12):2236–54. doi: 10.1016/j.immuni.2022.10.016
5. Sabatino JJ Jr., Pröbstel AK, Zamvil SS. B cells in autoimmune and neurodegenerative central nervous system diseases. Nat Rev Neurosci (2019) 20(12):728–45. doi: 10.1038/s41583-019-0233-2
6. Stephenson J, Nutma E, van der Valk P, Amor S. Inflammation in CNS neurodegenerative diseases. Immunology (2018) 154(2):204–19. doi: 10.1111/imm.12922
7. Hammond TR, Marsh SE, Stevens B. Immune signaling in neurodegeneration. Immunity (2019) 50(4):955–74. doi: 10.1016/j.immuni.2019.03.016
8. Glass CK, Saijo K, Winner B, Marchetto MC, Gage FH. Mechanisms underlying inflammation in neurodegeneration. Cell (2010) 140(6):918–34. doi: 10.1016/j.cell.2010.02.016
9. Voet S, Srinivasan S, Lamkanfi M, van Loo G. Inflammasomes in neuroinflammatory and neurodegenerative diseases. EMBO Mol Med (2019) 11(6). doi: 10.15252/emmm.201810248
10. Sekula P, Del Greco MF, Pattaro C, Köttgen A. Mendelian randomization as an approach to assess causality using observational data. J Am Soc Nephrol (2016) 27(11):3253–65. doi: 10.1681/asn.2016010098
11. Bowden J, Holmes MV. Meta-analysis and Mendelian randomization: A review. Res Synth Methods (2019) 10(4):486–96. doi: 10.1002/jrsm.1346
12. Birney E. Mendelian randomization. Cold Spring Harb Perspect Med (2022) 12(4). doi: 10.1101/cshperspect.a041302
13. Ning J, Huang SY, Chen SD, Zhang YR, Huang YY, Yu JT. Investigating casual associations among gut microbiota, metabolites, and neurodegenerative diseases: A Mendelian randomization study. J Alzheimers Dis (2022) 87(1):211–22. doi: 10.3233/jad-215411
14. Ge YJ, Ou YN, Deng YT, Wu BS, Yang L, Zhang YR, et al. Prioritization of drug targets for neurodegenerative diseases by integrating genetic and proteomic data from brain and blood. Biol Psychiatry (2023) 93(9):770–9. doi: 10.1016/j.biopsych.2022.11.002
15. Orrù V, Steri M, Sidore C, Marongiu M, Serra V, Olla S, et al. Complex genetic signatures in immune cells underlie autoimmunity and inform therapy. Nat Genet (2020) 52(10):1036–45. doi: 10.1038/s41588-020-0684-4
16. Zheng J, Baird D, Borges MC, Bowden J, Hemani G, Haycock P, et al. Recent developments in mendelian randomization studies. Curr Epidemiol Rep (2017) 4(4):330–45. doi: 10.1007/s40471-017-0128-6
17. Wang C, Zhu D, Zhang D, Zuo X, Yao L, Liu T, et al. Causal role of immune cells in schizophrenia: Mendelian randomization (MR) study. BMC Psychiatry (2023) 23(1):590. doi: 10.1186/s12888-023-05081-4
18. Lambert JC, Ibrahim-Verbaas CA, Harold D, Naj AC, Sims R, Bellenguez C, et al. Meta-analysis of 74,046 individuals identifies 11 new susceptibility loci for Alzheimer’s disease. Nat Genet (2013) 45(12):1452–8. doi: 10.1038/ng.2802
19. Nalls MA, Blauwendraat C, Vallerga CL, Heilbron K, Bandres-Ciga S, Chang D, et al. Identification of novel risk loci, causal insights, and heritable risk for Parkinson’s disease: a meta-analysis of genome-wide association studies. Lancet Neurol (2019) 18(12):1091–102. doi: 10.1016/s1474-4422(19)30320-5
20. van Rheenen W, van der Spek RAA, Bakker MK, van Vugt J, Hop PJ, Zwamborn RAJ, et al. Common and rare variant association analyses in amyotrophic lateral sclerosis identify 15 risk loci with distinct genetic architectures and neuron-specific biology. Nat Genet (2021) 53(12):1636–48. doi: 10.1038/s41588-021-00973-1
21. Beecham AH, Patsopoulos NA, Xifara DK, Davis MF, Kemppinen A, Cotsapas C, et al. Analysis of immune-related loci identifies 48 new susceptibility variants for multiple sclerosis. Nat Genet (2013) 45(11):1353–60. doi: 10.1038/ng.2770
22. Burgess S, Thompson SG. Bias in causal estimates from Mendelian randomization studies with weak instruments. Stat Med (2011) 30(11):1312–23. doi: 10.1002/sim.4197
23. Burgess S, Scott RA, Timpson NJ, Davey Smith G, Thompson SG. Using published data in Mendelian randomization: a blueprint for efficient identification of causal risk factors. Eur J Epidemiol (2015) 30(7):543–52. doi: 10.1007/s10654-015-0011-z
24. Hartwig FP, Davey Smith G, Bowden J. Robust inference in summary data Mendelian randomization via the zero modal pleiotropy assumption. Int J Epidemiol (2017) 46(6):1985–98. doi: 10.1093/ije/dyx102
25. Lee H, Mayer H. Validation of the mean radiant temperature simulated by the RayMan software in urban environments. Int J Biometeorol (2016) 60(11):1775–85. doi: 10.1007/s00484-016-1166-3
26. Bowden J, Davey Smith G, Burgess S. Mendelian randomization with invalid instruments: effect estimation and bias detection through Egger regression. Int J Epidemiol (2015) 44(2):512–25. doi: 10.1093/ije/dyv080
27. Grover S, Del Greco MF, Stein CM, Ziegler A. Mendelian randomization. Methods Mol Biol (2017) 1666:581–628. doi: 10.1007/978-1-4939-7274-6_29
28. Greco MF, Minelli C, Sheehan NA, Thompson JR. Detecting pleiotropy in Mendelian randomisation studies with summary data and a continuous outcome. Stat Med (2015) 34(21):2926–40. doi: 10.1002/sim.6522
29. Burgess S, Thompson SG. Interpreting findings from Mendelian randomization using the MR-Egger method. Eur J Epidemiol (2017) 32(5):377–89. doi: 10.1007/s10654-017-0255-x
30. Curtin F, Schulz P. Multiple correlations and Bonferroni’s correction. Biol Psychiatry (1998) 44(8):775–7. doi: 10.1016/s0006-3223(98)00043-2
31. Griciuc A, Federico AN, Natasan J, Forte AM, McGinty D, Nguyen H, et al. Gene therapy for Alzheimer’s disease targeting CD33 reduces amyloid beta accumulation and neuroinflammation. Hum Mol Genet (2020) 29(17):2920–35. doi: 10.1093/hmg/ddaa179
32. Griciuc A, Tanzi RE. The role of innate immune genes in Alzheimer’s disease. Curr Opin Neurol (2021) 34(2):228–36. doi: 10.1097/wco.0000000000000911
33. Tortora F, Rendina A, Angiolillo A, Di Costanzo A, Aniello F, Donizetti A, et al. CD33 rs2455069 SNP: correlation with Alzheimer’s disease and hypothesis of functional role. Int J Mol Sci (2022) 23(7):3629. doi: 10.3390/ijms23073629
34. Gu X, Dou M, Cao B, Jiang Z, Chen Y. Peripheral level of CD33 and Alzheimer’s disease: a bidirectional two-sample Mendelian randomization study. Transl Psychiatry (2022) 12(1):427. doi: 10.1038/s41398-022-02205-4
35. Zhao L. CD33 in Alzheimer’s disease - biology, pathogenesis, and therapeutics: A mini-review. Gerontology (2019) 65(4):323–31. doi: 10.1159/000492596
36. Salminen A, Kaarniranta K, Kauppinen A. Hypoxia/ischemia impairs CD33 (Siglec-3)/TREM2 signaling: Potential role in Alzheimer’s pathogenesis. Neurochem Int (2021) 150:105186. doi: 10.1016/j.neuint.2021.105186
37. Eskandari-Sedighi G, Jung J, Macauley MS. CD33 isoforms in microglia and Alzheimer’s disease: Friend and foe. Mol Aspects Med (2023) 90:101111. doi: 10.1016/j.mam.2022.101111
38. Griciuc A, Patel S, Federico AN, Choi SH, Innes BJ, Oram MK, et al. TREM2 acts downstream of CD33 in modulating microglial pathology in Alzheimer’s disease. Neuron (2019) 103(5):820–35. doi: 10.1016/j.neuron.2019.06.010
39. Bisht K, Sharma K, Tremblay M. Chronic stress as a risk factor for Alzheimer’s disease: Roles of microglia-mediated synaptic remodeling, inflammation, and oxidative stress. Neurobiol Stress (2018) 9:9–21. doi: 10.1016/j.ynstr.2018.05.003
40. Haure-Mirande JV, Audrain M, Ehrlich ME, Gandy S. Microglial TYROBP/DAP12 in Alzheimer’s disease: Transduction of physiological and pathological signals across TREM2. Mol Neurodegener (2022) 17(1):55. doi: 10.1186/s13024-022-00552-w
41. Griciuc A, Serrano-Pozo A, Parrado AR, Lesinski AN, Asselin CN, Mullin K, et al. Alzheimer’s disease risk gene CD33 inhibits microglial uptake of amyloid beta. Neuron (2013) 78(4):631–43. doi: 10.1016/j.neuron.2013.04.014
42. Aliseychik MP, Andreeva TV, Rogaev EI. Immunogenetic factors of neurodegenerative diseases: the role of HLA class II. Biochem (Mosc) (2018) 83(9):1104–16. doi: 10.1134/s0006297918090122
43. Busse S, Steiner J, Alter J, Dobrowolny H, Mawrin C, Bogerts B, et al. Expression of HLA-DR, CD80, and CD86 in healthy aging and Alzheimer’s disease. J Alzheimers Dis (2015) 47(1):177–84. doi: 10.3233/jad-150217
44. Hendrickx DAE, van Eden CG, Schuurman KG, Hamann J, Huitinga I. Staining of HLA-DR, Iba1 and CD68 in human microglia reveals partially overlapping expression depending on cellular morphology and pathology. J Neuroimmunol (2017) 309:12–22. doi: 10.1016/j.jneuroim.2017.04.007
45. Singh-Bains MK, Linke V, Austria MDR, Tan AYS, Scotter EL, Mehrabi NF, et al. Altered microglia and neurovasculature in the Alzheimer’s disease cerebellum. Neurobiol Dis (2019) 132:104589. doi: 10.1016/j.nbd.2019.104589
46. Walker DG, Lue LF. Immune phenotypes of microglia in human neurodegenerative disease: challenges to detecting microglial polarization in human brains. Alzheimers Res Ther (2015) 7(1):56. doi: 10.1186/s13195-015-0139-9
47. Gonzalez-Gil A, Porell RN, Fernandes SM, Maenpaa E, Li TA, Li T, et al. Human brain sialoglycan ligand for CD33, a microglial inhibitory Siglec implicated in Alzheimer’s disease. J Biol Chem (2022) 298(6):101960. doi: 10.1016/j.jbc.2022.101960
48. Yuan C, Aierken A, Xie Z, Li N, Zhao J, Qing H. The age-related microglial transformation in Alzheimer’s disease pathogenesis. Neurobiol Aging (2020) 92:82–91. doi: 10.1016/j.neurobiolaging.2020.03.024
49. Nissen SK, Shrivastava K, Schulte C, Otzen DE, Goldeck D, Berg D, et al. Alterations in blood monocyte functions in Parkinson’s disease. Mov Disord (2019) 34(11):1711–21. doi: 10.1002/mds.27815
50. Batchu S. Prefrontal cortex transcriptomic deconvolution implicates monocyte infiltration in Parkinson’s disease. Neurodegener Dis (2020) 20(2-3):110–2. doi: 10.1159/000510218
51. Harms AS, Ferreira SA, Romero-Ramos M. Periphery and brain, innate and adaptive immunity in Parkinson’s disease. Acta Neuropathol (2021) 141(4):527–45. doi: 10.1007/s00401-021-02268-5
52. Brown GC, Camacho M, Williams-Gray CH. The endotoxin hypothesis of Parkinson’s disease. Mov Disord (2023) 38(7):1143–55. doi: 10.1002/mds.29432
53. Grozdanov V, Bliederhaeuser C, Ruf WP, Roth V, Fundel-Clemens K, Zondler L, et al. Inflammatory dysregulation of blood monocytes in Parkinson’s disease patients. Acta Neuropathol (2014) 128(5):651–63. doi: 10.1007/s00401-014-1345-4
54. Wijeyekoon RS, Kronenberg-Versteeg D, Scott KM, Hayat S, Jones JL, Clatworthy MR, et al. Monocyte function in Parkinson’s disease and the impact of autologous serum on phagocytosis. Front Neurol (2018) 9:870. doi: 10.3389/fneur.2018.00870
55. Terkelsen MH, Klaestrup IH, Hvingelby V, Lauritsen J, Pavese N, Romero-Ramos M. Neuroinflammation and immune changes in prodromal parkinson’s disease and other synucleinopathies. J Parkinsons Dis (2022) 12(s1):S149–s163. doi: 10.3233/jpd-223245
56. McFleder RL, Makhotkina A, Groh J, Keber U, Imdahl F, Peña Mosca J, et al. Brain-to-gut trafficking of alpha-synuclein by CD11c(+) cells in a mouse model of Parkinson’s disease. Nat Commun (2023) 14(1):7529. doi: 10.1038/s41467-023-43224-z
57. Shores EW, Love PE. TCR zeta chain in T cell development and selection. Curr Opin Immunol (1997) 9(3):380–9. doi: 10.1016/s0952-7915(97)80085-4
58. Gil D, Schamel WW, Montoya M, Sánchez-Madrid F, Alarcón B. Recruitment of Nck by CD3 epsilon reveals a ligand-induced conformational change essential for T cell receptor signaling and synapse formation. Cell (2002) 109(7):901–12. doi: 10.1016/s0092-8674(02)00799-7
59. Dave VP. Role of CD3ϵ-mediated signaling in T-cell development and function. Crit Rev Immunol (2011) 31(1):73–84. doi: 10.1615/critrevimmunol.v31.i1.70
60. Machhi J, Kevadiya BD, Muhammad IK, Herskovitz J, Olson KE, Mosley RL, et al. Harnessing regulatory T cell neuroprotective activities for treatment of neurodegenerative disorders. Mol Neurodegener (2020) 15(1):32. doi: 10.1186/s13024-020-00375-7
61. Reynolds AD, Banerjee R, Liu J, Gendelman HE, Mosley RL. Neuroprotective activities of CD4+CD25+ regulatory T cells in an animal model of Parkinson’s disease. J Leukoc Biol (2007) 82(5):1083–94. doi: 10.1189/jlb.0507296
62. Benner EJ, Mosley RL, Destache CJ, Lewis TB, Jackson-Lewis V, Gorantla S, et al. Therapeutic immunization protects dopaminergic neurons in a mouse model of Parkinson’s disease. Proc Natl Acad Sci USA (2004) 101(25):9435–40. doi: 10.1073/pnas.0400569101
63. Eggenhuizen PJ, Ng BH, Ooi JD. Treg enhancing therapies to treat autoimmune diseases. Int J Mol Sci (2020) 21(19):7015. doi: 10.3390/ijms21197015
64. Yang Y, Pan D, Gong Z, Tang J, Li Z, Ding F, et al. Decreased blood CD4+ T lymphocyte helps predict cognitive impairment in patients with amyotrophic lateral sclerosis. BMC Neurol (2021) 21(1):157. doi: 10.1186/s12883-021-02185-w
65. González H, Pacheco R. T-cell-mediated regulation of neuroinflammation involved in neurodegenerative diseases. J Neuroinflamm (2014) 11:201. doi: 10.1186/s12974-014-0201-8
66. Jones KJ, Lovett-Racke AE, Walker CL, Sanders VM. CD4 + T cells and neuroprotection: relevance to motoneuron injury and disease. J Neuroimmune Pharmacol (2015) 10(4):587–94. doi: 10.1007/s11481-015-9625-x
67. Kaur K, Chen PC, Ko MW, Mei A, Chovatiya N, Huerta-Yepez S, et al. The potential role of cytotoxic immune effectors in induction, progression and pathogenesis of amyotrophic lateral sclerosis (ALS). Cells (2022) 11(21):3431. doi: 10.3390/cells11213431
68. Terrabuio E, Zenaro E, Constantin G. The role of the CD8+ T cell compartment in ageing and neurodegenerative disorders. Front Immunol (2023) 14:1233870. doi: 10.3389/fimmu.2023.1233870
69. Sunder-Plassmann R, Pickl WF, Majdic O, Knapp W, Holter W. Crosslinking of CD27 in the presence of CD28 costimulation results in T cell proliferation and cytokine production. Cell Immunol (1995) 164(1):20–7. doi: 10.1006/cimm.1995.1138
70. Ribot JC, Silva-Santos B. Differentiation and activation of γδ T Lymphocytes: Focus on CD27 and CD28 costimulatory receptors. Adv Exp Med Biol (2013) 785:95–105. doi: 10.1007/978-1-4614-6217-0_11
71. Gattinoni L, Lugli E, Ji Y, Pos Z, Paulos CM, Quigley MF, et al. A human memory T cell subset with stem cell-like properties. Nat Med (2011) 17(10):1290–7. doi: 10.1038/nm.2446
72. El Mahdaoui S, Husted SR, Hansen MB, Cobanovic S, Mahler MR, Buhelt S, et al. Cerebrospinal fluid soluble CD27 is associated with CD8(+) T cells, B cells and biomarkers of B cell activity in relapsing-remitting multiple sclerosis. J Neuroimmunol (2023) 381:578128. doi: 10.1016/j.jneuroim.2023.578128
73. Hintzen RQ, van Lier RA, Kuijpers KC, Baars PA, Schaasberg W, Lucas CJ, et al. Elevated levels of a soluble form of the T cell activation antigen CD27 in cerebrospinal fluid of multiple sclerosis patients. J Neuroimmunol (1991) 35(1-3):211–7. doi: 10.1016/0165-5728(91)90175-7
Keywords: immune cells, Mendelian randomization, neurodegenerative diseases, Alzheimer’s disease, Parkinson’s disease, amyotrophic lateral sclerosis, multiple sclerosis
Citation: Tang C, Lei X, Ding Y, Yang S, Ma Y and He D (2024) Causal relationship between immune cells and neurodegenerative diseases: a two-sample Mendelian randomisation study. Front. Immunol. 15:1339649. doi: 10.3389/fimmu.2024.1339649
Received: 16 November 2023; Accepted: 08 January 2024;
Published: 29 January 2024.
Edited by:
Wassim Elyaman, Columbia University, United StatesReviewed by:
Dallin Dressman, Columbia University, United StatesKeenan Alexander Walker, Johns Hopkins University, United States
Annie Lee, Columbia University, United States
Copyright © 2024 Tang, Lei, Ding, Yang, Ma and He. This is an open-access article distributed under the terms of the Creative Commons Attribution License (CC BY). The use, distribution or reproduction in other forums is permitted, provided the original author(s) and the copyright owner(s) are credited and that the original publication in this journal is cited, in accordance with accepted academic practice. No use, distribution or reproduction is permitted which does not comply with these terms.
*Correspondence: Dian He, aGVkaWFuQGdtYy5lZHUuY24=